Article

Solar Energy Resource Analysis and Evaluation of Photovoltaic System Performance in Various Regions of Saudi Arabia

1
Department of Electrical Engineering, College of Engineering, Majmaah University, Al Majmaah 11952, Kingdom of Saudi Arabia
2
Electrical Engineering Department, Assiut University, Assiut 71515, Egypt
*
Author to whom correspondence should be addressed.
Sustainability 2018, 10(4), 1129; https://doi.org/10.3390/su10041129
Submission received: 11 March 2018 / Revised: 5 April 2018 / Accepted: 6 April 2018 / Published: 10 April 2018

Abstract

:
According to Vision 2030, the Kingdom of Saudi Arabia (K.S.A) plans to harness 9.5 GW of energy from renewable energy sources, which includes a major part of solar PV generation. This massive implementation of solar projects requires an accurate assessment and analysis of solar resource data and PV site selection. This paper presents a detailed analysis of one-year solar radiation data and energy output of 100 kW PV systems at 44 different locations across the K.S.A. Coastal areas have a lower amount of global horizontal irradiance (GHI) as compared to inland areas. Najran University station gives the highest annual electrical output of 172,083 kWh, yield factor of 1721, and capacity utilization factor of 19.6%. Sharurah and Timma TVTC are second and third best with respect to annual PV performance. Similarly, during high load summer season (April–October), Tabuk station is the best location for a PV power plant with an electrical output of 110,250 kWh, yield factor of 1102, and capacity utilization factor of 21.46%. Overall, the northern province of Tabuk is the most feasible region for a solar PV plant. The basic approach presented in this research study compares solar resource pattern and solar PV system output pattern with the load profile of the country. The site selected based on this criterion is recommended to be economically most feasible which can reduce the stress on electricity companies during high load seasons by clipping the peak load during daytime in the hot summer period.

1. Introduction

The K.S.A has a unique electrical load profile. The electrical load is low in the winter season from November to March, and increases very quickly from April onward and reaches a peak value in June and July. The electrical load remains on the higher side until October. Peak load in the summer season is two times higher than winter peak load. This unique characteristic of electrical load is developed by cooling load in residential and commercial buildings in the hot summer season. Residential and commercial buildings in K.S.A use about 50% of the total electricity consumed [1,2,3]. According to World Energy Council statistics, an average household in K.S.A consumed 23.81 MWh of electricity in 2014 which is third highest consumption rate in the world, while the overall average in the world was 3.35 MWh [4,5]. In 2015, K.S.A generated 328.1 billion kWh of electricity, which is 6.4% more than that generated in 2014 and almost twice that in 2006 (181.4 billion kWh) [6]. The demand for electricity is rising at a very brisk rate. The number of subscribers are increasing at an average rate of 5.2%. Electricity demand growth of the industrial sector is 6.9%. This has resulted in more combustion of fossil fuels, which will eventually release a greater amount of CO 2 into the atmosphere. Environmental pollution and global warming is considered a serious threat to life on our planet [7,8,9]. It is becoming an accepted fact that the amount CO 2 emissions resulting from fossil fuels burning is so huge that a technical fix to this problem is inevitable [10,11,12,13,14]. In 2013, the K.S.A released 458.8 million tons of CO 2 into the atmosphere due to combustion of fossil fuel as compare to 429.8 million tons in 2012 [15]. The annual average growth rate of CO 2 emissions in the K.S.A between 1971 and 2013 was 5.8% [16,17]. Electricity demand growth has been increasing at a high rate of around 7.5% per annum in the last decade or so [18]. This increasing demand for electrical energy is one of the main problems being faced by the power companies in the K.S.A. Saudi Arabia is among the 26 countries accounting for three-quarters of global energy demand [19]. The renewable energies share in primary consumption is less than 0.1% in the K.S.A as compared to 12.9% in the rest of the world [20]. Unless renewable energy resources are explored and adopted, fossil fuel demand for power generation is estimated to increase from 3.4 mb/d in 2010 to 8.3 mb/d in 2028 [6]. This will result in a significant reduction in the country’s export revenue.
In order to overcome energy crises in future, the K.S.A has plans to include renewable resources to diversify its power generation. The K.S.A has massive oil reserves and at the same time, the Kingdom is blessed with other resources, like solar energy, that could solve all the energy crises in the future. Annual solar irradiance in the country is around 2000–2450 kWh/ m 2 [21], along with the vast empty land areas available to host solar installation, which makes the K.S.A an ideal location for both PV and CSP generation [22,23,24,25].
Average annual solar radiation in the Arabian Peninsula is about 2000   kWh / m 2 [26]. Only around 0.1% land area of the country is required to meet the projected demand for electricity for 2050 [27]. The barrier to the adoption of solar power generation is its huge capital cost but unlike other renewables, solar power is abundant and everywhere. Renewable energy is essential in the Gulf Cooperation Council (GCC) countries, but government policies to subsidize fossil fuels are the major barriers in the way of renewable energy [28]. Increasing solar share in energy mix increases the cost of the solar system but fuel cost, cost of emissions and emissions itself get reduced [29]. Solar PV can be installed domestically on rooftops and commercially in or near cities to avoid losses due to long distance transmission. This makes solar power the most feasible resource in the renewable category. Germany has the second highest installed solar PV capacity in the world. Interestingly, minimum solar irradiation in Saudi Arabia ( 2000   kWh / m 2 ) is more than maximum irradiation in Germany ( 1200   kWh / m 2 ). The installed capacity of solar PV in Germany is 32,509 MWP.
Current projects, related to solar power generation in the K.S.A, have been based on outdated and limited solar resource data, mostly relying on estimated data from satellite-based observations of the atmosphere. The K.S.A has set an initial target of generating 9.5 gigawatts of renewable energy. This large-scale expansion of renewable projects, as planned in vision 2030 [30], requires precise, long-term ground-based real data. In order to obtain long-term accurate ground-based data, the K.S.A has established a Renewable Resource Monitoring and Mapping (RRMM) network [31]. The data used in this paper was taken from The King Abdullah City of Atomic and Renewable Energy (K.A.CARE). K.A.CARE has established a RRMM network of 46 stations across the country.
A recent study on solar radiation data in the K.S.A reports an assessment of solar radiation resources at 30 locations across the country [32]. The GHI, direct normal irradiance (DNI), and their variabilities are discussed over a one-year period but no seasonal load variations and solar radiation variations were analyzed at the same time. Another study presents a techno-economic review of rooftop solar PV for Al Majmaah city, province of Riyadh, Saudi Arabia and feasibility of the system was proven based on annual production of PV energy and payback period, but seasonal load profile variations were not considered in the feasibility analysis [3]. Sherif S. Rashwan et al. performed an environmental and economic study of a small-scale PV power plant for a small building in Dhahran, K.S.A [33]. Sulaiman AlYahya et al. compared solar radiation data from K.A.CARE for two locations in K.S.A (K.A.CARE Headquarter Riyadh and Qasim University Stations) with long-term estimates by GeoModel [34]. Hisham El Khashab et al. investigated renewable energy source applications for a hybrid system (PV, wind turbine, and fuel cell systems) at Yanbu, K.S.A and cost of energy in three systems was compared [35]. Abdullah Al-Sharaf et al. investigated the potential for power generation via wind and solar PV at five different locations in the K.S.A [36]. Another study investigates a PV-diesel hybrid power system with battery backup for a remote village in Saudi Arabia [37].
The existing research focuses on either a general scenario of solar radiations and feasibility of solar PV generation at a particular location. None of the existing study compared solar PV feasibility over a large number of locations across each and every corner of the country. None of the existing work explored the most feasible location while taking into account the shape of the annual load profile of the K.S.A.
Most of the existing research work focuses on solar radiation levels and other weather related factors while finding the best site for solar PV generation in a country. One very important missing aspect is to consider the load profile of the country as well. Here in this paper, most feasible region for solar PV generation is explored and shape of load profile is considered as a very important parameter in the site selection. This approach is very useful to locate the best site for solar PV station in a country where the load is high over a period of few months and electricity companies are overstressed during that period. A site selected using this approach will have an added advantage to further clip the load peak and release stress on electricity companies.

2. Materials and Methods

2.1. Data Collection

In order to find the most feasible regions for solar PV generation, a careful and accurate collection of data is very important. The data used in this study is one full year (December 2015 to November 2016) of solar radiation data gathered from 46 different locations in the K.S.A. The data is collected from King Abdullah City for Atomic and Renewable Energy (K.A.CARE). K.A.CARE has a RRMM network, which focuses on monitoring and mapping solar, wind, geothermal, and waste-to-energy resources in the K.S.A [31]. In order to acquire data for the spatial and temporal variability of solar resources, RRMM network has established solar resource monitoring stations (SRMS) at various locations throughout the Kingdom. Based on types and quantities of monitoring instrumentations, SRMS are classified into three tiers.

2.1.1. Tier 1 Research Stations

Tier one stations are most complete and complex stations with the highest accuracy of data. These stations provide data with low uncertainty of ±2%. Tier 1 stations are cleaned and checked on a daily schedule. All Tier 1 stations comply with the measurement practices described in the World Meteorological Organization (WMO) Baseline Surface Radiation Network (BSRN). These stations are further classified into three configurations:
  • Configuration A—Research and Development Laboratory—These stations contain a full complement of radiometric instruments with independent and redundant solar radiation component data. This configuration also contains basic meteorological instruments plus horizontal visibility and dust deposition measuring instruments as well.
  • Configuration B—Solar Broadband and Spectral Monitoring Station—This configuration contains all broadband solar radiometers, selected solar spectral radiometers, photometers, and pyranometers. This configuration also contains basic meteorological instruments plus horizontal visibility and dust deposition measuring instruments as well.
  • Configuration C—Broadband Baseline Monitoring Station—This configuration contains basic meteorological instruments and other instruments to provide fundamental solar irradiance data (GHI, DNI, and GHI).

2.1.2. Tier 2 Mid-Range Stations

These stations provide solar resource and surface meteorological data with a baseline uncertainty of ±5%. These stations are cleaned and checked twice a week and provide one-minute data, averaged to hourly and daily data for ease of use.

2.1.3. Tier 3 Simple Stations

Tier 3 stations are arranged in a cluster of eight instruments measuring solar irradiance and temperature, surrounding a single rotating shadowband radiometer (RSR). The instruments on a simple station are clustered in approximately 4   km 2 area to characterize rapid solar resource variations.

2.1.4. Data Quality Assurance

The quality of data is assured on daily bases by visually inspecting all resources and stations operation data via graphs to make sure that data is within the acceptable established range and reasonably follows the acceptable patterns. This daily inspection approach helps to pinpoint the operational issues and reduce the harmful effects of distorted data. K.A.CARE used a more robust approach to ensure the quality of data by installation of a backup pyranometer of the same make and same model as the primary. The secondary pyranometer provides a redundant measurement of GHI at all the stations. This redundancy of GHI measuring instruments helps to trigger appropriate investigative measures and corrective actions in case one of the sensors may have an issue and sensors are reading in disagreement with high uncertainties. The three components of solar radiation (GHI, DNI, DHI) are analyzed with the help of an automated program SERI QC, utilizing the secondary redundant sensors, and viewing long-term pattern tendency and parameter ratios. Short duration data irregularities resulting from known cleaning periods are filled with values through interpolation or by using two known components to calculate the third one [32].

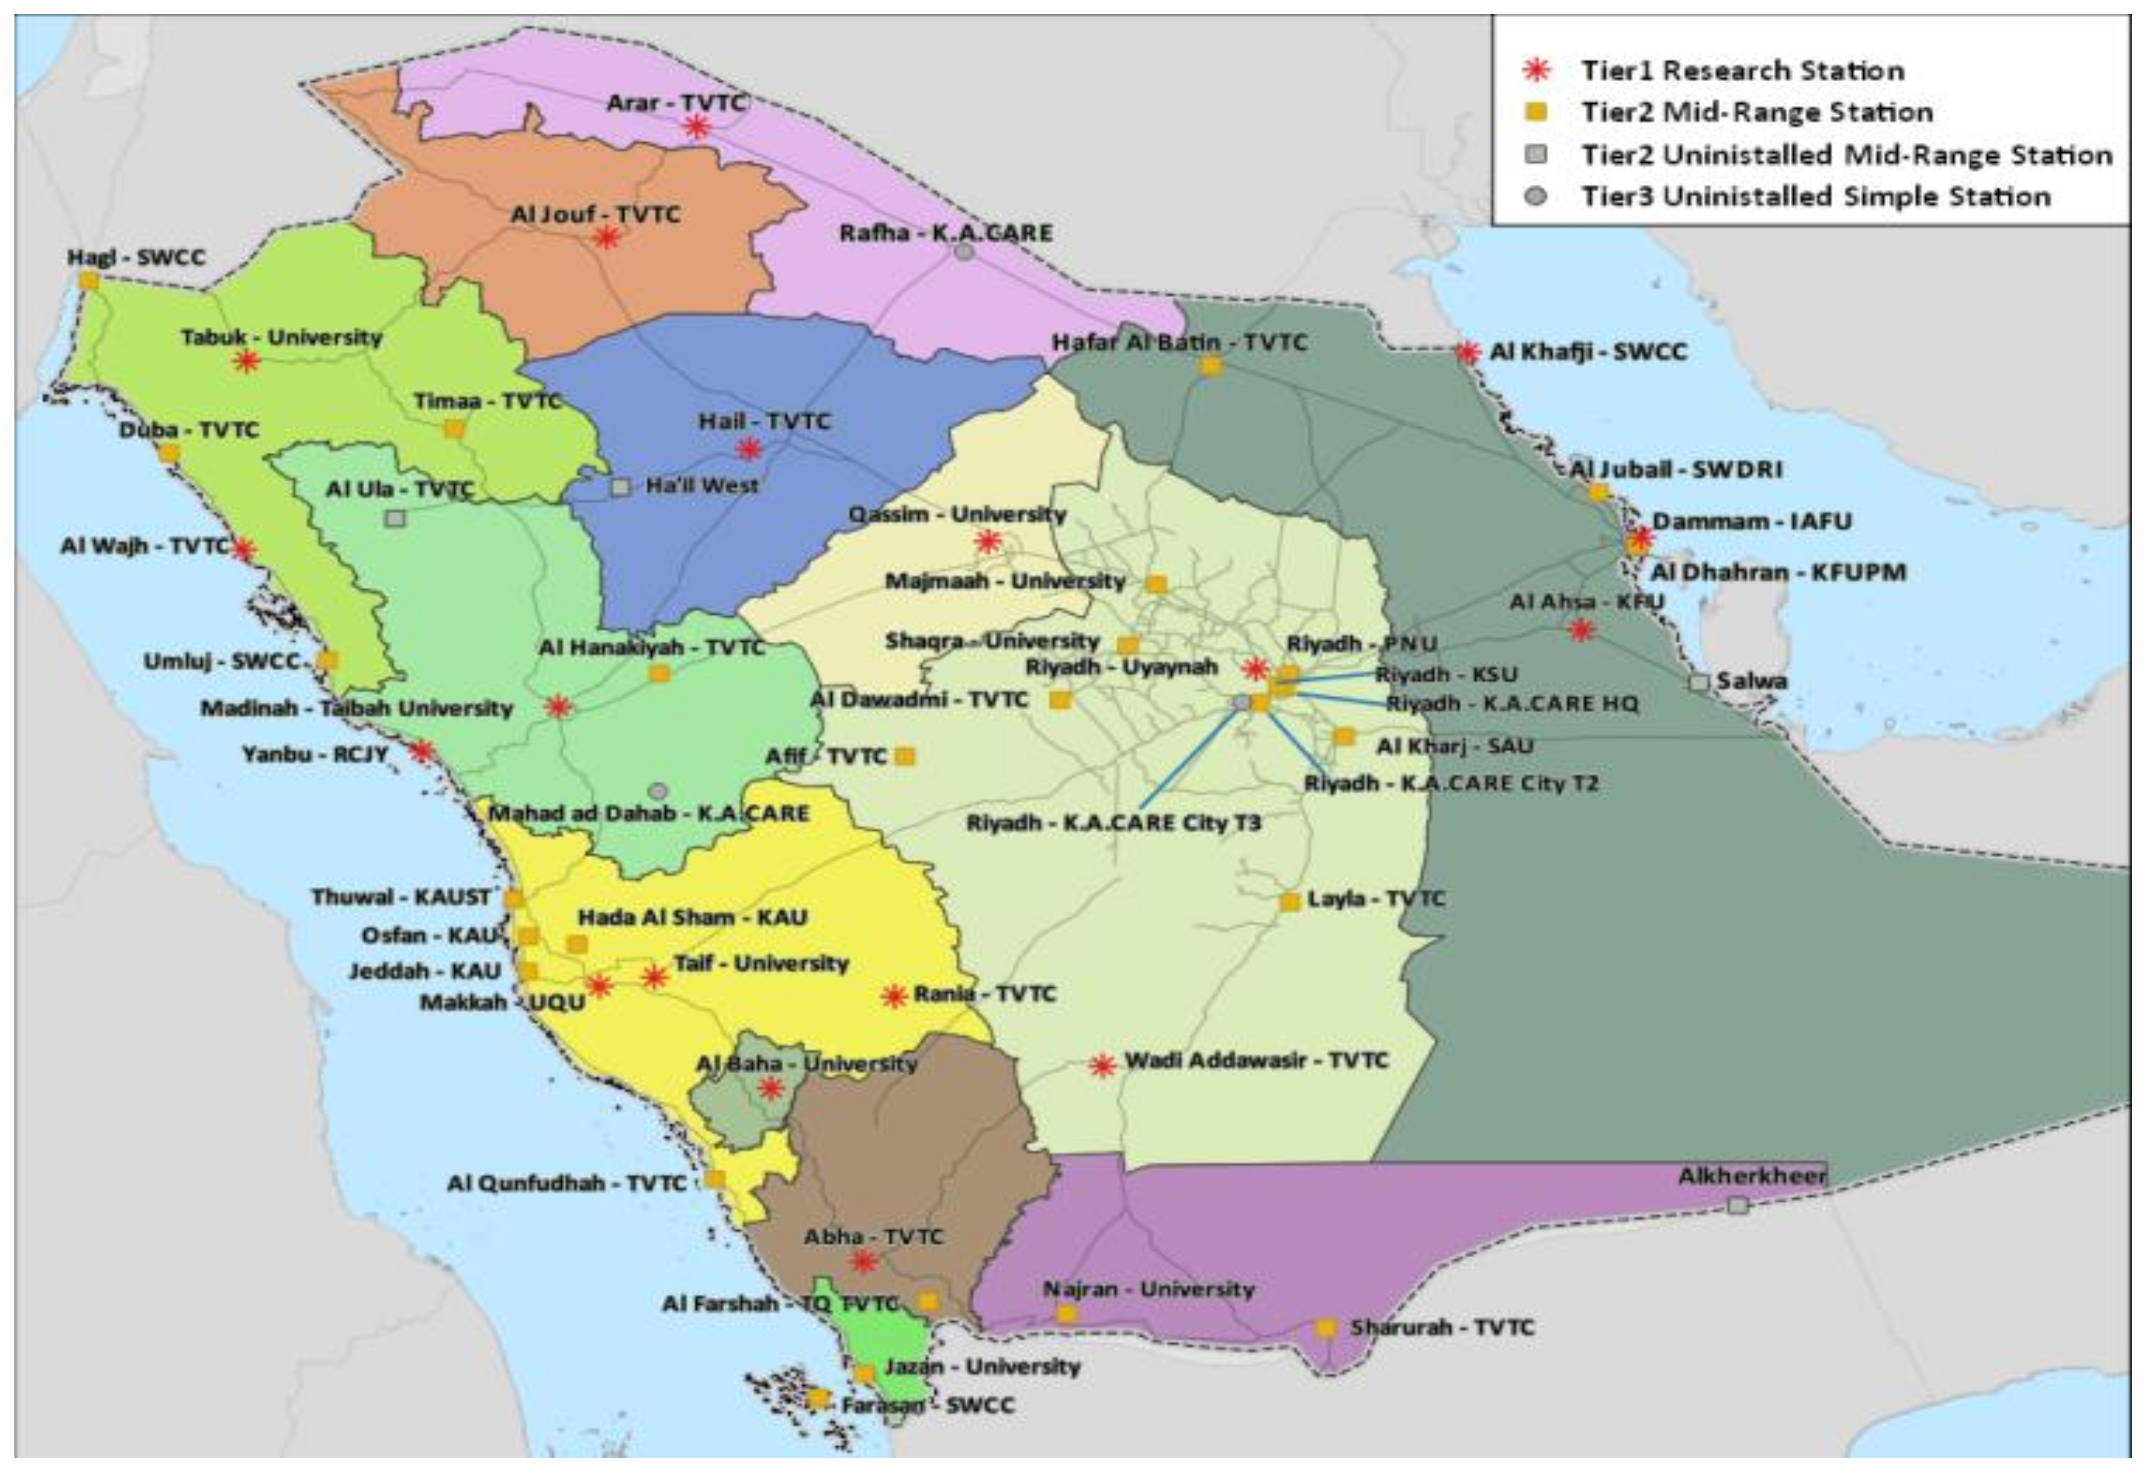
2.1.5. Solar Resource Monitoring Stations Network

K.A.CARE has planned 53 SRMSs across the country, out of which 46 stations are already established in all provinces of Saudi Arabia. Distribution of these stations in various provinces is shown in the Map in Figure 1 [38]. Table 1 provides the detailed information about all 46 installed stations locations with station name, city name, province name, and station type. It can be observed in Figure 1 and Table 1 that the bulk of the stations are installed in the central region and western coastal areas. The northern part of the K.S.A has fewer SRMSs. There are only a few stations in the eastern part of the country. A summary of all existing and planned stations, their types, and installation status are shown in Table 2. It can be seen in Table 2 that no Tier 3 simple stations have been installed yet. There are 18 Tier 1 (research) stations with a low-level uncertainty of ±2% and 28 Tier 2 (mid-range) stations with medium level uncertainty of ±5% [38].

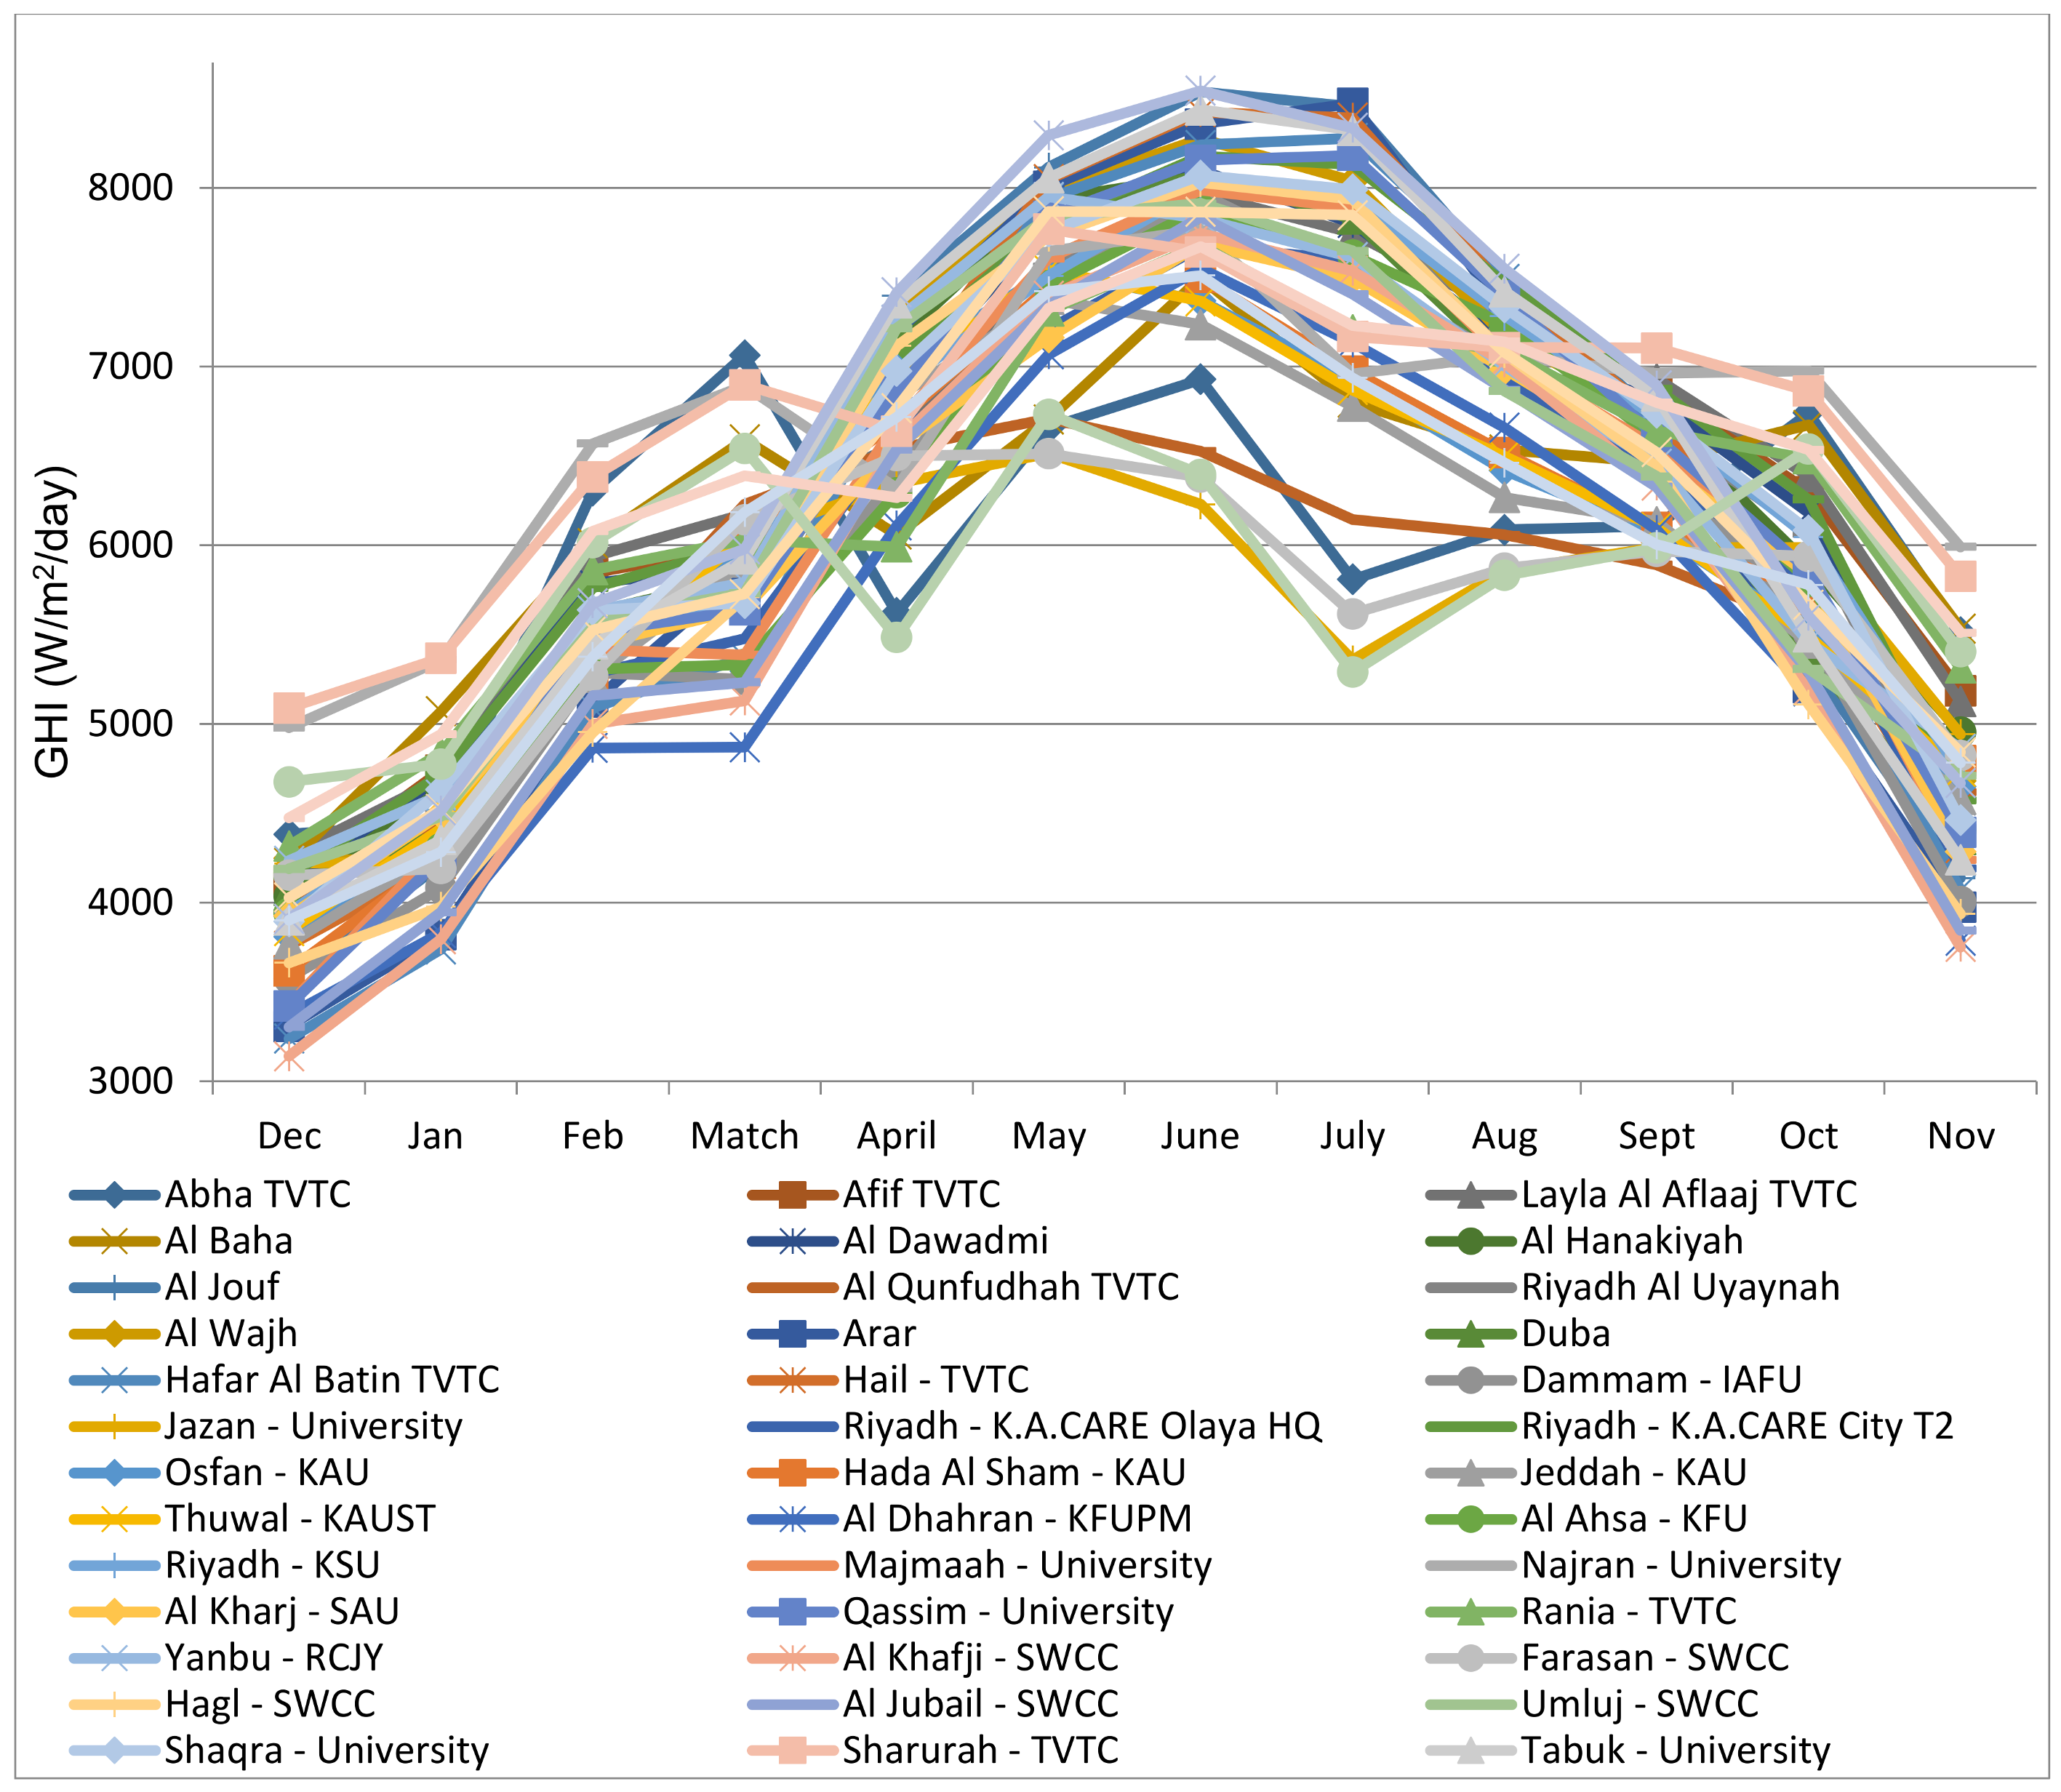
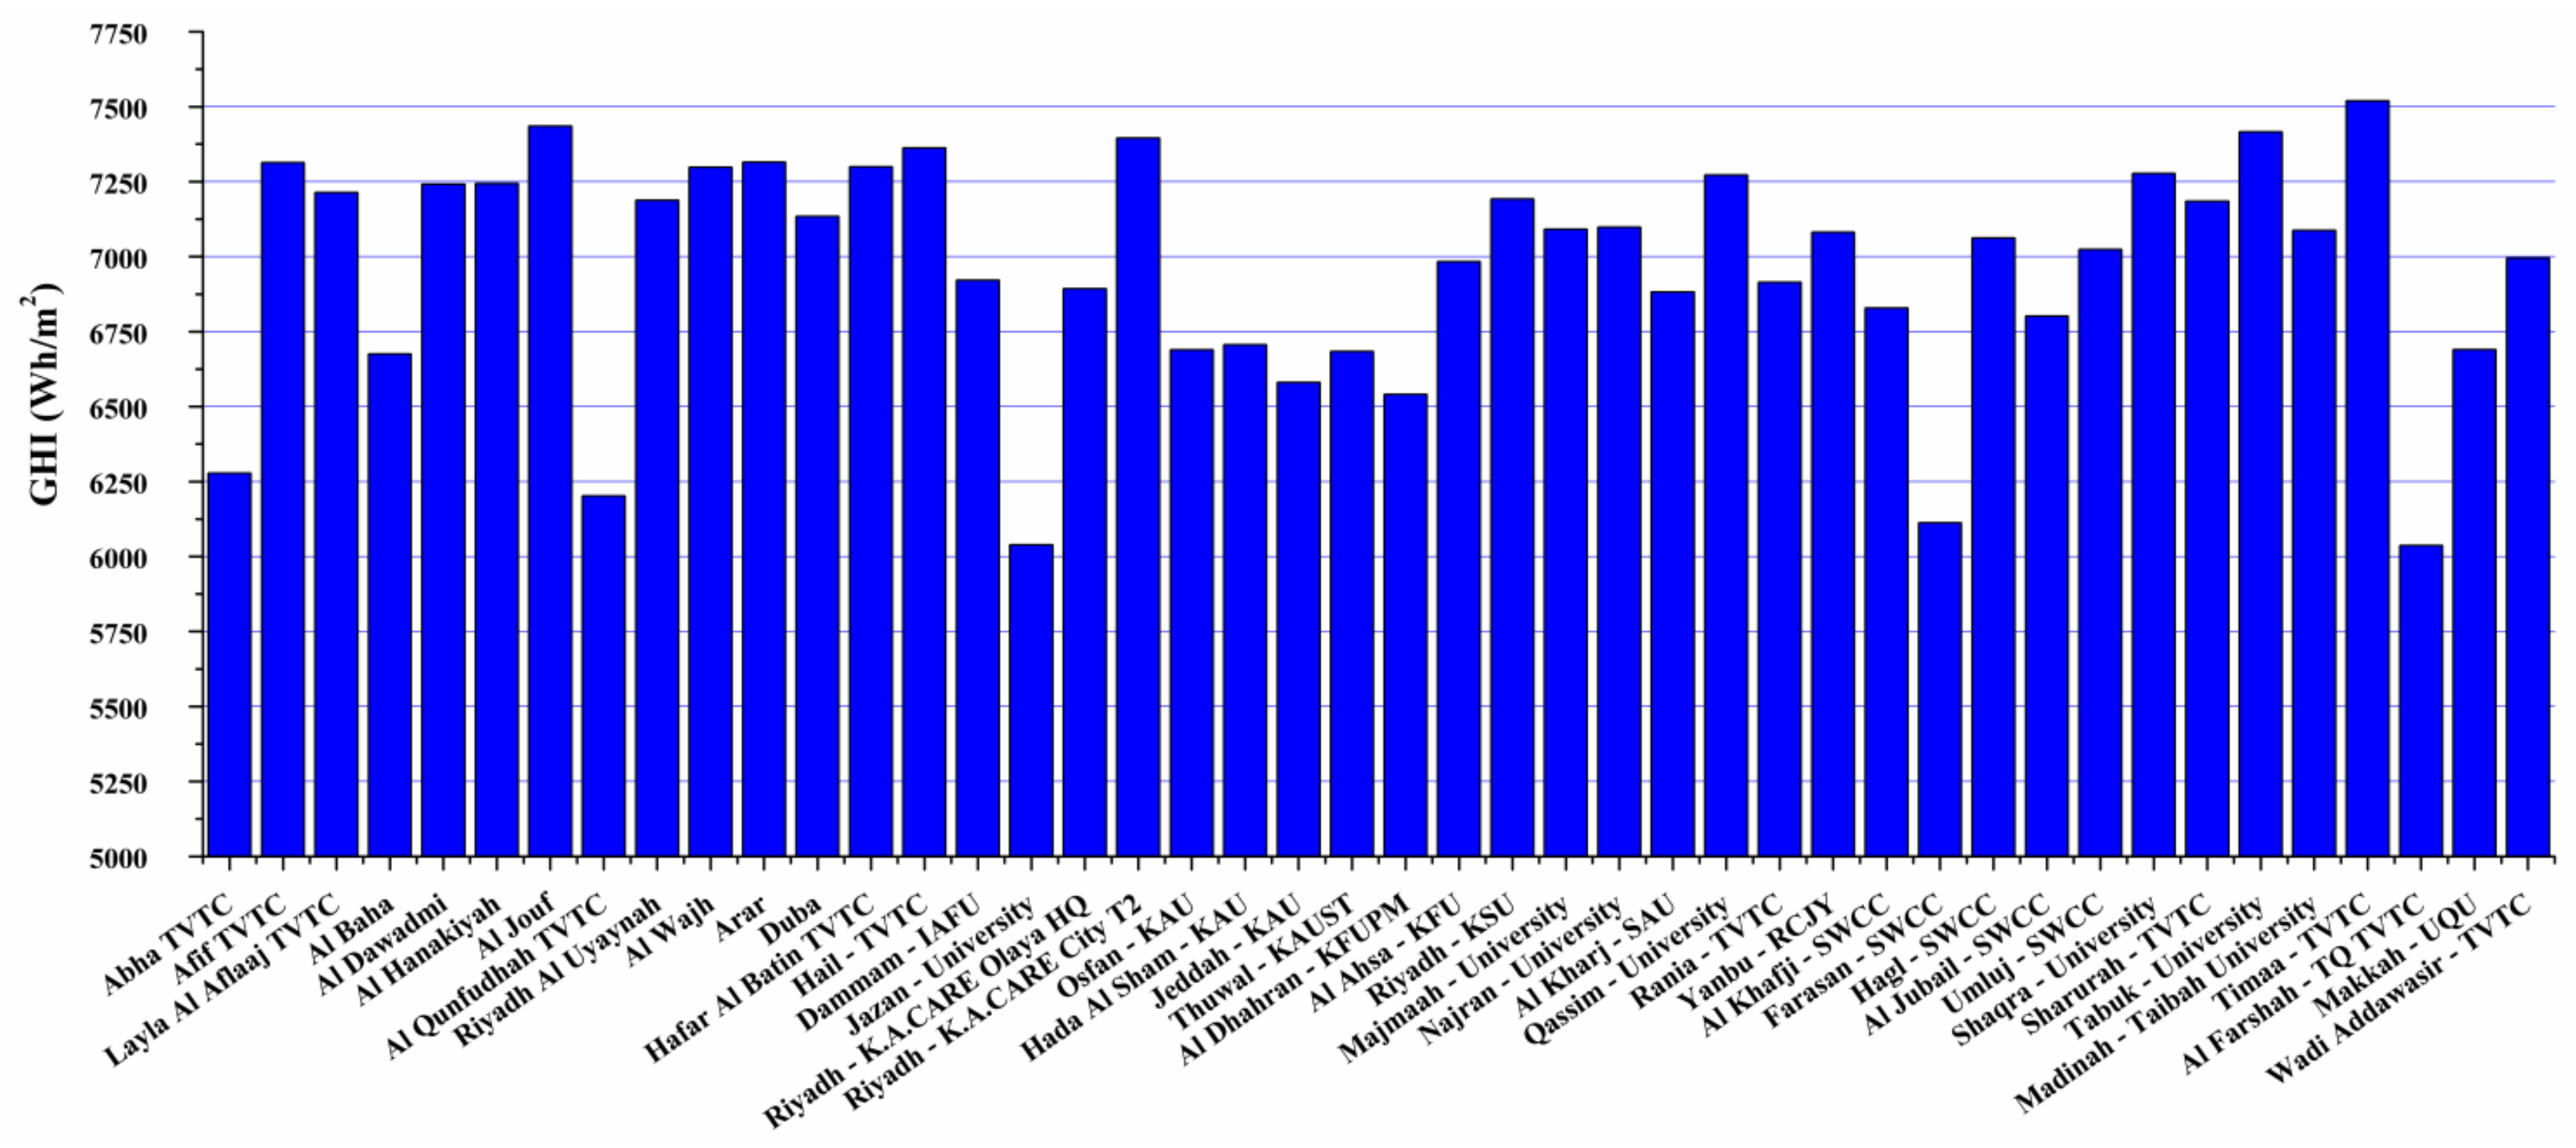
2.2. Analysis of GHI Solar Data for 46 Stations

One-year data for 46 installed stations was collected from K.A.CARE. Data from 44 stations is complete for the one-year study period from December 2015 to November 2016. Two stations have incomplete or no data. Princess Noora University Riyadh station has no data for the given period and Taif University station has one month of missing data (November 2016). GHI data for all the 44 stations is presented in Table 3. We analyzed the data in Table 3 to know the station wise pattern and trends of GHI in each region. It can be observed in Table 3 that a minimum average daily total GHI of 5542.6 Wh/m2 is at Al Dhahran station, which is a Tier 2 station. Al Dhahran is a coastal area station in the eastern province with high water vapor and more cloudy weather, which is one of the factors to lower the level of GHI in this area. Jazan University station has the second lowest average daily total GHI during the study period followed by Farasan Island station at third lowest. Both of these stations are also coastal area stations in Jazan province in the western region of Saudi Arabia. Al Qunfudhah TVTC, again a coastal area station in Province of Makkah in the western region of K.S.A, has the fourth lowest average daily total GHI. AlKhafji—SWCC and Al Jubail—SWCC stations are placed in the fifth and sixth lowest positions. Both AlKhafji—SWCC and Al Jubail—SWCC stations are also coastal area stations situated in the coastal area of the eastern province. Here, the trend shows that coastal area stations on both eastern and western regions of Saudi Arabia have lower levels of GHI, which is linked to cloudy and humid weather of these areas.
Sharurah station has the highest average daily total GHI of 6654.5 Wh/m2 and it is a Tier 2 station. The second highest average daily total GHI is observed at Najran University station, which has 6623.3 Wh/m2 of GHI. Both of these stations are located in the province of Najran in the southern region of Saudi Arabia. Timaa TVTC station is third highest on the list with average daily total GHI of 6448.4 Wh/m2. This station is located in the northwest part of the country in Tabuk province. Afif-TVTC with 6423.6 Wh/m2 and Riyadh—K.A.CARE City T2 with 6413.9 Wh/m2 are placed at fourth and fifth respectively in the top-ranked list. Both of these stations are in the central part of the K.S.A. Layla Al Aflaaj—TVTC and Wadi Addawasir—TVTC are the next two highest on the list and are also in the central region. There is one common thing in all of the high average daily total GHI stations that all of them are located in the areas where the weather is dry and humidity level is very low.
A plot of the average daily total GHI and relative humidity levels of the seven highest and seven lowest (GHI wise) stations is shown in Figure 2. Figure 2 clearly depicts that stations with low relative humidity have high daily average of GHI and vice versa. Six out of seven stations with low GHI are coastal area stations on both eastern and western coastal lines of Saudi Arabia. Eastern coastal area stations have relatively lower humidity level as compared to western coastal areas. Nevertheless, all the coastal area stations have relative humidity level of more than 50% except Alkhafji-SWCC station, which has a relative humidity level of 42.5%. Sea breeze brings a lot of moisture resulting in increased level of relative humidity. The relatively low level of humidity is due to wind direction and speed at Alkhafji. Wind speed at Alkhafji-SWCC station is 3.1 m/s and average wind direction is 236° (SW) as compared to Jubail-SWCC station with an average wind speed and wind direction of 3.6 m/s and 258° (WSW), respectively. Cross-wind at Jubail-SWCC brings lot of moisture from sea as compared to Alkhafji-SWCC station with lesser wind speed and different wind direction angle. This has resulted in lower relative humidity level at Alkhafji-SWCC as compared to Jubail station. None of the seven top-ranked stations are located in coastal areas. In fact, all of them are located in the dry areas with very low relative humidity levels of under or around 25%. A high level of relative humidity not only affects the GHI but it also affects solar PV modules and their efficiency as well. Although water vapors in the atmosphere are not visible to human eye, yet they are visible to solar cells. Corrosion is one of the major effects of humidity on solar cell and it becomes a grave issue if temperature is also high at the same time. In humid weather, the corrosion phenomenon may deteriorate the titanium–silver contact on silicon solar cells. High temperatures in the range of 40 °C–60 °C may result in long-term deterioration of these contacts [39]. Typically, the corrosion process accelerates under high humidity and high temperature conditions because of the presence of minute quantities of ionization contaminate (e.g., salts). Another effect of higher humidity is growth of fungus. High humidity levels around 75% to 95% and temperatures in the range of 20–40 °C result in higher growth rate of fungi [39]. Other effects include the formation of a sticky surface film of moisture that catches dust and dirt particles.

2.3. Methodological Approach towards Identification of Most Feasible Region for Solar PV System

The K.S.A’s electric load has a unique aspect that country’s load almost becomes double in the summer-time as compared to winter. In order to meet this high load demand in summer, a high penetration of renewable energy is inevitable. Over the last decade, peak load and consumption of electricity are growing at a rapid pace. Peak load is growing at an average pace of more than 7% [18]. Under the given economic and demographic trends, peak load is expected to be tripled by 2030 [40]. In order to find the regions which are most suitable for solar PV power generation, the stations with high GHI over one annum and stations with high GHI during high load summer season from April to October are analyzed and compared in this study.
Solar radiations and ambient air temperature are the two most important factors, which affect the performance of the PV system [41]. Solar radiation is a measure of the amount of sunlight falling on a given surface. The higher the solar radiation incident on a solar cell, the more energy a cell will produce. Other factors such as tilt angle of PV panels, fog, passing clouds, and dust accumulation effect the solar radiation hitting the PV surface. Ambient air temperature is another important parameter to be considered for PV energy output calculations [41]. Solar cells operate at much higher temperatures than ambient air temperature. As the ambient temperature increases, cell temperature further increases. The hotter the cell material is, the more resistance there is and the slower the electrons can move through it. The energy output of PV module decreases as the cell temperature increases. All of these factors differ from one site to another and from time to time over the span of one year. Similarly, the feasibility of PV system at a particular location depends on how effectively the PV system generated power can be used to clip the peak demand for electricity in high load season. Therefore, the shape of load profile is taken as an important parameter for the selection of a most feasible region for PV system. The solar resource data for the study period of one year is collected from RRMM network of K.A.CARE. There is not enough data for dust accumulation, therefore it is assumed that PV panels are regularly cleaned.
A 100 kW PV power system is designed in HOMER (Hybrid Optimization Model for Electric Renewable) software. It is a micro-grid computer modeling program which is developed by the National Renewable Energy Laboratory (NREL). It is a very powerful tool to evaluate the feasibility of renewable energy based system. Simulations are performed to evaluate the performance of the proposed 100 kW PV system at 44 locations across the Kingdom. The PV system is tested at each location and following performance analysis are considered for identification of the most feasible location for PV power generation:
  • PV system total energy output over the period of one year;
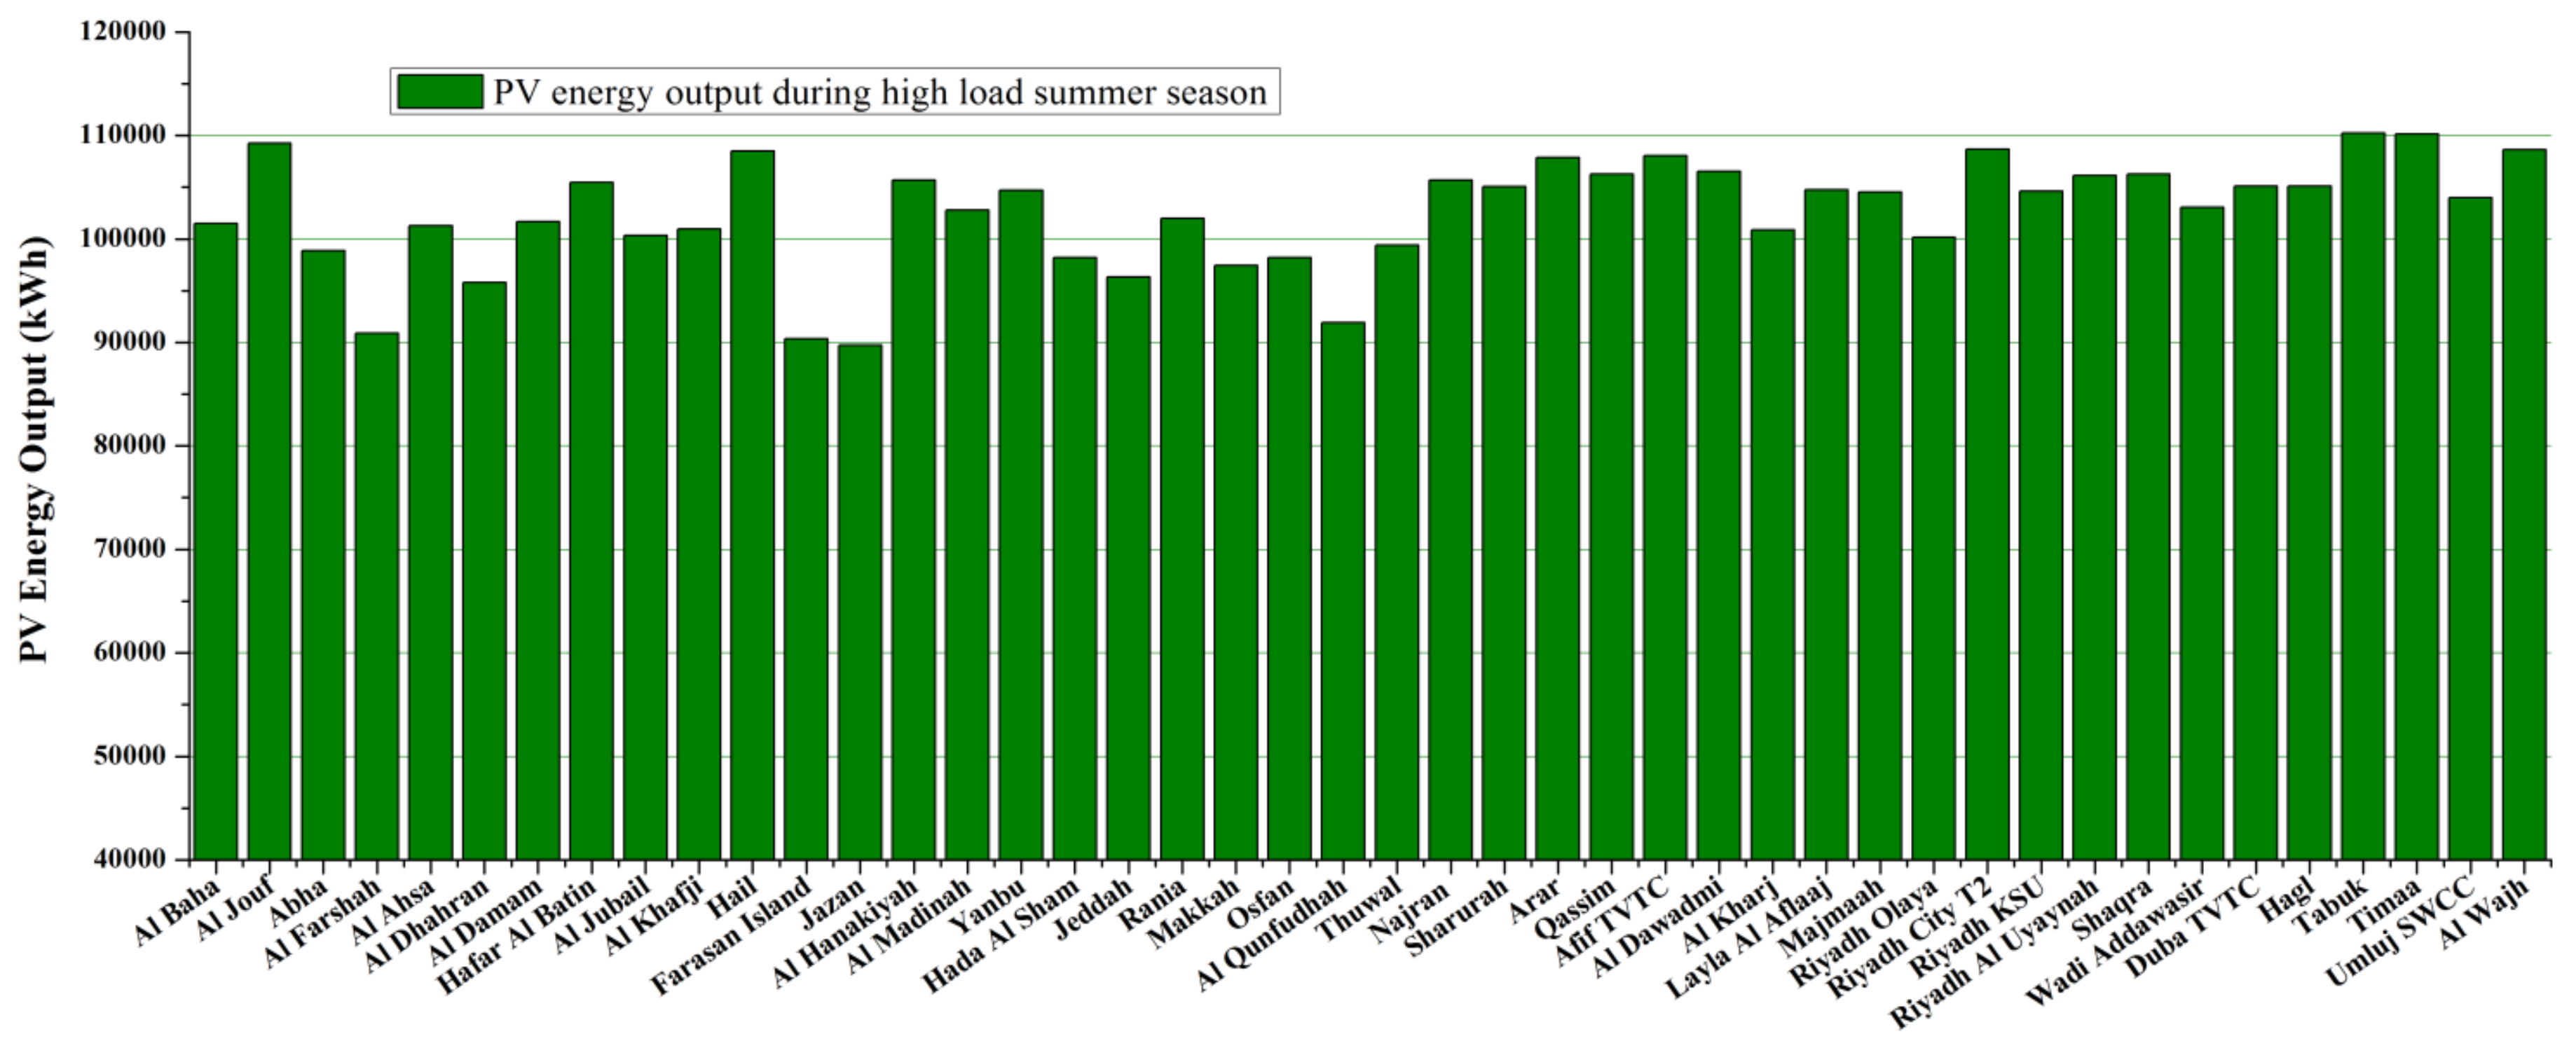
  • PV system total energy output during high load summer season;
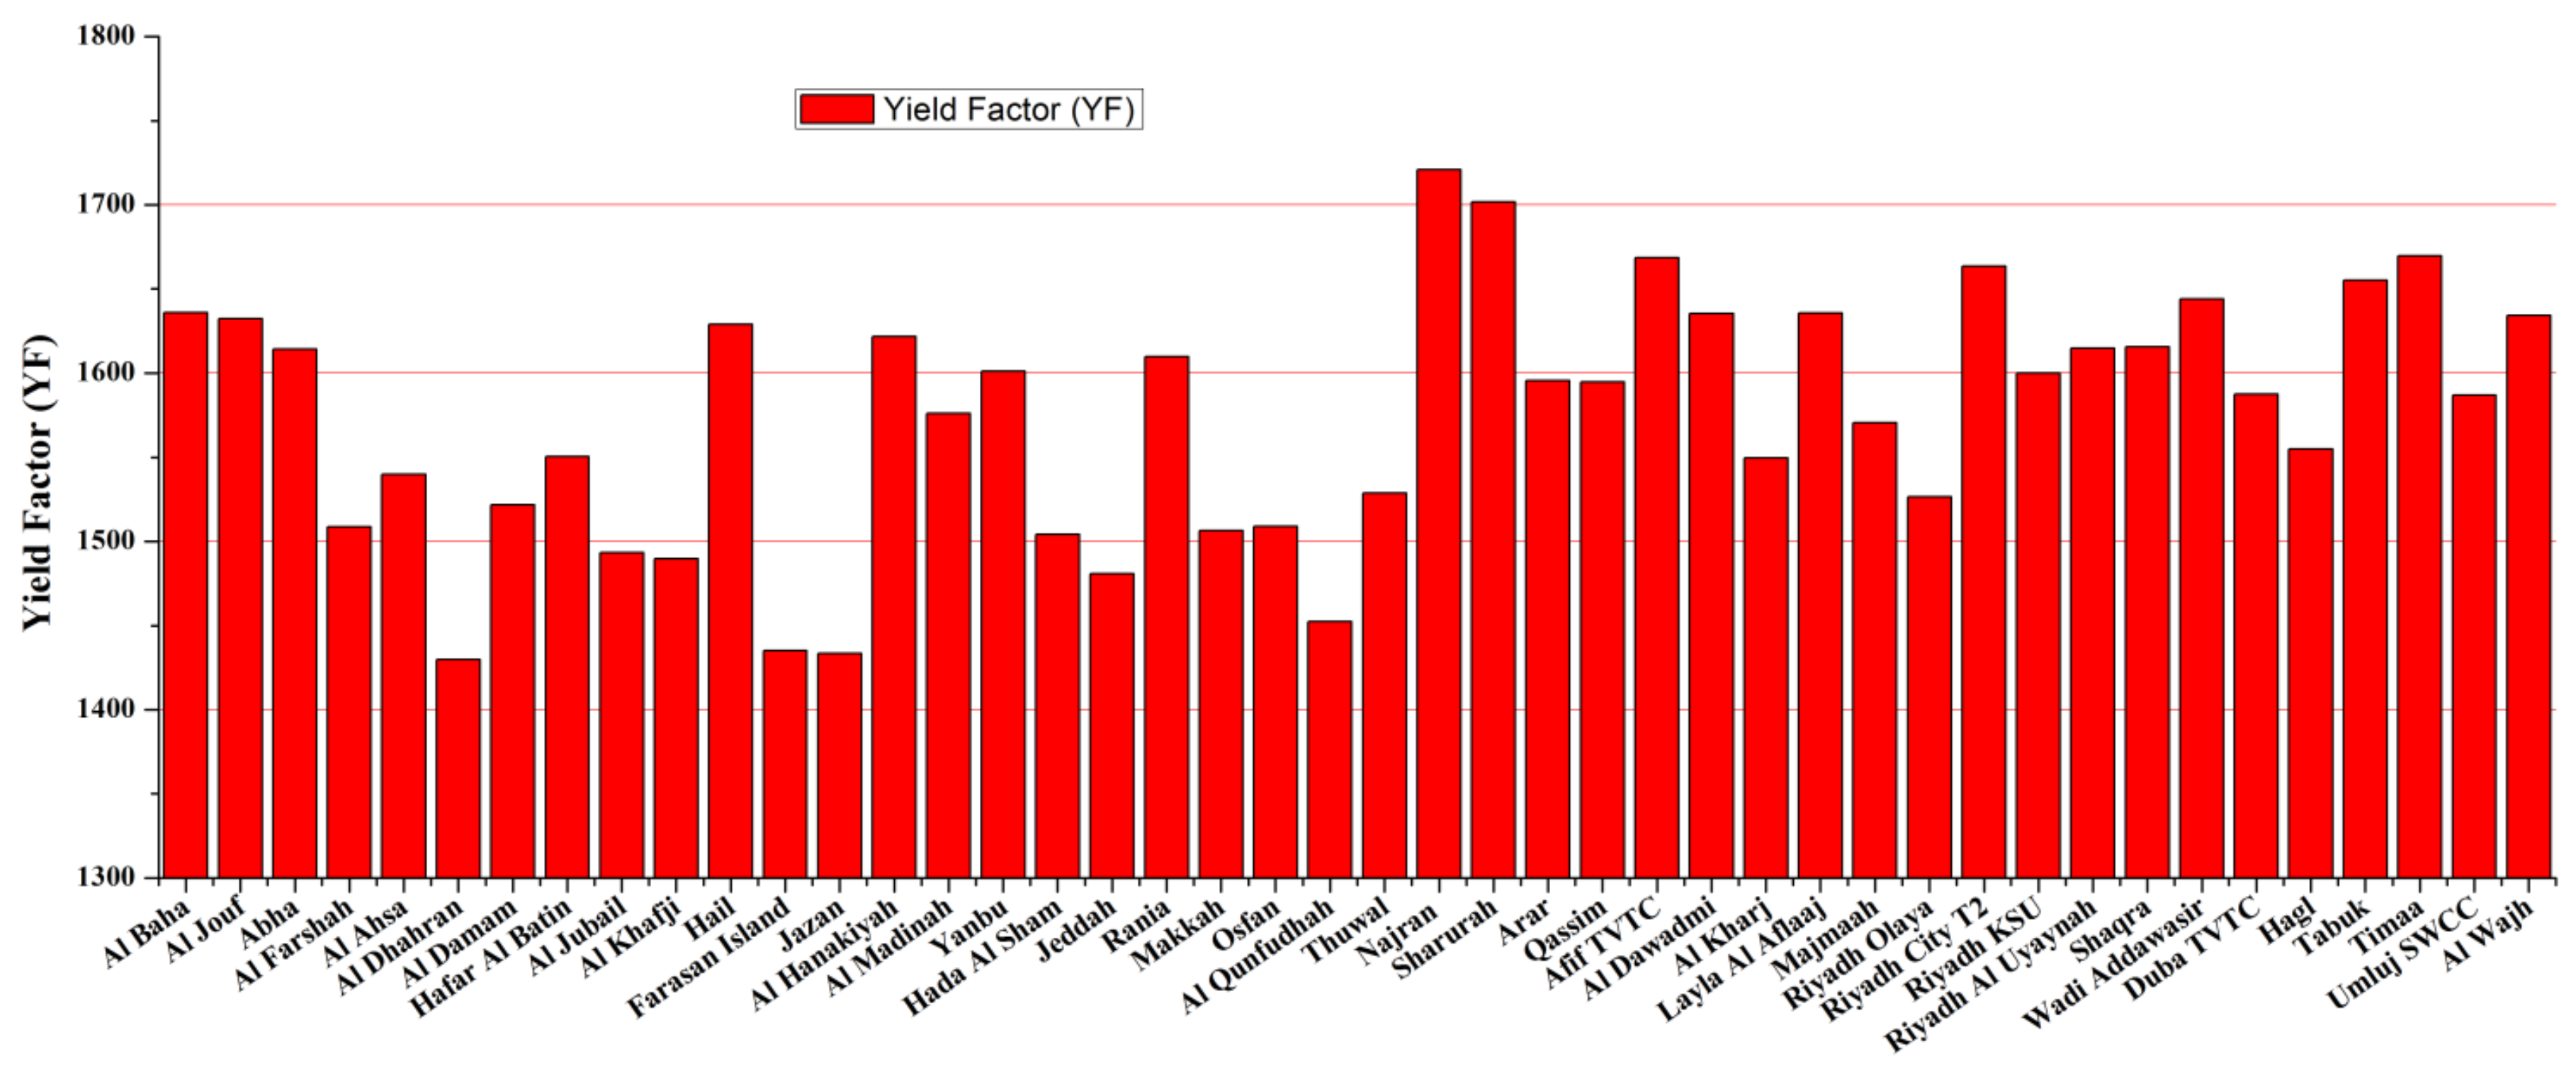
  • Annual yield factor (YF), which represents the number of times the PV system can produce its rated power over a period of one year;
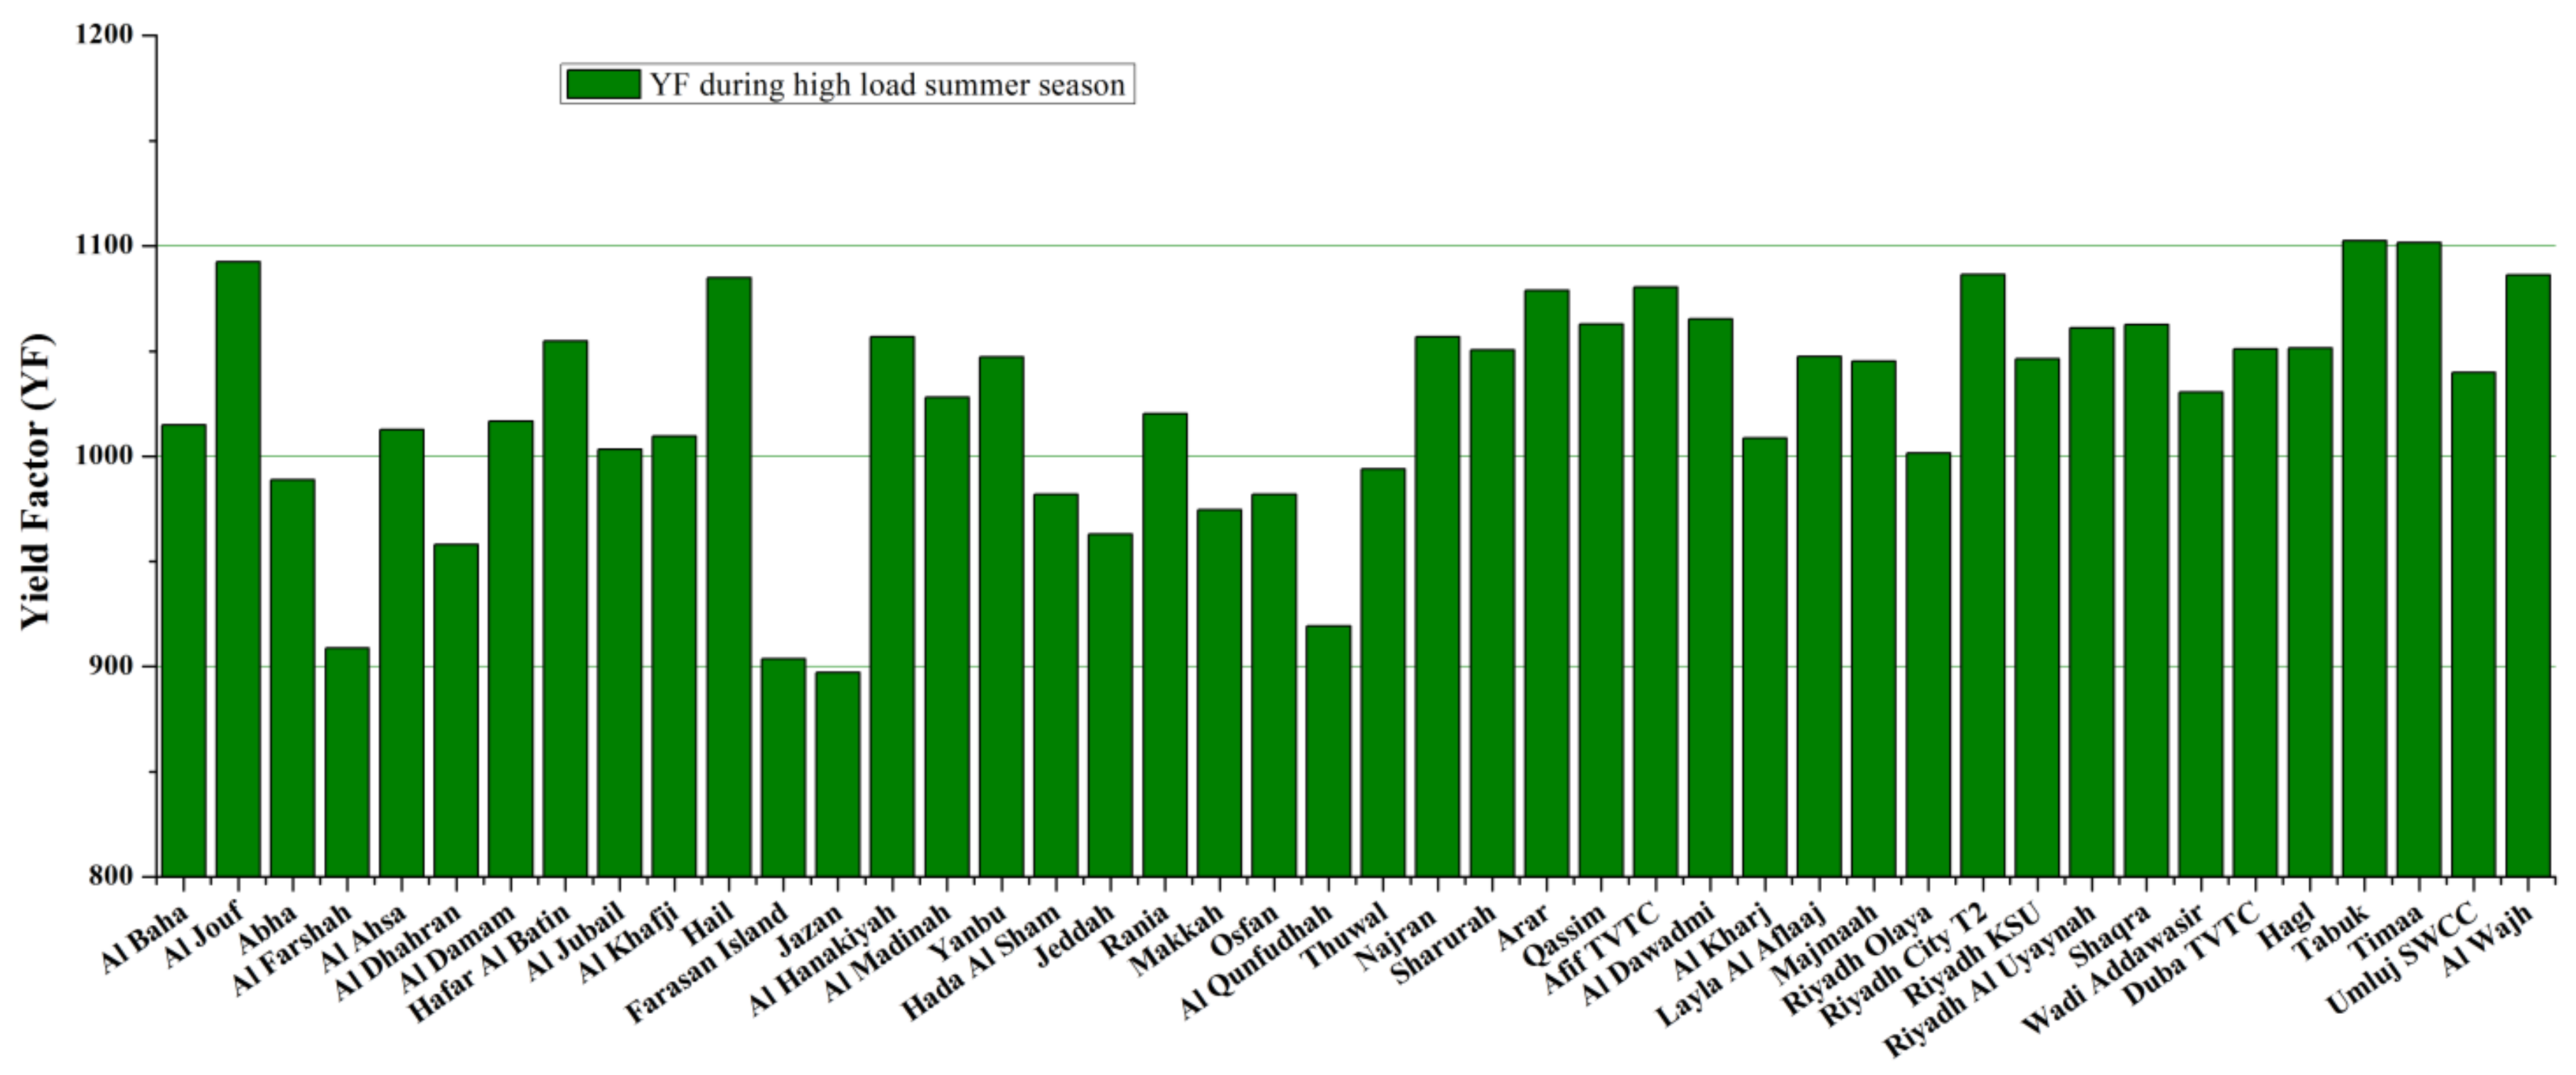
  • Summer season yield factor (YF), which represents the number of times the PV system can produce its rated power during a high load summer season;
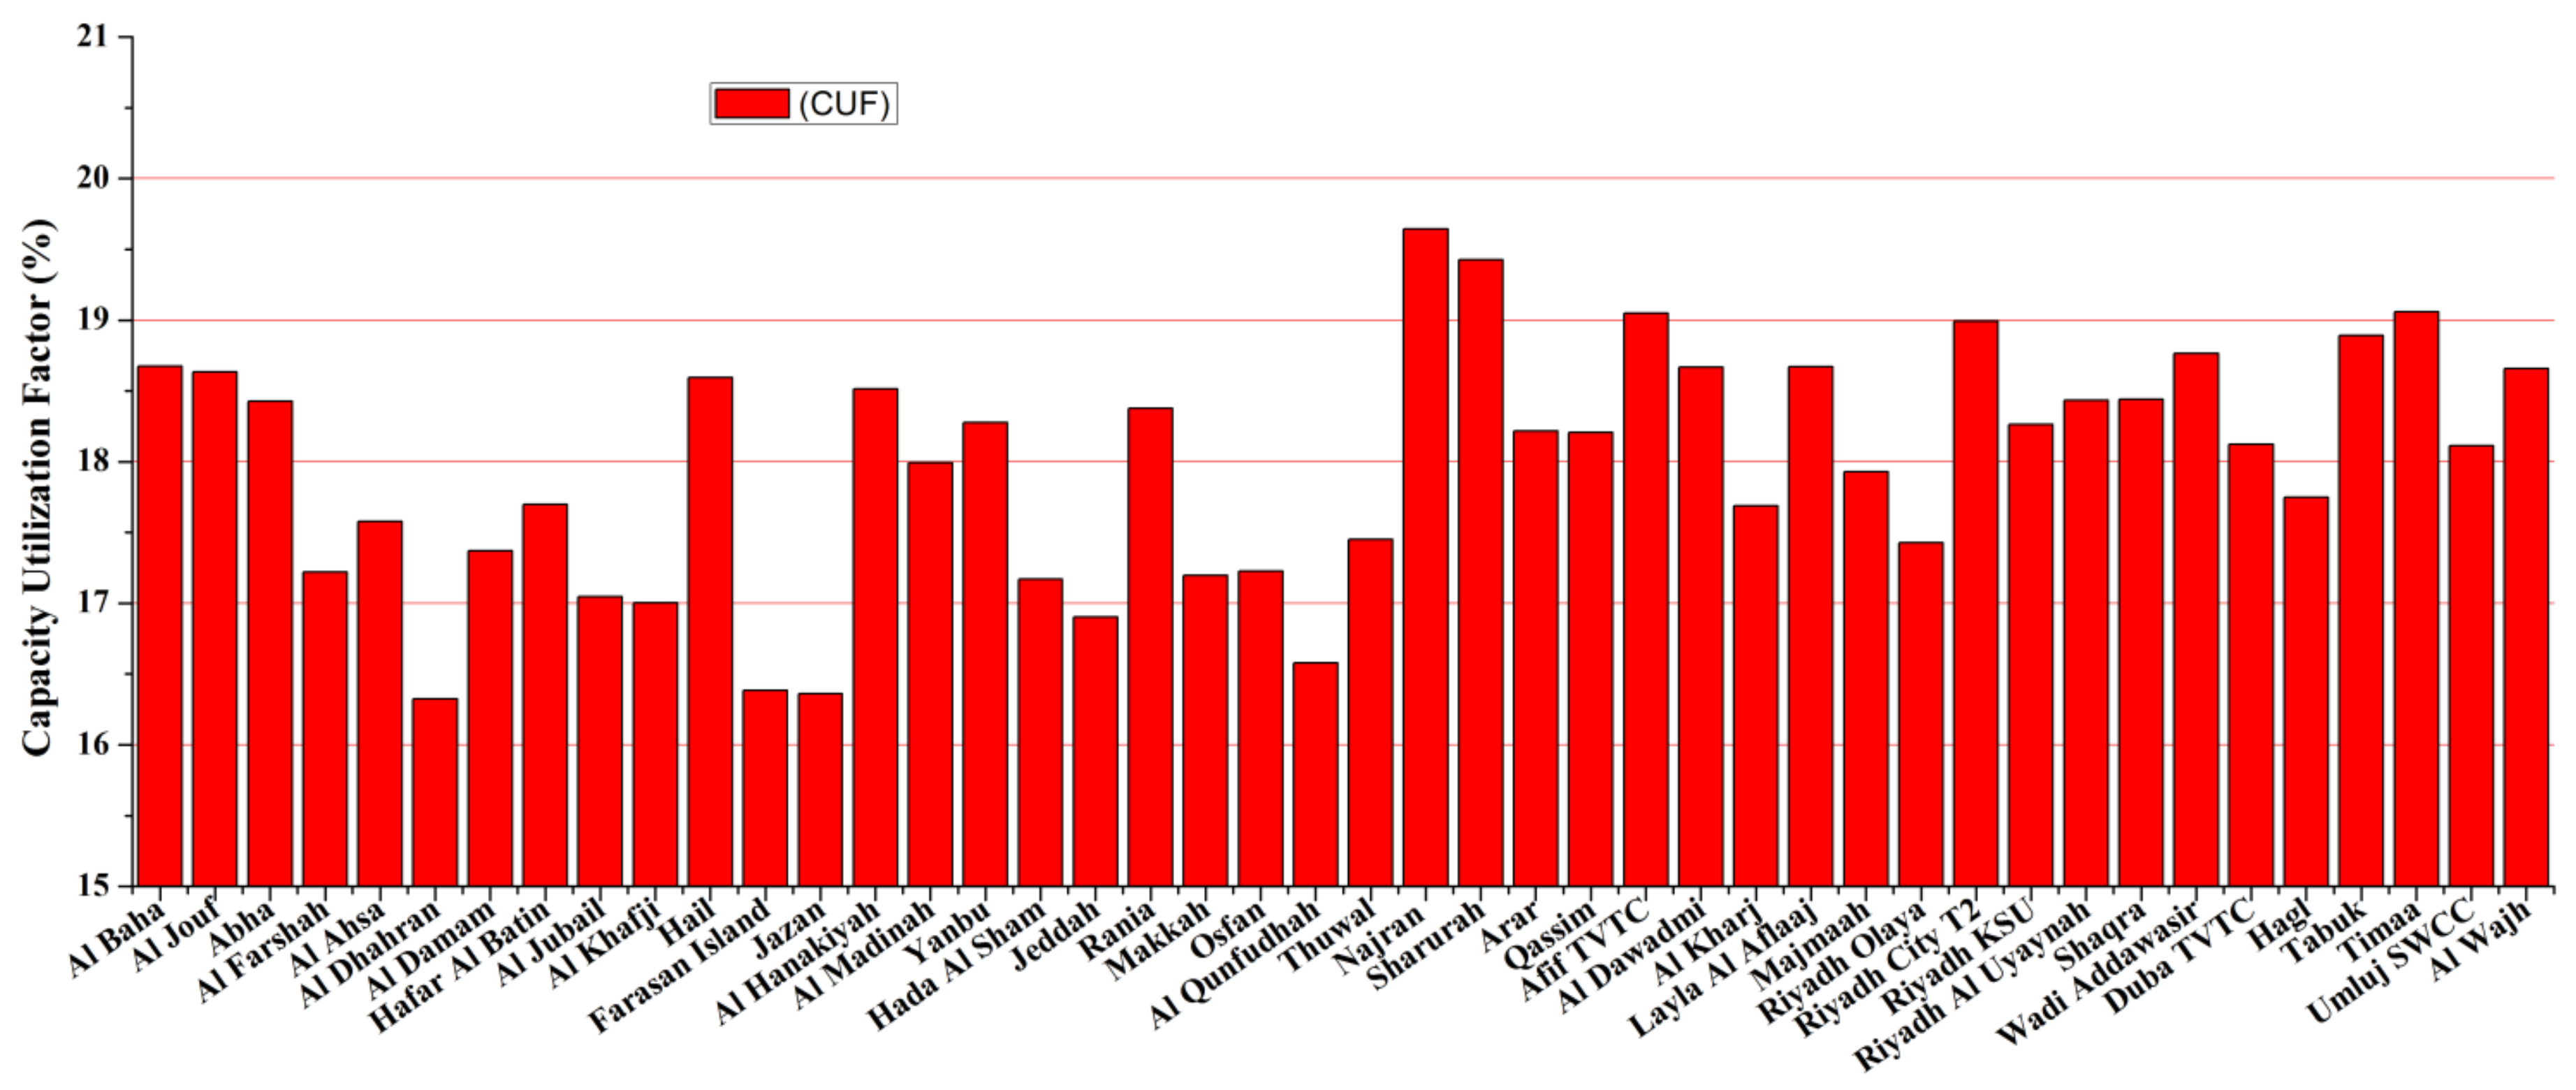
  • Annual capacity utilization factor (CUF), which measures the percentage of usability of a proposed PV system over a period of one year;
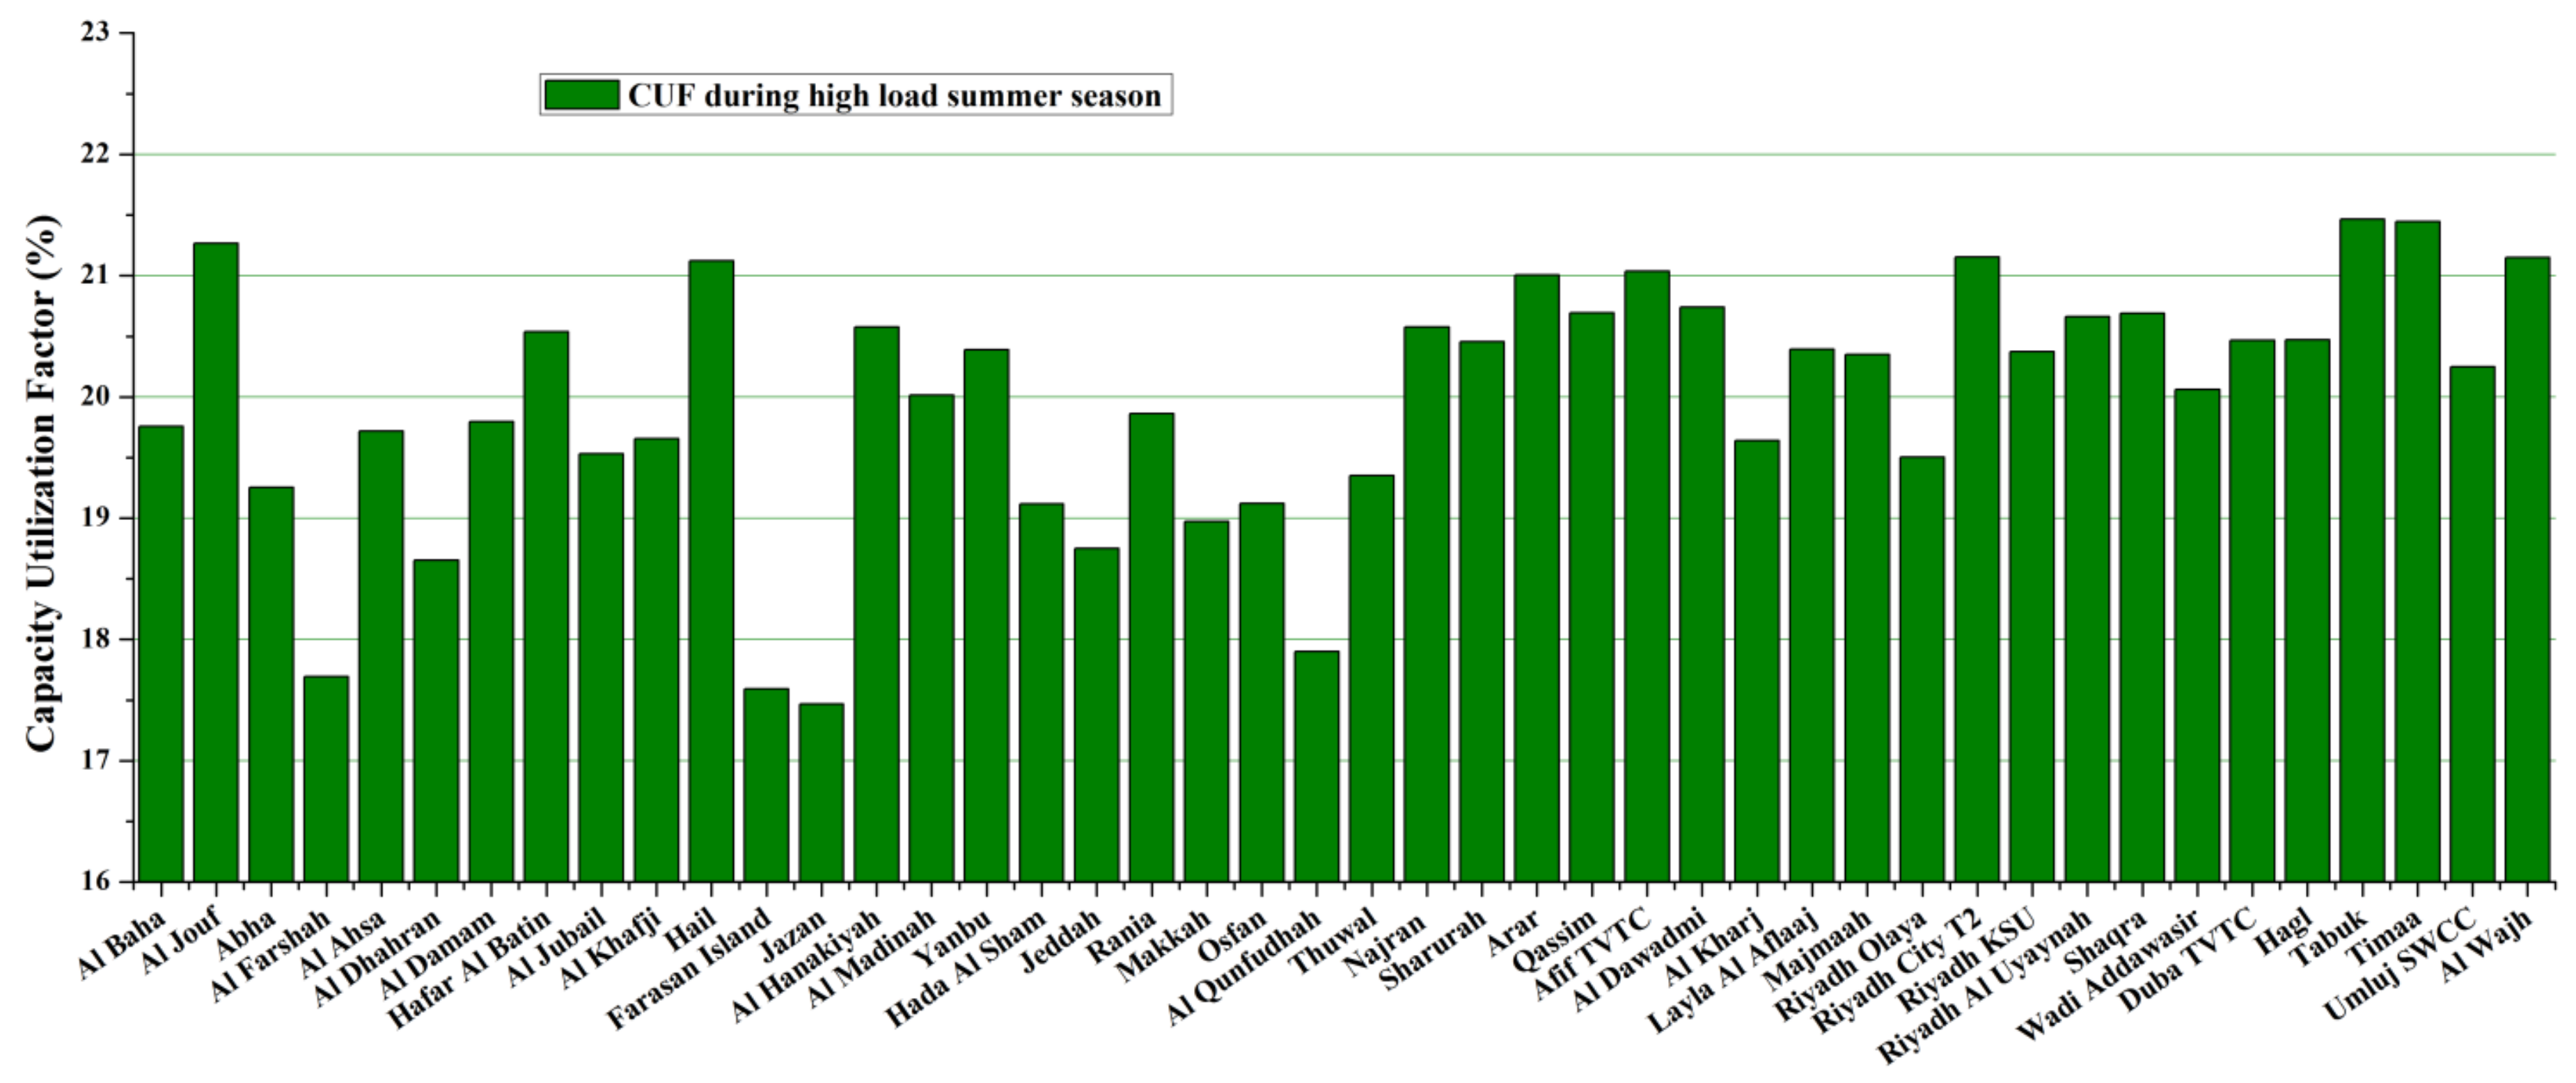
  • Summer season capacity utilization factor (CUF), which measure the percentage of usability of a proposed PV system during a high load summer season.

3. Results and Discussion

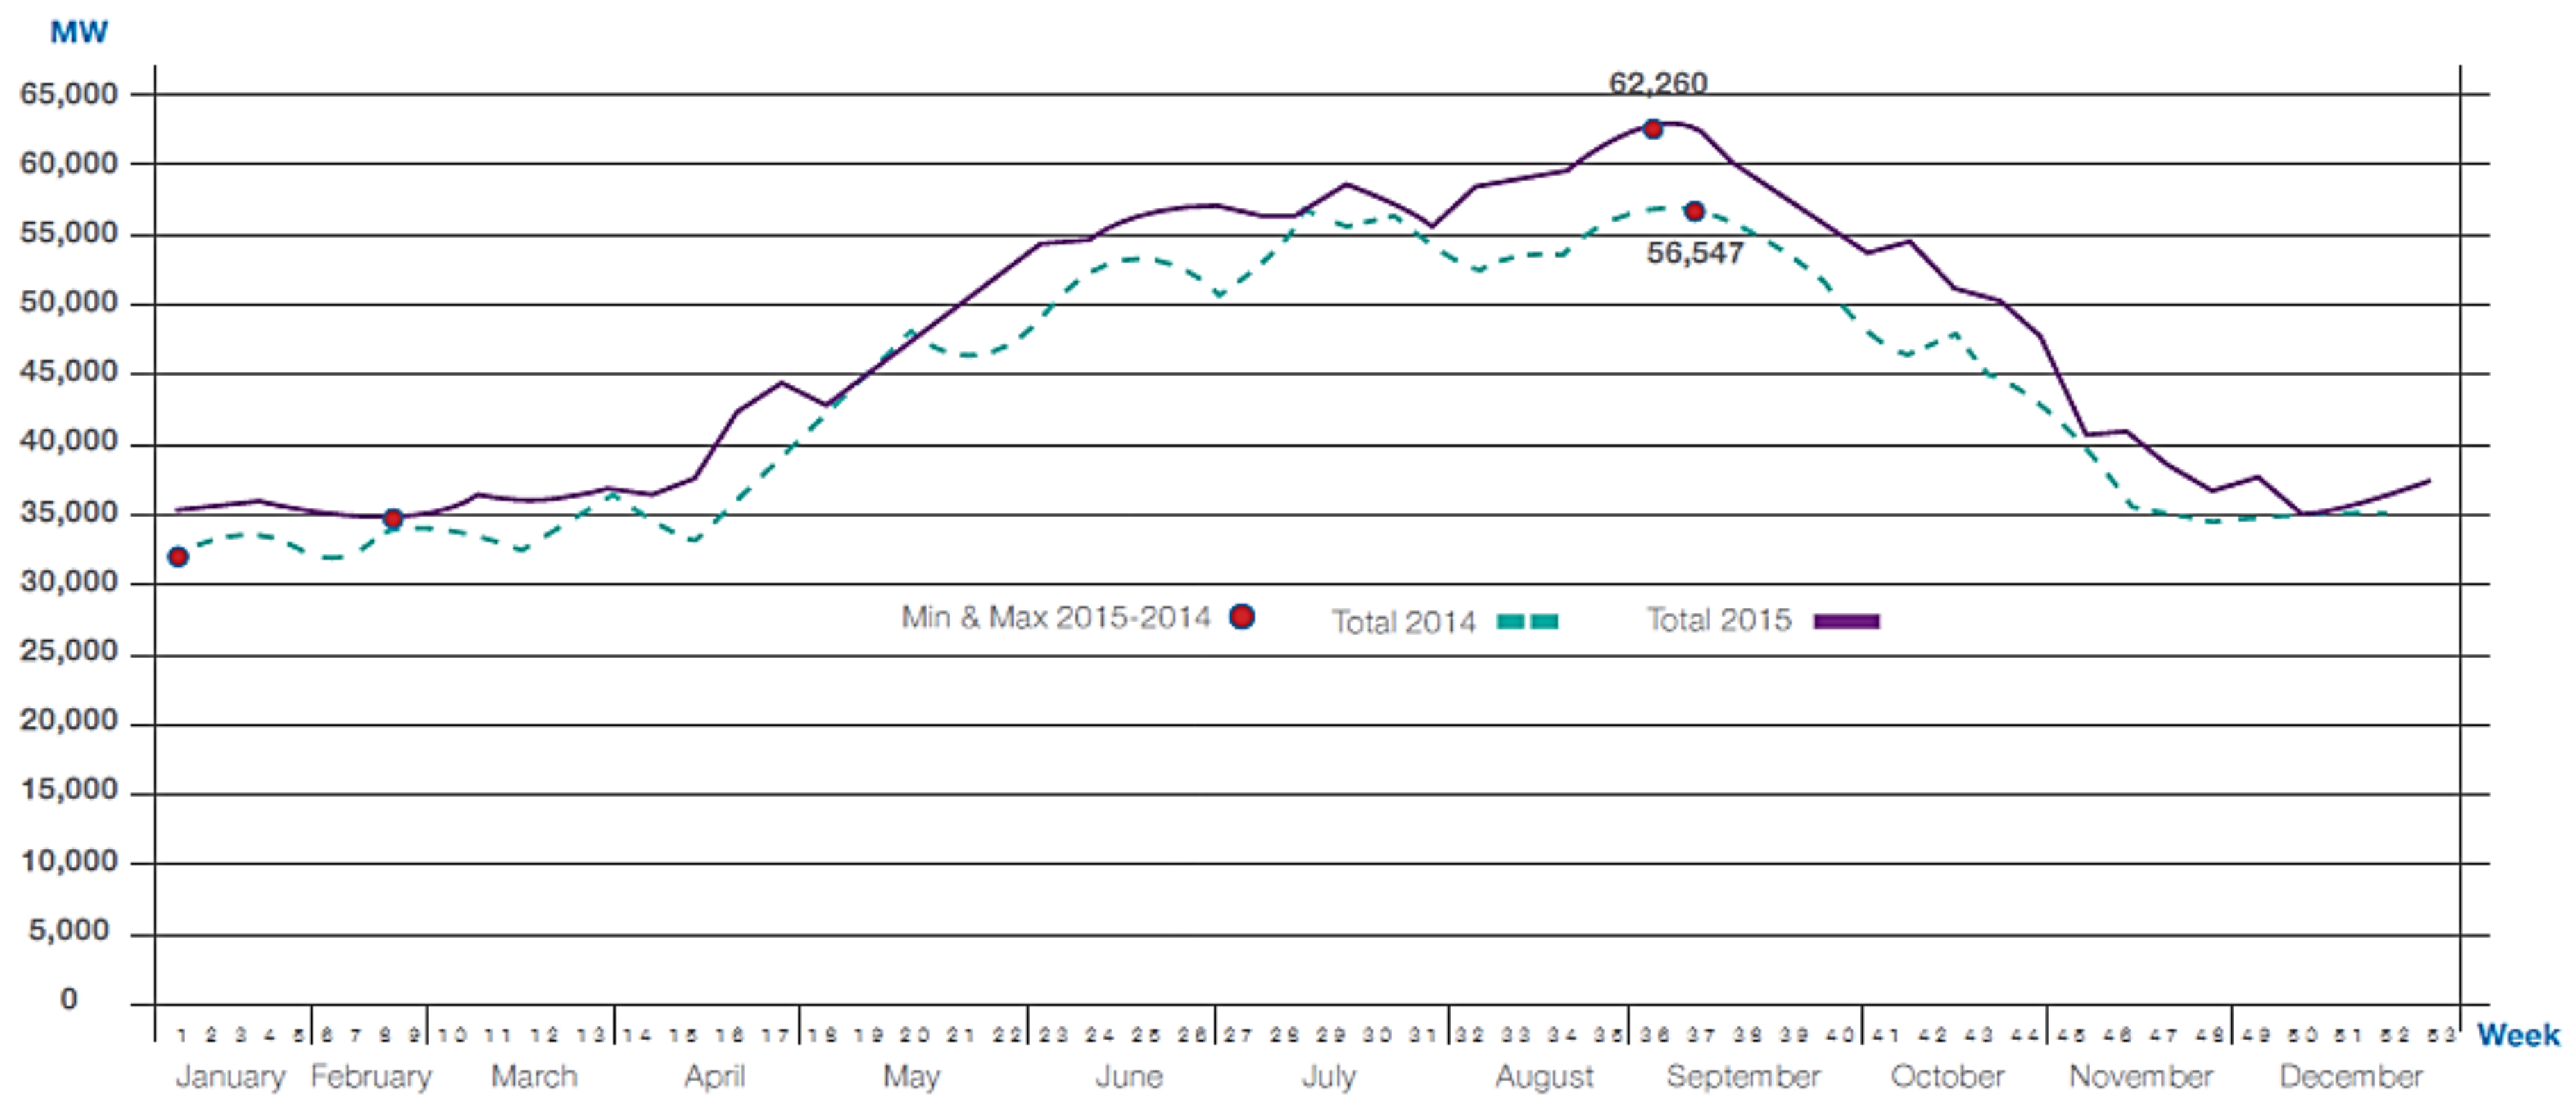
3.1. K.S.A Load Curve vs. Solar Irradiance Pattern

A very important angle of analyzing GHI values is to match the pattern of GHI over the period of one year with annual load curve of the country. It is very important that solar radiation patterns follow the load curve. If high solar radiation is available during those months of the year when the load of the country is high, then this high radiation can really help to cut the peak of the load curve by the inclusion of solar PV power in the system. Figure 3 shows the annual load curve of Saudi Arabia for two consecutive years 2014 and 2015 [42]. It can be seen in the load curve that the load is high during summer from the month of April to October. The load is almost double during summer months.
Figure 4 presents total daily average GHI curve of 44 stations over the period of one year. It is evident from Figure 4 that solar irradiance of most of the stations follow the load pattern and GHI is on the higher side from April to October. There are few stations where the GHI does not follow the load pattern and their high value does not follow the high load months.
In order to find the most feasible stations from solar irradiance point of view, we need to compare average daily total GHI of all the stations in high load season from April to October. Figure 5 shows average daily total GHI during summer-time high load from April to October. Al Farshah TQ TVTC, Jazan University, Farasan SWCC, Abha TVTC, Al Qunfudhah TVTC stations do not follow the load pattern and have low GHI during the peak load season. It can also be observed in Figure 4 as well. Al Farshah TQ TVTC and Abha TVTC stations are located in Abha province. This province has humid weather. Jazan University and Farasan SWCC stations are in Jazan province. Both of these stations are located in the southwest coastal area. Al Qunfudhah is located in the southwest of Makkah province and it is a coastal area station as well.
Timaa TVTC, AlJouf TVTC, Tabuk University, Riyadh K.A.CARE City T2, Hail TVTC, Arar TVTC, and Afif TVTC stations are the top-ranked stations with very high GHI values during the summertime. Timaa TVTC and Tabuk University stations are located in Tabuk province. Tabuk province is in the northwest region of the country. Arar TVTC is located in the northern border province. AlJouf TVTC, Riyadh K.A.CARE City T2, and Afif TVTC stations are located in the central province of Riyadh. Hail TVTC station is in Hail province, which is also central region of the country. From here, we can conclude that central and northern regions have high GHI during the high load summer period. These stations follow the load pattern very well. High GHI during the high load season indicates that solar PV power generation is suitable to replace the high peak load of the country during summertime.
The best site for solar PV generation is the one with high GHI in peak load season as well as high GHI throughout the year. In order to find the regions, which are most suitable for solar PV power generation, we compare the stations with high GHI over one annum and stations with high GHI during high load summer season from April to October. Names and GHIs of the top 10 stations over the period of one year and top 10 stations during of high load season are summarized in Table 4. We can identify four stations in Table 4, which have high GHI in both one-year period and summertime high load period. These stations exhibit very good average daily total GHI during summer and they have high average daily total GHI over the whole year as well. Looking at the load pattern of Saudi Arabia, it can be concluded that these four stations could be the best candidate sites for Solar PV generation.

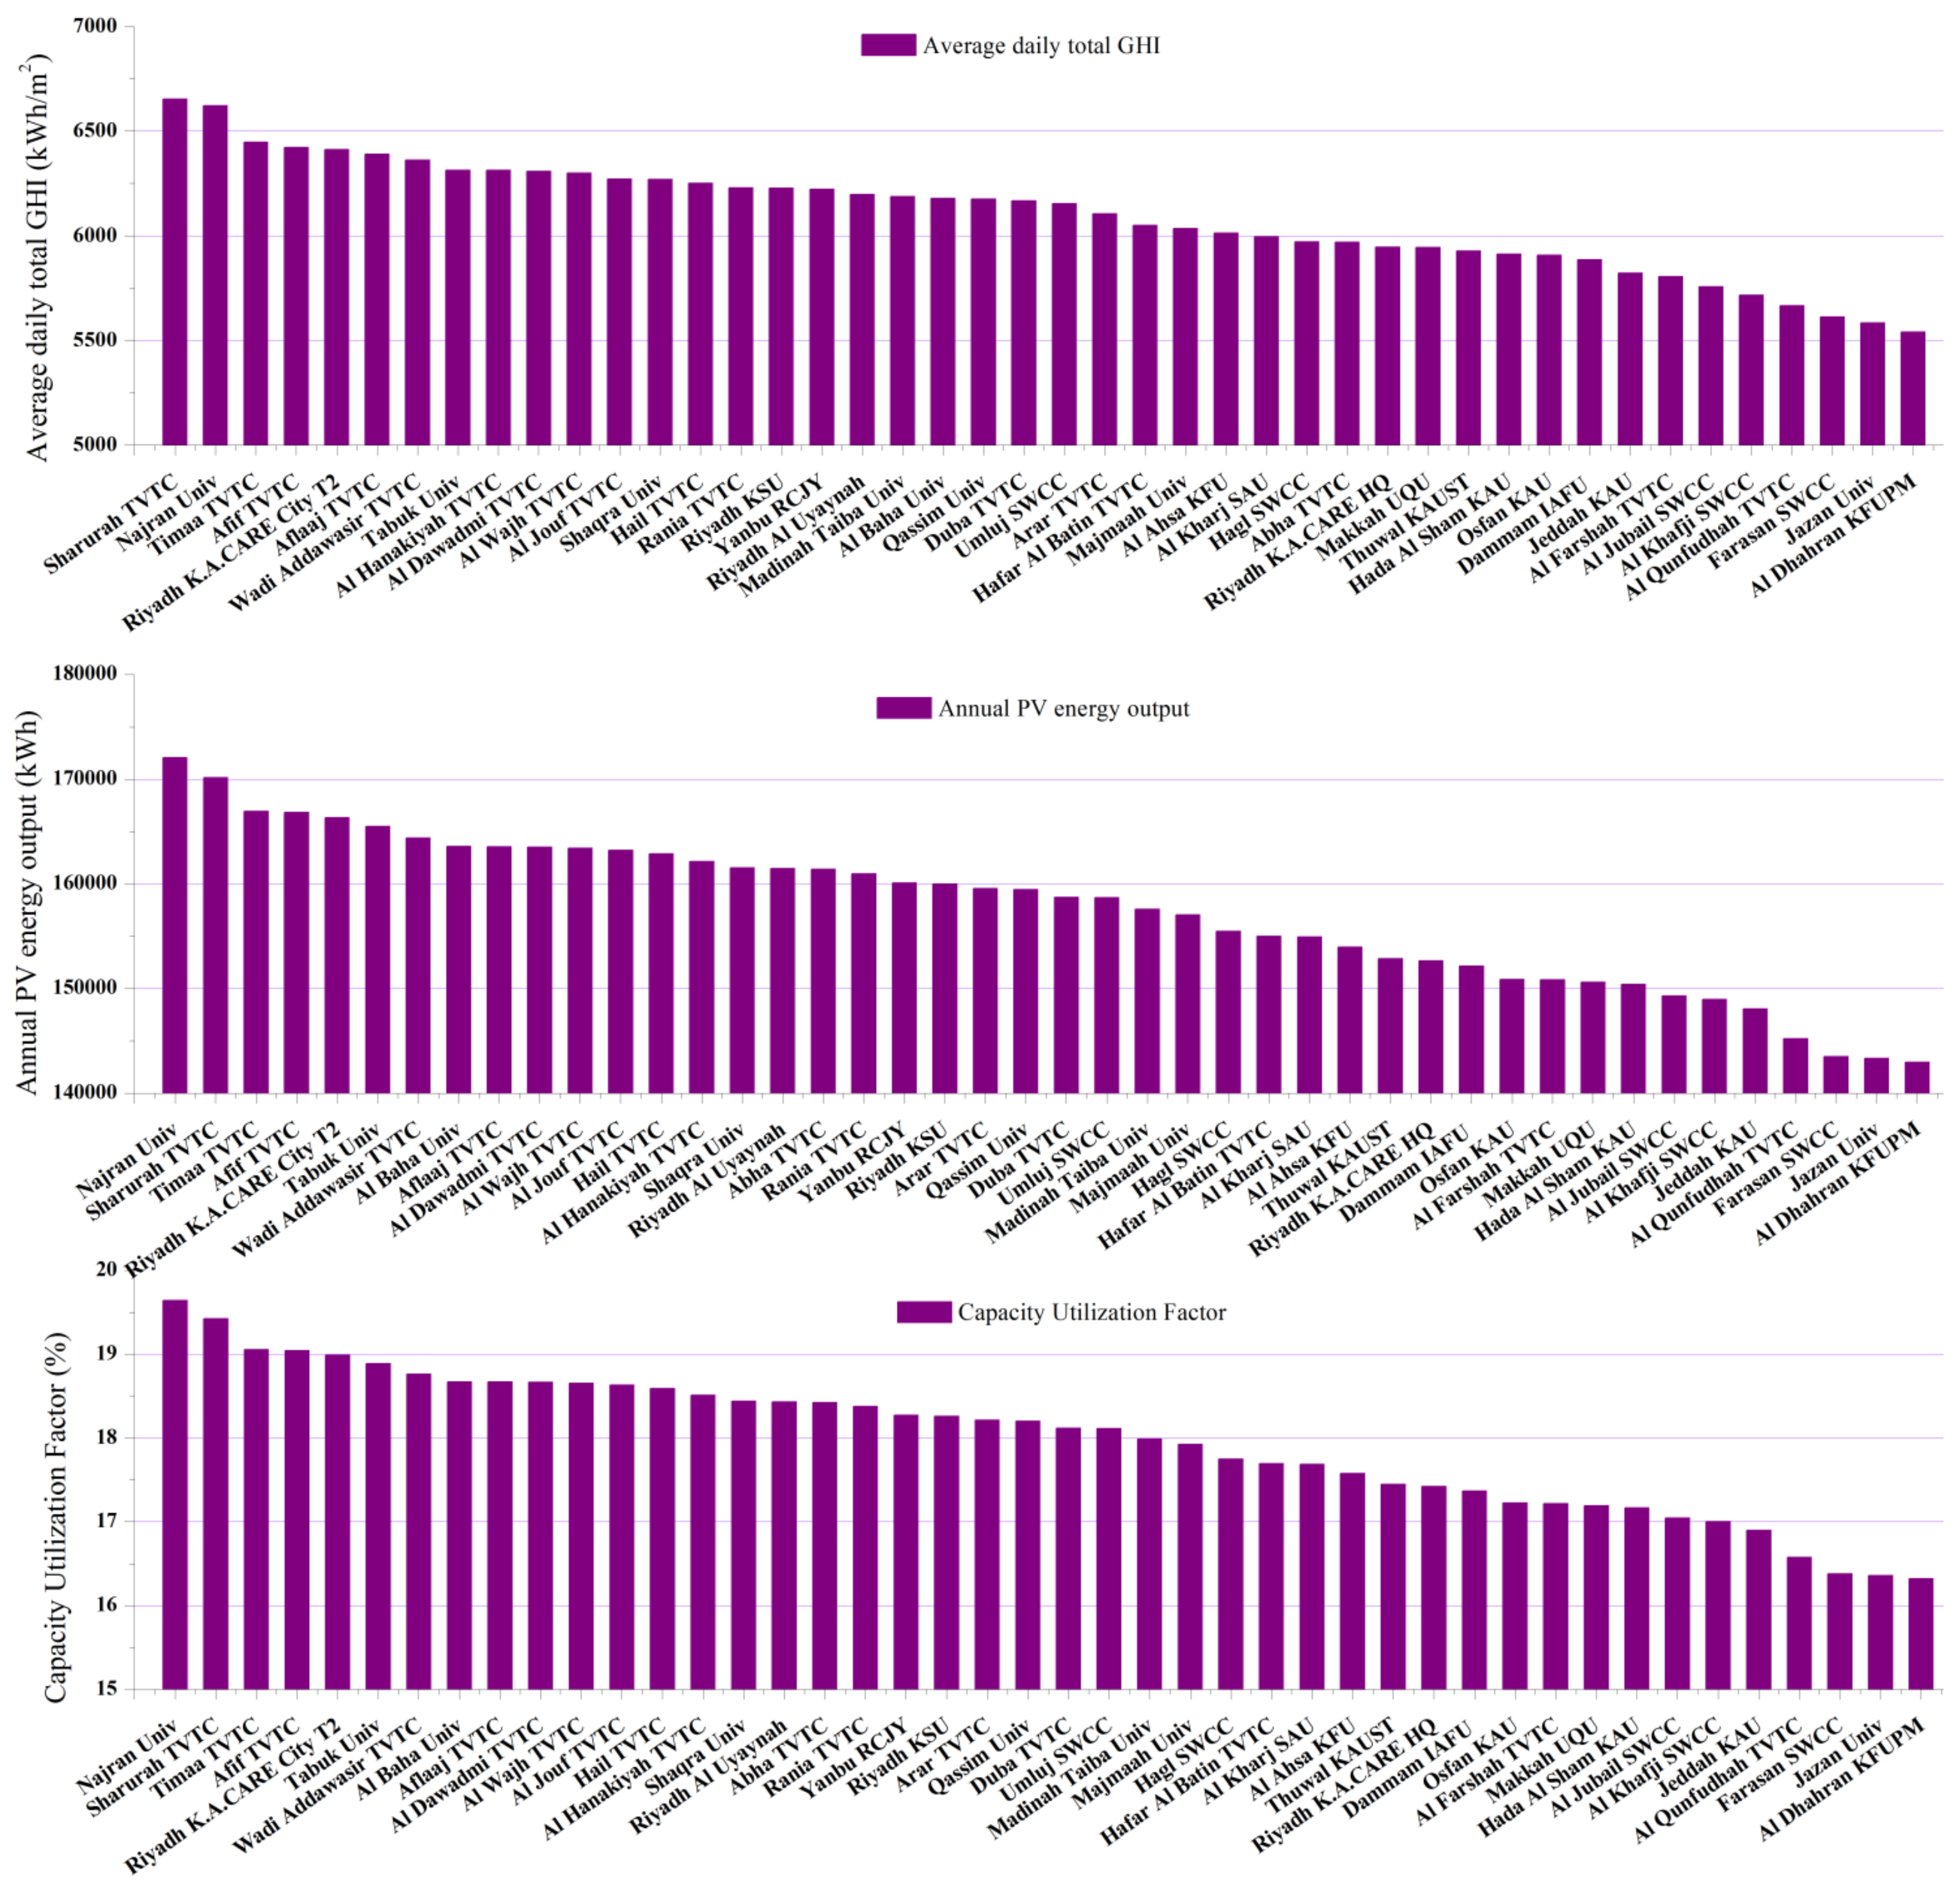
3.2. Performance Analysis of Photovoltaic System at Each Station

HOMER Pro software is used to find out the electrical energy production capacity of solar PV system at each station in various part of the Kingdom. A 100 kW solar PV system is designed in HOMER to obtain the PV power output at 44 different locations across the country. Flat plate mono-crystalline silicon modules are used in the analysis for HOMER software. The details about the module are provided in Table 5.

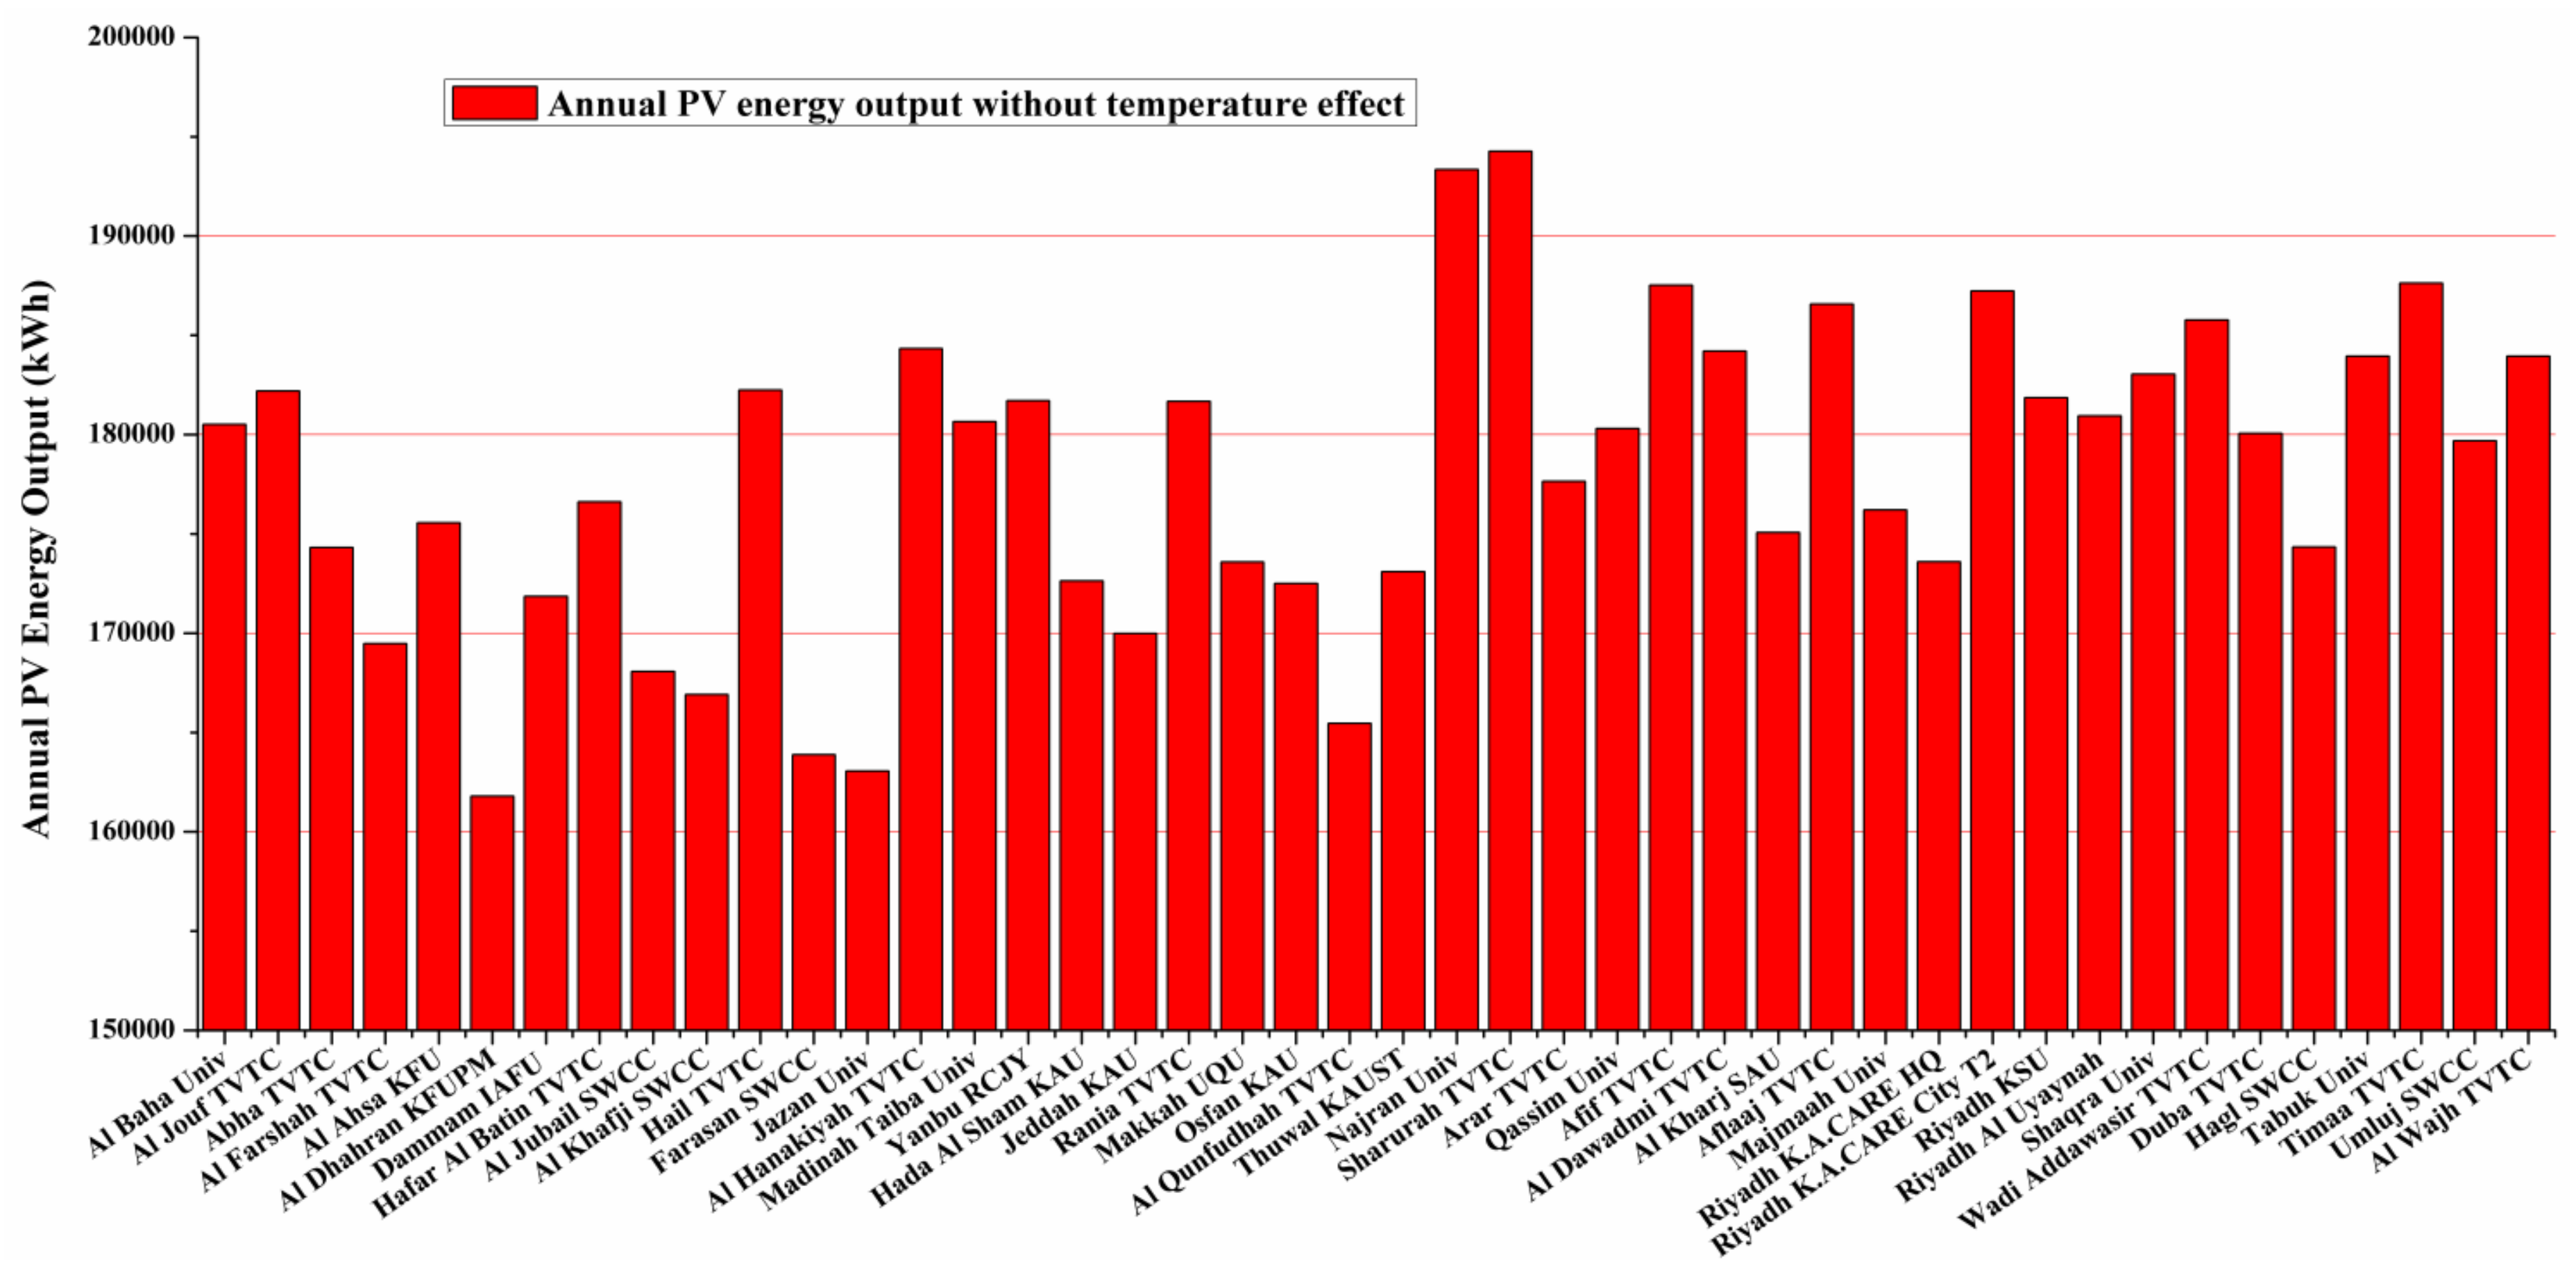
3.2.1. Analysis of PV System at 44 Locations

Figure 6 shows the total annual electrical energy produced by the proposed 100 KW solar power plant for 44 locations across the K.S.A. It is observed that Sharurah TVTC station gives the highest annual electrical energy output of 194,264 kWh followed by Najran University station with 193,351 kWh output. Timaa TVTC station produces third highest annual electrical output. Similarly, the three stations with the lowest annual electrical energy output are Al Dhahran KFUPM (161,793 kWh), Jazan University (163,053 kWh), and Farasan SWCC (163,875 kWh).
Temperature plays a pivotal role in the energy output productivity of PV modules. The output of the PV module decreases with increasing temperature. The ambient air temperature and daytime temperature of solar cells are not equal. As solar cells are dark in color, they absorb more sun energy, which causes a rise in cell temperature. As a result, solar cells operate at much higher temperature than the ambient air temperature. As the ambient temperature increases, cell temperature further increases and short circuit current somewhat increases but at the same time, open circuit voltage, fill factor (FF), maximum power output, and the efficiency decreases. Maximum output power of PV module decreases linearly with temperature [43]. The temperature coefficient of power for the selected module for this research is −0.45%/°C [44]. The output power of PV array is given by the equation
P P V = Y P V f P V ( G T G T ,   S T C ) [ 1 α p ( T C T C ,   S T C ) ]
where:
  • Y P V : power output of PV array under standard testing conditions [kW]
  • f P V : PV derating factor [%]
  • G T : solar radiations incident on PV array in the current time step [kW/m2]
  • G T ,   S T C : incident radiations at standard test conditions [1 kW/m2]
  • α p : temperature coefficient of power [ % / ° C ]
  • T C : PV cell temperature in the current time step [ ° C ]
  • T C ,   S T C : PV cell temperature at standard test conditions [ ° C ]
If we ignore the temperature effect on PV output then the above equation of PV out will reduce as under
P P V = Y P V f P V ( G T G T ,   S T C )
Figure 6 shows the PV output of 100 kW solar power plant without considering the effect of temperature. The K.S.A is a country with very hot and long summer season. The temperature in some areas reaches 50 °C during summer season. It can be observed in Equation (1) that PV output decreases linearly with increasing temperature, therefore, it is very important to consider the effect of temperature while finding the most feasible sites for solar PV generation. Table 6 shows the average monthly daytime temperatures of 44 locations under study [38].

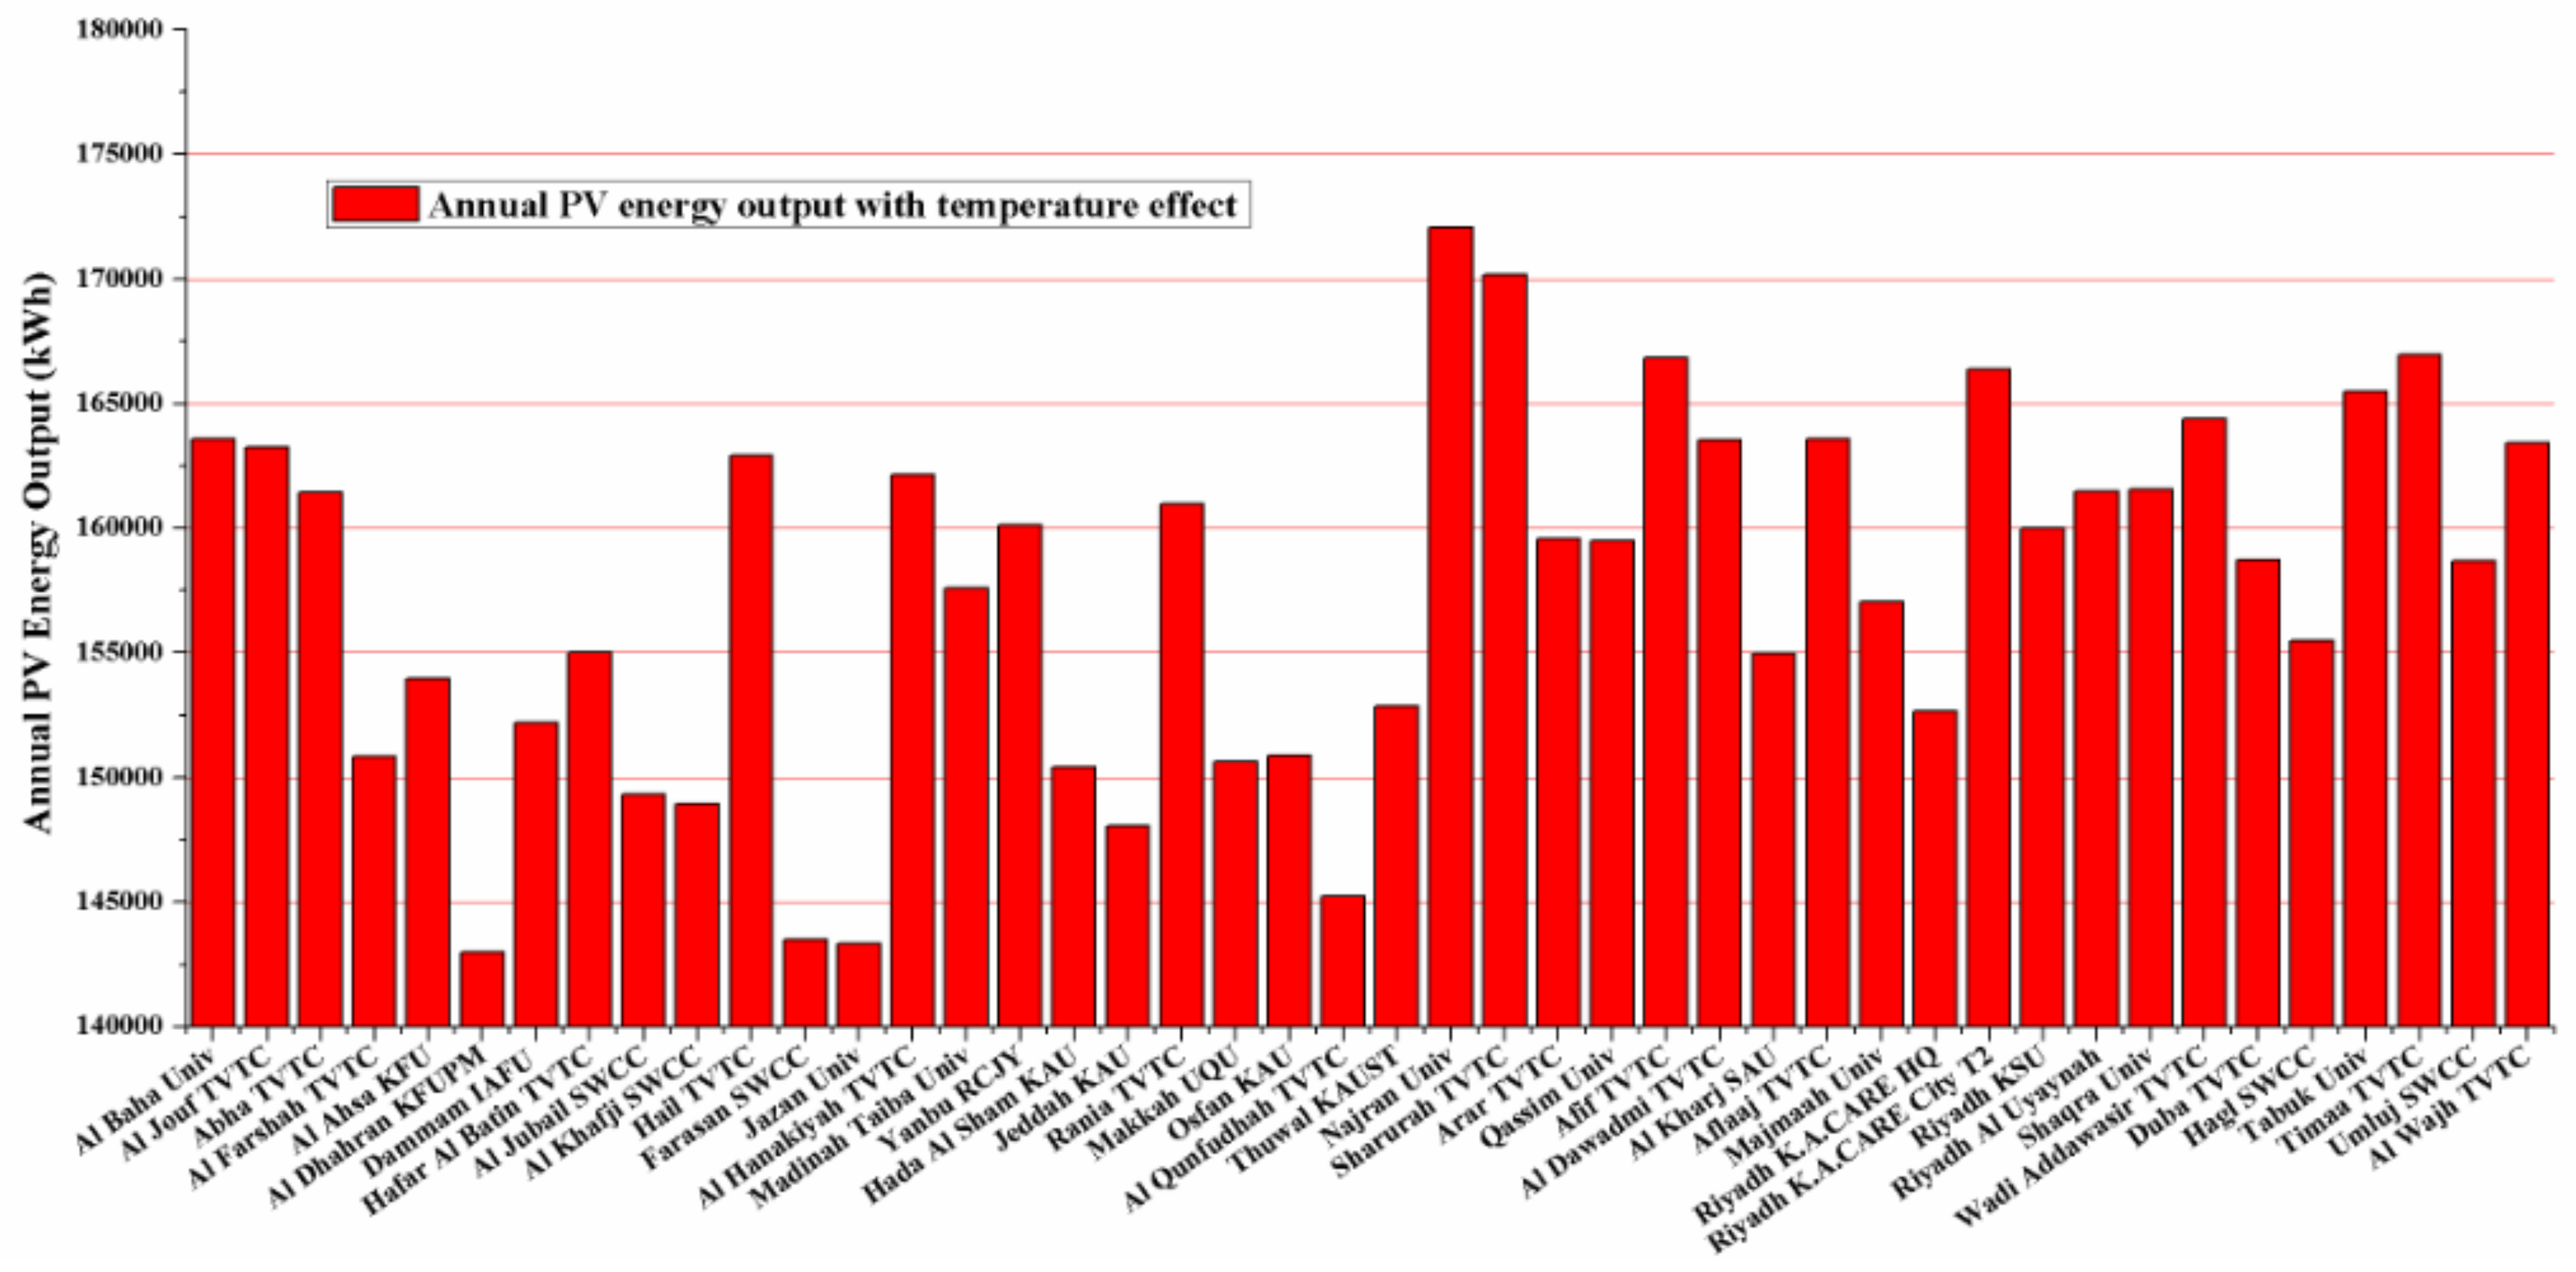
3.2.2. Analysis of PV System at 44 Locations Including Temperature Effect

Figure 7 shows the total annual electrical energy output of the proposed 100 kW solar PV plant by taking into account the effect of temperature on PV output at 44 locations across the Kingdom. It is observed that Najran University station gives the highest annual electrical output of 172,083 kWh followed by Sharurah TVTC station with 170,184 kWh output energy. It was the other way around when temperature effect was not included in the analysis. The reason behind the shift in top-ranked stations is the higher temperature in Sharurah and moderate temperature in Najran during the summer season. The average daytime temperature of Sharurah over one year study period is 31.3 °C and average daytime temperature at Najran is 28.4 °C. Timaa TVTC is the third best with 166,957 kWh output. It can be observed by comparing energy production of the proposed PV plant in two cases (with and without temperature effect) in Figure 6 and Figure 7 that if we consider the temperature effect, then ranking of most feasible stations may change. A particular station might have a good solar GHI but at the same time temperature at that site could be on the higher side and it will cause a reduction in the total annual output energy at that site. As Saudi Arabia is a hot country with very high temperature in the long summer season, so temperature plays a vital role in the selection of feasible PV sites.
Figure 8 shows the yield factor (YF) of the proposed PV system at 44 locations. Figure 8 indicates that Najran University station has the highest YF of 1721 followed by Sharurah TVTC station with a YF of 1701.8 and the lowest YF is observed in Al Dhahran station which is 1429.9. Figure 9 shows the capacity utilization factor (CUF) of the proposed PV system at 44 locations, which is the measure of percentage usability of the PV system. Najran University station has the highest CUF of 19.6% followed by Sharurah TVTC station with 19.4%, and the lowest CUF is observed in Al Dhahran station, which is 16.3%.

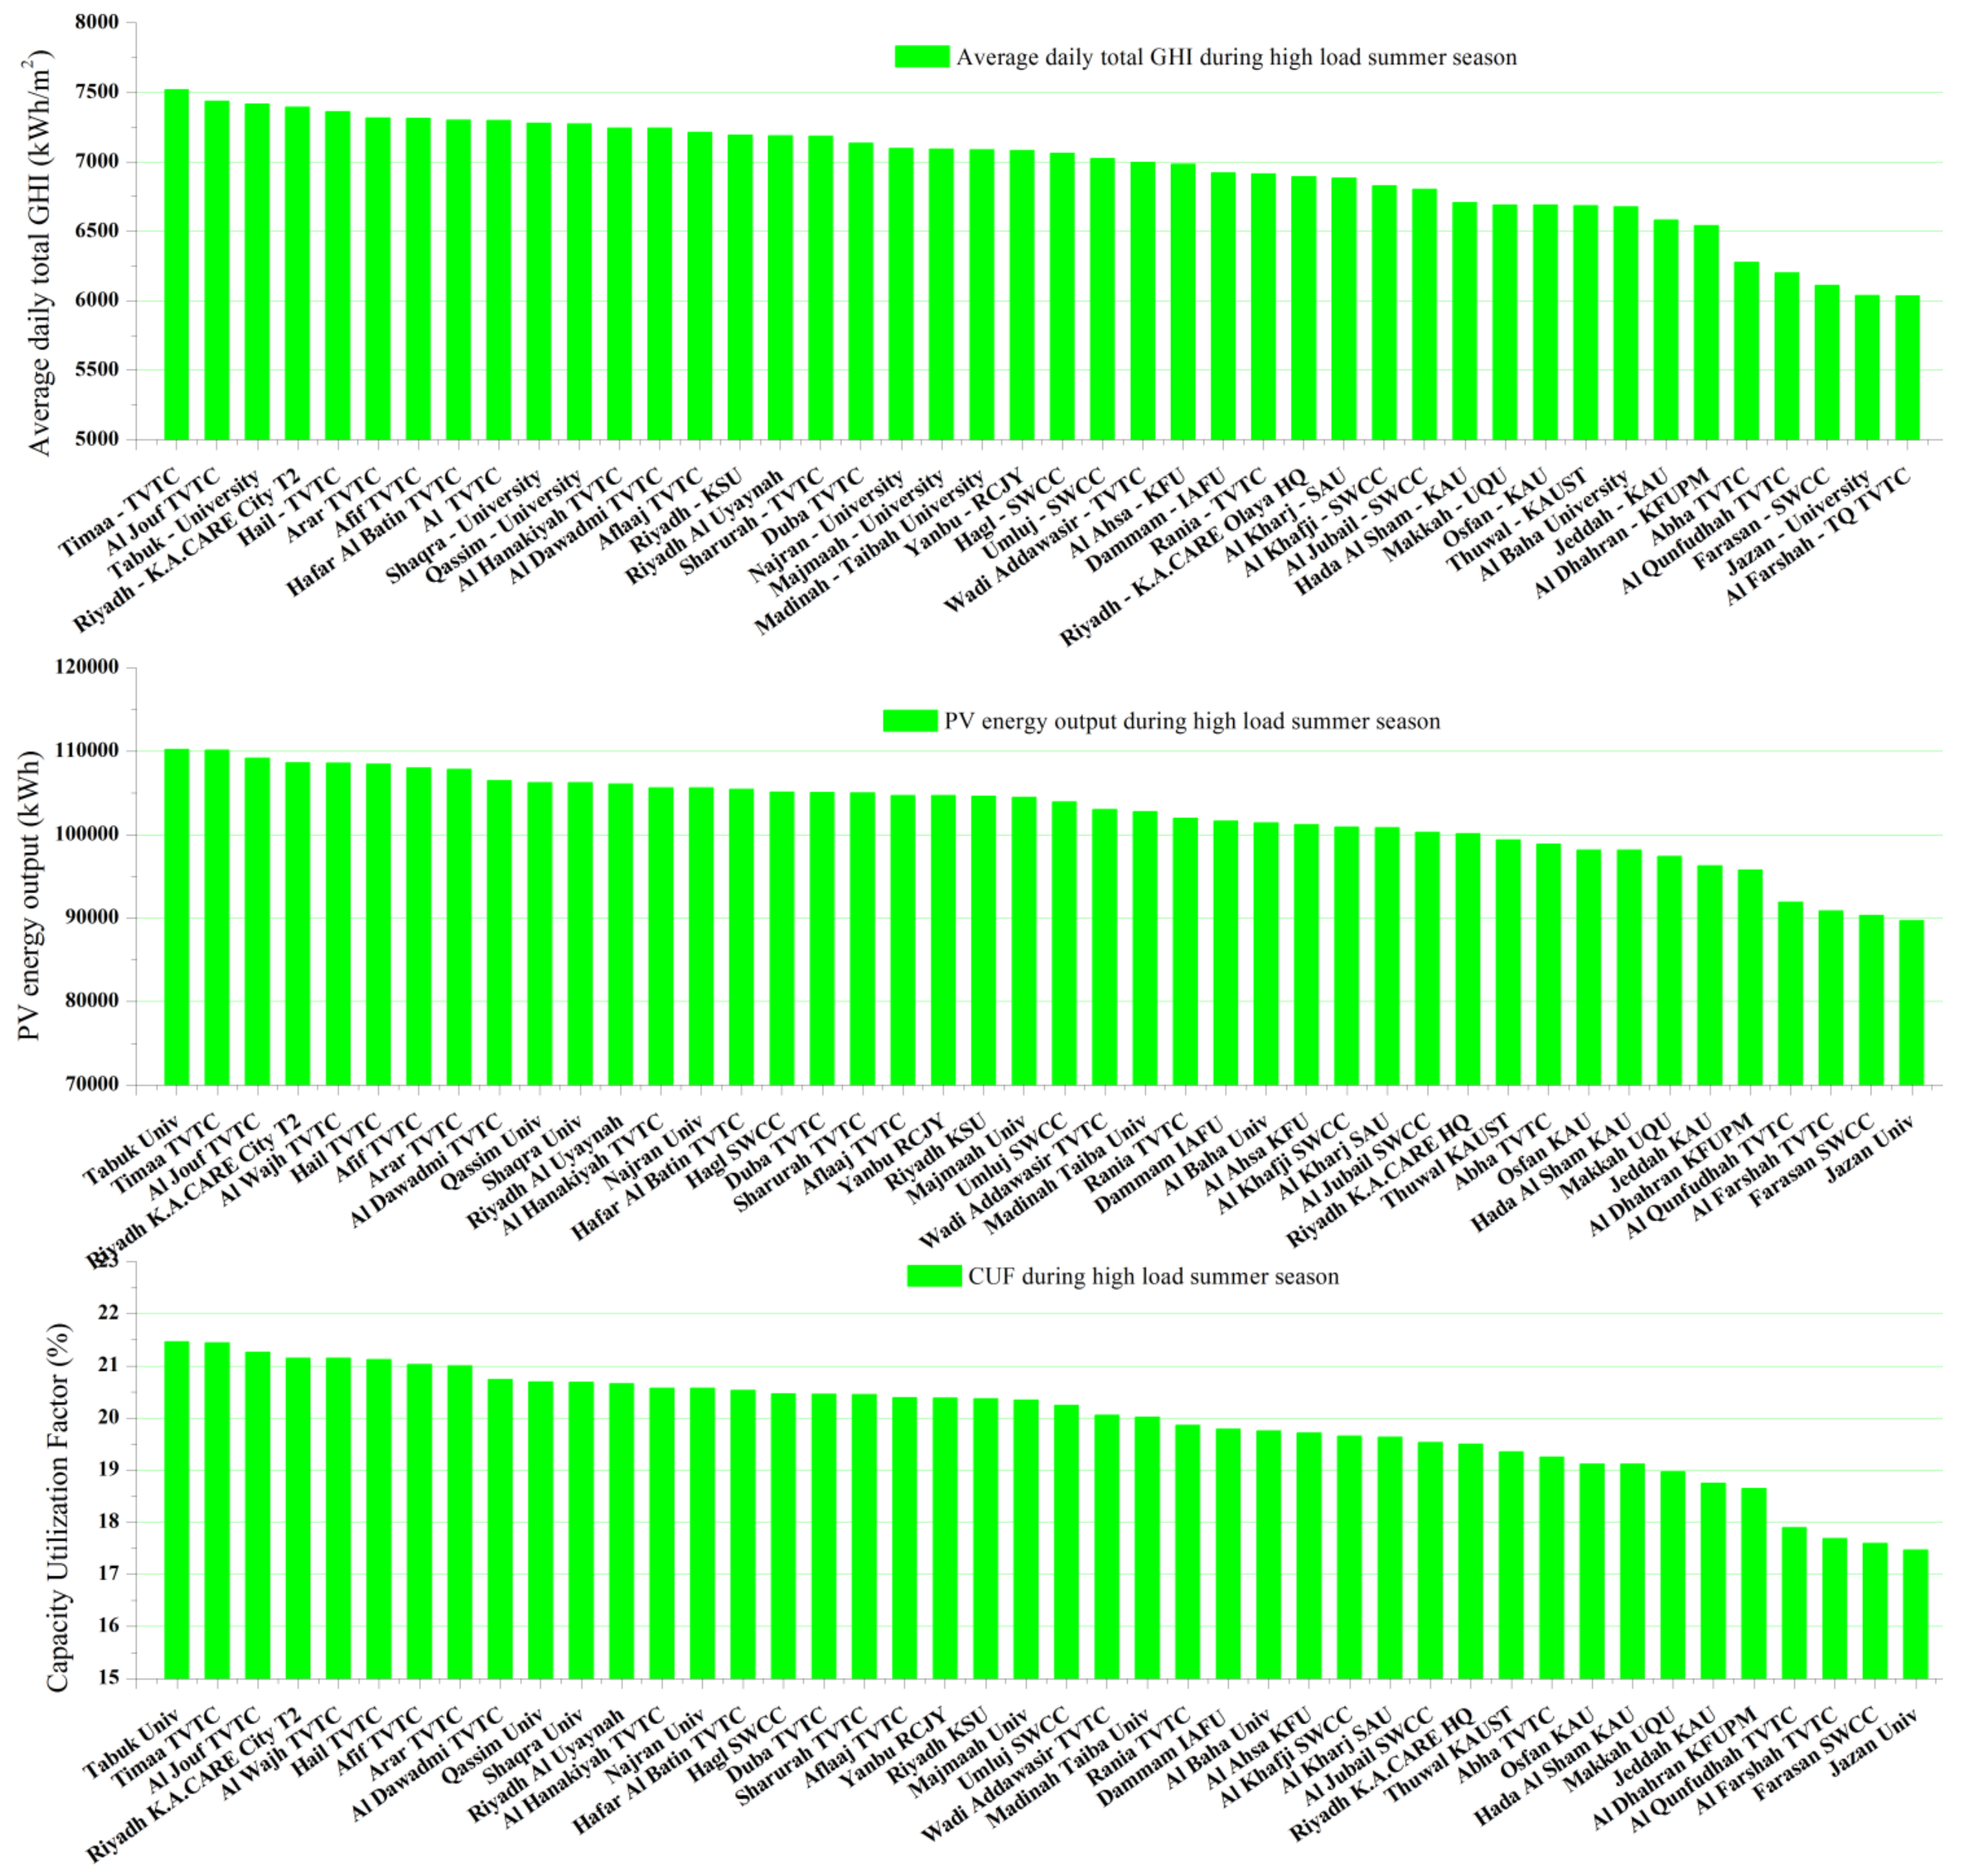
3.2.3. Analysis of PV System at 44 Locations in High Load Summer Season

The K.S.A has a unique load profile with the long summer season of high electric load from April to October. In order to find most feasible sites for solar PV generation, it is very important to consider the load profile as well. The K.S.A has to meet high load demand in the summer season, which is a very difficult task for electricity companies in the Kingdom. In this paper, one of the proposed selection criteria for the best site is to look for the solar PV feasible sites, which have high PV energy potential in the high load summer season. For this approach, the energy output production of a 100 kW PV plant is simulated in the high load summer season from April to October.
Figure 10 shows the energy output of the proposed PV plant at 44 locations during the high load summer months including the temperature effect. It can be observed in Figure 10 that Tabuk University station has the highest annual energy output of 110,250 kWh for the proposed 100 kW PV system during high load season and Timaa TVTC is at the second place with 110,148 kWh. Although Timaa TVTC has better GHI in the high load summer season as compared to Tabuk University station, but the high temperature at this location has pushed it down in the ranking. The average daytime temperature at Tabuk in high load summer season (April to October) is 30.8 °C and at Timaa is 33.1 °C. Al Jouf TVTC and Riyadh K.A.CARE City T2 are the next two in the list with 109,235 kWh and 108,647 kWh respectively.
Figure 11 shows the YF of the proposed PV system at 44 locations during high load summer season. It can be observed in Figure 11 that Tabuk has the maximum YF and Timma TVTC has the second best YF during high load summer season. Jazan has the minimum YF of 987.2 during high load summer season. Capacity utilization factor of proposed PV system during high load summer season at 44 locations is presented in Figure 12. Tabuk and Timma are closely placed at the first and second positions with PV CUF of 21.46% and 21.44% respectively followed by Al Jouf TVTC with third best CUF of 21.27%. Jazan has the lowest CUF of 17.47%.

3.3. Ranking of Stations

Figure 13 shows the ranking of 44 station sites under study based on the average daily total GHI, annual energy output, and CUF of a proposed 100kW PV system at each location over the period of one year. Here, it can be observed that the top-ranked stations with respect to average daily total GHI do not share the same ranking position in annual PV energy output and CUF ranking. Therefore, it can concluded that a station with highest average daily total GHI does not guarantee to be the best station for solar PV power production because ambient temperature at the site plays a vital role in PV output energy production. Sharurah TVTC is the top-ranked station with highest average daily total GHI but when this station is tested with a 100 kW PV plant, then it is moved to second place with respect to energy output and CUF. Najran University station, which has the second highest average daily total GHI but it is the top-ranked station when it comes to PV energy output and CUF because of the moderate temperature in Najran as compared to Sharurah. Similarly, Tabuk University station has moved up from eighth to sixth position above Layla Al Aflaaj and Wadi Addawasir stations. On the other hand, Layla Al Aflaaj has the sixth highest average daily total GHI but it is moved down to ninth place with respect to PV energy output and CUF. The reason again is the moderate temperature at Tabuk and relatively higher temperature at Wadi Addawasir and Layla Al Aflaaj stations. Daytime average temperature at Tabuk station is 25 °C, while daytime average temperatures at Wadi Addawasir and Layla Al Aflaaj stations are 29.6 °C and 30.7 °C respectively. Al Hanakiyah has the ninth best average daily total GHI but it is not in the top 10 PV energy output stations. Similarly, Al Baha station is not in the 10 best daily GHI stations but it is at number 8 in the top 10 stations with respect to PV energy output and CUF of PV plant. Daytime average temperature at Al Hanakiyah and Al Baha stations are 30 °C and 25.5 °C respectively. Out of top 10 stations with respect to GHI, 4 have different rankings when listed with respect to their CUF and PV energy output.
Figure 14 shows the ranking of 44 stations during high load summer season based on the average daily total GHI, PV energy output, and CUF of proposed 100 kW PV system at each location. There are a greater number of shifts in the position of top-ranked stations when a comparison is performed during high load summer season. With respect to GHI, 7 out of top 10 stations have different rankings when they are listed with respect to their PV energy output and CUF in high load summer season and 2 stations even do not find a place in top 10 PV energy output and CUF stations. Hafar Al Batin and Shaqra University stations have the 8th and 10th best GHI in K.S.A in summer season but they are not in the top 10 PV energy output and PV CUF stations ranking. Greater number of shifts here is due to very hot summer in the K.S.A.
A comparison of the top 10 stations with respect to GHI and top 10 stations with respect to PV energy output, and shift in the position of stations over the period of one year and during the high load summer season is presented in Table 7. It is clear that high average daily total GHI is not a sufficient criterion to find the best location for a PV plant because there are other factors which affect the PV energy output as well. The magnitude of the impact of other factors could be different under different weather conditions in different countries. As the K.S.A has hot weather, impact of temperature on PV energy output is greater.
The proposed criterion to choose the most feasible sites is to select only those sites, which find their place in top-ranked stations in both cases (high annual and high summer). The sites selected based on this criterion are feasible both economically and clipping the high load peaks in summer months. The scores of top-ranked sites in each case (high annual and high summer) and their rankings are shown in Table 8. Timaa TVTC, Tabuk University, and Al Wajh TVTC stations are located in the northern province of Tabuk. Riyadh K.A.CARE City T2, Afif TVTC, and AL Dawadmi TVTC stations are located in the Central province of Riyadh. Tabuk province in the northern region and Riyadh province in the central region are the two most feasible regions for solar PV generation. The overall score of Tabuk province is 38 (Timaa TVTC: 17, Tabuk University: 15 and Al Wajh TVTC: 6) and an overall score of the central province, Riyadh, is 27 (Riyadh K.A.CARE City T2: 13, Afif TVTC: 11 and AL Dawadmi TVTC: 3). From here, it is concluded that northern province of Tabuk is the most feasible region for solar PV generation. Two of the top three stations in Tabuk region are Tier 1 stations with low level uncertainty of ±2% and all three stations of Riyadh region are Tier 2 stations with medium level uncertainty of ±5%. The results for the Tabuk region are relatively more accurate than the Riyadh region. The Tabuk region lead by a big margin, so this small uncertainty in the measured data in the Riyadh region does not affect the final results.

4. Conclusions

This paper analyzes and compares solar radiation and PV system performance at 44 locations in different areas of Saudi Arabia. This research has several key findings about the selection of the best site for a solar PV system. The criterion proposed in this paper compares GHI and PV energy production with the load profile while taking into account a key factor (temperature) which is also responsible for very high load in the country during summer season. Most of the locations in the K.S.A have high GHI, which are well suited for solar PV generation. However, some areas have very high temperatures, which degrade the performance of PV technologies; as a result, those sites have lesser PV energy output in spite of having very good solar resources. Very interesting results were observed when a comparison of GHI and PV system performance, over the period of one-year vs. the high load summer season, was performed. Some of the top ranked sites with excellent GHI resource are not even in the top 10 sites in the country when it comes to real PV system performance. The best-selected sites are those which have high annual PV energy output and high output during the high load season. Tabuk province in the northern region and Riyadh province in the central region are the two most feasible regions for solar PV generation. The overall score of Tabuk province is 38 and the overall score of the central province of Riyadh is 27. From these results, it is clear that the northern Province of Tabuk is the most feasible region for solar PV generation. A site selected based on this criterion will be economically most feasible out of the lot and at the same time, it will release the stress on electricity companies during high load season by clipping the peak load during daytime in the hot summer period. The data and analysis presented in this paper will be beneficial for policymaking as well as for planning the best locations for solar PV. The results of this research are critical in guiding policies, reducing the risks for deploying solar facilities, and providing judicious information for construction of solar facilities. The same approach can be used in other countries where a correlation between solar resource, PV energy output, and load profile exists.

Acknowledgments

The authors would like to thank the Deanship of Scientific Research, Majmaah University and his office for providing an opportunity and support to take up this research project. The Deanship of Research, Majmaah University (Contract No. 37/69), financed the total work. We acknowledge our gratitude to the Team Atlas of the King Abdulla City for Atomic and Renewable Energy (K.A.CARE) Riyadh for providing the solar data for this study.

Author Contributions

Ahmed Bilal Awan and Muhammad Zubair suggested the research idea, analyzed the data, performed simulations, and contributed in writing the manuscript. Praveen R. P. and Ahmed Abokhalil collected and analyzed the data and contributed in writing the manuscript.

Conflicts of Interest

The authors declare no conflicts of interest.

References

  1. Shaahid, S.M.; Elhadidy, M.A. Economic analysis of hybrid photovoltaic-diesel-battery power systems for residential loads in hot regions-A step to clean future. Renew. Sustain. Energy Rev. 2008, 12, 488–503. [Google Scholar] [CrossRef]
  2. Kaffine, D.T.; McBee, B.J.; Lieskovsky, J. Emissions savings from wind power generation in Texas. Energy J. 2013, 34, 155–175. [Google Scholar] [CrossRef]
  3. Awan, A.-B. Feasibility and Estimation of Technical Potential and Calculation of Payback Period of Roof-Top Solar PV System in the City of Majmaah, Province of Riyadh, K.S.A. J. Energy Nat. Resour. 2016, 5, 12–18. [Google Scholar] [CrossRef]
  4. World Energy Council, Average Electricity Consumption per Electrified Household. Energy Efficiency Indicators. Available online: https://www.wec-indicators.enerdata.eu/household-electricity-use.html (accessed on 1 September 2017).
  5. Matar, W. A look at the response of households to time-of-use electricity pricing in Saudi Arabia and its impact on the wider economy. Energy Strateg. Rev. 2017, 16, 13–23. [Google Scholar] [CrossRef]
  6. BP. BP Statistical Review of World Energy 2017. Available online: https://www.bp.com/content/dam/bp/en/corporate/pdf/energy-economics/statistical-review-2017/bp-statistical-review-of-world-energy-2017-full-report.pdf (accessed on 15 December 2017).
  7. Crabtree, G.W.; Lewis, N.S. Solar energy conversion. Phys. Today 2007, 60, 37–42. [Google Scholar] [CrossRef]
  8. Chalvatzis, K.J.; Hooper, E. Energy security vs. climate change: Theoretical framework development and experience in selected EU electricity markets. Renew. Sustain. Energy Rev. 2009, 13, 2703–2709. [Google Scholar] [CrossRef] [Green Version]
  9. IPCC. Fourth Assesment Report of the Intergovernmental Pannel on Climate Change—IPCC: Climate Change 2007; IPCC: Geneva, Switzerland, 2007. [Google Scholar]
  10. Awan, A.B.; Khan, Z.A. Recent progress in renewable energy—Remedy of energy crisis in Pakistan. Renew. Sustain. Energy Rev. 2014, 33, 236–253. [Google Scholar] [CrossRef]
  11. Bruggink, J.J.C.; der van Zwaan, B.C.C. The role of nuclear energy in establishing sustainable energy paths. Int. J. Glob. Energy Issues 2002, 18, 151–180. [Google Scholar] [CrossRef]
  12. Trainer, T. Can renewables etc. solve the greenhouse problem? The negative case. Energy Policy 2010, 38, 4107–4114. [Google Scholar] [CrossRef]
  13. Stern, N. Climate. Stern Review: The Economics of Climate Change Report; HM Treasury: London, UK, 2007.
  14. Zidanšek, A.; Blinc, R.; Jeglič, A.; Kabashi, S.; Bekteshi, S.; Šlaus, I. Climate changes, biofuels and the sustainable future. Int. J. Hydrogen Energy 2009, 34, 6980–6983. [Google Scholar] [CrossRef]
  15. Krishna, L.V.; Al Thalhi, F.A. Solar and Wind Energy Potential in the Tabuk Region, Saudi Arabia. Int. J. Appl. Sci. Technol. 2015, 5, 12–22. [Google Scholar]
  16. Alkhathlan, K.; Javid, M. Carbon emissions and oil consumption in Saudi Arabia. Renew. Sustain. Energy Rev. 2015, 48, 105–111. [Google Scholar] [CrossRef]
  17. Alshehry, A.S.; Belloumi, M. Energy consumption, carbon dioxide emissions and economic growth: The case of Saudi Arabia. Renew. Sustain. Energy Rev. 2015, 41, 237–247. [Google Scholar] [CrossRef]
  18. Electricity and Cogeneration Regulatory Authority. Available online: http://www.ecra.gov.sa/en-us/DataAndStatistics/NationalRecord/pages/NationalRecord.aspx (accessed on 10 December 2017).
  19. Saygin, D.; Kempener, R.; Wagner, N.; Ayuso, M.; Gielen, D. The Implications for renewable energy innovation of doubling the share of renewables in the global energy mix between 2010 and 2030. Energies 2015, 8, 5828–5865. [Google Scholar] [CrossRef]
  20. Belloumi, M.; Alshehry, A. Sustainable Energy Development in Saudi Arabia. Sustainability 2015, 7, 5153–5170. [Google Scholar] [CrossRef]
  21. National Renewable Energy Laboratory. Available online: https://www.nrel.gov/ (accessed on 20 November 2017).
  22. Almasoud, A.H.; Gandayh, H.M. Future of solar energy in Saudi Arabia. J. King Saud Univ. Eng. Sci. 2015, 27, 153–157. [Google Scholar] [CrossRef]
  23. Baras, A.; Bamhair, W.; Alkhoshi, Y.; Alodan, M. Opportunities and challenges of solar energy in Saudi Arabia. World Renew. Energy Forum 2012, 6, 4721–4726. [Google Scholar]
  24. Pazheri, F.R. Solar Power Potential In Saudi Arabia. J. Eng. Res. Appl. 2014, 4, 171–174. [Google Scholar] [CrossRef]
  25. Shaahid, S.M.; Al-Hadhrami, L.M.; Rahman, M.K. Review of economic assessment of hybrid photovoltaic-diesel-battery power systems for residential loads for different provinces of Saudi Arabia. Renew. Sustain. Energy Rev. 2014, 31, 174–181. [Google Scholar] [CrossRef]
  26. Alawaji, S.H. Evaluation of solar energy research and its applications in Saudi Arabia—20 years of experience. Renew. Sustain. Energy Rev. 2001, 5, 59–77. [Google Scholar] [CrossRef]
  27. Alnaser, W.E.; Alnaser, N.W. The status of renewable energy in the GCC countries. Renew. Sustain. Energy Rev. 2011, 15, 3074–3098. [Google Scholar] [CrossRef]
  28. Lilliestam, J.; Patt, A. Barriers, risks and policies for renewables in the Gulf states. Energies 2015, 8, 8263–8285. [Google Scholar] [CrossRef]
  29. Khan, N.A.; Awan, A.B.; Mahmood, A.; Razzaq, S.; Zafar, A.; Sidhu, G.A.S. Combined emission economic dispatch of power system including solar photo voltaic generation. Energy Convers. Manag. 2015, 92, 82–91. [Google Scholar] [CrossRef]
  30. A Renewable Energy Market, Saudi Arabia Vision 2030. Available online: http://vision2030.gov.sa/en/node/87 (accessed on 10 November 2017).
  31. K.A.CARE. Renewable Resource Monitoring and Mapping (RRMM) Network. Available online: https://rratlas.kacare.gov.sa (accessed on 20 December 2017).
  32. Zell, E.; Gasim, S.; Wilcox, S.; Katamoura, S.; Stoffel, T.; Shibli, H.; Engel-Cox, J.; Subie, M. Al Assessment of solar radiation resources in Saudi Arabia. Sol. Energy 2015, 119, 422–438. [Google Scholar] [CrossRef]
  33. Rashwan, S.S.; Shaaban, A.M.; Al-Suliman, F. A comparative study of a small-scale solar PV power plant in Saudi Arabia. Renew. Sustain. Energy Rev. 2017, 80, 313–318. [Google Scholar] [CrossRef]
  34. AlYahya, S.; Irfan, M.A. Analysis from the new solar radiation Atlas for Saudi Arabia. Sol. Energy 2016, 130, 116–127. [Google Scholar] [CrossRef]
  35. El Khashab, H.; Al Ghamedi, M. Comparison between hybrid renewable energy systems in Saudi Arabia. J. Electr. Syst. Inf. Technol. 2015, 2, 111–119. [Google Scholar] [CrossRef]
  36. Al-Sharafi, A.; Sahin, A.Z.; Ayar, T.; Yilbas, B.S. Techno-economic analysis and optimization of solar and wind energy systems for power generation and hydrogen production in Saudi Arabia. Renew. Sustain. Energy Rev. 2017, 69, 33–49. [Google Scholar] [CrossRef]
  37. Rehman, S.; Al-Hadhrami, L.M. Study of a solar PV-diesel-battery hybrid power system for a remotely located population near Rafha, Saudi Arabia. Energy 2010, 35, 4986–4995. [Google Scholar] [CrossRef]
  38. K.A.CARE. Available online: https://rratlas.kacare.gov.sa/RRMMPublicPortal/?q=en/Solar/StationTiers/MonitorList (accessed on 15 December 2017).
  39. Elminir, H.K.; Benda, V.; Tousek, J. Effects of Solar Irradiation Conditions and Other Factors on the Outdoor Performance of Photovoltaic Modules. J. Electr. Eng. 2001, 52, 125–133. [Google Scholar]
  40. Collins, R.D.; Gowharji, W.; Habib, A.; Alwajeeh, R.; Stephen, R. Evaluating scenarios of capacity expansion given high seasonal variability of electricity demand: The case of Saudi Arabia. In Proceedings of the 31st International Conference of the System Dynamics Society, Cambridge, MA, USA, 21–25 July 2013. [Google Scholar]
  41. Almarshoud, A.F. Almarshoud Performance of solar resources in Saudi Arabiale. Renew. Sustain. Energy Rev. 2016, 66, 694–701. [Google Scholar] [CrossRef]
  42. Authority, E.; Authority, C.R. Annual Statistical Report 2015 for Electricity and Seawater Desalination Industries; Dubai Electricity and Water Authority: Dubai, Saudi Arabia, 2015.
  43. Chander, S.; Purohit, A.; Sharma, A.; Nehra, S.P.; Dhaka, M.S. Impact of temperature on performance of series and parallel connected mono-crystalline silicon solar cells. Energy Rep. 2015, 1, 175–180. [Google Scholar] [CrossRef]
  44. PV Module. Available online: https://www.mitsubishielectricsolar.com/images/uploads/documents/specs/MLU_spec_sheet_250W_255W.pdf (accessed on 15 January 2018).
Figure 1. Map of solar resource monitoring stations (SRMS) network by province.
Sustainability 10 01129 g001
Figure 2. Average daily total GHI vs. relative humidity for the top seven and bottom seven stations with respect to GHI.
Sustainability 10 01129 g002
Figure 3. Annual load profile of Saudi Arabia.
Sustainability 10 01129 g003
Figure 4. Average daily total GHI of 44 stations over the one-year study period.
Sustainability 10 01129 g004
Figure 5. Average daily total GHI during high load summer season (April to October).
Sustainability 10 01129 g005
Figure 6. Electrical Energy (kWh) generated by 100 KW solar PV system at each station without temperature effect.
Sustainability 10 01129 g006
Figure 7. Electrical Energy (kWh) generated by 100 KW solar PV system at each station including temperature effect.
Sustainability 10 01129 g007
Figure 8. Annual yield factor (YF) of the proposed PV system at 44 locations.
Sustainability 10 01129 g008
Figure 9. Annual capacity utilization factor (CUF) of the proposed PV system at 44 locations.
Sustainability 10 01129 g009
Figure 10. Electrical energy (kWh) generated by 100 KW solar PV system at each station during high load season including temperature effect.
Sustainability 10 01129 g010
Figure 11. Yield factor (YF) of the proposed PV system at 44 locations during high load summer season.
Sustainability 10 01129 g011
Figure 12. Capacity utilization factor (CUF) of the proposed PV system at 44 locations during high load summer season.
Sustainability 10 01129 g012
Figure 13. Ranking of stations based on average daily total GHI, annual PV energy output, and capacity utilization factor.
Sustainability 10 01129 g013
Figure 14. Ranking of stations based on average daily total GHI, annual PV energy output, and capacity utilization factor.
Sustainability 10 01129 g014
Table 1. Solar resource monitoring stations details
Province NameCityStation NameStation AbbreviationStation Type (Tier)
Al BahaAl BahaAl Baha UniversityAl Baha-University1C
Al JoufAl JoufAl Jouf College of TechnologyAl Jouf-TVTC1C
AsirAbhaAbha Technical InstituteAbha-TVTC1B
Al FarshahTuhamat Qahtan Technical InstituteAl Farshah-TVTC2
Eastern ProvinceAl AhsaKing Faisal UniversityAl Ahsa-KFU1C
Al DhahranKing Fahd University of Petroleum and MineralsAl Dhahran-KFUPM2
Al DammamImam Abdulrahman Al Faisal UniversityDammam-IAFU1B
Hafar Al BatinHafar Al Batin Technical CollegeHafar Al Batin-TVTC2
Al JubailSaline Water Conversion Corporation (Jubail)Al Jubail-SWCC2
Al KhafjiSaline Water Conversion Corporation (Al Khafji)Al Khafji-SWCC1C
HailHailHail College of TechnologyHail-TVTC1C
JazanFarasan IslandSaline Water Conversion Corporation (Farasan)Farasan-SWCC2
JazanJazan UniversityJazan-UniversityC
MadinahAl HanakiyahAl Hanakiyah Technical InstituteAl Hanakiyah-TVTC2
Al MadinahTaibah UniversityTaibah-University1C
YanbuRoyal Commission of Jubail and YanbuYanbu-RCJY1C
MakkahHada Al ShamKing Abdulaziz University (East Hada Al Sham Campus)Hada Al Sham-KAU2
JeddahKing Abdulaziz University (Main Campus)Jeddah-KAU2
RaniaRania Technical InstituteRania-TVTC1C
MakkahUmm Al Qura UniversityMakkah-UQU1C
OsfanKing Abdulaziz University (Osfan campus)Osfan-KAU2
Al QunfudhahAl Qunfudhah Technical InstituteAl Qunfudhah-TVTC2
TaifTaif UniversityTaif-University1C
ThuwalKing Abdullah University of Science and TechnologyThuwal-KAUST2
NajranAlkherkheerAl KherkheerAl Kherkheer2
NajranNajran UniversityNajran-University2
SharurahSharurah Technical InstituteSharurah-TVTC2
Northern BordersArarArar Technical InstituteArar-TVTC1C
QassimQassimQassim UniversityQassim-University1B
RiyadhAfifAfif Technical InstituteAfif-TVTC2
Al DawadmiAl Dawadmi College of TechnologyAl Dawadmi-TVTC2
Al KharjPrince Sattam bin Abdulaziz UniversityAl Kharj-SAU2
LaylaAl Aflaaj Technical InstituteAl Aflaaj-TVTC2
MajmaahMajmaah UniversityMajmaah-University2
RiyadhK.A.CARE Building Olaya StRiyadh-K.A.CARE HQ2
RiyadhK.A.CARE City Site Tier 2Riyadh-K.A.CARE City T22
RiyadhKing Saud UniversityRiyadh-KSU2
RiyadhPrincess Norah UniversityRiyadh-PNU2
RiyadhAl Uyaynah Research StationRiyadh-Al Uyaynah1A
ShaqraShaqra UniversityShaqra-University2
Wadi AddawasirWadi Addawasir College of TechnologyWadi Addawasir-TVTC1C
TabukDubaDuba Technical InstituteDuba-TVTC2
HaglSaline Water Conversion Corporation (Hagl)Hagl-SWCC2
TabukTabuk UniversityTabuk-University1C
TimaaTimaa Technical InstituteTimaa-TVTC2
UmlujSaline Water Conversion Corporation (Umluj)Umluj-SWCC2
Al WajhAl Wajh Technical InstituteAl Wajh-TVTC1C
Table 2. Network Statistics.
Station Type# Stations PlannedStations Online
Tier 1—Research Stations1818
  • Configuration A—Research and Development Laboratory
-1
  • Configuration B—Solar Broadband and Spectral Monitoring Stations
-3
  • Configuration C—Broadband Baseline Monitoring Station
-14
Tier 2—Mid- Range Stations3228
Tier 3—Simple Stations30
Total5346
Table 3. Average daily total GHI data ( Wh / m 2 ) for 44 stations across the country.
MonthDecemberJanuaryFebruaryMarchAprilMayJuneJulyAugustSeptemberOctoberNovemberAverage Daily Total
Station
Al Baha4223.45070.66012.56591.56059.16705.174966798.56535.46462.66673.55533.86180.2
Al Jouf3576.54213.85347.55948.57395.38115.68536.28453.77474.46718.25355.441376272.7
Abha43824443.66304.77063.65620.966566928.45808.760866106.867405512.55971.1
Al Farshah4675.54775.16013.96540.55483.16733.46396.25290.15831.25985.66538.45404.15805.6
Al Ahsa3938.94301.55306.35333.26294.67453.57881.47623.272396594.95798.44401.56013.9
Al Dhahran3372.4382948664869.86110.47067.97548.671346657.16086.651823787.15542.6
Al Damam3576.74081.652855248.16403.97434.17966.87557.47035.46546.25505.84005.15887.2
Hafar Al Batin3238.33738.15090.25373.26927.27943.18240.18278.97491.36618.75601.54071.66051
Al Jubail3303.63946.35158.35232.46536.57343.57835.67405.36870.26327.55290.43843.45757.7
Al Khafji3139.43794.74999.25130.76579.87395.37745.77535.470226333.95186.63750.95717.8
Hail3758.84217.25427.85794.16860.28047.68423.98393.47434.76720.45655.34304.26253.1
Farasan Island4152.54190.35270.461436501.16512.56381.75615.95871.35966.75937.94823.25613.9
Jazan4218.64235.553126044.46345.365156228.35356.45858.15986.75986.549425585.7
Al Hanakiyah4035.44631.256255820.57143.37936.48066.37897.77040.36728.55894.34954.36314.4
Al Madinah4028.4523.55526.25727.667677868.47865.47847.67077.96520.75666.94840.66188.3
Yanbu4234.14603.15635.15790.37261.27949.17829.27612.57001.86455.45458.74860.86224.3
Hada Al Sham3618.64255.752796068.46687.374457498.26974.66517.76098.95723.74795.65913.6
Jeddah3769.14295.15262.75906.96825.47375.772356776.96267.66132.45452.14578.85823.1
Rania4316.348395862.76030.75990.87311.77679.37206.37089.56638.86483.353136230.1
Makkah3901.24282.65375.66185.167187421.175106936.16461.46003.95778.54782.25946.3
Osfan3909.74306.953525972.869877530.27368.46923.76418.16071.65525.24648.75909.5
Al Qunfudhah4007.64440.95305.26228.46540.16707.46526.96143.16057.85890.75548.749175667.8
Thuwal3840.64414.85339.16040.36923.17541.17365.268696498.66099.45491.94731.85929.6
Najran4979.25358.76569.468926318.57646.97765.36958.87062.76960.66977.15990.86623.3
Sharurah5088.45368.96383.16898.66639.47768.47642.571677106.17104.16862.15825.46654.5
Arar3307.93819.55121.65858.87190.88008.58357.984727303.86663.95204.43974.86106.9
Qassim34224250.75510.95637.66867.87839.48155.38182.67395.56606.25856.94392.26176.4
Afif TVTC4121.5474058445999.26962.37820.68067.87836.57324.36881.86300.15185.56423.6
Al Dawadmi4078.14706.557885882.76856.97791.881007802.97153.96803.76181.24572.56309.8
Al Kharj3924.44494.35439.25644.265557162.17685.27490.36983.36468.158344284.45997
Layla Al Aflaaj4265.1469559366174.86563.97596.77967.47749.37299.6693363855124.46390.8
Majmaah3428.64326.55414.65387.36687.17605.37986.17888.17054.16549.65867.54240.46036.3
Riyadh Olaya3812.24353.65280.154766618.772117668.17600.16930.26429.95790.54191.65946.8
Riyadh City T24150.44718.75761.55999.77053.47803.98179.881317465.46874.95255.24572.96413.9
Riyadh KSU3943.34519.55507.85715.66880.57507.57997.97922.37282.86714.56044.94720.56229.8
Riyadh Al Uyaynah3941.54496.85578.35628.56865.875588006.1793872156665.76065.44419.76198.2
Shaqra3894.64631.856385675.86974.27755.98069.97991.47329.56740.56081.64461.26270.4
Wadi Addawasir4473.74942.16079.763906266.47327.27670.77228.27139.66798.56534.15510.36363.4
Duba TVTC4067.84390.55492.157747230.47834.58077.67826.57013.365615395.14353.76168
Hagl3662.53976.24953.15708.8711577288031.37935.970736440.95108.53936.15972.5
Tabuk3902.64352.45446.45922.67356.28055.984378322.87420.26833.75486.84239.66314.7
Timaa3908.94514.65675.15978.274168294.18543.48335.97546.768955603.94668.56448.4
Umluj SWCC4188.24483.75583.65733.27214.37835.17912.47648.36863.263855307.74710.36155.4
Al Wajh4247.54228.45517.55860.77311.27982.28274.480387170.16713.85597.14681.96301.9
Table 4. Top 10 stations with highest average daily total GHI over the period of one year and during high load summer season.
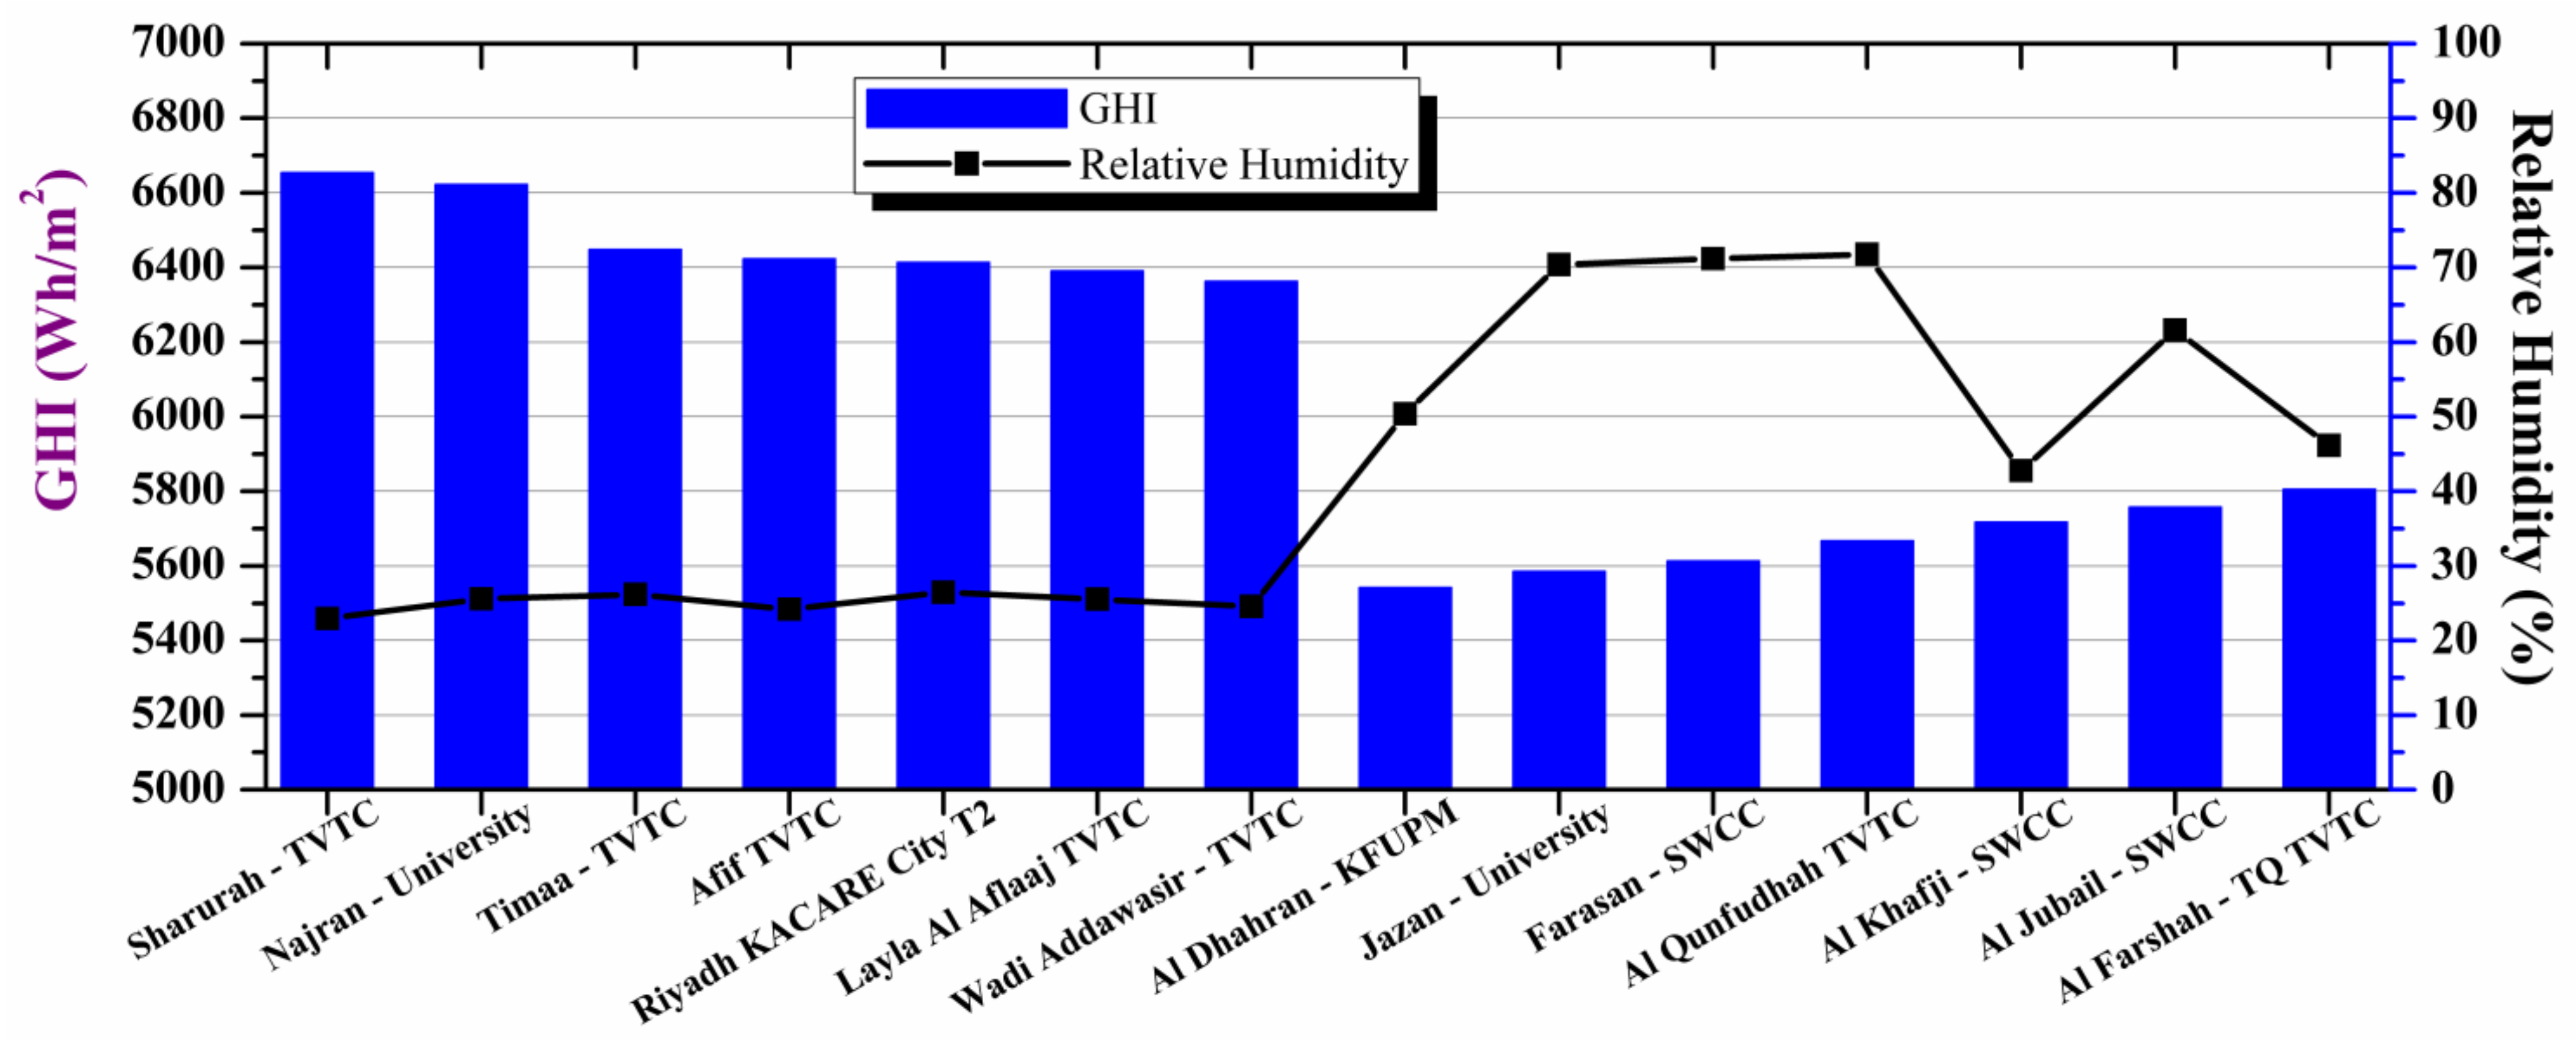
Average Daily Total GHI over the Period of One YearAverage Daily Total GHI during High Load Summer Season (April to October)
Station NameGHI (WH/m2)Station NameGHI (WH/m2)
Sharurah TVTC6654.5Timaa TVTC7519.3
Najran University6623.3Al Jouf TVTC7435.4
Timaa TVTC6448.4Tabuk University7416.1
Afif TVTC6423.6Riyadh K.A.CARE City T27394.8
Riyadh K.A.CARE City T26413.9Hail TVTC362.2
Al Aflaaj TVTC6390.8Arar TVTC7314.5
Wadi Addawasir TVTC6363.4Afif TVTC7313.3
Tabuk University6314.7Hafar Al Batin TVTC7300.1
Al Hanakiyah TVTC6314.4AlWajh TVTC7298.1
Al Dawadmi TVTC6309.8Shaqra University7277.6
Table 5. PV module specifications.
Model NamePV-MLU250HC Modules
Cell typeMonocrystalline Silicon 78 × 156 mm
Maximum power rating Pmax (Pmax)250 W
Open circuit voltage V OC 37.6 V
Short circuit current I SC 8.79 A
Maximum power voltage ( V mp ) 31 V
Maximum power current ( I mp )8.08 A
Module Efficiency15.4%
Normal operating cell temperature (NOCT)45.7 °C
Table 6. Daytime ambient temperature (°C) at 44 stations across the country.
MonthDecemberJanuaryFebruaryMarchAprilMayJuneJulyAugustSeptemberOctoberNovemberDaily Average
Station
Al Baha Univ18.21820.125.222.129.133.231.931.730.425.421.325.6
Al Jouf TVTC11.312.016.520.326.229.535.536.637.733.028.118.525.3
Abha TVTC15.214.516.620.517.923.426.024.623.423.619.916.820.2
Al Farshah TVTC26.225.227.631.828.532.735.333.031.433.230.827.730.3
Al Ahsa KFU19.218.721.325.929.236.540.041.841.338.031.925.730.8
Al Dhahran KFUPM19.718.620.925.128.835.839.040.439.836.731.525.930.2
Dammam IAFU19.618.320.224.427.934.237.438.838.435.730.725.329.2
Hafar Al Batin TVTC13.914.518.923.728.735.239.741.842.537.831.322.029.2
Al Jubail SWCC19.118.119.724.227.233.436.838.337.935.530.125.128.8
Al Khafji SWCC16.015.618.522.926.432.336.938.637.834.628.922.027.5
Hail TVTC12.613.317.020.925.330.735.036.737.233.828.420.025.9
Farasan SWCC31.030.130.631.833.535.436.836.435.936.534.532.133.7
Jazan Univ30.629.530.032.133.534.936.335.134.435.433.531.533.1
Al Hanakiyah TVTC18.319.221.927.427.834.538.738.739.737.530.925.130.0
Madinah Taiba Univ21.121.924.430.129.936.340.038.939.839.133.828.532.0
Yanbu RCJY24.924.226.728.930.932.634.634.234.634.232.330.030.7
Hada Al Sham KAU27.726.929.432.732.835.738.537.437.036.934.232.533.5
Jeddah KAU28.527.629.532.134.636.037.838.437.236.534.533.033.8
Rania TVTC20.820.422.629.425.434.537.838.437.935.528.924.429.7
Makkah UQU28.427.129.633.633.137.540.138.637.537.934.632.334.2
Osfan KAU27.326.028.830.234.535.336.837.136.335.533.631.832.8
Al Qunfudhah TVTC30.529.229.832.133.934.735.735.635.535.433.331.833.1
Thuwal KAUST27.025.927.729.431.332.833.434.734.634.031.831.031.1
Najran Univ20.320.322.329.626.032.835.236.535.133.226.523.228.4
Sharurah TVTC22.622.924.132.030.736.538.438.837.936.529.326.331.3
Arar TVTC10.410.615.319.525.529.635.437.038.332.527.017.124.8
Qassim Univ15.115.919.224.427.133.737.839.439.536.429.622.028.3
Afif TVTC16.917.319.725.724.832.636.037.237.034.928.322.727.8
Al Dawadmi TVTC16.416.419.626.125.532.936.938.638.335.929.022.528.2
Al Kharj SAU17.817.420.326.528.135.538.140.739.936.228.822.729.3
Aflaaj TVTC19.719.321.727.928.836.839.441.140.537.530.624.930.7
Majmaah Univ14.814.918.123.426.333.336.838.438.234.927.921.027.3
Riyadh K.A.CARE HQ17.818.320.925.728.636.439.941.841.638.431.724.730.5
Riyadh K.A.CARE City T215.615.918.823.525.733.236.938.538.134.928.621.827.6
Riyadh KSU17.517.520.626.428.335.838.841.140.637.230.324.229.9
Riyadh Al Uyaynah15.515.818.123.225.733.136.337.837.634.727.720.027.1
Shaqra Univ17.016.820.026.327.034.038.240.039.837.029.923.129.1
Wadi Addawasir TVTC20.420.121.729.027.435.137.039.138.435.227.723.629.6
Duba TVTC23.321.324.727.930.532.837.134.834.734.432.229.230.2
Hagl SWCC20.518.822.924.229.530.233.933.933.731.929.826.228.0
Tabuk Univ12.512.617.421.726.328.934.034.034.531.126.820.225.0
Timaa TVTC13.413.718.823.727.131.035.936.637.734.229.421.826.9
Umluj SWCC24.923.025.528.330.531.934.934.834.433.432.129.930.3
Al Wajh TVTC22.521.124.226.728.830.633.333.032.731.430.328.328.6
Table 7. Top 10 stations (both annually and high load season) with respect to GHI and top 10 stations with respect to PV energy output.
Average Daily Total GHI and PV Energy Output Ranking over the Period of One YearAverage Daily Total GHI and PV Energy Output Ranking during High Load Summer Season (April to October)
Average Daily total GHI StationsPV Energy Output StationsChange in RankingAverage Daily Total GHI StationsPV Energy Output StationsChange in Ranking
Sharurah TVTCNajran University1 Sustainability 10 01129 i001Timaa TVTCTabuk University2 Sustainability 10 01129 i001
Najran UniversityShahrurah TVTC1 Sustainability 10 01129 i002Al Jouf TVTCTimaa TVTC1 Sustainability 10 01129 i002
Timaa TVTCTimaa TVTC0 Tabuk UniversityAl Jouf TVTC1 Sustainability 10 01129 i002
Afif TVTCAfif TVTC0 Riyadh KACARE City T2AlWajh TVTC5 Sustainability 10 01129 i001
Riyadh KACARE City T2Riyadh KACARE City T20 Hail TVTCRiyadh KACARE City T21 Sustainability 10 01129 i002
Aflaaj TVTCTabuk University2 Sustainability 10 01129 i001Arar TVTCHail TVTC1 Sustainability 10 01129 i001
Wadi Addawasir TVTCWadi Addawasir TVTC0 Afif TVTCAfif TVTC0
Tabuk UniversityAl Baha University12 Sustainability 10 01129 i001Hafar Al Batin TVTCArar TVTC2 Sustainability 10 01129 i002
Al Hanakiyah TVTCAflaaj TVTC3 Sustainability 10 01129 i002AlWajh TVTCAl Dawadmi TVTC4 Sustainability 10 01129 i001
Al Dawadmi TVTCAl Dawadmi TVTC0 Shaqra UniversityQassim University0
Al Hanakiyah TVTC5 Sustainability 10 01129 i002 Shaqra University1 Sustainability 10 01129 i002
Hafar Al Batin TVTC7 Sustainability 10 01129 i002
1 Sustainability 10 01129 i001 Increase in ranking, Sustainability 10 01129 i002 Decline in ranking.
Table 8. Score of top-selected sites.
Station NameAnnual Performance RankingScoreSummer Season Performance RankingScoreTotal Score
Timaa TVTC382917
Tabuk University6511015
Riyadh K.A.CARE City T2564713
Afif TVTC477411
Al Wajh TVTC110566
Al Dawadmi TVTC101923

