Hyperspectral Estimation of the Chlorophyll Content in Short-Term and Long-Term Restorations of Mangrove in Quanzhou Bay Estuary, China

 , ,
, ,
Abstract
:
1. Introduction
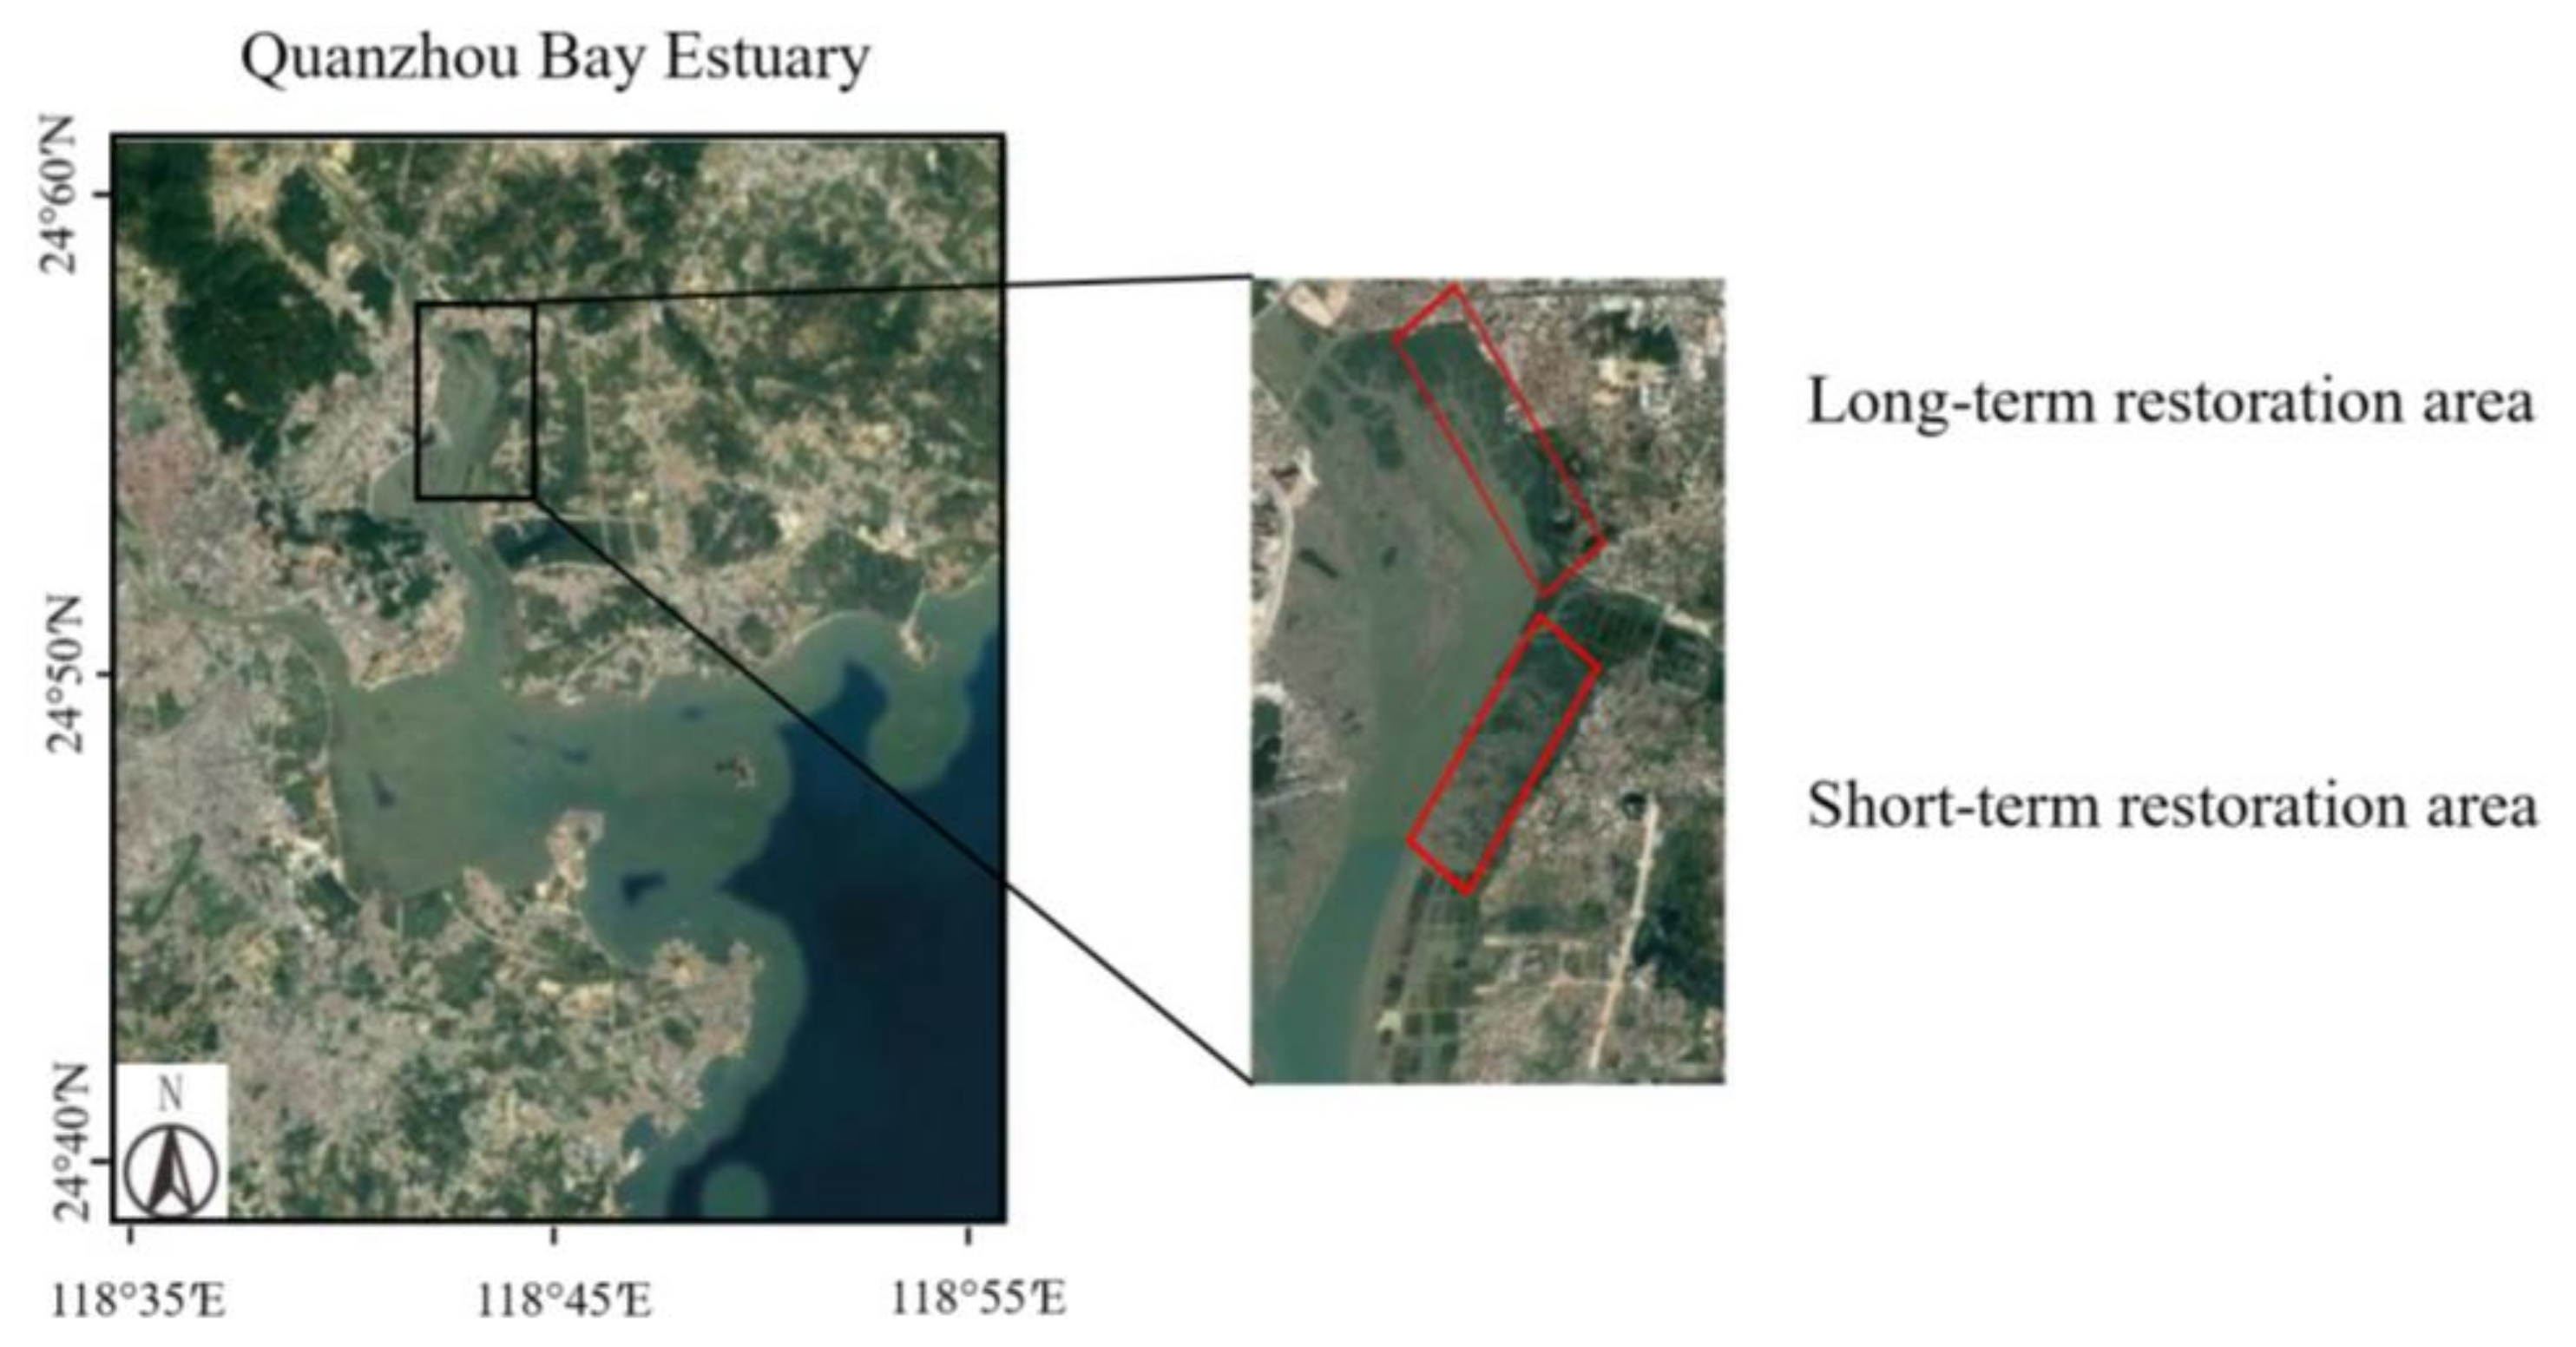
2. Study Area
3. Materials and Methods
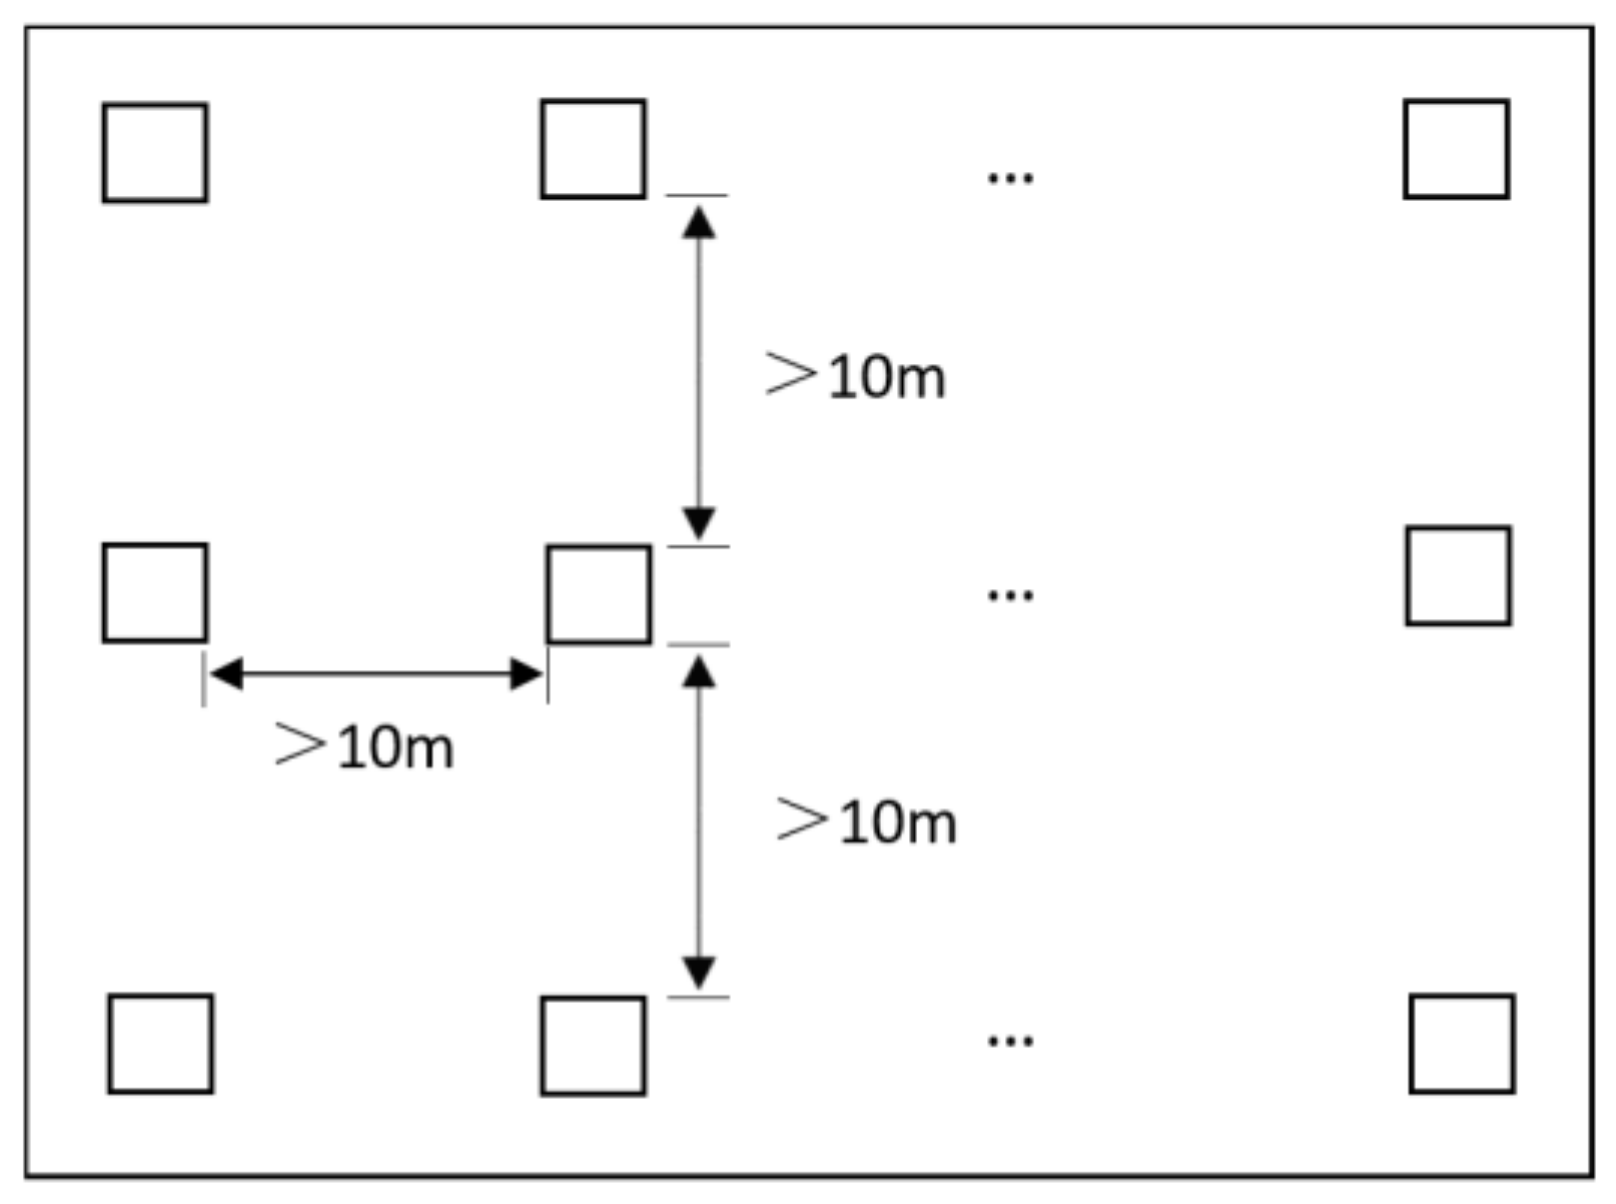
3.1. Experimental Design
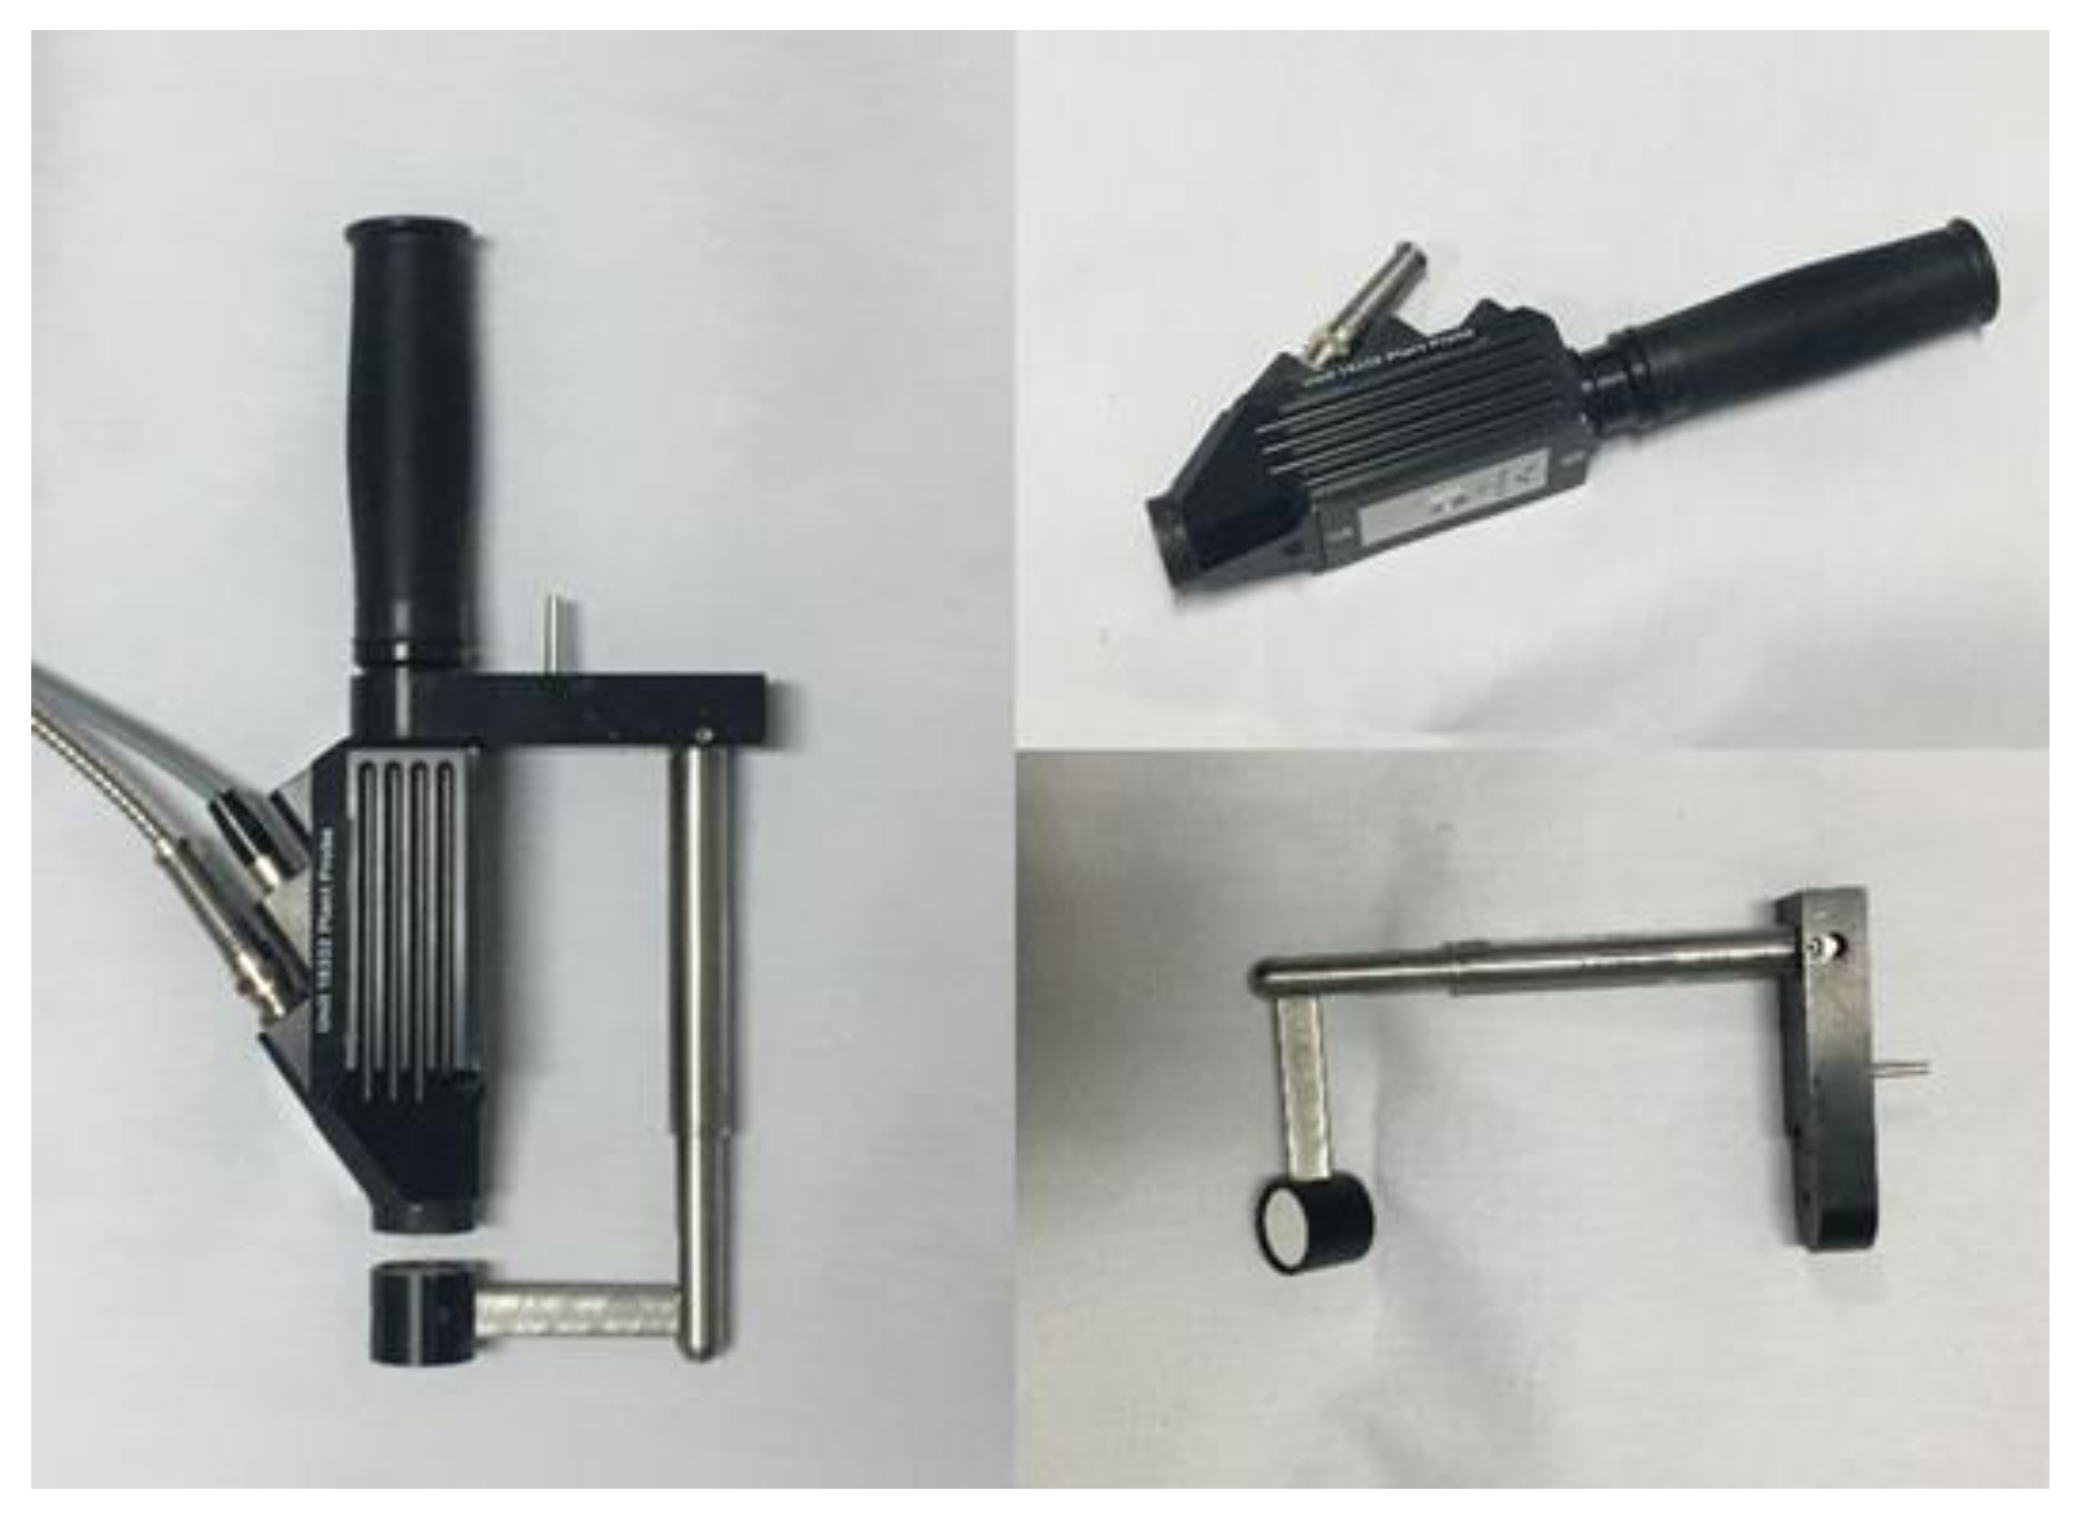
3.2. Leaf Spectrometry
3.3. Measurement of the Leaf Chlorophyll Content
3.4. Statistical Analyses
4. Results
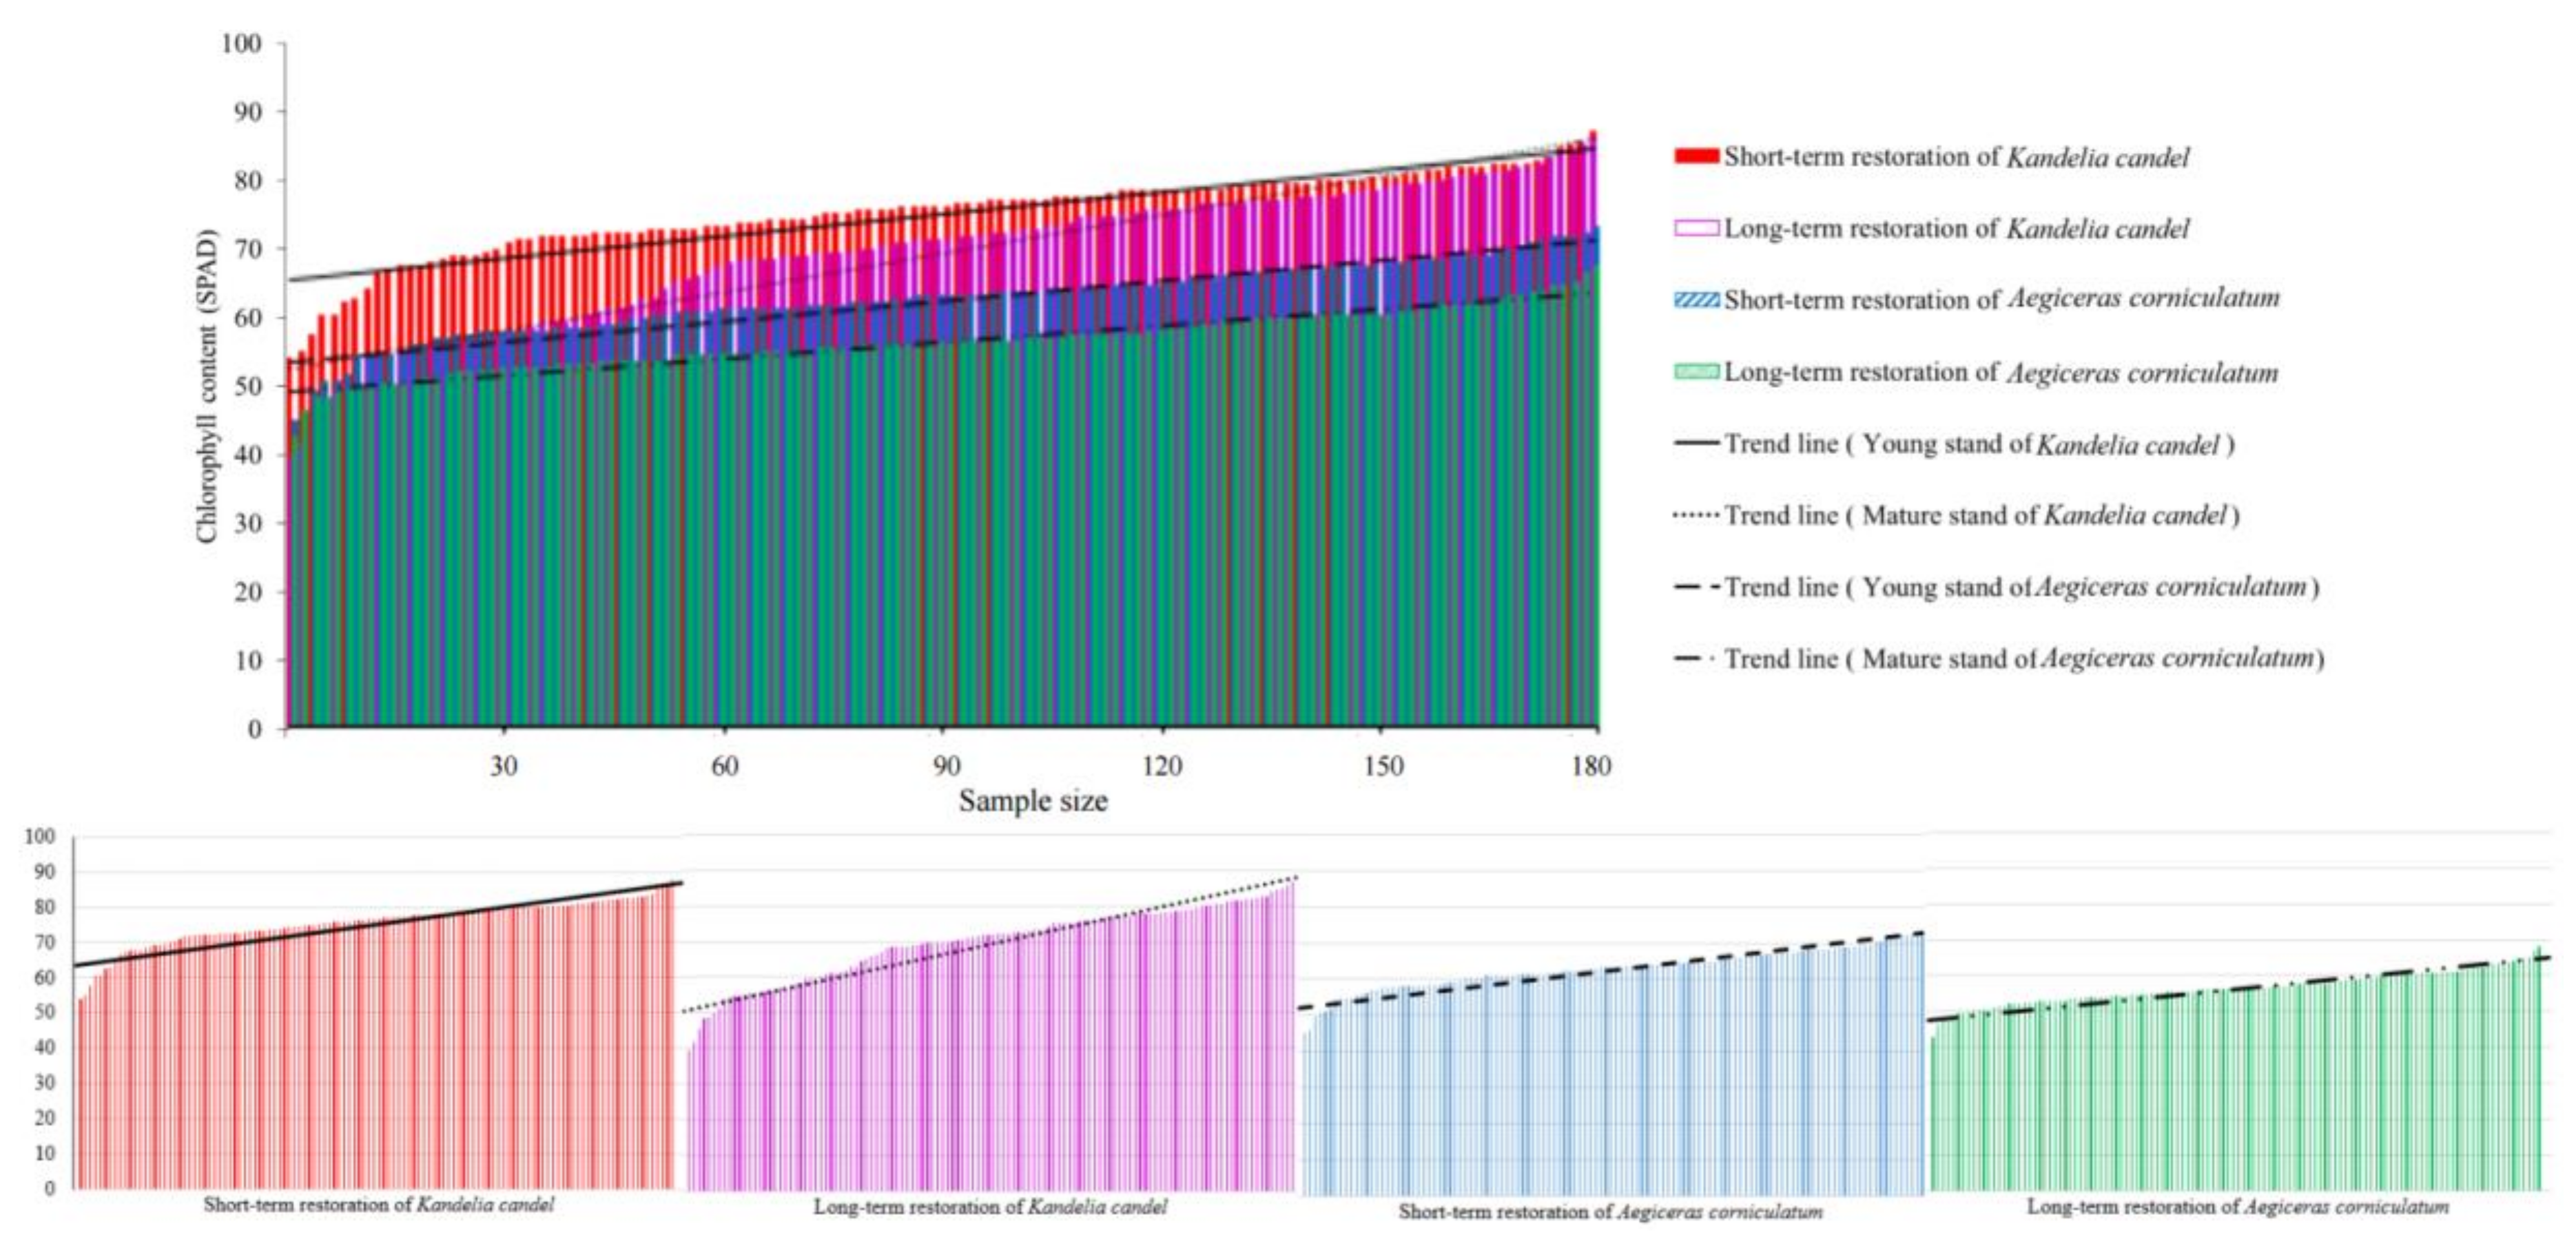
4.1. Analysis of the Chlorophyll Content in Samples
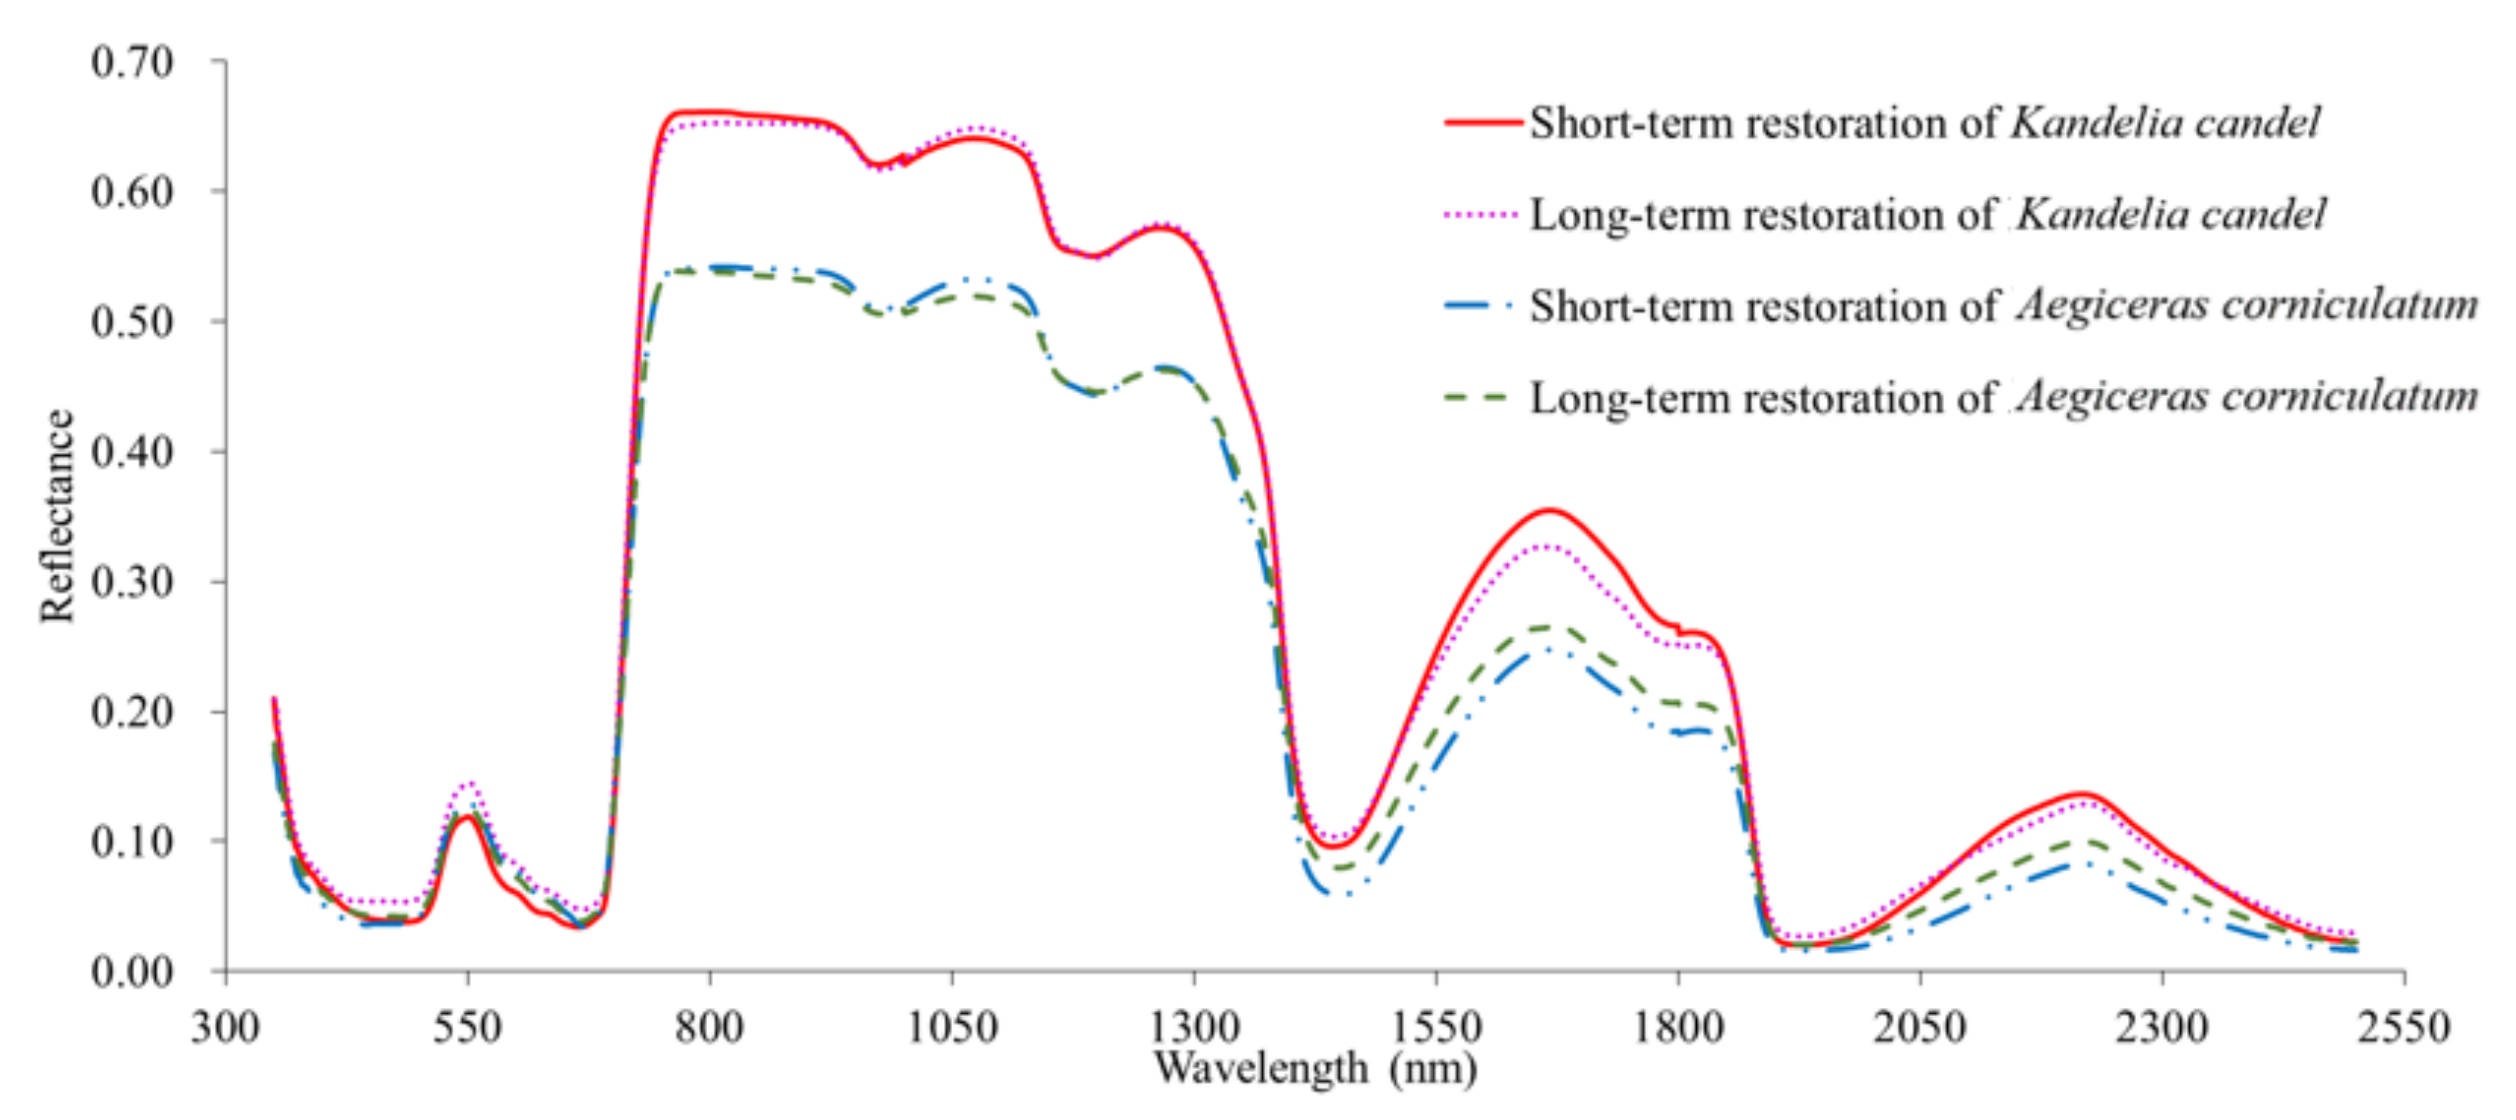
4.2. Comparison of the Spectral Properties of the Mangrove Leaves
4.3. Model to Estimate the Chlorophyll Content
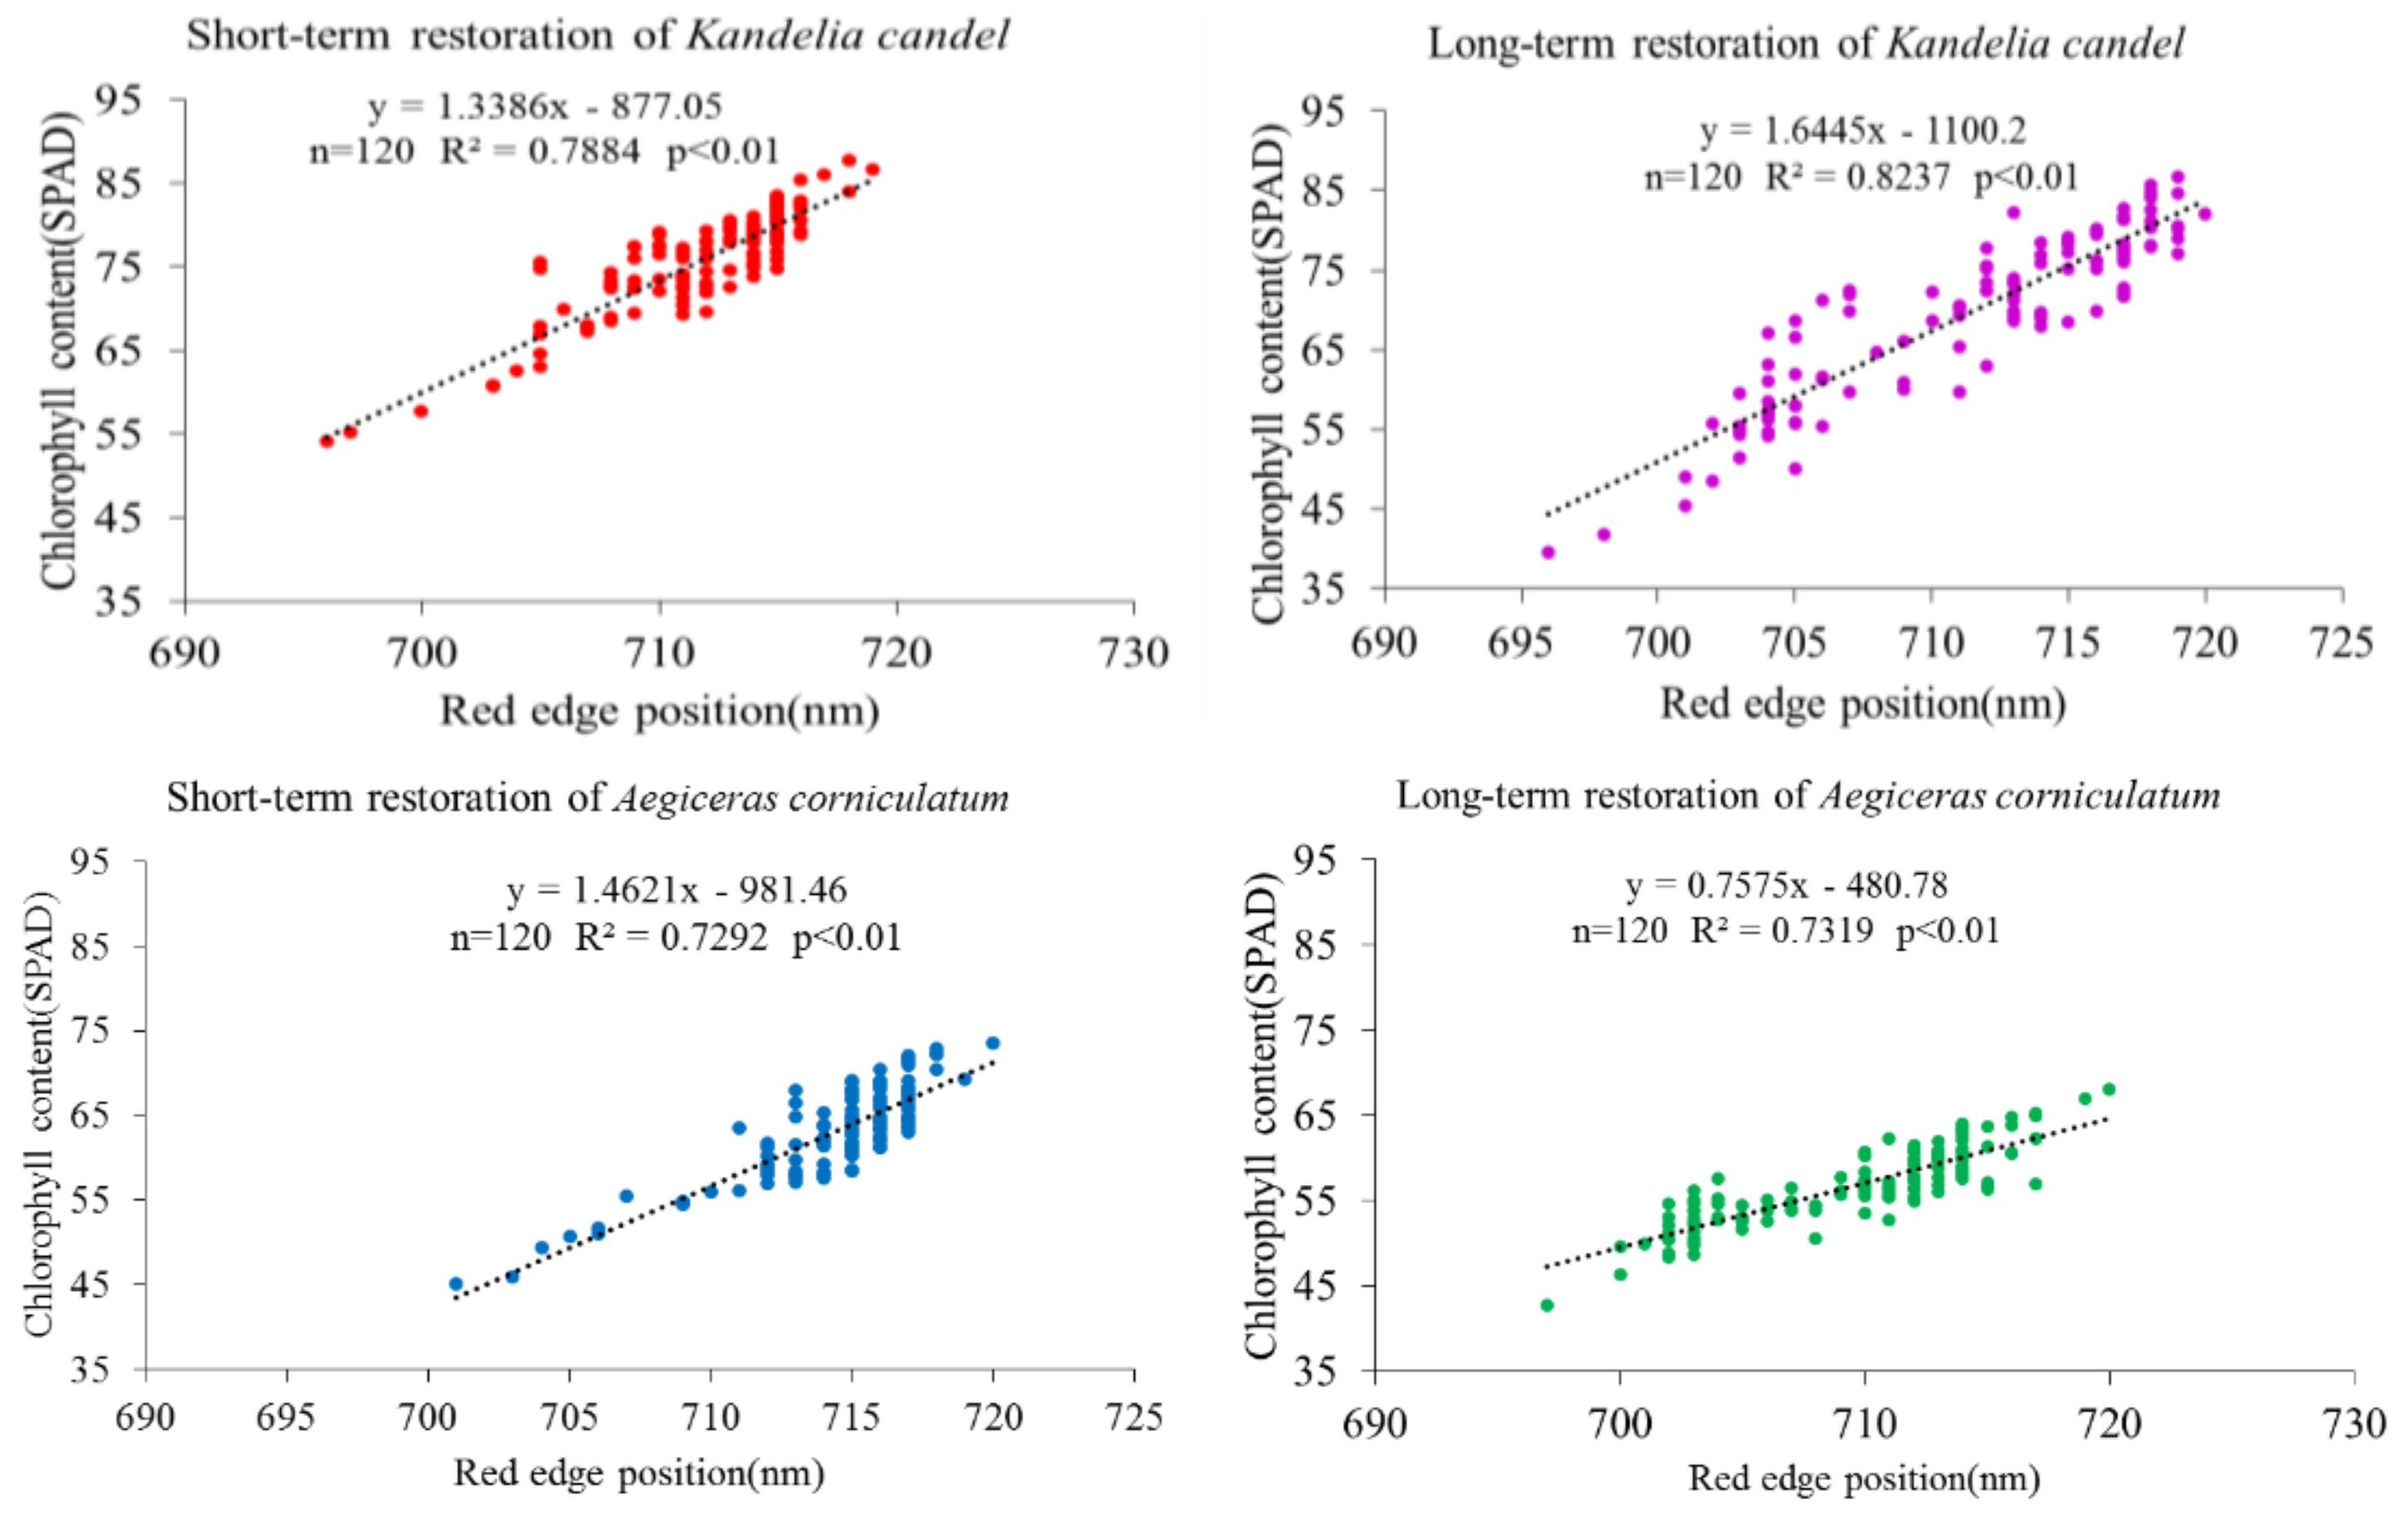
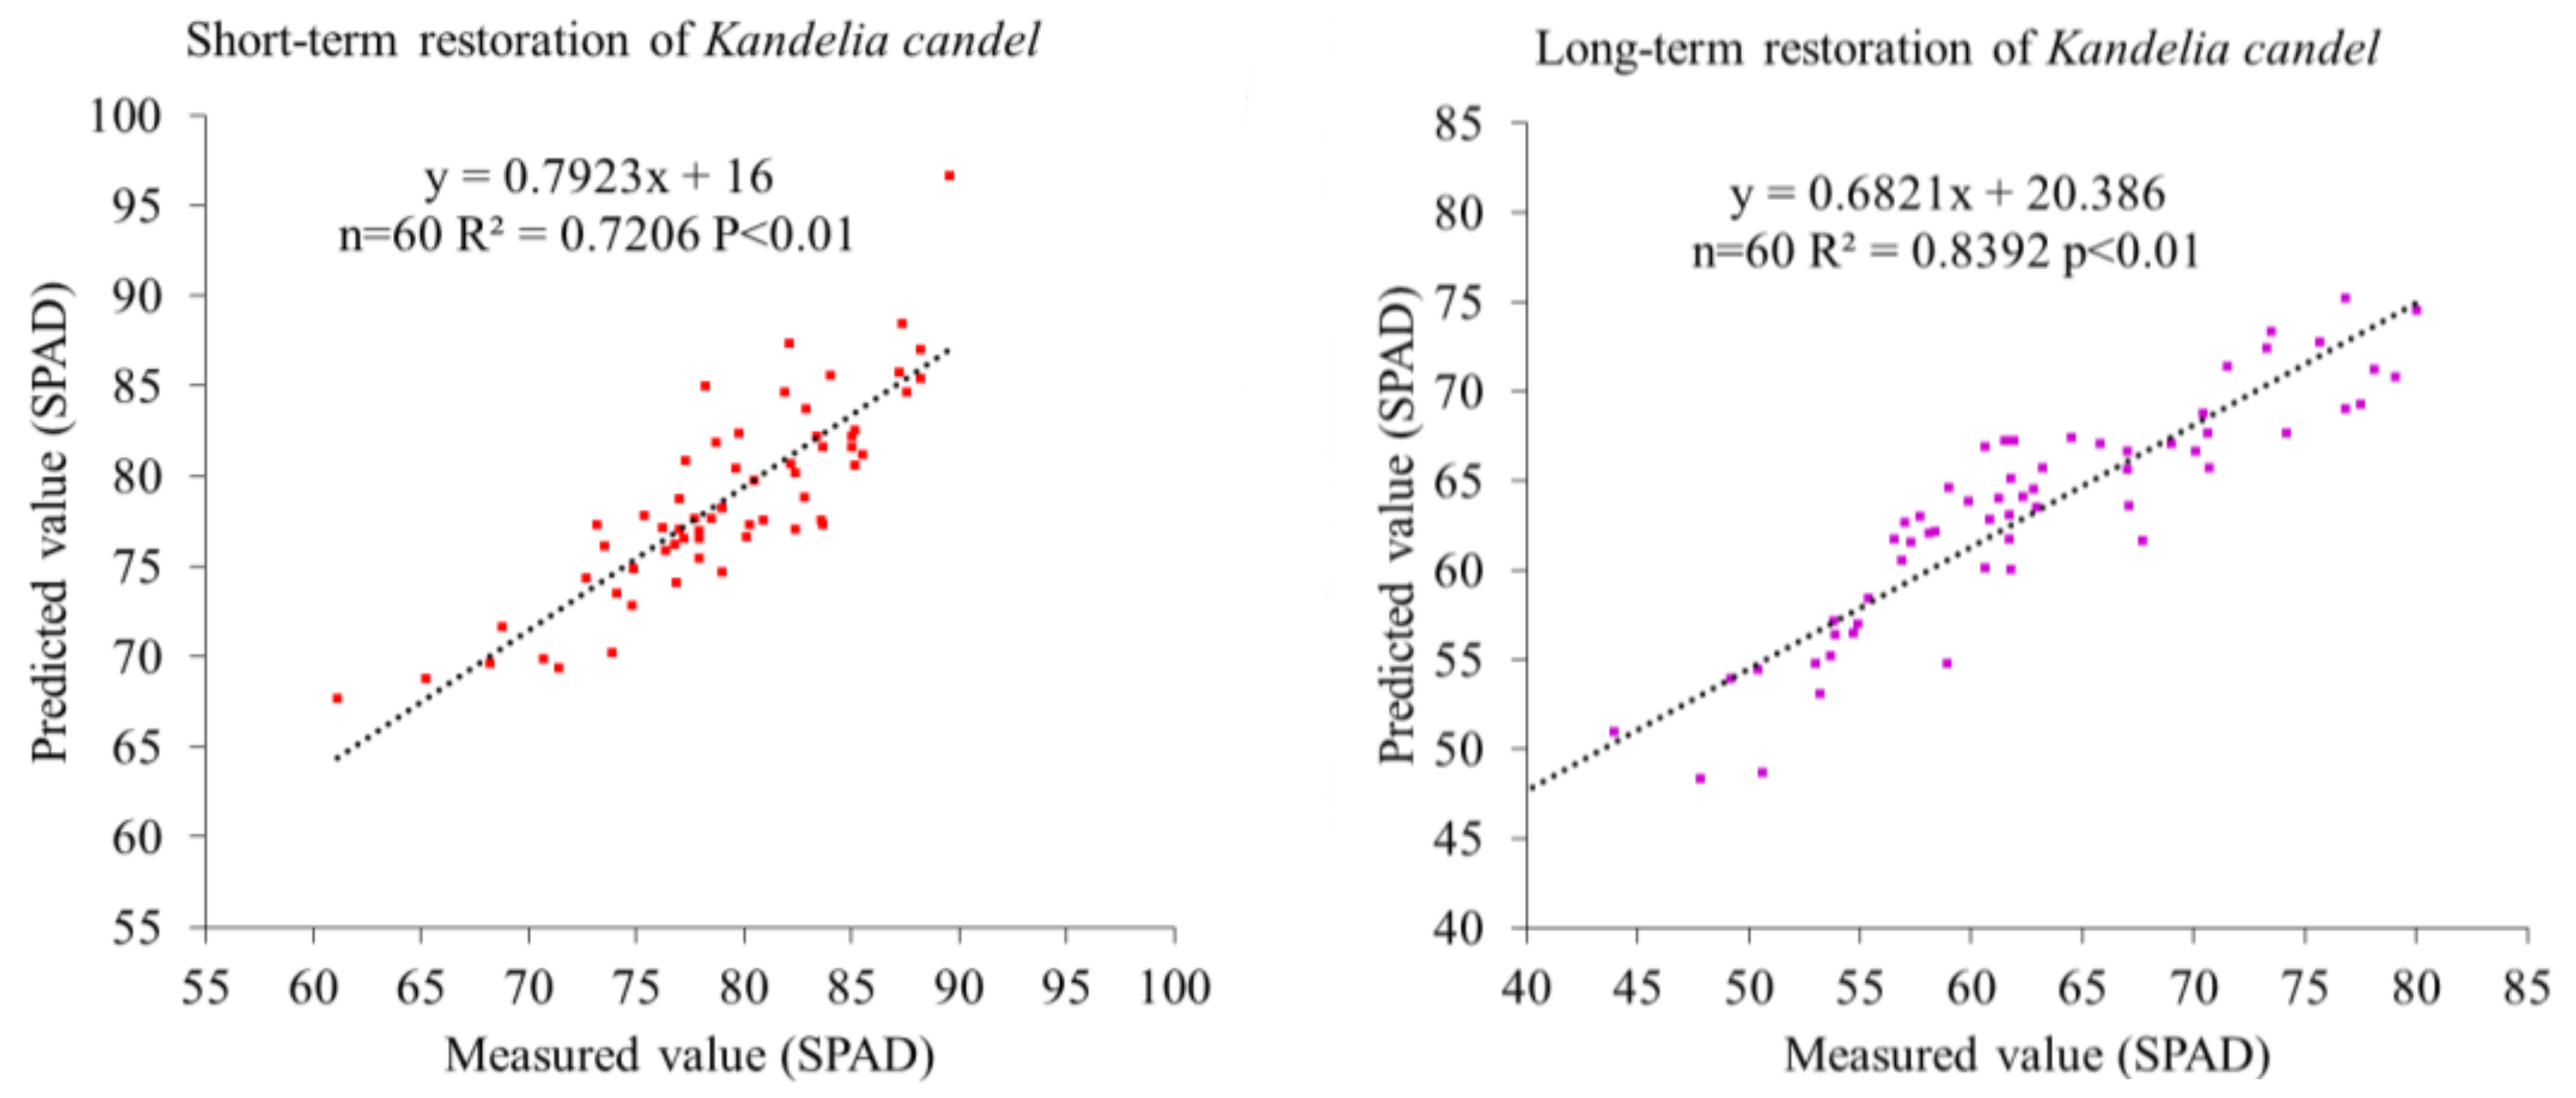
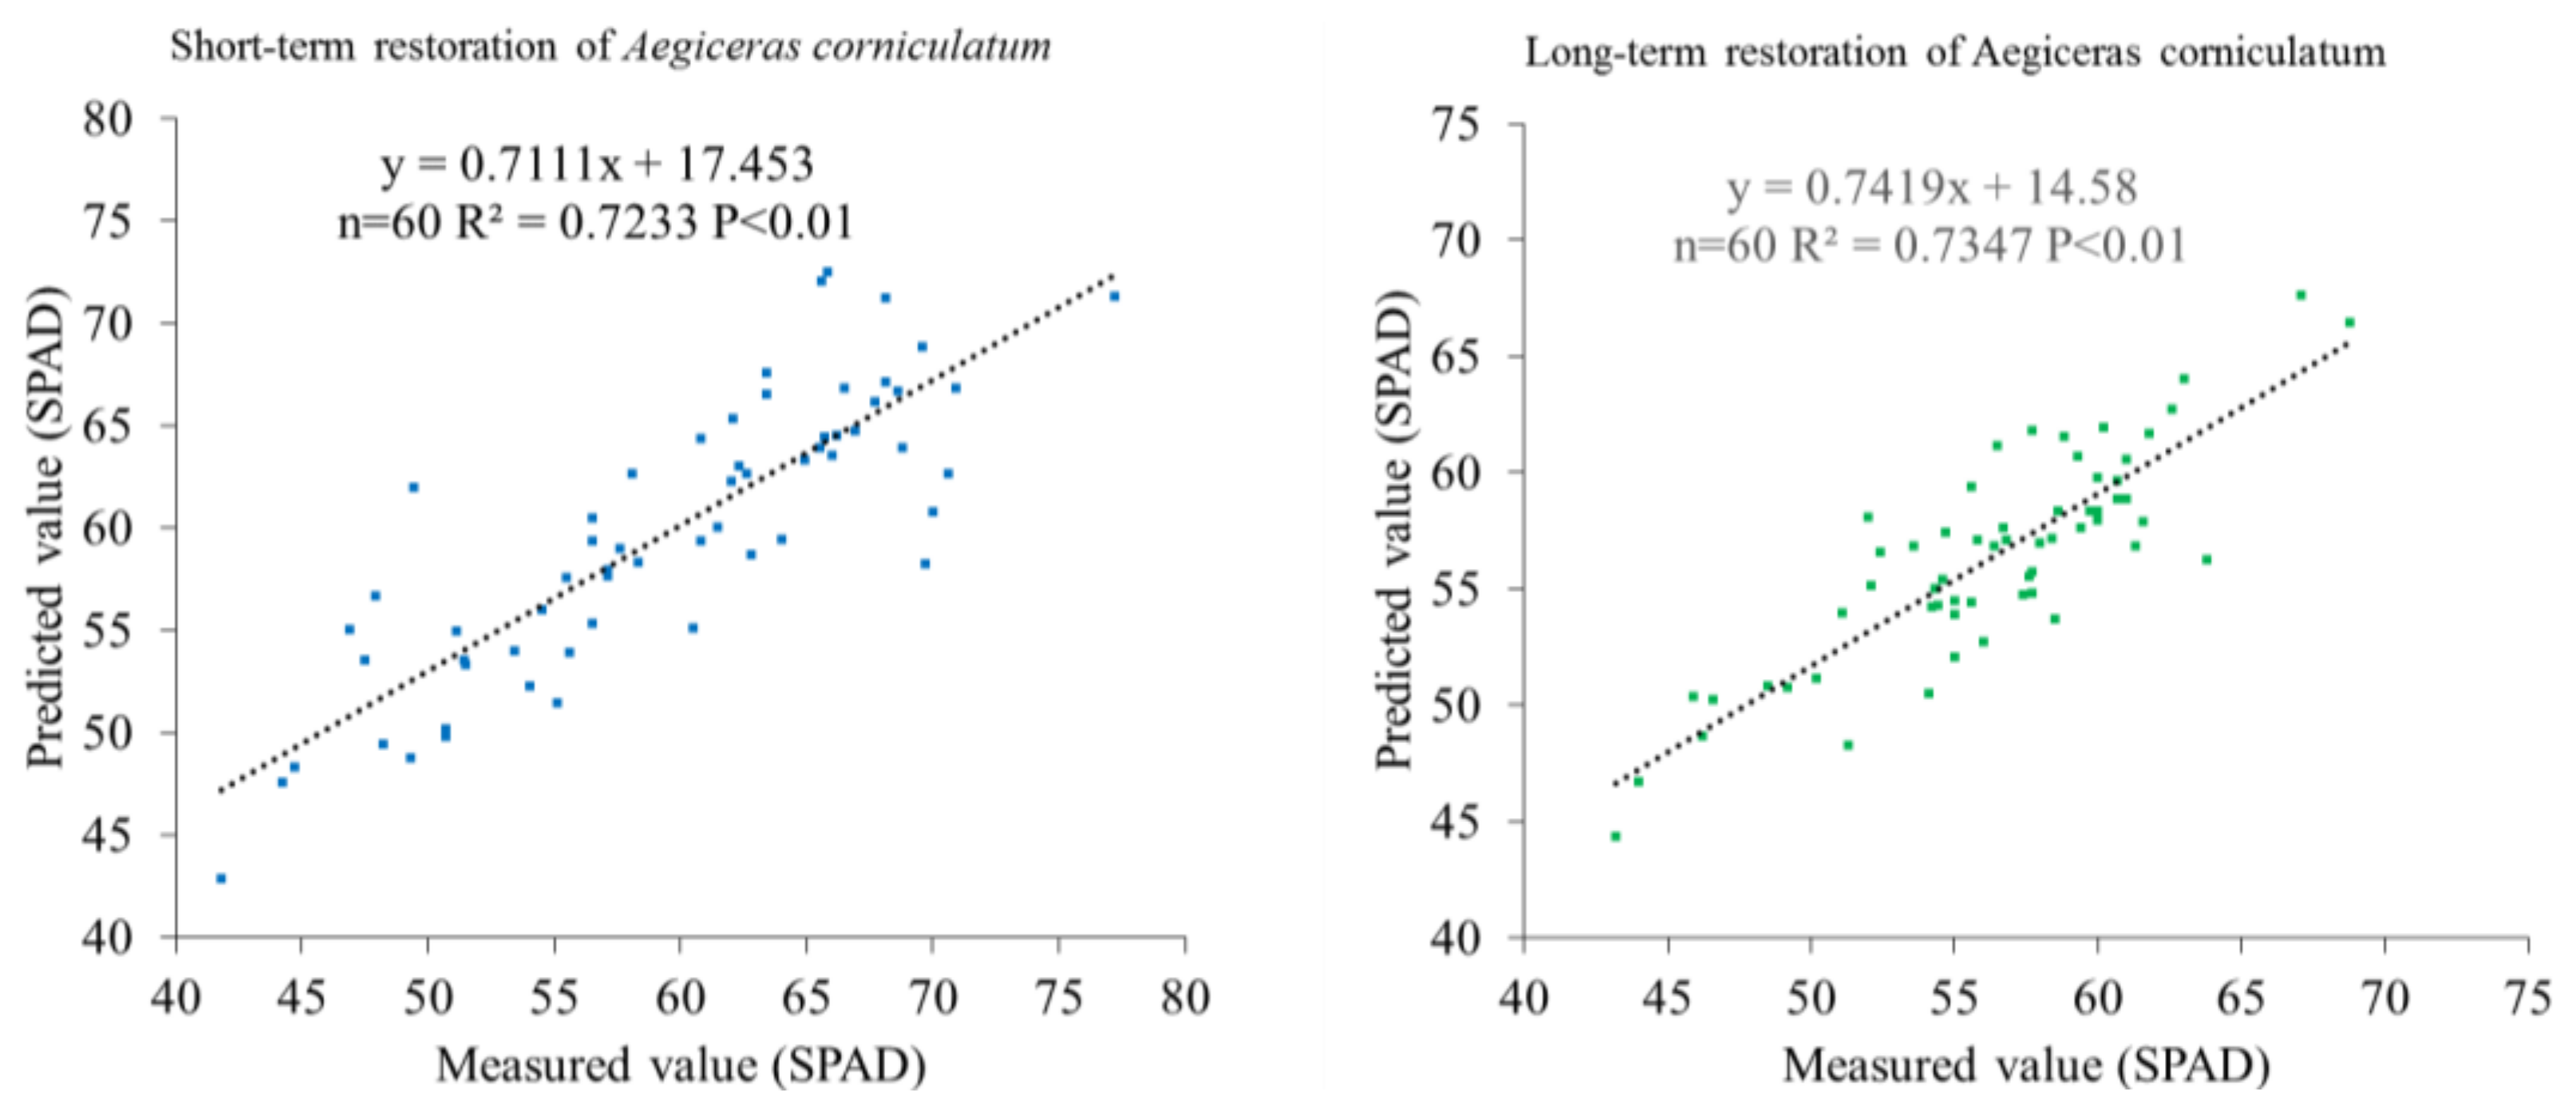
4.3.1. Red-Edge Position Model
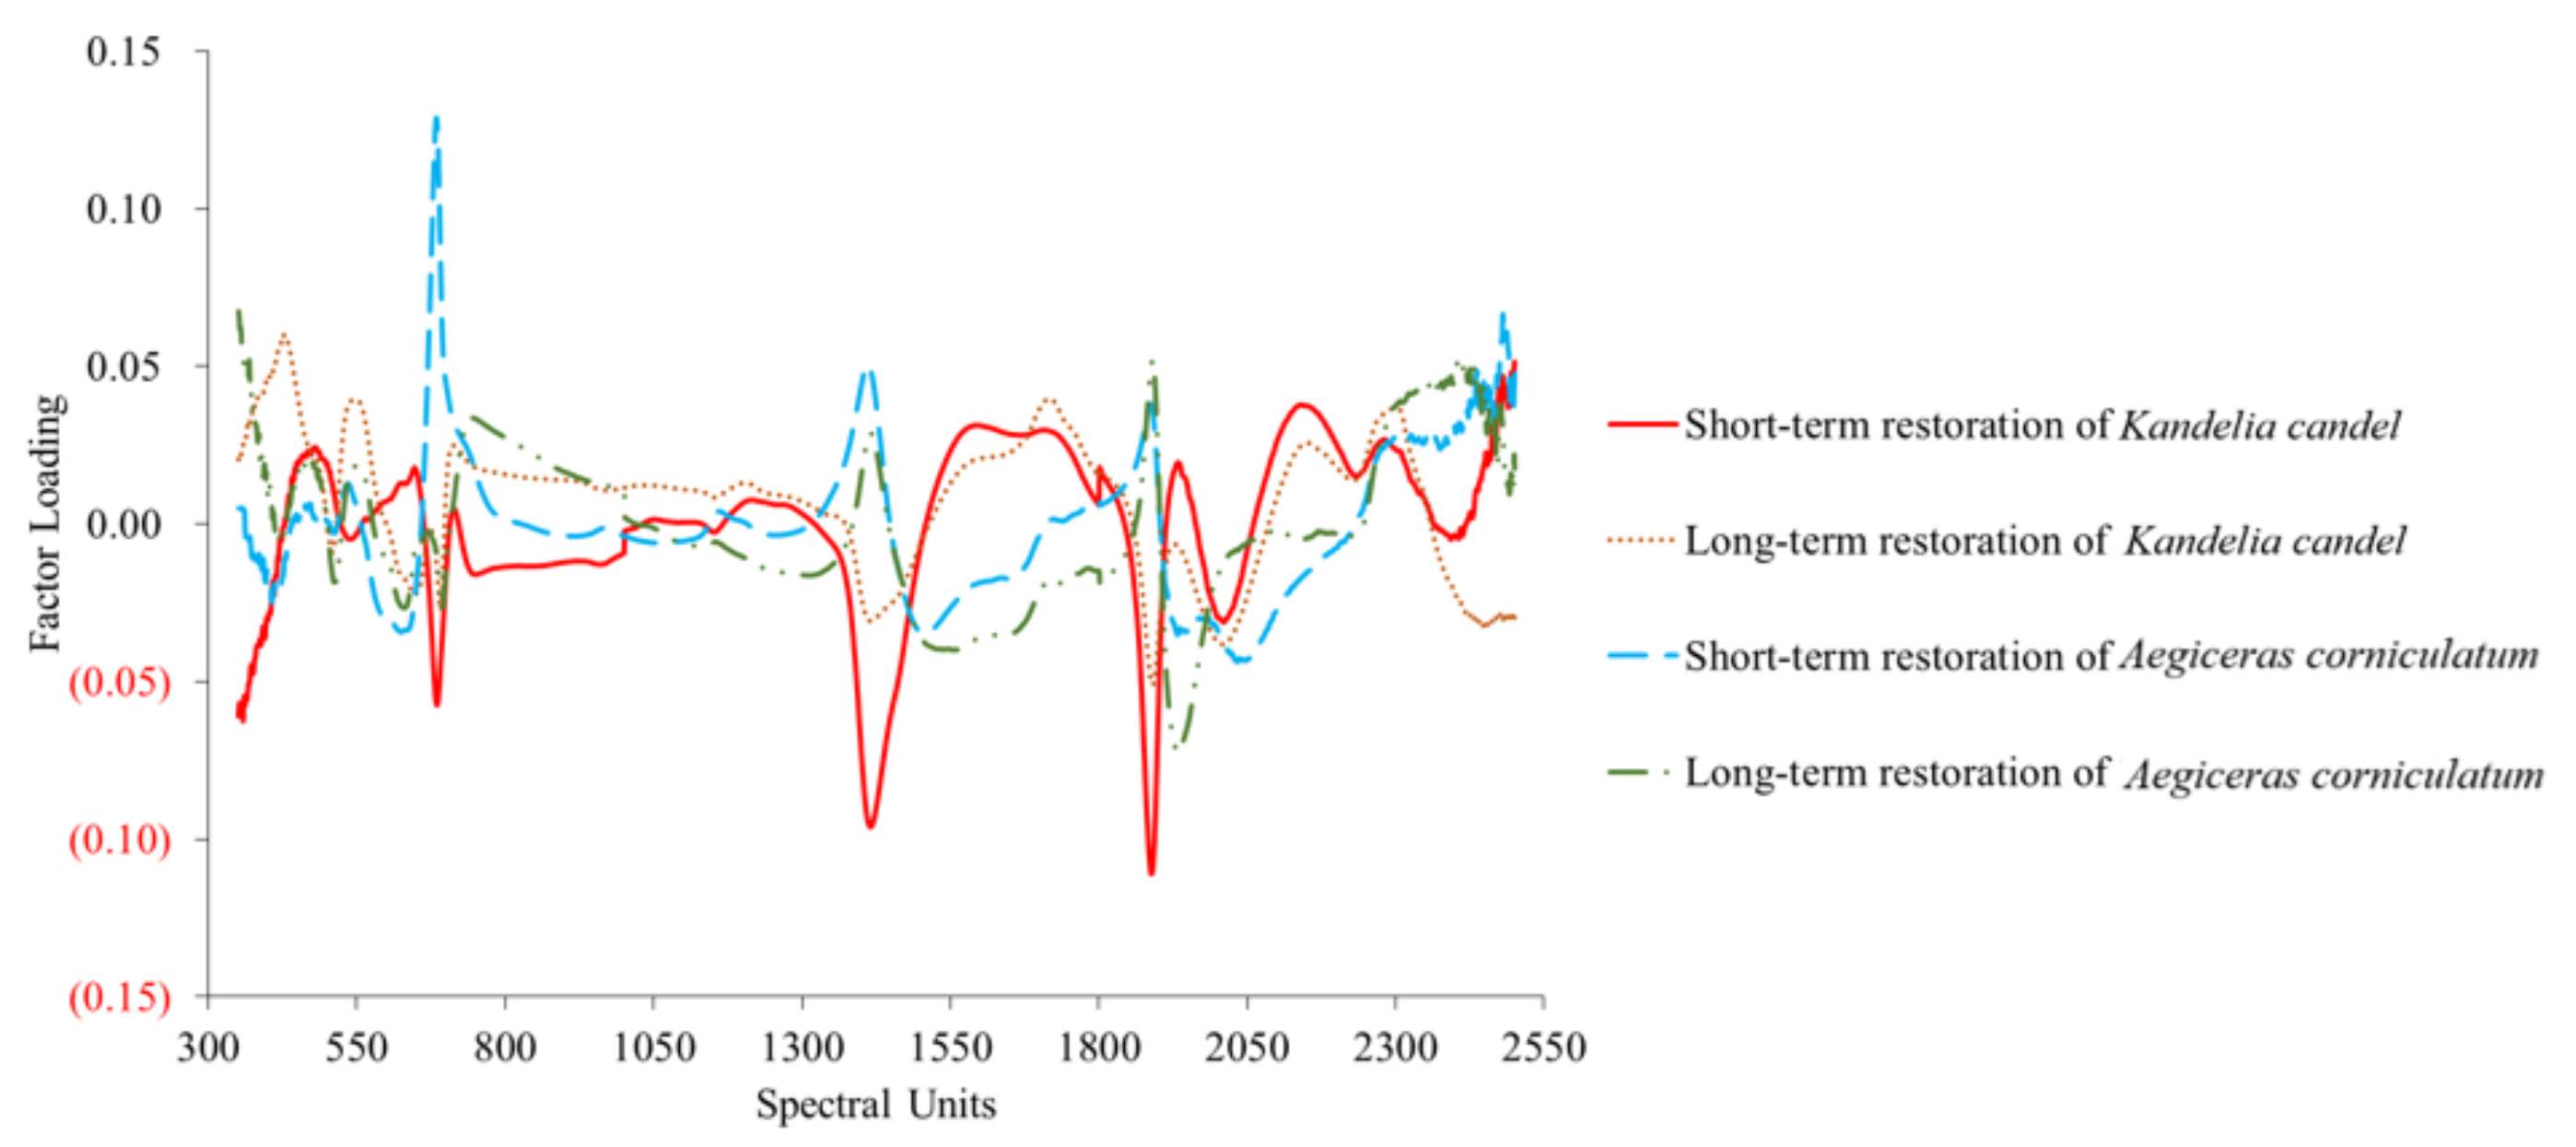
4.3.2. Full-Wave-Band Spectrum Model
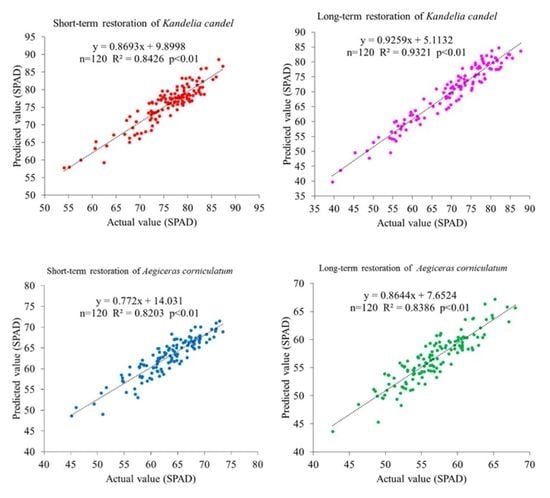
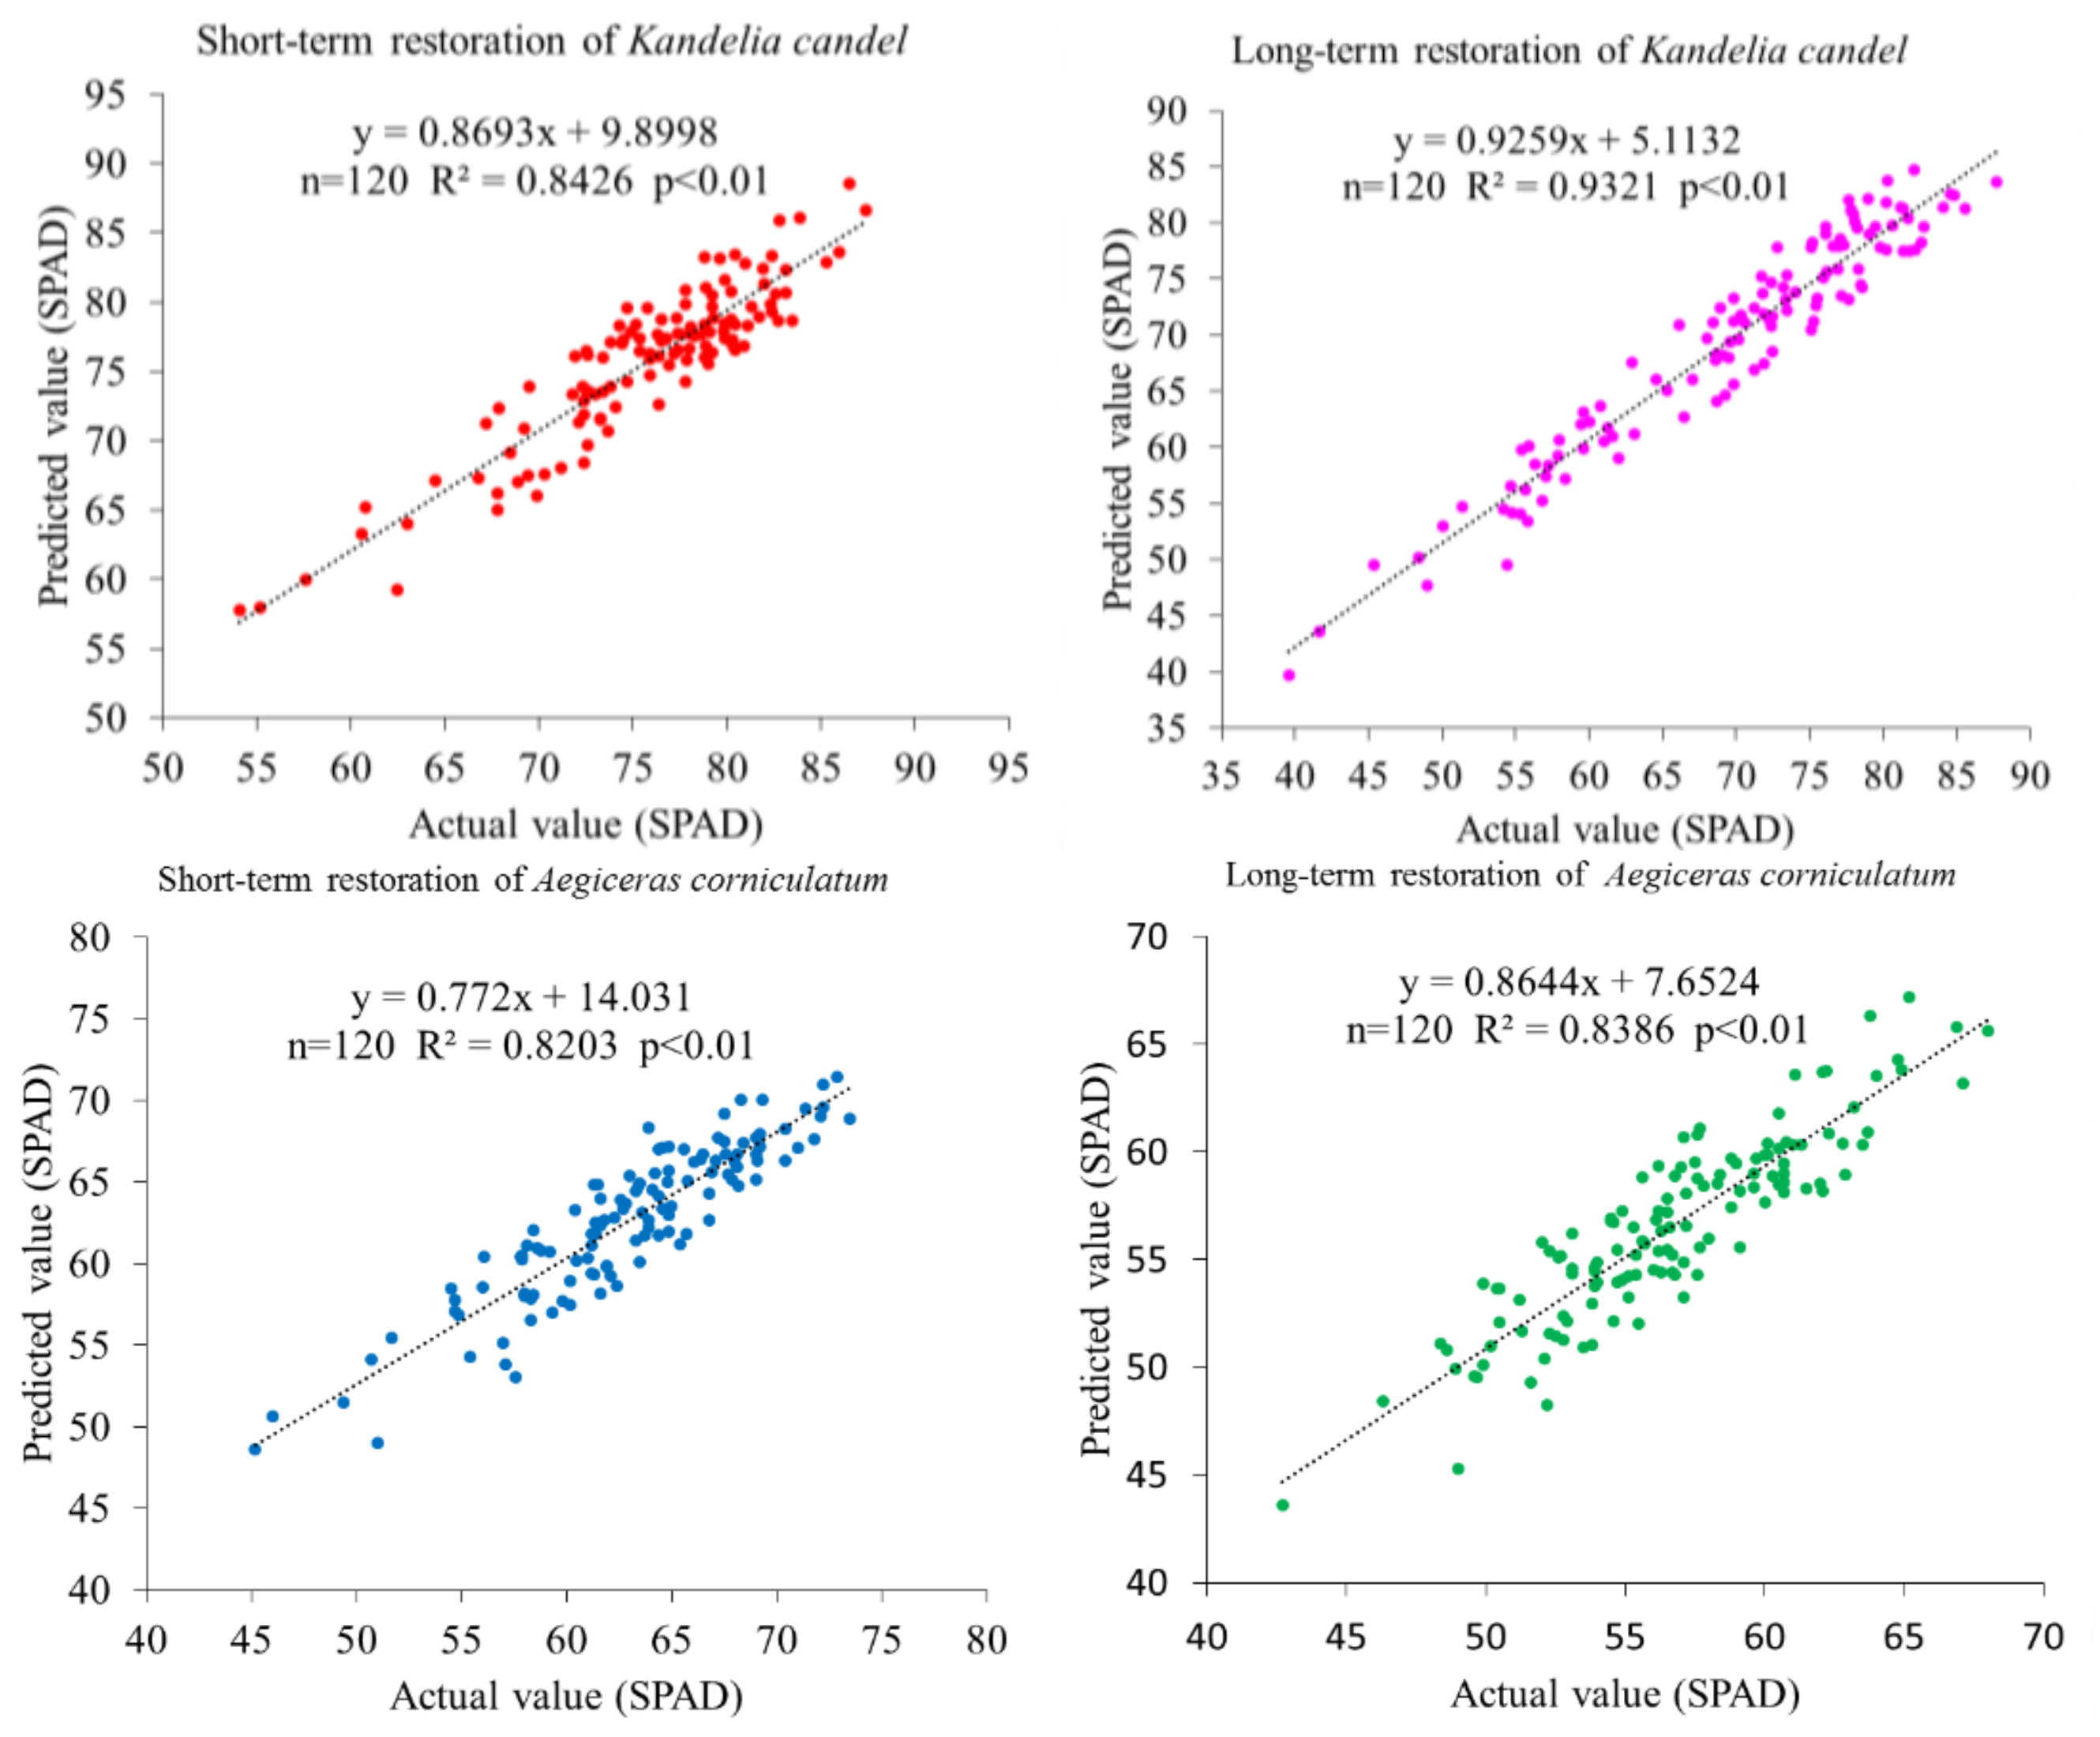
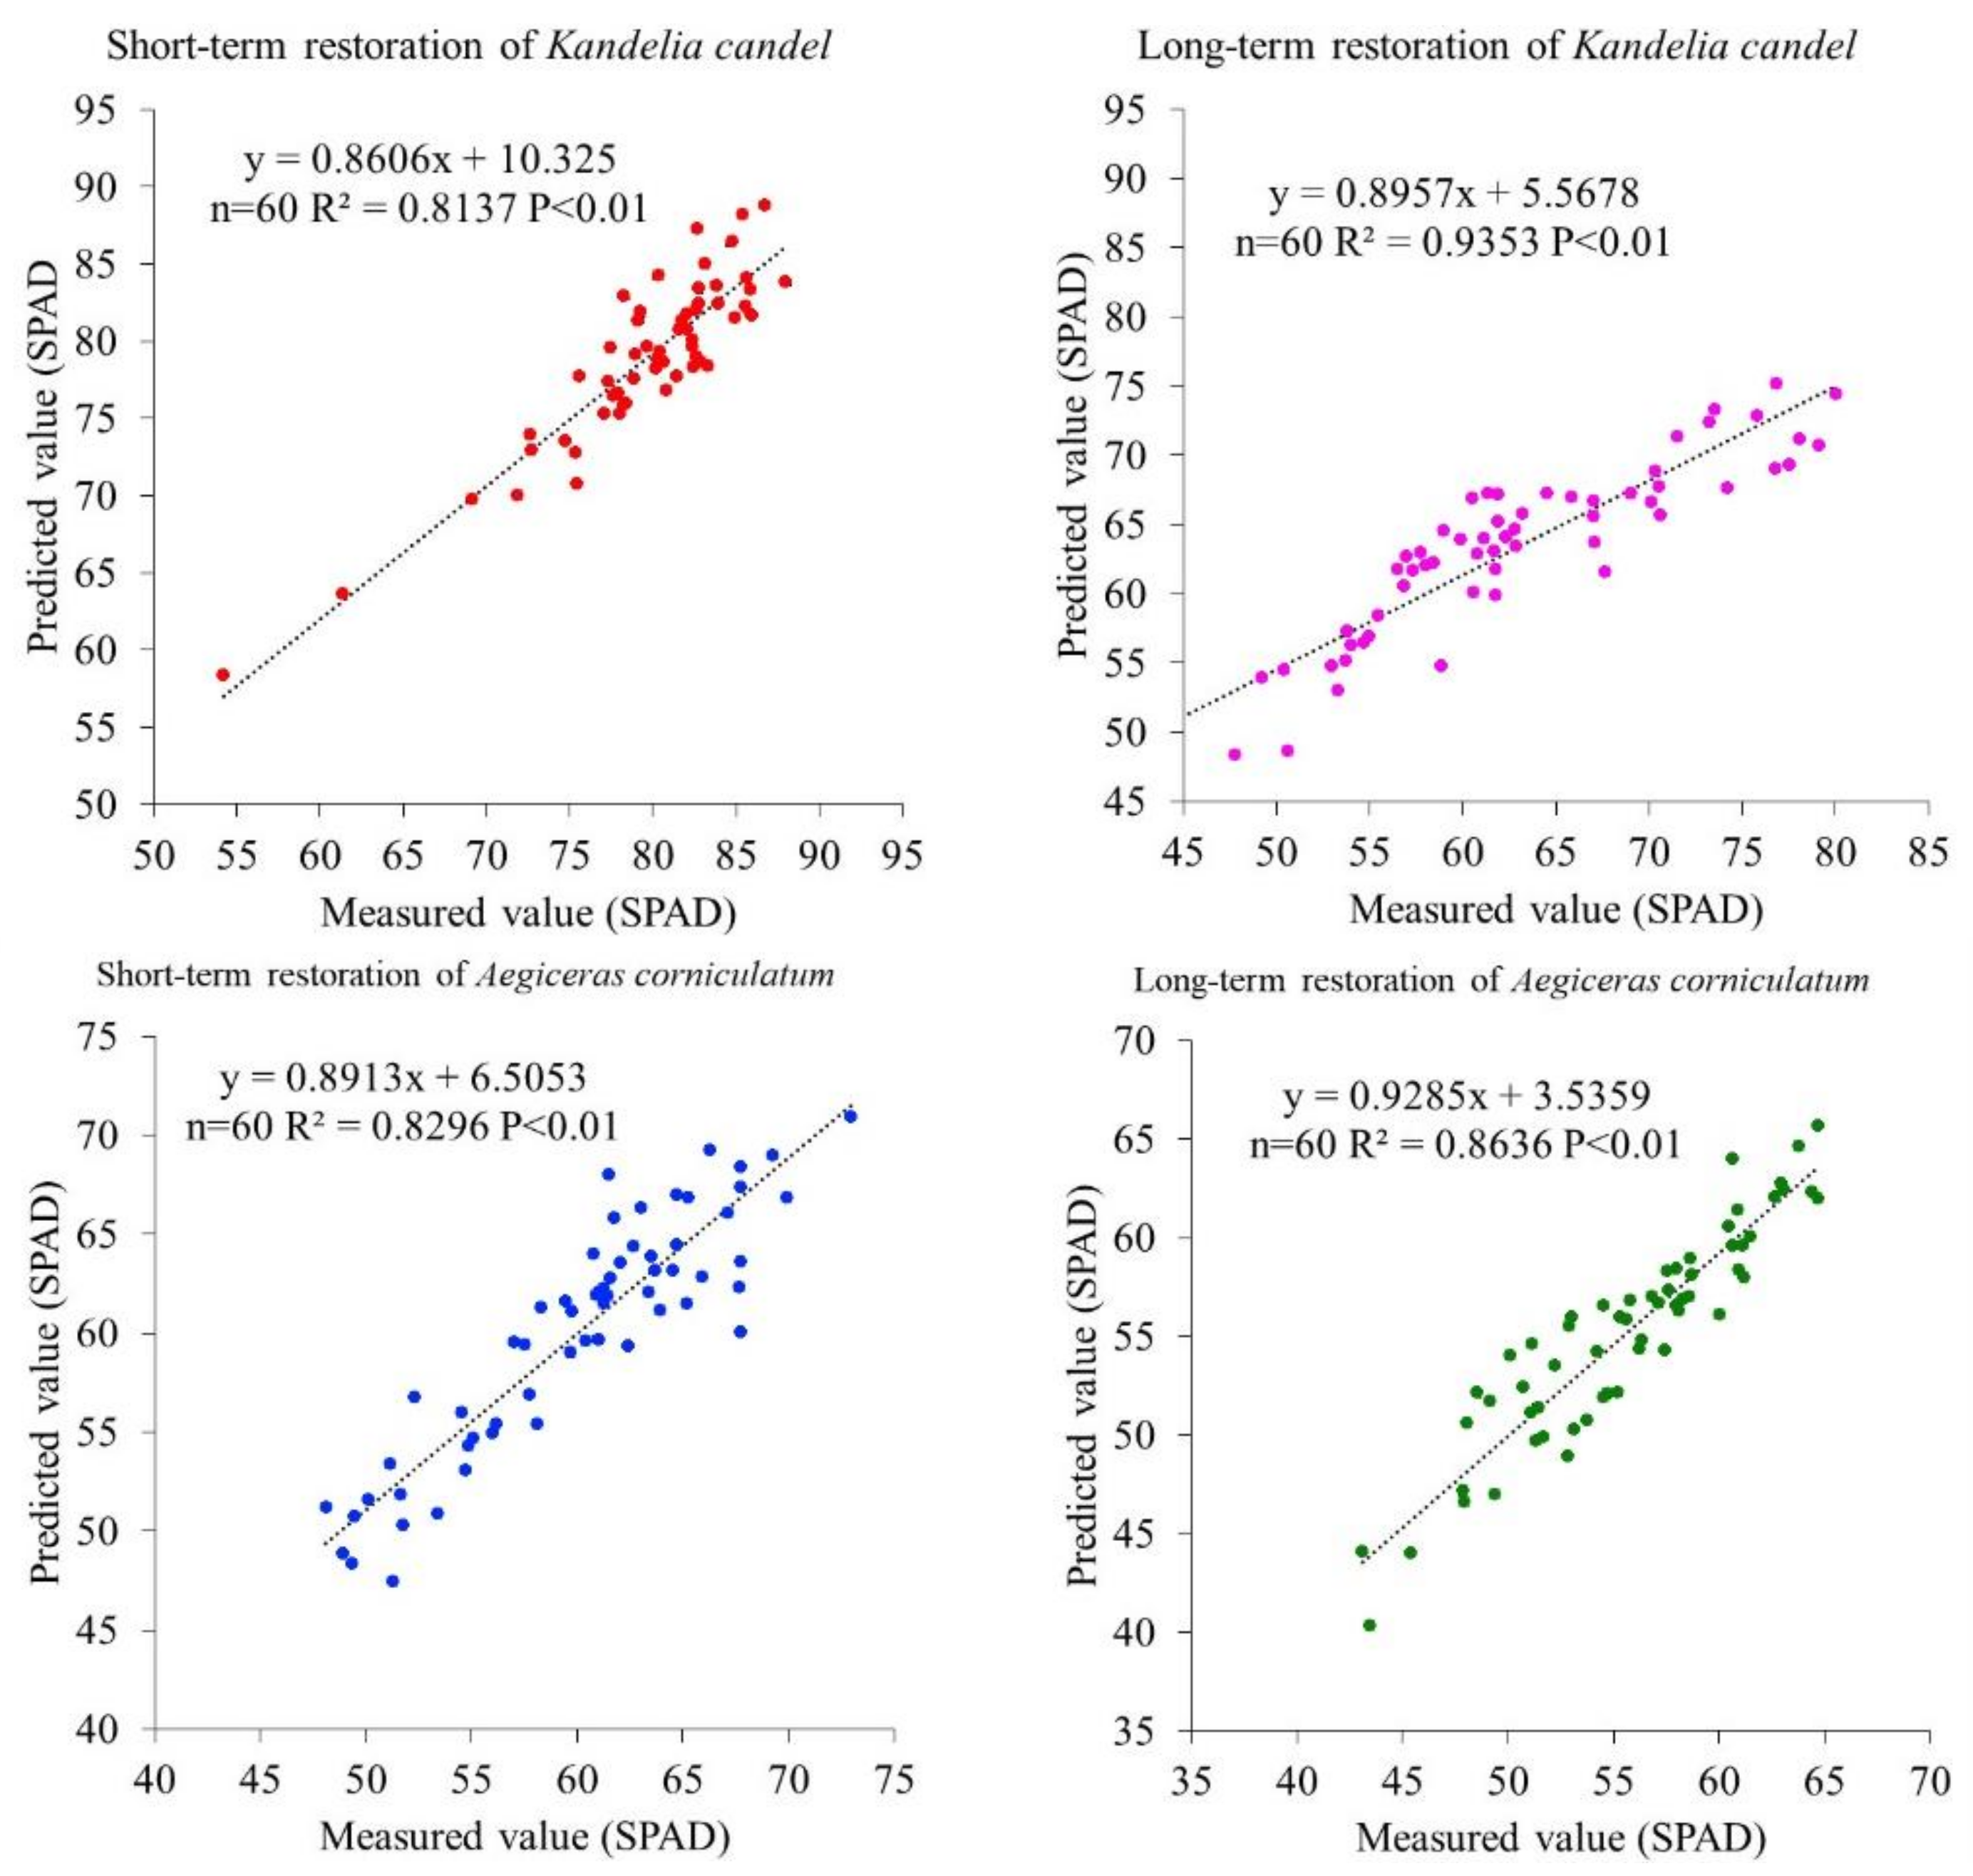
4.4. Verification of the Estimation Model
5. Discussion
6. Conclusions
Supplementary Materials
Acknowledgments
Author Contributions
Conflicts of Interest
References
- Chen, B.; Yu, W.; Liu, W.; Liu, Z. An assessment on restoration of typical marine ecosystems in China—Achievements and lessons. Ocean Coast. Manag. 2012, 57, 53–61. [Google Scholar] [CrossRef]
- Cui, L.; Zhang, M.; Li, W.; Lei, Y.; Ma, M.; Mao, X.; Xiao, H.; Zhao, X. Understanding Wetlands; Popular Science Press: Beijing, China, 2017. [Google Scholar]
- Huang, G.L. The protection and development of Mangrove Wetland in China. For. Res. Manag. 1996, 5, 14–17. (In Chinese) [Google Scholar]
- Wang, Y.N.; Fu, X.M.; Shao, C.L.; Wang, C.; Li, G.; Liu, G.; Sun, S.; Zeng, X.; Ye, Z.; Guan, S. Investigation on the Status of Mangrove Resources and Medicinal Research in China I. Ecological Functions and Values. Period. Ocean Univ. China 2009, 122, 2071–2083. [Google Scholar]
- Yan, C.; Niu, Z.; Wang, J.; Liu, L.; Huang, J. The assessment of spectral indices applied in chlorophyll content retrieval and a modified crop canopy chlorophyll content retrieval model. J. Remote Sens. 2005, 9, 742–750. [Google Scholar]
- Harahsheh, H. Chapter 4 Remote sensing applications for coastal and marine resources management. Dev. Earth Environ. Sci. 2005, 3, 49–61. [Google Scholar]
- Heenkenda, M.K.; Joyce, K.E.; Maier, S.W.; de Bruin, S. Quantifying mangrove chlorophyll from high spatial resolution imagery. ISPRS J. Photogramm. 2015, 108, 234–244. [Google Scholar] [CrossRef]
- Guzman, J.P.; Dash, J.; Atkinson, P. Remote sensing of mangrove forest phenology and its environmental drivers. Remote Sens. Environ. 2018, 205, 71–84. [Google Scholar] [CrossRef]
- Lee, T.M.; Yeh, H.C. Applying remote sensing techniques to monitor shifting wetland vegetation: A case study of Danshui River estuary mangrove communities, Taiwan. Ecol. Eng. 2009, 35, 487–496. [Google Scholar] [CrossRef]
- Scholander, P.F. How Mangroves Desalinate Seawater. Physiol. Plant. 1968, 21, 251–261. [Google Scholar] [CrossRef]
- Medina, E.; Fernandez, W.; Barboza, F. Element uptake, accumulation, and resorption in leaves of mangrove species with different mechanisms of salt regulation. Web Ecol. 2015, 15, 3–13. [Google Scholar] [CrossRef]
- Tomlinson, P.B. The Botany of Mangroves; Cambridge University Press: Cambridge, UK, 1986. [Google Scholar]
- Lin, P. Mangroves; China Ocean Press: Beijing, China, 1984. (In Chinese) [Google Scholar]
- Rovai, A.S.; Barufi, J.B.; Pagliosa, P.R.; Scherner, F.; Torres, M.A.; Horta, P.A.; Simonassi, J.C.; Quadros, D.P.; Borges, D.L.; Soriano-Sierra, E.J. Photosynthetic performance of restored and natural mangroves under different environmental constraints. Environ. Pollut. 2013, 181, 233–241. [Google Scholar] [CrossRef] [PubMed]
- Zheng, C.; Liu, W.; Qiu, J.; Huang, X.; Chen, S. Comparison of physiological characteristics of Kandelia obovata, at different ages in winter in the northernmost mangrove transplanted area of China. Acta Ecol. Sin. 2013, 33, 132–138. [Google Scholar] [CrossRef]
- Castillo, J.A.A.; Apan, A.; Maraseni, T.N.; Salmo, S. Estimation and mapping of above-ground biomass of mangrove forests and their replacement land uses in the Philippines using Sentinel imagery. ISPRS J. Photogramm. 2017, 134, 70–85. [Google Scholar] [CrossRef]
- Turpie, K.R.; Klemas, V.V.; Byrd, K.; Kelly, M.; Jo, Y.H. Prospective HyspIRI global observations of tidal wetlands. Remote Sens. Environ. 2015, 167, 206–217. [Google Scholar] [CrossRef]
- Pham, L.T.H.; Brabyn, L. Monitoring mangrove biomass change in Vietnam using SPOT images and an object-based approach combined with machine learning algorithms. ISPRS J. Photogramm. 2017, 128, 86–97. [Google Scholar] [CrossRef]
- Vaiphasa, C.; Skidmore, A.K.; Boer, W.F.D.; Vaiphasa, T. A hyperspectral band selector for plant species discrimination. ISPRS J. Photogramm. 2007, 62, 225–235. [Google Scholar] [CrossRef]
- Zhang, C.; Kovacs, J.; Liu, Y.; Floresverdugo, F.; Floresdesantiago, F. Separating mangrove species and conditions using laboratory hyperspectral data: A case study of a degraded mangrove forest of the Mexican Pacific. Remote Sens. 2014, 6, 11673–11688. [Google Scholar] [CrossRef]
- Jia, M.; Zhang, Y.; Wang, Z.; Song, K.; Ren, C. Mapping the distribution of mangrove species in the Core Zone of Mai Po Marshes Nature Reserve, Hong Kong, using hyperspectral data and high-resolution data. Int. J. Appl. Earth Obs. 2014, 33, 226–231. [Google Scholar] [CrossRef]
- Vaiphasa, C.; Ongsomwang, S.; Vaiphasa, T.; Skidmore, A.K. Tropical mangrove species discrimination using hyperspectral data: A laboratory study. Estuar. Coast. Shelf Sci. 2005, 65, 371–379. [Google Scholar] [CrossRef]
- Reinert, F.; de Pinho, C.F.; Ferreira, M.A. Diagnosing the level of stress on a mangrove species (Laguncularia racemosa) contaminated with oil: A necessary step for monitoring mangrove ecosystem. Mar. Pollut. Bull. 2016, 113, 94–99. [Google Scholar] [CrossRef] [PubMed]
- Floresdesantiago, F.; Kovacs, J.; Wang, J.; Flores-Verdugo, F.; Zhang, C.; González-Farías, F. Examining the Influence of Seasonality, Condition, and Species Composition on Mangrove Leaf Pigment Contents and Laboratory Based Spectroscopy Data. Remote Sens. 2016, 8, 226. [Google Scholar] [CrossRef]
- Flores-De-Santiago, F.; Kovacs, J.M.; Flores-Verdugo, F. The influence of seasonality in estimating mangrove leaf chlorophyll—A content from hyperspectral data. Wetl. Ecol. Manag. 2013, 21, 193–207. [Google Scholar] [CrossRef]
- Das, S. Ecological Restoration and Livelihood: Contribution of Planted Mangroves as Nursery and Habitat for Artisanal and Commercial Fishery. World Dev. 2017, 94, 492–502. [Google Scholar] [CrossRef]
- Ferreira, A.C.; Ganade, G.; Attayde, J.L.D. Restoration versus natural regeneration in a neotropical mangrove: Effects on plant biomass and crab communities. Ocean Coast. Manag. 2015, 110, 38–45. [Google Scholar] [CrossRef]
- Stokes, D.J.; Bulmer, R.H.; Lundquist, C.J. Addressing the mismatch between restoration objectives and monitoring needs to support mangrove management. Ocean Coast. Manag. 2016, 134, 69–78. [Google Scholar] [CrossRef]
- Zaldívar-Jiménez, A.; Ladrón-De-Guevara-Porras, P.; Pérez-Ceballos, R.; Díaz-Mondragón, S.; Rosado-Solórzano, R. US-Mexico joint Gulf of Mexico large marine ecosystem based assessment and management: Experience in community involvement and mangrove wetland restoration in Términos lagoon, Mexico. Environ. Dev. 2017, 22, 206–213. [Google Scholar] [CrossRef]
- Zarco-Tejada, P.J.; Miller, J.R.; Morales, A.; Berjón, A.; Agüera, J. Hyperspectral indices and model simulation for chlorophyll estimation in open-canopy tree crops. Remote Sens. Environ. 2004, 90, 463–476. [Google Scholar] [CrossRef]
- Kamal, M.; Phinn, S.; Johansen, K. Assessment of multi-resolution image data for mangrove leaf area index mapping. Remote Sens. Environ. 2016, 176, 242–254. [Google Scholar] [CrossRef]
- Fauzi, A.; Skidmore, A.K.; Van, G.H.; Schlerf, M.; Heitkönig, I.M.A. Shrimp pond effluent dominates foliar nitrogen in disturbed mangroves as mapped using hyperspectral imagery. Mar. Pollut. Bull. 2013, 76, 42–51. [Google Scholar] [CrossRef] [PubMed]
- Cho, M.A.; Skidmore, A.K. A new technique for extracting the red edge position from hyperspectral data: The linear extrapolation method. Remote Sens. Environ. 2006, 101, 181–193. [Google Scholar] [CrossRef]
- Delegido, J.; Verrelst, J.; Meza, C.M.; Rivera, J.P.; Alonso, L.; Moreno, J. A red-edge spectral index for remote sensing estimation of green LAI over agroecosystems. Eur. J. Agron. 2013, 46, 42–52. [Google Scholar] [CrossRef]
- Kopačková, V.; Mišurec, J.; Lhotáková, Z.; Oulehle, F.; Albrechtová, J. Using multi-date high spectral resolution data to assess the physiological status of macroscopically undamaged foliage on a regional scale. Int. J. Appl. Earth Obs. 2014, 27, 169–186. [Google Scholar] [CrossRef]
- Stratoulias, D.; Balzter, H.; Zlinszky, A.; Tóth, V.R. Assessment of ecophysiology of lake shore reed vegetation based on chlorophyll fluorescence, field spectroscopy and hyperspectral airborne imagery. Remote Sens. Environ. 2015, 157, 72–84. [Google Scholar] [CrossRef] [Green Version]
- Dawson, T.P.; Curran, P.J. Technical note a new technique for interpolating the reflectance red edge position. Int. J. Remote Sens. 1998, 19, 2133–2139. [Google Scholar] [CrossRef]
- Curran, P.J. Relationship between herbicide concentration during the 1960s and 1970s and the contemporary MERIS Terrestrial Chlorophyll Index (MTCI) for southern Vietnam. Int. J. Geogr. Inf. Sci. 2006, 20, 929–939. [Google Scholar]
- Zhang, C.; Chen, K.; Liu, Y.; Kovacs, J.M.; Flores-Verdugo, F.; Flores-de-Santiago, F. Spectral response to varying levels of leaf pigments collected from a degraded mangrove forest. J. Appl. Remote Sens. 2012, 6, 063501. [Google Scholar] [CrossRef]
- Cole, B.; Mcmorrow, J.; Evans, M. Empirical Modelling of Vegetation Abundance from Airborne Hyperspectral Data for Upland Peatland Restoration Monitoring. Remote Sens. 2014, 6, 716–739. [Google Scholar] [CrossRef]
- Möckel, T.; Dalmayne, J.; Prentice, H.; Eklundh, L.; Purschke, O.; Schmidtlein, S.; Hall, K. Classification of Grassland Successional Stages Using Airborne Hyperspectral Imagery. Remote Sens. 2014, 6, 7732–7761. [Google Scholar] [CrossRef]
- Tian, J.; Wang, L.; Li, X.; Gong, H.; Shi, C.; Zhong, R.; Liu, X. Comparison of UAV and WorldView-2 imagery for mapping leaf area index of mangrove forest. Int. J. Appl. Earth Obs. 2017, 61, 22–31. [Google Scholar] [CrossRef]
- Li, L.; Ren, T.; Ma, Y.; Wei, Q.; Wang, S.; Li, X.; Cong, R.; Liu, S.; Lu, J. Evaluating chlorophyll density in winter oilseed rape (Brassica napus L.) using canopy hyperspectral red-edge parameters. Comput. Electron. Agric. 2016, 126, 21–31. [Google Scholar] [CrossRef]
- Pastorguzman, J.; Atkinson, P.; Dash, J.; Riojanieto, R. Spatotemporal Variation in Mangrove Chlorophyll Concentration Using Landsat 8. Remote Sens. 2015, 7, 14530–14558. [Google Scholar] [CrossRef]
- Li, W.; Cui, L.; Zhang, M.; Wang, Y.; Zhang, Y.; Lei, Y.; Zhao, X. Effect of mangrove restoration on crab burrow density in Luoyangjiang Estuary, China. For. Ecosyst. 2015, 2, 263–271. [Google Scholar] [CrossRef]
- Fu, W.; Wu, Y. Estimation of aboveground biomass of different mangrove trees based on canopy diameter and tree height. Procedia Environ. Sci. 2011, 10, 2189–2194. [Google Scholar] [CrossRef]
- Yao, F.; Zhang, Z.; Yang, R.; Sun, J.; Cui, S. Hyperspectral models for estimating vegetation chlorophyll content based on red edge parameter. Trans. CSAE 2009, 25, 123–129. [Google Scholar]
- Croft, H.; Chen, J.M.; Zhang, Y. The applicability of empirical vegetation indices for determining leaf chlorophyll content over different leaf and canopy structures. Ecol. Complex. 2014, 17, 119–130. [Google Scholar] [CrossRef]
- Delegido, J.; Wittenberghe, S.V.; Verrelst, J.; Ortiz, V.; Veroustraete, F.; Valcke, R.; Samson, R.; Rivera, J.P.; Tenjo, C.; Moreno, J. Chlorophyll content mapping of urban vegetation in the city of Valencia based on the hyperspectral NAOC index. Ecol. Indic. 2014, 40, 34–42. [Google Scholar] [CrossRef]
- Wang, H.F.; Huo, Z.G.; Zhou, G.S.; Liao, Q.H.; Feng, H.K.; Wu, L. Estimating leaf SPAD values of freeze-damaged winter wheat using continuous wavelet analysis. Plant Physiol. Biochem. 2016, 98, 39–45. [Google Scholar] [CrossRef] [PubMed]
- Vos, J.; Bom, M. Hand-held chlorophyll meter: A promising tool to assess the nitrogen status of potato foliage. Potato Res. 1993, 36, 301–308. [Google Scholar] [CrossRef]
- Wu, J.D.; Wang, D.; Rosen, C.J.; Bauer, M.E. Comparison of petiole nitrate concentrations, SPAD chlorophyll readings, and QuickBird satellite imagery in detecting nitrogen status of potato canopies. Field Crops Res. 2015, 101, 96–103. [Google Scholar] [CrossRef]
- Curran, P.J.; Dungan, J.L.; Macler, B.A.; Plummer, S.E. The effect of a red leaf pigment on the relationship between red edge and chlorophyll concentration. Remote Sens. Environ. 1991, 35, 69–76. [Google Scholar] [CrossRef]
- Gates, D.M.; Keegan, H.J.; Schleter, J.C.; Weidner, V.R. Spectral properties of plants. Appl. Opt. 1965, 4, 11–20. [Google Scholar] [CrossRef]
- Horler, D.N.H.; Dockray, M.; Barber, J. The red edge of plant leaf reflectance. Int. J. Remote Sens. 1983, 4, 273–288. [Google Scholar] [CrossRef]
- Ye, Y.; Tam, N.F.Y.; Wong, Y.S.; Lu, C.Y. Growth and physiological responses of two mangrove species (Bruguiera gymnorrhiza, and Kandelia candel) to waterlogging. Environ. Exp. Bot. 2003, 49, 209–221. [Google Scholar] [CrossRef]
- Chen, L.; Wang, W.; Li, Q.Q.; Zhang, Y.; Yang, S.; Osland, M.J.; Huang, J.; Peng, C. Mangrove species’ responses to winter air temperature extremes in China. Ecosphere 2017, 8, e01865. [Google Scholar] [CrossRef]
- Sahu, S.K.; Singh, R.; Kathiresan, K. Multi-gene phylogenetic analysis reveals the multiple origin and evolution of mangrove physiological traits through exaptation. Estuar. Coast. Shelf Sci. 2016, 183, 41–51. [Google Scholar] [CrossRef]
- Torrecilla, E.; Stramski, D.; Reynolds, R.A.; Millán-Núñez, E.; Piera, J. Cluster analysis of hyperspectral optical data for discriminating phytoplankton pigment assemblages in the open ocean. Remote Sens. Environ. 2011, 115, 2578–2593. [Google Scholar] [CrossRef] [Green Version]
- Naidoo, L.; Cho, M.A.; Mathieu, R.; Asner, G. Classification of savanna tree species, in the Greater Kruger National Park region, by integrating hyperspectral and LiDAR data in a Random Forest data mining environment. ISPRS J. Photogramm. 2012, 69, 167–179. [Google Scholar] [CrossRef]
- Ajithkumar, T.T.; Thangaradjou, T.; Kannan, L. Spectral reflectance properties of mangrove species of the Muthupettai mangrove environment, Tamil Nadu. J. Environ. Biol. 2008, 29, 785–788. [Google Scholar] [PubMed]
- Al-Naimi, N.; Al-Ghouti, M.A.; Balakrishnan, P. Investigating chlorophyll and nitrogen levels of mangroves at Al-Khor, Qatar: An integrated chemical analysis and remote sensing approach. Environ. Monit. Assess. 2016, 188, 1–12. [Google Scholar] [CrossRef] [PubMed]
- Jacquemoud, S.; Baret, F. PROSPECT: A model of leaf optical properties spectra. Remote Sens. Environ. 1990, 34, 75–91. [Google Scholar] [CrossRef]
- Maier, S.W.; Lüdeker, W.; Günther, K.P. SLOP: A Revised Version of the Stochastic Model for Leaf Optical Properties. Remote Sens. Environ. 1999, 68, 273–280. [Google Scholar] [CrossRef]
- Féret, J.B.; Gitelson, A.A.; Noble, S.D.; Jacquemoud, S. PROSPECT-D: Towards modeling leaf optical properties through a complete lifecycle. Remote Sens. Environ. 2017, 193, 204–215. [Google Scholar] [CrossRef]


| Parameter Name | Spectral Bands (nm) | Channel Number | Spectral Resolution | Sample Interval | Minimum Integral Time (ms) | Viewing Angle (°) | Standard Illuminant (W) |
|---|---|---|---|---|---|---|---|
| Parameter values | 350~2500 | 2151 | 3 nm@700 nm; 10 nm@1400/2100 nm | 1.4 nm@350~1000 nm; 1.1 nm@1001~2500 nm | 1 | 25 | 50 |
| Data Composition | Average (SPAD) | Maximum (SPAD) | Minimum (SPAD) | SD (SPAD) | C.V (%) |
|---|---|---|---|---|---|
| Short-term restoration of Kandelia candel | 75.7 | 87.7 | 54.1 | 6.2 | 8.2 |
| Long-term restoration of Kandelia candel | 69.7 | 86.7 | 39.6 | 10.3 | 14.8 |
| Short-term restoration of Aegiceras corniculatum | 62.9 | 73.5 | 45.2 | 5.5 | 8.8 |
| Long-term restoration of Aegiceras corniculatum | 56.6 | 68.0 | 42.7 | 4.5 | 7.9 |
| Model | Classification | R2 | RMSE | Stat. Sig |
|---|---|---|---|---|
| Red edge position model | Short-term restoration of Kandelia candel | 0.7206 | 3.11 | p-value < 0.01 |
| Long-term restoration of Kandelia candel | 0.8392 | 3.98 | p-value < 0.01 | |
| Short-term restoration of Aegiceras corniculatum | 0.7233 | 4.23 | p-value < 0.01 | |
| Long-term restoration of Aegiceras corniculatum | 0.7347 | 2.96 | p-value < 0.01 | |
| Full-wave band spectrum model | Short-term restoration of Kandelia candel | 0.8137 | 2.47 | p-value < 0.01 |
| Long-term restoration of Kandelia candel | 0.9353 | 2.26 | p-value < 0.01 | |
| Short-term restoration of Aegiceras corniculatum | 0.8296 | 2.52 | p-value < 0.01 | |
| Long-term restoration of Aegiceras corniculatum | 0.8636 | 2.01 | p-value < 0.01 |
© 2018 by the authors. Licensee MDPI, Basel, Switzerland. This article is an open access article distributed under the terms and conditions of the Creative Commons Attribution (CC BY) license (http://creativecommons.org/licenses/by/4.0/).
Share and Cite
Dou, Z.; Cui, L.; Li, J.; Zhu, Y.; Gao, C.; Pan, X.; Lei, Y.; Zhang, M.; Zhao, X.; Li, W. Hyperspectral Estimation of the Chlorophyll Content in Short-Term and Long-Term Restorations of Mangrove in Quanzhou Bay Estuary, China. Sustainability 2018, 10, 1127. https://doi.org/10.3390/su10041127
Dou Z, Cui L, Li J, Zhu Y, Gao C, Pan X, Lei Y, Zhang M, Zhao X, Li W. Hyperspectral Estimation of the Chlorophyll Content in Short-Term and Long-Term Restorations of Mangrove in Quanzhou Bay Estuary, China. Sustainability. 2018; 10(4):1127. https://doi.org/10.3390/su10041127
Chicago/Turabian StyleDou, Zhiguo, Lijuan Cui, Jing Li, Yinuo Zhu, Changjun Gao, Xu Pan, Yinru Lei, Manyin Zhang, Xinsheng Zhao, and Wei Li. 2018. "Hyperspectral Estimation of the Chlorophyll Content in Short-Term and Long-Term Restorations of Mangrove in Quanzhou Bay Estuary, China" Sustainability 10, no. 4: 1127. https://doi.org/10.3390/su10041127