Article

Coupling Field Observations and Geographical Information System (GIS)-Based Analysis for Improved Sustainable Urban Drainage Systems (SUDS) Performance

1
Department of Civil and Environmental Engineering, Norwegian University of Science and Technology, 7491 Trondheim, Norway
2
SINTEF Building and Infrastructure, 7465 Trondheim, Norway
*
Author to whom correspondence should be addressed.
Sustainability 2018, 10(12), 4683; https://doi.org/10.3390/su10124683
Submission received: 31 October 2018 / Revised: 4 December 2018 / Accepted: 5 December 2018 / Published: 9 December 2018

Abstract

:
Urbanization and increased precipitation volumes and intensities due to climate change add pressure to the urban drainage system, resulting in increased flooding frequencies of urban areas and deteriorating water quality in receiving waters. Infiltration practices and the use of blue green infrastructure, also called Sustainable Urban Drainage Systems (SUDS), can limit, and, in some cases, reverse the effects of urbanization. However, adequate infiltration capacity is an essential parameter for the successful implementation. In this paper, a Geographical Information System (GIS)-based hydrology analysis for SUDS placements is coupled with field measurements using Modified Phillip Dunne infiltrometer tests. The case study area is the expansion of the campus at the Norwegian University of Science and Technology (NTNU) over the next decade. Infiltration in urban soils can be highly heterogenous over short distances. When comparing measured infiltration rates with physical characteristics of the soils showed that the physical characteristics are not a good indication of the infiltration potential in urban soils with a large degree of compaction. The results showed that measuring the infiltration potential combined with flow path analysis can greatly enhance the benefits of blue green infrastructure, with an up to 70% difference in area required for SUDS solutions for managing 90% of the annual precipitation.

1. Introduction

The performance of sustainable urban drainage systems (SUDS), such as rain gardens, swales, and bioretention areas are driven mainly by the infiltration rate, the process in which water enters the soil media. The infiltration process may be described by the saturated hydraulic conductivity, Ksat, which measures the rate at which water can enter into the soil media at a given viscosity (temperature dependent) and soil permeability [1]. Soil maps can be used to obtain an estimate through soil type, which again can give parameters, such as Ksat and permeability. However, in urban areas the heterogeneity of soils is a major issue in using such maps. Soils in urban areas can vary significantly from soils with the same classification in natural non urban areas due to; (1) the degree of compaction over time due to construction and heavy loads; (2) the amount of organic matter; and, (3) contamination from construction debris and unspecified construction fill [2,3,4,5]. This makes it challenging to classify urban soils in the normal soil taxonomy groups, and assume water infiltration properties that are based on values given in tables.
Given that their performance is greatly influenced by in-situ conditions, there is an unused potential in identifying the best suited location for SUDS placement prior to the placing of new buildings and major infrastructure layout. In a retrofitting process, most optimal locations of SUDS can ensure a significantly improved performance.
Geographical Information Systems (GIS) provides an efficient way to analyze terrain data from digital elevation models (DEMs), which can provide information about watershed boundaries, slope, flow direction, and accumulation of water in a watershed, among others. GIS tools have been used as part of decision support systems to aid in selection of areas to be targeted for SUDS placement, and or retrofitting. Moore et al. [6] used a GIS based decision support system to select areas for SUDS placements with the aim to reduce combined sewer overflows (CSO) in large watersheds (>100 ha). The system would select suitable areas that are based on a set of criteria, and further analyze the types of SUDS that were likely to be best suited. A study from Espoo in southern Finland coupled GIS with the Storm Water Management Model (SWMM), a hydrological model to simulate runoff, to find the best suited placement for pervious pavements [7]. Placement and performance of green roofs to mitigate flash floods has been another application of SUDS placement coupled with GIS [8,9]. These GIS-based studies have integrated decision support with spatial information. However, the results will only be as good as the data input. Knowing the heterogeneity of urban soils, it is clear that general soil maps are not accurate enough to produce reliable results for infiltration based SUDS locations.
The motivation for application of SUDS in Norway are guided by a three-step strategic approach to stormwater management; where small events should be infiltrated locally, medium events should be detained locally, and for large events, the focus should be to ensure safe flood ways [10]. To further promote the implementation of SUDS in Norway, the Norwegian parliament effectuated in 2018, that the use of nature based solutions should be the norm, and exemptions needs to be justified, as part of national guidelines for adaptation to climate change. This is also in line with fulfilling the UNs Agenda 2030 Sustainable Development Goals (SDGs). Specifically, goal number 6, clean water, and sanitation, as well as goals number 11 Sustainable cities and communities, and goal number 14, life on land. The nationally anchored strategy has created a need for better tools for identifying the suitable areas for SUDS and validating their performance.
This study seeks to couple the advantages of GIS and spatial analysis with information about the infiltration capacity based on observations. The campus of the Norwegian University of Science and Technology (NTNU) was used as a case study. GIS- based flow path analysis was coupled with measured infiltration rates at different locations on campus. Based on the results from this analysis, the potential infiltration areas that are suitable to apply SUDS techniques have been identified.
Specifically, the objectives of this paper were to: (1) Develop a method to couple GIS based flow direction and accumulation tools for drainage line calculations with field infiltration measurement using to improve SUDS placements; (2) investigate how the heterogeneity of urban soil affects infiltration potential for SUDS locations; and, (3) determine the impact of site specific placement in managing the design storm requirements for SUDS.

2. Materials and Methods
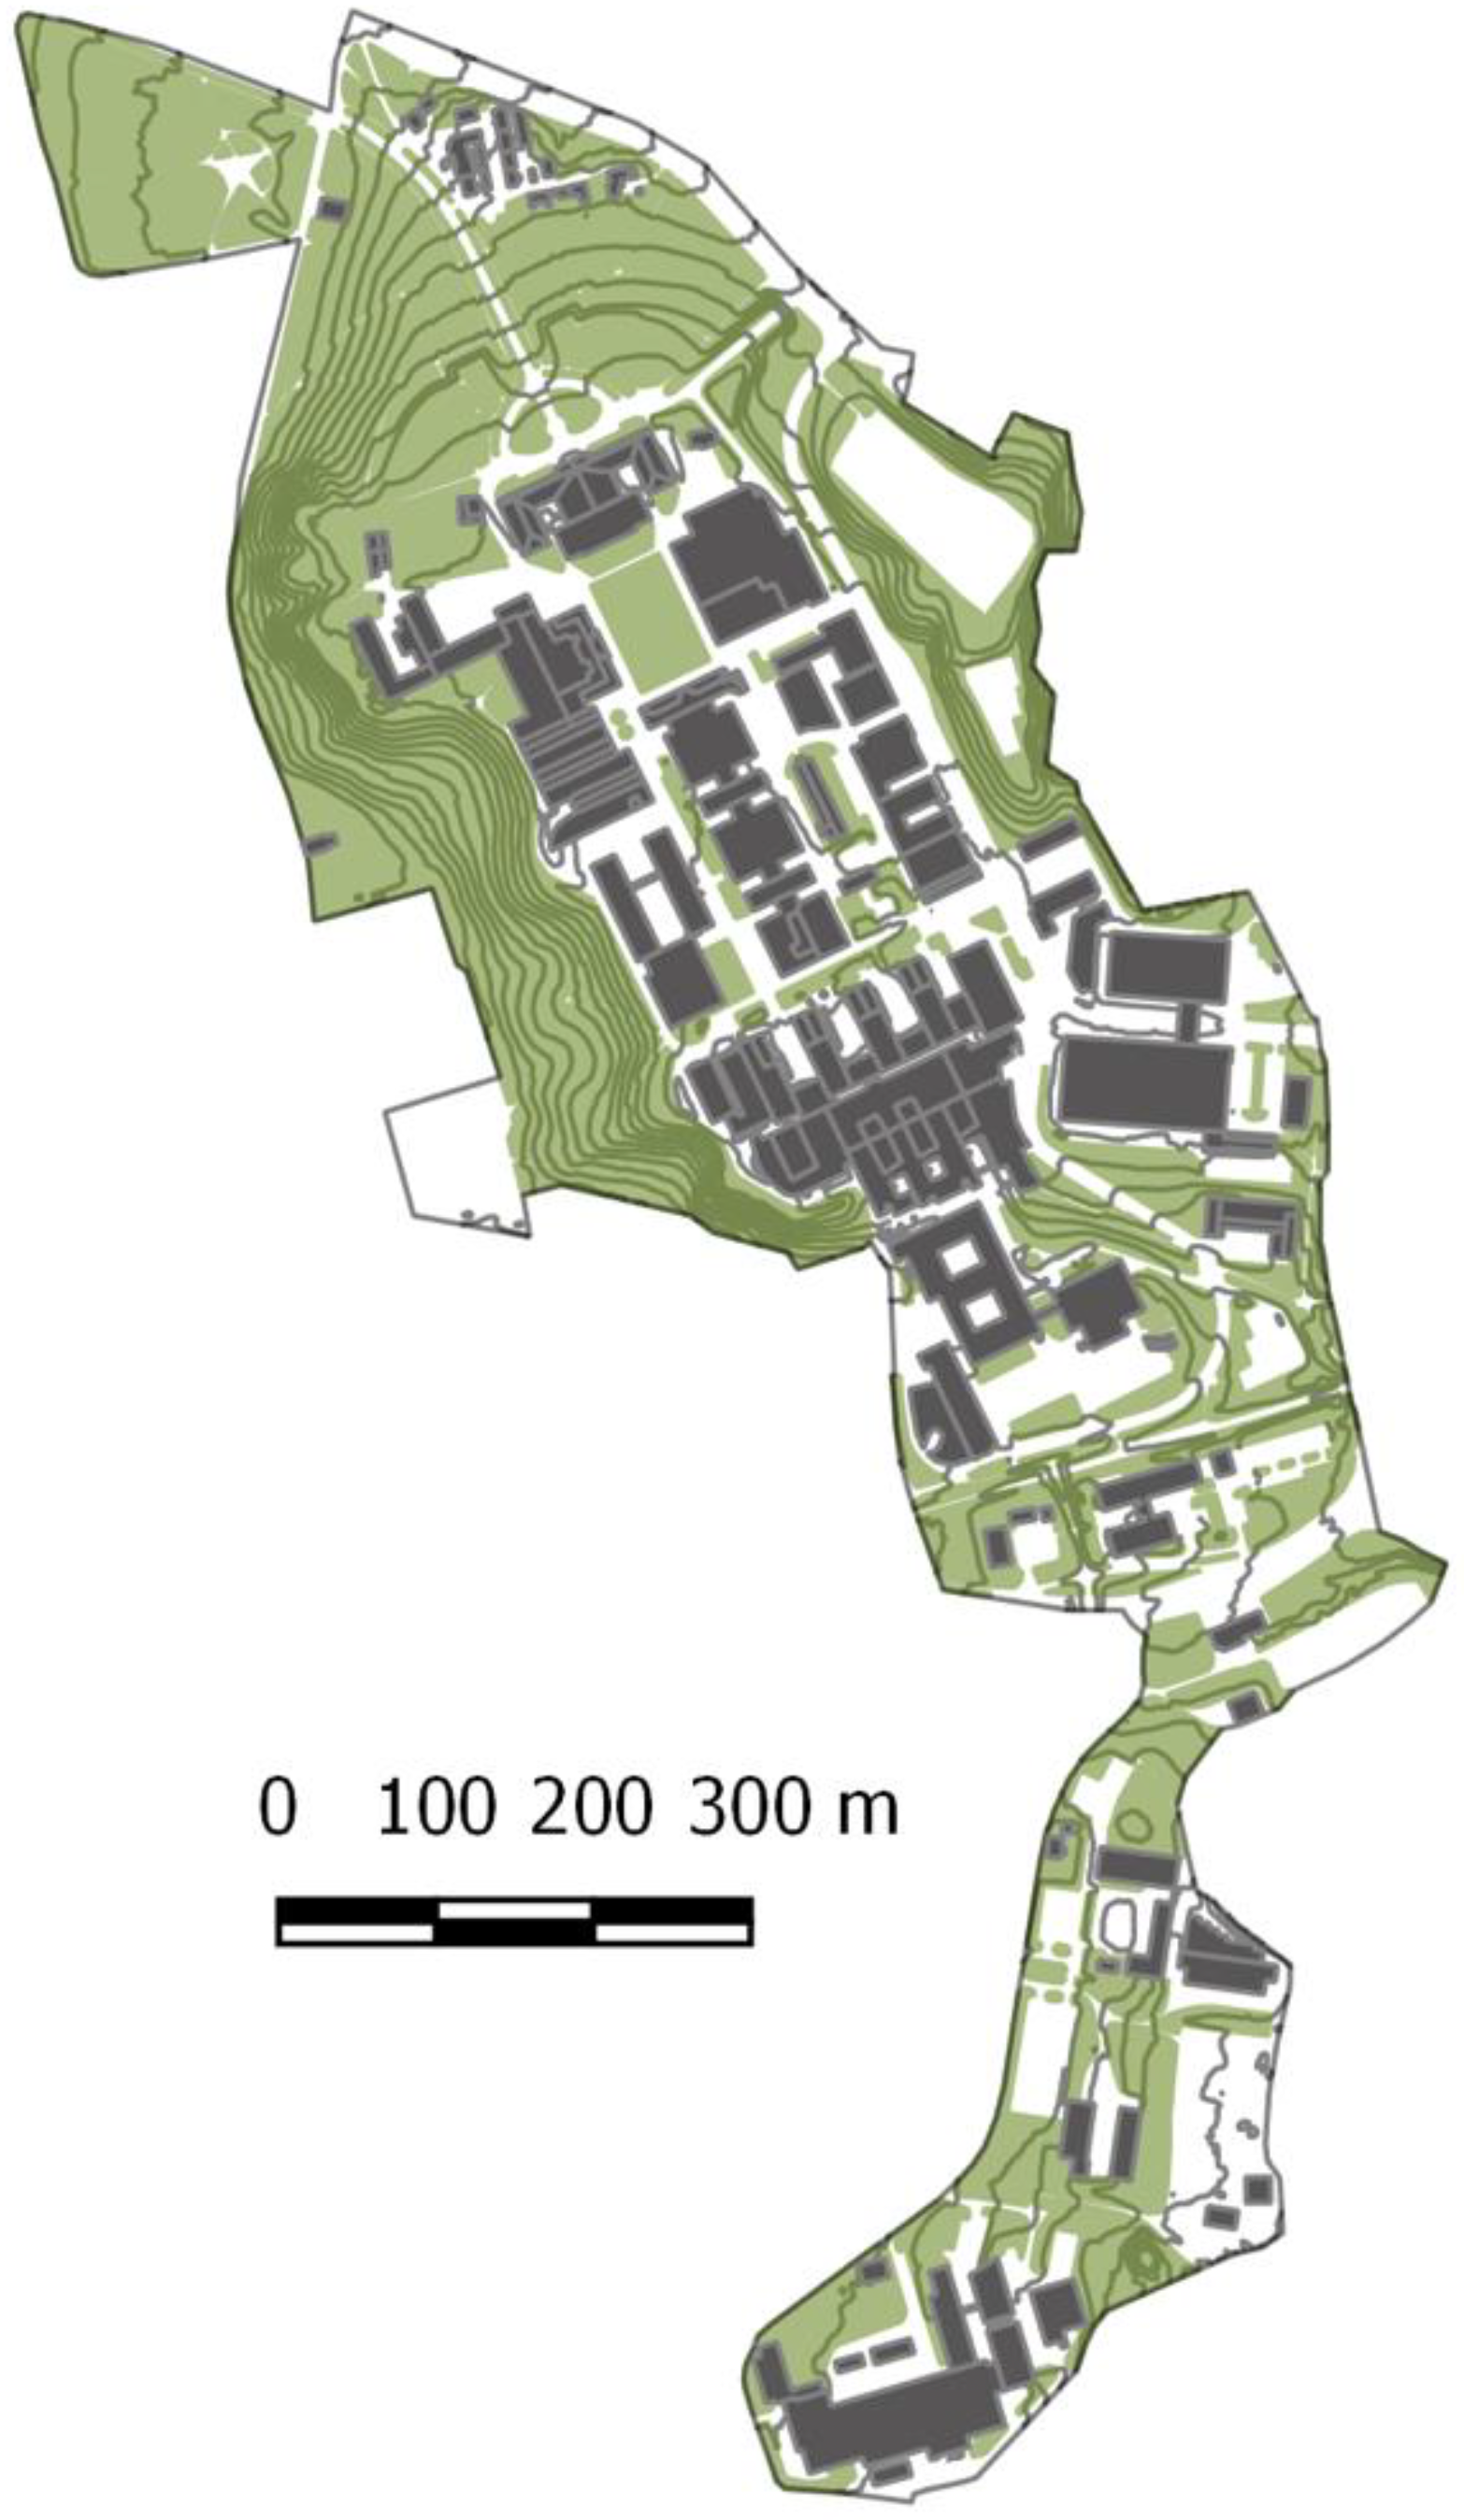
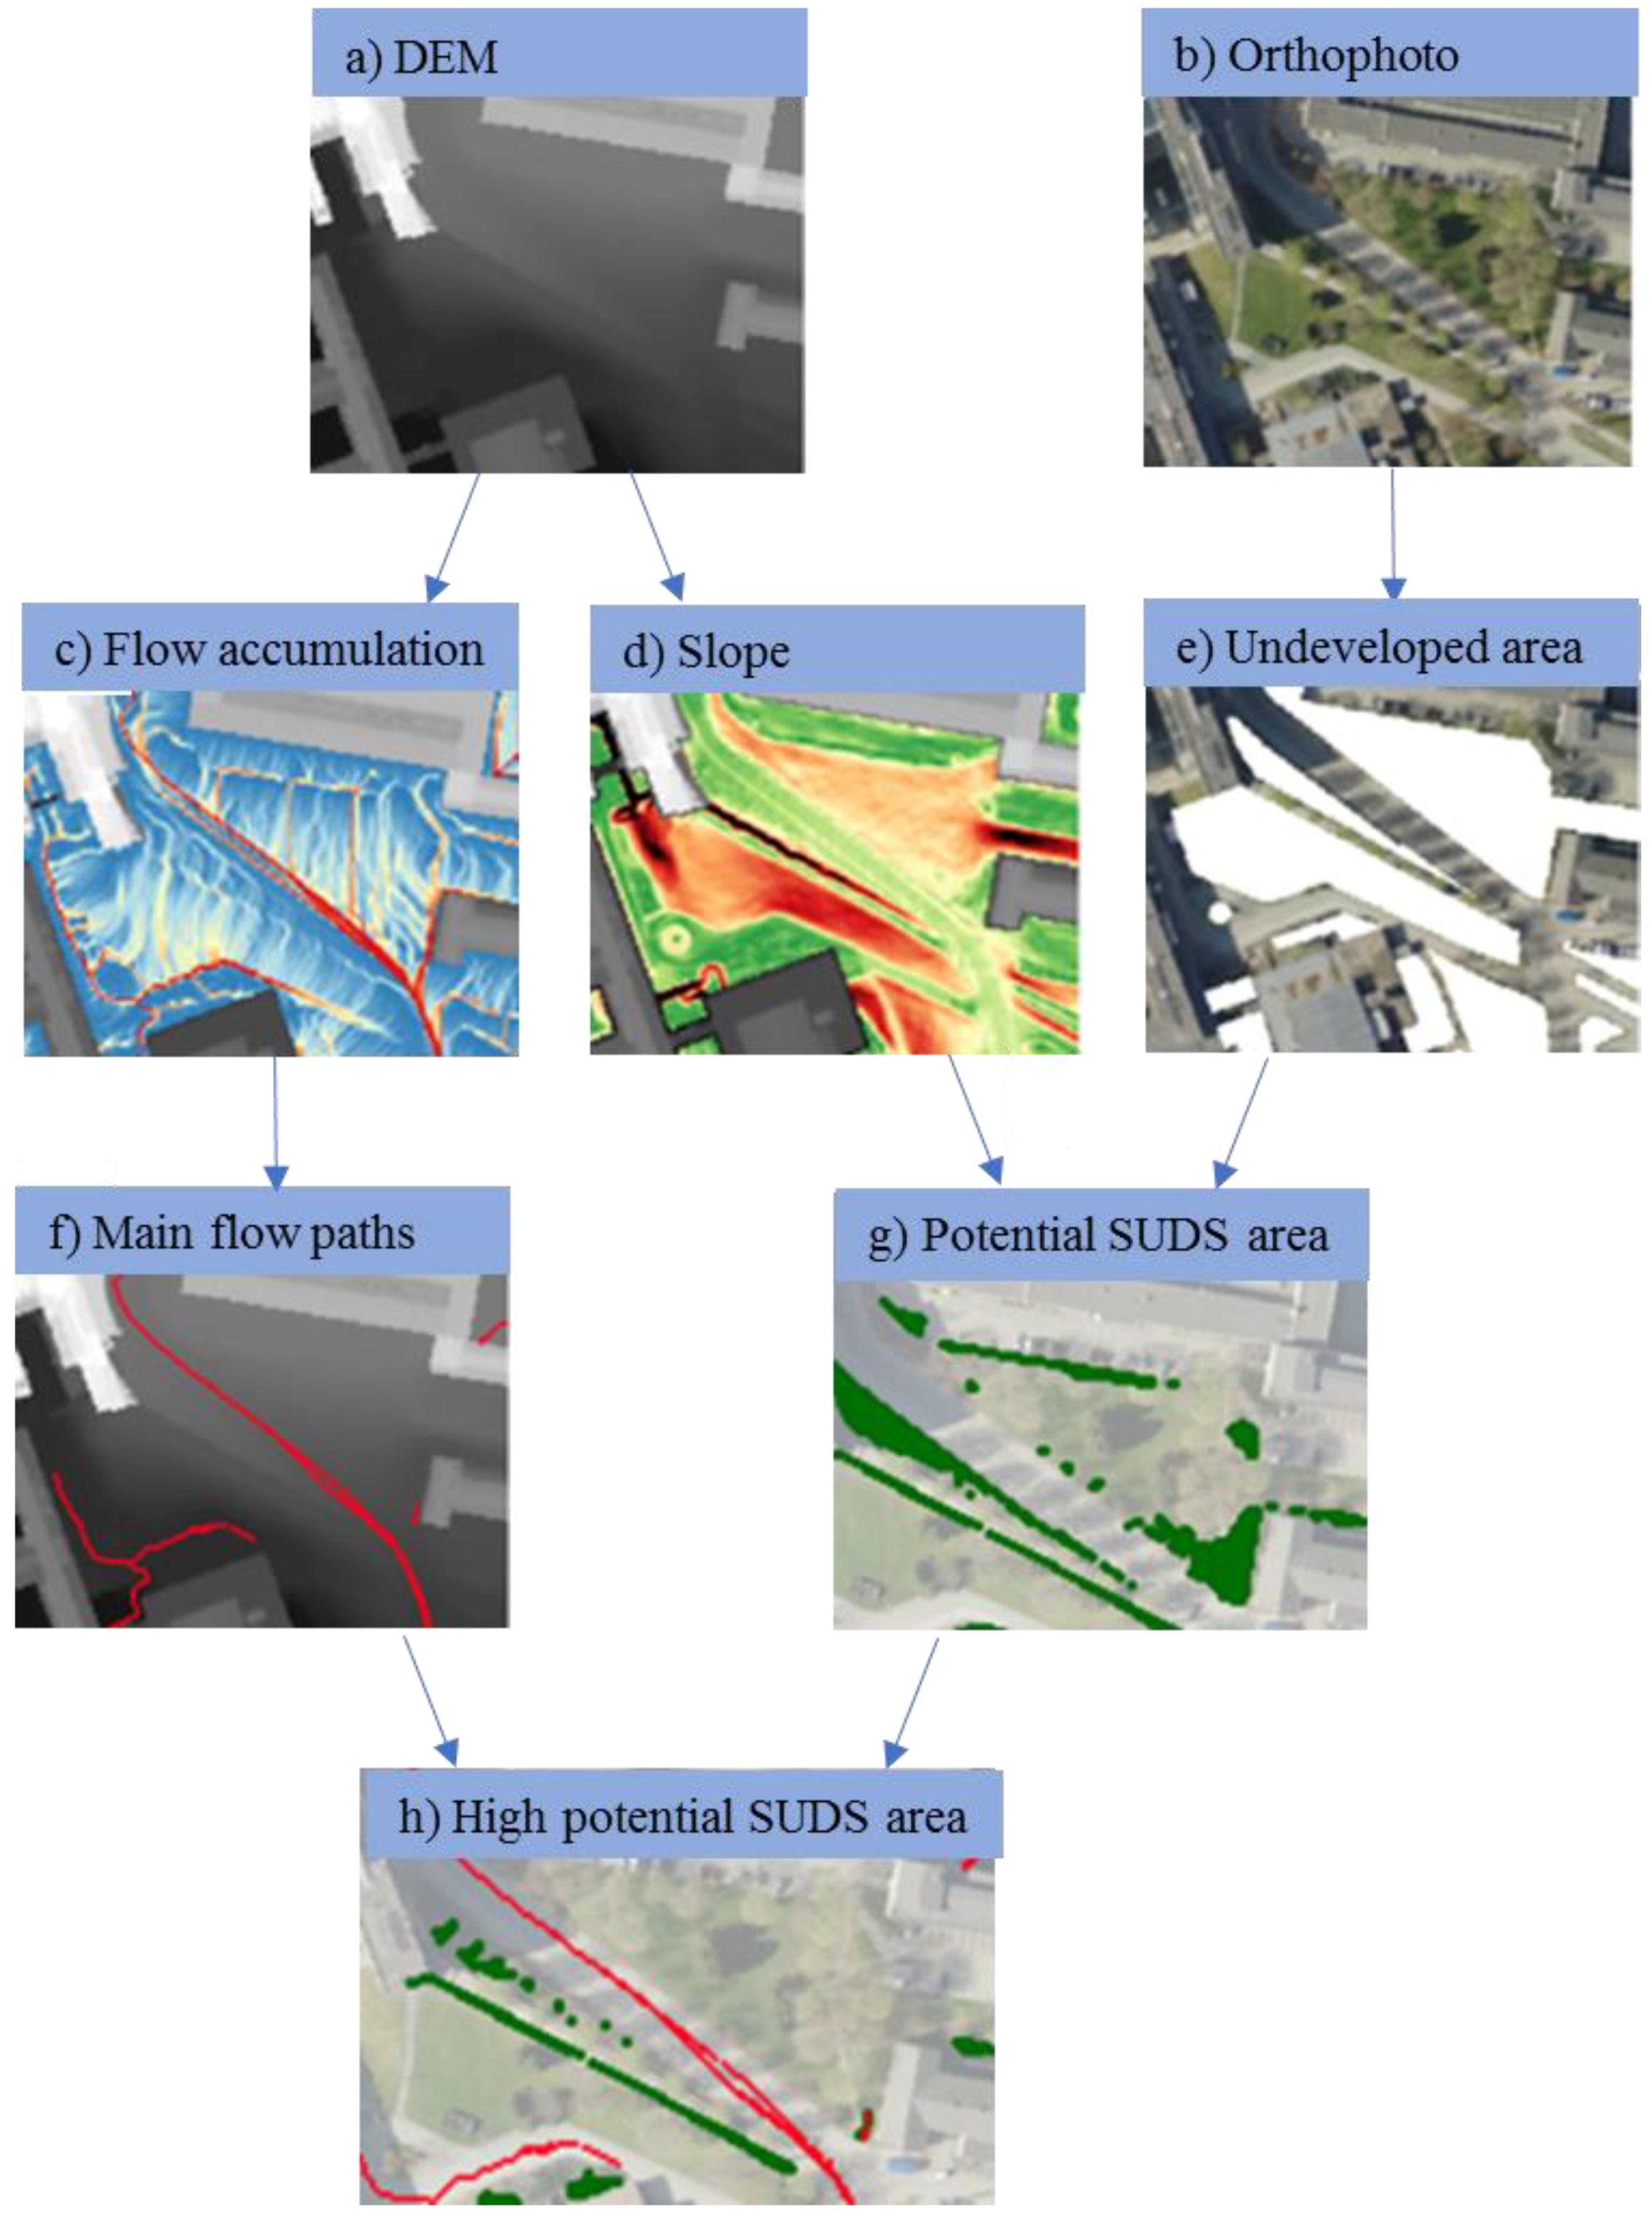
In this study, a method that couples field measurements of infiltration protentional with GIS analysis of the flow directions and accumulation into drainage lines is introduced as a case study at the NTNU campus in Trondheim, Norway. First, the method for the GIS analysis is described, followed by the field Modified Phillip Dunne (MPD) measurements and subsequent data analysis. Before the combined new method coupling the analysis of the two data sets is described.
The NTNU campus is a centrally located area at Gløshaugen and Lerkendal in the city of Trondheim, Norway. The campus area is more than 50 ha large in total. The area has a high degree of impervious surfaces, comprising buildings, parking lots, and roads. In total, the sealed surfaces make 58% of the total area, Figure 1. There are also large areas of park and undeveloped green space in the catchment. The surface slope changes from flat areas in the central core to hilly parts with up to 60% surface slope along the edges. The studied area has its highest point at the Gløshaugen plateau, from where the elevation decreases in all directions. Over the next decade, the campus building mass will be expanded to house several parts of the university that today is located across the city at other campuses. This will add up to 92,000 m2 of building mass in one or more clusters of buildings in parts of what is currently undeveloped areas. The Campus Development Project has a strong focus on development in line with the SDGs and preserving green spaces, which makes it relevant as a reference for green campus initiatives.

2.1. GIS Analysis

The GIS analysis is performed by the open source program QGIS® v. 2.18.13 with implementations from the open source program SAGA© GIS v. 2.3.2. The output of the GIS analysis are several maps, which show urban planners potential and high potential SUDS areas, as well as main flow paths for surface runoff. Complete reference guidelines, including files of the developed tools to perform the described GIS analysis, can be downloaded from www.klima2050.no.
The GIS process is illustrated in Figure 2. The input data are a digital elevation map (DEM) (Figure 2a) and orthophoto (Figure 2b). From the DEM, the flow accumulation (Figure 2c) and slope (Figure 2d) maps are calculated, whereas the undeveloped areas (Figure 2e) are extracted from the orthophoto. The flow accumulation is used to calculate the main flow paths (Figure 2f). The slope and the undeveloped areas combined will result in the potential SUDS areas (Figure 2g), and subsequently combing this result with the main flow paths will result in high potential SUDS areas (Figure 2h).
To ensure uninterrupted flow lines when calculating the main flow paths, local surface depressions in the DEM are filled, using a sink filling algorithm [11]. Flow accumulation shows for each cell in a DEM raster the number of cells that flow lines pass through that grid cell [12]. This means that the number of flowlines from the entire map that have segment endpoints within that cell will be shown for each DEM raster cell. The flow direction is calculated using the Rho8 algorithm [13] and the flow direction calculated for the steepest downslope neighbor. The Rho8 algorithm is well suited for steep topography [13], typically found in many Norwegian catchments, which is also the case for the case study presented here.
To identify the highest flow concentrations from the flow accumulation results, a threshold for the main flow paths was calculated. The root mean square flow accumulation is calculated according to Equation (1), while considering all flow accumulation values:
x R M S = 1 n ( x 1 2 +   x 2 2 + +   x n 2 )
where xn is the flow accumulation value in grid cell n and xRMS is the root mean square used as a flow accumulation threshold. Higher values are given increased weight by the RMS, due to the squaring of each value. This is necessary since there are many low values that are slightly larger than 1 (which is not of interest for the calculation) and only a few large values of interest for the calculation. All cells with a larger flow accumulation than the root mean square are defined as the main flow paths. These paths represent the connection of many flow paths, meaning that the majority surface runoff will follow these paths.
Furthermore, the potential SUDS areas were defined as undeveloped areas having a slope less than 10%, whereas high potential areas in addition should be located close to main flow paths and have an elevation that is equal to or lower than the nearby runoff areas. More details about the criteria for the potential SUDS areas and high potential SUDS areas are given in Section 2.4.

2.2. Field Measurements

Field infiltration measurements were conducted using the MPD Infiltrometer method [14,15]. This single ring infiltrometer test was performed using a 50 cm tall, 110 mm inner diameter acrylic tube. A measuring tape was attached to the tube in order to read off water levels as the water infiltrated into the under lying soils. The tube was placed five centimeters into the soil surface and filled with 40 cm of water (3.8 L). The water level was read off at 2 min intervals the first 30 min and then on a 5 min interval until all the water had infiltrated. The reading was done by reading off the height of water using the measuring tape glued on to the tube and a stop watch. Prior to the infiltration test, a soil sample of a minimum 1 L of soil was collected close to the location of the tube, this was used to measure initial soil moisture in the soil. After the infiltration test, a soil sample of minimum 1 L of soil was collected where the tube had been placed. This latter sample was used to measure the soil moisture after the infiltration test. In addition to the manual method described above, an automated MPD Infiltrometer (Upstream Technologies, New Brighton, USA) was used for some of the samples. The theory behind and the procedure is the same as for the fully manual method, however for the automated method the change in head is automatically recorded based in a water depth/pressure measurement. The infiltration rate is further automatically calculated for every 200 s using the same method, as described below.
All field samples were done with three replicates at each site location. The final Ksat was calculated as an average of the three measured values. The hydraulic conductivity is given by:
K = ρ · g μ k
where: K = hydraulic conductivity (m/s), k = permeability (m2), μ = dynamic viscosity (kg/m·s), ρ = density of water (kg/m3), and g = gravitational acceleration (m/s2). The manual field measurements were post processed using a MATLAB scrip to compensate for the horizontal flow direction of the water as it enters the soils [16].

2.3. Laboratory Analysis

The collected soil samples were used to determine the soil moisture content before and after the test and for particle size sieving. The samples were first weighed followed by oven drying at 105 °C for 24 h. Following the oven drying, the samples were weighed again. The difference in wet and dry weight gives the water weight of the sample, which can be used to calculated moisture content by mass using Equation (3):
θ = W w e t W d r y W w e t
where: θ is the soil moisture (%); Wwet and Wdry are the wet and dry weight of the soil sample, respectively, in grams.
The dried soil samples were then sieved in a AS200 sieving machine with the following fractions; 4 mm, 2 mm, 1 mm, 500 µm, 250 µm, 125 µm, 63 µm, and 45 µm. This produced soil classifications curves for each sample. A minimum of 350 g dried soil was used for the sieving.

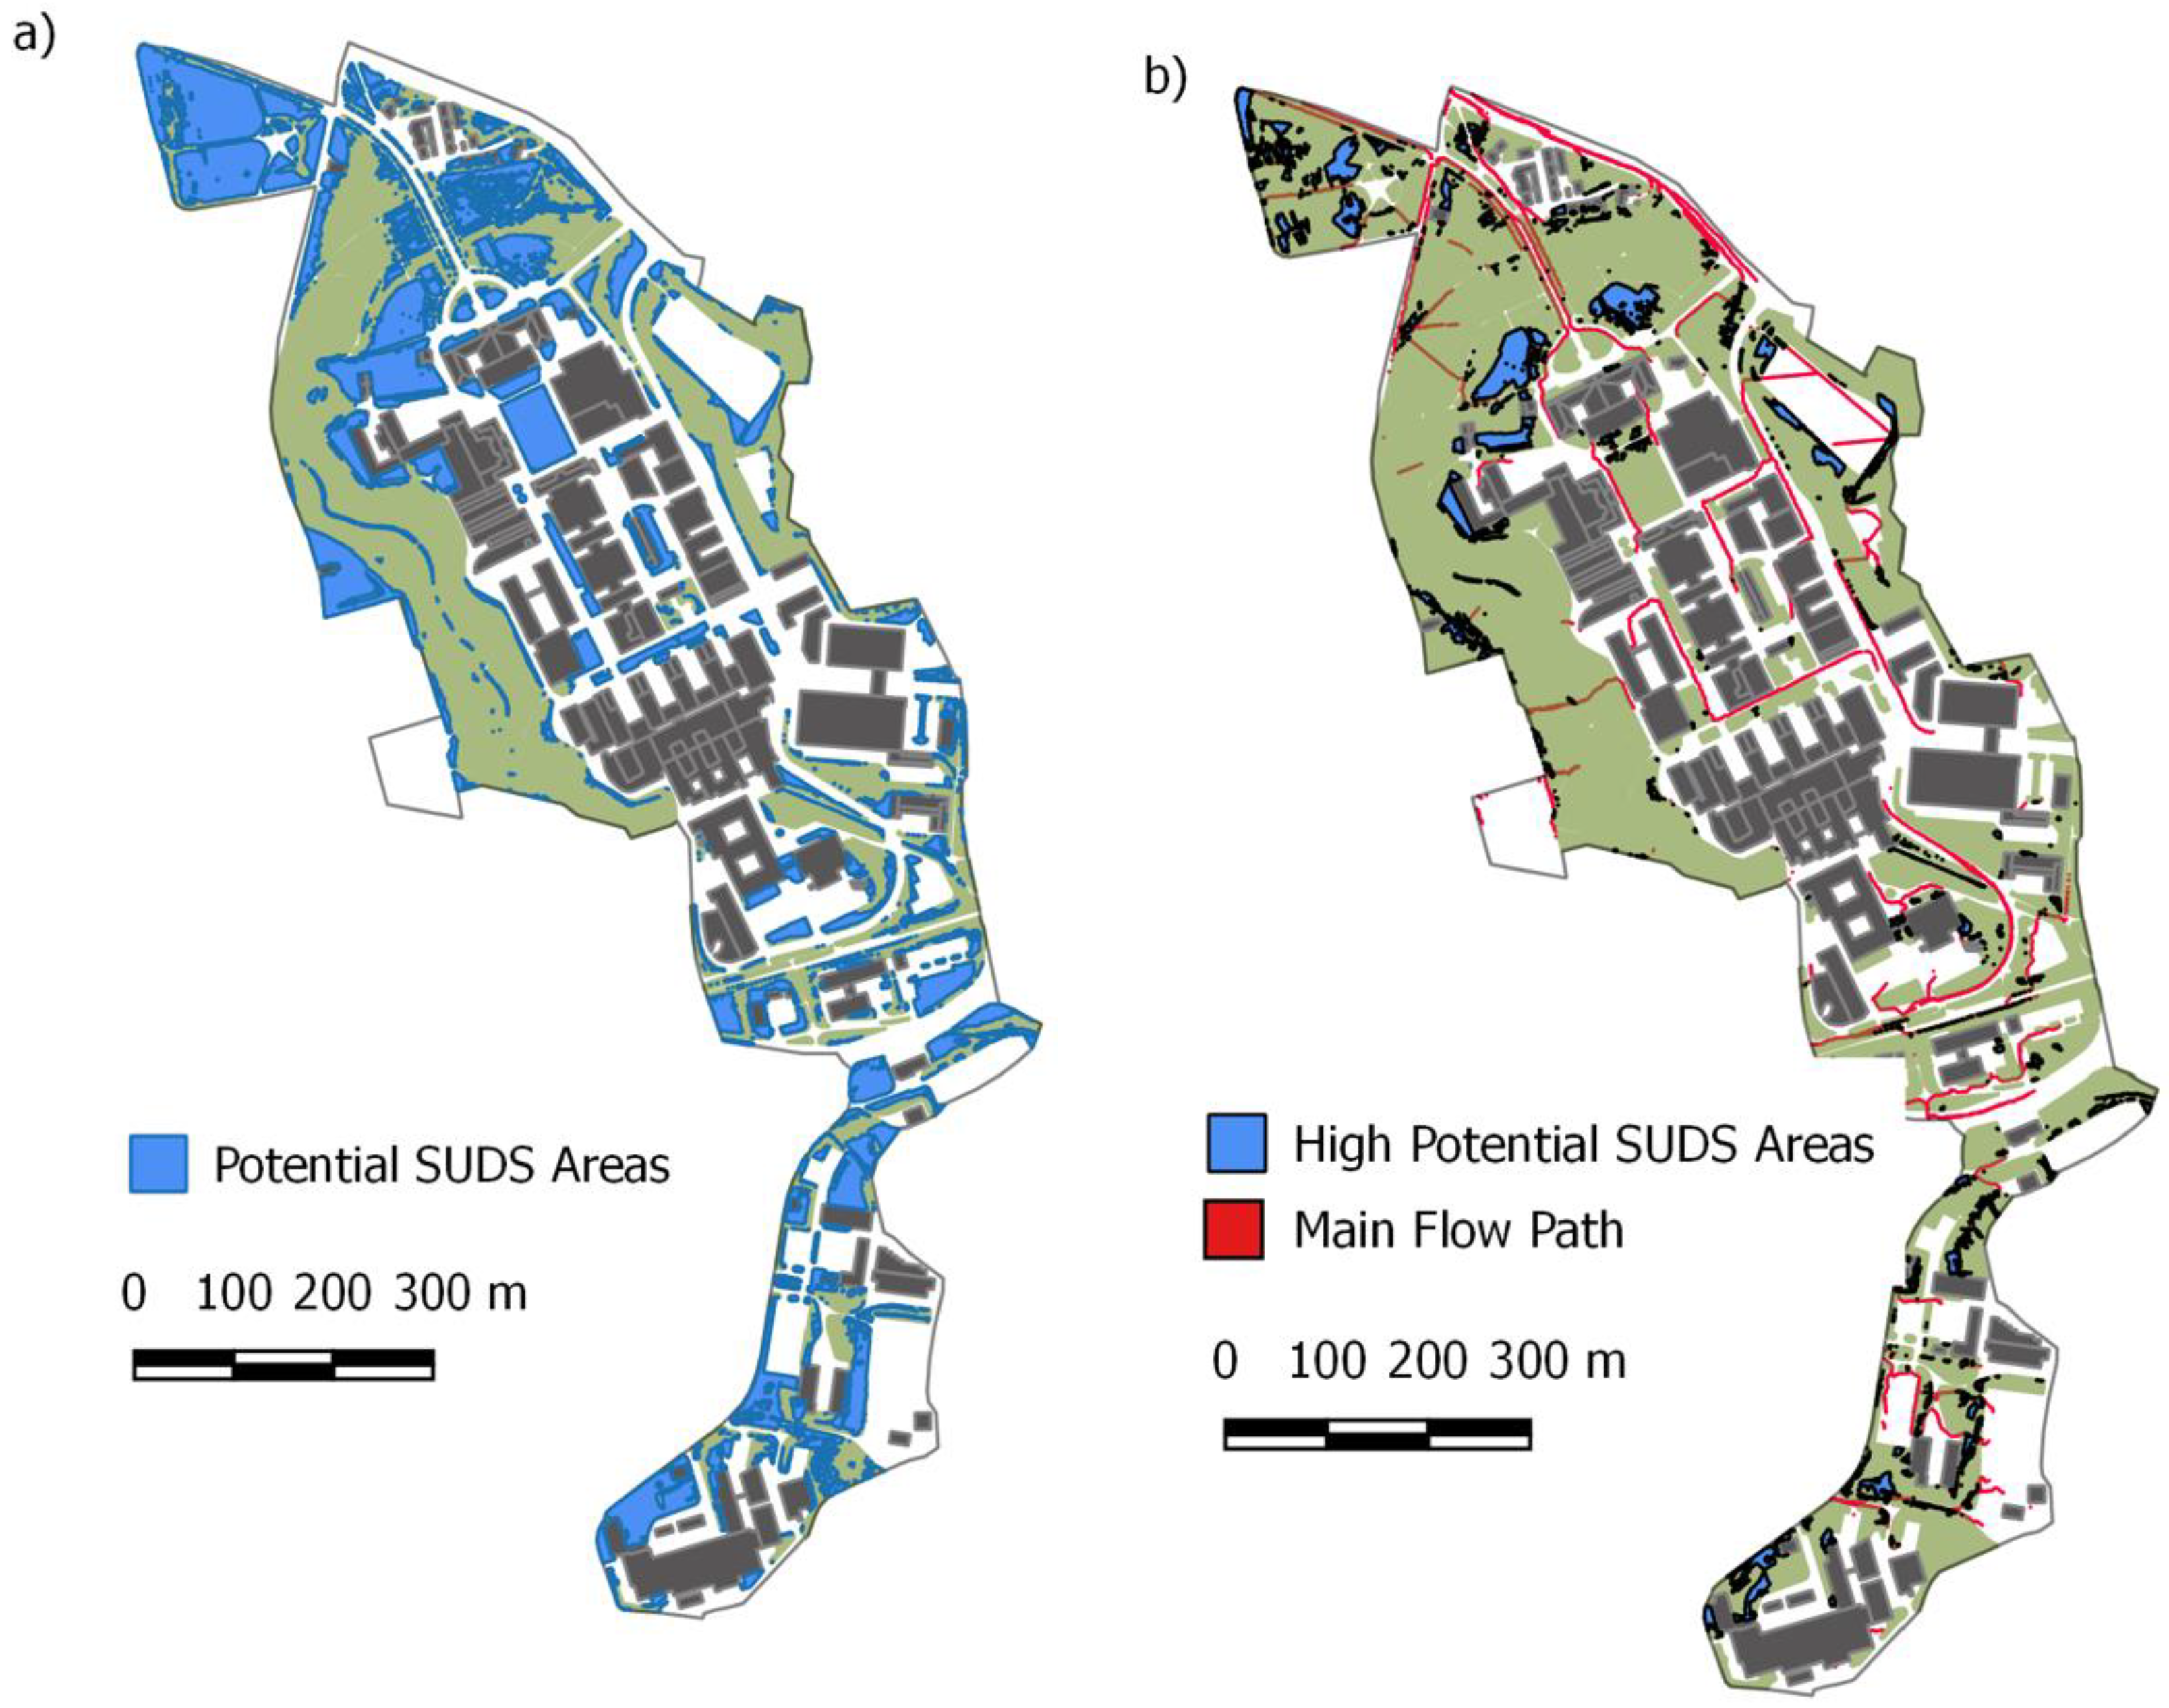
2.4. Potential SUDS Area Detection

Potential SUDS areas were identified based on the following criteria; first, by locating SUDS to areas where the flow path naturally accumulates water it minimizes the regrading needed to collect the surface runoff. This provides the opportunity to treat stormwater effectively using infiltration based SUDS with minimal regrading of the terrain. Secondly, priority was given to areas with an elevation of the potential SUDS areas equal or lower than the nearby runoff areas, enabling natural drainage and avoiding costly modification of nearby terrain. Areas fulfilling these two criteria were identified as high potential SUDS areas, as natural areas where water concentrated in the flow path and has available space for SUDS implementation at a favorable elevation, resulting in areas highly recommended for SUDS implementation.
Two main criteria for SUDS placement were identified; first, the location in connection to flow path of area to maximize the potential efficiency of the system; second, the infiltration capacity in the native soils, which determines the sites’ suitability for infiltration based SUDS and to the extent possible using the on-site soil. The infiltration potential from the field measurement was made into an infiltration potential map using the point measurements from the field measurements to make a Thiessen polygons [17], where the areas closest in proximity to each point measurement were classified with the infiltration of the point measurement.
The GIS analysis of flow accumulation creating runoff paths was coupled with landuse data and field measurements to determine potential SUDS placements using the following algorithm. Overlaying the surface runoff flow path, the point field observation map identifies the surface runoff paths with the highest infiltration rates, which gives the largest potential for SUDS implementation. The second step overlays the landuse map to identify which of the highest potential infiltration areas are available for use. This can either be based on property ownership or by undeveloped area. Undeveloped area in this case could be unused green areas, inactive courtyards, or storage areas. Also, areas like parking lots, where a reduction of the pervious area is planned, could be “undeveloped” in the broad sense of this method.

2.5. SUDS Selection and Design Storms

Norway has adopted a three-step approach to stormwater management, where SUDS are classified into three categories. Step 1 is infiltration based SUDS intended to infiltrate all small events, typically events with less than 1–2 year return period. Step 2 is based on the detention of all medium events and subsequent infiltration and slow release downstream. While, the third step is focused on safe floodways for all large and extreme events [10]. The definition of the size of the storm events is left to local authorities to decide. This case study used a requirement that SUDS in step 1 and 2 should handle 90% of the annual volume, i.e., by using daily observed rainfall data the daily depth of rainfall that will only be exceeded 10% of the time. Using data from 2013–2017 from the nearby Risvollan station (data available for download at www.eklima.no) it was determined that on a daily basis the SUDS would have to handle 19.3 mm of precipitation in order to manage 90% of the annual volume. In other words, a design specification of 19.3 mm for the specific SUDS, like a bioretention area or a combination of SUDS, like green roofs coupled with bioretention areas, would infiltrate 90% of the annual precipitation, and only 10% would become overflow from the system. The calculation uses a daily timestep, meaning that if the 19.3 mm came in a shorter duration event, the infiltration capacity would be reached faster. Trondheim is a wet coast area with frequent but typically low intensity events, which makes this assumption reasonable.
The design of the bioretention cells was sized using Darcy’s law [4]. The design recommendation for raingardens in Norway is given as 10 cm/h [18,19], which is significantly higher than the commonly recommended 3 cm/h in more temperate climates. This is due to the need to maintain a sufficient infiltration capacity also in the winter months with partly frozen soils.
A = A d r a i n × C × P × d f k × t f × ( h f + d f )
where: A (m2) equals the needed surface area of the bioretention area, Adrain equals the total drainage area draining into the bioretention area (m2), C is the rational formula runoff coefficient, P is the precipitation (m), tf is the time to drain (h), hf is the average height of water above the filter bed (m), df is the depth of the filter media (m), and k is the saturated hydraulic conductivity (m/h). The second group of SUDS chosen in this study was green roofs. Green roofs have an array of positive benefits; including a positive effect on stormwater detention and retention metrics, serves to protect roof membranes for UV exposure, reduce temperature fluctuations in the roof, and reduce energy consumptions, especially in warmer climates [20,21,22,23,24,25]. The performance of green roofs can be divided into detention and retention performance. Detention performance is an event based metrics, while the retention performance is a longer term performance metric that is dependent on the evapotranspiration function of the roof [19,25,26]. In this study, green roofs were used to show case the potential performance enhancing effect of the overall SUDS system performance on an annual basis, when green roofs and bioretention areas are coupled. This leads to a focus on the retention performance of the green roofs. The retention performance was based on the retention performance from studies by Johannessen et al. [19], where Trondheim was one of the field measurement locations.

3. Results

3.1. Drainage Lines

The estimated drainage lines on campus are shown in Figure 3 and clearly show the hill shaped area. The main drainage lines are away from the central high point down relatively steep slopes to the lower laying areas around the outer edges of the case studies. The landuse in the area (cf. Figure 1) has most of the impervious surface areas located on the higher plateau of the case study areas.

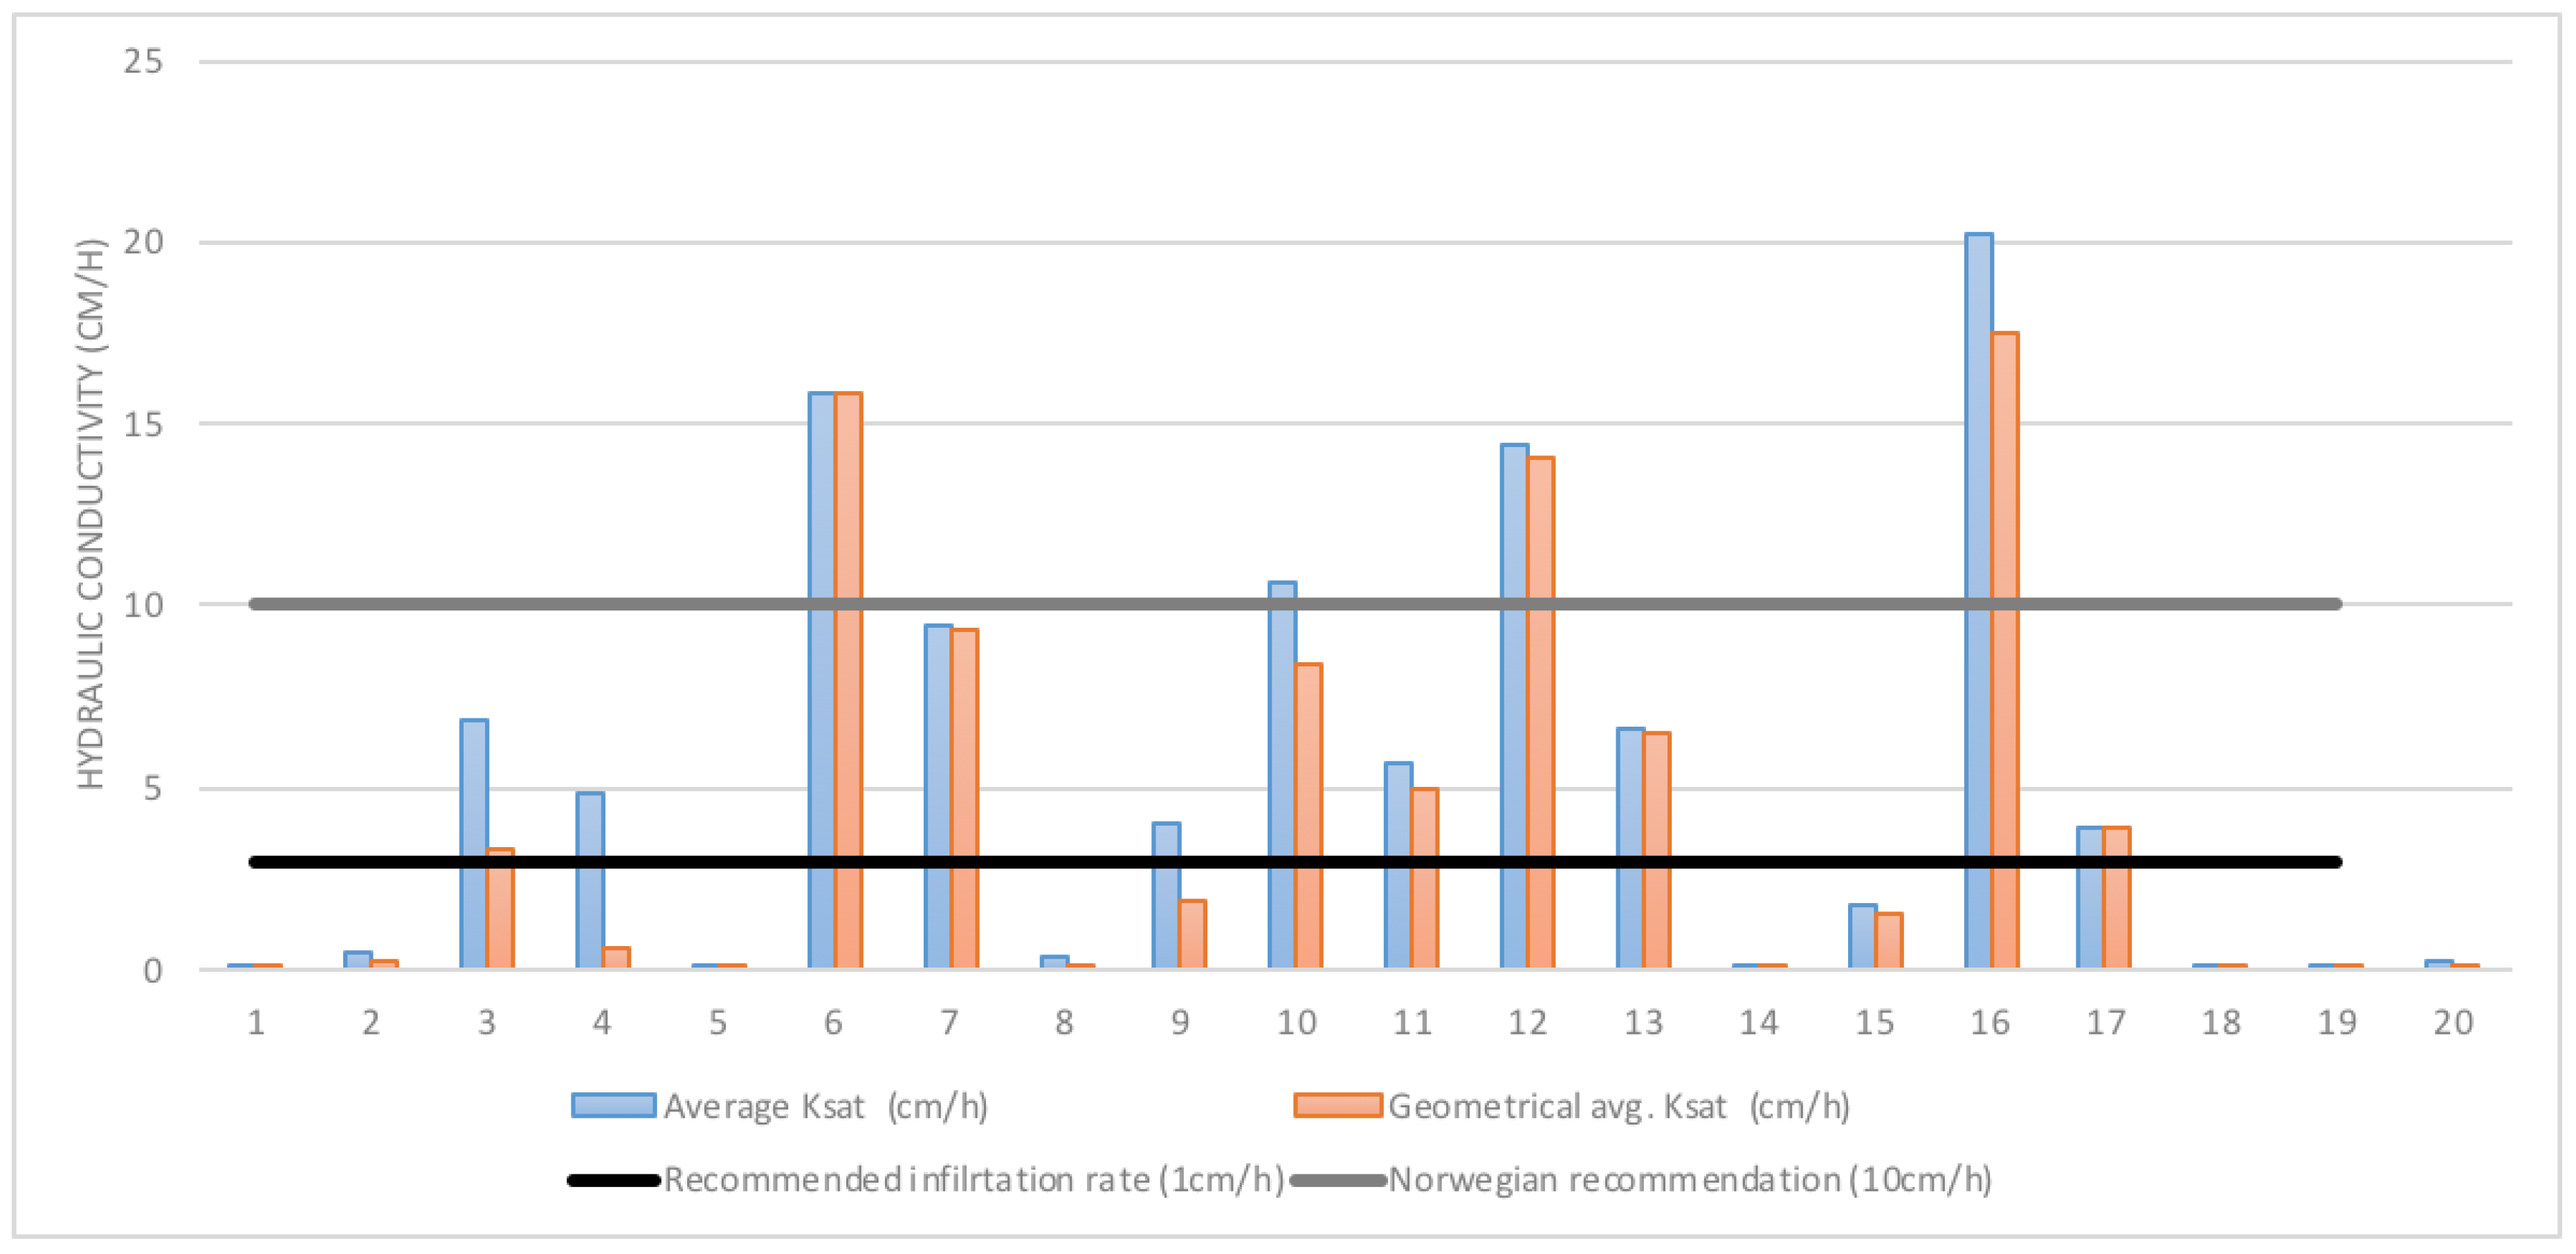
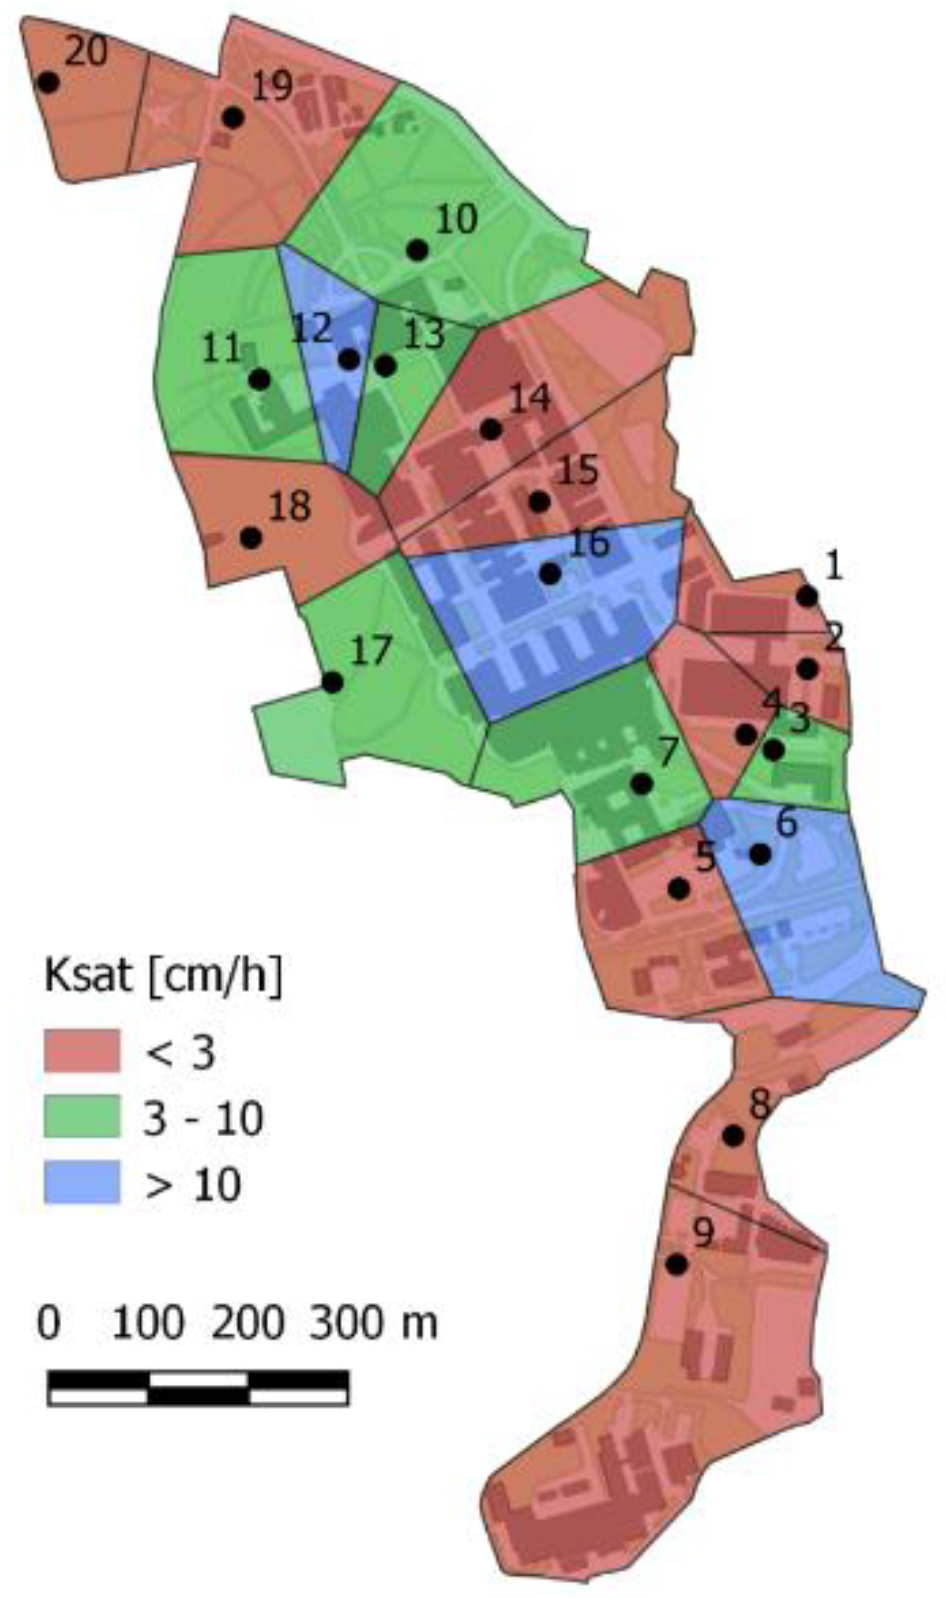
3.2. Field Infiltration Measurements

The infiltration capacity has been measured at a total of 20 sample sites, with three replicas at each site. The case study area is an area where there have been several construction stages, making it a typical urban area. From the sieving analysis of the soil samples, all samples were found to have a high sand content; in the range of 46–80% of the particles were in the sand particle range (0.05–2 mm), the complete sieving analysis results are attached in the supplementary information (Table S1). The predominant soil types were found to be sandy loams and loamy sands according to the soil texture triangle. Ksat values ranged from less than 1 cm/h to over 20 cm/h (Figure 4). When comparing the simple mean to the geometric mean, it can be seen than while most of the replica were similar, some sampling points, like sampling point number 4, shows a larger variation between the replicas, resulting in a larger difference between the simple mean and the geometric mean. This indicates that additional measurement should be undertaken prior to SUDS placement decisions. The spatial distribution of the Ksat values indicated generally higher infiltration capacities in the central areas than in the north and south ends of the case study area (Figure 5).

3.3. SUDS Implementation Potential

Looking at the existing development of the campus case study area, the pervious area makes up 44% of the total area. This is area that is currently available for SUDS implementation. Choosing three different strategies for the implementation of SUDS in this case demonstrates the importance of coupling field measurements with GIS based analysis.

3.3.1. GIS Data Driven Approach

Using GIS-based analysis, it was found that the green area of the campus represents 44% of the total study area. Further, eliminating areas with slopes exceeding 10% reduced the potential infiltration area to 36% of the green area (or 16% of the total case study area) (cf. Figure 6a). The flow accumulation was also considered in the analysis, identifying the potential infiltration areas that are located at the end of the drainage lines for the case study areas. This left 20% of the potential infiltration area (or 3.2% of the total case study area) (cf. Figure 6b). The location of these 3.2% of the case study area are found in drainage areas 6, 8, 9, 10, 11, 12, 13, 20, and the lower parts of area 14 and 18 (cf. Figure 5).

3.3.2. Field Measurement Based Approach

Using the field measurement results and the recommendation of 10 cm/h infiltration rates in bioretention areas in cold climates given by Paus et al. [18], the best suited areas that are based on infiltration rates can be identified. This yields five drainage areas; 6, 7, 10, 12, and 16 (cf. Figure 5). The total area draining into these areas include 176,327 m2 from the areas around.

3.3.3. Combined GIS Analysis and Field Measurement Approach

If we couple the results from the GIS analysis with the field measurement approach, the best fitted area for SUDS given both drainage lines and infiltration potential can be identified. This can further be used to estimate the volume that can be managed in the SUDS based on a requirement of, for example, 90% of the annual volume, or a specific return period volume. The best fitted areas by overlaying the two approaches are the areas identified in drainage area 10, 12, and 6. The south end of the case study area, drainage area 8, 9 though identified through the GIS analysis as well suited for SUDS, show poor infiltration capacity, well below the recommended minimum 3 cm/h rate. The same is true for the north west end of the case study area, area 20. Area 10 and 12 are part of the green area in front of the existing main building on campus. The buildings around these areas have high historic value limiting the options for exterior retrofitting of downspouts. However, there are also 22 544 m2 of roads and parking spaces. The runoff from these areas can with minor retrofitting be drained into SUDS, like bioretention cells in area 12 and 10. In area 6, there are several existing buildings with flat roofs; however, though the buildings are not of historic value the potential for retrofitting by disconnecting the roof drains is limited. The cold climate in the case study areas means that all flat roofed buildings have interior roof drains, and leading water over the parapet is generally avoided due to freezing problems (Norwegian National Building code, Tek17, www.dibk.no). However, retrofitting with green roofs could be a good option here. This will also reduce the area needed for bioretention to 13.3 mm given the 6 mm retention in the green roofs.
Looking at the required areas for SUDS for the case study area using bioretention areas as an example and using the design equation that is based on Darcy’s Equation (4), it is possible to evaluate the total area needed for bioretention if the whole case study area was retrofitted with bioretention areas to manage all runoff from the impervious surfaces (Table 1). The importance of these results is the large variation in the required area as a result of the Ksat values from the various field measurements. This shows the potential in improving SUDS performance by localizing the best placements early in the planning and design process. Significant reduction in required area and cost savings could be achieved by this method.

4. Discussion

The two first methods applied to analyze the placement of SUDS; the GIS analysis, and the field measurements approach gave different results, which is not necessarily surprising. Applying a combination of both methods, a partial overlapping area can be identified as the third method. Demonstrated through the case study, it can be seen that the third method yields a result that is superior to either of the two by identifying the areas where criteria from both the GIS analysis and the field measurements are met. Following strictly the GIS analysis of drainage lines and slopes less than 10% yields predominantly areas at the bottom of the steep hills that drop down from the center plateau of the study areas. Though this would serve to collect the maximum amount of runoff in an efficient manner, the high runoff volumes that are generated from the impervious areas on the plateau that would be transported down these steep hills would yield high flow velocities, which could lead to erosion problems. In addition, when the field measurement results are added, it can be seen that the areas at the bottom of the hills; areas 19, 20, 8, and 9 are also the areas with the poorest infiltration rates, where infiltration based SUDS are not recommended without replacing the in-situ soils. Infiltrating more of the runoff directly on the plateau where the infiltration rates are higher would decrease the runoff volumes down the steep hills.
The variation in infiltration rates are typical for urban areas, and they are largely due to soil compaction, as shown in several previous studies, among others [27]. This variation demonstrated the need for a combined GIS and field measurement approach for SUDS placement. The NTNU campus will add a significant number of buildings to the case study area over the next decade. Applying the demonstrated combined method of an in-depth GIS analyses coupled with the field measurements approach can optimize the locations of building with respect to stormwater management early in the planning process. This will ensure a sustainable stormwater management with SUDS placed at locations with favorable performance.

5. Conclusions

This case study investigated how coupling GIS analysis that is based on standard landuse maps and DEMs with targeted field measurements of infiltration potentials can significantly increase the capacity of SUDS to manage stormwater. The method that is proposed by coupling drainage line analysis with field infiltration measurements demonstrated how the area that is required for SUDS could be significantly reduced by considering the infiltration potential in addition to the GIS analysis.
The field measurement from the case study area of 50 ha can vary greatly from practically zero infiltration to relatively high rates. When comparing the Ksat values with the soil physical analysis, it was shown that physical characteristics is not a good indication of infiltration potential in urban soils with a large degree of compactions.
The site specific placement was shown to have a large impact on the area required for SUDS and the potential for using local in situ soils. The area requirement for handling 90% of the annual rainfall volume (19.3 mm) was up to 70% between two neighboring drainage areas (10 and 12). This is important, as it has cost implications, as for development cases there is always a pressure to minimize area required for SUDS implementation. There is also a cost incentive to use in-situ soil to the greatest extent possible, where the local infiltration potential become an important parameter. However amending the in-situ soil with small amounts of sand of compost or digging it up and disaggregate it to make it less compacted will also go a long way, especially in the case study that is presented here where the sand content was high.

Supplementary Materials

The following are available online at https://www.mdpi.com/2071-1050/10/12/4683/s1, Table S1: Soil sieving analysis of the sampling sites.

Author Contributions

Conceptualization, T.M.M. and E.S.; Formal analysis, T.M.M., E.S., D.K. and L.J.; Funding acquisition, T.M.M. and E.S.; Investigation, D.K. and L.J.; Methodology, T.M.M., E.S. and D.K.; Supervision, T.M.M. and E.S.; Writing—original draft, T.M.M. and E.S.; Writing—review & editing, T.M.M. and E.S.

Funding

This research was funded by Klima 2050 through the Norwegian Research Council SFI grant program (grant number 237859/030), and the Norwegian Research Council funded project DRENSSTEN (contract # NFR 269526).

Acknowledgments

This study was initiated and supported by Klima 2050 and DRENSSTEN with the aim to reduce the societal risk caused by stormwater floods associated with climate change.

Conflicts of Interest

The authors declare no conflict of interest. The funders had no role in the design of the study; in the collection, analyses, or interpretation of data; in the writing of the manuscript, or in the decision to publish the results.

References

  1. McWhorter, D.B.; Sunada, D.K. Ground-Water Hydrology and Hydraulics; Water Resources Publications: Fort Collins, CO, USA, 1977. [Google Scholar]
  2. Gregory, J.H.; Dukes, M.D.; Jones, P.H.; Miller, G.L. Effect of urban soil compaction on infiltration rate. J. Soil Water Conserv. 2006, 61, 117–124. [Google Scholar]
  3. Pitt, R.; Chen, S.E.; Clark, S.E.; Swenson, J.; Ong, C.K. Compaction’s impacts on urban storm-water infiltration. J. Irrig. Drain. Eng. 2008, 134, 652–658. [Google Scholar] [CrossRef]
  4. Wang, Q.; Zhang, Q.H.; Wu, Y.; Wang, X.C.C. Physicochemical conditions and properties of particles in urban runoff and rivers: Implications for runoff pollution. Chemosphere 2017, 173, 318–325. [Google Scholar] [CrossRef] [PubMed]
  5. Morel, J.L.; Schwartz, C.; Florentin, L.; de Kimpe, C. Urban Soils. In Reference Module in Earth Systems and Environmental Sciences; Elsevier: Amsterdam, The Netherlands, 2005; pp. 202–208. [Google Scholar]
  6. Moore, S.L.; Stovin, V.R.; Wall, M.; Ashley, R.M. A GIS-based methodology for selecting stormwater disconnection opportunities. Water Sci. Technol. 2012, 66, 275–283. [Google Scholar] [CrossRef] [PubMed]
  7. Jato-Espino, D.; Sillanpaa, N.; Charlesworth, S.M.; Andres-Domenech, I. Coupling GIS with Stormwater Modelling for the Location Prioritization and Hydrological Simulation of Permeable Pavements in Urban Catchments. Water 2016, 8, 451. [Google Scholar] [CrossRef]
  8. Liu, C.L.; Li, Y. Measuring eco-roof mitigation on flash floods via GIS simulation. Built Environ. Proj. Asset Manag. 2016, 6, 415–427. [Google Scholar] [CrossRef]
  9. Liu, C.L.; Li, Y.; Li, J. Geographic information system-based assessment of mitigating flash-flood disaster from green roof systems. Comput. Environ. Urban Syst. 2017, 64, 321–331. [Google Scholar] [CrossRef]
  10. Lindholm, O. Veiledning i Klimatilpasset Overvannshåndtering; Norsk Vann BA: Hamar, Norway, 2008. [Google Scholar]
  11. Wang, L.; Liu, H. An efficient method for identifying and filling surface depressions in digital elevation models for hydrologic analysis and modelling. Int. J. Geogr. Inf. Sci. 2006, 20, 193–213. [Google Scholar] [CrossRef]
  12. López-Vicente, M.; Pérez-Bielsa, C.; López-Montero, T.; Lambán, L.J.; Navas, A. Runoff simulation with eight different flow accumulation algorithms: Recommendations using a spatially distributed and open-source model. Environ. Model. Softw. 2014, 62, 11–21. [Google Scholar] [CrossRef] [Green Version]
  13. Fairfield, J.; Laymarie, P. Drainage networks from grid digital elevation models. Water Resour. Res. 1991, 27, 709–717. [Google Scholar] [CrossRef]
  14. Ahmed, F.; Nestingen, R.; Nieber, J.L.; Gulliver, J.S.; Hozalski, R.M. A Modified Philip-Dunne Infiltrometer for Measuring the Field-Saturated Hydraulic Conductivity of Surface Soil. Vadose Zone J. 2014, 13, 10. [Google Scholar] [CrossRef]
  15. Nestingen, R.; Asleson, B.C.; Gulliver, J.S.; Hozalski, R.M.; Nieber, J.L. Laboratory Comparison of Field Infiltrometers. J. Sustain. Water Built Environ. 2018, 4, 04018005. [Google Scholar] [CrossRef]
  16. Paus, K.H. Toxic Metal Removal and Hydraulic Capacity in Bioretention Cells in Cold Climate Regions; Norwegian University of Science and Technology: Trondheim, Norway, 2015. [Google Scholar]
  17. Aurenhammer, F. Voronoi Diagrams—A Survey of a Fundamental Geometric Data Structure. ACM Comput. Surv. 1991, 23, 345–405. [Google Scholar] [CrossRef]
  18. Paus, K.H.; Muthanna, T.M.; Braskerud, B.C. The hydrological performance of bioretention cells in regions with cold climates: Seasonal variation and implications for design. Hydrol. Res. 2016, 47, 291–304. [Google Scholar] [CrossRef]
  19. Johannessen, B.G.; Muthanna, T.M.; Braskerud, B.C. Detention and Retention Behavior of Four Extensive Green Roofs in Three Nordic Climate Zones. Water 2018, 10, 671. [Google Scholar] [CrossRef]
  20. Andenaes, E.; Kvande, T.; Muthanna, T.M.; Lohne, J. Performance of Blue-Green Roofs in Cold Climates: A Scoping Review. Buildings 2018, 8, 55. [Google Scholar] [CrossRef]
  21. Oberndorfer, E.; Lundholm, J.; Bass, B.; Coffman, R.R.; Doshi, H.; Dunnett, N.; Gaffin, S.; Kohler, M.; Liu, K.K.Y.; Rowe, B. Green roofs as urban ecosystems: Ecological structures, functions, and services. Bioscience 2007, 57, 823–833. [Google Scholar] [CrossRef]
  22. Teemusk, A.; Mander, U. Greenroof potential to reduce temperature fluctuations of a roof membrane: A case study from Estonia. Build. Environ. 2009, 44, 643–650. [Google Scholar] [CrossRef]
  23. Saadatian, O.; Sopian, K.; Salleh, E.; Lim, C.H.; Riffat, S.; Saadatian, E.; Toudeshki, A.; Sulaiman, M.Y. A review of energy aspects of green roofs. Renew. Sustain. Energy Rev. 2013, 23, 155–168. [Google Scholar] [CrossRef]
  24. Besir, A.B.; Cuce, E. Green roofs and facades: A comprehensive review. Renew. Sustain. Energy Rev. 2018, 82, 915–939. [Google Scholar] [CrossRef]
  25. De-Ville, S.; Menon, M.; Stovin, V. Temporal variations in the potential hydrological performance of extensive green roof systems. J. Hydrol. 2018, 558, 564–578. [Google Scholar] [CrossRef]
  26. De-Ville, S.; Menon, M.; Jia, X.D.; Stovin, V. A Longitudinal Microcosm Study on the Effects of Ageing on Potential Green Roof Hydrological Performance. Water 2018, 10, 784. [Google Scholar] [CrossRef]
  27. Becker, A.M.; Muthanna, T.M.; Braskerud, B.C. Trinn 1: Reduser overvannet i avløpsnettet ved å frakoble taknedløp. VANN 2016, 51, 359–369. [Google Scholar]
Figure 1. The Norwegian University of Science and Technology (NTNU) campus area at Gløshaugen and Lerkendal in Trondheim showing the contour lines with elevations in meters above mean sea level, undeveloped areas in green, roads and parking lots in white, and buildings in grey.
Sustainability 10 04683 g001
Figure 2. Illustrated geographical Information Systems (GIS) process, (a) input digital elevation model (DEM) (white = high to black = low), (b) input data orthophotos, (c) calculated flow accumulation (blue = low to red = high), (d) calculated slope (green = low to red = high), (e) determined undeveloped land (white), (f) selected main flow paths (red), (g) resulting potential sustainable urban drainage systems (SUDS) areas (green), (h) resulting high potential SUDS areas (green) next to main flow paths (red).
Sustainability 10 04683 g002
Figure 3. Flow accumulation map indicating drainage lines for the case study area, where the blue through white, yellow, and into red indicate increasing flow accumulations. Making the red lines the main drainage lines.
Sustainability 10 04683 g003
Figure 4. Distribution of saturated hydraulic conductivity (Ksat) over the 20 sampling sites. The simple average and the geometric mean are reported together with the typical international recommended rates of 3 cm/h, and the Norwegian recommendation of 10 cm/h.
Sustainability 10 04683 g004
Figure 5. Spatial distribution of Ksat within the case study area based on the field measurements, calculated using Thiessen polygons.
Sustainability 10 04683 g005
Figure 6. GIS analysis of the NTNU campus case study with highlighted the potential SUDS areas (a) and highlighted the high potential SUDS areas (b) next to main flow paths.
Sustainability 10 04683 g006
Table 1. Total area needed for bioretention based on the infiltration rates from the different drainage areas with Ksat values above the minimum recommended 3 cm/h.
Drainage AreaArea of Bioretention (m2)Area of Bioretention as a % of the Impervious Area
359322.0%
43203411.0%
612240.4%
720830.7%
9102663.5%
1023140.8%
1139201.4%
1213740.5%
1329881.0%
1611100.4%
1749201.7%

