Article

Nitrogen Recovery from Wastewater: Possibilities, Competition with Other Resources, and Adaptation Pathways

by
Jan Peter Van der Hoek
1,2,*,
Rogier Duijff
1 and
Otto Reinstra
2
1
Department of Water Management, Faculty of Civil Engineering and Geosciences, Delft University of Technology, Stevinweg 1, 2628 CN Delft, The Netherlands
2
Waternet, Strategic Centre, Korte Ouderkerkerdijk 7, 1096 AC Amsterdam, The Netherlands
*
Author to whom correspondence should be addressed.
Sustainability 2018, 10(12), 4605; https://doi.org/10.3390/su10124605
Submission received: 5 October 2018 / Revised: 27 November 2018 / Accepted: 1 December 2018 / Published: 5 December 2018
(This article belongs to the Special Issue Sustainable Wastewater Treatment Systems)

Abstract

:
Due to increased food production, the demand for nitrogen and phosphorus as fertilizers grows. Nitrogen-based fertilizers are produced with the Haber–Bosch process through the industrial fixation of N2 into ammonia. Through wastewater treatment, the nitrogen is finally released back to the atmosphere as N2 gas. This nitrogen cycle is characterized by drawbacks. The energy requirement is high, and in the wastewater treatment, nitrogen is mainly converted to N2 gas and lost to the atmosphere. In this study, technologies for nitrogen recovery from wastewater were selected based on four criteria: sustainability (energy use and N2O emissions), the potential to recover nitrogen in an applicable form, the maturity of the technology, and the nitrogen concentration that can be handled by the technology. As in wastewater treatment, the focus is also on the recovery of other resources; the interactions of nitrogen recovery with biogas production, phosphorus recovery, and cellulose recovery were examined. The mutual interference of the several nitrogen recovery technologies was studied using adaptive policy making. The most promising mature technologies that can be incorporated into existing wastewater treatment plants include struvite precipitation, the treatment of digester reject water by air stripping, vacuum membrane filtration, hydrophobic membrane filtration, and treatment of air from thermal sludge drying, resulting respectively in 1.1%, 24%, 75%, 75%, and 2.1% nitrogen recovery for the specific case wastewater treatment plant Amsterdam-West. The effects on sustainability were limited. Higher nitrogen recovery (60%) could be realized by separate urine collection, but this requires a completely new infrastructure for wastewater collection and treatment. It was concluded that different technologies in parallel are required to reach sustainable solutions. Nitrogen recovery does not interfere with the recovery of the other resources. An adaptation pathways map is a good tool to take into account new developments, uncertainties, and different ambitions when choosing technologies for nitrogen recovery.

1. Introduction

The increase of the world population to eight to 10 billion by 2050 [1,2] will result in substantial pressure on food supply [3]. Nitrogen and phosphorus play a critical role in plant growth and supply [4]. Due to increased food production, the demand for nitrogen and phosphorus will grow. Phosphorus is a non-renewable resource. The most common form of phosphorus on Earth is locked in igneous and sedimentary deposits, with the mining of these rocks being the most viable method of extraction. With the current rate of extraction and consumption, these “readily exploitable” sources of phosphorus will be depleted within the next 45–100 years [5]. The reserve of this resource is getting smaller, and now phosphate is on the European Union (EU) list of critical raw material [6]. Driven by future shortages, a paradigm shift is currently underway from an attitude that considers wastewater as a waste to be treated, to a proactive interest in recovering materials and energy from these streams [7]. Much research is being carried out into phosphorus removal from wastewater [8,9,10], and technologies are now applied at full-scale [11].
Nitrogen is abundantly present in the atmosphere (almost 80%) in a highly stable and non-reactive form, N2 gas. Nitrogen in its reactive forms (ammonium, nitrite, and nitrate) is essential for plant growth, and its content is limited in soils. Most naturally occurring reactive nitrogen comes from lightning (2%) and biological fixation (98%) [4]. Since the Haber–Bosch process was invented in 1909, which provides an industrial fixation of N2 into ammonia, the production of N-based fertilizers supported the largest historical increase in food production capacity [12]. The Haber–Bosch process more than quadrupled the productivity of agricultural crops [13].
However, the introduction of the Haber–Bosch process affected the nitrogen cycle. The increased food production by use of N-based fertilizers produced by the Haber–Bosch process is excreted mainly as urea and NH4+ by human metabolism, and discharged to the sewer. To avoid the eutrophication of water, in the current wastewater treatment technology based on the conventional activated sludge process, the reduced reactive nitrogen is biologically converted to its nonreactive N2 gas form through the nitrification/denitrification or deammonification (anammox) process [14], and then released back into the atmosphere.
Although the nitrogen cycle is closed through the combination of industrial fixation of N2 into ammonia by the Haber–Bosch process and the enhanced microbiological conversion of reduced reactive nitrogen to N2 gas, it is also characterized by serious environmental drawbacks. Firstly, nitrogen entering waste streams is mainly converted to N2 gas and lost to the atmosphere rather than reused. Secondly, the processes of N-fixation for fertilizers’ production and N-dissipation for wastewater treatment require much energy. Thirdly, the biological removal of nitrogen from the wastewater results in nitrous oxide (N2O) gas emissions representing an intermediate of increasing concern in terms of greenhouse gas emissions from wastewater treatment plants: the emission is relatively small (3% of the estimated total anthropogenic N2O emission), but is a significant factor (26%) in the greenhouse gas footprint of the total water chain [15].
For these reasons, it is relevant to examine more sustainable pathways for nitrogen, which consist of interventions in the present (anthropogenic) nitrogen cycle, such as the direct recovery of nitrogen from wastewater and reuse. Up until now, there has been only limited experience with nitrogen recovery from wastewater combined with nitrogen reuse at full scale. Ammonia precipitation as struvite is applied in practice, but the main focus of this process is phosphorus recovery [11]. In a household-scale wastewater treatment system operated with domestic sewage, gardening/irrigation water was recovered from raw sewage or secondary effluent by low-pressure ultrafiltration [16]. In the European MEMORY project (“membranes for energy and water recovery”), the technical and economic feasibility of a submerged anaerobic membrane bioreactor, treating urban wastewater, is demonstrated at an industrial scale. Instead of consuming electricity to destroy organic matter and nitrogen, methane is generated directly from the raw wastewater, and the membranes produce disinfected reusable water that is rich in fertilizers [17].
At the same time, there are many other initiatives than nitrogen recovery and nitrogen reuse to make the wastewater treatment more sustainable. Many of these focus on resource recovery. A transition in wastewater treatment plants toward the reuse of wastewater-derived resources is recognized as a promising solution to shift wastewater treatment from standard treatment to the current emphasis on sustainability [18]. In addition to water, energy and nutrient recovery (phosphorus and nitrogen) emerging options are e.g., the recovery of cellulose fibers [19], biopolymers [20], bioplastics [21], and protein [22]. In the Netherlands, there is a special program, the Energy and Raw Materials Factory, focusing on the recovery of materials and energy from wastewater to contribute to the circular economy. The program involves resources such as cellulose, bioplastics, phosphate, alginate-like exopolymers from aerobic granular sludge, and biomass [23]. Due to its many possibilities, the challenge is how to develop a coherent policy and strategy, and how to make the right choices [24].
Within the possibilities for nitrogen recovery and nitrogen reuse, competing synergistic or neutral interventions and technologies may also exist, resulting in lock-ins (measures that are mutually exclusive), no-regret measures (measures that do not limit the number of options after a decision), and win–win measures (measures that are significant for more than one strategy).
This study has three specific objectives. Firstly, it explores alternatives to recover and reuse nitrogen from wastewater in a more sustainable way (Section 3.2). Secondly, the selected alternatives are placed beside other alternatives for resource recovery from wastewater to judge the exclusion or synergy with these other resource recovery alternatives (Section 3.3). Thirdly, the alternatives for nitrogen recovery and reuse are compared with each other to identify lock-ins, win–win, and no-regret measures (Section 3.3).

2. Materials and Methods

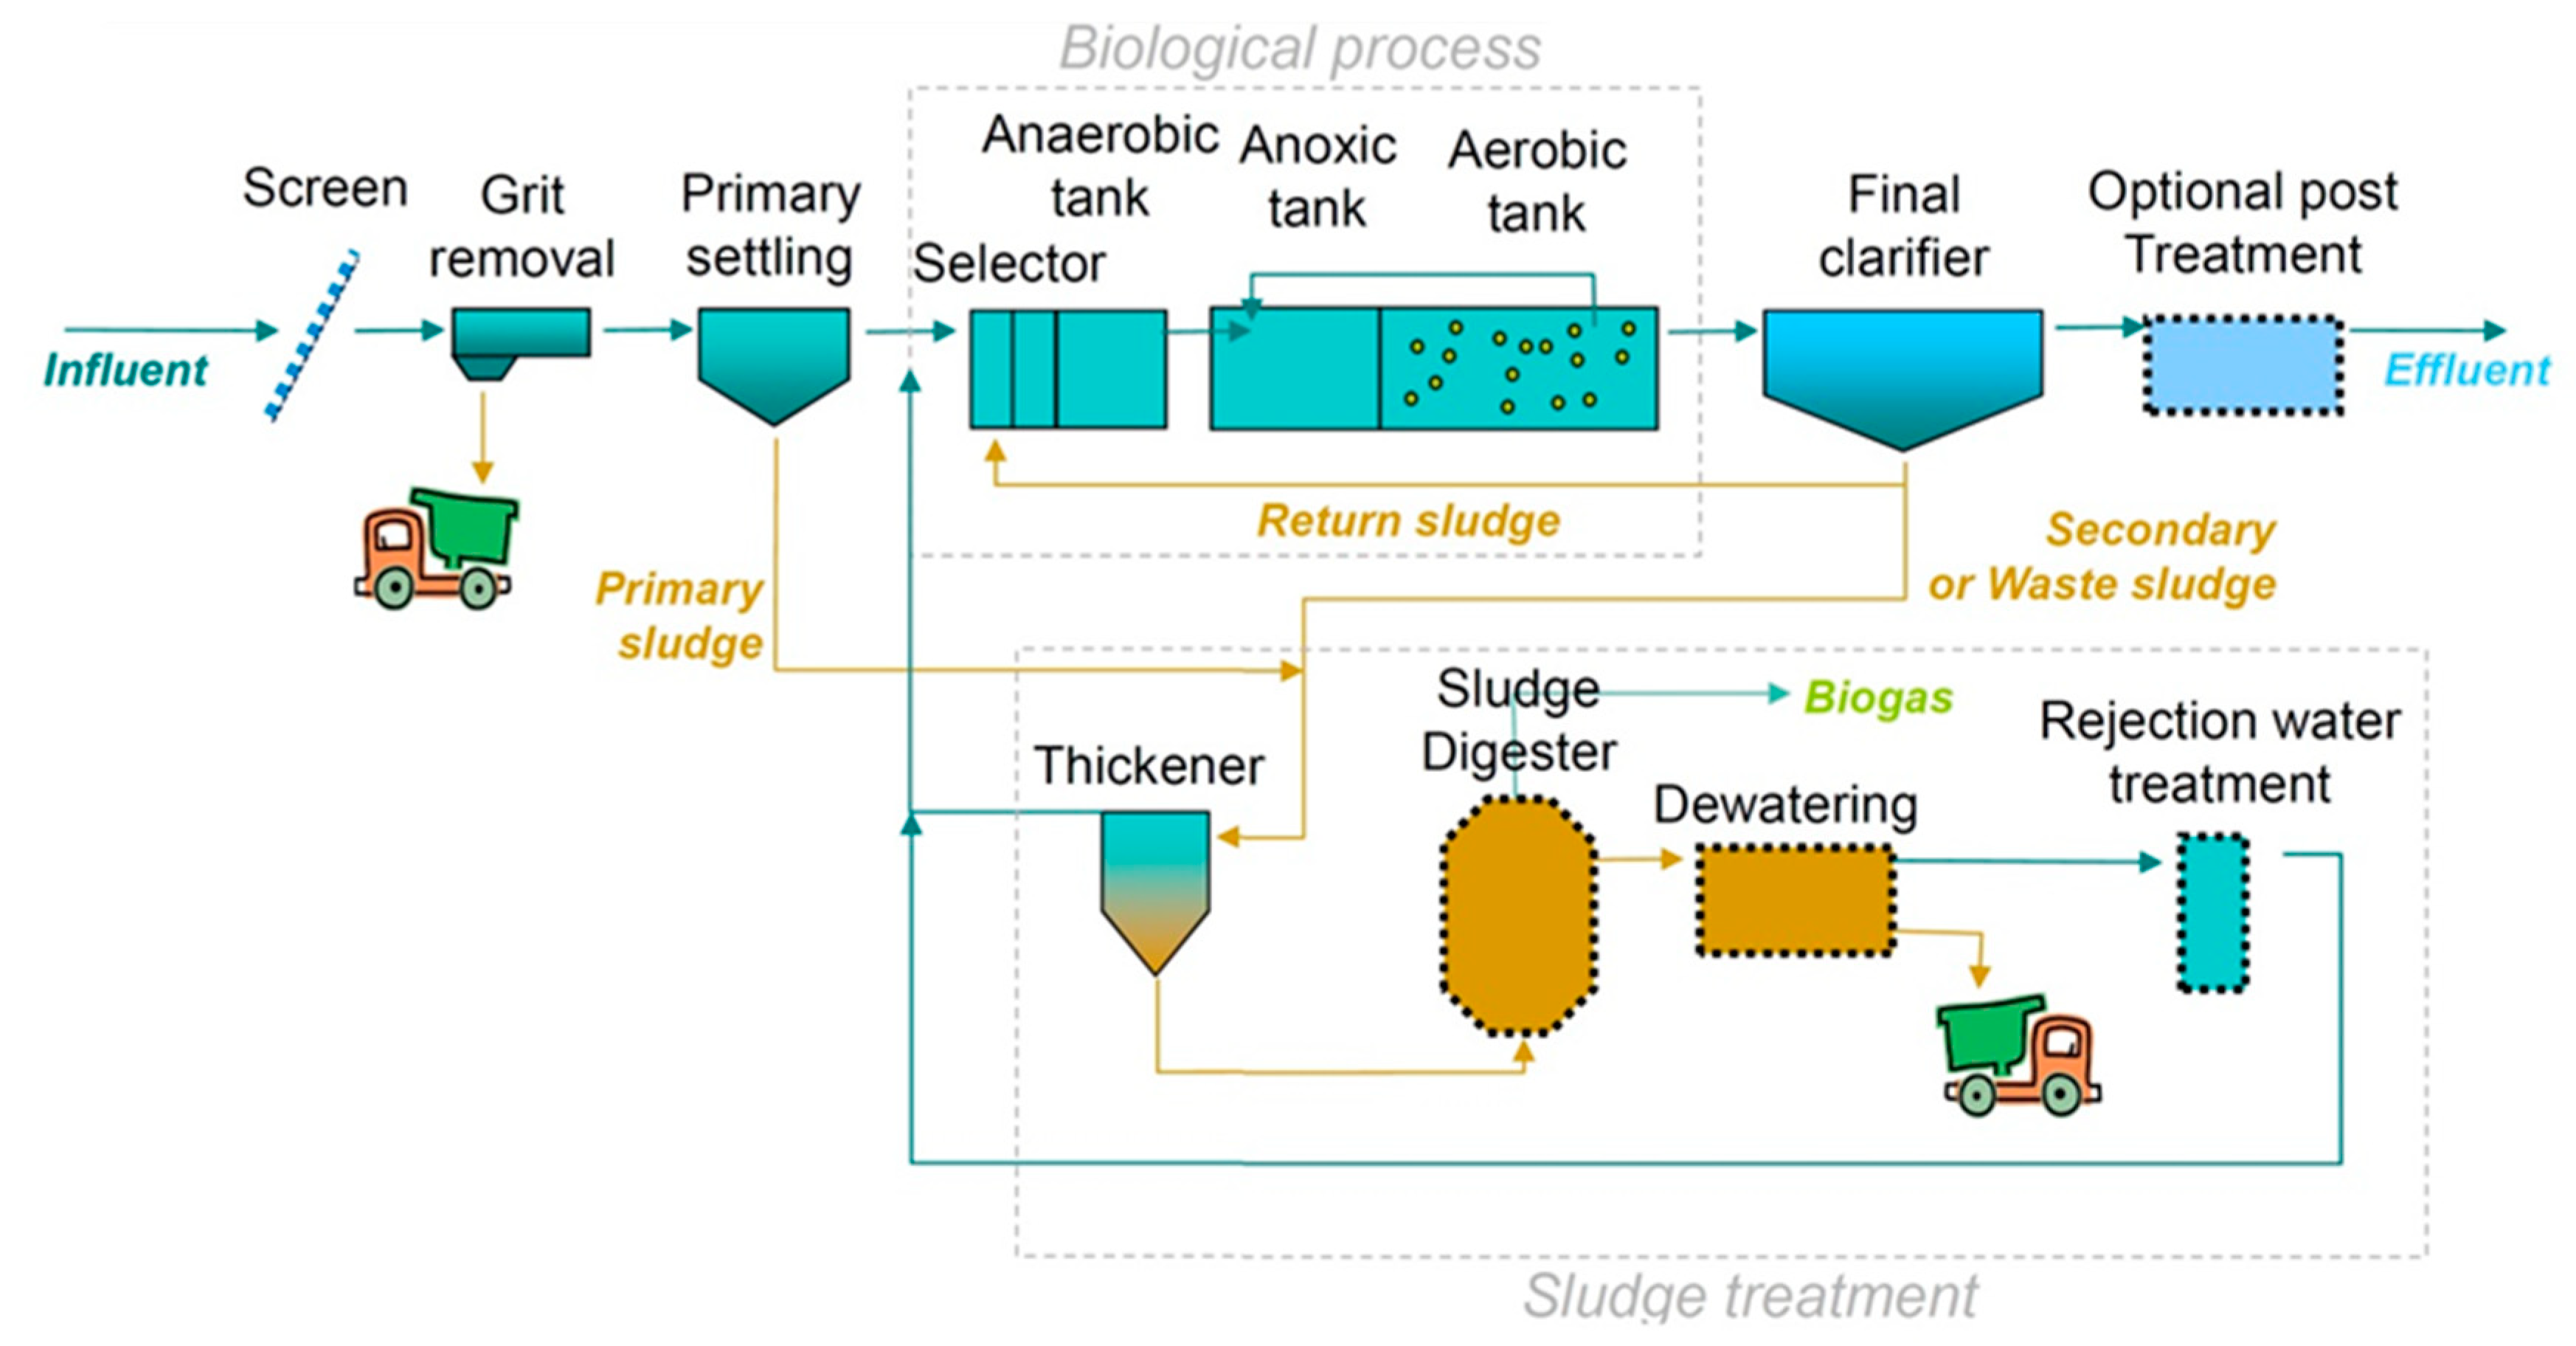
2.1. Wastewater Treatment Plant Amsterdam-West

The wastewater treatment plant (WWTP) Amsterdam-West was used as a specific case in this study. This plant is operated by the water utility Waternet, which is the public water service of the City of Amsterdam and the Regional Water Authority Amstel, Gooi, and Vecht. Figure 1 schematically shows the process configuration of this plant. After primary treatment, the wastewater is transferred to a series of biological treatment tanks. Together, these form the modified University of Cape Town (mUTC) process with biological phosphorus and nitrogen removal. Finally, the wastewater passes the secondary settling tank. Primary sludge and waste sludge are digested. Digested sludge is dewatered, after which the dewatered sludge is transported to a struvite installation to produce struvite.
This WWTP was chosen for analysis because it has a large capacity of 1,014,000 people equivalents (PEs). The N-load to this plant through Amsterdam’s wastewater is 3932 ton N/year [25], which is 4.4% of the total N-load in sewer water in the Netherlands. In addition, sludge from the other WWTPs operated by Waternet is transported to this plant for digestion, by which the total N-load to this plant equals 4705 ton N/year, which is 5.3% of the total N-load in wastewater treatment in the Netherlands. During the digestion, nitrogen is released in the form of NH3/NH4+, which can be recovered by several technologies. These characteristics make WWTP Amsterdam-West potentially attractive for nitrogen recovery.

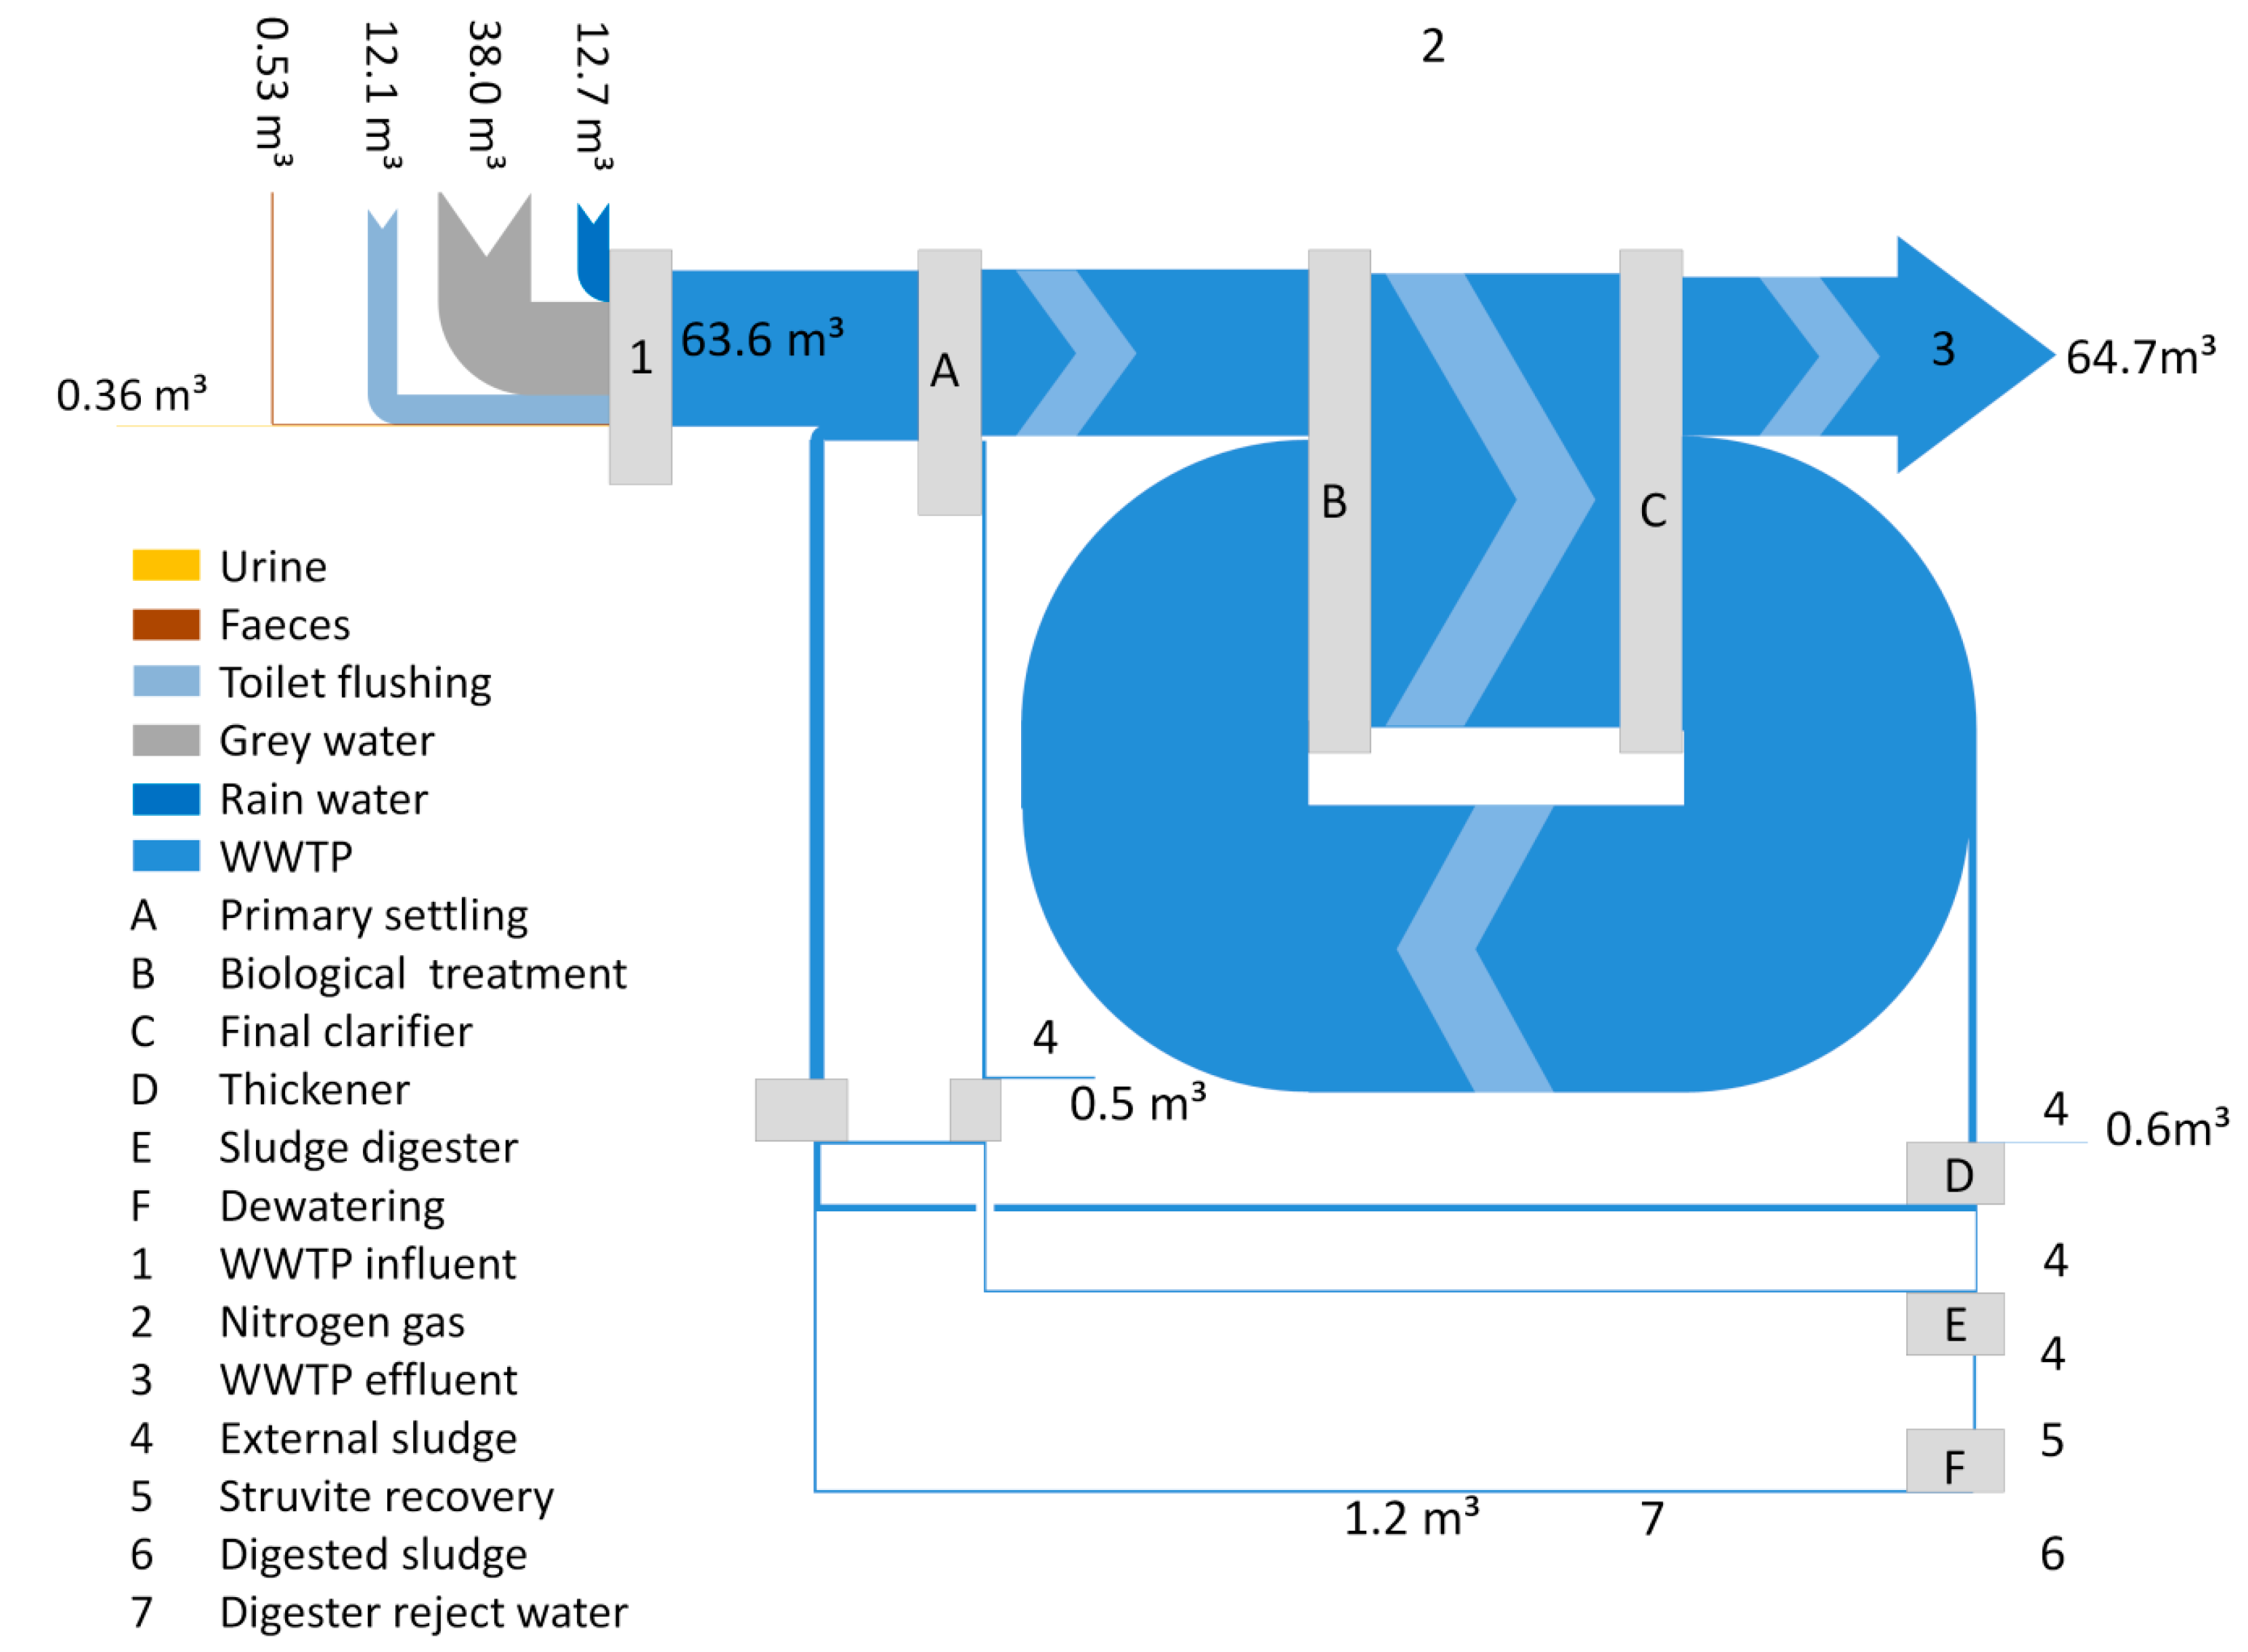
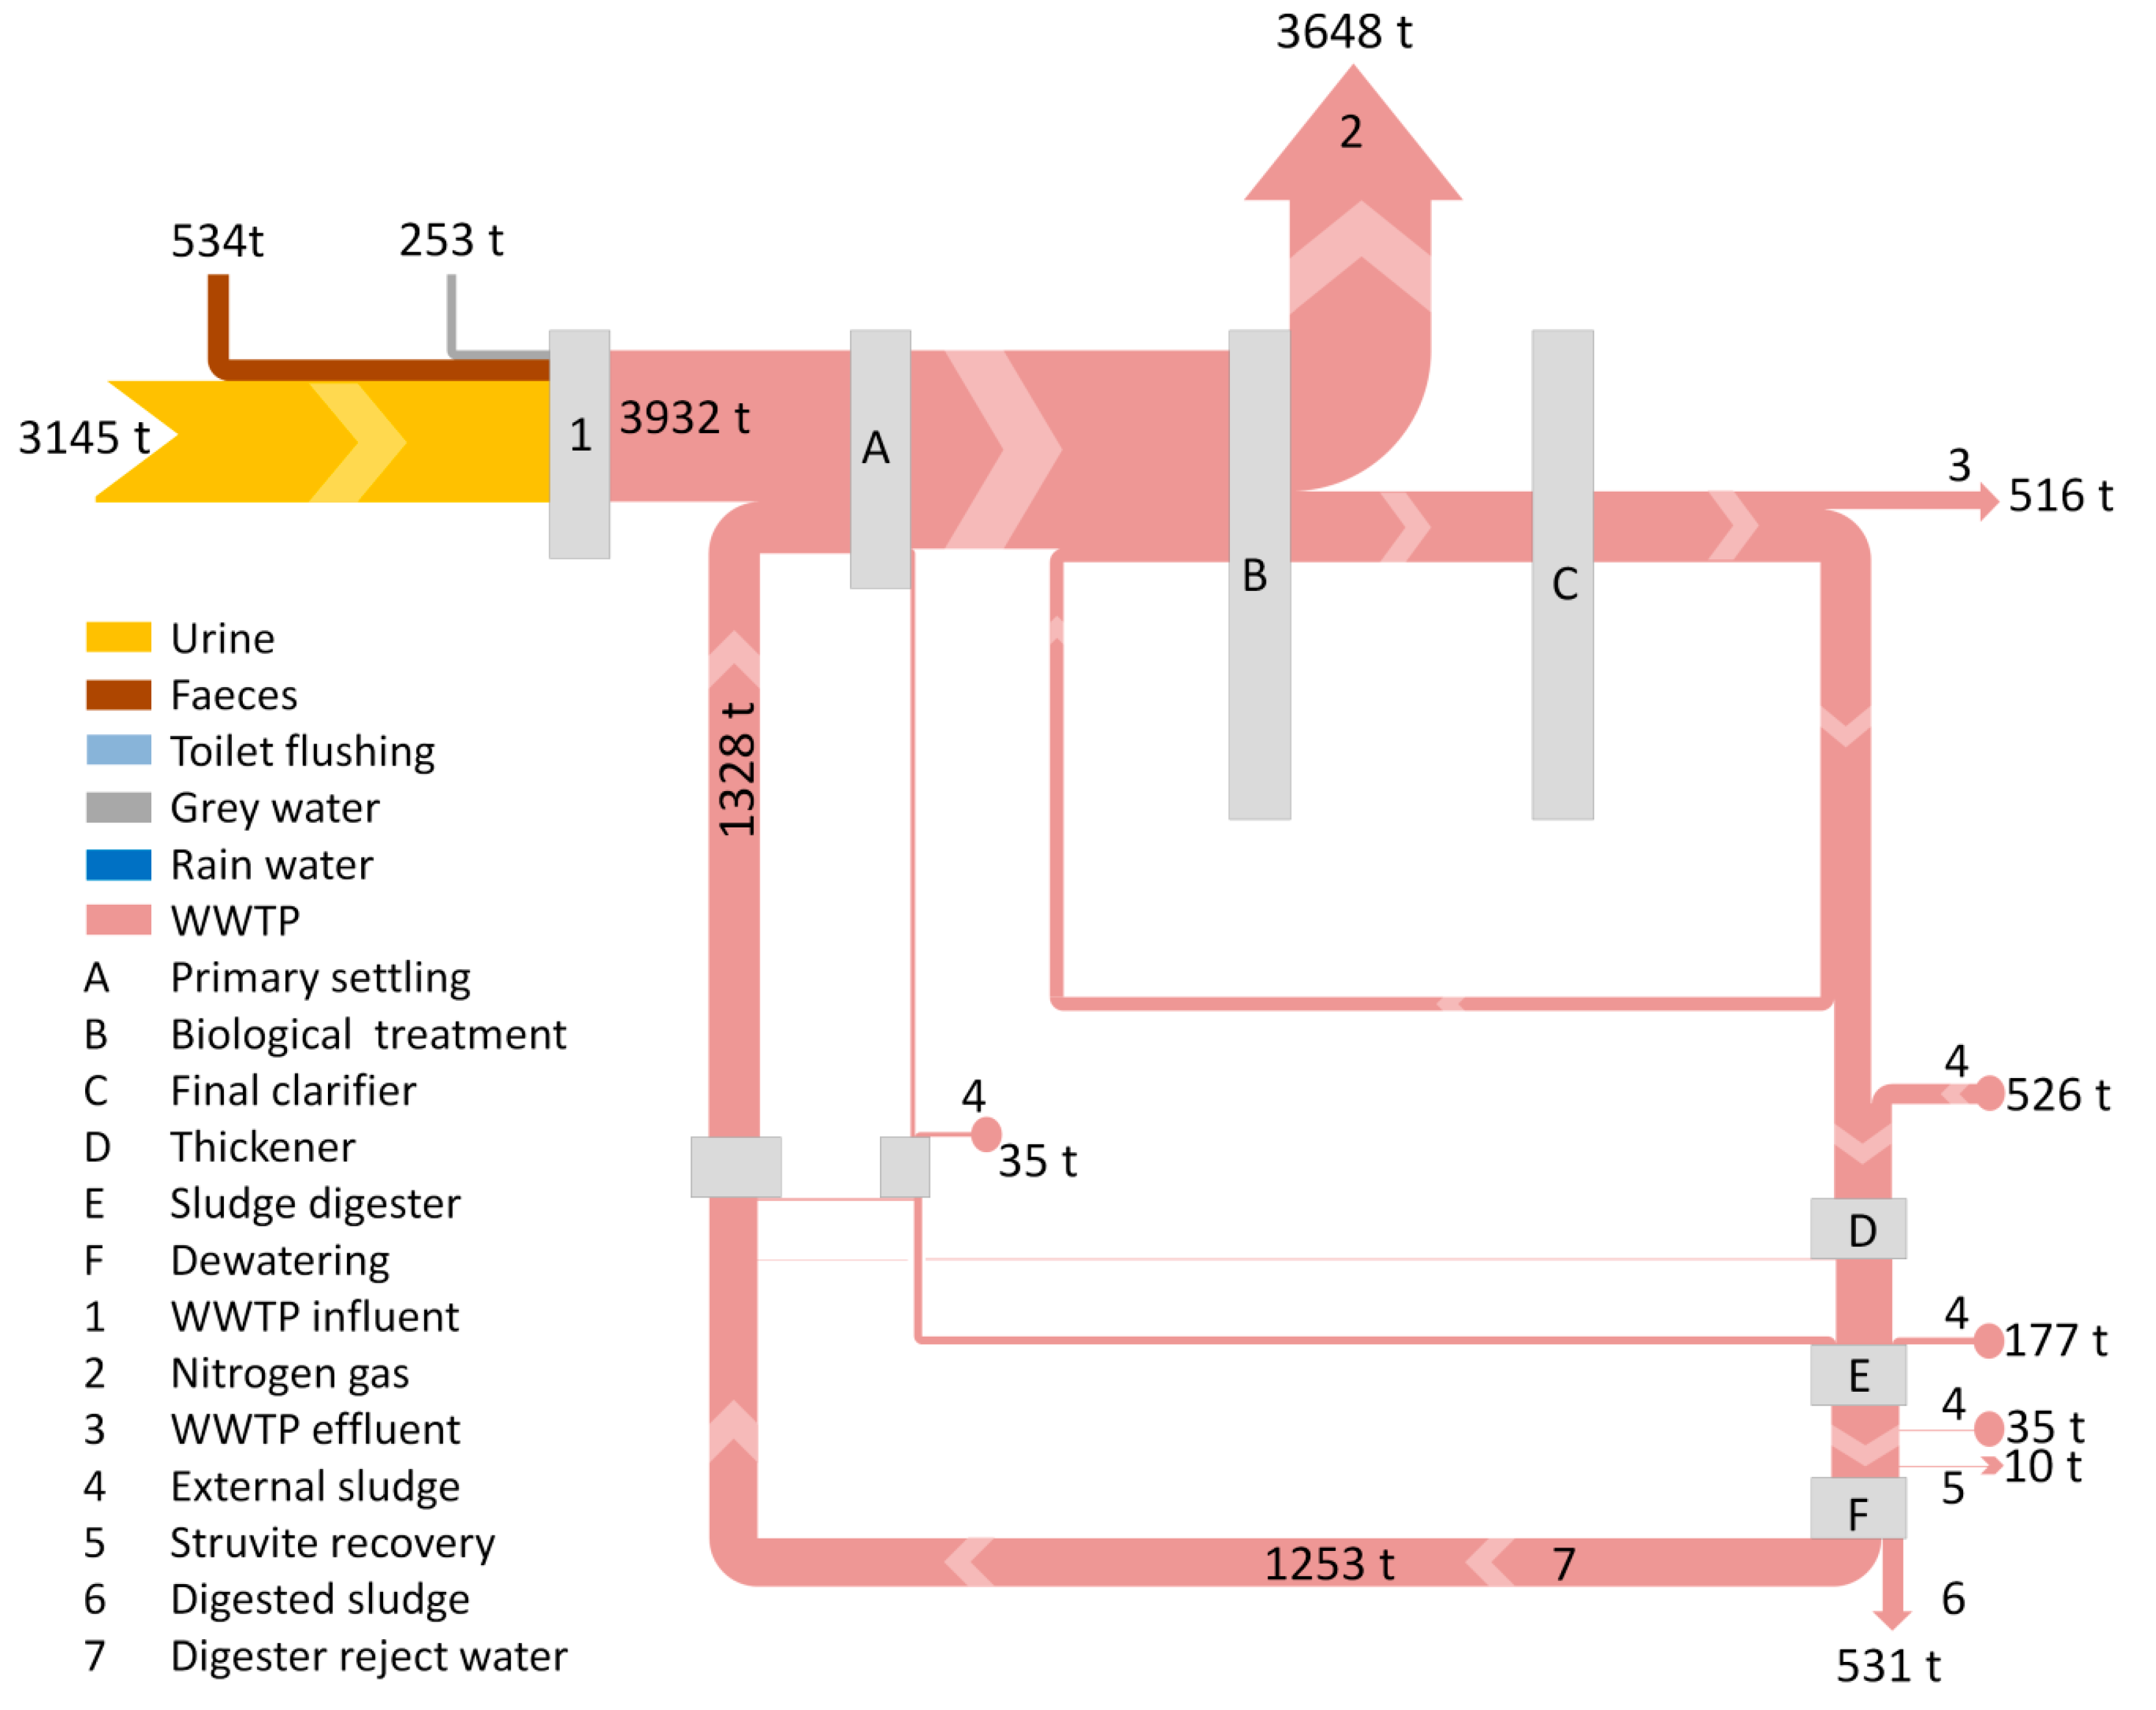
2.2. Nitrogen Balance and Water Balance

A nitrogen mass balance was made for the whole treatment process of WWTP Amsterdam-West. Also, a water balance was made for the whole treatment process. The nitrogen balance shows where nitrogen is present and in which quantities in the treatment process. Combination with the water balance shows the nitrogen concentrations in the treatment process. Concentration is an important parameter, as many recovery techniques work more efficiently at higher concentrations. Locations with high nitrogen mass and a high nitrogen concentration are attractive for nitrogen recovery.

2.3. Selection of Alternatives

Based on a literature review, alternatives were identified. By the use of four specific criteria, alternatives were selected for further evaluation. The criteria were:
  • The alternative has to be more sustainable with respect to energy use and N2O emissions;
  • The alternative has to focus on the recovery of nitrogen in an applicable form;
  • The alternative must be applicable in practice;
  • The alternative has to be able to cope with nitrogen in the concentration range that is present in the wastewater treatment process (60–8800 mg/L, see Section 3: Results and Discussion).
For criterion 1, the combination Haber–Bosch – deammonification was considered as a benchmark. This implies that the alternative requires lower energy consumption as compared with the combination Haber–Bosch – deammonification, and should result in N2O emissions during the wastewater treatment that are far below the conventional nitrification–denitrification process and below the deammonification process. To quantify this, the nitrogen cycle as shown in Figure 2 has to be considered.
The primary energy requirement of N-fixation in the Haber–Bosch process is in the range of 37–45 MJ/kg-N, while the nitrification–denitrification wastewater treatment process (steps 1–2 and steps 3–6 in Figure 2) requires about 42.2–45 MJ/kg-N [26,27]. So, the total primary energy requirement for N-fixation and N-removal reaches 90 MJ/kg-N. N-removal by the deammonification process (a two-step process where ammonia-oxidizing bacteria aerobically convert half of the ammonia to nitrite, and anammox bacteria anaerobically oxidize the residual ammonia using nitrite to produce nitrogen gas without the organic carbon substrate required for conventional heterotrophic denitrification, as shown in step 1 and step 8 in Figure 2) requires 3.1 MJ/kg-N [27] to 16 MJ/kg-N [26], and reduces the total energy use of N-fixation and N-removal to less than 61 MJ/kg-N, which is the benchmark value. With respect to N2O emissions, in the conventional nitrification–denitrification process, N2O is produced in step 1 (aerobic ammonia oxidation), while in the denitrification (steps 3–6), incomplete denitrification can lead to N2O emissions [15]. N-removal by the deammonification process results in less N2O emission, as can be seen in Figure 2. The aerobic ammonium oxidation results in N2O (step 1), but the anaerobic oxidation of ammonia to nitrogen gas (step 8) does not emit N2O. The global warming potential of the deammonification process is only 40%, as compared with the conventional nitrification–denitrification process [28], which is considered as the benchmark value.
By means of these criteria, the alternatives were scored qualitatively, as shown in Table 1.

2.4. Relation to Other Alternatives for Resource Recovery from Wastewater

In the Dutch program “The Energy and Raw Materials Factory”, the focus is on the recovery of energy and the materials phosphorus, cellulose, bio-ALE (alginate-like exopolymers from aerobic granular sludge), and bioplastics from wastewater [23]. In this study, the relation of nitrogen recovery with biogas production, phosphorus recovery, and cellulose recovery was analyzed. Bio-ALE was excluded, because the recovery of bio-ALE requires the application of the Nereda aerobic granular sludge technology as wastewater treatment [29], and this technology is not applied at the WWTP Amsterdam-West. Bioplastic was excluded, because the production costs of this material are currently still rather high; it is twice as much as the regular market prices. In addition, there is no available stable industrial production process yet [23].

2.5. Interdependencies between Nitrogen Recovery Alternatives

There is a wide variety of available alternatives for nitrogen recovery and reuse. External factors, which may change over time due to technological, environmental, economic, and market developments, influence the choice for an optimal alternative. Adaptive policy making is an approach to make decisions at this moment, taking into account future developments. It considers uncertainties and complex dynamics, and adaptation pathways show which interventions can be done in which sequence and at which time [30]. This approach was applied to see interdependencies between the nitrogen recovery alternatives, as represented in adaptation pathway maps.

3. Results and Discussion

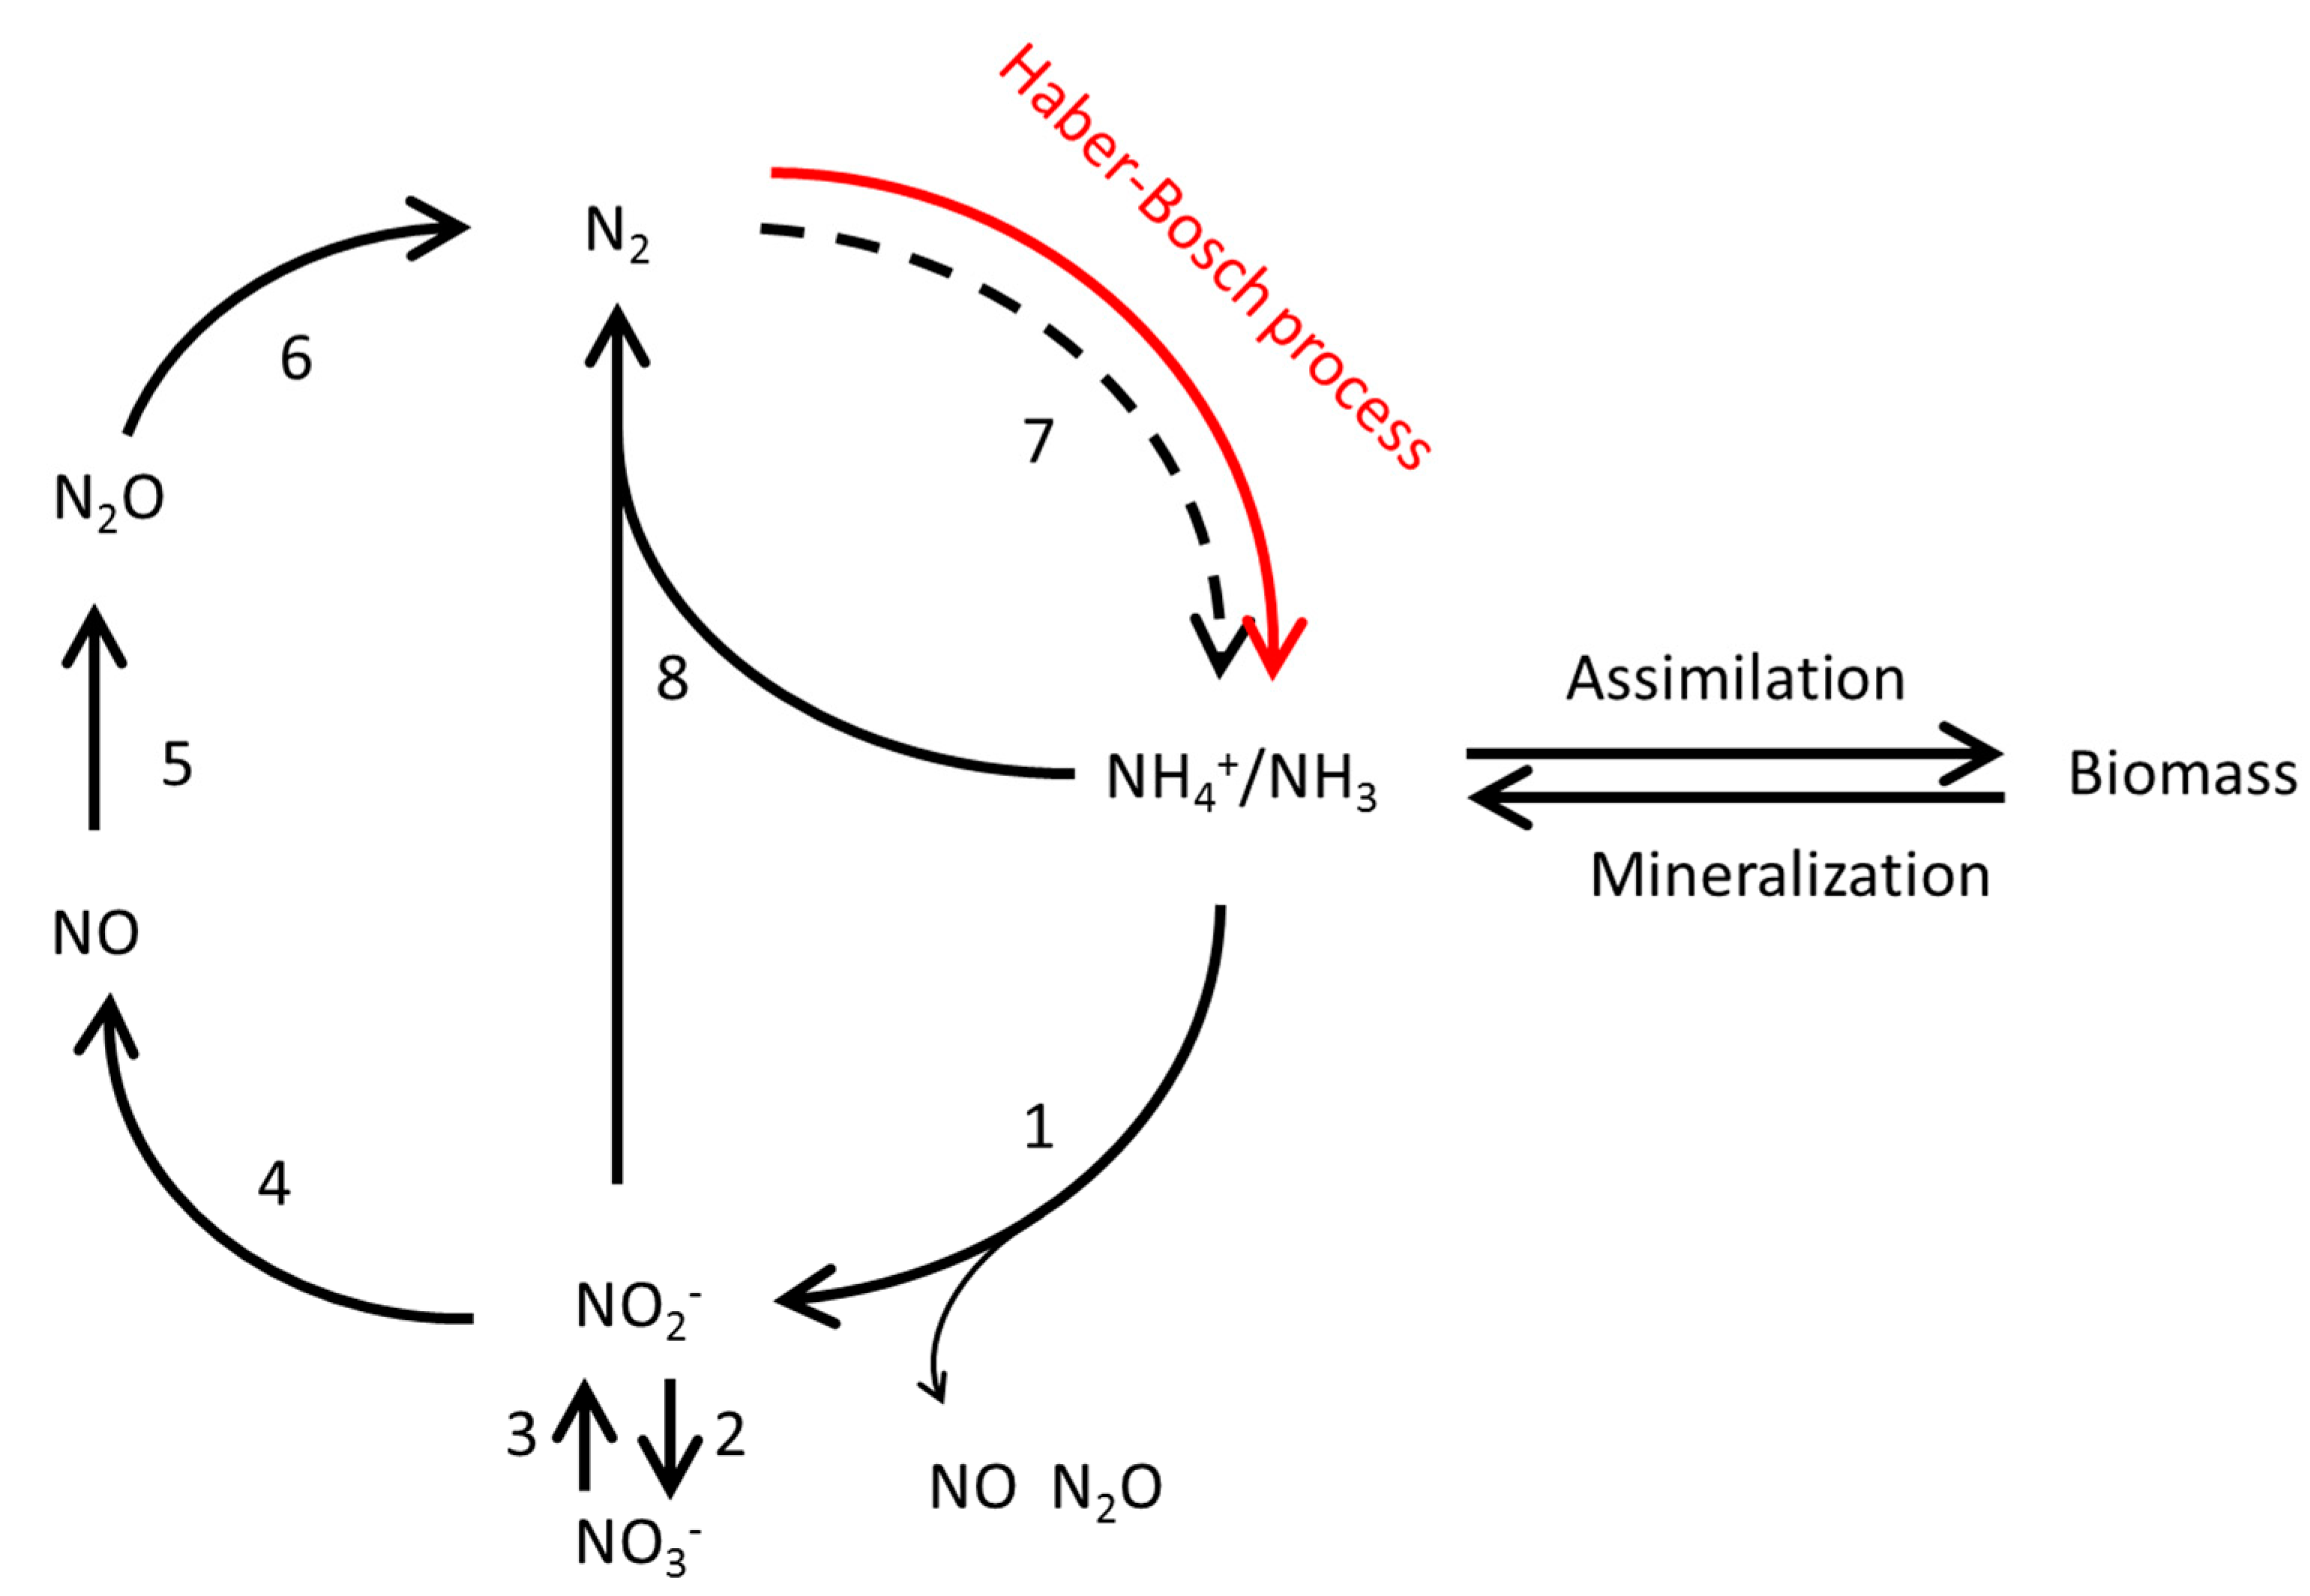
3.1. Nitrogen Flow through the Wastewater Treatment Process

The water balance of the WWTP Amsterdam-West is shown in Figure 3. The first step was a black box approach to close the water balance over the system. There was a slight unbalance of 1.8% over the whole system, which was probably due to evaporation. Therefore, 1.8% was added to the effluent flow. The incoming flow (1,044,548 inhabitants) consists of the flushing water of toilets (31.7 L/person/day), grey water (99.6 L/person/day), urine (0.94 L/person/day), feces (1.4 L/person/day), and rainwater. For rainwater, it was assumed that it contributed 20% to the total incoming flow [31,32,33].
The nitrogen balance of the WWTP Amsterdam-West is shown in Figure 4. Also, for this balance, the first step was a black box approach, based on the measured nitrogen concentration in the influent and effluent. Nitrogen in surplus sludge was determined at the plant (75 g N/kg ds). For primary sludge, digested sludge, and external sludge, the same value was assumed. Due to the low-volume flows, the impact of this assumption is very limited. The nitrogen content in the digester reject water was determined at 1030 mg/L, but showed large variations (750–1700 mg N/L). The balance was closed by the assumption that all other outflow concerned nitrogen gas. The total incoming nitrogen mass (exclusive of the incoming external sludge) was divided over urine, feces, flushing water of toilets, greywater, and rainwater, with the following assumptions: urine contributes 80% to the total incoming mass [34,35], the contribution of feces is based on 1.4 g N/person/day [32], while rainwater and the flushing water of the toilets do not contribute.
Based on these balances, the concentrations in specific flows can be calculated and related to the total nitrogen inflow through the system (3932 ton N in the influent, 773 ton N from external sludge, comprising in total 4705 ton N). Table 2 shows the results. Urine has the highest contribution and the highest concentration. Based on the urine volume and the assumed mass contribution to the influent (80%), the concentration is 8800 mg N/L, which is close to the concentration of 8830 mg N/L mentioned in Stowa [32]. The second flow with a high concentration is the digester rejects water. At a concentration of 1030 mg N/L, this flow contributes 27% to the total nitrogen inflow.
Both the high concentrations and the relatively high contributions may be attractive to take these flows into account when considering nitrogen recovery and reuse. In addition, nitrogen recovery from these flows will lower the nitrogen load of the WWTP, and thus result in a lower energy use and a lower N2O emission. Table 2 also shows the nitrogen concentrations in the influent and effluent of the treatment plant, and the relative contribution to the total nitrogen flow. The influent has a large contribution at a relatively low concentration.

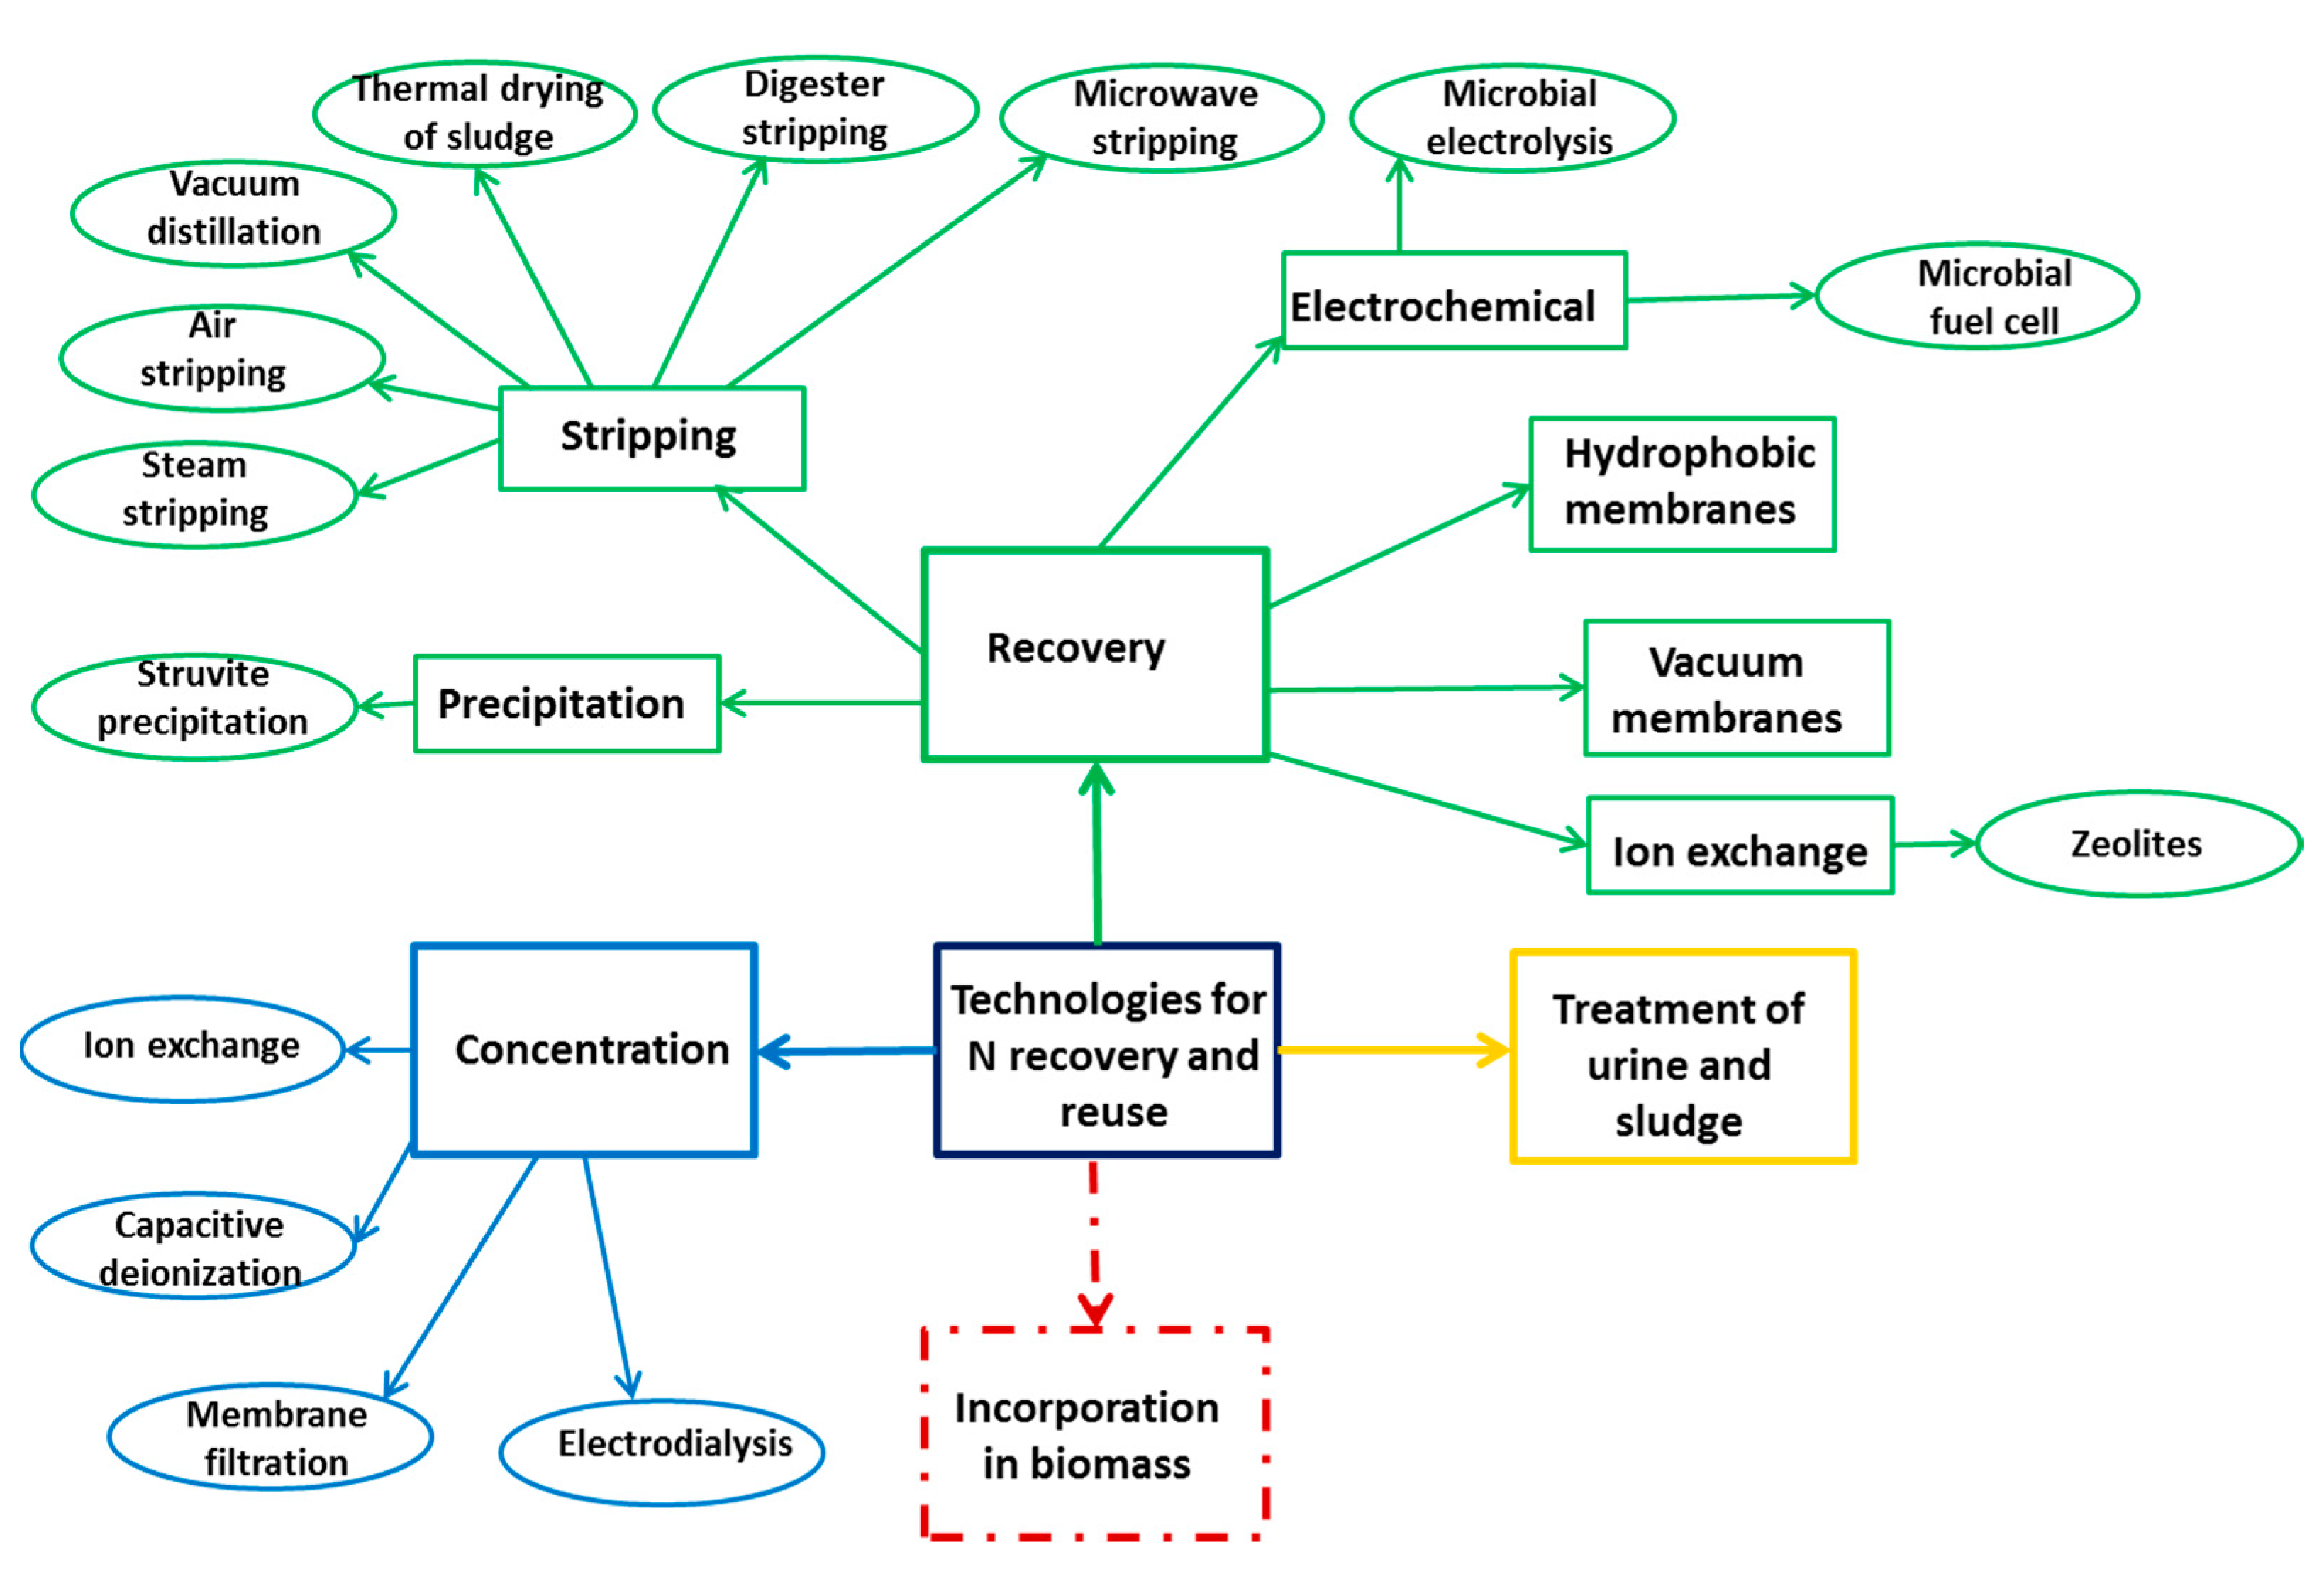
3.2. Nitrogen Recovery and Reuse: Technologies and Strategies

At present, many technologies are available to recover nitrogen from wastewater [4,36,37,38]. In principle, these technologies can be divided in four strategies to recover and reuse nitrogen:
  • technologies with the aim of recovering nitrogen directly from wastewater or digester reject water;
  • technologies with the aim of concentrating nitrogen in wastewater or digester reject water to enhance recovery technologies;
  • technologies to treat urine or sludge;
  • technologies with the aim of incorporating nitrogen in biomass.
Figure 5 shows an overview of strategies with related technologies.
The technologies for further evaluation were selected based on the four criteria. The fourth strategy, incorporation of nitrogen in biomass, was not considered, as this strategy focuses on recovery and/or the production of biomass from wastewater in general, and not on the recovery of nitrogen in specific. The results of the selection are shown in Table 3. A description of the technologies and the detailed scores on the criteria are presented in Supplemental Material 1 and Supplemental Material 2.
The selection shows that it is not possible for the technologies to reach a high score on the criterion “sustainability”, because in all of the cases, N2O emissions still take place on a level above the N2O emissions of the benchmark process (Haber–Bosch and deammonification). Most of the technologies recover nitrogen from the digester reject. This reduces the N-load of the wastewater treatment system (maximum 27%, based on Table 2), but without a radical change of the wastewater treatment system, emissions will remain too high. A 27% reduction in N-load while maintaining the conventional nitrification–denitrification process will not result in a 60% decrease of global warming potential as can be achieved by introduction of the deammonification process. Only urine treatment (maximum 67% reduction in N-load) is close to the benchmark with respect to N2O emissions. For that reason, it was decided to select the technologies for further evaluation based on a positive score on the other three criteria: recovery of nitrogen in an applicable form, maturity, and concentration range. Based on that, the technologies for further evaluation are struvite precipitation, air stripping, thermal drying of sludge with subsequent air treatment, hydrophobic membranes, vacuum membranes, urine treatment, and sludge reuse. Table 4 shows a first estimate of the nitrogen that can be recovered at the WWTP Amsterdam-West. The struvite recovery is based on the full-scale design of the WWTP Amsterdam-West and the operational experiences with this plant [11]. For air stripping, an efficiency of 90% was assumed [38]. The nitrogen recovery by the thermal drying of sludge is based on the nitrogen content in the sludge of WWTP Amsterdam-West and the maximum efficiency, as described in Horttanainen et al. [39]. As hydrophobic membranes for the treatment of digester reject water, polytetrafluoroethylene (PTFE) membranes (flat-sheet, hollow fiber, and spiral wound) and its expanded form (ePTFE) are preferred for NH3 extraction due to their hydrophobic characters, excellent organic resistance, and chemical stability with acidic and alkaline solutions [40]. Efficiency depends strongly on the process conditions; an efficiency of 75% was assumed. Conventional flat-sheet porous PTFE membranes have been applied for vacuum membrane distillation for ammonia removal, with efficiencies varying between 70–90% [41]. The treatment of human urine for nitrogen recovery can be achieved with evaporation, electrodialysis, and reverse osmosis with at least 90% recovery [42]. With respect to sludge reuse, it was assumed that 100% of the digested sewage sludge is applied.
Based on these estimates, it can be seen that especially air stripping, hydrophobic membranes, vacuum membranes, and urine treatment result in an increase of sustainability when the present wastewater treatment process of the WWTP Amsterdam-West is considered as a benchmark: The N-load of the wastewater treatment system reduces by 20–60%, resulting in a lower N2O emission. Whether also the energy use will be reduced strongly depends on the energy use of the nitrogen recovery technology and the system boundaries. For example, air stripping requires 90 MJ/kg-N [26], which is much more than the nitrification–denitrification process (42.2–45 MJ/kg-N), but it is comparable to the total primary energy requirement of N-fixation and N-removal by nitrification–denitrification process (90 MJ/kg-N). Table 4 also shows that only technologies in parallel will result in a substantial nitrogen recovery. The use of technologies in parallel will be addressed in Section 3.4.

3.3. Competition with Biogas Production and Recovery of Phosphorus and Cellulose

Biogas production, the recovery of phosphorus, and the recovery of cellulose are part of the Dutch program “The Energy and Raw Materials Factory” [23]. Nitrogen recovery is not a part of this program, so it is important to determine how the selected options for nitrogen recovery interact with biogas production, phosphorus recovery, and cellulose recovery. For biogas production, it is assumed that anaerobic sludge digestion is applied [43]; for phosphorus recovery, it is assumed that struvite precipitation in the digested sludge is applied [8,9,10], and for cellulose recovery, it is assumed that fine-mesh sieves are applied as pretreatment for biological municipal wastewater treatment [19]. Table 5 shows the interactions. In fact, all of the nitrogen recovery technologies are no-regret measures, except for the reuse of sludge. The reuse of sludge has an effect on biogas production. In case it is acceptable to reuse sludge with a lower organic carbon content, there is no interaction between nitrogen recovery through sludge reuse and the Dutch program “The Energy and Raw Materials Factory” at all. As nitrogen recovery on the one hand, and biogas production, phosphorus recovery, and cellulose recovery, on the other, do not exclude each other, biogas production, phosphorus recovery, and cellulose recovery were not taken into account for the adaptation pathways of nitrogen recovery alternatives.
In addition to the effects of nitrogen recovery on biogas production, phosphorus recovery, and cellulose recovery, it is also important to determine the effects vice-versa. Table 6 shows the results. It can be concluded that biogas production has an effect. With respect to the nitrogen recovery technologies—struvite precipitation, air stripping, and thermal drying of sludge—it is a win–win measure, as it enhances nitrogen recovery. With respect to sludge reuse, it is a lock-in measure: it reduces the total amount of sludge and the nitrogen content of the sludge. Also, phosphorus recovery has an effect: it reduces the N-content and P-content of the sludge. However, as in the Netherlands, there is a surplus of manure with especially a surplus of phosphorus, the removal of phosphorus from the wastewater treatment sludge may be beneficial to market this material in agriculture [44].

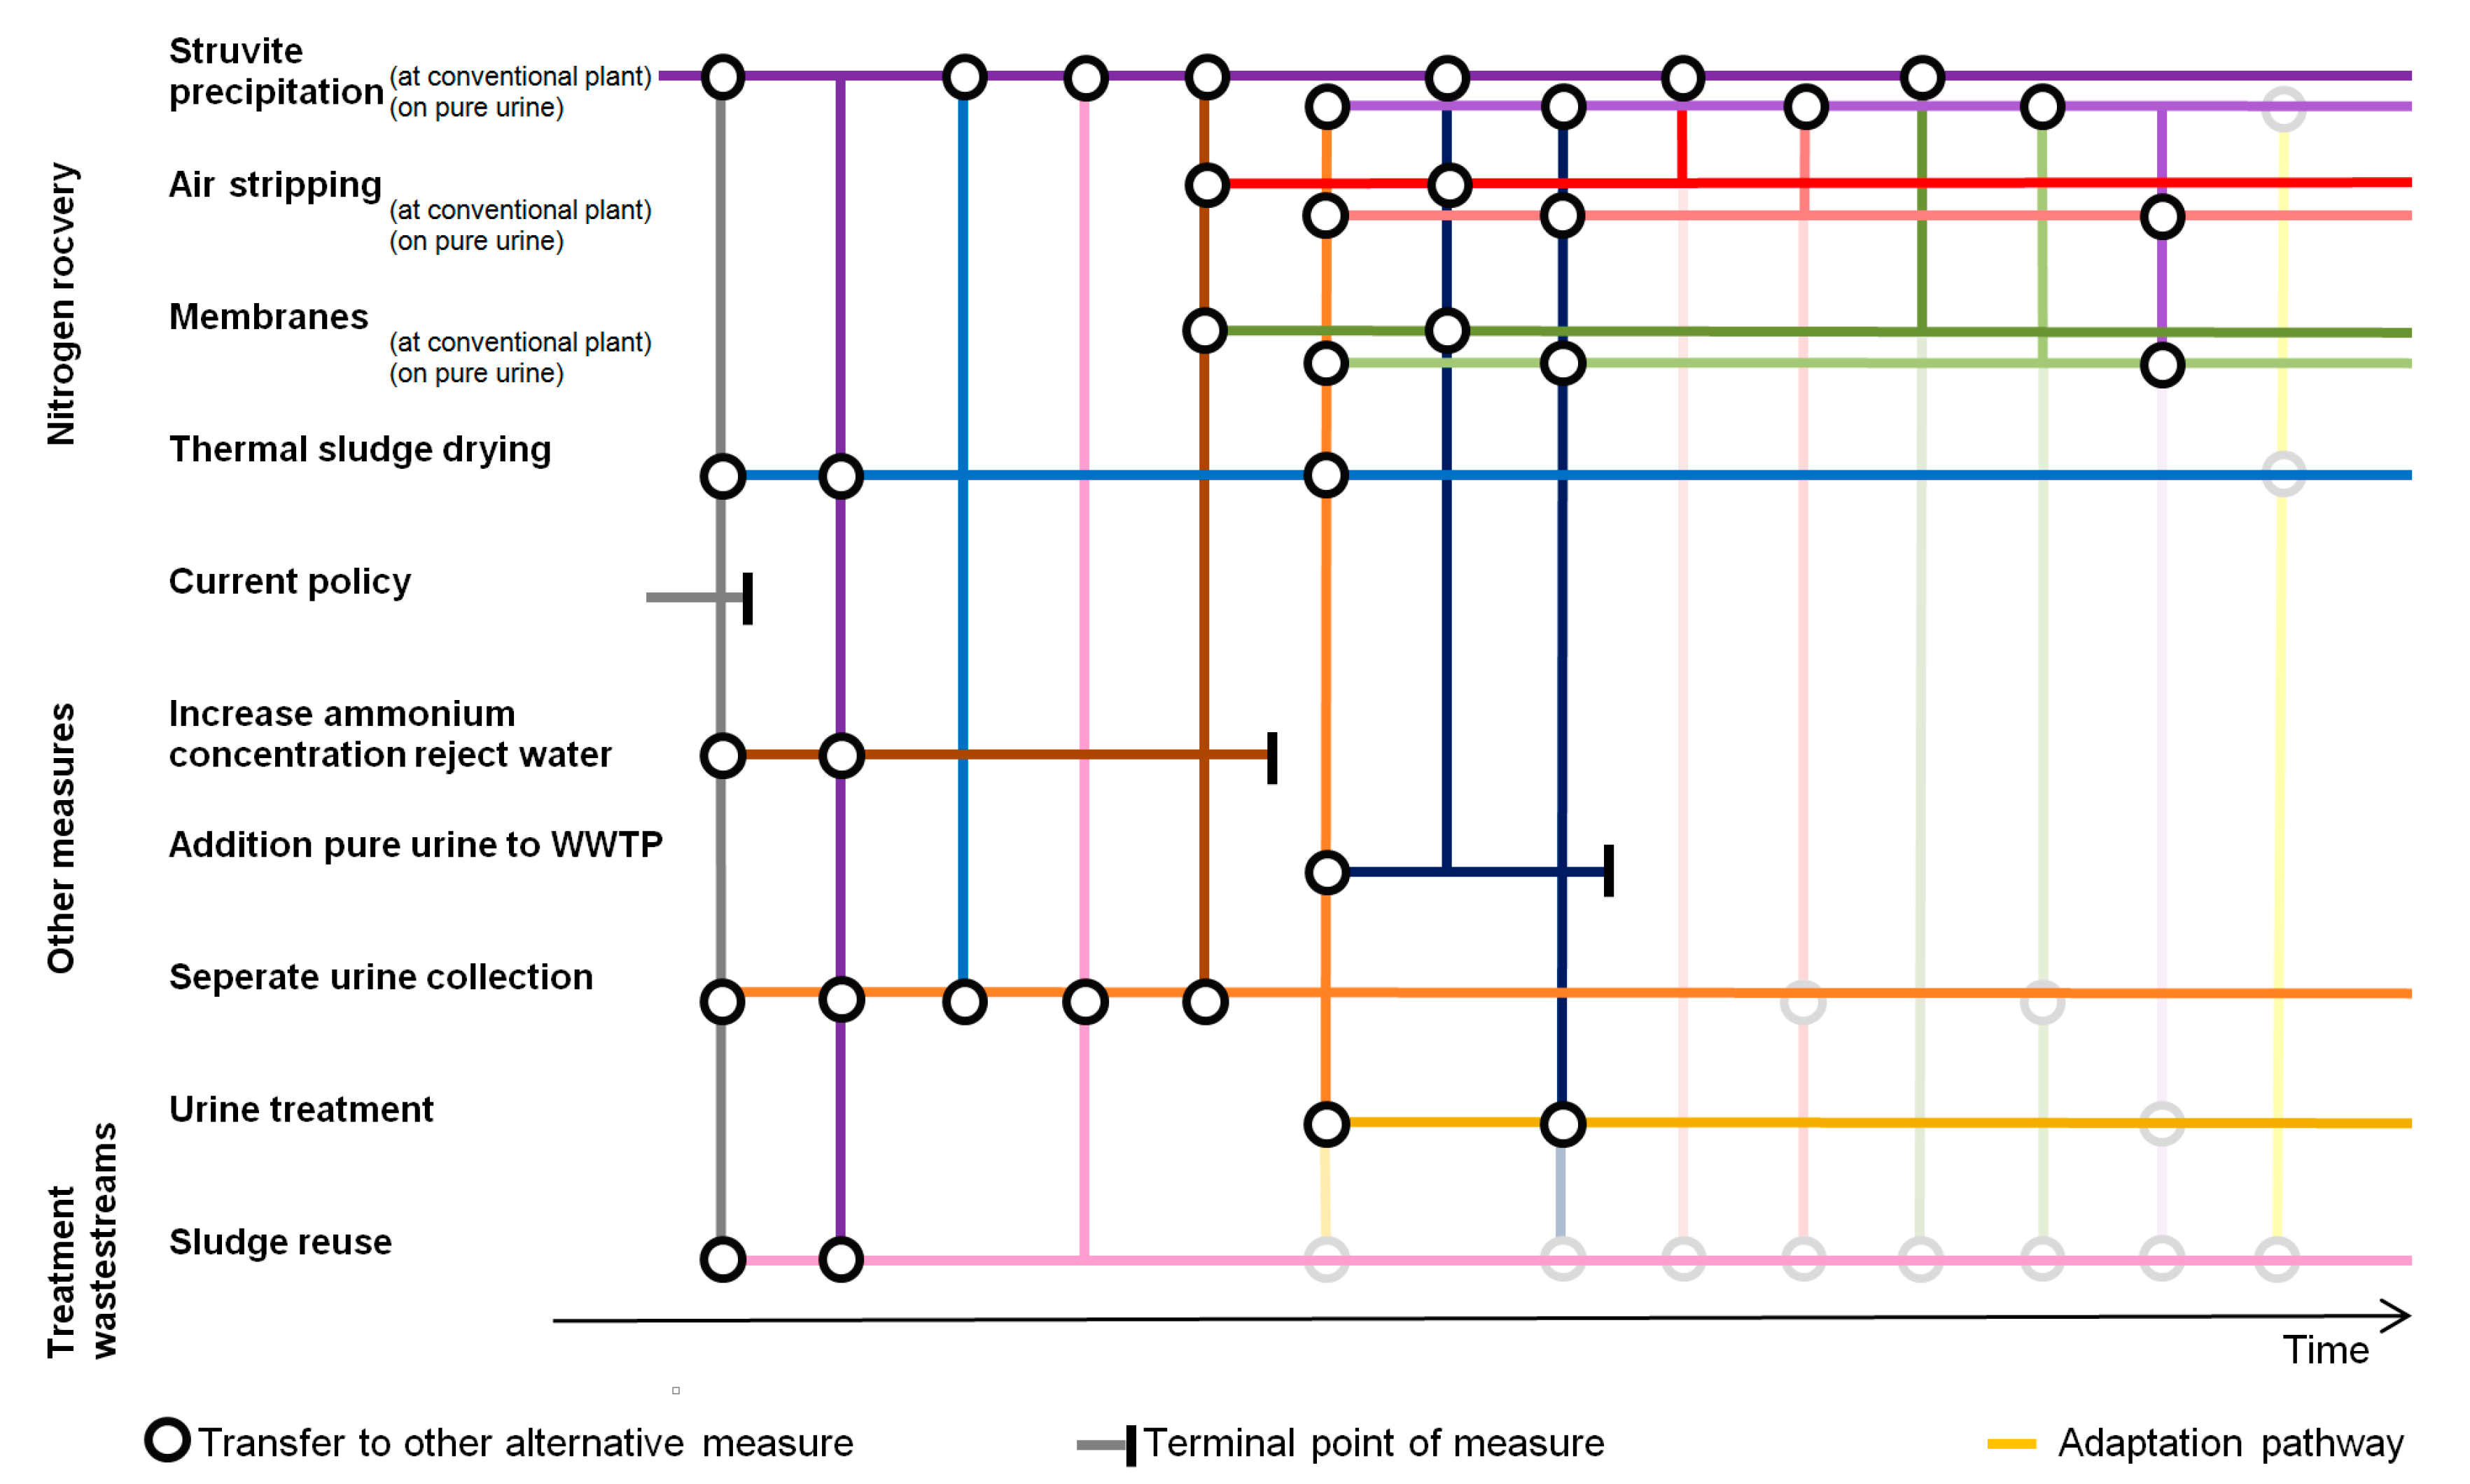
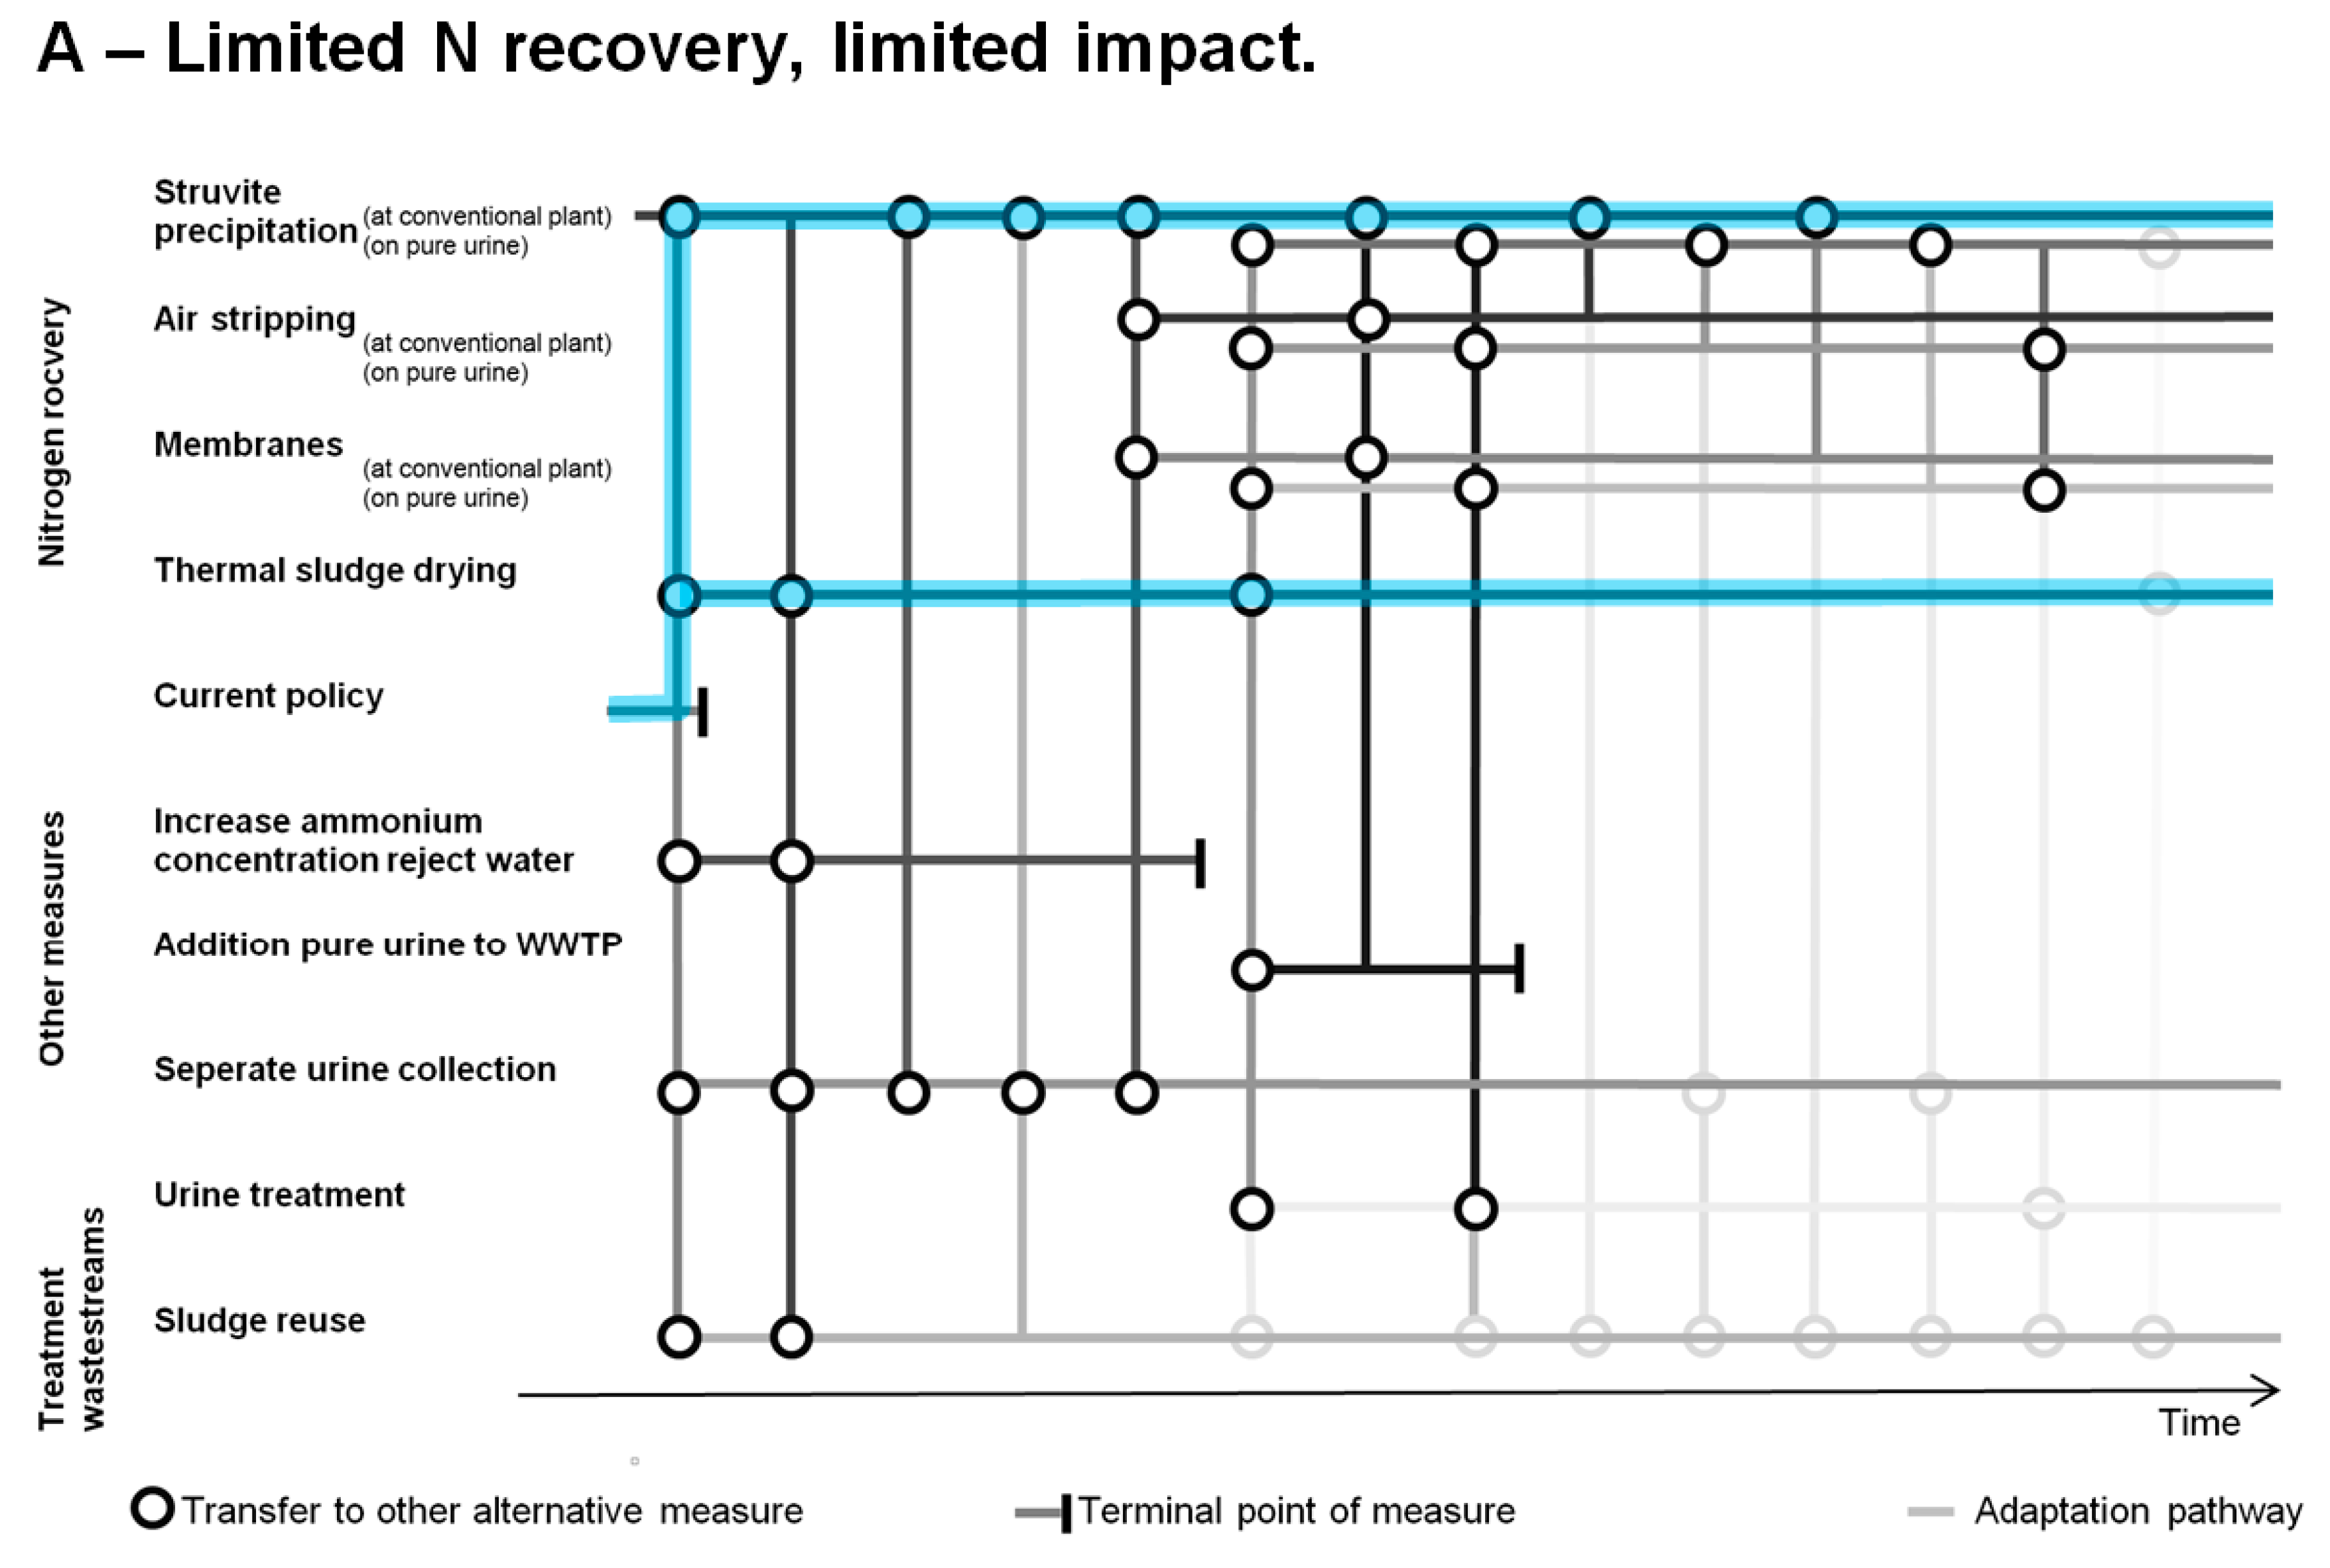
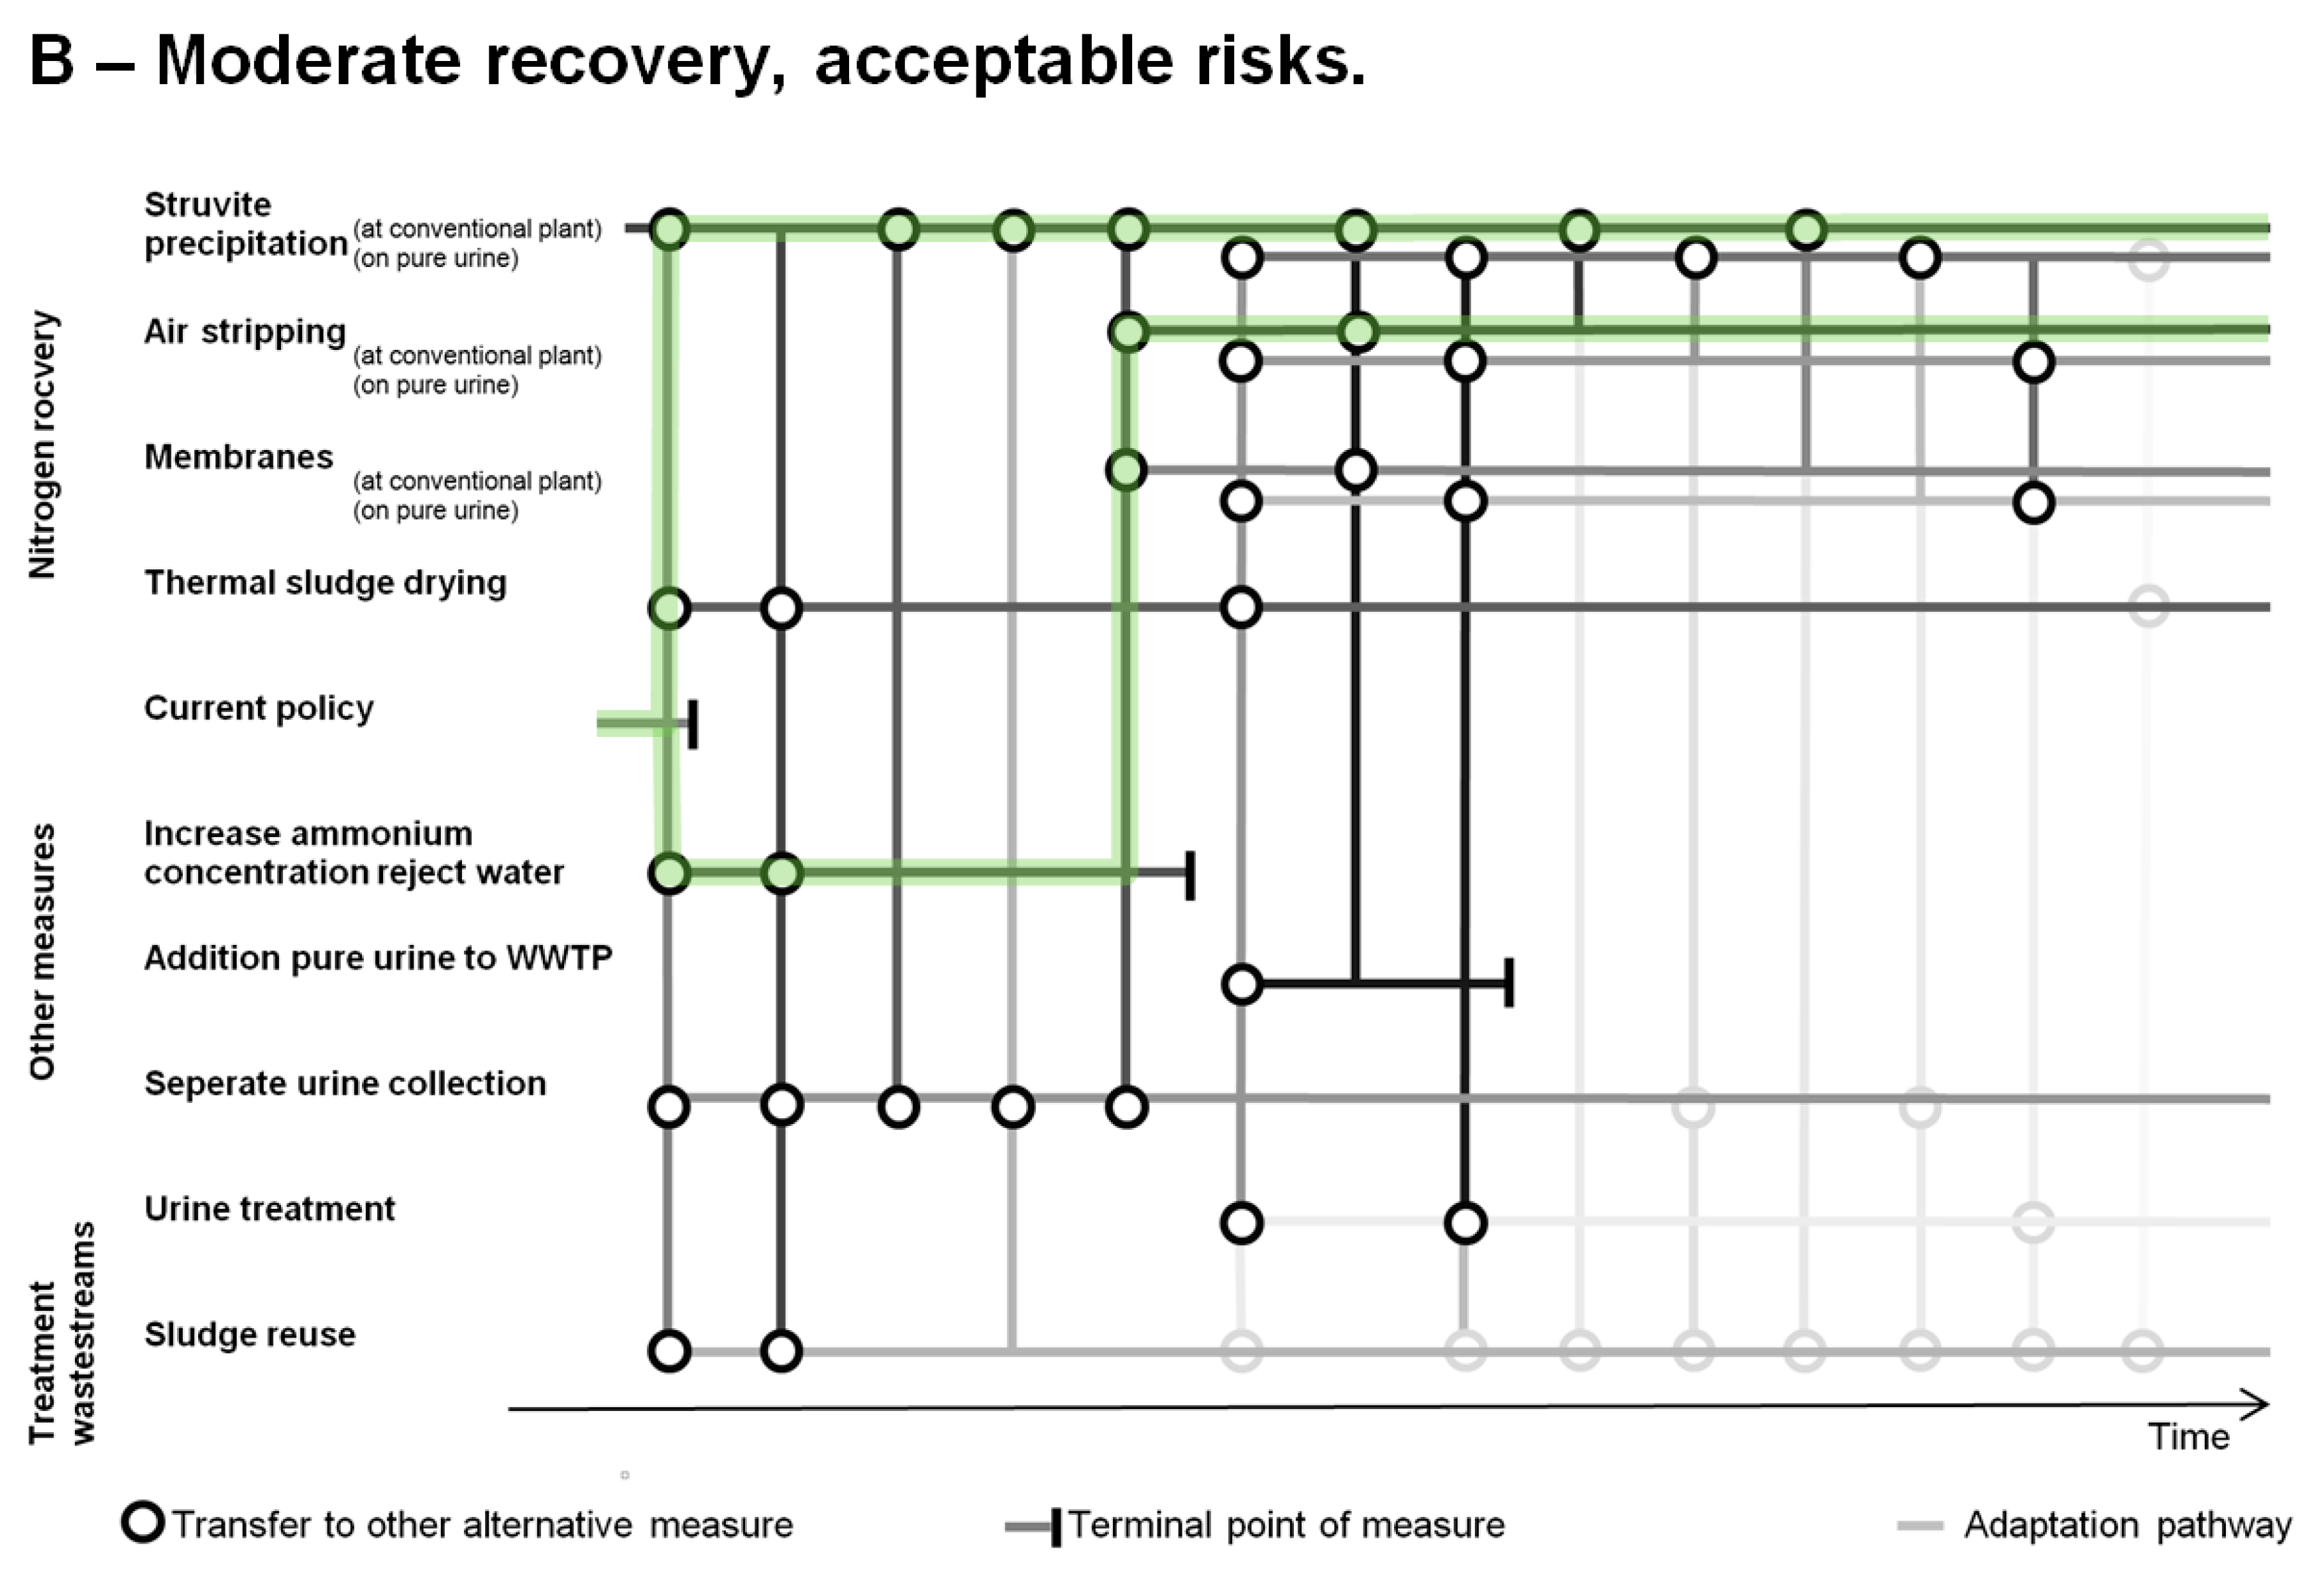
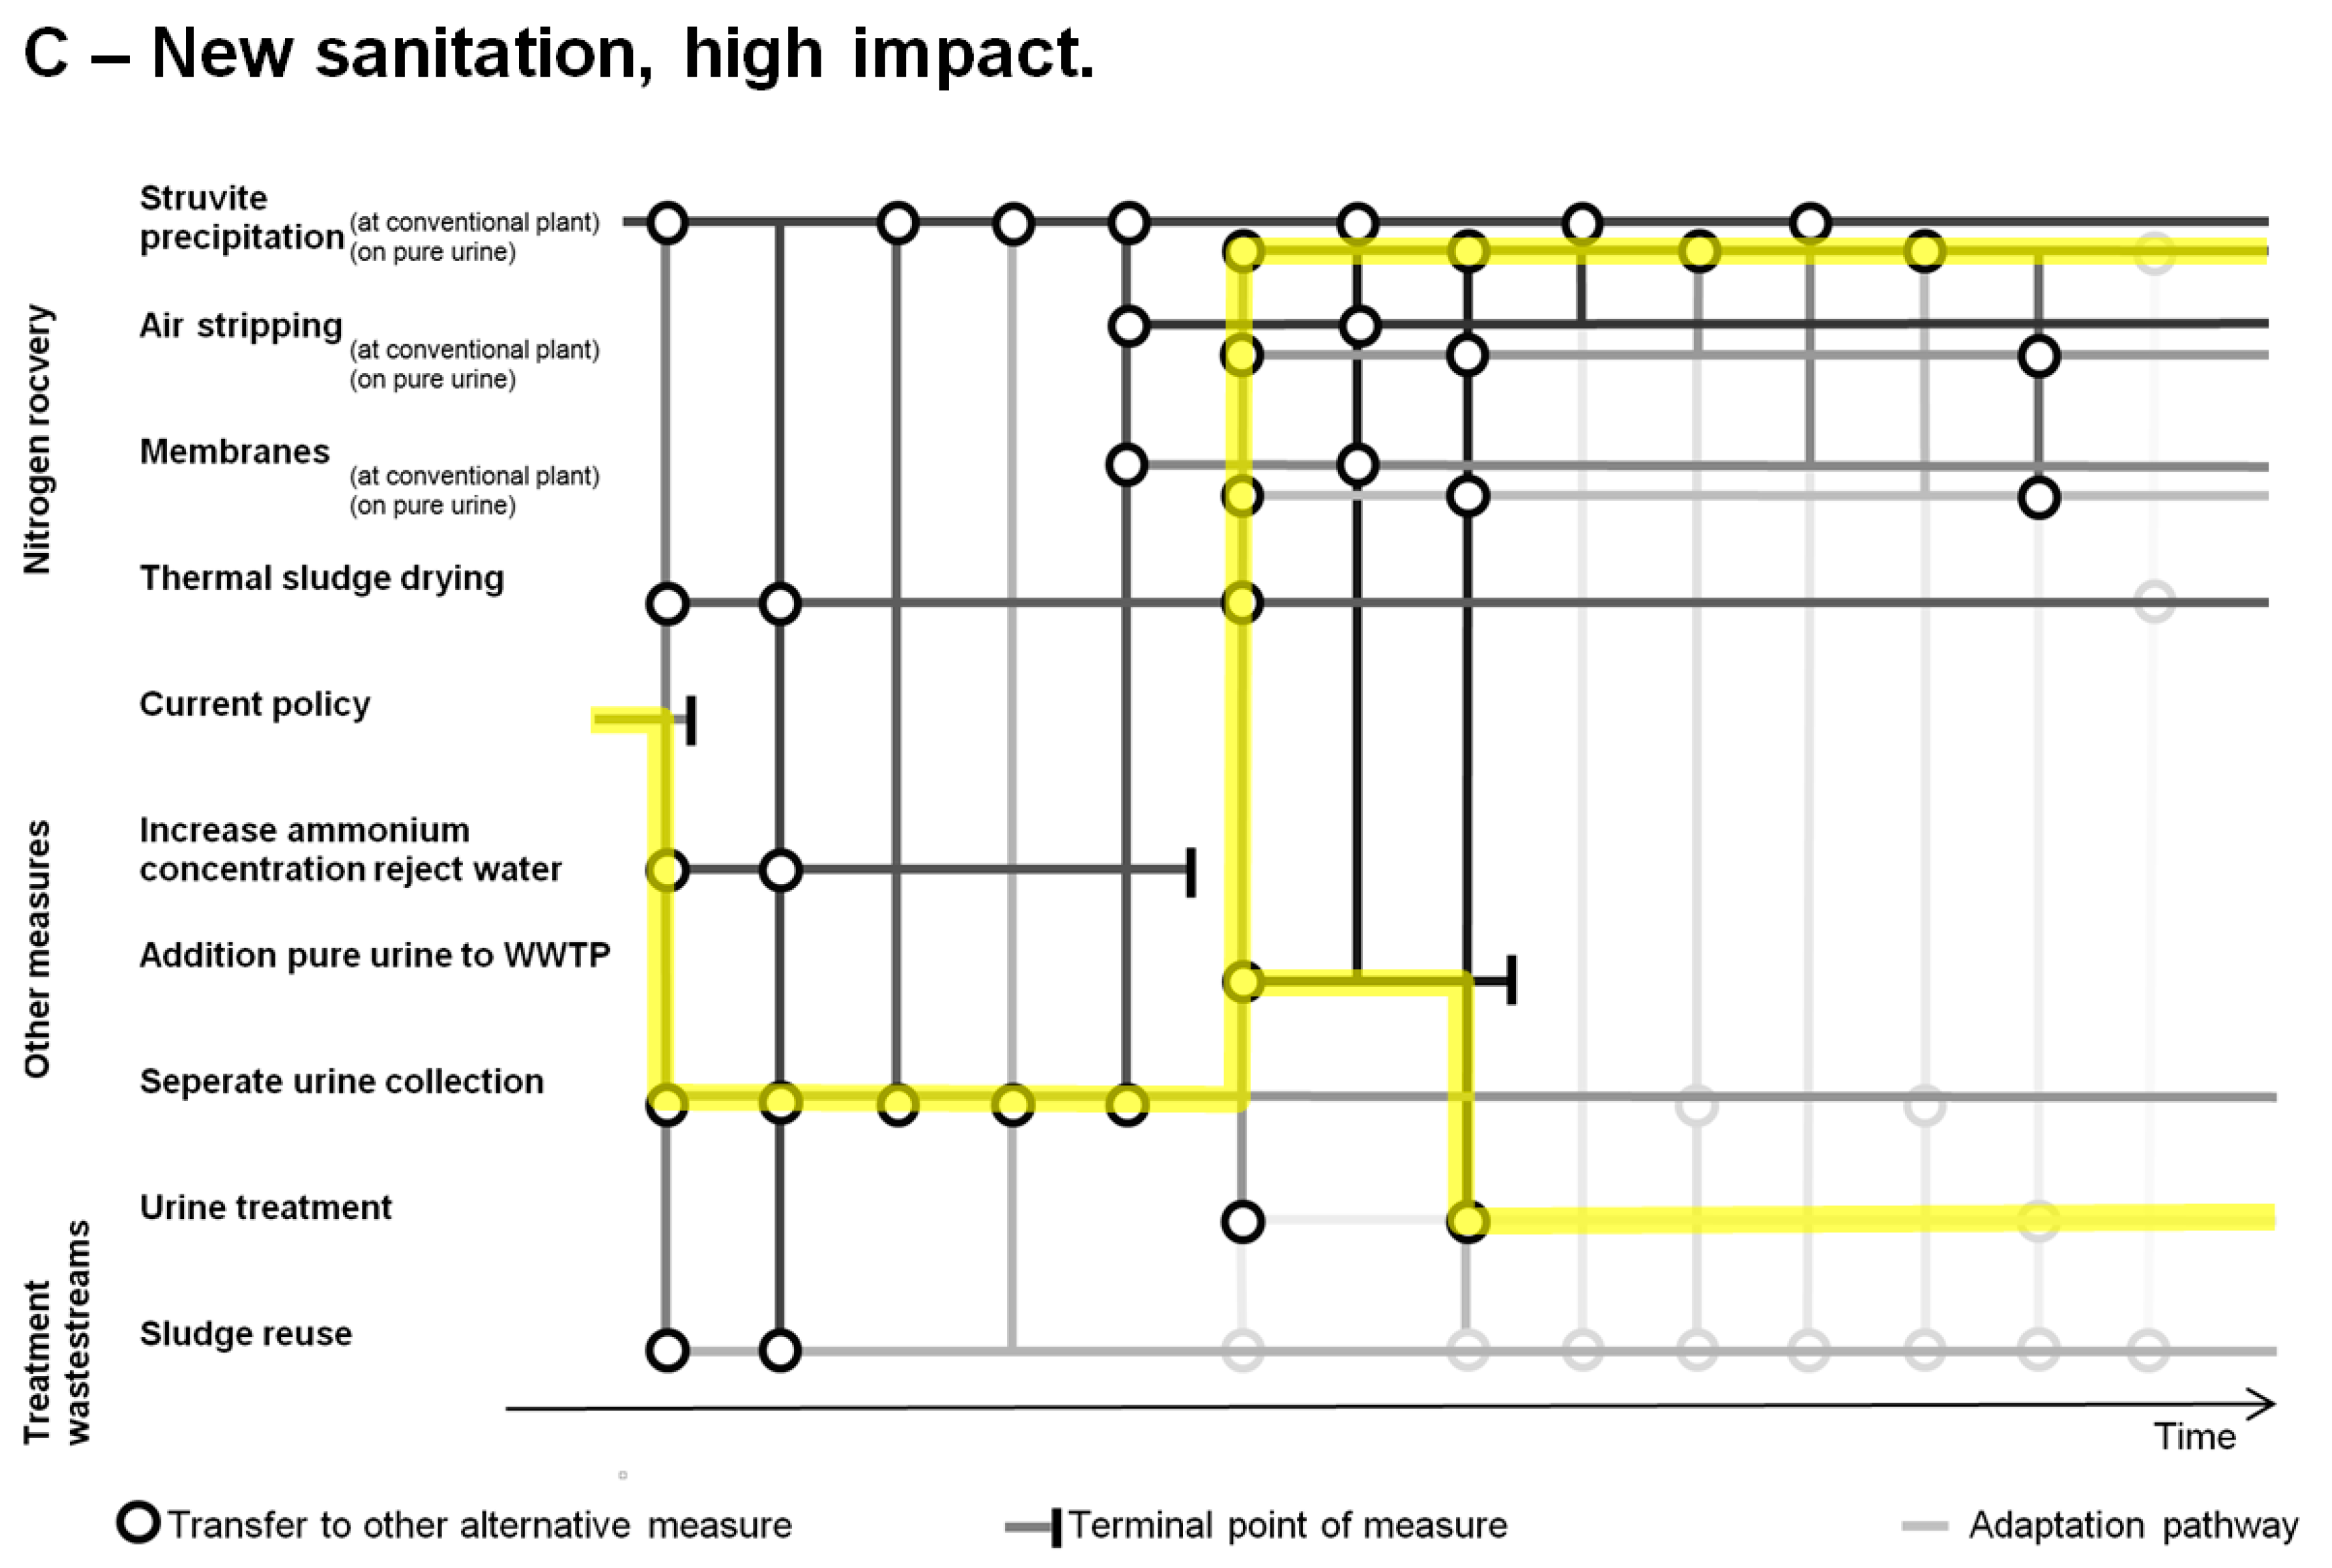
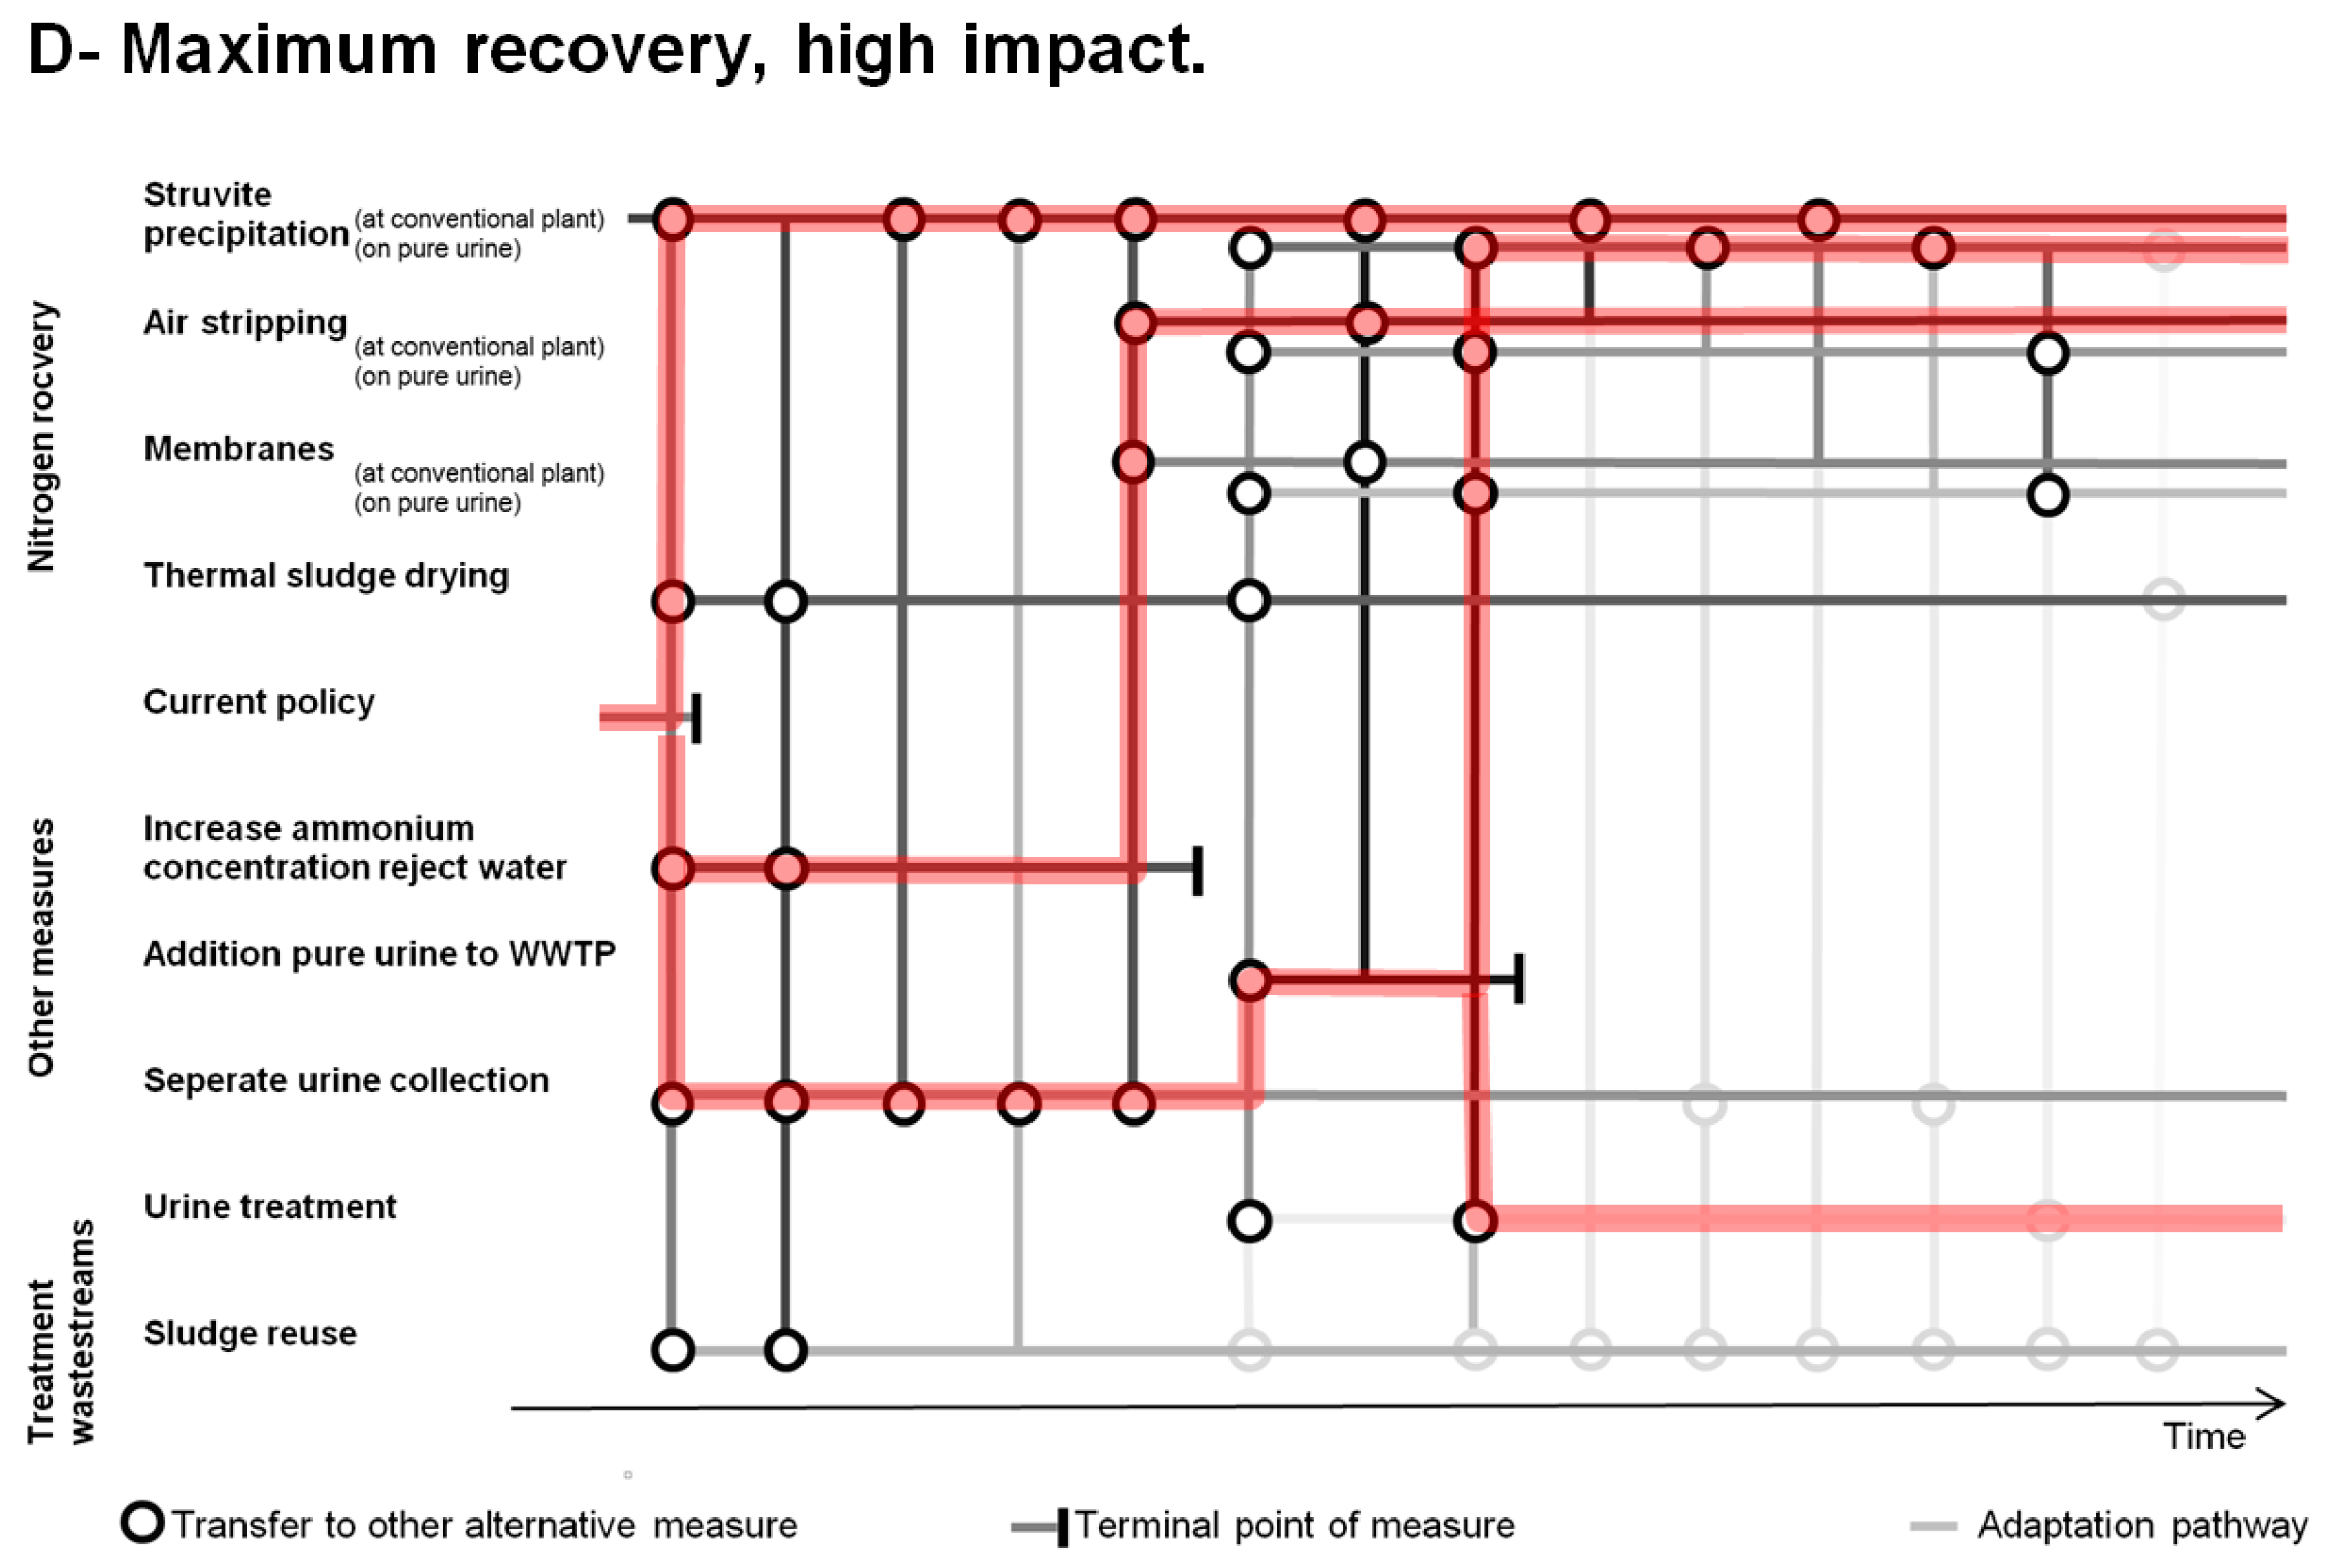
3.4. Adaptation Pathway Maps for Nitrogen Recovery Alternatives

To construct the adaptation pathways, the alternatives were grouped into three specific actions: (1) the recovery of nitrogen; (2) the treatment of specific waste streams; and (3) other alternatives that may affect nitrogen recovery.
The first group contains struvite precipitation, air stripping, the thermal drying of sludge, and hydrophilic and vacuum membranes to recover nitrogen. These technologies can be applied in the wastewater treatment system, but can also applied on pure urine that is separately collected. The treatment of specific streams (group 2) concerns urine treatment to reuse this stream directly (e.g., hydrolysis of urea or stabilization of urine) and sludge reuse. Other alternatives that may affect nitrogen recovery (group 3) are an increase of the nitrogen content in the digester reject water e.g., through thermal hydrolysis pretreatment of sludge [45,46], the addition of urine to the existing wastewater treatment plant, and the separate collection of urine.
The adaptation pathways map, as shown in Figure 6, presents an overview of the relevant pathways to reach the desired shared goal: nitrogen reuse from wastewater. All of the alternatives are represented by a colored horizontal line, and can be considered as ‘different ways leading to Rome’. A vertical line with the same color indicates that after the choice of a specific alternative (with that color), switches are possible to other alternatives via transfer stations. A terminal station represents the moment of an adaptation tipping point: the alternative is effective until this moment. Transfer stations show the available alternatives after this point. Transparent pathways and transfer stations represent unnecessarily complicated ways to achieve a measure.
As an example: if the choice is made for struvite precipitation, the purple line is followed. From this line, a vertical purple line originates. This means that after the choice for struvite precipitation, a switch can be made to the thermal drying of sludge through the transfer station. On the other hand, no switch can be made from thermal sludge drying to struvite precipitation at the same moment in time, in case the initial choice was the thermal drying of sludge: the vertical line has another color. Later in time, the switch is possible (crossing blue lines).
The map shows an indication of time on the X-axis, which is not absolute. It indicates that some alternatives are not directly applicable, and some other measures are needed first. For example, the treatment of urine and/or addition of urine to the existing treatment require new sanitation concepts. The introduction of new sanitation is only possible in new housing estates, and requires time. However, urine can already been collected separately on an ad hoc basis, e.g., at festivals, and this urine can be used in many alternatives. The application of hydrophobic and vacuum membranes require high N concentrations in the digester reject water, so the first step is to develop methods to increase this concentration, and after this development, membranes are applicable.
Although the adaptation pathways map is complex, it is a very helpful tool to determine which pathways have to be followed to realize a specific scenario with a specific goal. Figure 7, Figure 8, Figure 9 and Figure 10 show four specific scenarios that decision makers could follow.
Figure 7 shows the pathways that can be followed when the goal is to recover a limited amount of nitrogen with alternatives that have little impact on the existing wastewater treatment systems, and with a high level of feasibility. Recovery through the thermal drying of sludge and struvite precipitation seems attractive.
Figure 8 shows the pathways that can be followed when the ambition is to recover more nitrogen, and more risks can be accepted. In that case, technologies to increase the concentration of nitrogen in the digester reject water with subsequent air stripping of the digester reject water can be chosen.
In case a high impact is allowed, new sanitation can be chosen. The corresponding pathways are shown in Figure 9.
Finally, the goal can be to recover the maximum amount of nitrogen from wastewater. This scenario with corresponding pathways is presented in Figure 10. Many alternatives have to be introduced in parallel: nitrogen is recovered from pure urine, as well as from the sludge and digester reject water at the wastewater treatment plant.

4. Conclusions

  • Nitrogen recovery from wastewater with the existing wastewater treatment system as a starting point results in only limited improvement in sustainability.
  • Radical changes in wastewater treatment, and the application of several nitrogen recovery technologies in parallel, are required to improve sustainability substantially. The separate collection and treatment of urine is an attractive option, but requires a completely new infrastructure for wastewater collection and wastewater treatment.
  • Nitrogen recovery from wastewater does not negatively affect biogas production from wastewater, phosphorus recovery from wastewater, and cellulose recovery from wastewater.
  • The use of adaptation pathways maps is an attractive method to compare and judge several combinations of nitrogen recovery technologies, especially when different strategies have to be analyzed, and technological and market developments are uncertain.

Supplementary Materials

The following are available online at https://www.mdpi.com/2071-1050/10/12/4605/s1, Supplemental Material 1: Description of technologies; Supplemental Material 2: Evaluation of technologies.

Author Contributions

The work is conceived and supervised by J.P.v.d.H. and O.R. R.D. worked on the literature review, data collection and wrote the original draft as a report. All three authors contributed towards the preparation and review of the manuscript.

Funding

This research received no external funding.

Conflicts of Interest

The authors declare no conflict of interest.

References

  1. Ezeh, A.C.; Bongaarts, J.; Mberu, B. Global population trends and policy options. Lancet 2012, 380, 142–148. [Google Scholar] [CrossRef]
  2. United Nations. World Urbanization Prospects: The 2015 Revison; United Nations: New York, NY, USA, 2015. [Google Scholar]
  3. Alexandratos, N.; Bruinsma, J. World Agriculture towards 2030/2050: The 2012 Revision; ESA Working Paper No. 12-03; FAO: Rome, Italy, 2012; Available online: http://www.fao.org/docrep/016/ap106e/ap106e.pdf (accessed on 14 August 2018).
  4. Sengupta, S.; Nawaz, T.; Beaudry, J. Nitrogen and Phosphorus Recovery from Wastewater. Curr. Pollut. Rep. 2015, 1, 155–166. [Google Scholar] [CrossRef] [Green Version]
  5. Duley, B. Recycling Phosphorus by Recovery from Sewage; Centre Europeen dÉtudes des Polyphosphates: Brussels, Belgium, 1998; pp. 1–17. [Google Scholar]
  6. European Commission. The European Critical Raw Materials Review; MEMO/14/37726/05/2014; European Commission: Brussels, Belgium, 2014; Available online: http://europa.eu/rapid/press-release_MEMO-14-377_en.htm (accessed on 14 August 2018).
  7. Puchongkawarin, C.; Gomez-Mont, C.; Stuckey, D.C.; Chachuat, B. Optimization-based methodology for the development of wastewater facilities for energy and nutrient recovery. Chemosphere 2015, 140, 150–158. [Google Scholar] [CrossRef] [PubMed]
  8. Doyle, J.D.; Parsons, S.A. Struvite formation, control and recovery. Water Res. 2002, 36, 3925–3940. [Google Scholar] [CrossRef]
  9. Garcia-Belinchón, C.; Rieck, T.; Bouchy, L.; Galí, A.; Rougé, P.; Fàbregas, C. Struvite recovery: Pilot-scale results and economic assessment of different scenarios. Water Pract. Technol. 2013, 8, 119–130. [Google Scholar] [CrossRef]
  10. Bergmans, B.J.C.; Veltman, A.M.; van Loosdrecht, M.C.M.; van Lier, J.B.; Rietveld, L.C. Struvite formation for enhanced dewaterability of digested wastewater sludge. Environ. Technol. 2014, 35, 549–555. [Google Scholar] [CrossRef]
  11. van der Hoek, J.P.; Struker, A.; de Danschutter, J.E.M. Amsterdam as a sustainable European metropolis: Integration of water, energy and material flows. Urban Water J. 2017, 14, 61–68. [Google Scholar] [CrossRef]
  12. Erisman, J.W.; Sutton, M.A.; Galloway, J.; Klimont, Z.; Winiwarter, W. How a century of ammonia synthesis changed the world. Nat. Geosci. 2008, 1, 636–639. [Google Scholar] [CrossRef]
  13. Stein, L.Y.; Klotz, M.G. The nitrogen cycle. Curr. Biol. 2016, 26, R94–R98. [Google Scholar] [CrossRef]
  14. Paredes, D.; Kuschk, P.; Mbwette, T.S.A.; Stange, F.; Müller, R.; Köser, H. New aspects of microbial nitrogen transformations in the context of wastewater treatment—A review. Eng. Life Sci. 2007, 7, 13–25. [Google Scholar] [CrossRef]
  15. Kampschreur, M.J.; Temmink, H.; Kleerebezen, R.; Jetten, M.S.M.; van Loosdrecht, M.C.M. Nitrous oxide emission during wastewater treatment. Water Res. 2009, 43, 4093–4103. [Google Scholar] [CrossRef] [PubMed]
  16. Diamantis, V.I.; Anagnostopoulos, K.; Melidis, P.; Ntougias, S.; Aivasidis, A. Intermittent operation of low pressure UF membranes for sewage reuse at household level. Water Sci. Technol. 2013, 68, 799–806. [Google Scholar] [CrossRef] [PubMed]
  17. Membranes for Energy and Water Recovery. The MEMORY Project: Co-Funded by the European Community under the Life+ Financial Instrument with the Grant Agreement n.LIFE13ENV/ES/001353. Available online: www.life-memory.eu (accessed on 14 November 2018).
  18. Wang, X.; McCarty, P.L.; Liu, J.; Ren, N.-Q.; Lee, D.-J.; Yu, H.-Q.; Qian, J. Probalistic evaluation of integrating resource recovery into wastewater treatment to improve environmental sustainability. Proc. Natl. Acad. Sci. USA 2015, 112, 1630–1635. [Google Scholar] [CrossRef] [PubMed]
  19. Ruiken, C.J.; Breurer, G.; Klaversma, E.; Santiago, T.; van Loosdrecht, M.C.M. Sieving wastewater cellulose recovery, economic and energetic evaluation. Water Res. 2013, 47, 43–48. [Google Scholar] [CrossRef] [PubMed]
  20. Tamis, J.; Marang, L.; Jiang, Y.; van Loosdrecht, M.C.M.; Kleerebezem, R. Modeling PHA-producing microbial enrichment cultures—Towards a generalized model with predictive power. New Biotechnol. 2014, 31, 324–334. [Google Scholar] [CrossRef] [PubMed]
  21. Kleerebezem, R.; van Loosdrecht, M.C.M. Mixed culture biotechnology for bioengineering production. Curr. Opin. Biotechnol. 2007, 18, 207–212. [Google Scholar] [CrossRef] [PubMed]
  22. Matassa, S.; Verstraete, W.; Pikaar, I.; Boon, N. Autotrophic nitrogen assimilation and carbon capture for microbial protein production by a novel enrichment of hydrogen-oxidizing bacteria. Water Res. 2016, 101, 137–146. [Google Scholar] [CrossRef]
  23. van Leeuwen, K.; de Vries, E.; Koop, S.; Roest, K. The Energy & Raw Materials Factory: Role and Potential Contribution to the Circular Economy of the Netherlands. Environ. Manag. 2018, 61, 786–795. [Google Scholar] [Green Version]
  24. van der Hoek, J.P.; de Fooij, H.; Struker, A. Wastewater as a resource: Strategies to recover resources from Amsterdam’s wastewater. Resour. Conserv. Recycl. 2016, 113, 53–56. [Google Scholar] [CrossRef]
  25. Waternet. Technical Year Report Wastewater Treatment 2017; Internal Report; Waternet: Amsterdam, The Netherlands, 2018. (In Dutch) [Google Scholar]
  26. Maurer, M.; Schwegler, P.; Larsen, T.A. Nutrients in urine: Energetic aspects of the removal and recovery. Water Sci. Technol. 2003, 48, 37–46. [Google Scholar] [CrossRef]
  27. Mulder, A. The quest for sustainable nitrogen removal technologies. Water Sci. Technol. 2003, 48, 67–75. [Google Scholar] [CrossRef] [PubMed] [Green Version]
  28. Lin, Y.; Guo, M.; Shah, N.; Stuckey, D.C. Economic and environmental evaluation of nitrogen removal and recovery methods from wastewater. Bioresour. Technol. 2016, 215, 227–238. [Google Scholar] [CrossRef] [PubMed]
  29. van der Roest, H.; van Loosdrecht, M.C.M.; Langkamp, E.J.; Uijterlinde, C. Recovery and reuse of Bio-ALE from granular Nereda sludge. Water 2015, 21, 48. [Google Scholar]
  30. Haasnoot, M.; Kwakkel, J.H.; Walker, W.E.; ter Maat, J. Dynamic adaptive policy pathways: A method for crafting robust decisions for a deeply uncertain world. Glob. Environ. Chang. 2013, 23, 485–498. [Google Scholar] [CrossRef] [Green Version]
  31. de Fooij, H. Wastewater as a Resource—Strategies to Recover Resources from Amsterdam’s Wastewater. Master’s Thesis, University of Twente, Enschede, The Netherlands, 25 January 2015. [Google Scholar]
  32. Stowa. Treatment of Urine; Report Stowa 2010-W02; Foundation for Applied Water Research: Amersfoort, The Netherlands, 2010. (In Dutch) [Google Scholar]
  33. Rose, C.; Parker, A.; Jefferson, B.; Cartmell, E. The Characterization of Feces and Urine: A Review of the Literature to Inform Advanced Treatment Technology. Crit. Rev. Environ. Sci. Technol. 2015, 45, 1827–1879. [Google Scholar] [CrossRef] [PubMed] [Green Version]
  34. Stowa. Separate Urine Collection and Treatment. Options for Sustainable Wastewater Treatment Systems and Mineral Recovery; Report Stowa 2001-39; Foundation for Applied Water Research: Amersfoort, The Netherlands, 2001. [Google Scholar]
  35. Stowa. Options for Separate Treatment of Urine; Report Stowa 2005-11; Foundation for Applied Water Research: Amersfoort, The Netherlands, 2005. [Google Scholar]
  36. Maurer, M.; Muncke, J.; Larsen, T.A. Technologies for nitrogen recovery and reuse. In Water Recycling and Resource Recovery in Industry; Lens, P., Pol, L.H., Wilderer, P.A., Asano, T., Eds.; IWA Publishing: London, UK, 2002; pp. 491–510. [Google Scholar]
  37. Stowa. Explorative Research on Innovative Nitrogen Recovery; Report 2012-51; Foundation for Applied Water Research: Amersfoort, The Netherlands, 2012. [Google Scholar]
  38. Capodaglio, A.G.; Hlavínek, P.; Raboni, M. Physico-chemical technologies for nitrogen removal from wastewater: A review. Rev. Ambient. Agua 2015, 10, 481–489. [Google Scholar]
  39. Horttanainen, M.; Deviatkin, I.; Havukainen, J. Nitrogen release from mechanically dewatered sewage sludge during thermal drying and potential for recovery. J. Clean. Prod. 2017, 142, 1819–1826. [Google Scholar] [CrossRef]
  40. Kunz, A.; Mukhtar, S. Hydrophobic membrane technology for ammonia extraction from wastewaters. J. Braz. Assoc. Agric. Eng. 2016, 36, 377–386. [Google Scholar] [CrossRef]
  41. EL-Bourawi, M.S.; Khayet, M.; Ra, M.; Ding, Z.; Li, Z.; Zhang, X. Application of vacuum membrane distillation for ammonia removal. J. Membr. Sci. 2007, 301, 200–209. [Google Scholar] [CrossRef]
  42. Maurer, M.; Pronk, W.; Larsen, T.A. Treatment processes for source-separated urine. Water Res. 2006, 40, 3151–3166. [Google Scholar] [CrossRef]
  43. McCarty, P.L.; Bae, J.; Kim, J. Domestic wastewater treatment as a net energy producer—Can this be achieved? Environ. Sci. Technol. 2011, 45, 7100–7106. [Google Scholar] [CrossRef] [PubMed]
  44. Regelink, I.C.; Ehlert, P.A.I.; Römkens, P.F.A.M. Perspectives of the Supply of (Phosphorus Reduced) Wastewater Treatment Sludge to the Agricultural Sector; Report 2819; Wageningen Environmental Research: Wageningen, The Netherlands, 2017. (In Dutch) [Google Scholar]
  45. van Dijk, L.; de Man, A. Continuous thermal sludge hydrolysis: Lower costs and more energy at the wastewater treatment plant. J. H2O 2010, 43, 8–9. (In Dutch) [Google Scholar]
  46. Phothilangka, P.; Schoen, M.A.; Huber, M.; Luchetta, P.; Winkler, T.; Wett, B. Prediction of thermal hydrolysis pretreatment on anaerobic digestion of waste activated sludge. Water Sci. Technol. 2008, 58, 1467–1473. [Google Scholar] [CrossRef] [PubMed]
Figure 1. Wastewater treatment plant Amsterdam-West.
Sustainability 10 04605 g001
Figure 2. The nitrogen cycles. (1) Aerobic ammonium oxidation, (2) aerobic nitrite oxidation, (3) nitrate reduction to nitrite, (4) nitrite reduction to nitric oxide, (5) nitric oxide reduction to nitrous oxide, (6) nitrous oxide reduction to dinitrogen gas, (7) nitrogen fixation (not relevant in most wastewater treatment plants), (8) ammonium oxidation with nitrite (anammox). Complete nitrification comprises steps 1 and 2, complete denitrification comprises steps 3–6 (adapted from Kampschreur et al. [15]).
Sustainability 10 04605 g002
Figure 3. The water balance of the wastewater treatment plant (WWTP) Amsterdam-West (volume flows in 106 m3/year).
Sustainability 10 04605 g003
Figure 4. The nitrogen balance of the WWTP Amsterdam-West (mass flow in tons/year).
Sustainability 10 04605 g004
Figure 5. Overview of strategies with related technologies for nitrogen recovery and reuse.
Sustainability 10 04605 g005
Figure 6. Adaptation pathways map of alternatives for nitrogen recovery from wastewater.
Sustainability 10 04605 g006
Figure 7. Adaptation pathways for nitrogen recovery from wastewater for scenario A: limited N-recovery with limited impact.
Sustainability 10 04605 g007
Figure 8. Adaptation pathways for nitrogen recovery from wastewater for scenario B: moderate N-recovery with acceptable risks.
Sustainability 10 04605 g008
Figure 9. Adaptation pathways for nitrogen recovery from wastewater for scenario C: new sanitation with high impact.
Sustainability 10 04605 g009
Figure 10. Adaptation pathways for nitrogen recovery from wastewater for scenario D: maximum N-recovery with high impact.
Sustainability 10 04605 g010
Table 1. Preselection of alternatives on four criteria.
SustainabilityRecovery of Nitrogen in an Applicable FormMaturity of the AlternativeConcentration Range
++Specific product++Mature technology
+Lower energy use and lower N2O emissions+Concentrated stream separated from the wastewater+Available on the market+Within the range of 60–8800 mg/L and capable of treating large quantities
+−Lower energy use or lower N2O emissions+−Concentrated wastewater stream+−Successful pilot plant
No lower energy use, no lower N2O emissionsTransfer to N2 gas in combination with energy productionSuccessful proof of conceptOutside the range of 60–8800 mg/L and/or not capable of treating large quantities
−−Transfer to N2 gas−−In conceptual phase
Note: ++ very positive score; + positive score; +− neutral score; − negative score; −− very negative score
Table 2. Nitrogen concentration and relative nitrogen mass in four specific flows.
FlowConcentration (mg N/L)Relative Contribution to Total N Inflow (%)
Urine880067
Digester reject water103027
WWTP influent6184
WWTP effluent8.111
Table 3. Selection of technologies for nitrogen recovery and reuse.
TechnologySustainabilityRecovery of Nitrogen in an Applicable FormMaturityConcentration RangeSelected for Further Evaluation
Membrane filtration+−+−+++No
Capacitive deionization+−+No
Struvite precipitation+++++Yes
Steam stripping+++-No
Air stripping++++Yes
Vacuum distillation+++No
Thermal sludge drying with subsequent air treatment+++++Yes
Digester stripping+++No
Microwave stripping++++No
Electrodialysis++−+No
Microbial electrolysis+++No
Microbial fuel cell+++No
Hydrophobic membranes++++Yes
Vacuum membranes++++Yes
Ion exchange+++No
Urine treatment+−++++Yes
Sludge reuse+++−+Yes
Note: ++ very positive score; + positive score; +− neutral score; − negative score; −− very negative score
Table 4. Recovery of nitrogen at WWTP Amsterdam-West with the selected technologies.
TechnologyApplication at StreamProcess ConditionsN Recovery
Mass (tons)% of Total N Flow
Struvite recoveryDigested sludgeProduction of 900 ton struvite with 5.7% N51.31.1
Air strippingDigester reject water90% efficiency112824
Thermal drying of sludgeDigested sludge531 ton N in sludge, 19% as ammonia, efficiency 99%99.92.1
Hydrophobic membranesDigester reject water75% efficiency94020
Vacuum membranesDigester reject water75% efficiency94020
Urine treatmentIncoming urine90% recovery283160
Sludge reuseDigested sewage sludge100% application53111
Table 5. Effect of selected nitrogen recovery technologies on biogas production, phosphorus recovery, and cellulose recovery from the Dutch program “The Energy and Raw Materials Factory”.
N-Recovery TechnologyEffect on
Biogas ProductionPhosphorus RecoveryCellulose Recovery
Struvite precipitationNitrogen is recovered as struvite from the sludge after digestion, and does not affect the digestion of sludge and biogas productionNitrogen and phosphorus are simultaneously removed as struvite, no interferenceNitrogen is recovered as struvite from the digested sludge and does not affect cellulose recovery as pretreatment
Air strippingAir stripping is applied on the digester reject water, and does not affect the digestion of sludge and biogas productionAir stripping is applied on the digester reject water and does not affect the recovery of phosphorus as struvite from the digested sludgeAir stripping is applied on the digester reject water and does not affect cellulose recovery as pretreatment
Thermal drying of sludgeThermal drying of sludge is applied after sludge digestion, and does not affect biogas productionThermal drying of sludge is applied after struvite recovery and does not affect phosphorus recoveryThermal drying of sludge takes place at the end of the treatment process and does not affect cellulose recovery as pretreatment
Hydrophobic membranes and vacuum membranesHydrophobic and vacuum membranes are applied on the digester reject water, and do not affect the digestion of sludge and biogas productionHydrophobic and vacuum membranes are applied on the digester reject water and do not affect the recovery of phosphorus as struvite from the digested sludgeHydrophobic membranes and vacuum membranes are applied on the digester reject water and do not affect cellulose recovery as pretreatment
Urine treatmentUrine hardly contains any organic material; separate urine collection and treatment does not affect biogas productionThe total nitrogen load to the wastewater treatment system is that high (urine contributes for 80% to nitrogen mass in the influent, still 20% in other incoming flows) that the separate collection and treatment of urine does not affect phosphorus recovery through struvite precipitationUrine contains no cellulose, so the separate collection and treatment of urine does not affect cellulose recovery
Sludge reuseIn case the aim is to use sludge with a high organic carbon content, sludge digestion is not preferred, so it does affect biogas productionSludge is used as a residual product, so it does not affect preceding phosphorus recoverySludge is used as a residual product so it does not affect cellulose recovery as pretreatment
Table 6. Effects of biogas production, phosphorus recovery, and cellulose recovery from the Dutch program “The Energy and Raw Materials Factory” (TERMF) on selected nitrogen recovery technologies.
TERMF RecoveryEffect on N-Recovery Technology
Struvite PrecipitationAir StrippingThermal Drying of SludgeHydrophobic and Vacuum MembranesUrine TreatmentSludge Reuse
Biogas productionThrough the digestion of sludge, P and N are released in high concentrations, which is advantageous for struvite precipitationThrough the digestion of sludge, N is released in high concentrations as ammonium/ammonia, which is advantageous for air strippingThrough the digestion of sludge, N is released in high concentrations as ammonium/ammonia, which is advantageous for recovery during the drying of sludgeThrough the digestion of sludge, N is released in high concentrations as ammonium/ammonia, which is advantageous for recovery during membrane filtrationBiogas is produced during sludge digestion and does not affect the separate collection and treatment of urine as the first step in the wastewater treatment systemSludge digestion for biogas production reduces the amount of sludge and transfers nitrogen to the digester reject water, resulting in a lower N-content of the sludge
Phosphorus recoveryNitrogen recovery and phosphorus are simultaneously removed as struvite, no interferencePhosphorus recovery as struvite precipitation is applied after sludge digestion, and thus does not affect N-recovery through the air stripping of digester reject waterPhosphorus recovery through struvite precipitation lowers both N and P-concentrations in the sludge, so the N-recovery through sludge drying after struvite precipitation is lowerPhosphorus recovery as struvite precipitation is applied after sludge digestion, and thus does not affect N-recovery from digester reject water through membrane filtrationPhosphorus is recovered from the digested sludge, and does not affect the separate collection and treatment of urine as the first step in the wastewater treatment systemPhosphorus recovery through struvite precipitation lowers the N- and P-content of the sludge, but a low P-content may be attractive to market the product in agriculture
Cellulose recoveryN and P are not recovered through cellulose recovery, so there is no effect on N recovery through struvite precipitationN is not recovered through cellulose recovery, so there is no effect on N-recovery through the air stripping of digester reject waterThe total amount of organic material that is introduced in the wastewater treatment system is reduced, so the amount of sludge is reduced. However, the N-mass in the sludge is not reducedN is not recovered through cellulose recovery, so no effect on N-recovery through the membrane filtration of digester reject waterUrine is collected and treated prior to cellulose recovery, so no effectThe total amount of organic material that is introduced in the subsequent wastewater treatment system after cellulose recovery is reduced, so the amount of sludge is reduced. However, the N-mass in the sludge is not reduced

