Article

Forest Landscape Change and Preliminary Study on Its Driving Forces in Ślęża Landscape Park (Southwestern Poland) in 1883–2013

1
The Faculty of Environmental Engineering and Geodesy, Department of Spatial Economy, Wroclaw University of Environmental and Life Sciences, 50-375 Wroclaw, Poland
2
The Faculty of Environmental Engineering and Spatial Management, Institute of Land Improvement, Environmental Development and Geodesy, Poznan University of Life Sciences, 60-637 Poznan, Poland
*
Author to whom correspondence should be addressed.
Sustainability 2018, 10(12), 4526; https://doi.org/10.3390/su10124526
Submission received: 11 October 2018 / Revised: 26 November 2018 / Accepted: 29 November 2018 / Published: 30 November 2018

Abstract

:
Changes in forest landscapes have been connected with human activity for centuries and can be considered one of the main driving forces of change from a global perspective. The spatial distribution of forests changes along with the geopolitical situation, demographic changes, intensification of agriculture, urbanization, or changes in land use policy. However, due to the limited availability of historical data, the driving forces of changes in forest landscapes are most often considered in relation to recent decades, without taking long-term analyses into account. The aim of this paper is to determine the level and types of landscape changes and make preliminary study on natural and socio-economic factors on changes in forest landscapes within the protected area, Ślęża Landscape Park, and its buffer zone using long-term analyses covering a period of 140 years (1883–2013). A comparison of historical and current maps and demographic data related to three consecutive periods of time as well as natural and location factors by using the ArcGIS software allows the selected driving forces of forest landscape transformations to be analyzed. We took into account natural factors such as the elevation, slope, and exposure of the hillside and socio-economic drivers like population changes, distances to centers of municipalities, main roads, and built-up areas.

1. Introduction

On a global scale, human beings have been the main driving force for the transformation of the Earth’s surface for several hundred years [1]. People have significantly influenced landscape changes. Transformations have occurred to meet the needs of society and its individual units. Today, we can see the effects of many historical changes in the landscape. Over the last few decades, these changes have intensified due to strong socio-economic changes, including changes in agriculture, industry, or transport [2]. These transformations are particularly evident in the countries in Central and Eastern Europe, where profound political and socio-economic changes have taken place [3]. The significance of the changes that followed the fall of communism have been particularly emphasized [4,5]. Changes resulting from the enlargement of the European Union in 2004 have also been analyzed [6]. Both traditional agricultural landscapes [7,8,9], urban and industrial [10,11,12,13], have undergone strong transformations, as well as landscapes with high value for tourists [14,15]. Changes in forest landscapes and those in the immediate vicinities of forests [16,17,18,19] are particularly noticeable. The results of palaeoenvironmental studies [20], used also as primary source for the reconstruction of forest cover [21], have more and more often become the starting point for research on long-term landscape changes. So far, in many cases, landscape change studies have been limited only to identifying the sizes and types of transformations, ignoring the identification of factors that could have a significant impact on the landscape. Meanwhile, understanding the phenomena that lie behind a specific transformation is crucial in the context of conservations and sustainable landscape management [22]. Understanding the cause and effect relationship is one of the ideas on which the analysis of driving forces of landscape changes is based [23]. The knowledge of the causes allow the main driving forces and categories of phenomena that have helped to shape the landscape to be classified. The reason for many changes, especially in suburban areas [24,25], is urbanization, and this is causing more and more intensive transformations. As the result of this, the percentage of urbanized landscapes is increasing at the expense of natural and semi-natural landscapes. Other causes of changes in landscapes include the intensification of agriculture, the succession of forests in abandoned areas, increased demand for service areas, the development of renewable energy sources, and the creation of protected areas [26]. The land use policy of local authorities is also a frequent driving force of landscape change [27]. This often leads to the degradation of historically shaped landscapes that are part of the local cultural heritage which should be protected elements in the land use policy [28].
The acceleration of landscape changes in recent decades has also been noticed by the Council of Europe. To limit negative changes, the European Landscape Convention was adopted in 2000 [29]. The signatories of this convention, including Poland, have recognized the landscape as being an important part of quality of life and a key element of the well-being of society of which every person has the responsibility to protect, shape, and plan for. However, the Polish government has not yet implemented the provisions of the convention to Polish law despite the obligations resulting from the ratification in 2004. That is why no landscape assessment on a whole country scale has been done, and thus, it has not been possible to identify the forces and pressures that have caused the transformations as well as their levels of intensity. Methods for determination of the landscape change index have been developed [30]. However, these studies have been conducted locally and not in the context of the whole country. Knowledge in this field is particularly important where the purposes and functions of particular areas change frequently as the result of adapting space to current social and economic needs. Areas of tourist investment are particularly located within or close to areas that are attractive in terms of aesthetic appeal and that are often protected by one of the landscape protection forms. An example of this type of area in Poland is landscape parks—areas with high landscape value that cover both forest areas as well as areas of arable land, rural settlements, and sometimes, also small towns. In the context of this form of protection, the necessity of monitoring and planning changes in the landscape has been emphasized [31,32].
When conducting research on landscape changes, we should always be aware that the condition of the landscape which we are currently observing is a physiognomic reflection and synthesis of changes caused by a number of different factors. This has become the basis for the concept of the driving forces for landscape change [23,33], also known as drivers [34] or key processes [35]. These are the factors that have caused noticeable changes in the landscape and have significantly influenced the direction of its further transformation. Driving forces are divided into five basic groups: socio-economic, political, technological, cultural, and natural/spatial [23]. Analyses of the causes of changes in the landscape may concern different spatial scales and different time periods. The results of analyses often include the identification of the main actors of change (people/institutions) which have had a decisive influence on the change of landscape [36,37]. This research trend has been considered in many European countries. Analyses of driving forces have concerned, in particular, landscapes in Switzerland [38], Germany [39], Slovakia [40,41], the Mediterranean landscapes [42,43], and across Europe [44]. In the context of forest areas, analyses of driving forces have usually also included entire countries or regions [45,46,47]. Smaller areas have rarely been analyzed [48]. Although, in previous years, interest in research on the driving forces of landscape changes has increased significantly, there is still a lack of examples of this type of research in some European Union countries, including Poland [49]. The case study of the Ślęża Landscape Park and its buffer zone, where the protected landscape and important elements of the Lower Silesia’s cultural heritage in Poland have been analyzed, will supplement the knowledge of the character of forest landscape change in this part of Europe which has not been recognized well in this aspect. Preliminary results of driving forces studies will give a good basis for further analysis of cause and result relationship between identified factors and observed phenomena for a full understanding of the dynamics of changes.
To meet the needs of the research, we assumed that forest landscape is a landscape perceived by people to be a mosaic of various land cover types dominated by forests and which provide goods and services related to forests. The main goal of our research was to determine the level and types of landscape changes and make preliminary study on the dependencies between basic driving forces—natural and socio-economic—and changes in forest landscapes over a long-term period of about 140 years (1883–2013). To simplify the way that the boundaries of forest landscapes were defined, we chose the Ślęża Landscape Park and its buffer zone as a case study area. We assumed that goods and services related to the forest landscape of the Ślęża Massif were limited to the surrounding protected area and the buffer zone. However, we would like to stress that the manuscript is mainly focused on spatiotemporal analyses of forest landscape change which have a great importance for analysis of its driving forces. The results of preliminary study on driving forces of forest landscape change presented in this manuscript is the first study related to area of research and gives a good basis for further studies on the correlation of each factor with the observed types of changes in forest landscapes. Analyses of other possible driving forces like land use policies and local legal regulations are planned in the second stage of research.
In order to achieve our intended goal, we performed comparative analyses of land cover maps, demographic and location data available in the analyzed periods, together with a summary of historical events, which we supplemented with an analysis of natural factors in ArcGIS software. To identify and understand the level and character of forest landscape changes and its driving forces in the Ślęża Landscape Park and its buffer zone, we tried to answer four questions:
  • What have the quantitative changes within the forest and non-forest landscapes over a period of 140 years, divided into three periods of time, covering approximately 40–50 years, been?
  • In which time period was the landscape change index (LCI), which determines the level of change in landscapes, more intensive? Is it possible to calculate the index based on historical data?
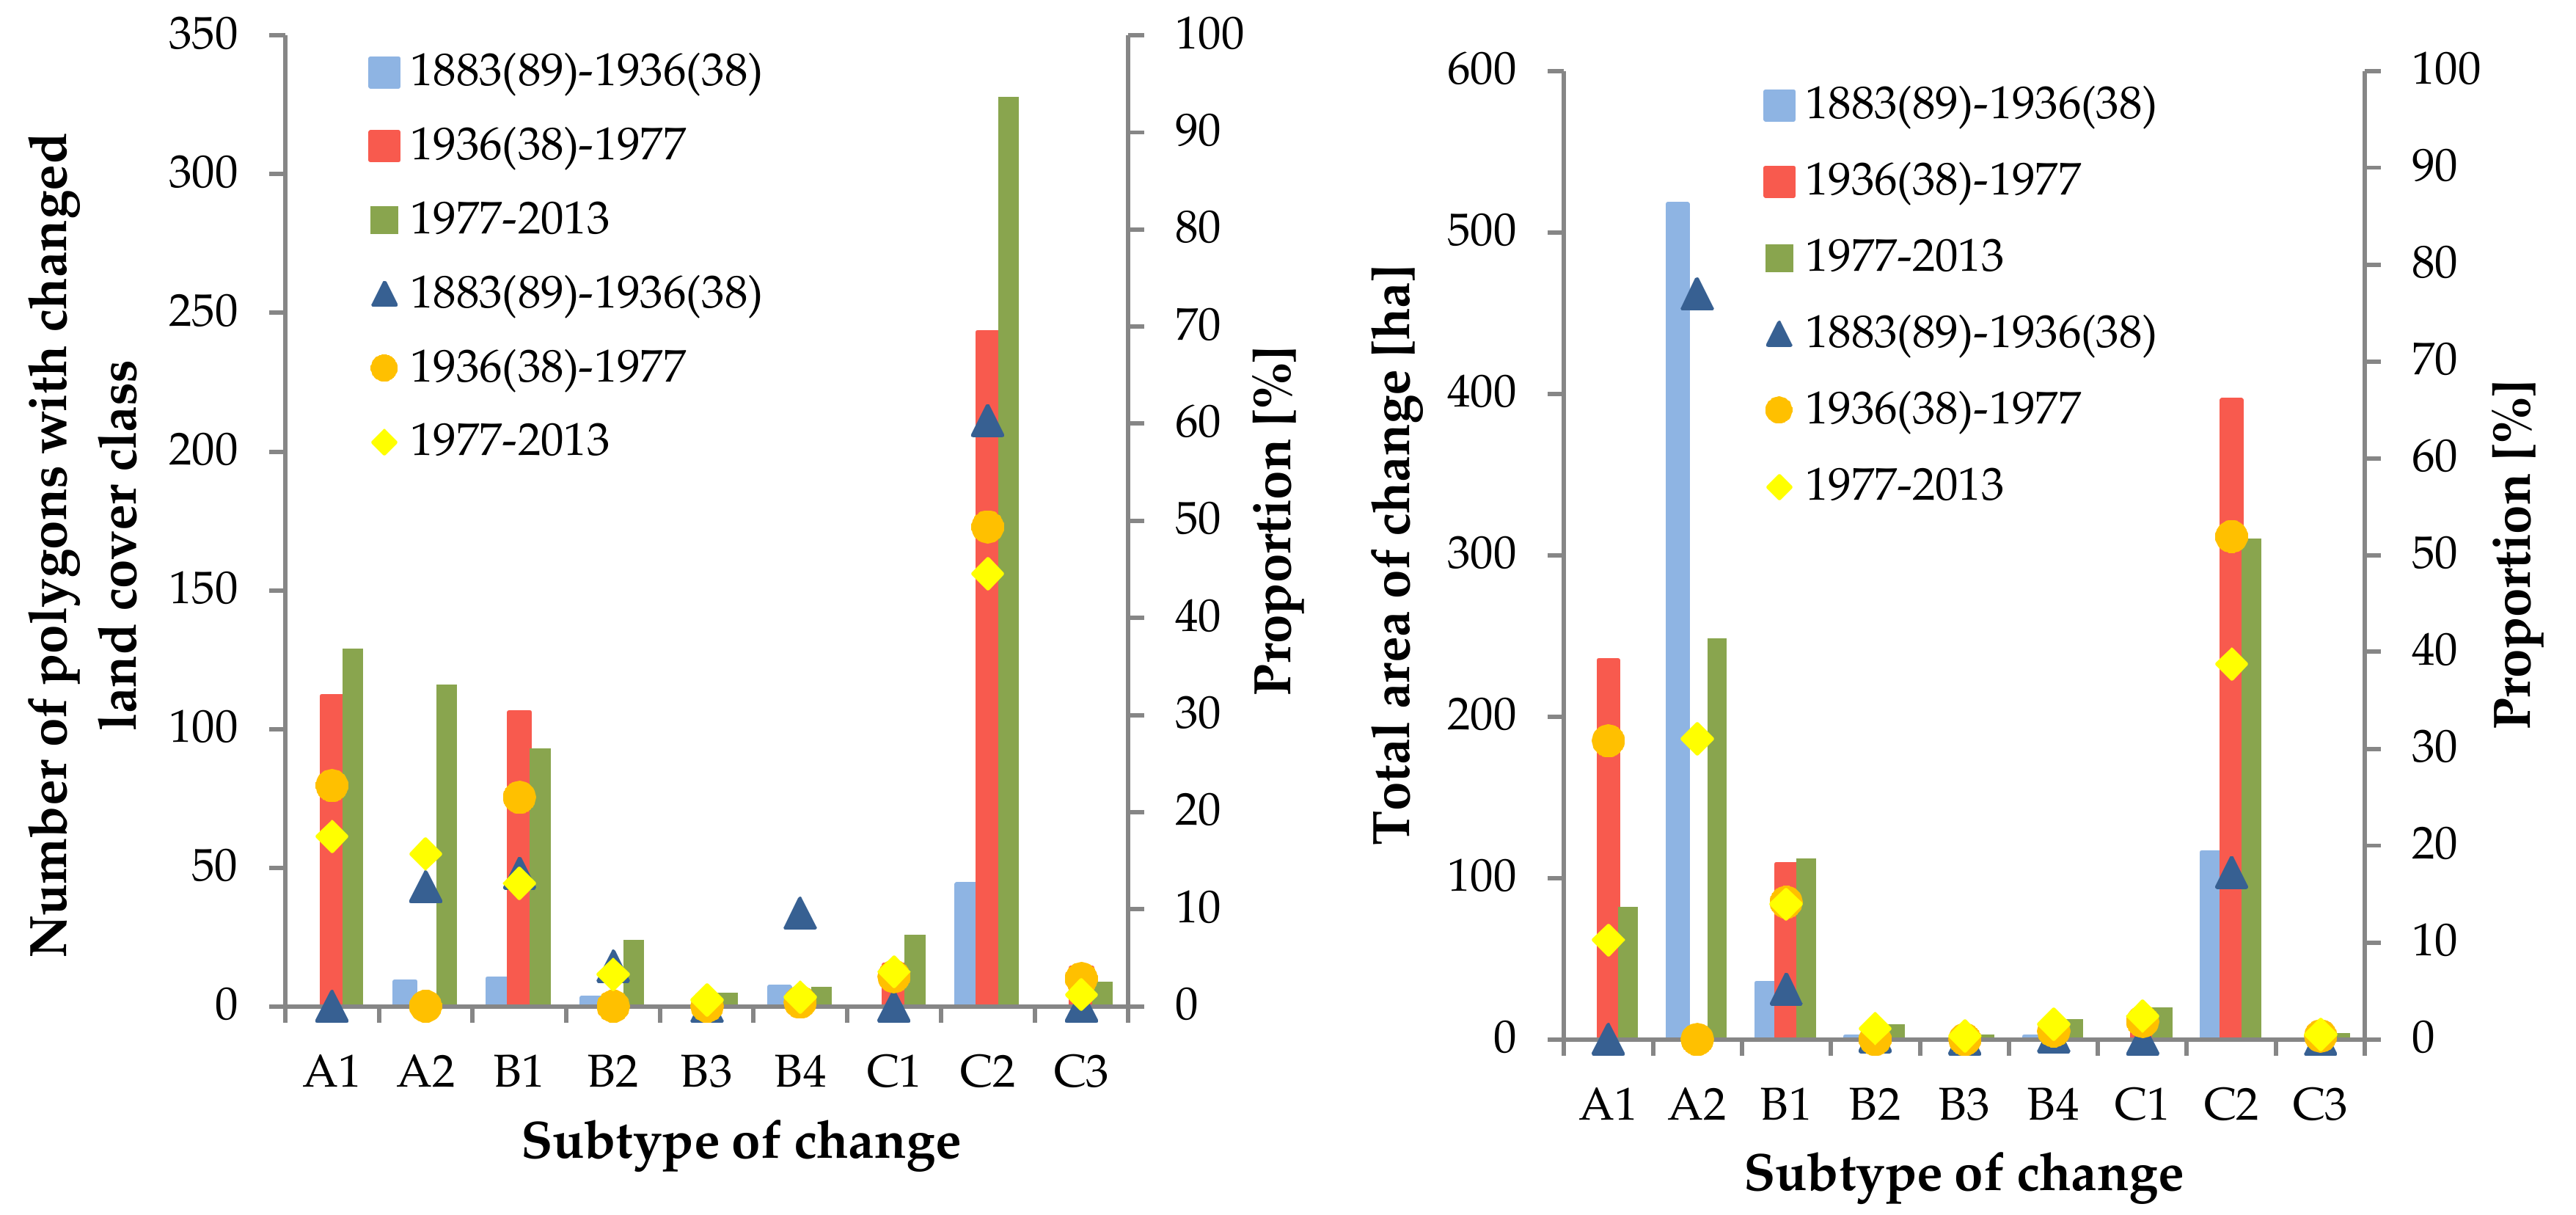
  • What have the main types of forest and non-forest landscape transformations been in the studied area?
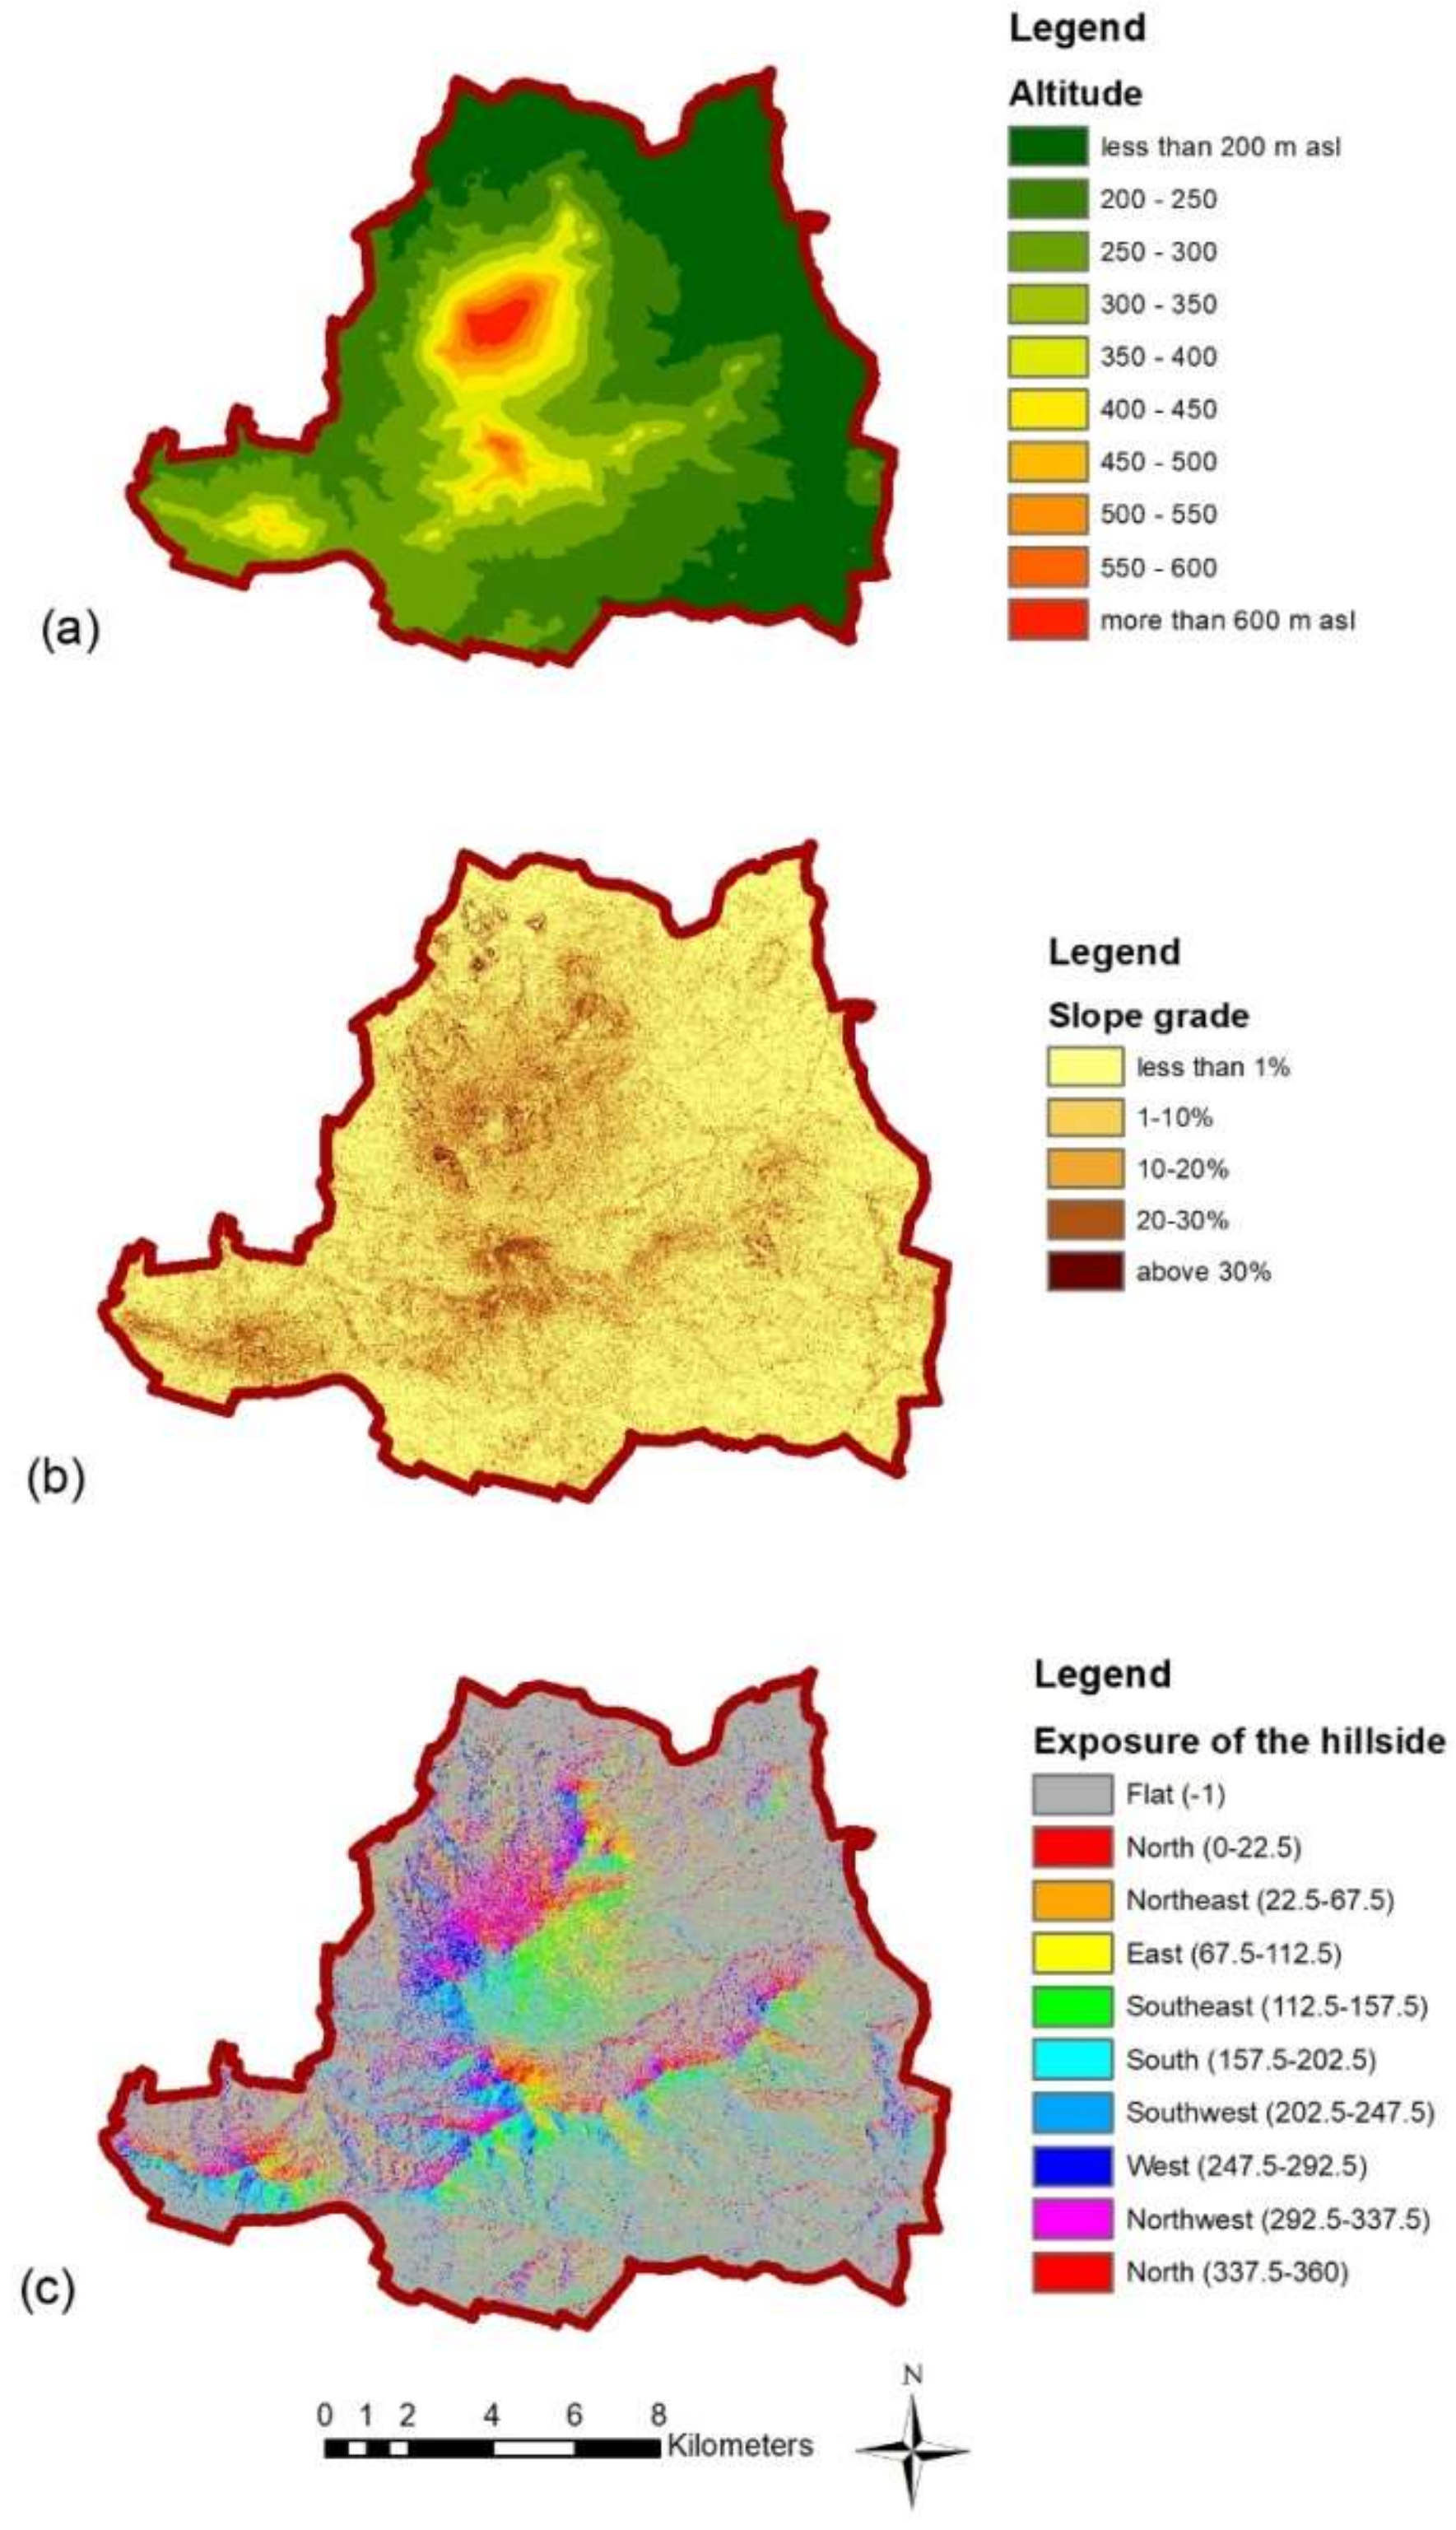
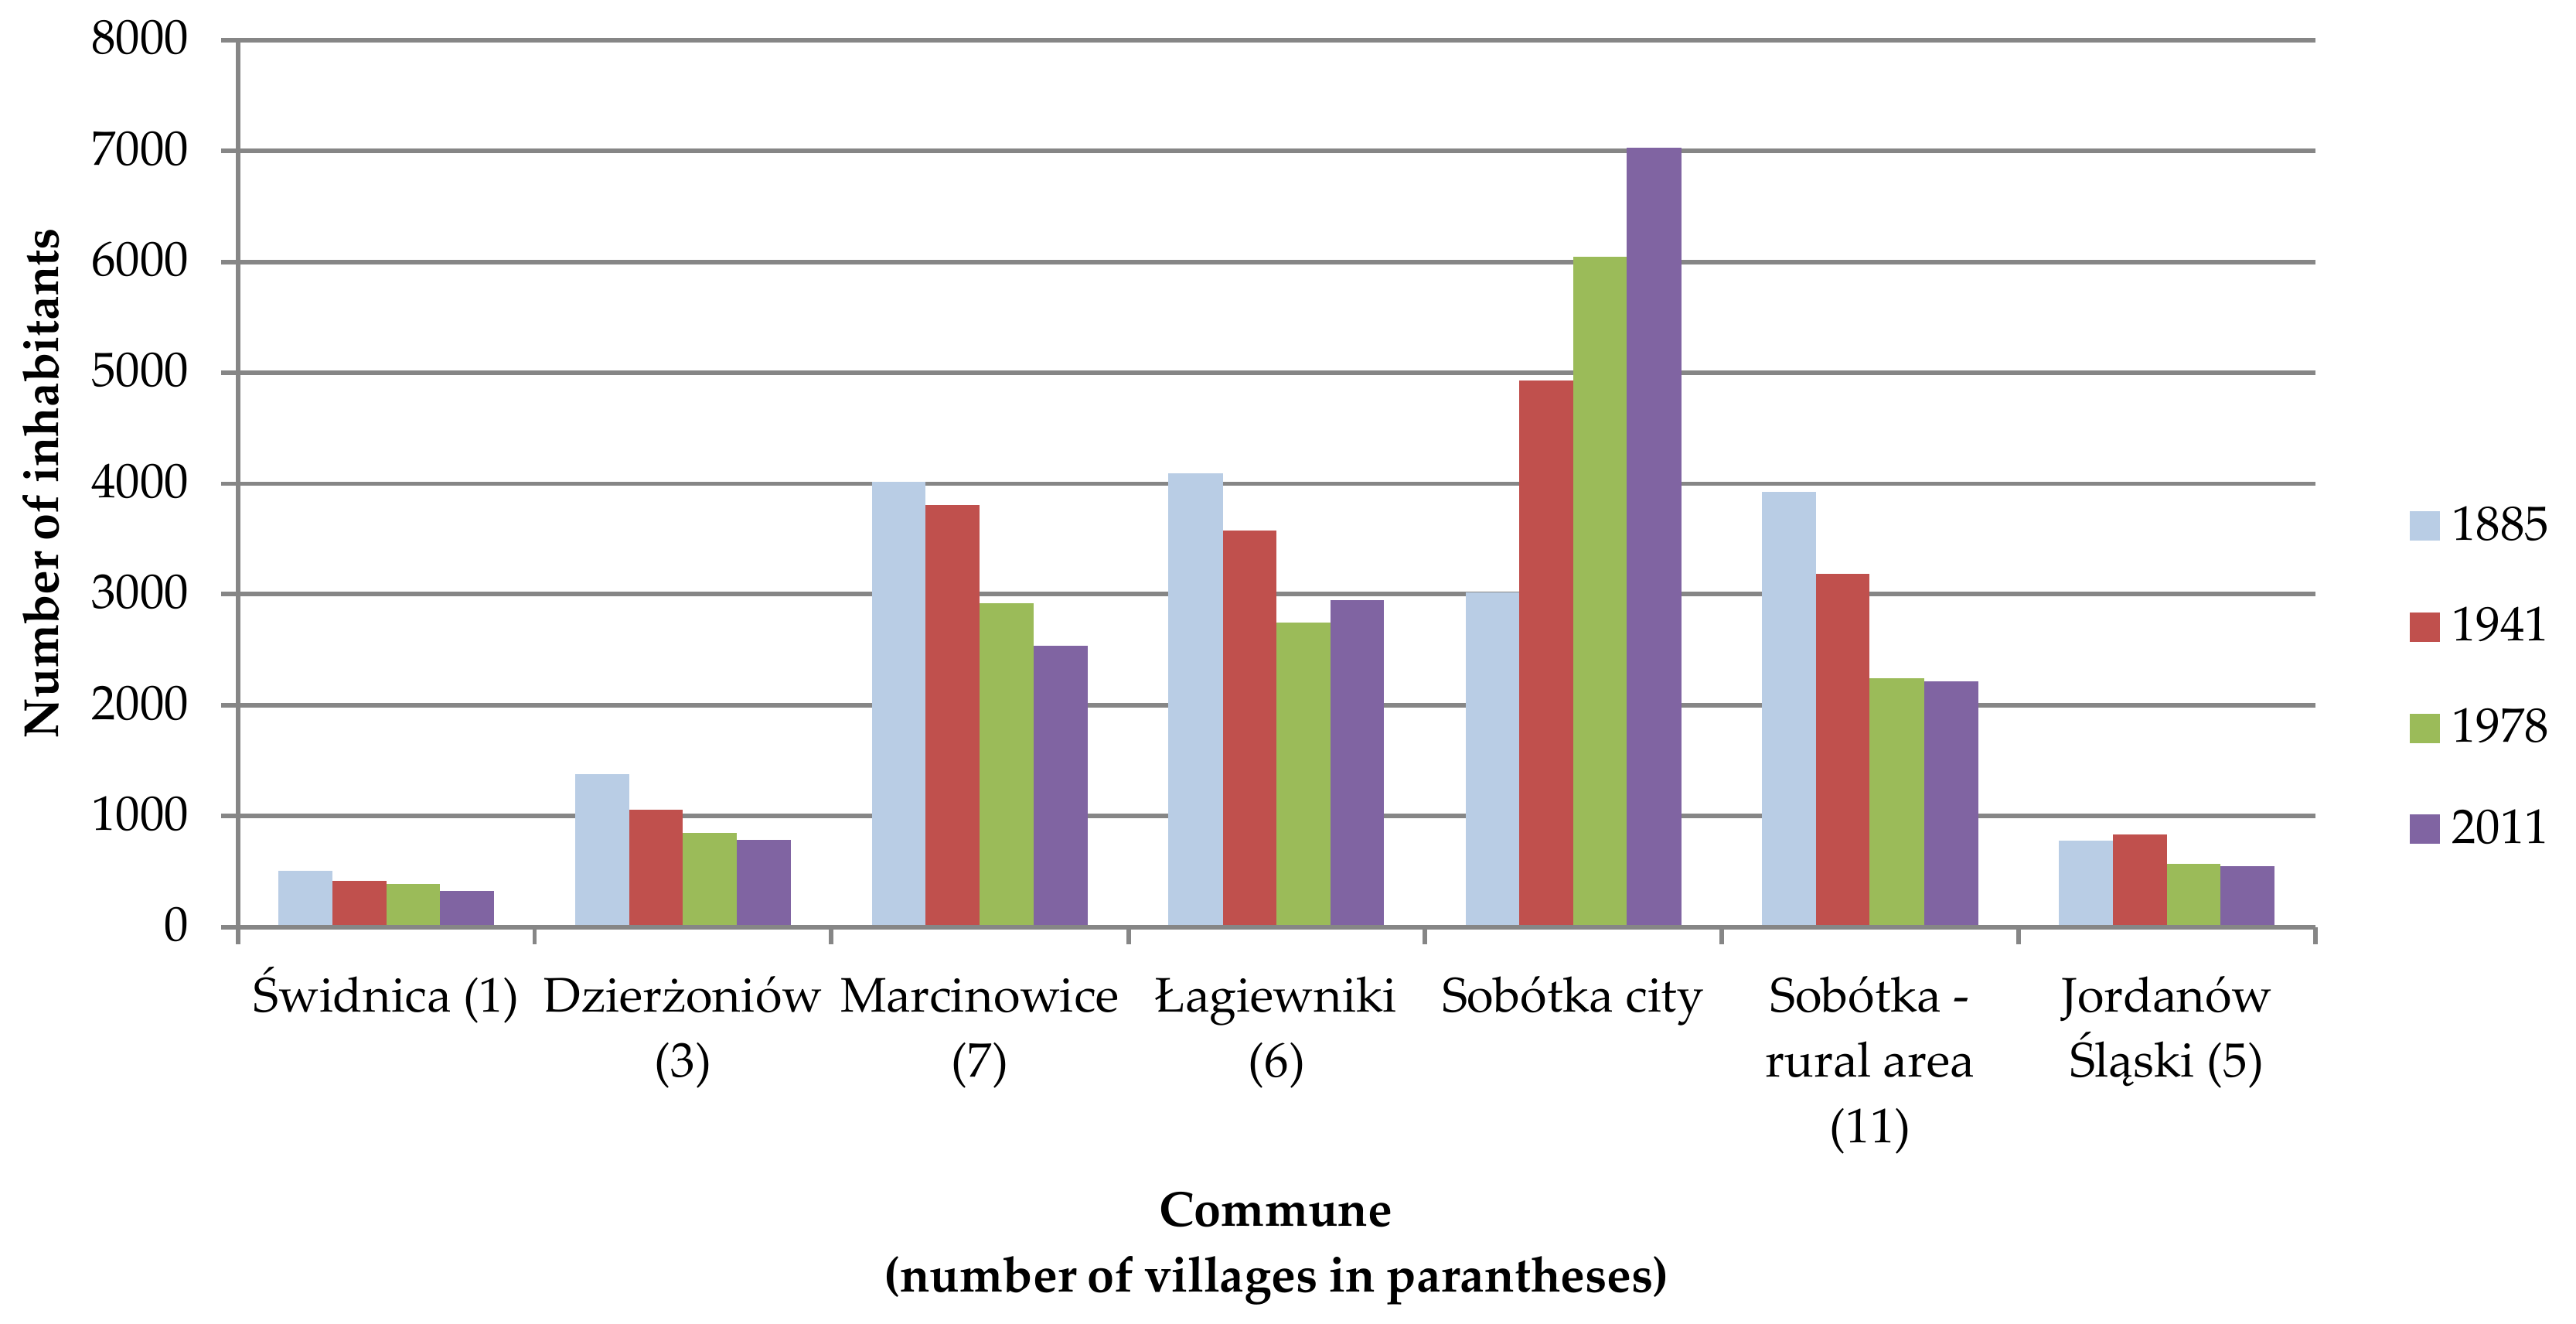
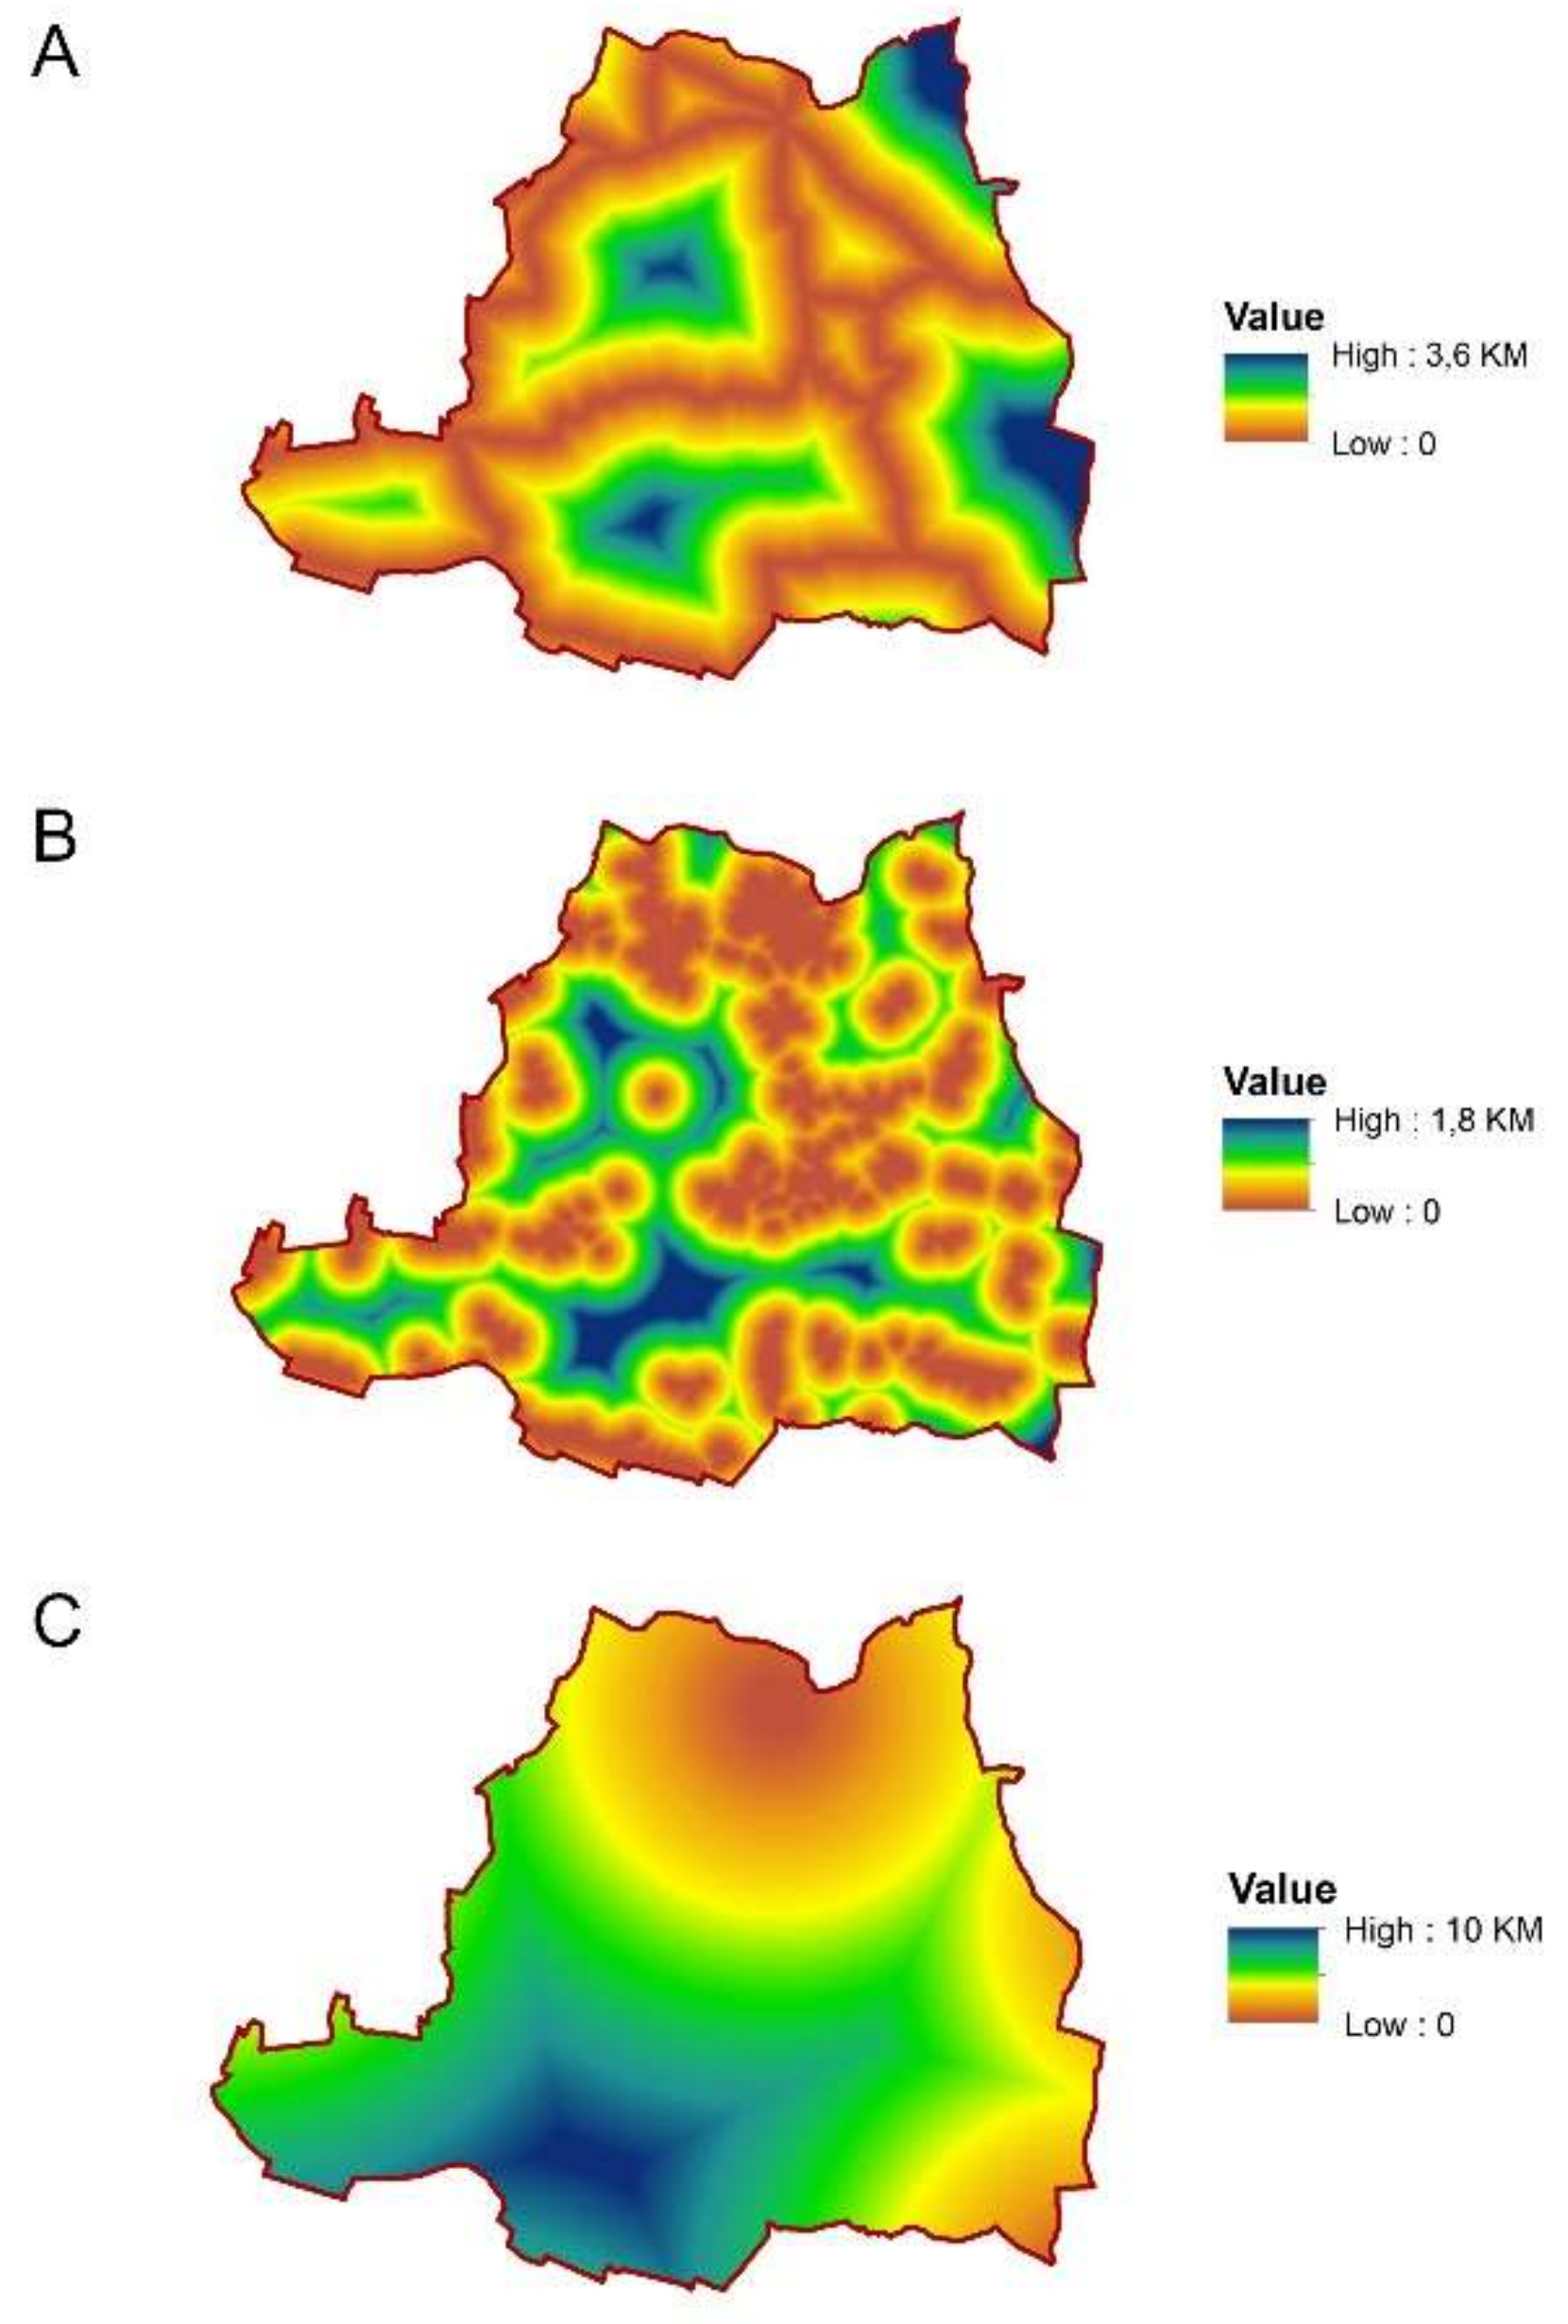
  • What are the characteristics of identified landscape changes in the context of natural factors such as elevation, slope, and hillside exposure as well as socioeconomic factors such as population changes, distances to built-up areas, main roads, and capitals of municipalities?

2. Materials and Methods

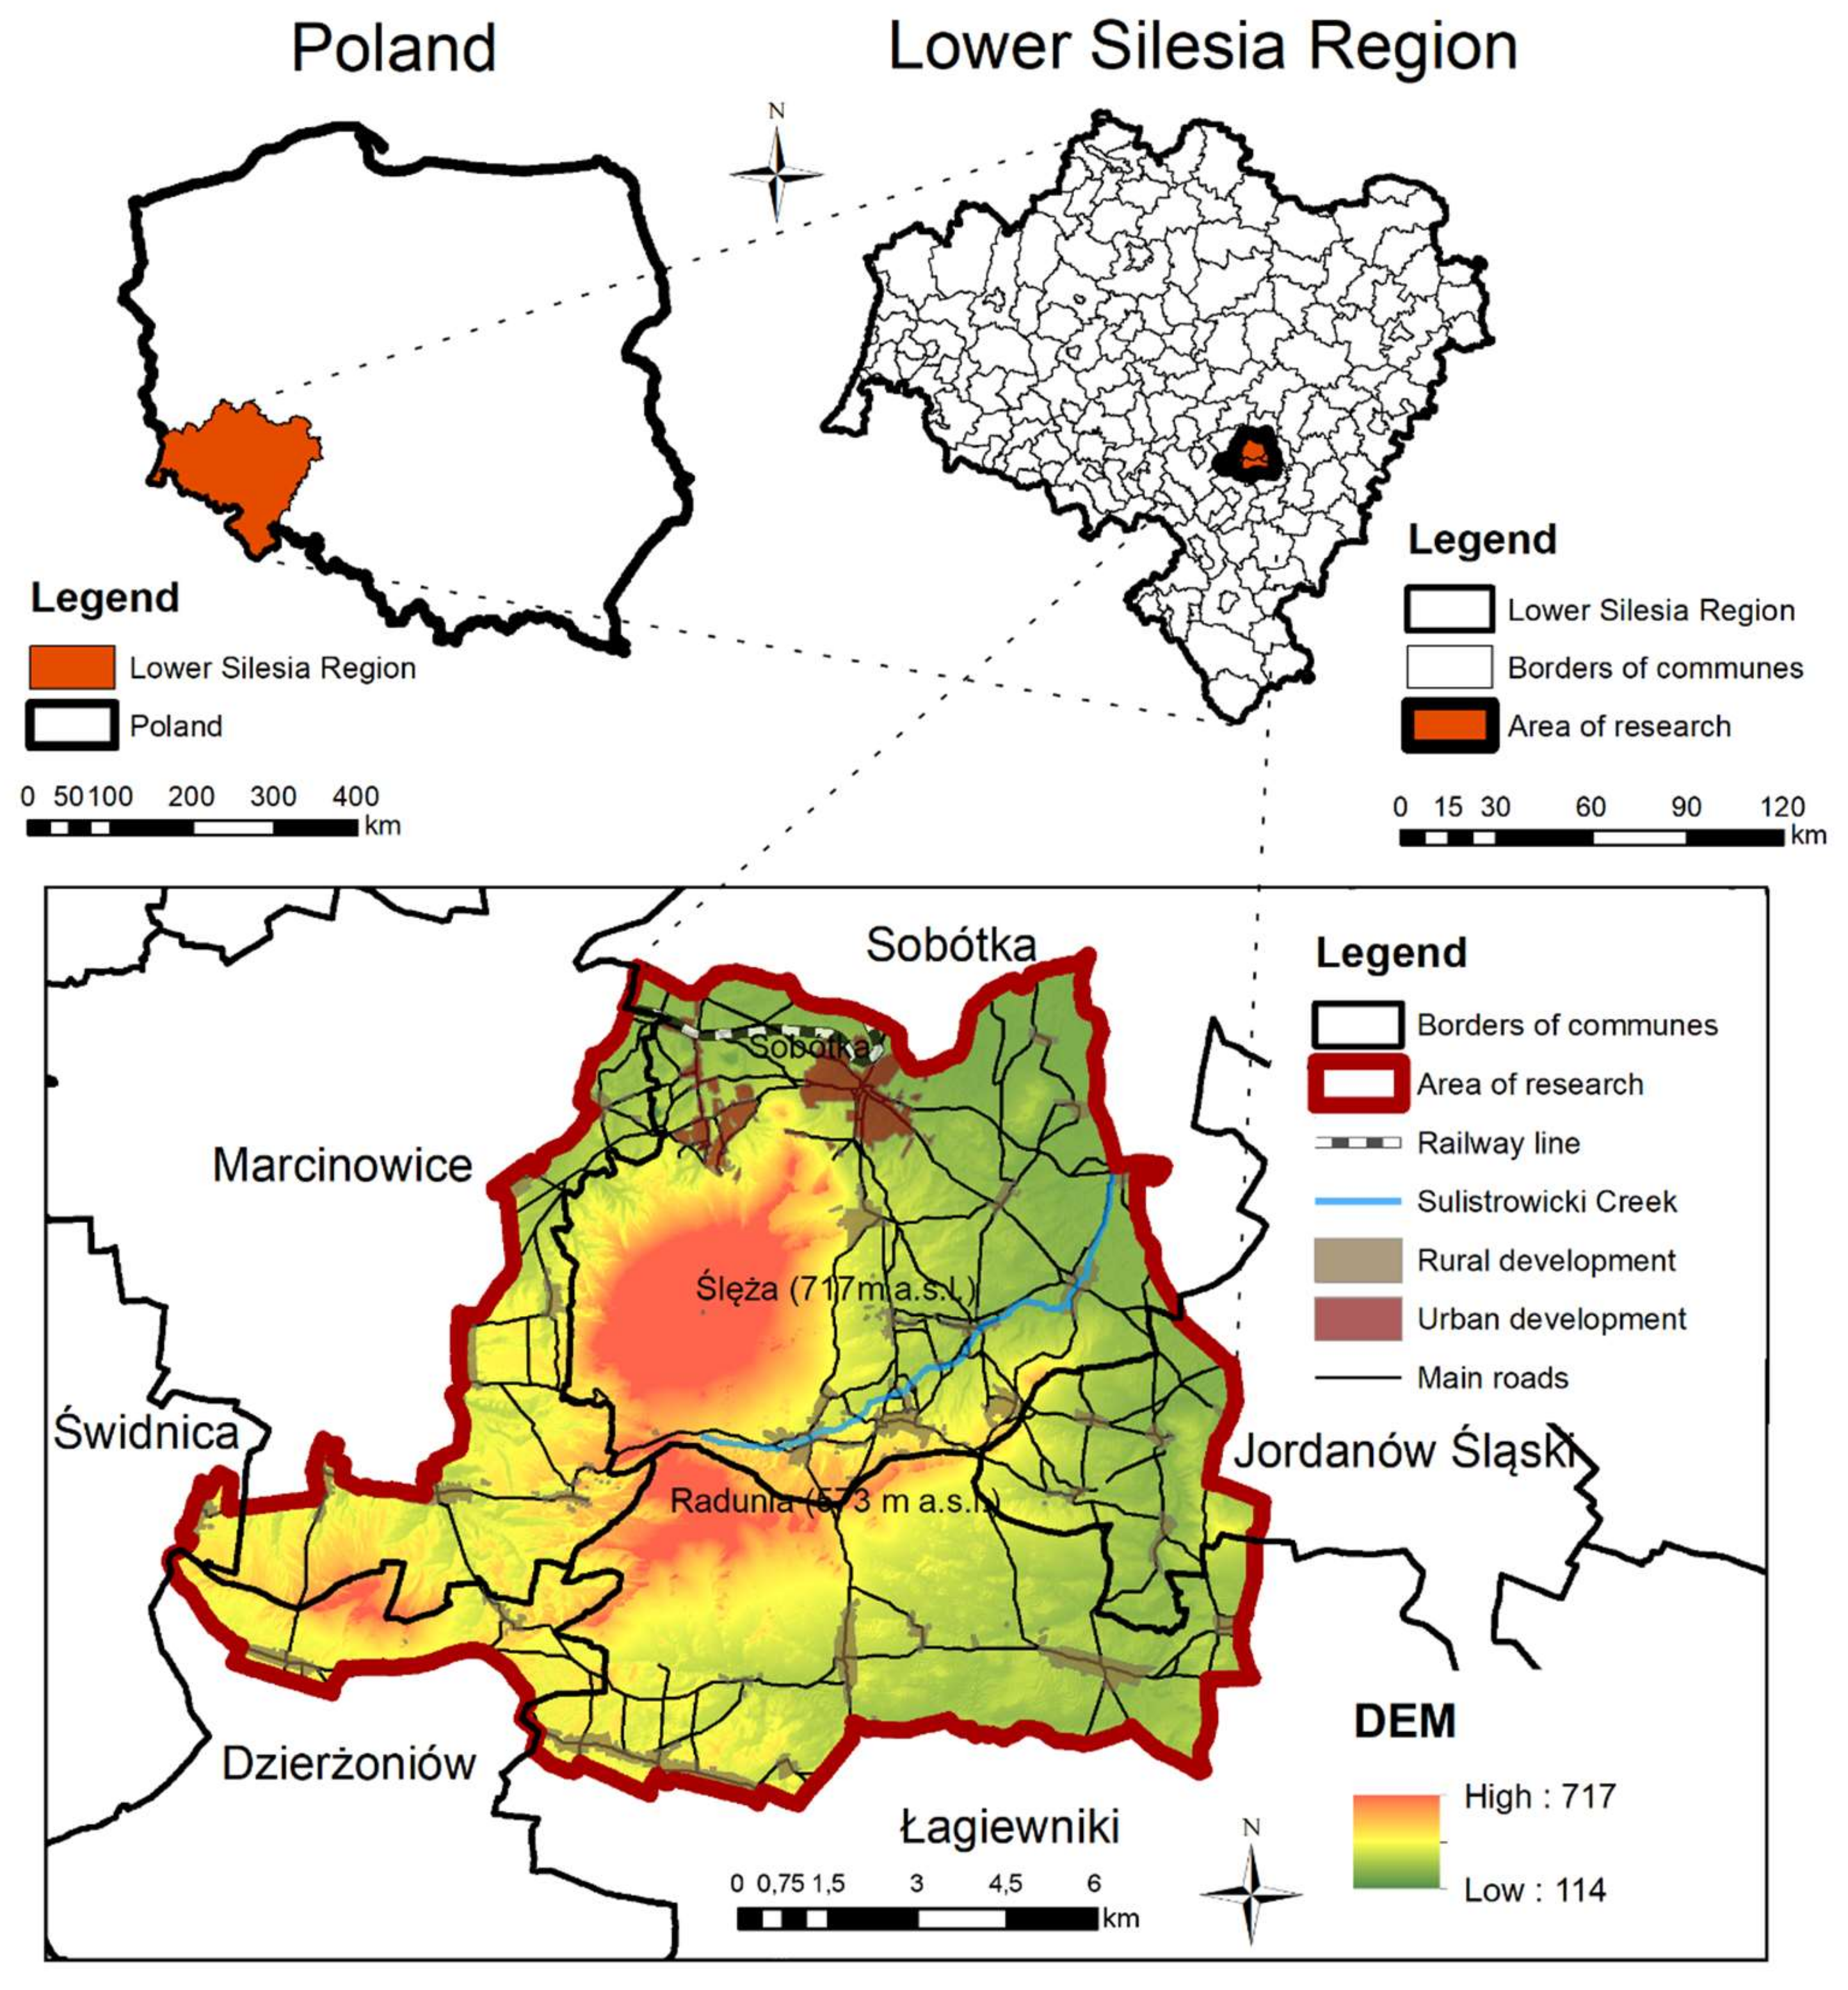
2.1. Case Study Area

The area of our research was the Ślęża Landscape Park and its buffer zone (Figure 1). The park is one of 12 protected areas of this type in Lower Silesia with a total area of 158.07 km2, including a buffer zone. The research area covers the part of six communes located around the highest hill of Przedgórze Sudeckie—Ślęża (717 m a.s.l.). The research area is located about 40 km southwest of the capital of the region, Wrocław. The landscape park consists of three main parts. Together, the three parts of park occupy an area of 76.78 km2. They are connected to each other with an area of 81.29 km2—a buffer zone around the landscape park which protects it against external threats resulting from human activity.
The Ślęża Landscape Park was created on 8 June 1988 to preserve the landscape of the Ślęża Massif, including preservation of the local character and scale of development in historically shaped settlement units and undeveloped spaces in the open forest and meadow landscape and to protect the area’s diverse natural, geological, and geomorphological value [50]. Currently, the area within the limits of the Ślęża Landscape Park is covered mainly by forests (about 62%), which occupy the slopes of Ślęża, Radunia, and the surrounding hills. The lower slopes and flatlands are predominantly used for agricultural purposes. There is one city located in the Northern part of the landscape park. The remaining units of the settlement system are villages that are evenly distributed around the hills among the agricultural and forest areas. In total, areas covered with forest within the boundaries of the landscape park and its buffer zone currently occupy over 33%, and areas not covered with forest occupy 67%, of which 59% is agricultural land, 7% is built-up areas, and 1% is other areas.
Before analyzing the driving forces of landscape changes within the research area, it should be mentioned that the Ślęża mountain has been a special place for the inhabitants of Lower Silesia since ancient times. Raised above the surrounding flat areas, it was a place of pagan sun worship of the local tribes which lived at the foot of the mountain in the later Bronze Age and early Iron Age (1300 BC–500 BC). Today, the Ślęża Massif is a protected area as a landscape park, and partly as a Natura 2000 area. It enjoys great popularity among tourists as well as among the residents of the largest city in the region, Wrocław. The surrounding landscape is a factor that attracts the rich inhabitants of the city who build their second homes there. Due to the rich deposits of granite, it is also an area that has been associated with mining for years.
In terms of types of forest in the park, there is a division into two parts [51]. The top of Ślęża mountain is overgrown with Galio odorati-Fagetum and Luzulo pilosae-Fagetum and is protected as a nature reserve. However, these forest associations are preserved in a small part of their potential area of occurrence. Paleobotanical studies revealed that the primary vegetation for entire area of Ślęża Massif was beech and oak forest. The lower parts, today occupied mainly by arable land and built-up areas, were dominated by oak-hornbeam forest [52]. Today, in most of the study area, these types of forest have been replaced by the monoculture of Picea abies with a dense forest stand that is often devoid of undergrowth and was formed in the 19th century. In the Northern part, there is also a fragment of an old and well-preserved Tilio platyphyllis-Acerion pseudoplatani with rich forest undergrowth. The peak of the Radunia mountain is overgrown with Potentillo albae-Quercetum with a dominance of Quercus petraea. On the top, there is sparse forest with an unusual dwarf form of this species. However, at the foot of hills, there are numerous orchards, mostly of Cerasus sp. Some areas, formerly used for agriculture, have undergone spontaneous forest succession.

2.2. Identification of Changes in Forest Landscapes

To make it possible to identify landscape changes in last 140 years, it was necessary to select the proper archival source materials that would have a similar content and give detailed information about land cover. Source maps should have also been published at the same scale, which ensured a similar rate of data generalization. Four series of maps published in 1883–1889, 1936–1938, 1977, and 2013 at 1:25,000 scale, containing information of land cover, were selected from available source materials. The basis for choosing the source maps was availability of good quality map sheets covering the whole research area and the similarity of land cover types. The full information of collected maps is included in Table 1. Five sheets of maps from the oldest considered series published in 1883–1889, and next published in 1936–1938 (Topographische Karte—Messtischblatt) refer to the period under German rule. The maps were made in the field and are characterized by very high detail and extraordinary land cover mapping accuracy. They are one of the best sources of information on land cover transformation over the last 140 years and are commonly used in landscape change analyses [53]. Polish land cover maps from 1977 and 2013 were developed on the basis of aerial photos supplemented with field verification.
The availability of source maps was a direct cause of identification of landscape changes in three periods covering approximately 40–50 years: 1883(89)–1936(38), 1936(38)–1977, and 1977–2013. Publication dates in parentheses represent the newest map from the series. There were no more published series of land cover maps at the same scale that would cover the whole area of the study. The lack of data sources made it impossible to increase the number of analyzed periods of time. Selected intervals were long enough to identify forest transformations at archival maps and covered different political and economic conditions which can be considered as underlying driving forces of landscape change in the study area. Chronological time intervals allowed us to identify and compare data and find some trends of landscape transformations in the last 140 years. All the maps contain basic land cover classes—such as forest (young and mature), meadows, agricultural land, urban and rural development, water areas, mining areas, etc.—appear consistently over all time periods. The changes between these land cover classes represent the most landscape transformations within research area. Therefore, it gives enough information and comparable data from each time interval.
Georeferences were given for all historical maps used in the analysis. As a ground control points, we chose the least volatile elements in the landscape like the tops of hills, the intersections of main roads, and preserved historical buildings. The newest database of topographic objects from 2013 was the reference layer for the remaining maps. A rubber sheeting method of transformation called ‘spline’ was used to calibrate the maps. It gave the best calibration results when ground control points are important and exact registration is required [54]; however, it causes significant distortions of the maps [55] that can be overcome by using a dense grid of ground control points.
The selected four series of source maps were the basis for preparing four land cover maps showing most common elements of the landscape. Prepared maps made it possible to compare data in ArcMap 10.2.2. Land cover was divided into two groups—areas covered with forest and areas not covered with forest. In addition, the maps show the major roads and railways. Full classification of land cover types is included in Table 2.
The next step was to create a database containing the area of each type of land cover type and its percentage share in relation to the entire analyzed area in each of the time periods. The basis for this was land cover maps prepared for each time period. In order to calculate the landscape change index (LCI) for each period, it was necessary to specify parameters that indicate changes in the percentage share of areas covered by each of land cover type. It was calculated with
CAi = 100 × (At+1 − At)/TA
where CAi represents changes in the percentage share of areas covered by each land cover type in relation to the total area of research (%); At+1 represents the area covered with each type of land cover during the time interval t + 1 (ha); At represents the area covered with each type of land cover during the time interval t (ha); and TA represents the total research area (ha).
This allowed us to determine the landscape change index (LCI) for each of the time intervals. The LCI is defined as the absolute values of change in the land cover types that have the greatest impact on the shape of the landscape, assuming that both increases and decreases in these values cause changes in the landscape [30]. The index was calculated for each period of time by multiplying a factor of one-half by the sum of the absolute values of change in percentage share of areas covered by each land type cover in relation to the whole analyzed area. Summing the absolute values of change of each land cover type essentially doubled the index, so the LCI included a factor of one-half to reflect the actual level of change. LCI was calculated with
LCI t = 1 2 × i = 1 n | CA i |
where LCIt represents the landscape change index in each time interval; and |CAi| represents the absolute value of change in percentage share of the areas covered by each land cover type in relation to the total research area.
To identify the nature and scale of changes related to forest area all polygons which were detected as including changes by the clip tool in ArcGIS software (tool used to cut out a piece of features representing land cover classes from one of analyzed period of time by using the features from another period of time) were analyzed in terms of type of transformation and total and average area. Identification of changes related to forests allowed us to create a classification of types and subtypes of changes in forest landscapes that took place in the Ślęża Landscape Park in the analyzed time intervals. This classification includes three types of change and a total of nine subtypes of change related to forest landscapes. Other possible types and subtypes of change not listed in the classification below were not observed in the research area. Full classification of types and subtypes of forest landscape changes is included in Table 3.

2.3. Driving Forces of Changes in Forest Landscapes

Natural driving forces associated with topographic conditions may largely determine type of landscape change [36]. Therefore, three of such kind factors (elevation, slope, and hillside exposure) were taken into account. Based on reference data [51,56], variables like natural disasters and type of soils were considered insignificant and not considered in this study. Socioeconomic factors also play important roles in landscape changes [38]. Therefore, we selected four factors for consideration—human demographic changes, distances to main roads, and capitals of municipalities and built-up areas. The analyzed a group of topographic factors including data obtained on the basis of analyses of the digital elevation model (DEM) with a mesh resolution of 1 × 1 m obtained on the basis of aerial laser scanning (LIDAR) with an average height error of 0.2 m. The digital elevation model was the basis for constructing maps of possible natural drivers of change, such as elevation, slope, and hillside exposure, by using ArcMAP 10.2.2 software with the 3D Analyst extension. However, it should be emphasized that these factors can be considered as an indirect driving forces of change because they determine only the accessibility of the area. Construction of new communication routes as well as better and better construction equipment enables changes in higher located areas.
The second group, socio-economic factors, included human demographic changes which were determined from the population censuses of 1885, 1941, 1978, and 2011 for individual villages within the boundaries of the study area. The distances to the main roads (national, province, and county), the five nearest municipalities (Sobótka, Marcinowice, Jordanów Śląski, Łagiewniki, and Dzierżoniów) and borders of built-up areas were calculated from the axes of roads, and the central parts of villages and towns which were obtained on from the land cover maps developed in the first stage of research for different periods of time. The geopolitical situation in particular periods of time—as well as the main historical, cultural, and technological events—were also described as a background to the research results. The main data sources were literature and chronicles of events. The complete list of analyzed driving forces and data sources is shown in Table 4.
Next step was to determine the characteristics of each observed type of change within the forest landscapes in each of the time intervals in the context of selected possible natural and socioeconomic driving forces. Each polygon that underwent transformation was described in terms of its dominant slope, the exposure of the hillside, elevation, human demographic changes of the nearest village and city, and the distances to the nearest major towns (with headquarter of commune council), main roads (national, provincial and county roads), and built-up areas. Then polygons were classified for the appropriate classes in terms of elevation (50 m intervals), slopes (10 % intervals), hillside exposure (according to the sides of the world), distances from municipalities (2 km intervals), distances from main roads (500 m intervals), and distances from built-up areas (250 m intervals). Last step was to count the polygons separately for each type of landscape transformation specified in the classification (A1–A2, B1–B4, C1–C3).
It should be noted that used methods may be the source of some errors resulting from the process of identification of past landscape transformations connected especially with mapping of changes. One should also be aware that the archival source materials, despite being published at the same scale, differ in terms of their purpose (administrative, military maps, etc.), used signs, or degree of data generalization. Since the basis for mapping changes were archival maps from different time periods the analysis had the potential to contain some errors resulting from the inaccuracy of the georeferencing of individual maps or the method of drawing polygons. To minimize the amount of erroneous data, we eliminated all polygons that symbolized a change in an area smaller than 0.1 ha Analyses of driving forces behind landscape changes have also some limitations because they do not indicate cause and effect relationships between selected driving forces and identified landscape transformations. Therefore, the correlation analyses between each factor and landscape changes are necessary in the next stage of research. Data collected at the initial stage of driving forces analyses can only be the basis of further studies for full understanding processes shaping the landscape.

3. Results

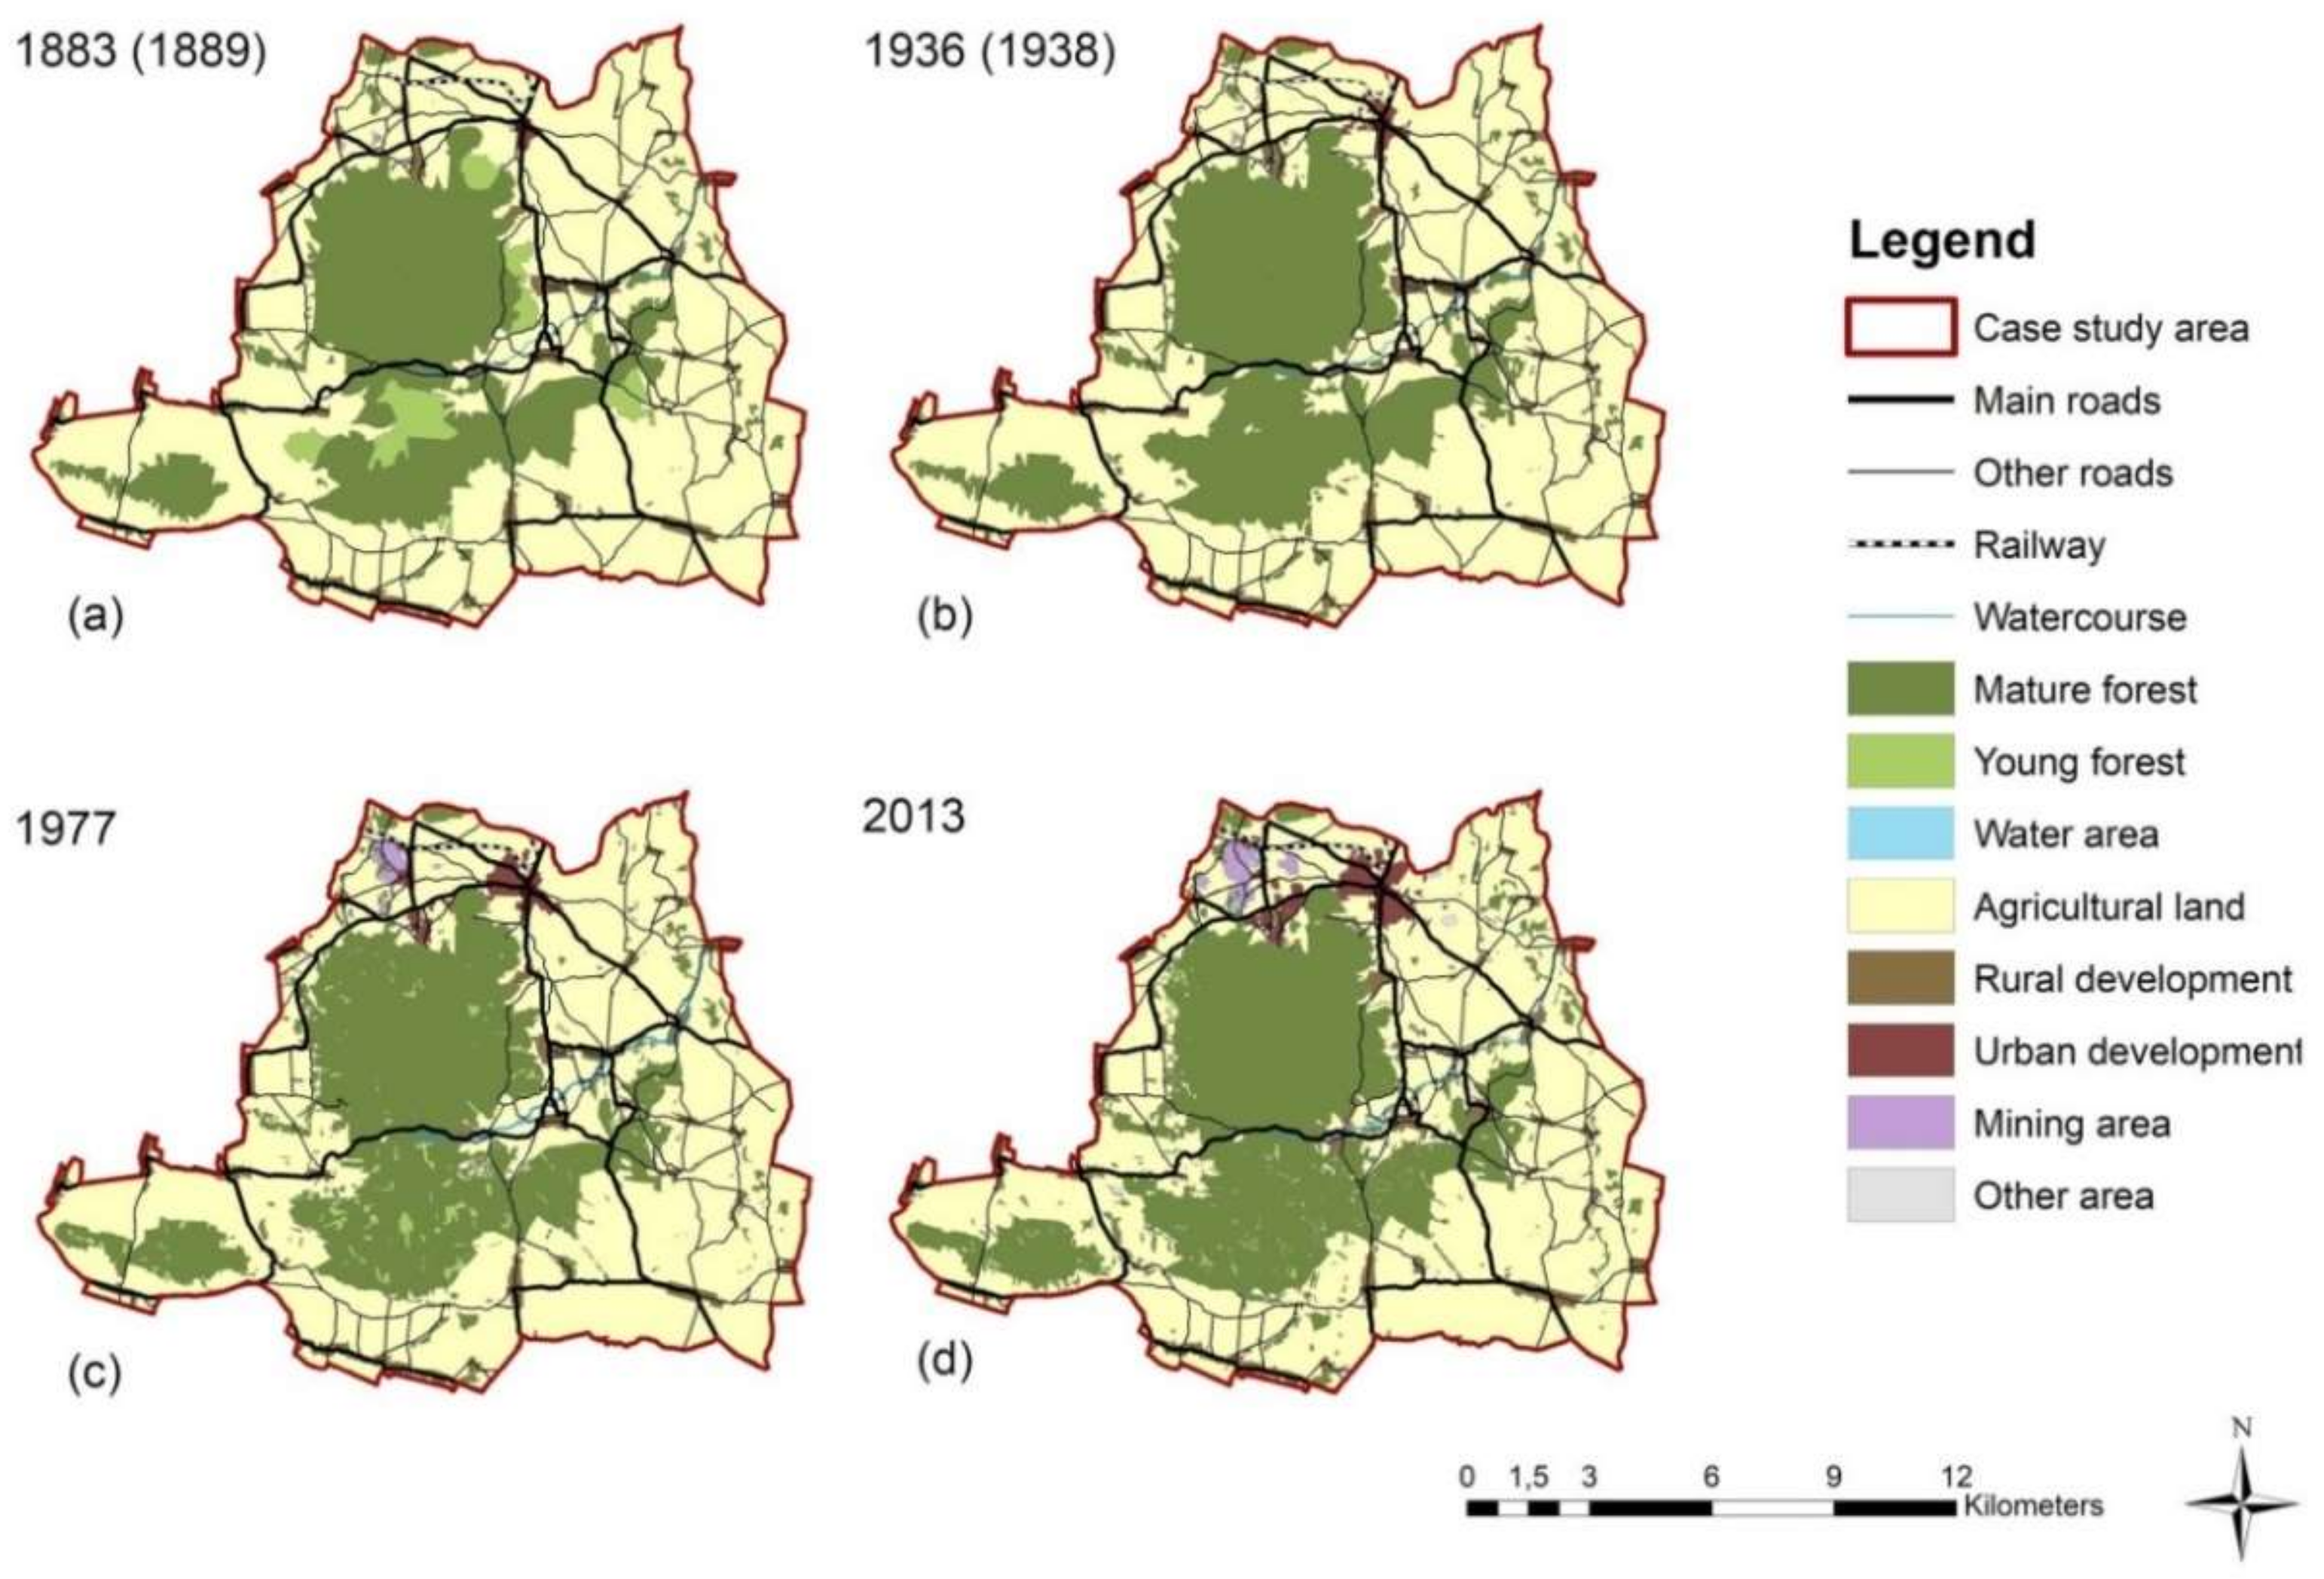
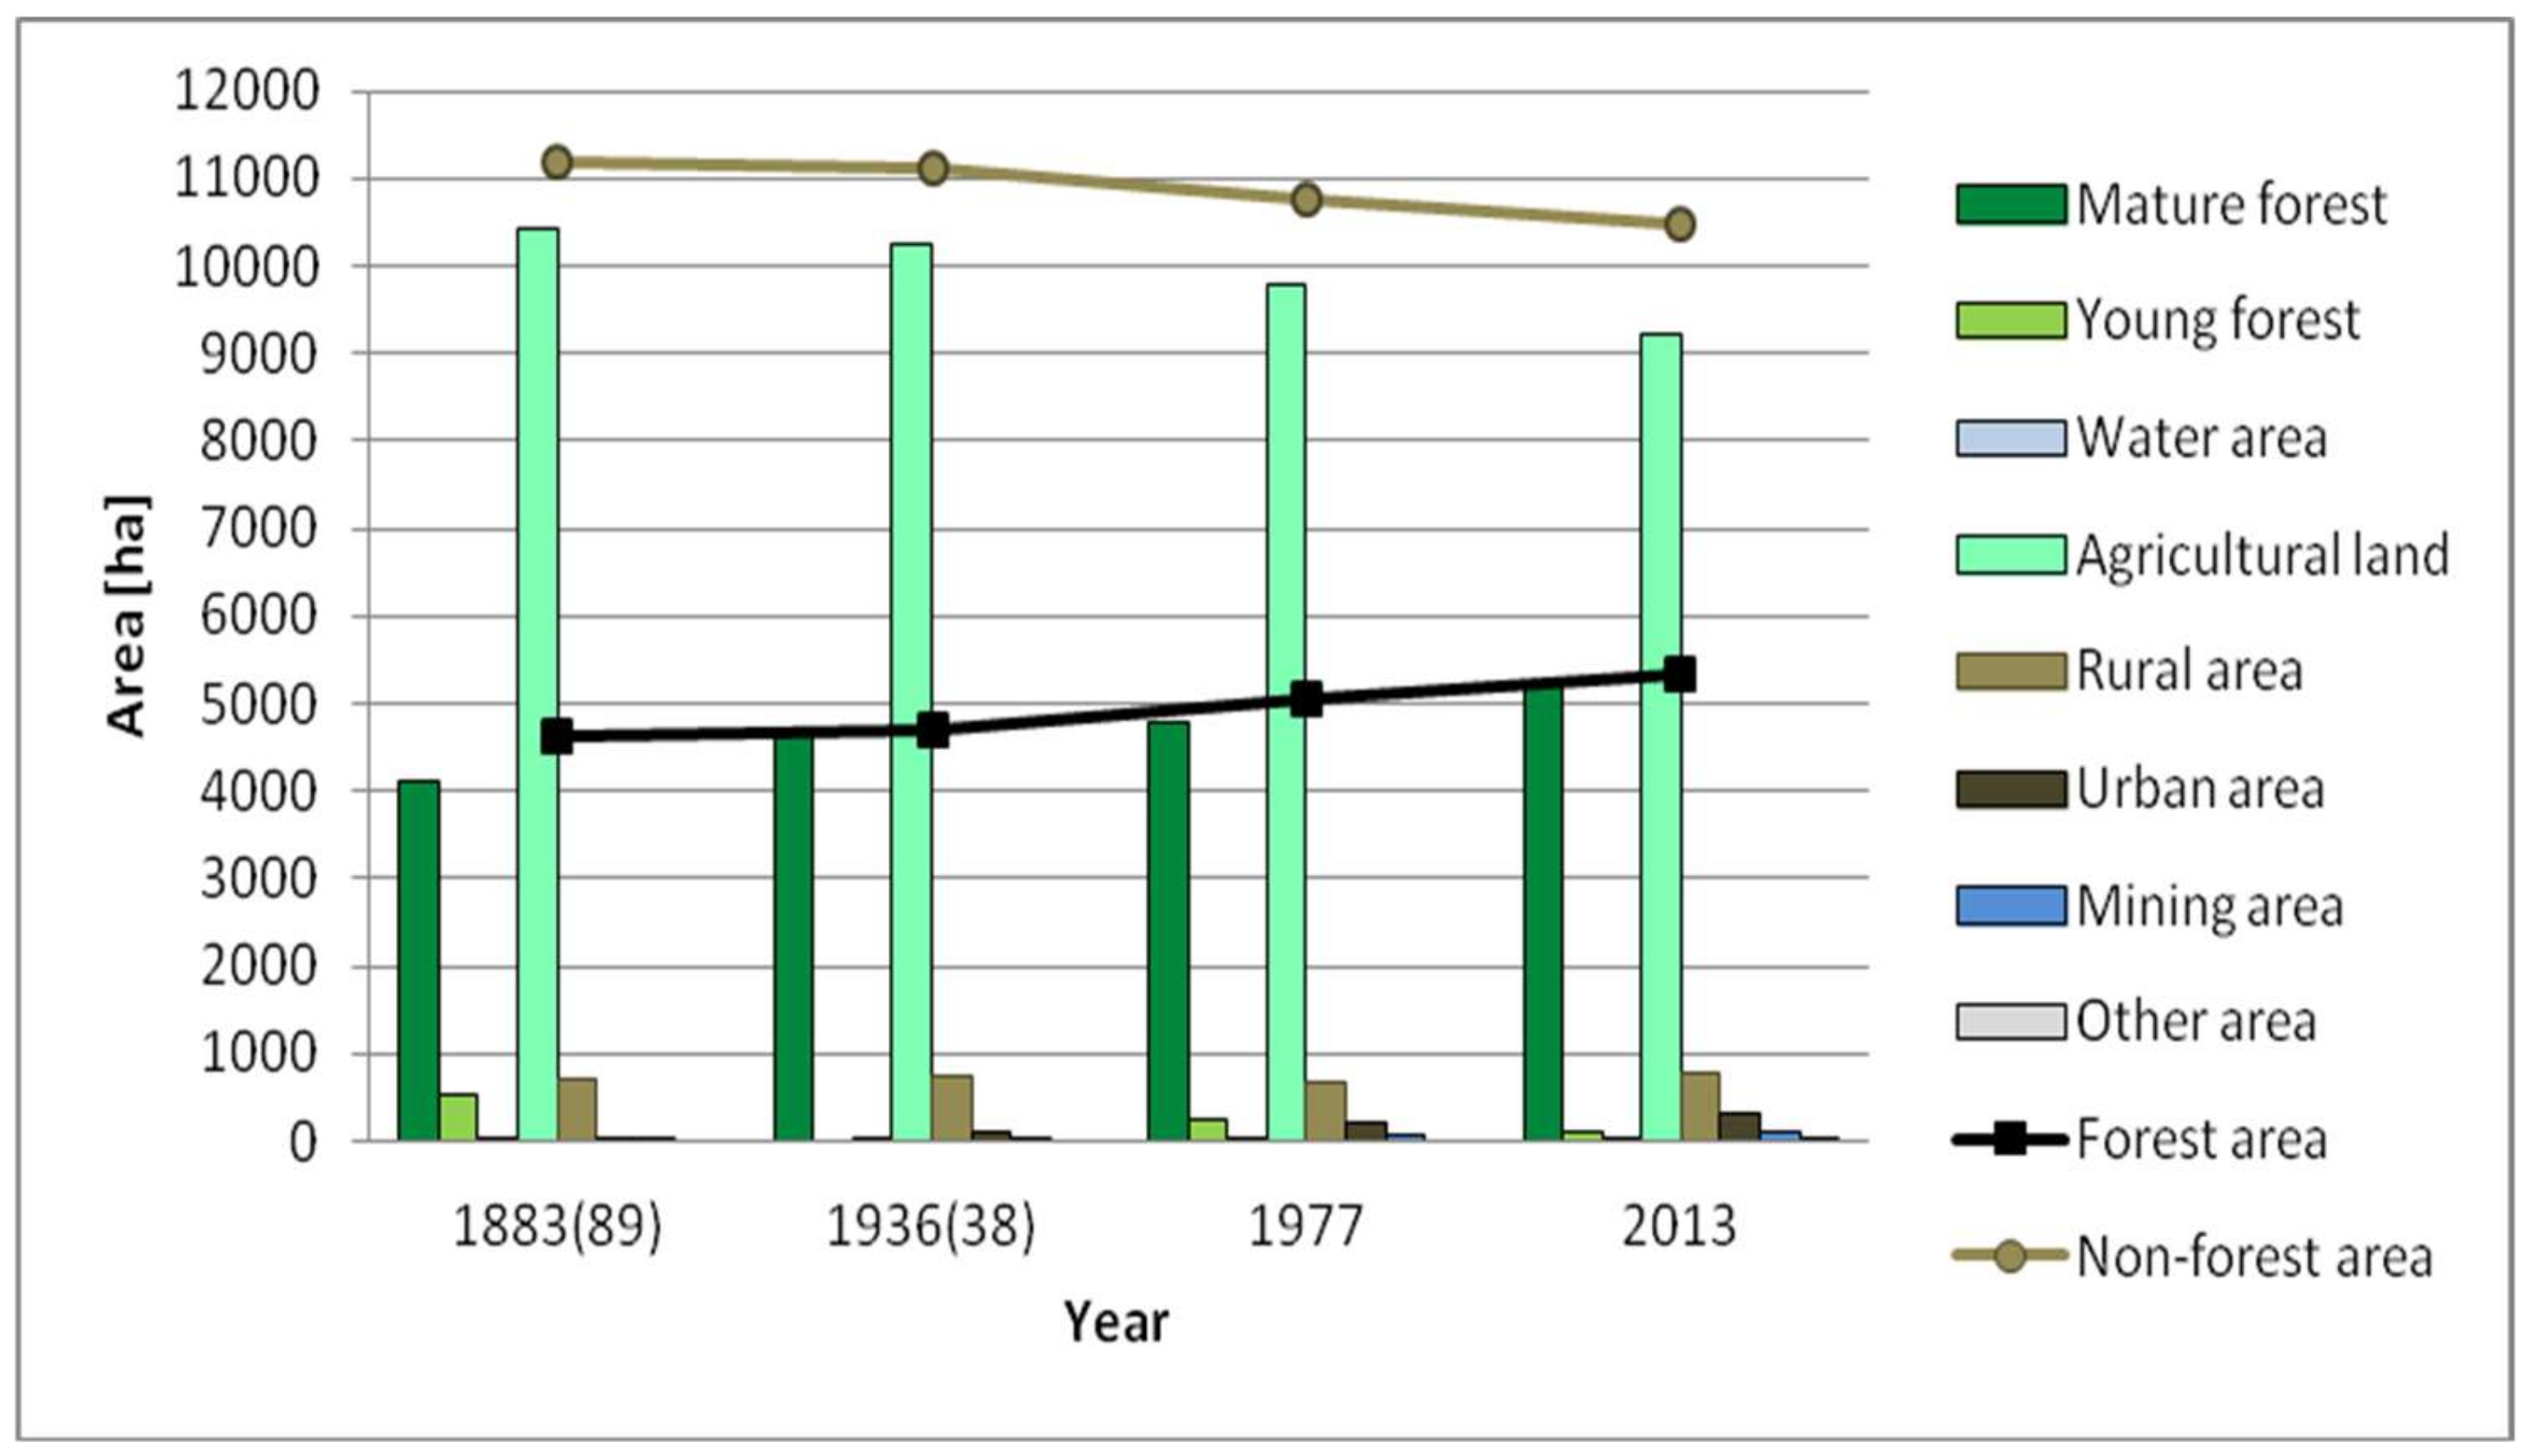
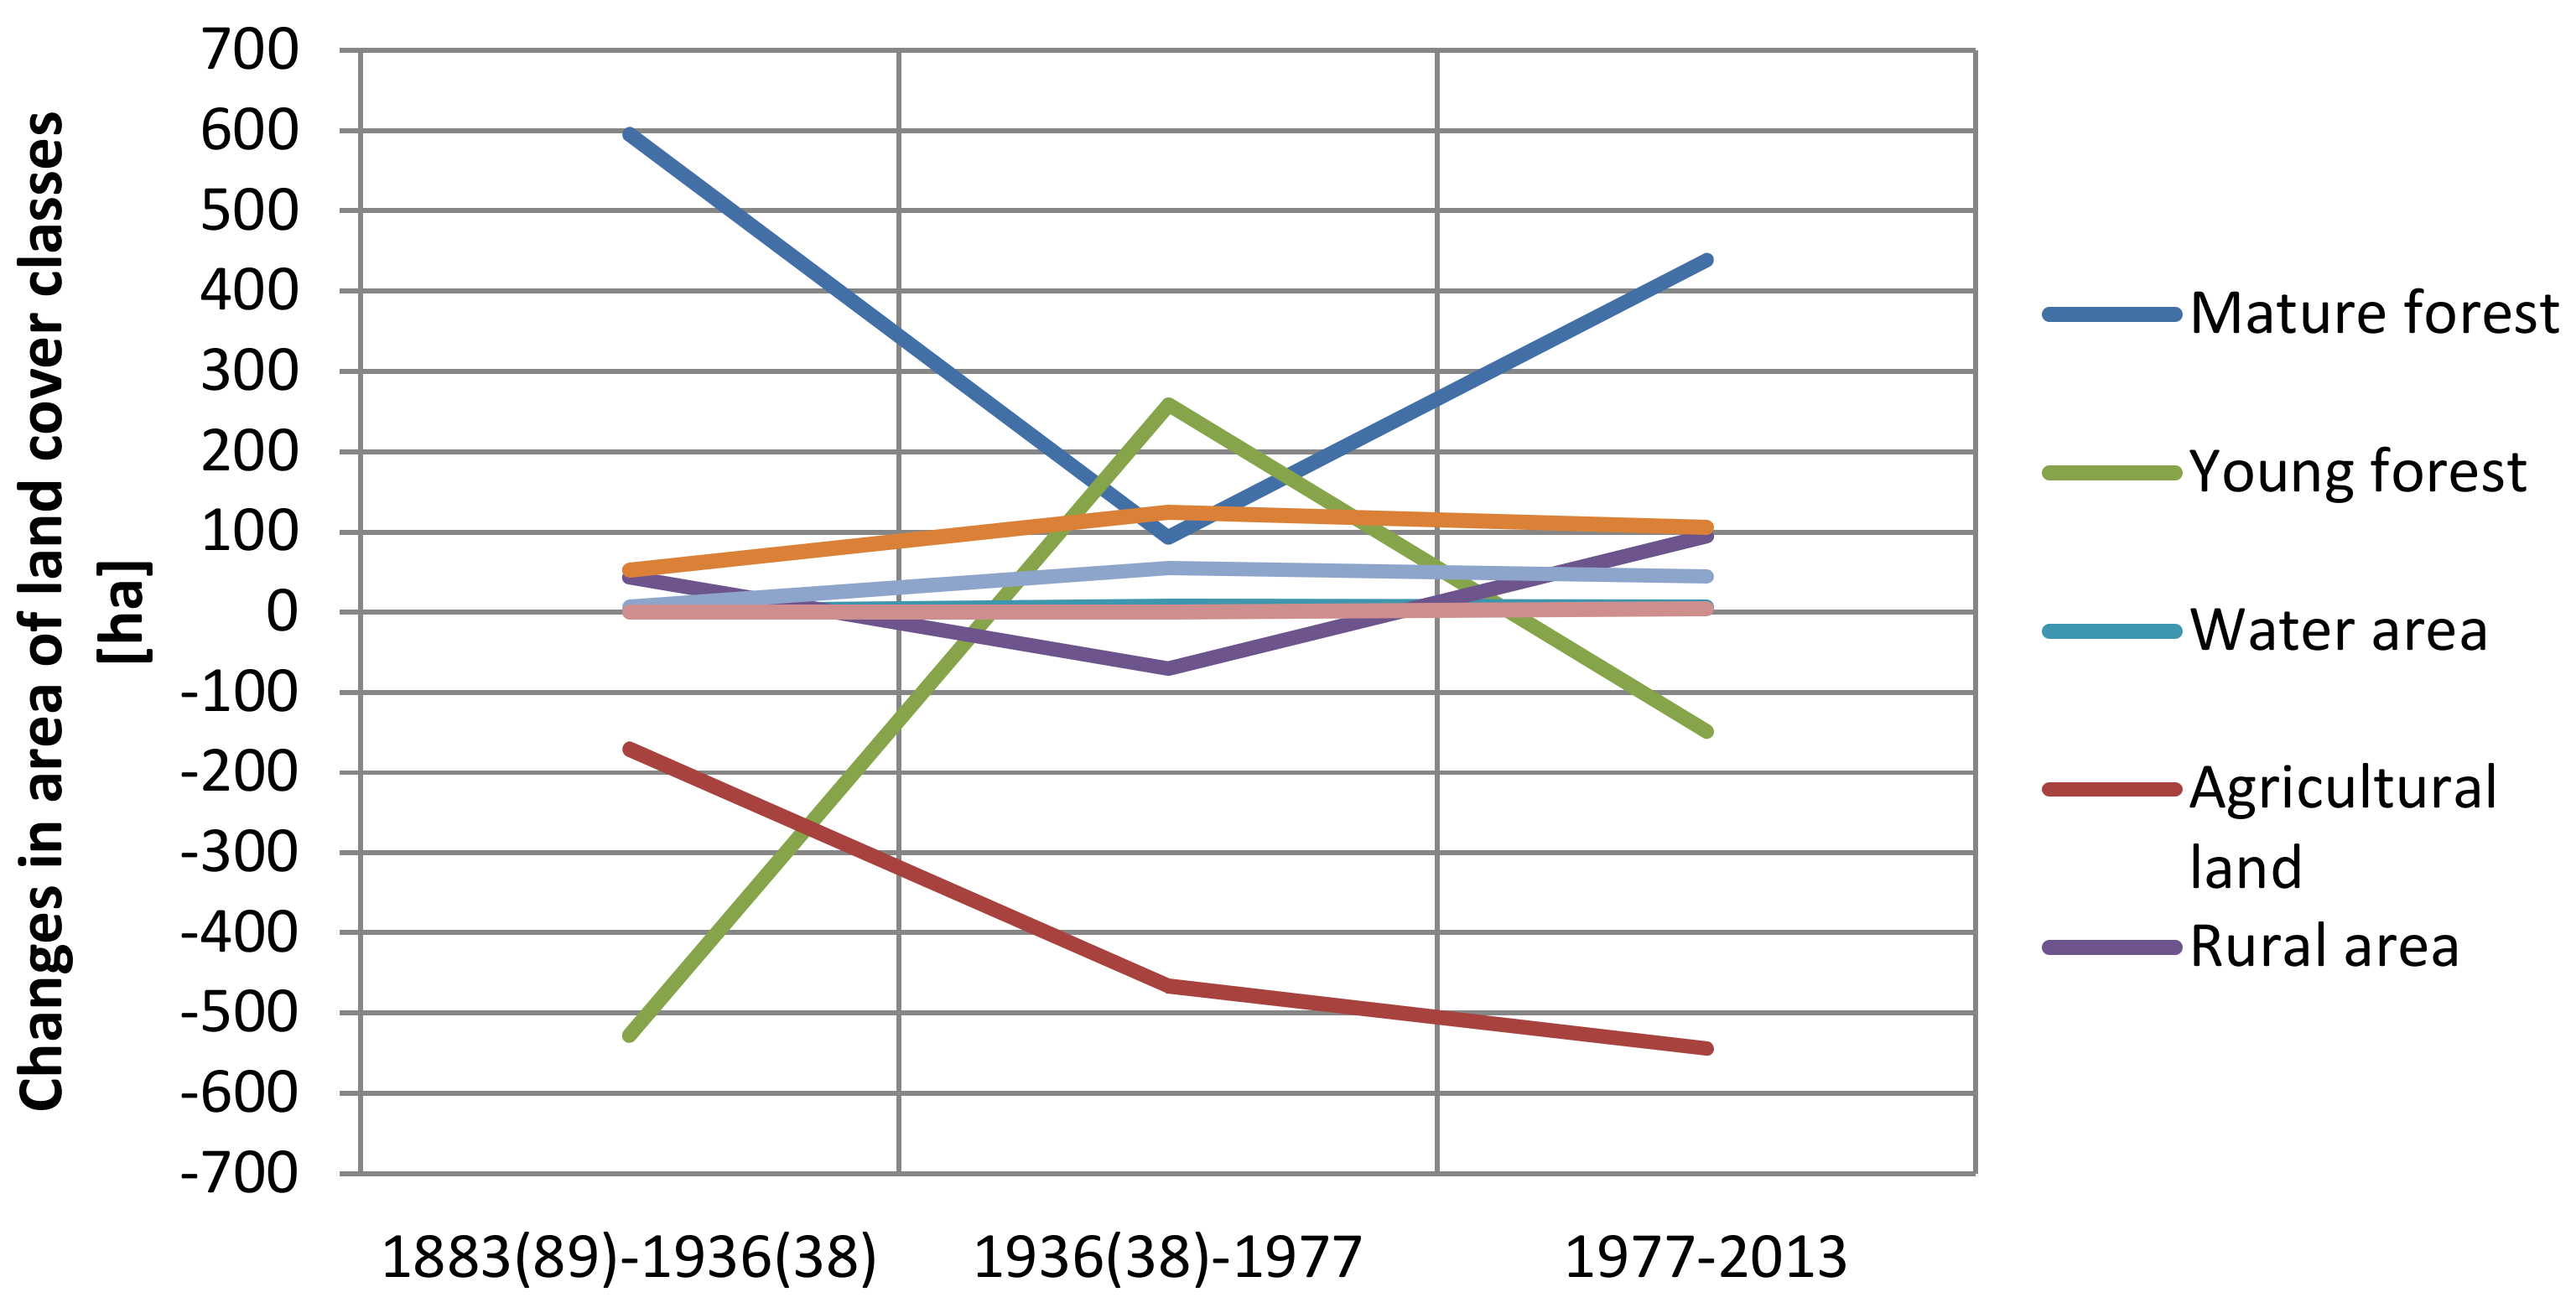
3.1. Changes in Forest and Non-Forest Land Cover in the Years 1883–2013

Changes in the area of land cover classes is one of the main indicators of landscape dynamics. Analyses of four prepared land cover maps (Figure 2) show that the area covered with forest has systematically increased in particular periods, mainly at the expense of the area used for agriculture. There were also significant transformations within the forest area—some parts were temporarily deforested and some of the young forests reached a mature age. No young forests were found in 1936(38) within the research area, but the plantation and forest nurseries are mentioned in the source map legend. The area of rural, urban development, and mining also systematically increased. Changes of the area of land cover classes in each period are presented in Figure 3.
In the first of the analyzed time intervals, 1883(89)–1936(38), there was a slight increase in the area covered with forests, from 29.32% to 29.75%. However, at that time, there were transformations within the forest structure—significant areas of young forests occupying 3.34% of the study area had already developed a mature structure. The largest increase (2.22%) of forest area was recorded between 1936(38) and 1977. In 2013, the forest area reached a value of 33.11%. Among the areas not covered with the forest, there was a systematic increase in the area of rural development, with the exception of the period 1936(38)–1977 when part of the rural area was included in the city limits of Sobótka. The mining area also systematically increased from 1936(38) to 2013. This was related to the expansion of one of the largest granite mines in Lower Silesia, located in the Northern part of the study area. Agricultural areas decreased systematically from 65.86% in 1883(89) to 58.38% in 2013. The largest decreases occurred in the periods 1936(38)–1977 and 1977–2013. Changes in the area of land cover classes are shown in Figure 4
The largest changes within the areas covered by the forest occurred in the period 1883(89)–1936(38). The landscape change index level (LCI) for this period of time was more than twice as high as the index for the period 1977–2013 and more than three times higher than in 1936(38)–1977 (Table 5). Significantly lower dynamics of changes concerned areas not covered by forest in the period 1883(89)–1936(38). The LCI in this period was almost three times lower than in the subsequent analyzed periods. It can be observed that the LCI for the whole area in the period 1883(89)–1936(38) is comparable to the indicator for the period 1977–2013. In the first of these periods, the changes concerned mainly area covered with forest and in the second, they mainly concerned non-forest area.
An analysis of landscape transformations showed a total of 1302 polygons with a total area of 2236.1 ha that have changed since 1883(89). In the period 1883(89)–1936(38), the vast majority of recorded transformations (more than 60%) were changes from areas originally used for agriculture to areas of mature forest. The largest area of change concerned transformations of young forest to mature forest. However, new areas of young forests were not detected in 1936(38). About half of the transformations in 1936(38)–1977 were connected with the abandonment of agricultural land process as well as forest succession. Temporary and permanent deforestation was detected in 22% of changes. The average area of permanent deforestation was two times lower than that of temporary deforestation. The third of the analyzed time periods, 1977–2013, was characterized by the largest total number of changes, but the area of change decreased in comparison with previous analyzed periods. There were many temporary deforestations within the areas of mature forest and permanent deforestation in order to acquire new areas for agricultural activity. A greater area of deforestation was also recorded in order to acquire new areas for development and mining. The full list of landscape transformations types is presented in Table 6 and Figure 5.

3.2. Driving Forces of Changes in Forest Landscapes between 1883(89) and 2013

3.2.1. Natural Driving Forces of Landscape Change

In the first analyzed period, 1883(89)–1936(38), most of the changes concerned areas located at an average elevation of 250 to 300 m a.s.l. There were almost no changes at elevations higher than 400 m a.s.l. Transformations within forest areas (type A) were mainly observed in the 200–250 m a.s.l range, changes of forest landscapes into non-forest landscapes (type B) at elevations lower than 200 m a.s.l and changes of non-forest landscapes into forest landscapes (type C) in the ranges from 200 to 300 m a.s.l. In the next period, 1936(38)–1977, a reduction in the percentage of changes which concerned transformations at elevations less than 200 m a.s.l was noticeable. The percentage of transformations at elevations above 350 m increased as a result of changes within forest landscapes (type A). The largest number of such changes occurred mainly at elevations from 250 to 350 m a.s.l. Transformations from forest landscapes into non-forest landscapes (type B) and from non-forest landscapes into forest landscapes (type C) dominated at elevations from 200 to 300 m a.s.l. Most changes in the third analyzed period, 1977–2013, were in the ranges from 200 to 250 m a.s.l. and from 250 to 300 m a.s.l., while in areas below 200 m a.s.l., the changes occurred slightly more frequently than in the previous period. On the other hand, the percentage of changes observed at elevations higher than 350 m a.s.l. increased. When we look at the types of changes, it can be observed that transformations within forest areas (type A) dominated at 300–350 m a.s.l., while a larger percentage of forest landscape transformations into non-forest ones (type B) was recorded at lower elevations, from 200 to 250 m a.s.l.
The second analyzed factor was the average slope of the changed area. In each of the analyzed periods, about 65% of observed changes concerned areas with an average slope in the range of 1– 10%, while 31% of landscape transformations took place on slopes with an average grade of 20–30%. In the context of dominant hillside exposure the percentage share of changes was at a similar level in all analyzed periods of time. Among the areas where flat surface is not dominant, most changes were observed on the Northern and Northeastern exposures of the hillside, and the least number of changes were observed on the western, northwestern, and southwestern exposures of the hillside (see Figure 6).

3.2.2. Socioeconomic Driving Forces of Landscape Change

The group of socioeconomic driving forces of landscape changes includes, among others, population changes [57] and distances to roads, well-known facilities, places, or local service centers [58]. In the context of human population changes, we can observe that total number of people in the study area decrease slightly from 17,727 in 1885 to 16,339 in 2013. The number of people living in urban and rural areas has changed significantly. Only 2344 people lived in Sobótka in 1885, while 15,383 people lived in rural areas. The number of residents grew slightly to 17,819 in 1941. Human population of the city of Sobótka increased to 3412 inhabitants. The number of inhabitants in the rural part of the study area significantly decreased to 1978 as a result of population loss and mass displacement of native inhabitants in the post-war period. A total of 6043 people lived in Sobótka city, and 9729 lived in the rural areas. The population of the city of Sobótka increased to 7030 people, and the number of inhabitants of rural areas decreased to 9369 people in 2013. The changes in the human population in the study area are shown in Figure 7.
Most of the transformations occurred within the Sobótka precinct where Ślęża mountain is located, and within Jaźwina, Tąpadła, and Słupice precinct where Radunia mountain is located. A comparison of this indicator with population changes showed that less changes were observed in areas where the number of inhabitants in particular periods did not change significantly. The largest numbers of changes were identified in precincts where population changes were more noticeable.
The next analyzed factor from socioeconomic group of driving forces was the distance of areas that have changed from the centers of the surrounding municipalities (Figure 8). In all analyzed periods, the highest percentage of change concerned areas located at a distance of 6–8 km from the center of a municipality. The fewest changes were observed at distances of less than 2 km from the center of a municipality because only one municipality is located within the research area. The largest differences between the analyzed periods were noticed in the case of changes in locations at a distance of more than 8 km from the center of a municipality. Changes in forest areas (type A) were most frequently found at distances of 6–8 km and more than 8 km from the center of a municipality. The percentage of changes at a distance of more than 8 km increased in each subsequent period. Changes of forest landscapes into non-forest landscapes (type B) were observed to have occurred at a similar level at distances of 4–6 and 6–8 km from the center of a municipality. In the case of transformations of non-forest landscapes into forest landscapes (type C), the vast majority concerned locations at distances of 6–8 km from a municipality.
The second factor was the distance from a main road. In this context, changes were most frequently observed in all analyzed periods at distances of up to 500 m and from 500 to 1000 m from main roads. However, when we compared the periods, a systematic increase in the percentage of change at greater distances from the main roads was noticeable. For example, the percentage of change at a distance of 1500–2000 m increased from 4.11% in 1883(89) to 10.85% in 2013. The percentage of changes observed at a distance of 500–1000 m from the main road decreased from 1883(89) to 2013 more than 10%. The dominance of changes within forest-covered areas (type A) characteristically occurred at distances of 500 to 1500 m from the main road, although at larger distances, an increase in the change effect was noticeable. Transformations from forest landscapes into non-forest ones (type B) were recorded mainly at a distance of less than 500 m and from non-forest to forest landscapes (type C) also at a distance of 500 to 1000 m.
The last element of the analysis was the distance of observed changes from built-up areas. In this aspect, the ratio of locations with changes located less than 250 m from built-up areas (about 30%) was maintained at a similar level in all periods. On the other hand, the percentage of changes at locations at a distance of 250–500 m decreased systematically from 1883(89) to 2013. At the same time, the number of transformations located at distances greater than 750 m from built-up areas increased. Most changes in forest areas (type A) were observed at a distance of 750–1000 m from built-up areas. The vast majority of forest landscape transformations into non-forest landscapes (type B) covered areas less than 250 m from built-up areas. Similarly, in the case of changes from non-forest into forest landscapes (type C), the highest percentage of change was observed at distances of less than 250 m, as well as at distances of 250 to 500 m from built-up areas.

4. Discussion

Land cover analyses showed that the area covered by forests within the present limits of Ślęża Landscape Park increased from 29.32% at the end of the 19th century to 33.80% in 2013. Szymura et al. indicate that forest area increased of the entire Sudeten area from 30.4% in the 18th century to 36.4% in the 20th century [56]. The same situation has also been observed in other mountainous areas in Poland. An example of such process is the Beskid Mountains [59]. However, despite the increase in the forest area, the percentage of forest-covered area still remains smaller than in other mountain and foothill areas [60]. At the same time, it is higher than that in lowland areas [45]. This is the effect of the rather low elevation of the area, which favors agricultural land use; in particular, it includes areas below 200 m a.s.l.
The level of changes in forest and non-forest landscapes in particular periods, as indexed by the landscape change index, is difficult to compare with other research results, because studies using this index have not been used to analyze historical data—only contemporary data [41]. Considering the nature of the indicator used, based on the relative data obtained from cartographic analyses, a comparison with other areas would be possible only if the same source materials were used. It should be assumed that the accuracy of the data increases when more advanced methods can be used for the interpretation and processing of field or aerial data. Therefore, there was a difference in the number of changes identified from the prepared land cover maps. It grew in successive periods. In the first analyzed time interval, only 73 polygons representing changes in land cover were identified; in the second period, 492; and in the third, 737. Because of differences in the ability to obtain data of the same scale and degree of data generalization, the results of research should be interpreted with the use of relative rather than absolute data [61]. The approach of mapping the interactions between factors influencing urban development and environmental resources, which was used in the presented paper, corresponds with the latest studies in the field of socio-environmental vulnerability [62].
The basic factor which determines land cover within research area are topographical conditions. The slopes of Ślęża and surrounding hills have been covered with forests for years, and settlement areas are developing in the foothills, while arable land dominate in flat areas. Weak soil is mentioned in literature as the basic driving force behind changes in forest landscapes [63]; however, as shown by Szymura et al. [56], in the Sudety area, the soil type has not had a significant impact on landscape changes. Analyses of the driving forces of changes in forest landscapes have mainly concerned the Carpathian area [19,60,64], with its Polish part investigated less frequently [60,65]. There has been little research on the area of the Sudetes and its foothills. Generally, there has been a lack of research in Poland to allow comparisons of obtained results with other research. This was confirmed by Plieninger et al. [49] who showed that among 144 analyzed articles which identified driving forces of landscape change across Europe, only four referred to case studies located in Poland. In neighboring Germany, Czech Republic, and Slovakia, the number of such studies is much higher.
The analysis of the selected natural driving forces of landscape changes revealed that the topographical conditions of identified landscape transformations have changed over time. Changes related to forest area (type A) in the first analyzed period concerned elevations of 200–250 m a.s.l.; in the next, they occurred mainly at elevations of 250–350 m a.s.l.; and in the third period, they began to dominate at elevations of 300–350 m a.s.l. Landscape changes were identified at higher elevations in successive periods. Transformations of forest landscapes into non-forest landscapes (type B) and from non-forest to forest landscapes (type C) dominated at elevations of 200–300 m a.s.l. in all periods. In the lower-lying areas, these changes have been less frequent due to the increased area of arable land. The landscape remains basically unchanged at elevations greater than 350 m a.s.l. Areas with a slope from 1 to 10% and those in the north and Northeastern exposures of hillsides which are characterized by less sunlight are more susceptible to change. A smaller terrain slope makes landscape transformation easier, especially in terms of newly built-up areas as well as in areas of deforestation. On the northern slopes, these changes remain less visible due to the shorter lighting time.
The analysis of selected socioeconomic driving forces of landscape change showed that the stabilization of the population in the analyzed period helped to reduce the number of landscape changes. In areas where changes in the population were greater, more landscape changes were also observed. Transformations of forest-covered areas were the most common in the areas farthest away from the center of a municipality—at distances of 6–8 km and over 8 km. The other types of changes most commonly occurred at distances of 4–6 km and 6–8 km from the center of a municipality. The distances to the main road and built-up area also played important roles in the distribution of change types. Transformations within forest landscapes usually occurred at distances of 500–1500 m from main roads and 500–1250 m from built-up areas. Relatively close locations were preferred for the transportation of timber. Changes from forest landscapes into non-forest landscapes dominated at distances of less than 500 m from main roads and less than 250 m from built-up areas which is connected mainly with the locations of new buildings being close to existing ones with good access to roads. Changes of non-forest landscapes into forests were commonly identified at distances of 0–1000 m from major roads and at distance of 0–500 m from building areas. This was connected with the progressive process of succession close to the forest border.
In order to fully understand the changes that took place in forest landscapes during the discussed period of time, it was important to consider changes in the broader context of the political environment, cultural, and technological events. That is why we analyzed the chronicles of events and literature of those that could have influenced landscape changes. The political and technological driving forces of landscape changes from 1883(89)–1936(38) included changes in forest management policy. After a period of very strong forest exploitation in the 18th century and the beginning of the 19th century, the demand for wood in Prussia decreased significantly. Additionally, as a result of the inflow of capital from war contributions, the sale of state forests stopped. Gradually, due to the development of modern forestry sciences, which occurred at the end of the 19th century, the level of forest cover increased. The reason for this was a favorable tax policy, as a result of which large areas of land of poor quality, unsuitable for agriculture, were afforested. The use of appropriate tax rates indirectly protected forest landscapes, especially in mountainous areas [66]. An important technological event was a new railway line from Wrocław to Sobótka that was built in 1885. It influenced the development of the city in the Northern part, but also enabled the intensification of the extraction of minerals [67]. In the second analyzed period, after the end of the Second World War, the geopolitical situation changed completely. Lower Silesia became a part of Poland. The population was displaced—people from the Eastern part of pre-war Poland came to the research area. The top of Ślęża mountain has been protected since 1954 as a nature reserve. In 1973, two neighboring rural areas were included in the city limits of Sobótka. The political system in Poland changed in 1989—the period of communism ended after 50 years. An important event was the establishment of a landscape park of the entire area of the Ślęża Massif in 1988. In 2004, Poland joined the European Union, which was another indirect cause of change [30]. Due to the subsidies for afforested, poor quality, arable land within the study area, new forest areas have begun to appear quickly.

5. Conclusions

This study of the area covering the present borders of Ślęża Landscape Park related to the landscape changes in the period 1883(89)–2013 successfully measured the levels of landscape change in the three analyzed periods of time covering approximately 40–50 years. The analyses showed that the level of change in forest-covered areas was the highest in 1883(89)–1936(38) and in 1977–2013 for non-forest areas. Moreover, results of the studies on the landscape change index (LCI) show that it can be successfully used to determine the level of historical landscape change. Our results revealed that the percentage of area covered by forest has systematically grown since the end of the 19th century, mainly at the expense of agricultural land. The most frequently identified changes occurred in forest-covered areas and were connected with the temporary deforestation, maturation of forests and afforestation, especially transformations from agricultural land to mature forest area.
The study revealed that landscape transformations inside forest-covered areas have been located at higher elevations in successive periods while other drivers, like the slope grade and exposure of the hillside, have been constant. Analyses of socioeconomic driving forces of changes showed that they may be considered as one of the causes of landscape changes, but more studies are required. It should be noted that research may contain some errors, which can be the result of inaccuracies in the mapping of changes, and limitations related to the lack of analysis of cause and effect relationships between driving forces and landscape changes. However, this research provides valuable insight into the landscape changes of the last 140 years, introduces a new tool for assessing the level of historical landscape transformation (LCI), and indicates the direction of further study on driving forces behind landscape change of Ślęża Landscape Park.

Author Contributions

Methodology, P.K.; Data curation, all authors; Formal analysis, P.K. and I.S.; Investigation: P.K.; Writing—Original Draft Preparation, P.K., Writing—Review & Editing, P.K. and K.M.

Funding

This research was co-funded by the Polish National Science Centre, grant number 2013/09/D/HS4/01858. We are also grateful to the Ministry of Science and Higher Education (MNiSW, Poland) for supporting open access publishing in the framework of the Statutory funds of Department of Land Management, Wroclaw University of Environmental and Life Sciences.

Acknowledgments

The authors would like to give special thanks to the administration of the Lower Silesian Association of Landscape Parks for providing data for the analysis. Pre-print version of the manuscript titled “Driving Forces behind Forest Landscape Change in Ślęża Landscape Park (Southwester Poland) in 1883–2013” was initially submitted to the MDPI Platform www.preprints.org.

Conflicts of Interest

The authors declare no conflict of interest.

References

  1. Vitousek, P.M.; Mooney, H.A.; Lubchenco, J.; Melillo, J.M. Human Domination of Earth’s Ecosystems. Science 1997, 277, 494–499. [Google Scholar] [CrossRef]
  2. Antrop, M. Landscape change and the urbanization process in Europe. Landsc. Urban Plan. 2004, 67, 9–26. [Google Scholar] [CrossRef]
  3. Bičík, I.; Kupková, L.; Jeleček, L.; Kabrda, J.; Štych, P.; Janoušek, Z.; Winklerová, J. Land Use Changes in the Czech Republic 1845–2010: Socio-Economic Driving Forces. Springer: Basel, Switzerland, 2015; ISBN 978-3-319-17671-0. [Google Scholar]
  4. Łowicki, D. Land use changes in Poland during transformation: Case study of Wielkopolska region. Landsc. Urban Plan. 2008, 87, 279–288. [Google Scholar] [CrossRef]
  5. Skokanová, H.; Falťan, V.; Havlíček, M. Driving forces of main landscape change processes from past 200 years in Central Europe—differences between old democratic and post-socialist countries. Ekológia (Bratislava) 2016, 35, 50–65. [Google Scholar] [CrossRef]
  6. Heffner, K. Zmiany przestrzenne na obszarach wiejskich w Polsce w okresie transformacji i po wejściu do Unii Europejskiej. In Obszary wiejskie—wiejska przestrzeń i ludność, aktywność społeczna i przedsiębiorczość; Heffner, K., Klemens, B., Eds.; Studia KPZK PAN: Warsaw, Poland, 2016; pp. 12–27. [Google Scholar]
  7. Bičik, I.; Jeleček, L.; Štěpánek, V. Land-use changes and their social driving forces in Czechia in the 19th and 20th centuries. Land Use Policy 2001, 18, 65–73. [Google Scholar] [CrossRef]
  8. Peña, J.; Bonet, A.; Bellot, J.; Sánchez, J.R.; Eisenhuth, D.; Hallett, S.; Aledo, A. Driving forces of land-use change in a cultural landscape of Spain. In Modelling Land-use Change; Springer: Dordrecht, The Netherlands, 2007; pp. 97–116. ISBN 978-1-4020-6484-5. [Google Scholar]
  9. Liesovsky, J.; Bezak, P.; Spulerova, J.; Liesovsky, T.; Koleda, P.; Dobrovodska, M.; Bürgi, M.; Gimmi, U. The abandonment of traditional agricultural landscape in Slovakia—Analysis of extent and driving forces. J. Rural Stud. 2015, 37, 75–84. [Google Scholar] [CrossRef]
  10. Hersperger, A.M.; Bürgi, M. Driving forces of landscape change in the urbanizing Limmat Valley, Switzerland. In Modelling Land-Use Change; Springer: Dordrecht, The Netherlands, 2007; pp. 45–60. ISBN 978-1-4020-6484-5. [Google Scholar]
  11. Tokarczyk-Dorociak, K.; Kazak, J.; Szewrański, S. The Impact of a Large City on Land Use in Suburban Area—The Case of Wrocław (Poland). J. Ecol. Eng. 2018, 19, 89–98. [Google Scholar] [CrossRef]
  12. Zewdie, M.; Worku, H.; Bantider, A. Temporal Dynamics of the Driving Factors of Urban Landscape Change of Addis Ababa During the Past Three Decades. Environ. Manag. 2018, 61, 132–146. [Google Scholar] [CrossRef]
  13. Idczak, P.; Mrozik, K. Periurbanisation—Evidence from Polish metropolitan areas. Econ. Environ. Stud. 2018, 18, 183–202. [Google Scholar] [CrossRef]
  14. Przybyła, K.; Kulczyk-Dynowska, A. Transformations of Tourist Functions in Urban Areas of the Karkonosze Mountains. IOP Conf. Ser. Mater. Sci. Eng. 2017, 245, 072001. [Google Scholar] [CrossRef]
  15. Krajewski, P. Assessing changes in high-value landscape—Case study of the municipality of Sobotka in Poland. Polish J. Environ. Stud. 2017, 26, 2603–2610. [Google Scholar] [CrossRef]
  16. Saura, S.; Martín-Queller, E.; Hunter, M.L. Forest landscape change and biodiversity conservation. In Forest Landscapes and Global Change; Azevedo, J., Perera, A., Pinto, M., Eds.; Springer: New York, NY, USA, 2014; pp. 167–198. ISBN 978-1-4939-0953-7. [Google Scholar]
  17. Choi, J.; Lee, S.; Ji, S.Y.; Jeong, J.-C.; Lee, P.S.-H. Landscape Analysis to Assess the Impact of Development Projects on Forests. Sustainability 2016, 8, 1012. [Google Scholar] [CrossRef]
  18. Wu, Z.; Ge, Q.; Dai, E. Modeling the Relative Contributions of Land Use Change and Harvest to Forest Landscape Change in the Taihe County, China. Sustainability 2017, 9, 708. [Google Scholar] [CrossRef]
  19. Kruhlov, I.; Thom, D.; Chaskovskyy, O.; Keeton, W.S.; Scheller, R.M. Future forest landscapes of the Carpathians: Vegetation and carbon dynamics under climate change. Reg. Environ. Chang. 2018, 18, 1555–1567. [Google Scholar] [CrossRef]
  20. Mercuri, A.M.; Marignani, M.; Sadori, L. Palaeoecology and long-term human impact in plant biology, Plant Biosystems. Plant Biosyst. 2015, 149, 136–143. [Google Scholar] [CrossRef]
  21. Zanon, M.; Davis, B.A.S.; Marquer, L.; Brewer, S.; Kaplan, J.O. European Forest Cover During the Past 12,000 Years: A Palynological Reconstruction Based on Modern Analogs and Remote Sensing. Front. Plant Sci. 2018, 9, 253. [Google Scholar] [CrossRef] [PubMed]
  22. Antrop, M. Sustainable landscapes: contradiction, fiction or utopia? Landsc. Urban Plan. 2006, 75, 187–197. [Google Scholar] [CrossRef]
  23. Bürgi, M.; Hersperger, A.M.; Scheenberger, N. Driving forces of landscape change—Current and new directions. Landsc. Ecol. 2004, 19, 857–868. [Google Scholar] [CrossRef]
  24. Hersperger, A.M.; Bürgi, M. Going beyond landscape change description: Quantifying the importance of driving forces of landscape change in a Central Europe case study. Land Use Policy 2009, 26, 640–648. [Google Scholar] [CrossRef]
  25. Lin, X.; Wang, Y.; Wang, S.; Wang, D. Spatial differences and driving forces of land urbanization in China. J. Geogr. Sci. 2015, 25, 545–558. [Google Scholar] [CrossRef] [Green Version]
  26. Plieninger, T.; Bieling, C. (Eds.) Connecting cultural landscapes to resilience. In Resilience and the Cultural Landscape: Understanding and Managing Change in Human-shaped Environments; Cambridge University Press: New York, NY, USA, 2012; pp. 3–26. ISBN 978-1-107-02078-8. [Google Scholar]
  27. Mrozik, K.; Bossy, M.; Zaręba, K. Polityka przestrzenna gmin wiejskich na tle zmian zagospodarowania przestrzennego wynikających z suburbanizacji. Rocznik Ochrona Środowiska 2012, 14, 761–771. [Google Scholar]
  28. Solecka, I.; Raszka, B.; Krajewski, P. Landscape analysis for sustainable land use policy: A case study in the municipality of Popielów, Poland. Land Use Policy 2018, 75, 116–126. [Google Scholar] [CrossRef]
  29. Council of Europe. European Landscape Convention, Florence, 2000. ETS No. 176. Available online: http://conventions.coe.int/Treaty/en/Treaties/Html/176.htm. (accessed on 20 June 2018).
  30. Krajewski, P. Landscape change index as a tool for spatial analysis. J. IOP Mater. Sci. Engin. 2017, 245, 072014. [Google Scholar] [CrossRef]
  31. Kistowski, M. Wybrane Aspekty Zarządzania Ochroną Przyrody w Parkach Krajobrazowych; Uniwersytet Gdański: Gdańsk, Poland, 2004; ISBN 83-7326-188-5. [Google Scholar]
  32. Krajewski, P. Problemy planistyczne na terenach parków krajobrazowych w sąsiedztwie Wrocławia na przykładzie Ślężańskiego Parku Krajobrazowego. Res. Papers Wroclaw Univ. Econ. 2014, 367, 147–154. [Google Scholar] [CrossRef]
  33. Brandt, J.; Primdahl, J.; Reenberg, A. Rural land-use and dynamic forces—Analysis of ‘driving forces’ in space and time. In Land-use Changes and Their Environmental Impact in Rural Areas in Europe; Krönert, R., Baudry, J., Bowler, I.R., Reenberg, A., Eds.; UNESCO: Paris, France, 1999; pp. 81–102. ISBN 1-85070-047-8. [Google Scholar]
  34. Seabrook, L.; McAlpine, C.; Fensham, R. Cattle, crops and clearing: Regional drivers of landscape change in the Bridglow Belt, Queensland, Australia, 1840–2004. Landsc. Urban Plan. 2006, 78, 373–385. [Google Scholar] [CrossRef]
  35. Marucci, D. Landscape history as a planning tool. Landsc. Urban Plan. 2000, 49, 67–81. [Google Scholar] [CrossRef]
  36. Scheenberger, N.; Bürgi, M.; Hersperger, A.M.; Ewald, K.C. Driving forces and rates of landscape change as a promising combination for landscape change research—An application on the northern fringe of the Swiss Alps. Land Use Policy 2007, 24, 349–361. [Google Scholar] [CrossRef]
  37. Hersperger, A.M.; Gennaio, M.; Verburg, P.H.; Bürgi, M. Linking land change with driving forces and actors: Four conceptual models. Ecol. Soc. 2010, 15, 1–17. [Google Scholar] [CrossRef]
  38. Bürgi, M.; Straub, A.; Gimmi, U.; Salzmann, D. The recent landscape history of Limpach Valley, Switzerland: Considering three empirical hypotheses on driving forces of landscape change. Landsc. Ecol. 2010, 25, 287–297. [Google Scholar] [CrossRef]
  39. Bieling, C.; Plieninger, T.; Schaich, H. Patterns and causes of land change: Empirical results and conceptual considerations derived from a case study in the Swabian Alb, Germany. Land Use Policy 2013, 35, 192–203. [Google Scholar] [CrossRef]
  40. Lieskovský, J.; Kanka, R.; Bezák, P.; Štefunková, D.; Petrovič, F.; Dobrovodská, M. Driving forces behind vineyard abandonment in Slovakia following the move to a market-oriented economy. Land Use Policy 2013, 32, 356–365. [Google Scholar] [CrossRef]
  41. Krajewski, P. Landscape changes in selected suburban area of Bratislava (Slovakia). In Landscape and Landscape Ecology: Proceedings of the 17th International Symposium on Landscape Ecology; Halada, L., Baca, A., Boltizar, M., Eds.; Institute of Landscape Ecology, Slovak Academy of Sciences: Bratislava, Slovakia, 2016; pp. 110–117. ISBN 978-80-89325-28-3. [Google Scholar]
  42. Serra, P.; Pons, X.; Sauri, D. Land-cover and land-use change in a Mediterranean landscape: A spatial analysis of driving forces integrating biophysical and human factors. Appl. Geogr. 2008, 28, 189–209. [Google Scholar] [CrossRef]
  43. Geri, F.; Amici, V.; Rocchini, D. Human activity impact on the heterogeneity of Mediterranean landscape. Appl. Geogr. 2010, 30, 370–379. [Google Scholar] [CrossRef]
  44. Bürgi, M.; Bieling, C.; Von Hackwitz, K.; Kizos, T.; Liesovsky, J.; Martin, M.G.; McCarthy, S.; Müller, M.; Plieninger, T.; Printsmann, A. Processes and driving forces in changing cultural landscapes across Europe. Landsc. Ecol. 2017, 32, 2097–2112. [Google Scholar] [CrossRef]
  45. Szabo, P. Driving forces of stability and change in woodland structure: A case-study from the Czech lowlands. For. Ecol. Manag. 2010, 259, 650–656. [Google Scholar] [CrossRef]
  46. Loran, C.; Munteanu, C.; Verburg, P.H.; Schmatz, D.R.; Bürgi, M.; Zimmermann, N.E. Long-term change in drivers of forest cover expansion: An analysis for Switzerland (1850–2000). Reg. Environ. Chang. 2017, 17, 2223–2235. [Google Scholar] [CrossRef]
  47. Mwangi, H.M.; Lariu, P.; Julich, S.; Patil, S.D.; McDonald, M.A.; Feger, K.-H. Characterizing the Intensity and Dynamics of Land-Use Change in the Mara River Basin, East Africa. Forests 2018, 9, 8. [Google Scholar] [CrossRef]
  48. Frayer, J.; Müller, D.; Sun, Z.; Munroe, D.K.; Xu, J. Processes Underlying 50 Years of Local Forest-Cover Change in Yunnan, China. Forests 2014, 5, 3257–3273. [Google Scholar] [CrossRef] [Green Version]
  49. Plieninger, T.; Draux, H.; Fagerholm, N.; Bieling, C.; Bürgi, M.; Kizos, T.; Kuemmerle, T.; Primdahl, J.; Verburg, P.H. The driving forces of landscape change in Europe: A systematic review of the evidence. Land Use Policy 2016, 57, 204–214. [Google Scholar] [CrossRef]
  50. Regulation of the Lower Silesian Voivode dated 4 April 2007 regarding Ślęża Landscape Park. Available online: http://oi.uwoj.wroc.pl/dzienniki/Dzienniki_2007/Dz_U_Nr_94.pdf (accessed on 20 June 2018).
  51. Krajewski, P. Ślęża Landscape Park; Lower Silesian Association of Landscape Park: Wroclaw, Poland, 2012; ISBN 978-83-63166-03-8. [Google Scholar]
  52. Matuszkiewicz, W.; Faliński, J.B.; Kostrowicki, A.S.; Matuszkiewicz, J.M.; Olaczek, R.; Wojterski, T. Potential Natural Vegetation of Poland. General Map 1:300,000; IGiPZ PAN: Warszawa, Poland, 1995. [Google Scholar]
  53. Baude, M.; Meyer, B.C. Changes of landscape structure and soil production function since the 18th century in north-west Saxony. J. Environ. Geogr. 2012, 3, 11–23. [Google Scholar]
  54. Affek, A. Georeferencing of historical maps using GIS, as exemplified by the Austrian Military Surveys of Galicia. Geographia Pol. 2013, 86, 375–390. [Google Scholar] [CrossRef] [Green Version]
  55. Jaskulski, M.; Łukasiewicz, D.; Nalej, M. Comparison of methods for historical map transformation. Ann. Geomatics 2013, 11, 41–57. [Google Scholar]
  56. Szymura, T.H.; Murak, S.; Szymura, M.; Raduła, M.W. Changes in forest cover in Sudety Mountains during the last 250 years: Patterns, drivers, and landscape-scale implications for nature conservation. Acta Societatis Botanicorum Poloniae 2018, 87, 1–14. [Google Scholar] [CrossRef]
  57. Song, K.; Wang, Z.; Du, J.; Liu, L.; Zeng, L.; Ren, C. Wetland Degradation: Its Driving Forces and Environmental Impacts in the Sanjiang Plain, China. Environ. Manag. 2014, 54, 255–271. [Google Scholar] [CrossRef] [PubMed]
  58. Corona, R.; Galicia, L.; Palacio-Prieto, J.L.; Bürgi, M.; Hersperger, A.M. Local deforestation patterns and driving forces in a tropical dry forest in two municipalities of southern Oaxaca, Mexico (1985–2006). Investigaciones Geográficas 2016, 91, 86–104. [Google Scholar] [CrossRef]
  59. Sobala, M.; Rahmonov, O.; Myga-Piątek, U. Historical and contemporary forest ecosystem changes in the Beskid Mountains (southern Poland) between 1848 and 2014. iForest Biogeosci. For. 2017, 10, 939–947. [Google Scholar] [CrossRef] [Green Version]
  60. Szabó, P. Changes in woodland cover in the Carpathian Basin. In Human Nature: Studies in Historical Ecology and Environmental History; Szabó, P., Hédl, R., Eds.; Institute of Botany of the ASCR: Brno, Czech Republic, 2008; pp. 106–115. [Google Scholar]
  61. Plit, J. Analiza historyczna jako źródlo informacji o środowisku przyrodniczym. Problemy Ekologii Krajobrazu 2006, 16, 217–226. [Google Scholar]
  62. Szewrański, S.; Świąder, M.; Kazak, J.K.; Tokarczyk-Dorociak, K.; Van HooF, J. Socio-environmental vulnerability mapping for environmental and flood resilience assessment: The case of ageing and poverty in the city of Wroclaw, Poland. Integr. Environ. Assess. Manag. 2018, 14, 592–597. [Google Scholar] [CrossRef] [PubMed]
  63. Wulff, M.; Rujner, H. A GIS-based method for the reconstruction of the late eighteenth century forest vegetation in the Prignitz region (NE Germany). Landsc. Ecol. 2011, 26, 153–168. [Google Scholar] [CrossRef]
  64. Kozak, J. Forest cover change in the Western Carpathians in the past 180 years: A case study in the Orawa region in Poland. Mt. Res. Dev. 2003, 23, 369–375. [Google Scholar] [CrossRef]
  65. Munteanu, C.; Kuemmerle, T.; Boltiziar, M.; Butsic, V.; Gimmi, U.; Lúboš, H.; Kaim, D.; Király, G.; Konkoly-Gyuró, É.; Kozak, J.; et al. Forest and agricultural land change in the Carpathian region—A meta-analysis of long-term patterns and drivers of change. Land Use Policy 2014, 38, 685–697. [Google Scholar] [CrossRef]
  66. Nyrek, A. Kultura użytkowania gruntów uprawnych, lasów i wód na Śląsku od XV do XX wieku; Wydawnictwo Uniwersytetu Wrocławskiego: Wrocław, Poland, 1992. [Google Scholar]
  67. Staffa, M.; Mazurski, K.R.; Czerwiński, J.; Pisarski, G. Słownik geografii turystycznej Sudetów. Tom 20. Masyw Ślęży, Równina Świdnicka, Kotlina Dzierżoniowska; Wydawnictwo I-Bis: Wrocław, Poland, 2005. [Google Scholar]
Figure 1. Location and digital elevation model of the research area.
Sustainability 10 04526 g001
Figure 2. Changes in the land cover of the study area between 1883(89) and 2013: (a) map of land cover in 1883(89); (b) map of land cover in 1936(38); (c) map of land cover in 1977; (d) map of land cover in 2013.
Sustainability 10 04526 g002
Figure 3. The areas of land cover classes between 1883(89) and 2013.
Sustainability 10 04526 g003
Figure 4. Land cover changes in analyzed time intervals.
Sustainability 10 04526 g004
Figure 5. Area and number of different landscape changes in analyzed time intervals.
Sustainability 10 04526 g005
Figure 6. Maps of the analyzed natural driving forces of landscape change: (a) map of elevation; (b) map of slope grade; (c) map of hillside exposure.
Sustainability 10 04526 g006
Figure 7. Population changes in communes of Ślęża Landscape Park (source: population censuses from 1885, 1941, 1978, 2011).
Sustainability 10 04526 g007
Figure 8. Maps of the analyzed socioeconomic driving forces of landscape change: (A) map of the distance to a main road; (B) map of the distance to a built-up area; (C) map of the distance to the center of a municipality.
Sustainability 10 04526 g008
Table 1. Collected cartographic materials on a scale of 1:25,000 used to analyze changes in forest landscapes.
Map NameType of DataLand Cover ClassesMap SheetsDate of ReleaseSource of Data
Topographische Karte (Messtischblatt)raster dataforest, plantations and forest nurseries, meadows, pastures, arable land, wetland, marshland, fallow land, water areas, mining areas, urban and rural areas Zobten
Jordansmühl
Weizenrodau
Lauterbach
Mörschelwitz
1883
1889
1885
1883
1884
Library of Wroclaw University
Topographische Karte (Messtischblatt)raster dataforest, plantations and forest nurseries (not observed), meadows, pastures, arable land, wetland, marshland, fallow land, water areas, mining areas, urban and rural areas Zobten am Berge
Jordansmühl
Weizenrodau
Lauterbach
Rosenborn
1938
1938
1936
1936
1937
Library of Wroclaw University
Topographic map of Polandraster datamature forest, young forest, bushes, orchards, meadows, arable land, wetland, water areas, mining areas, urban and rural areasSobótka, Mysłaków, Dzierżoniów, Jordanów Śląski, Kobierzyce1977Head Office of Geodesy and Cartography
Database of Topographic Objectsvector datamature forest, young forest, bushes, orchards, meadows, pastures, arable land, wetland, fallow land, water areas, mining areas, landfill, urban and rural areas Sobótka, Mysłaków, Dzierżoniów, Jordanów Śląski, Kobierzyce2013Head Office of Geodesy and Cartography
Table 2. Classification of land cover types and subtypes.
Land Cover typeLand Cover SubtypeDescription of Class
Forest area (FA)Mature forest area (MFA)Areas covered with forest except young forest areas
Young forest area (YFA)Reforested woodland areas, plantations and forest nurseries
Non-forest area (NFA)Water area (WA)Water reservoirs and main watercourses
Agricultural land (AL)Arable land, meadows, pastures, bushes and orchards
Rural development area (RA)Built-up and recreational areas within all villages
Urban development area (UA)Built-up and recreational areas in the city of Sobótka
Mining area (MA)Existing quarries and material storage areas
Other area (OA)Other unclassified land cover classes, such as wetland, marshland, fallow land, landfills, and forest parking lots
Table 3. Classification of types and subtypes of forest landscape changes.
Type of Forest Landscape ChangeSubtype of Forest Landscape ChangeCode of Change
Transformations within forest landscapes (temporary deforestation, maturation of forest)Change from a mature forest area into a young forest area (MFA-YFA)A1
Change from a young forest area into a mature forest (YFA-MFA)A2
Transformation from forest landscapes into non-forest landscapes (permanent deforestation)Change from a mature forest area into agricultural land (MFA-AL)B1
Change from a mature forest area into a rural development area (MFA-RA)B2
Change from a mature forest area into an urban development area (MFA-UA)B3
Change from a mature forest area into a mining area (MFA-MA)B4
Transformation of non-forest landscapes into forest landscapes (afforestation)Change from agricultural land into a young forest area (AL-YFA)C1
Change from agricultural land into a mature forest area (AL-MFA)C2
Change from a mining area to a mature forest area (MA-MFA)C3
Table 4. Analyzed driving forces of changes in forest landscapes.
Group of Driving ForcesType of Driving ForceData SourceVariables Used to Quantify Factors
NaturalSlope grade
Hillside exposure
Elevation
Map of slope grade from the digital elevation model (DEM)
Map of the hillside exposure from the DEM
Map of elevation from the DEM
Slope (%)
Hillside exposure (Flat, N, NE, E, SE, S, SW, W, NW)
Elevation (m a.s.l.)
SocioeconomicHuman demographic changes
Distance to the main roads
Distance to the capital of municipality
The distance to the built-up area
Population censuses from 1885, 1941, 1978, and 2011
Land cover maps from four time periods
Number of inhabitants in each village (pcs.)
Distances to national, provincial, and county roads (km)
Distance to the center of the capital of the 5 nearest municipalities (km)
Distance to the nearest border of built-up area (km)
PoliticalPolitical events—national and localChronicles of events, literature-
CulturalCultural events, social changesChronicles of events, literature-
TechnologicalChanges in crop technology and forest managementChronicles of events, literature-
Table 5. Dynamics of changes in land cover in the research area between 1883(89) and 2013.
Time IntervalIndicatorForest AreaNon-Forest Area
MFA 1YFA 2WA 3AL 4RA 5UA 6MA 7OA 8
1883(89)–1936(38)CA (%)3.77 –3.34 0.01–1.080.28 0.33 0.040
LCI3.550.87
1936(38)–1977CA (%)0.59 1.63 0.04–2.95–0.45 0.79 0.350
LCI1.112.29
1977–2013CA (%)2.78 –0.94 0.04–3.440.60 0.67 0.280.02
LCI1.862.53
1 Mature forest area; 2 young forest area; 3 water area; 4 agricultural land; 5 rural area; 6 urban area; 7 mining area; 8 other area.
Table 6. Types and subtypes of forest landscape changes between 1883(89) and 2013; NP: number of polygons; AS: average size of polygon; TA: total area of change
Type of Change 1Subtype of Change 21883(89)–1936(38)1936(38)–19771977–2013
NP
(pcs)
AS
(ha)
TA
(ha)
NP
(pcs)
AS
(ha)
TA
(ha)
NP
(pcs)
AS
(ha)
TA
(ha)
AA100.00.01122.1235.21290.682.1
A2957.5517.70001162.1248.8
BB1103.534.91061.0108.4931.2112.0
B230.61.8000240.49.2
B300.0.00050.63.0
B470.31.823.46.771.812.3
CC1000150.914.1260.819.6
C2442.6116.02431.6396.23280.9310.1
C3000140.22.590.43.7
Total number/area of changes73-672.2492-763.1737-800.8
1 A: temporary deforestation, maturation of forest; B: permanent deforestation; C: afforestation; 2 A1: change of mature forest area into young forest area; A2: change of young forest area into mature forest; B1: change of mature forest area into agricultural land; B2: change of mature forest area into rural development area; B3: change of mature forest area into urban development area; B4: change of mature forest area into mining area; C1: change of agricultural land into young forest area; C2: change of agricultural land into mature forest area; C3: change of mining area to mature forest area.

