Article

Assessing Impacts of Soil Management Measures on Ecosystem Services

by
Gudrun Schwilch
1,2,*,
Tatenda Lemann
1,
Örjan Berglund
3,
Carlo Camarotto
4,
Artemi Cerdà
5,
Ioannis N. Daliakopoulos
6,
Silvia Kohnová
7,
Dominika Krzeminska
8,
Teodoro Marañón
9,
René Rietra
10,
Grzegorz Siebielec
11,
Johann Thorsson
12,
Mark Tibbett
13,
Sandra Valente
14,
Hedwig Van Delden
15,16,
Jan Van den Akker
10,
Simone Verzandvoort
10,
Nicoleta Olimpia Vrînceanu
17,
Christos Zoumides
18 and
Rudi Hessel
10
1
Centre for Development and Environment (CDE), University of Bern, Hallerstrasse 10, 3012 Bern, Switzerland
2
Federal Office for the Environment FOEN, Soil Section, CH-3003 Bern, Switzerland
3
Department of Soil and Environment, Swedish University of Agricultural Sciences, P.O. Box 7014, 750 07 Uppsala, Sweden
4
Department of Agronomy, Food, Natural resources, Animals and Environment (DAFNAE), University of Padova, 35020 Padova, Italy
5
Soil Erosion and Degradation Research Group, Department of Geography, University of Valencia. Blasco Ibáñez 28, 46010 Valencia, Spain
6
School of Environmental Engineering, Technical University of Crete, 73100 Chania, Greece
7
Department of Land and Water Resources Management, Faculty of Civil Engineering, Slovak University of Technology, Radlinského 11, 810 05 Bratislava, Slovakia
8
Norwegian Institute of Bioeconomy Research, Frederik A. Dahls vei 20, 1430 Aas, Norway
9
IRNAS, CSIC, Av. Reina Mercedes 10, 41012 Seville, Spain
10
Wageningen Environmental Research, P.O. Box 47, 6700 AA Wageningen, The Netherlands
11
Department of Soil Science Erosion and Land Protection, Institute of Soil Science and Plant Cultivation—State Research Institute, Czartoryskich 8, 24-100 Pulawy, Poland
12
Soil Conservation Service of Iceland, 851 Hella, Iceland
13
Centre for Agri-Environmental Research and Soil Research Centre, School of Agriculture, Policy and Development, University of Reading, Reading RG6 6AR, UK
14
Centre for Environmental and Marine Studies (CESAM), University of Aveiro, Campus Universitário de Santiago, 3810-193 Aveiro, Portugal
15
Research Institute for Knowledge Systems (RIKS), Hertogsingel 11B, 6211 NC Maastricht, The Netherlands
16
School of Civil, Environmental and Mining Engineering, The University of Adelaide, Adelaide SA 5005, Australia
17
National Research and Development Institute for Soil Science, Agrochemistry and Environment, Bd. Marasti 61, Sector 1, 011464 Bucharest, Romania
18
The Cyprus Institute, Energy, Environment and Water Research Center, 20 Konstantinou Kavafi Street, Nicosia 2121, Cyprus
*
Author to whom correspondence should be addressed.
Sustainability 2018, 10(12), 4416; https://doi.org/10.3390/su10124416
Submission received: 17 September 2018 / Revised: 9 November 2018 / Accepted: 19 November 2018 / Published: 26 November 2018
(This article belongs to the Special Issue Assessment and Governance of Sustainable Soil Management)

Abstract

:
Only a few studies have quantified and measured ecosystem services (ES) specifically related to soil. To address this gap, we have developed and applied a methodology to assess changes in ecosystem services, based on measured or estimated soil property changes that were stimulated by soil management measures (e.g., mulching, terracing, no-till). We applied the ES assessment methodology in 16 case study sites across Europe representing a high diversity of soil threats and land use systems. Various prevention and remediation measures were trialled, and the changes in manageable soil and other natural capital properties were measured and quantified. An Excel tool facilitated data collection, calculation of changes in ecosystem services, and visualization of measured short-term changes and estimated long-term changes at plot level and for the wider area. With this methodology, we were able to successfully collect and compare data on the impact of land management on 15 different ecosystem services from 26 different measures. Overall, the results are positive in terms of the impacts of the trialled measures on ecosystem services, with 18 out of 26 measures having no decrease in any service at the plot level. Although methodological challenges remain, the ES assessment was shown to be a comprehensive evaluation of the impacts of the trialled measures, and also served as an input to a stakeholder valuation of ecosystem services at local and sub-national levels.

1. Introduction

Ecosystem services (ES) specifically related to soil have recently become increasingly important to justify and support sustainable soil management for the mitigation or prevention of soil threats. However, the extensive literature on ES contains only a few studies that have quantified and measured soil-related ES [1,2,3]. Rutgers et al. [4] developed a method to quantify soil quality indicators on arable farms, with land users and experts giving scores to various ES indicators. Schulte et al. [5] identified proxy indicators for five soil functions based on agro-environmental indicators from current policy debates on interactions between agriculture and environment. Dominati et al. [6] worked with a comprehensive list of proxies for each service and units for measuring them, but omitted cultural services due to their non-biophysical nature and the related challenges of quantifying them. Van Oudenhoven et al. [7] applied the cascade model of Haines-Young and Potschin [8] to a multifunctional rural landscape in the Netherlands for the assessment of land management effects.
Although these frameworks reflect the specific contributions soils make to ES, they are unable to reveal the changes in ES that are introduced by soil management measures. Additionally, there is a lack of methods on how to quantify the changes in ES based on measured changes of soil properties, which would allow us to assess and compare the impacts of different measures on ES. Our research attempts to fill this gap by developing and applying a methodology to quantify changes in ecosystem services that were stimulated by soil management measures. To this end, we have reviewed the current scientific debate and, in an earlier step, proposed an adapted framework for soil-related ES that is suited for practical application in the prevention and remediation of soil degradation across Europe [3]. The framework we proposed in [3], see Figure 1, is an adaptation of existing frameworks, achieved by integrating components of soil science while introducing a consistent terminology that can be understood by a variety of stakeholders. The rationale is that changes in the properties of natural capital influence soil processes, which in turn support the provision of ES. The benefits produced by these ES are explicitly or implicitly valued by individuals and society. Their valuation influences decision-making and policymaking at different scales, potentially leading to a societal response, such as improved land management.
In the 17 RECARE (‘Preventing and remediating degradation of soils in Europe through land care’. EU FP7 project 2013–2018. www.recare-project.eu [9]. The main aim of RECARE was to develop effective prevention, remediation, and restoration measures using an innovative transdisciplinary approach, actively integrating and advancing knowledge of stakeholders and scientists in case studies, covering a range of soil threats in different bio-physical and socio-economic environments across Europe) case study sites across Europe, various soil management measures—selected by local stakeholders in a participatory workshop and targeting prevention, remediation, and restoration of a range of soil threats on various land use systems—were trialled (Table 1). The resulting changes in manageable soil and other natural capital properties were assessed and quantified. In this paper, we present how we developed a methodology to assess changes in ES based on these measured and estimated changes in soil properties. The aim was to develop and apply a methodology to provide a comprehensive appraisal of the impact of each measure on ES, including cultural ES, which have largely been under-represented in ES assessments to date [10]. We then present the results of the assessment of 26 different measures from 16 case study sites and discuss their interpretation as well as the methodological challenges. The ES assessment presented here served as an input to enable stakeholders at the local and subnational levels to determine and negotiate their valuation of ES in a deliberative process.

2. Materials and Methods

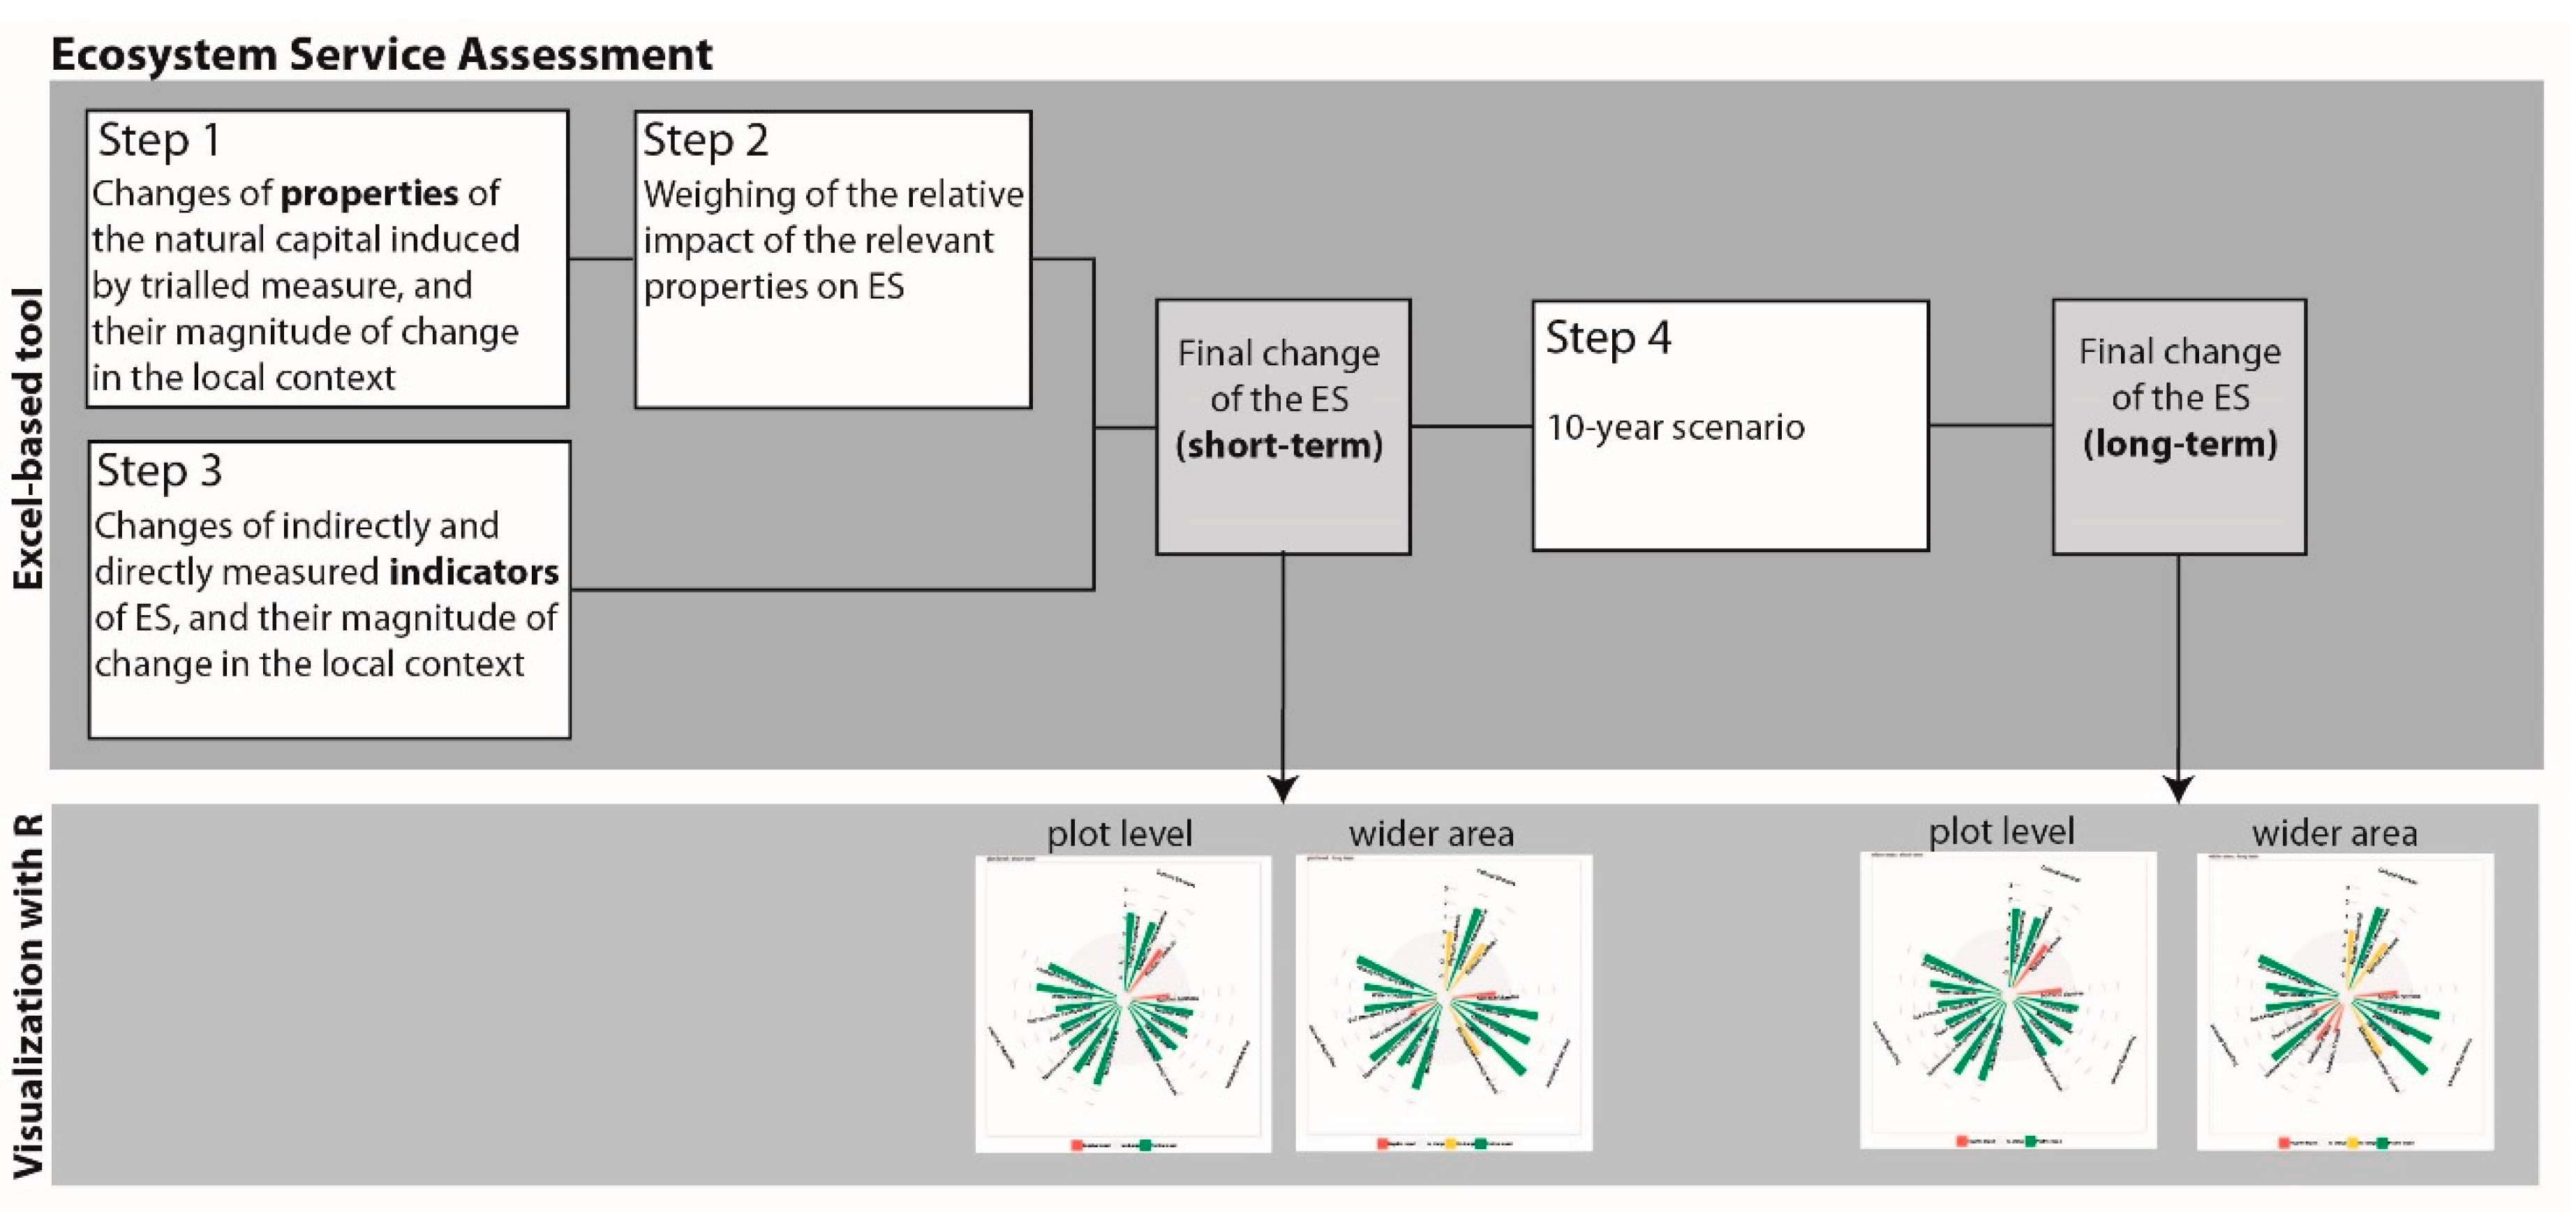
2.1. Developing a Practical Methodology to Assess ES

Several authors have reviewed available methodologies to assess ES. Turner et al. [28] reviewed methods, data, and models assessing changes in the value of ES from land degradation and restoration, providing a good overview of the current state of the art. Bagstad et al. [29] evaluated 17 tools for ES quantification and valuation of their usefulness in decision-making processes. Adhikari and Hartemink [1] conducted a global review linking soils to ES: They retrieved key soil properties related to ES and confirmed that the number of studies that directly link soil properties to the services is limited. Existing tools focus on land use planning (see also [30]) rather than on local-scale land management (e.g., tools used by the OpenNESS project, www.openness-project.eu/). They vary from simple to complicated and time-consuming models, e.g., Multi-scale Integrated Model of ES (MiMES, afordablefutures.com; [10]). There are tools designed for landscape-scale or larger spatial area, such as the land utilization & capability indicator LUCI/Polyscape (lucitools.org; [31]), which builds on a GIS-based model, as well as a few addressing the local scale, such as TESSA toolkit [32], but focusing on biodiversity sites only. Moreover, some studies focus on monetary valuation, such as Ghaley et al. [33], quantifying marketable and non-marketable ES of diverse production systems and management intensities. Concurring with Baveye et al. [2], we are convinced that non-monetary, deliberative ways of dealing with the multifunctional nature of soils are more appropriate than assigning price tags to aspects of soil management that we do not yet sufficiently understand. Volchko et al. [34,35] have worked on analyzing soil functions as part of a holistic sustainability appraisal of remediation alternatives. Their soil quality index was an arithmetic mean value of the sub-scores, without weighting.
Our main challenge was to define the linkages of soil properties to ES, something that hardly any study did [1]. In our process to come up with a workable methodology, we used some ideas and elements from the reviewed tools and literature. The methodology was developed in cooperation with a multi-disciplinary group of soil-related scientists and went through various iterations. Feedback from the international science, policy, and practitioner community was obtained at European science and policy events (Global Soil Week [36], European Geosciences Union [37], and Ecosystem Services Partnership conference [38]).
Furthermore, we evaluated whether we should quantify the ES before and after implementation of the trialled measure, or only evaluate the changes in ES. The first would conceptually be simpler and would also be in line with other studies, where the reference situation refers to a maximum ecological potential, often taken from a less managed agricultural landscape than the one at stake [4]. However, an assessment to quantify all ES before and after implementing 26 different measures across Europe was not feasible within the RECARE Project. We thus decided to focus on the changes only. Furthermore, focusing on changes resulting from trialled measures helped to identify the most effective measures and to keep the focus on the effects/impacts of soil threats as well as land management.
To delineate the zone to consider, we agreed to focus on the local plot area, where the measures were tested and monitored (such as the field level of the farm), as well as a wider area (such as a watershed), represented by the area for which a land use and degradation mapping was available at the case study sites.
In order to assess changes in the properties of the natural capital, we complemented the list of inherent and manageable properties published in Schwilch et al. [3] with properties monitored during the trials. The final list is shown in Figure 5, which depicts the number of properties assessed by the case studies. For ES that can be assessed directly, we decided to work with the MAES ‘Best available indicators for assessment of ES across different ecosystems’ (Mapping and Assessment of Ecosystems and their Services; [39,40]), acknowledging some of the limitations of legitimacy and validity as presented by Heink et al. [41]. The most difficult issue was the question of how to calculate changes in ES based on measured changes in properties of the natural capital. While looking for methods on how to quantify the impact of the changes of the various properties on the provision of ES, we realized that most studies only look at which soil (and management and environment) properties play a role in the provision of the ES, but they do not quantify the relative contribution of each property [1,6,42].

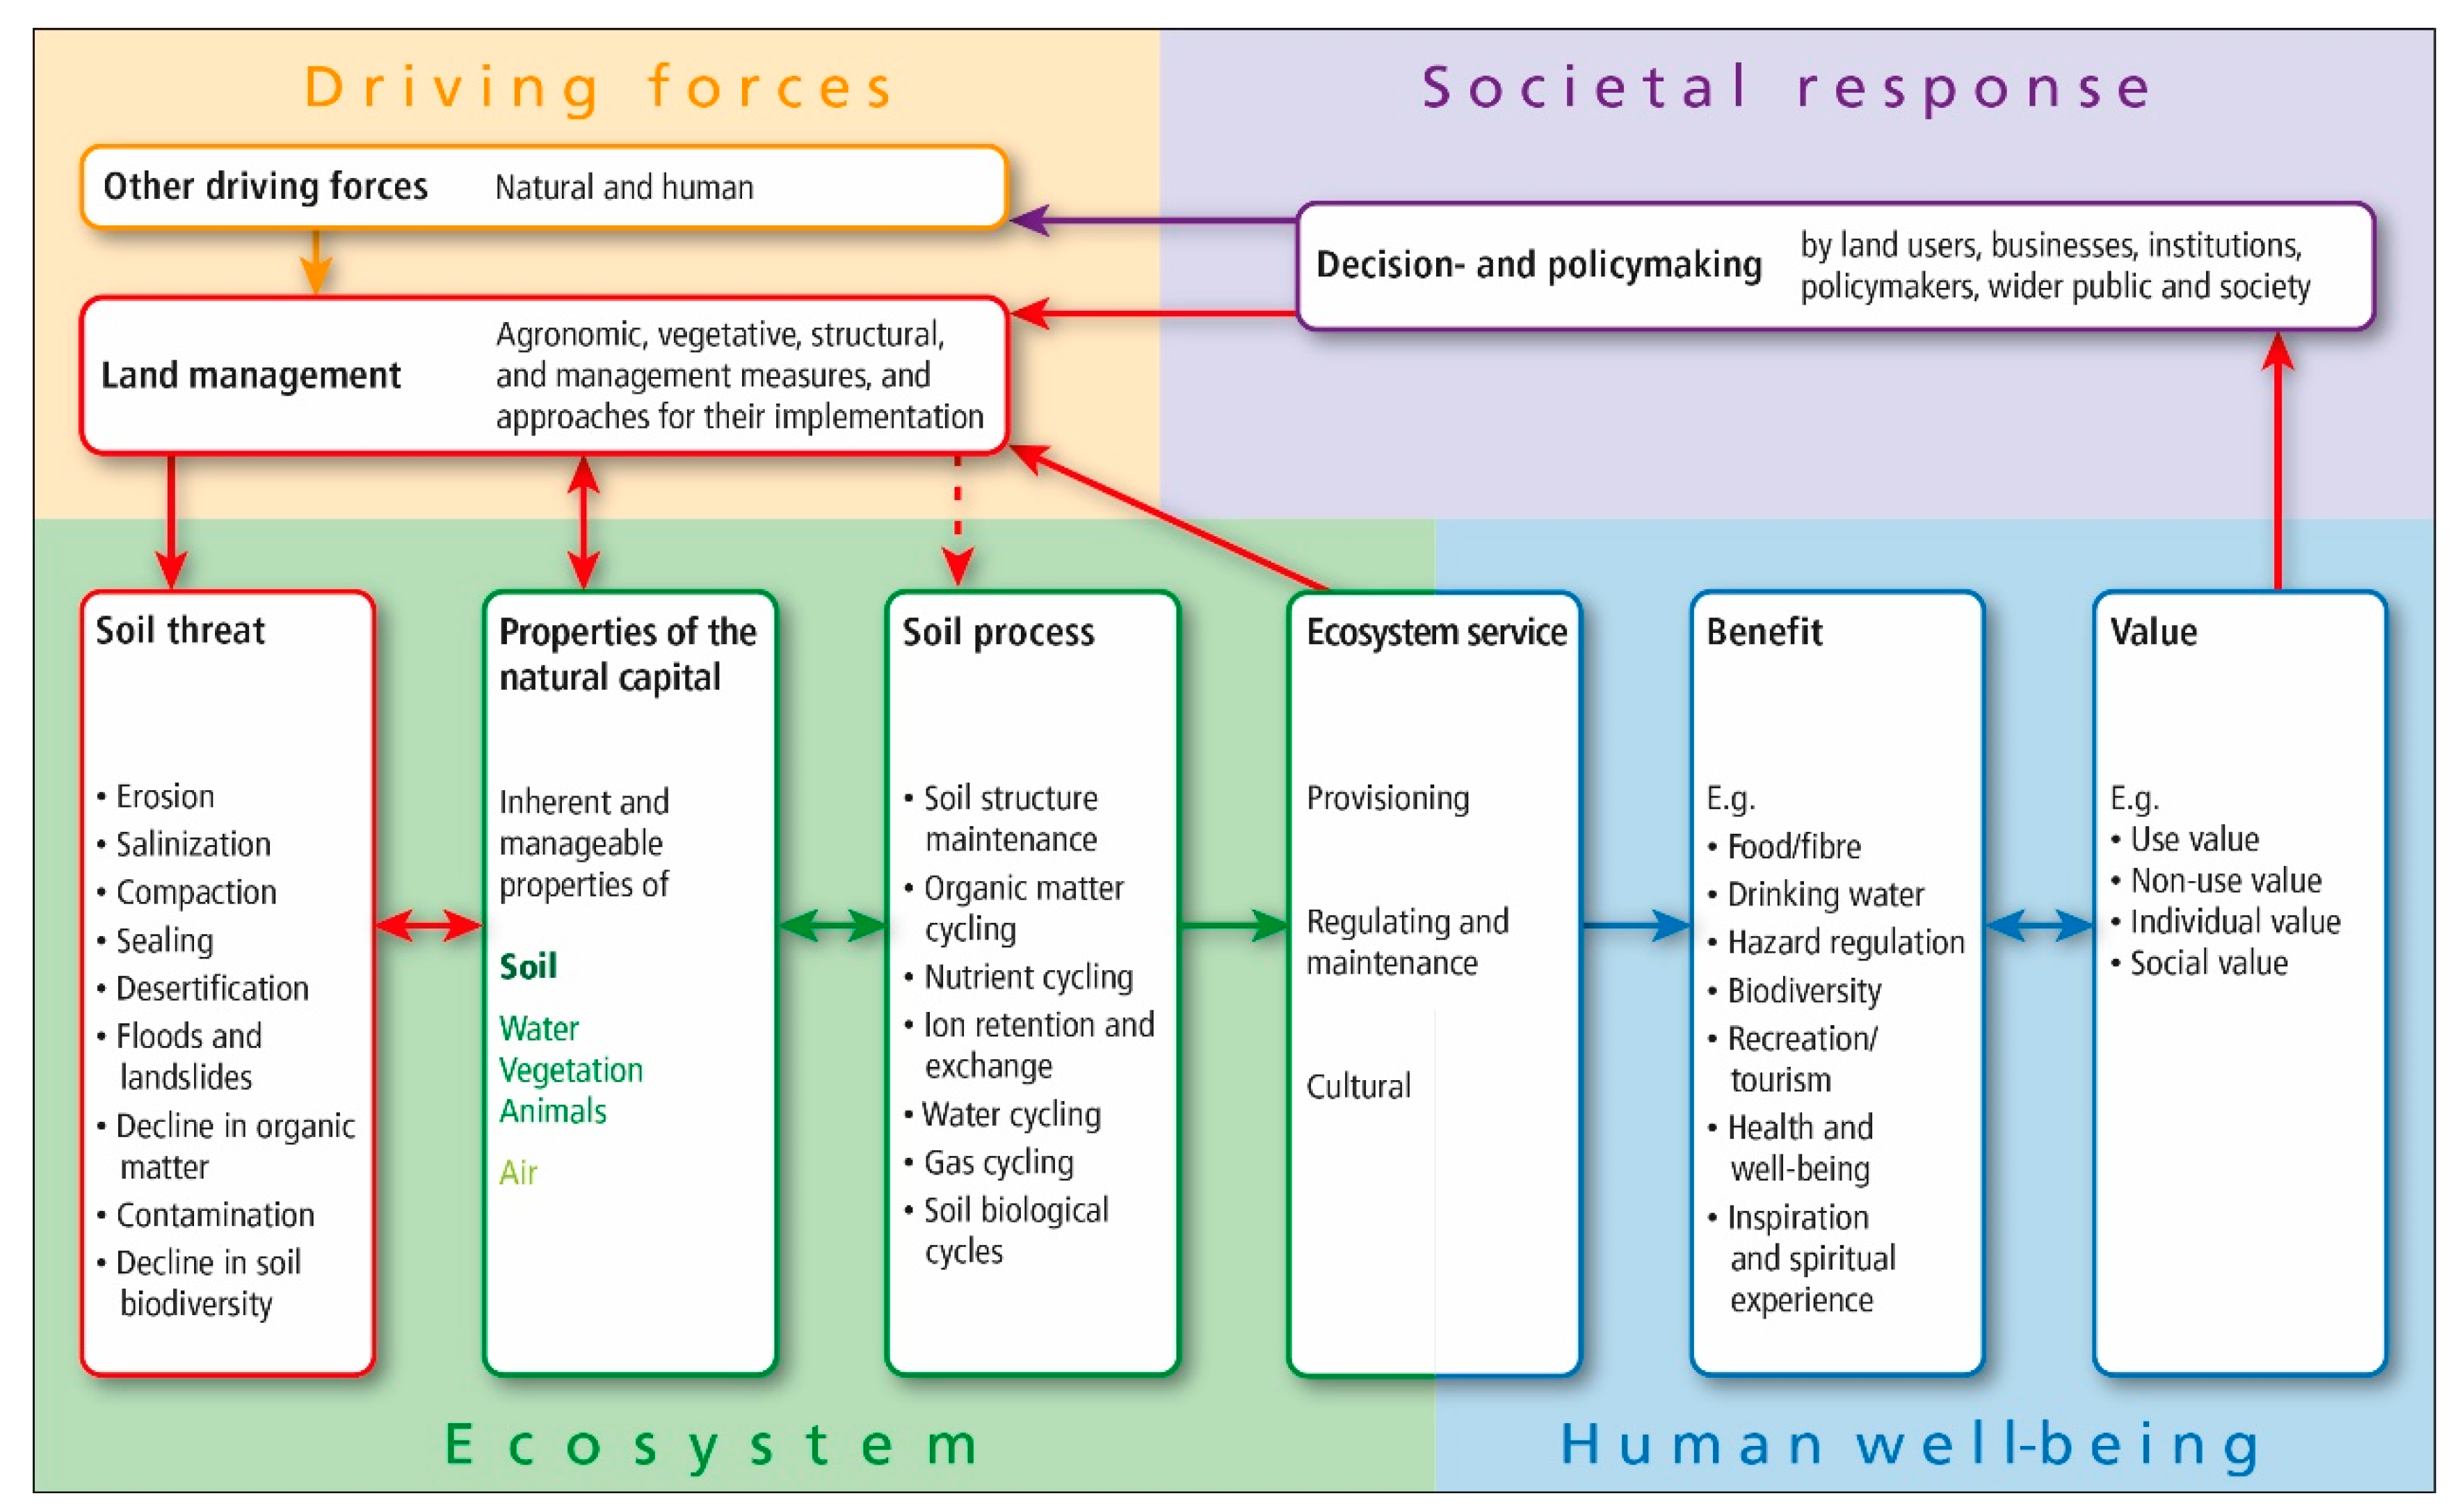
2.2. RECARE ES Assessment Methodology

As we aimed at a comprehensive perspective integrating all ES potentially affected by soil management, we evaluated available lists of ES, such as CICES ([43]; www.cices.eu) and TEEB ([44]; teebweb.org). We decided on CICES, because it was the most detailed and had a hierarchical structure of section, division, group, and class. We used CICES 4.3 but simplified it and changed some of the terms for easier comprehension to stakeholders. We then defined 15 ES that were relevant for RECARE case studies, all of which had been mentioned as being affected by the trialled measures in one or more case studies. They are a combination of the division and group from the CICES classification, as presented in Supplementary Material S2. For the methodology, the columns ‘RECARE Division & Group’ and their associated ‘Class’ were used.
To assess the impact of the trialled measures on ES we developed an Excel-based tool with final visualizations programmed in R (see Figure 2). The tool contains four steps which were taken to determine short-term and long-term changes of the 15 ES we defined.
In Step 1, the values of the measured or estimated properties of natural capital with and without trialled measures were entered for the whole implementation period. The list of 50 properties (see also Figure 5) originates mainly from Dominati et al. [6]. It was extended by the 16 case study partners during the methodology development phase and kept fixed for all assessments afterwards. The data for any property for which a change was measured, observed or estimated was entered. The magnitude of change of the selected properties was then appraised and rated in the local context from −3 (strong decrease) to 3 (strong increase) by considering seasonality and velocity of changes. Whether a certain increase is considered low or high within the local context represents the interpretation of the researcher involved.
In Step 2, the ‘impact dependence’ (positive impact +1 or negative impact −1) was defined for each property with an impact on the identified ES, for the plot level and the wider area (regional scale). Thereafter the relative impact of each property on each of the 15 specified ES was weighted for the plot level and the wider area. The total impact of all properties with an impact on an ES was always 100%. Figure 3 shows an example of the relative weight of properties explaining changes in the nutrition biomass ES. The default weights, as presented in Figure 3, were used for 12 measures. The main explanatory factors considered for nutrition biomass production thus include soil organic matter (SOM), soil moisture, and infiltration, with some importance for ‘weed amount/species’ and ‘soil fauna and microorganisms’. This was partly adapted from Adhikari and Hartemink [1], leaving out most of the inherent properties. The ‘grass undersowing’ trial in the Netherlands at Olden Eibergen assigned equal weights to four properties, namely mineral nitrogen, SOM, infiltration, and ‘soil fauna and micro-organisms’ (see Figure 3).
With the estimated impact of the measured change (from step 1), the impact dependence and the weighting of the properties (from step 2), the Excel-based tool then calculated two impact values between −3 and +3 for each ecosystem service, one for the affected area (plot level) and one for the wider area. The calculation was done by multiplying the ‘magnitude of change’ and the ‘impact dependence’ with the ‘weight’. If a specific ES was not relevant for the case study, it was set as N/A.
Some of the ES can be measured directly (such as crop yield), or assessed using other indicators than those related to a change in properties of the natural capital (such as number of visitors). In Step 3, these measured or estimated indicators were entered into the tool and their magnitude of change was again appraised and rated in the local context from −3 (strong decrease) to 3 (strong increase) for the affected ES, one for the plot level and one for the wider area. A challenge was how to combine the directly measured ES with the ones based on changed properties, as these would also have an effect (e.g., many properties have an impact on yield). Due to a lack of scientific evidence, we simply averaged the two. In many cases, however, no directly measured ES indicators were available. This average of the calculations in Step 2 and Step 3 then resulted in the final change of the ES due to the trialled measure between −3 (strong decrease) and +3 (strong increase). In addition, the case study partners also identified benefits (positive impacts, advantages) and drawbacks (losses, negative impacts, disadvantages) that the trialled measure may have for people and nature, such as increased yield, clean water, or increased workload.
In Step 4, we assessed for each ES, for plot level and wider area, whether the assigned short-term value from Step 3 will still be the same in 10 years or whether the changes in ES will increase or decrease. The case study partners also identified benefits and drawbacks of the trialled measure for this 10-year scenario.
In order to present the results to stakeholders we also investigated effective visualization approaches. Different studies suggest various forms of visualizing ES, e.g., the spatial relationship between service production area and service benefit area [45], or the relative provision of services in spider diagrams [46]. We developed an R script to generate four different graphs for each trialled measure for both short-term and long-term scenarios at both plot level and the wider area (Figure 4). The values on the axes indicate the magnitude of change in the 15 ES compared to the situation without the trialled measure. The grey circle of ‘no change’ reflects the supply of the ES before the implementation of the trialled measure. The values of the radial axes signify a strong increase (+3), moderate increase (+2), small increase (+1), no change (0), small decrease (−1), moderate decrease (−2), and strong decrease (−3). Green bars indicate that the ES has been increased compared to the situation without the trialled measure (the value is above zero); red bars that the ES has been reduced compared to the situation without the trialled measure (the value is below zero); yellow bars that the ES have not changed due to the trialled measure (the value is zero); and grey bars that the trialled measure has no relevance for this ES. In contrast to a standard bar chart, this kind of visualization has the advantage of also highlighting ES with no change, in addition to showing their increase or decrease. However, it makes the positive impacts (green) look larger than the negative ones (red), although this does not mean they are more important.

3. Results

The application of the ES assessment methodology to 26 trialled measures (Table 1), provided information for the case study partners on changes in ES brought about by the trialled measures. It also enabled cross-site comparisons and analysis, presented in the following sections along the single methodology steps.

3.1. Changes in Properties and their Impact on ES

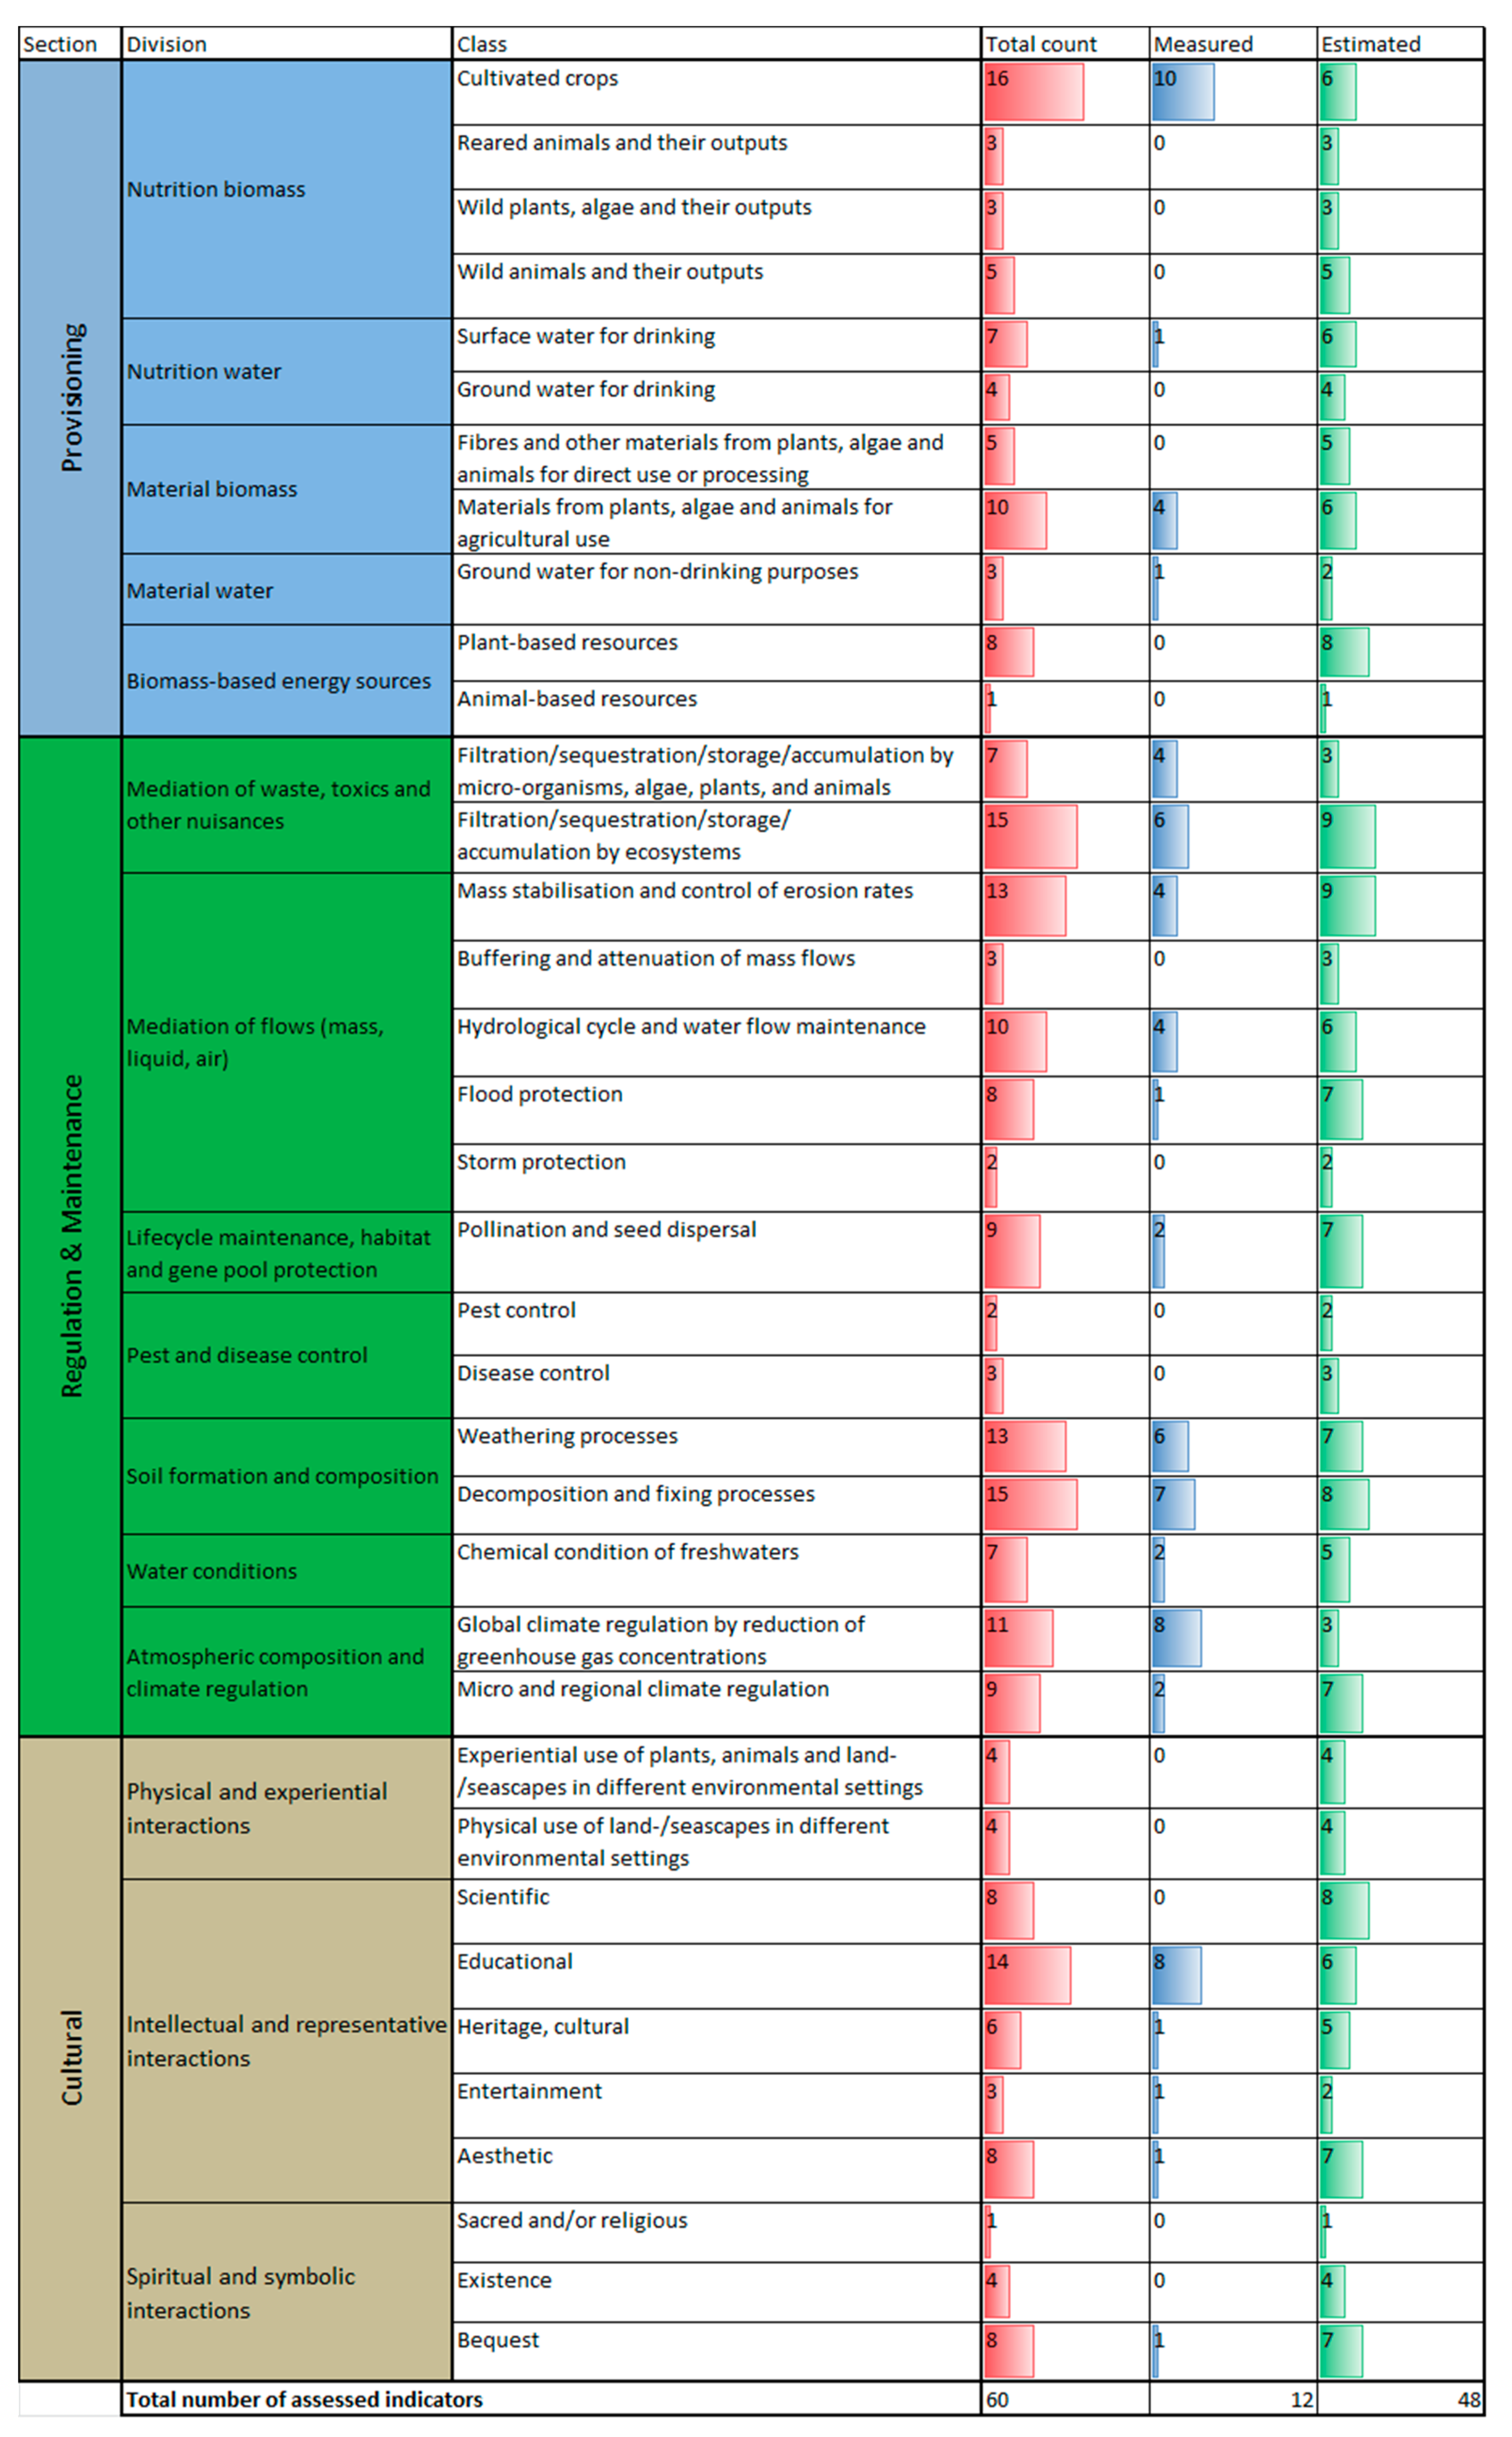
3.1.1. Measured and Estimated Properties of Natural Capital

Figure 5 shows that vegetation cover, soil organic matter, and soil moisture were assessed (i.e., measured or estimated) in about two-thirds of all trialled measures (red bars). The properties that were most frequently measured (blue bars) are vegetation cover, soil organic matter, pH, and soil moisture. Changes in properties that were estimated (green bars) rather than measured include surface water/runoff, soil fauna/microorganisms, water holding capacity, humidity, surface structure/roughness, infiltration, vegetation species composition, soil flora, and air temperature. The only listed property that was apparently not relevant in the case studies is the number of animals (grazing pressure), as this was not selected by any case study. Other properties of very little significance (only mentioned by one case study) included many of the inherent soil properties, the vertical and horizontal structure of vegetation, and the composition of animal type. This relates to the trialled measures in the case studies, which are mostly applied on cropland, with only few on forests and grazing land. However, the result of this analysis may provide a clue as to which properties are key to understanding and measuring land management-induced changes in the natural capital.

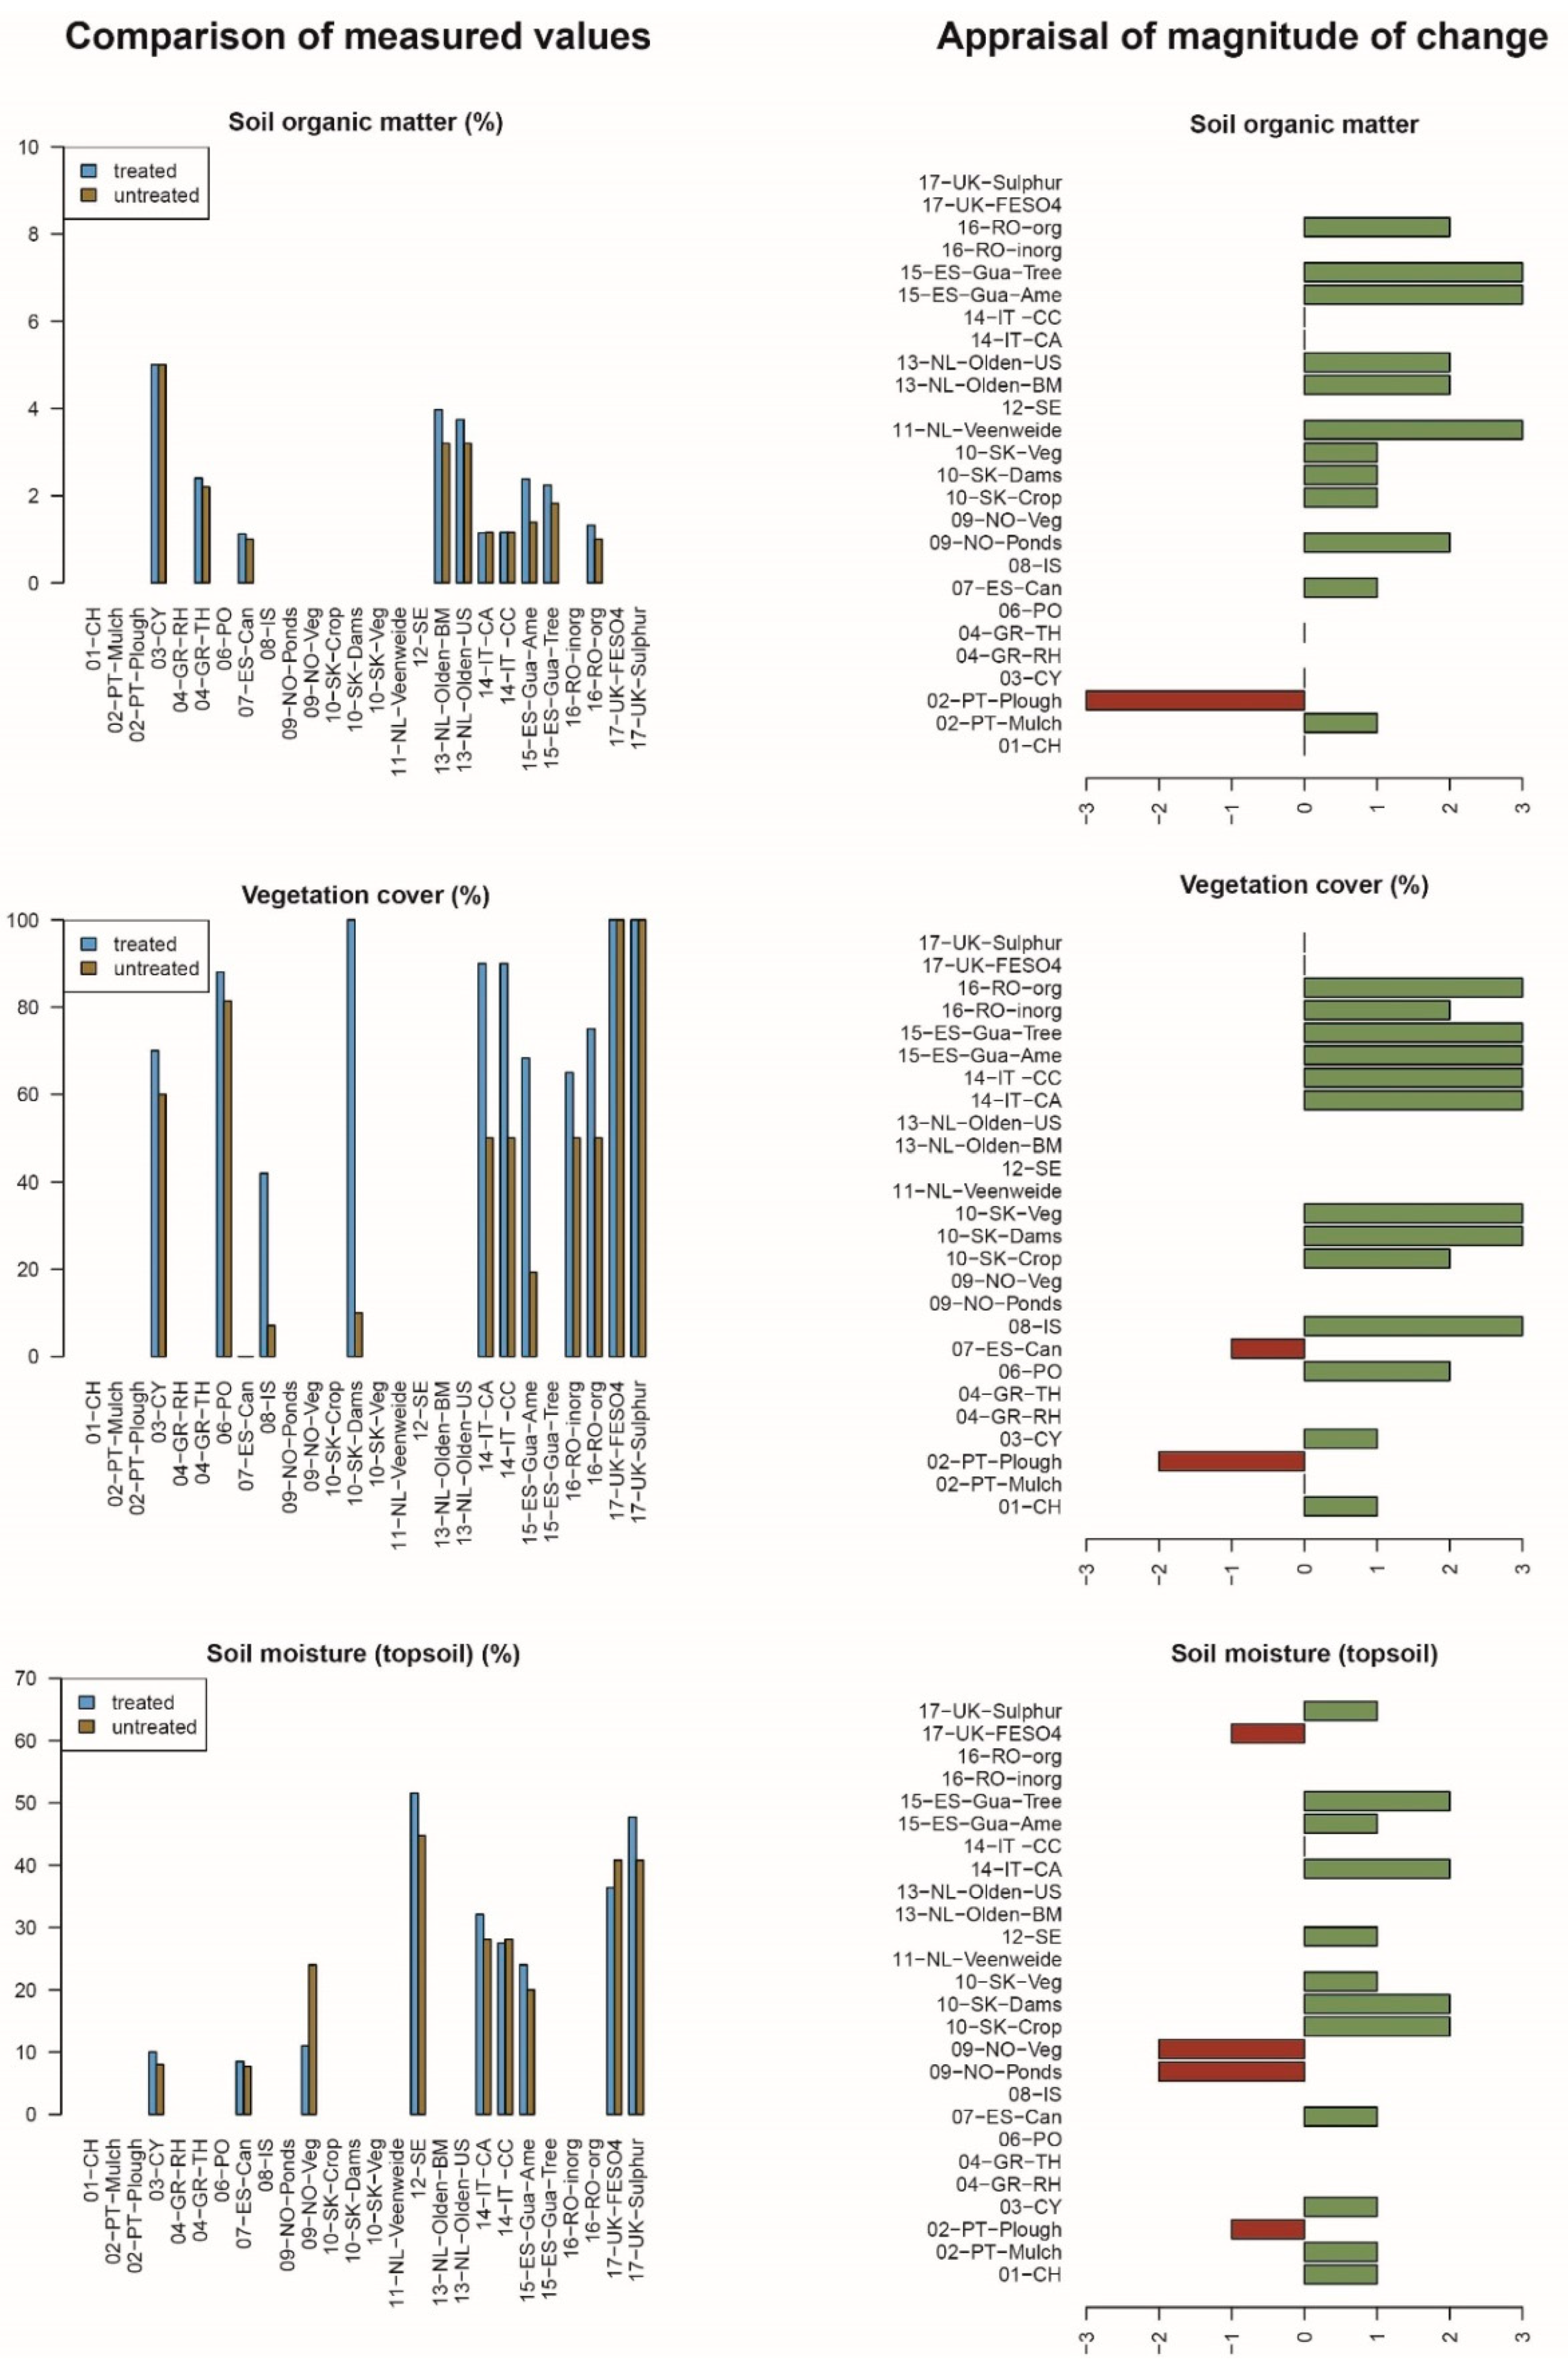
3.1.2. Comparison of Measured Values and Appraisal of Magnitude for Selected Properties

Figure 6 shows the measured values of three selected properties of the natural capital before and after the trial implementation for the plot scale (affected area) and their appraisal of magnitude of change compared to the local context. The selection of these particular properties was for illustration purposes only.
Soil organic matter: Looking at the estimated magnitude of changes in Figure 6 (right column), many sites report an increase in SOM. Portugal is an exception, as here the topsoil layer that is most rich in SOM was ploughed under and increased SOM decomposition resulted from aeration. Spain-Guadiamar reported an increase of 71% (magnitude 2 = moderate increase) for biosolid compost amendment and 23% for use of tree plantation of Olea europaea var. sylvestris, considered a magnitude of 3 (high increase) because SOM levels in the region are currently very low. In Romania, organic soil amendments from manure and an increased root growth of plants led to an increase in SOM of 32%, considered moderate. Veenweidegebied in the Netherlands reported a decrease in SOM loss for their peat soil from a loss of 11.6 to a loss of 5.6 t/ha/year with the implementation of submerged drains (since the decrease has become smaller this is shown as +3 in Figure 6). For the UK case study, where detailed data were available for over 10 years of measurements, changes in SOM were reported in opposite directions for the two measures. Elemental sulphur treatment led to a slight decrease from initially 4.1% SOM to 4.0%, while the treatment with ferrous sulphate increased SOM from 4.1% to 4.4%. This was rated with magnitude −1 and 1, respectively. These values are not shown in Figure 6 because they reflect a long-term change.
Vegetation cover: This property is reported to have increased considerably for a number of sites, namely Romania, Spain-Guadiamar, Italy, Iceland, and Slovakia. Only Portugal and Spain-Canyoles (mulching) report a decrease; in Portugal this was due to ploughing and in Spain mulching led to an increase in soil cover but a decrease in vegetation cover. For the contaminated site in Spain-Guadiamar, natural colonization of the contaminated area by plants was very slow, while tree plantation accelerated colonization and succession of plant communities. The Spain-Guadiamar trial with biosolid compost amendment managed to increase vegetation cover from 19% to 68% due to reduced metal phytotoxicity and improved soil fertility. In Romania, the second site under threat of contamination, researchers explain the effect as follows: “reducing the metals mobility in soil led to a diminishing of metals toxicity with benefits on plant growth”. This resulted in an increase from initially 50% to finally 65% vegetation cover (trial with inorganic soil amendments bentonite, zeolite, and dolomite). Their second trial (organic amendment) even increased vegetation cover from 50% to 75%. Both Italian trials increased vegetation cover by a magnitude of 3 by increasing cover from 50% initially to, respectively, 80% and 90% finally. Conservation agriculture as well as cover crops provide a soil cover by vegetation throughout the year.
Soil moisture (topsoil): Measured changes in soil moisture (mostly seasonal averages) were rather minimal, but on a very different level due to the different pedo-climatic conditions found in the case study areas. While the trialled measures in Sweden (peat soils) and in the UK (organic rich former heathland soils) achieved volumetric soil water content of over 40%, Spain-Canyoles and Cyprus reported only around 10% (semi-arid climate). While most sites reported an increase, there was a decrease in one of the Portuguese trials (ploughing), in the two Norwegian trials, as well as in the UK site with the ferrous sulphate treatment. In Portugal, this is due to increased macroporosity, at least during the initial period following ploughing, while in Norway this is a desired effect due to the threat of flooding.
From Figure 6, we conclude that most of the trialled measures did increase the assessed properties, with only few showing a decrease. The appraised magnitude of change confirms that these changes in properties are in many cases considerable (i.e., magnitude 2 or 3) within their local context.

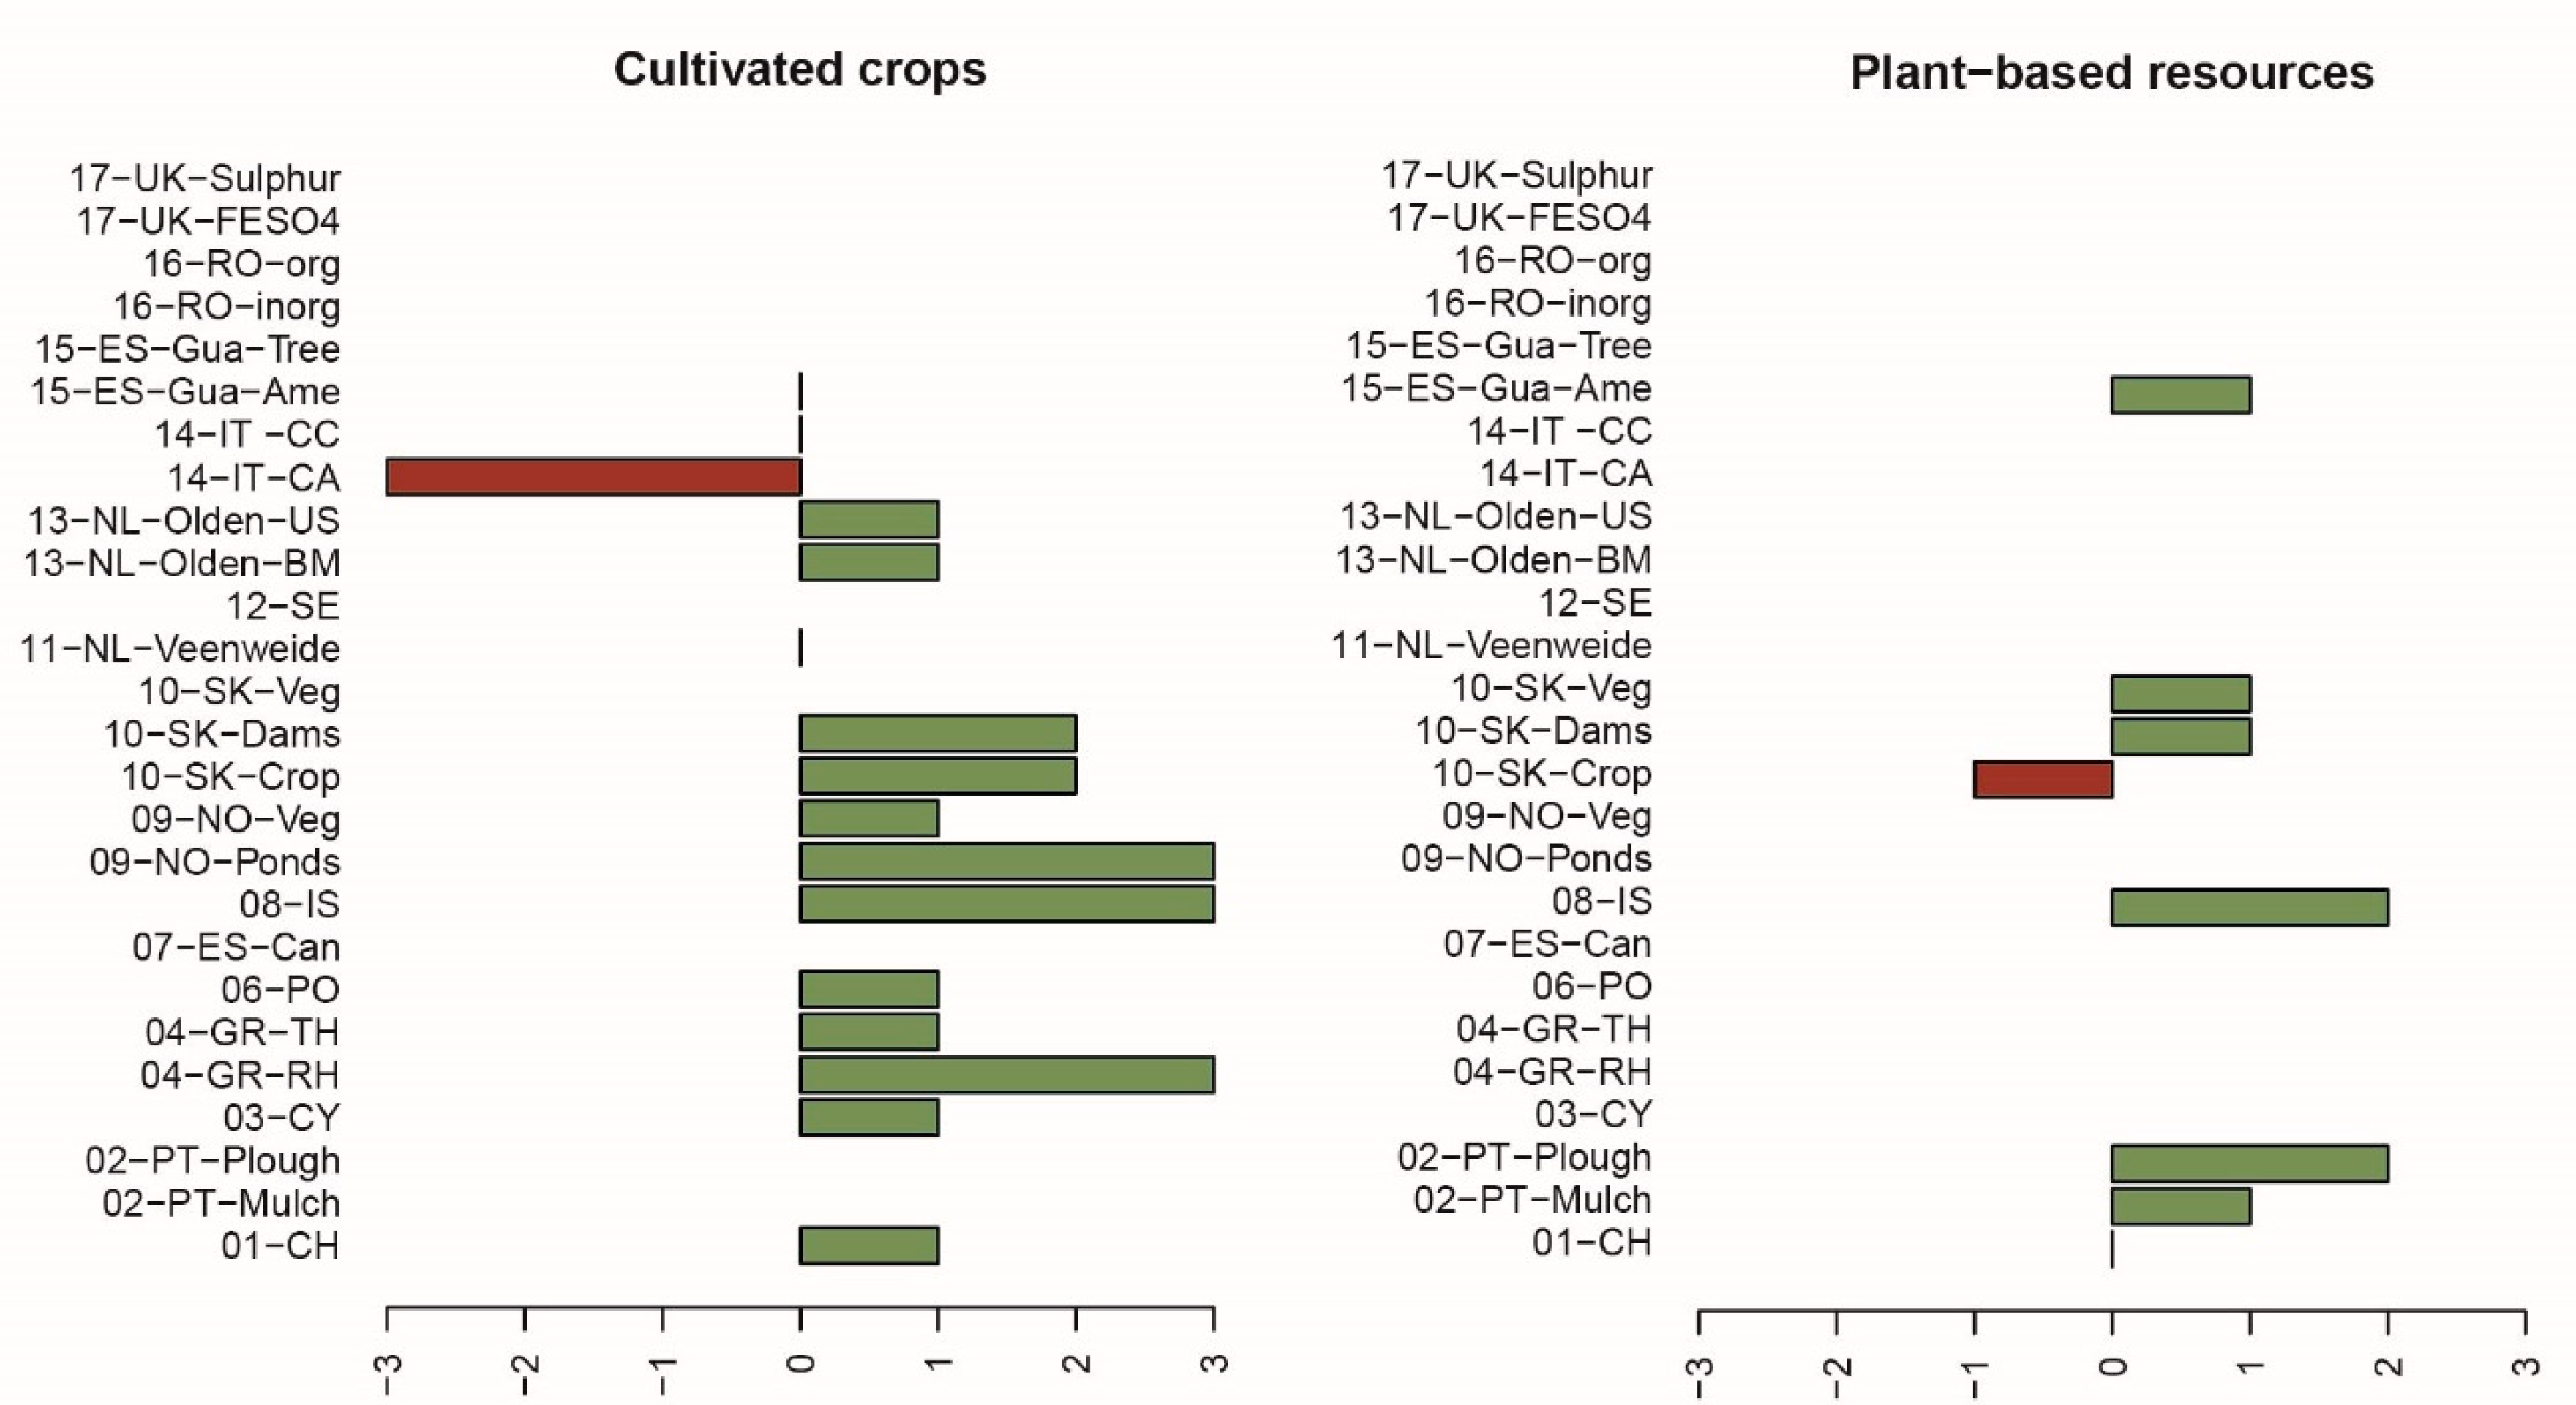
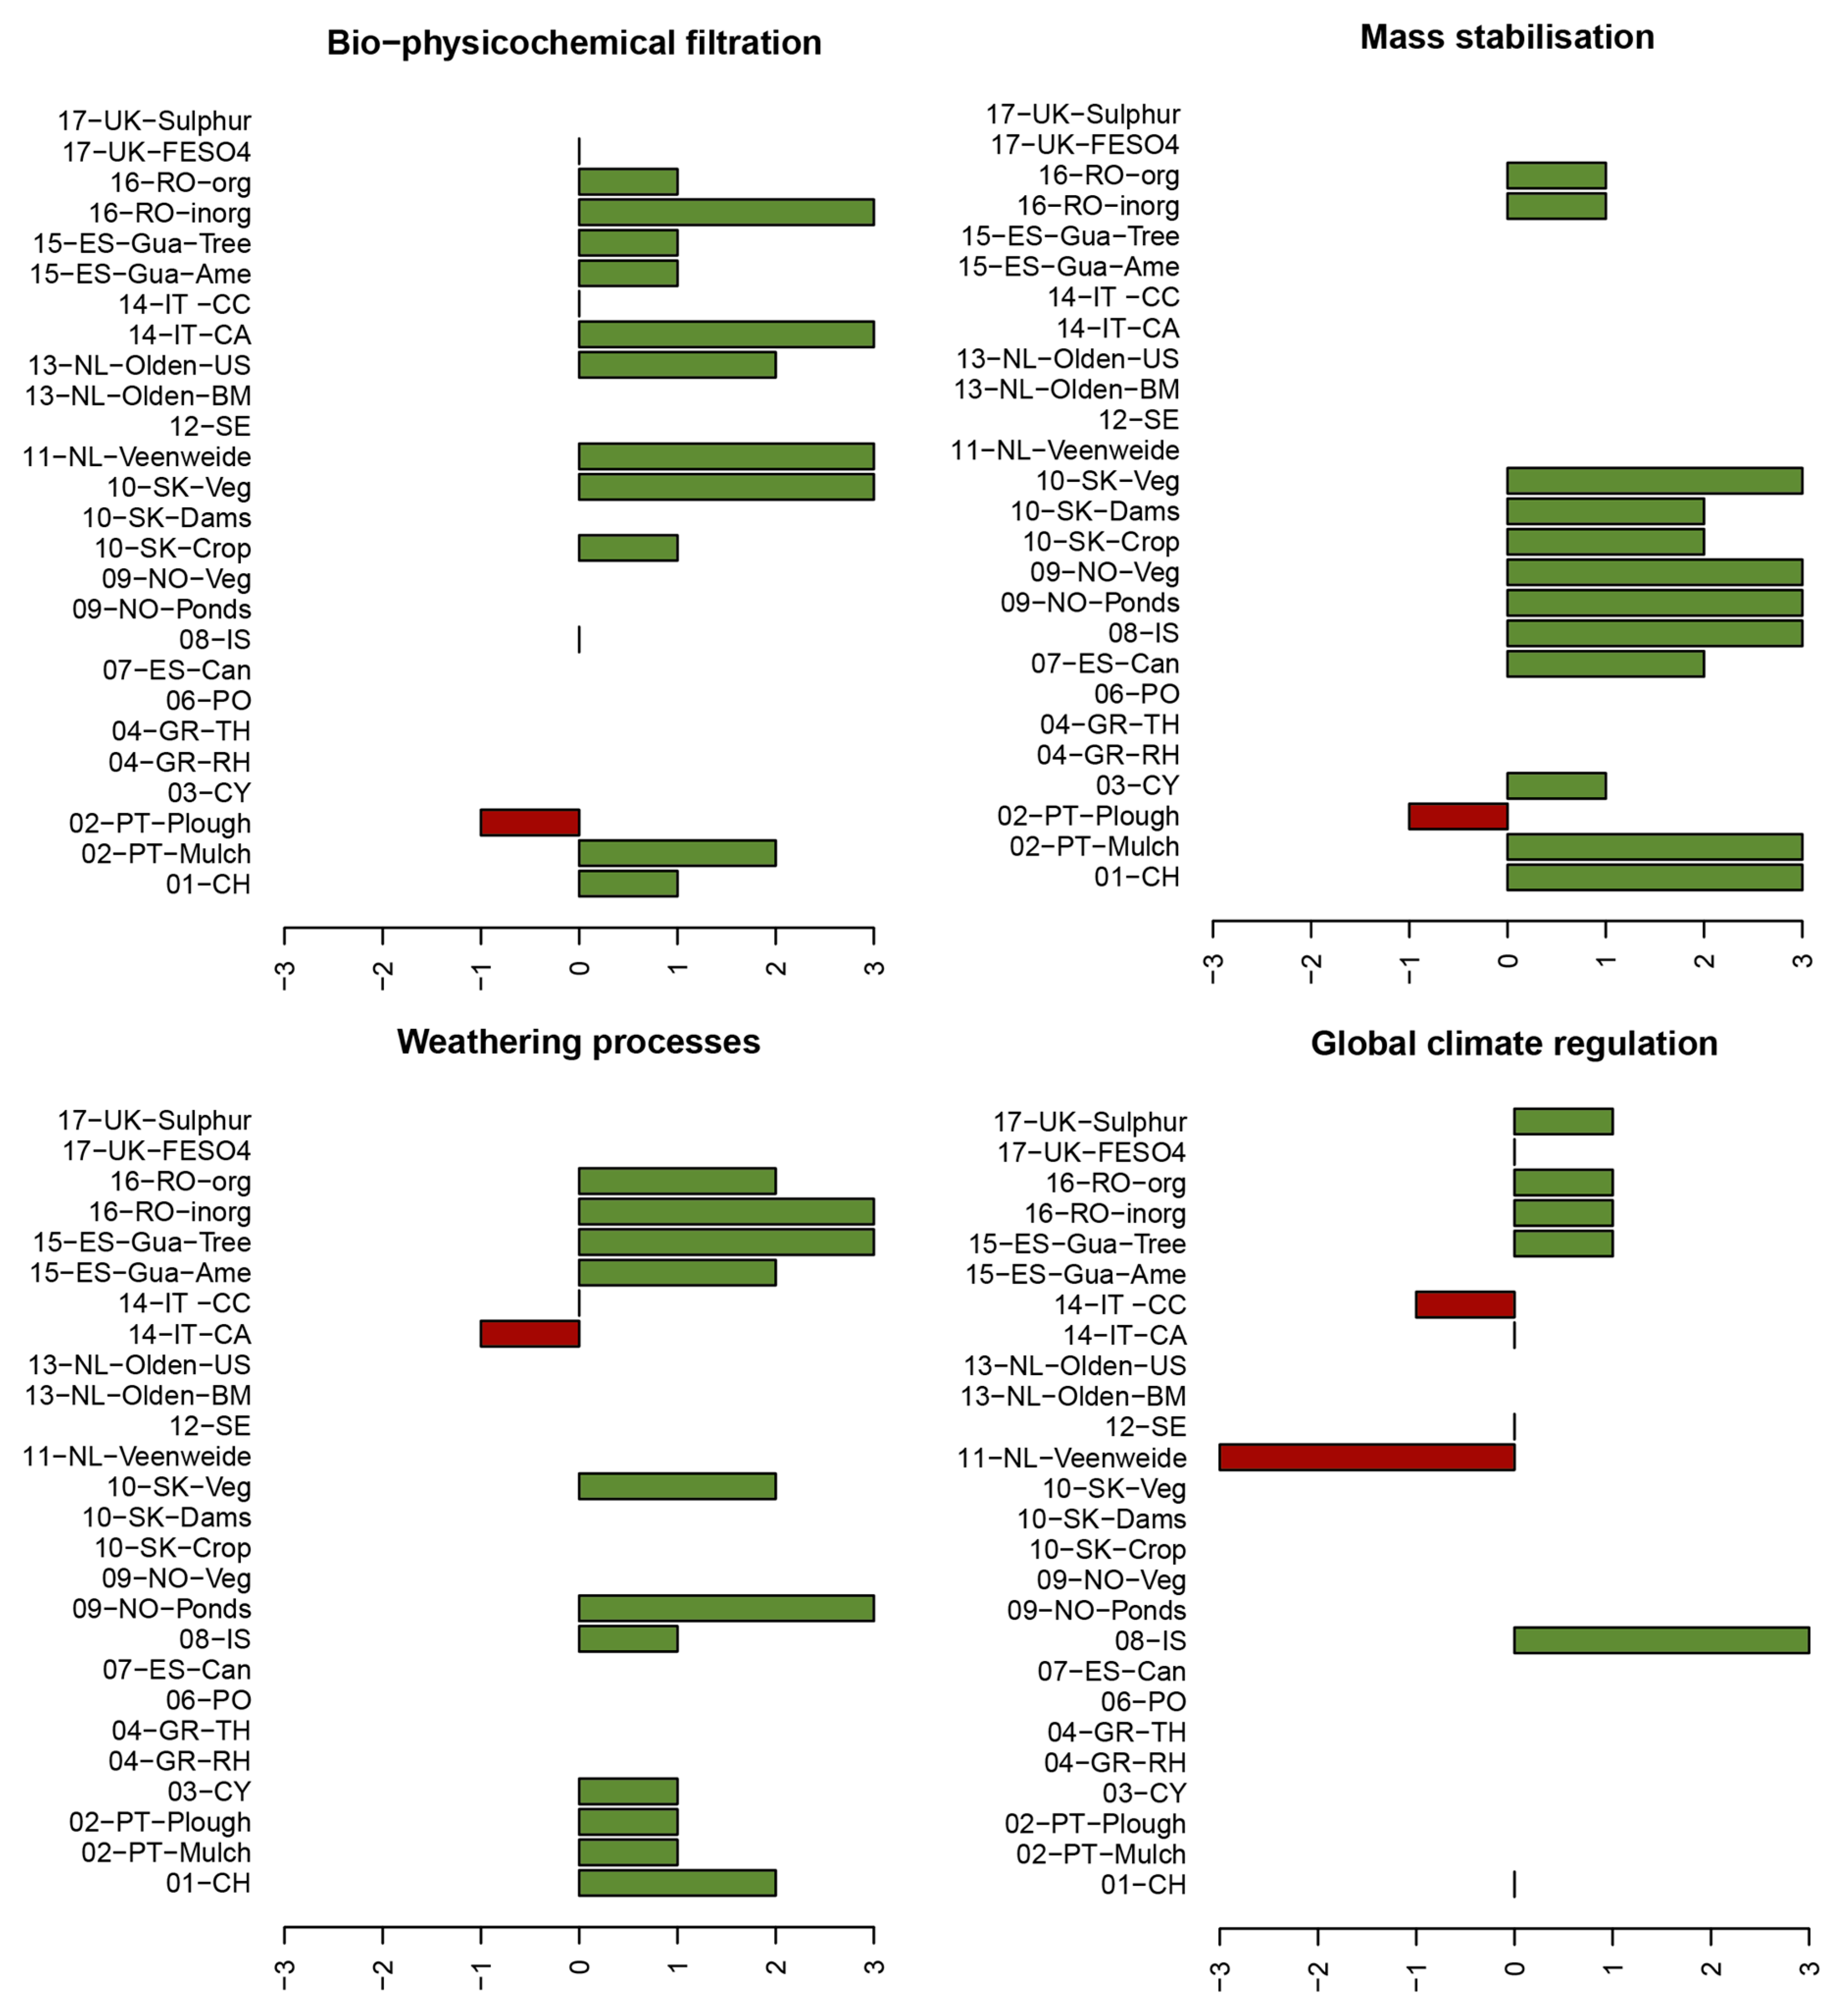
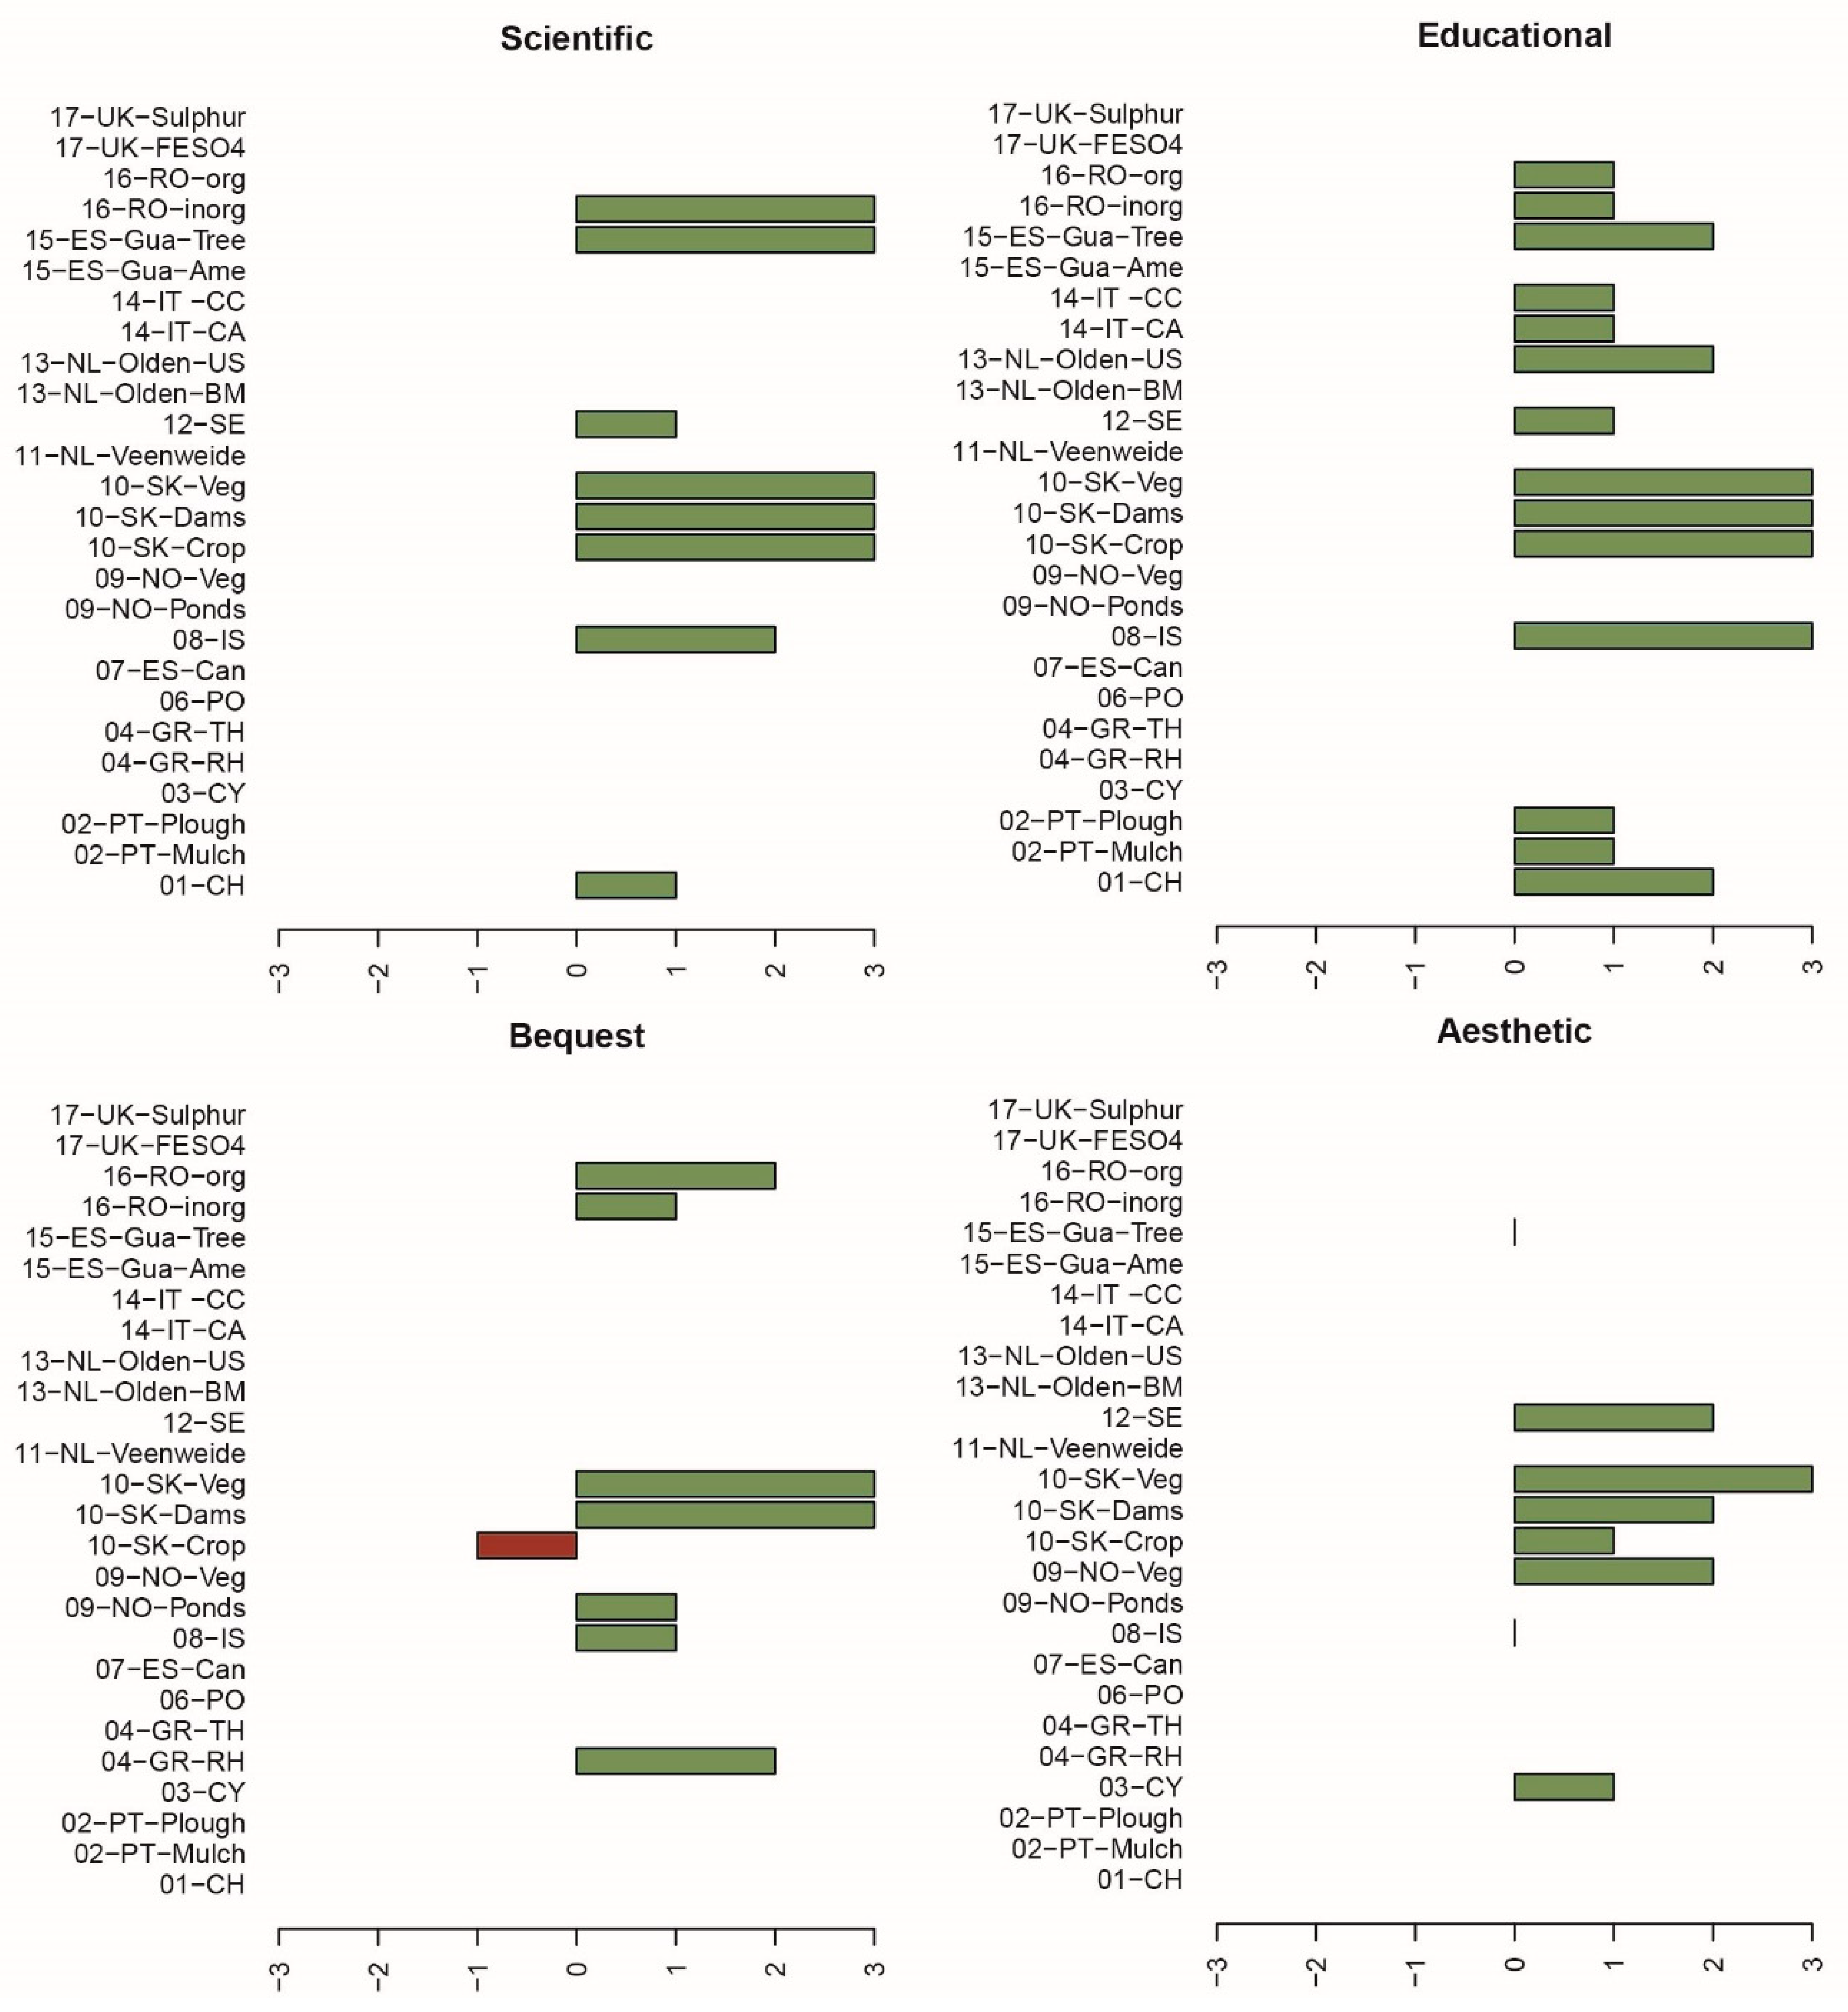
3.2. Measured Impact on ES

The results for Step 3 in Figure 2 include the assessed indicators for provisioning, regulating, and cultural services and their magnitude of change, i.e., how the level of ES provision has changed due to the trialled measure. Here we present the data for the affected area/plot level only, as there is more data available for that level due to the local trials and their monitoring.
Provisioning services: Figure 7 shows that among provisioning services, cultivated crops were by far the most assessed (in 16 out of 26 trials, see red bars). Crop yield was measured in 10 of the cases (blue bars) and estimated in the other 6 (green bars). Most other changes in provisioning services were estimated rather than measured.
Most trials related to crop production resulted in a measured or estimated yield increase (‘cultivated crops’ in Figure 8). The only exception is the Italian trial, where conservation agriculture led to a yield decrease of 25% (from 8 to 6 t/ha average from a three-year rotation of maize, wheat, and soybean). Some trials report a considerable increase (magnitude +3), such as Norway (flood retention ponds) and Iceland. In Norway, implementation of a retention pond reduced the incidences and the duration of flooding on crop fields located below the retention; there is less flood damage and thus an improvement in farm productivity. In Iceland, the increase in yield is almost 500% (from 7 to 42 t/ha), as the treatment involves direct reseeding. Other provisioning services are less affected by the trialled measures, or less important. Wild animals and their outputs are important in grazed ecosystems, such as in Spain-Guadiamar, Slovakia, Norway, Iceland, and the UK.
In Slovakia, the ES ‘plant-based energy resources’ include biofuel from rape and maize. A decrease is reported because the trialled measure of ‘changes in crop and land use management’ intended a reduction in agricultural land used for rape and maize cultivation due to their negative effects on soils. The other two Slovakian trials reported a small increase in ‘plant-based energy resources’, for example the trial with changes in vegetation that increase wood fuel.
Regulating Services: Figure 7 shows that for many of the regulating services, about half were measured and the other half estimated. Measuring was apparently more possible here than with the provisioning services.
Many of the regulating services show a strong improvement (Figure 9). The sites dealing with flooding and soil erosion report improvements in the ES ‘mass stabilization’, with as many as six trials reporting a strong improvement of magnitude 3. Streambank vegetation in Norway, for example, increased shear strength of the soil by up to 155%.
‘Weathering processes’ and ‘decomposition and fixing processes’, the two ES in the group of soil formation and composition, are important in many sites. Improvements of magnitude 3 are estimated in Norway, Romania, and Spain-Guadiamar. In the Italian Conservation Agriculture trial, a decrease in soil porosity was measured. This was interpreted as potential soil compaction and reported as a slight deterioration of the ES ‘weathering processes’.
The ES of ‘mediation of waste, toxics, and other nuisances’ is especially important in the two case studies where soil contamination needs to be remediated, namely Romania and Spain-Guadiamar. For both case studies, both trials show an improvement, and in each case study, one of the trials is clearly better than the other. Inorganic soil amendments in Romania increased the soil capacity to bind the metals and reduced the transfer of heavy metals from soil to plants. For the ES class ‘bio-physicochemical filtration’, the advantage of the inorganic soil amendments is particularly apparent, in that the sorption of contaminants on inorganic amendments has reduced the mobility of metals (e.g., Cd—mobile forms) in the soil by 94% (from 6.34 to 0.38 mg/kg) = magnitude 3. For the organic amendment, this value is 38.5% = magnitude 1. In Spain-Guadiamar, the benefits of the trials occur through a phytostabilization process, which is an immobilization of contaminants by plants and associated microorganisms. Trials with conservation agriculture in Italy showed that the nitrate concentration in percolation water decreased by almost 90% (from 39.7 mg/L to 4.3 mg/L), which is considered a strong improvement of magnitude 3 and benefits groundwater quality.
The ES ‘global climate regulation’ was of specific interest to the four case studies featuring soils threatened by loss of organic matter in mineral and peat soils. In Italy, carbon sequestration was measured as SOC stock variation (t/ha/y) for both trials. While conservation agriculture had negligible impact on this (15% reduction in GHG emissions from 1 to 0.86 t/ha/y, rated as magnitude 0), the cover crops trial caused a reduction of 41% (from 1 to 0.59 t/ha/y SOC stock variation, rated as magnitude −1). Data was obtained as a yearly average during the 2011–2017 period in the 0–30 cm soil layer.
Cultural Services: For the cultural services, measuring seems most feasible for the indicator of education, measured in eight trials as shown in Figure 7. Most other cultural services can only be estimated.
Many of the trialled measures have an impact on scientific, educational, heritage, and aesthetic interactions (see Figure 10). For example, in Iceland, it provides the opportunity to educate about land degradation processes, land reclamation activities, and the value of the provided ES. Education not only includes training of students, but also of farmers, such as on the issue of contamination in Romania, where the results from the experiments are used for dissemination and improvement of the knowledge about agricultural use of contaminated land with minimum risk for humans. The aesthetic ES of the Norwegian trial ‘streambank vegetation’ considers the diversification of the vegetation, which was rated magnitude 2, while the ‘flood retention pond’ did not provide any such service. In the UK, aesthetics is an important factor, as this is what people visit the case study area for and it is the socio-economic fabric of the landscape. Within the group of ‘spiritual and symbolic interactions’, the class ‘sacred and/or religious’ was not an issue in most sites, and ‘existence’ as well as ‘bequest’ were relevant in some sites. In Romania, a higher value for ‘bequest’ is due to the preserved agricultural use of contaminated land for traditional farmers without negative impact on human health. In the Slovakian ‘changes in crop and land use management’, the benefits are that there is an improvement of the landscape character, but with the drawback of a diversion from the past crop production, which was indicated as a small deterioration of magnitude −1. The Greek trial ‘rainwater harvesting system installed in greenhouses’ was rated with magnitude 2 for the ES ‘bequest’, because there is a water footprint reduction through the saved groundwater.

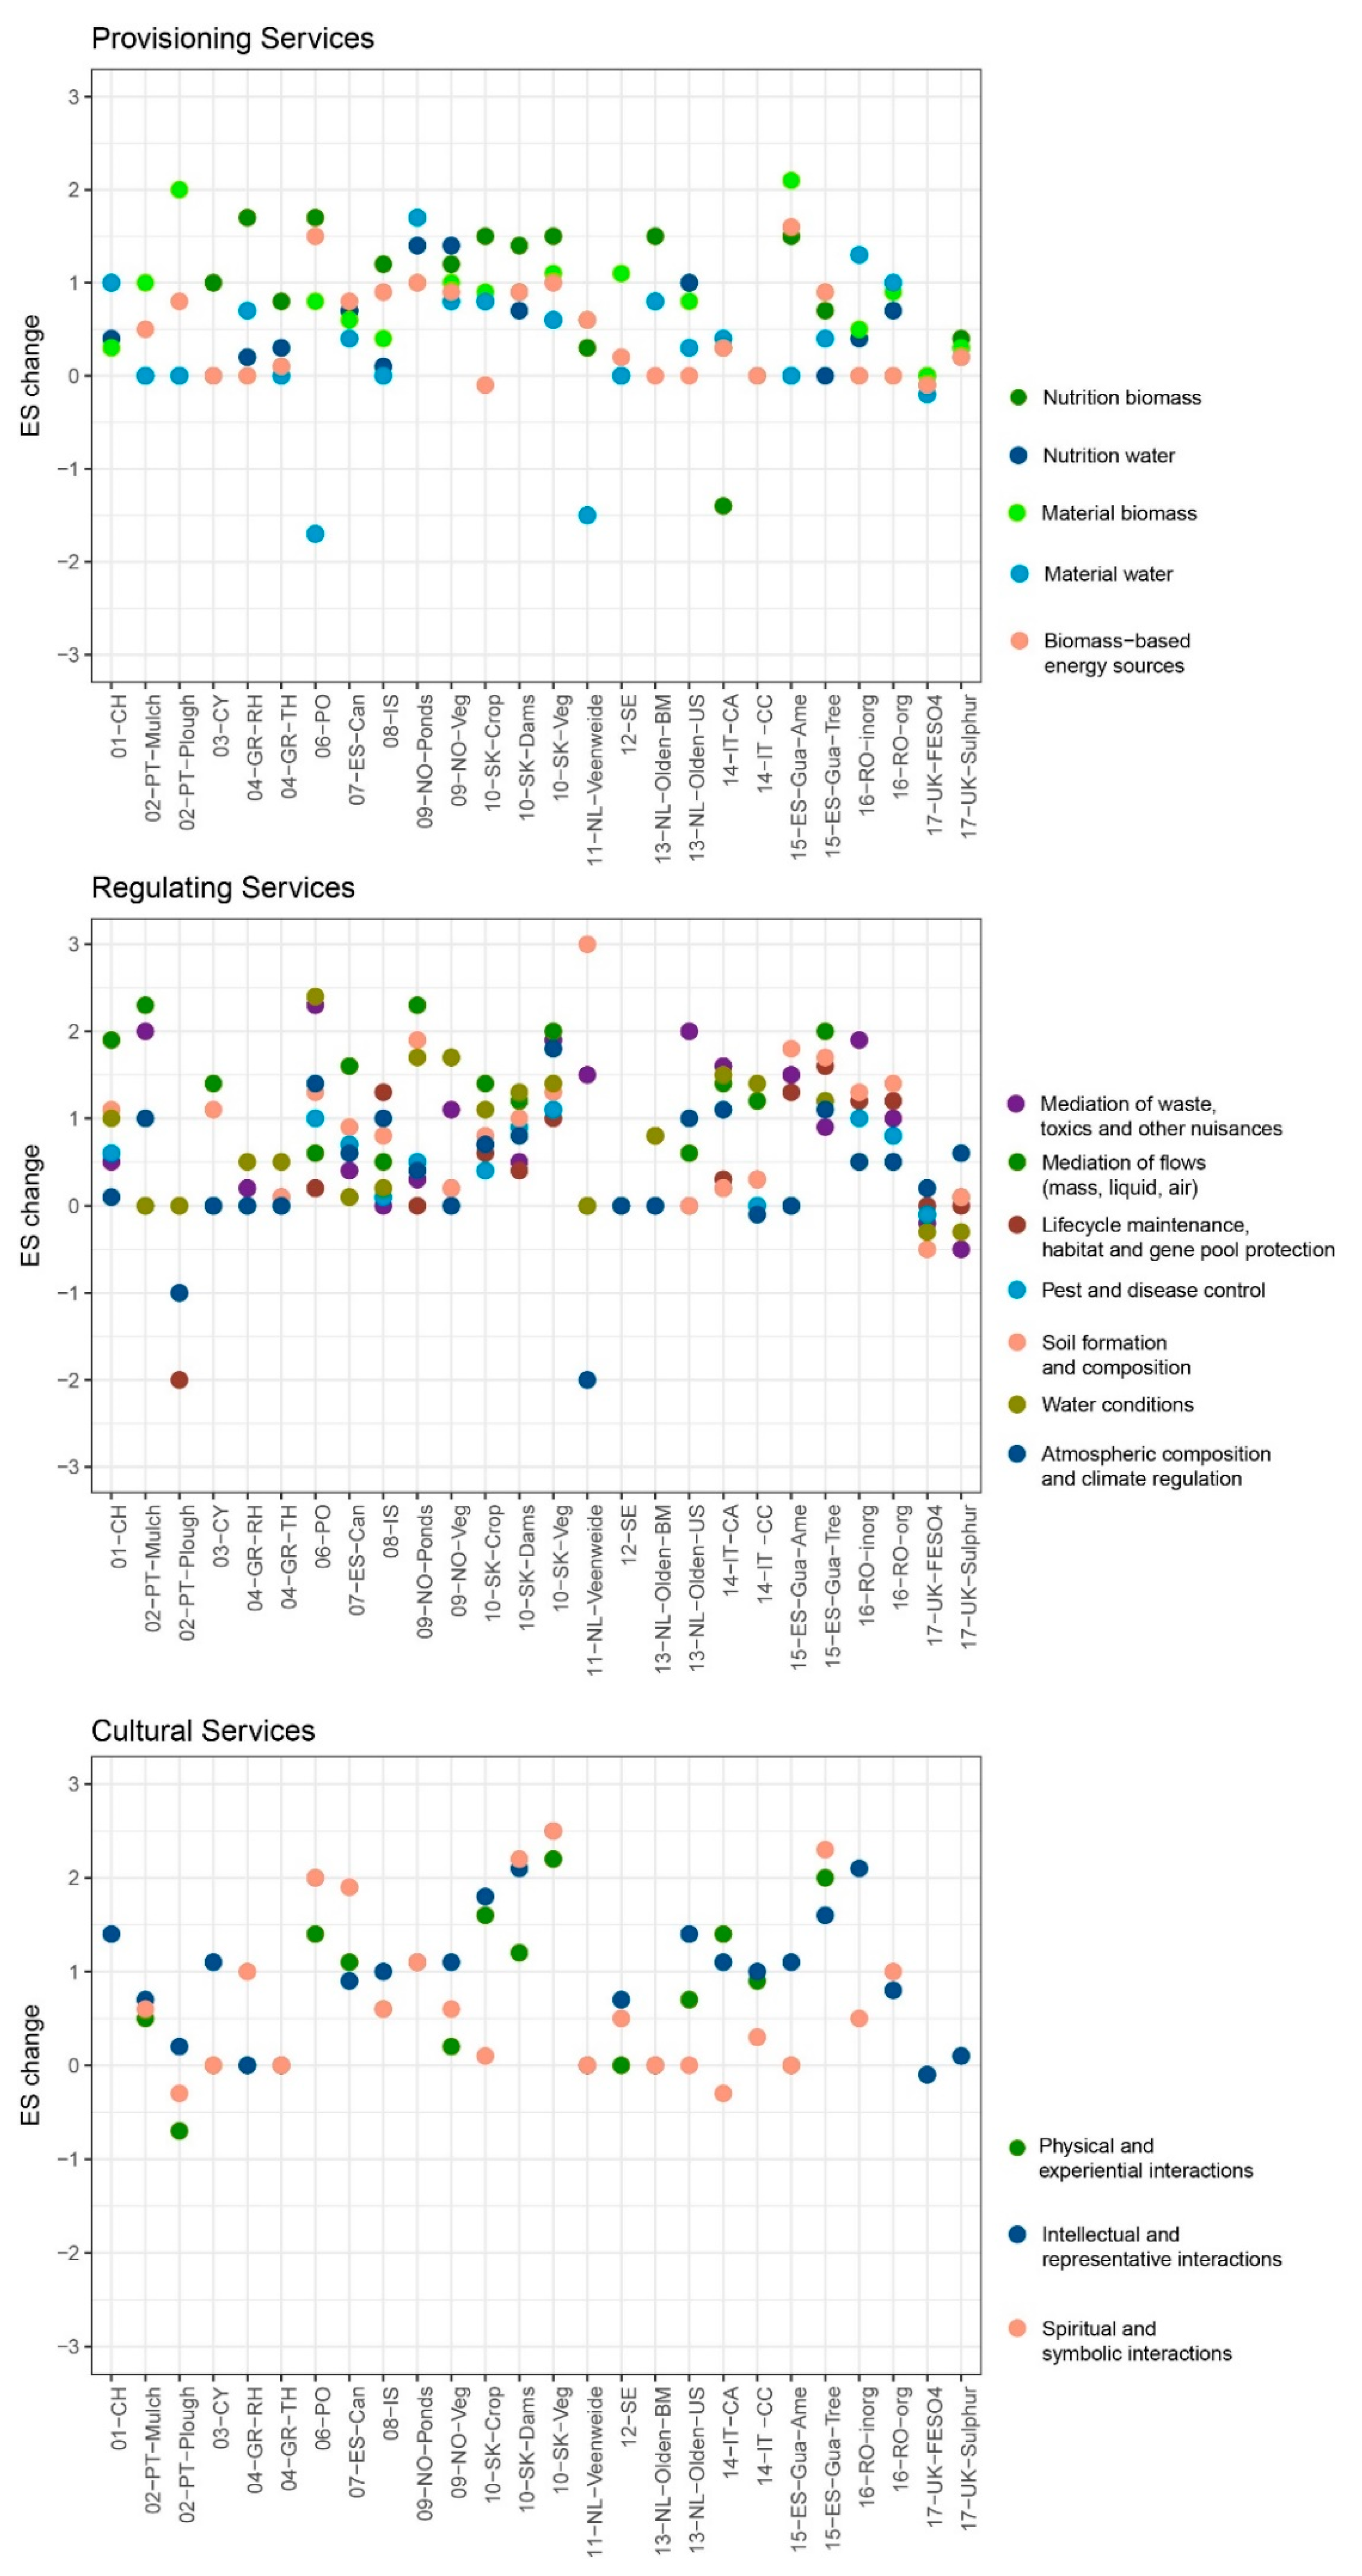
3.3. Final ES Change

Figure 11 plots the resulting calculated ES changes for all ES, all sites (sorted according to soil threat), and plot level. Overall, we observed mostly positive changes in ES, with only very few dots below the zero line (25 out of 382). Provisioning and cultural ES hardly reached a value above two, while the regulating ES showed some significant improvements between two and three. Few specific patterns were immediately visible, but a more detailed look revealed some that were not visible at first sight. For example, nutrition biomass (dark green dots in Figure 11) was higher overall in its service provision than nutrition water (dark blue dots), and almost all sites reported either an increase or no change in these services. Notable exceptions are Italy (yield decrease under conservation agriculture) and Poland (drinking water decrease). Overall, nutrition biomass achieved the highest changes within the group of provisioning services.
For the regulating services, pest and disease control were affected the least, the ES changes range between −0.1 and 1.2 for all sites, presumably because this issue was not the focus of the trialled measures targeting soil degradation. High values of increase, i.e., with a magnitude of >2, were achieved for ‘mediation of flows’ (dark green dots in Figure 11), ‘mediation of waste’ (purple dots), ‘soil formation and composition’ (salmon dots; namely NL-Veenweide with a magnitude of 3), and ‘water condition’ (olive dots). Looking at the overall picture, the ES ‘mediation of flows’ and ‘mediation of waste’ showed the most important positive impacts. The first is especially crucial for the soil erosion case studies (Switzerland, Portugal, Cyprus), with only the Portugal plough trial not showing an improvement. It is obviously also important for the flooding sites (Norway and Slovakia). The latter (mediation of waste) is specifically important for the contamination sites (Spain-Guadiamar and Romania), both of which reported an increase for their two trials, but with a distinct difference in favor of one of the trials each. Negative values were very rare. NL-Veenweide reported a moderate decrease (−2) and Portugal (plough) a small decrease (−1) of the ES ‘climate regulation’ (dark blue dots).
Out of the cultural services (Figure 11), it was mainly the ES ‘intellectual and representative interactions’ that increased for most sites and trials. This is probably due to the scientific and educational value of the project being a research project of mostly universities. The ES of ‘physical and experiential interactions’ seems to be affected positively mostly in the sealing, desertification, and flooding sites. Compared to other sites, these sites deal with larger areas. Interactions like walking, hiking, and sightseeing are thus more important and were positively influenced by the trialled measures.
Assuming a soil management measure that increases the supply of all three categories of ES would be best, Figure 11 indicates that no single trialled measure is clearly better than all others, i.e., there is no management measure which is most promising to improve ES.

3.4. 10-Year Scenarios

Figure 12 depicts the changes in selected provisioning, regulating, and cultural services that are expected for a 10-year scenario compared to the assessed changes after the trial implementation period (at plot level). Although this is based on a rough estimate, a slight to medium increase in all appraised ES can be shown. To illustrate the implications this has, we present selected results from three case study sites. In Cyprus, the short-term impacts of participatory terrace rehabilitation can be sustained in the long term with further engagement of the younger generation in mountain terrace farming [14]; more importantly, if applied at the wider area, some considerable future benefits may arise, such as reduced run-off and soil erosion, and flood prevention (ES mediation of flows). The relevance of terrace rehabilitation is also reflected in an increased and maintained cultural service ‘preservation of heritage (cultural landscapes)’. For the cover crops measure in Italy, it is expected that most ES will show a slight improvement in the long term. Researchers specifically mentioned improvements in groundwater quality, water cycle regulation, and organic carbon stabilization (C/N ratio), as well as a reduction in GHG emissions. For the conservation agriculture measure, the researchers expect an increase in crop production in the long term as observed in several studies. Mediation of waste, toxics, and other nuisances as well as pest and disease control are expected to show a moderate decrease in the long term because of an increase in the use of pesticides when applying conservation agriculture, especially relevant at the level of the wider area (see also Figure 4). The cultural service ‘spiritual and symbolic interaction’ is expected to change from a small decrease after the trial to a ‘no change’ in the long term, because people will recognize the continuous soil cover as a common practice and will not confuse it with land abandonment. For the UK trials, detailed data were available for over 10 years of measurements. The observed reduction in soil pH and nutrient content might be considered detrimental to mesotrophic pasture species and hence overall plant production, but these conditions are beneficial for acid grassland and heathland species. In a restoration ecology project, reverting agricultural land to support a heathland and acid grassland system, a reduction in nutrition biomass is to be expected. The outcome is intended to be a low input, ancestral agricultural grazing system. Such systems are becoming increasingly popular in the region as part of a general move towards traditional farming systems and habitat recreation for rare fauna and flora: a key part of the area’s touristic appeal.

4. Discussion

4.1. Soil Management and ES

4.1.1. Changes in ES due to Soil Management

Overall, the results paint a very positive picture in terms of the impacts of the trialled measures on ES, indicating that the trialled measures indeed increase ES. This was hypothesized, as most of these measures were selected for trialing due to their expected positive effects regarding the soil threat at stake (except for some trials being included to compare with conventional practices, such as the ploughing trial in Portugal). However, we were curious to see whether these measures would also show an impact on ES other than those affected by the soil threat. Would, for example, a measure against soil erosion only lead to an improved ‘mediation of flows’, or would it also provide positive impacts on ‘nutrition biomass’ (yields), as well as cultural services? Would it thus be possible to provide and improve a multitude of services and not decrease some services or present trade-offs over scale and time? Looking at the results from this perspective confirms that 18 out of 26 trialled measures did not show a decrease in any service at the affected area/plot level. For the wider area/regional level, it was even 20 cases out of 26. In other words, 67% and 74% of the trialled measures had only positive impacts on the ES at the plot level and wider area respectively. However, negative impacts on ecosystem services could have gone undetected in the trials or may not have emerged yet.
Can we now identify those properties of the natural capital that play a decisive role in improving the ES? In other words, which modifications of the natural capital would be required to achieve an effect on ES? This would be a very pertinent result relevant for science and for land management. However, more research is needed to better understand the relationship between the natural capital and ES, in order to derive information on these mechanisms. The critical point is the assignment of relative weights to explain how much the different properties of the natural capital affect ES or affect changes in ES. As mentioned before, we consider this to be one of the most difficult and challenging aspects of this research, although our methodology provides one way of solving the issue.
Nevertheless, as the detailed description of the results showed, some unexpected insights emerged from application of the methodology, in terms of the trialled measures and their direct comparison at case study level as well as across all case study sites. Some patterns became visible, e.g., regarding the soil threat at stake and the effectiveness of the measure in addressing these. The direct comparison of the effectively achieved magnitude of changes in properties as well as in ES sometimes confirmed expected impacts, but also revealed impacts that might have been unnoticed before or were under- or overestimated. Additionally, the results enabled easy detection of synergies and trade-offs among the 15 assessed ES for each trialled measure, and thus provided an evidence base for valuation.

4.1.2. Valuation of ES by Stakeholders

Following the assessment of impacts on ES as described in this paper, a valuation of the benefits of these ES is required, in order to use the results for future soil management decisions and for policymaking (see also [3]). Acknowledging that ES provided and influenced (changed) by soil management measures are valued differently by different stakeholders favours deliberative ways of stakeholder valuation and decision-making over monetary approaches. At the basis of stakeholder valuation is the understanding that a change in land management affects ecological processes, which in turn affect the kinds of benefits that people derive from land. Soil management thus alters ecological processes in such a way as to produce benefits (e.g., yield), but sometimes also drawbacks (e.g., contamination of groundwater with pesticides). However, benefits for some stakeholders might be drawbacks for others (or vice versa)—and for other geographical locations (e.g., downstream) or for future generations. This has to be taken into account for a comprehensive valuation of ES targeting the sustainability of soil management. RECARE has developed a stakeholder workshop methodology with a sequence of exercises enabling stakeholders (at the local as well as the sub-national level) to conduct such a valuation by combining local and scientific knowledge [47].
We noticed that stakeholders sometimes find the concept of ES difficult to understand or work with [48]. While the provisioning services are easy to understand due to their immediate use value or benefit to people, the regulating services are more difficult to perceive, as they frequently involve processes that show their positive or negative effects only in the long term and/or in a bigger context, and which are therefore often overlooked. The same holds true for the cultural services, which are less tangible and often go unnoticed. We found that some of these ES valuation workshops specifically uncovered some of these neglected (by the researchers) cultural services [48]. The valuation process further helped to evaluate whether the trialled measure(s) contributed to the desired benefits of the stakeholders. This also revealed synergies across stakeholders, scale, and time, e.g., if a measure provided distinct benefits for two or more different user groups (e.g., less on-site soil erosion for farmers and less off-site sedimentation damaging public infrastructure). Additionally, it also enabled an evaluation of which measure contributed most to the benefits and/or least to the drawbacks, in cases where several measures were compared.

4.2. Methodological Challenges and Critical Reflections

4.2.1. Measurements vs. Estimations

Asking for researchers’ estimates where no measured data were available (or where it would have been too demanding or costly to measure it) was a delicate issue. Nonetheless, we decided to do so to achieve a more balanced, comprehensive, and holistic assessment than basing the results on the measured data only, which is often limited. Many ES assessment studies base their calculations on selected and available data only [4,49,50], although ES is a holistic concept. In our view, ES assessment only makes sense if the whole system is assessed and any changes in the properties of the natural capital are included, while acknowledging that different expert teams would provide different ES assessment results, even with the same data available, also because some researchers are more hesitant to estimate than others. Additionally, some of the estimations and assigned magnitudes may reflect expectations or even ‘wishful thinking’ of the researchers involved, rather than reality [51]. For a holistic approach as used here, it is nearly impossible to measure every single property, and we thus consider expert elicitation indispensable and justified (see also the Best Professional Judgement approach used by Rutgers et al. [4]). Especially in ES mapping and modelling, this is a frequently used approach, because expert estimation “is based on the assumption that through experience, education or profession, certain people have sufficient knowledge on the research subject, to officially rely upon their opinion” [52] (p. 22), [53].

4.2.2. Assignment of Magnitudes and Impact Dependence

Contextual factors matter in the importance of changes in soil properties for changes in ES, such as the purpose of the soil management measure and regional differences. An example is the positive appraisal of low soil moisture values in Norway regarding flood reduction, compared to the negative appraisal of the same property in Slovakia, where water availability is important for vegetation growth, which positively influences flood risk reduction. The assignments of magnitude to interpret the changes in properties of the natural capital was thus an important step in understanding them in the local context, making them dimensionless, and comparing data across sites. However, this was also a difficult and tricky step, as the assignment of the impact dependence with ‘the more the better’ or ‘the less the better’ implies implicit values. For example, the low-resilience character of subsoil compaction turns the evaluation into accepting changes in subsoil compaction, while the precautionary principle would call for no change of the subsoil. However, working with the concept of ES is never value-free. The concept as such is anthropocentric and implies that there are ‘services for the benefits of humans’. However, the real valuation of the ES, whether they are increased or decreased by the trialled measure, is done during the stakeholder workshop following the ES assessment, where the researchers’ assignments can also be questioned and reversed again. This is in line with the doubts and criticism on valuation of soil ES formulated by many (soil) scientists and recently reviewed by Baveye et al. [2].

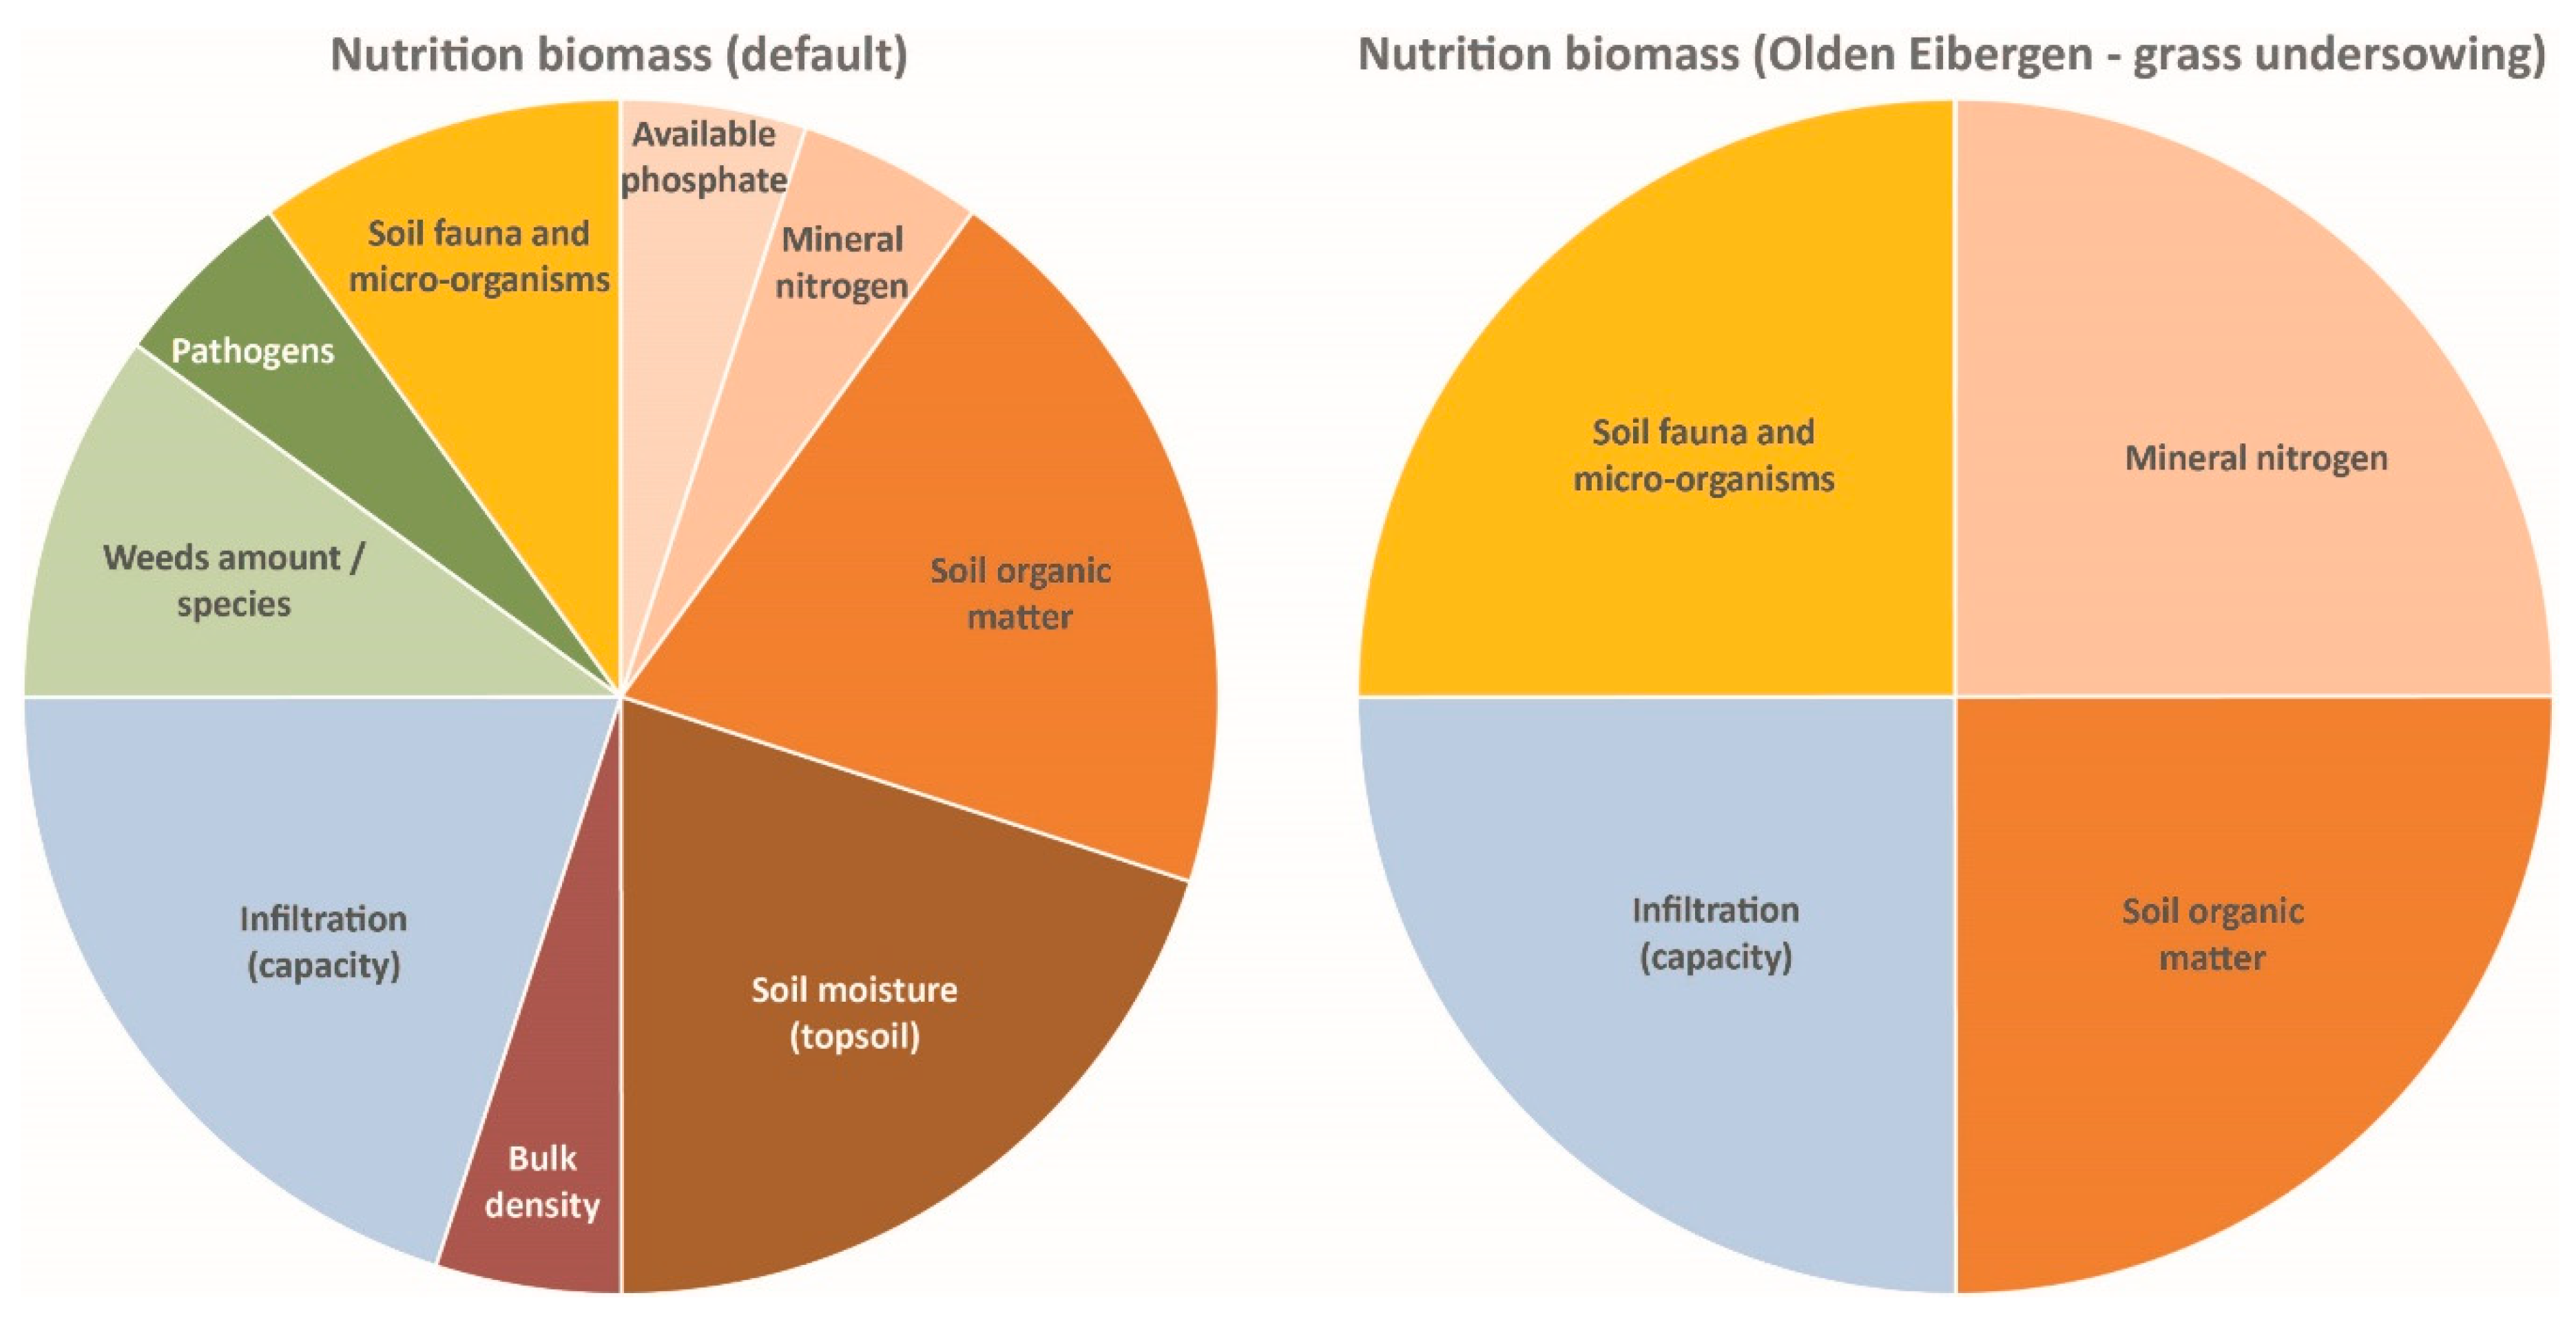
4.2.3. Assignment of Weights to Explain ES

It appeared to be difficult to estimate the relative importance of changes in soil properties in influencing the delivery of ES. However, assuming that all soil properties carry equal weight, as done in other studies (e.g., [54]), is also an assumption of weights. As described in the methodology section of this article, we could not find in the literature another way to calculate changes in ES based on changed properties of the natural capital, and it was thus impossible to avoid the assignment of relative importance to properties. Other scientists have researched the influence of soil properties on just one ES (e.g., nutrient cycling), and only indicated the ones that matter, without trying to rank the properties or to quantify the effect on the ES [42]. The recent global review on linking soils to ES, by Adhikari and Hartemink [1], also revealed that—although there are many studies defining the linkage of soil properties to ES—there are very few that quantify the contribution of different soil properties to the services.

4.2.4. Working towards a Holistic Appraisal of ES

One of the merits of the methodology lies in allowing all relevant ES to be included, and thus also dealing with ES that cannot easily be measured, such as cultural ES. We understand ecosystems as a holistic concept and therefore tried to avoid reducing the ES assessment to those ES that can easily be measured. We consider it important to identify, quantify, and valuate all changes in ES, as also supported by Braat and de Groot, who stated that “to choose a priori and arbitrarily to exclude some classes of services makes no sense” [55] (p. 12). Baveye [56] confirmed that the “key appeal of the concept of ES (the multiplicity of concurrent services) disappears if, in applications, authors pick and choose which services they include, and some are systematically overlooked” [56] (p. 47).
Nonetheless, how to combine the calculated ES change from the changed properties with the directly measured ES remains challenging. As described in the methodology development section, we decided to combine them using equal weight (50% each), which allowed both components to be represented in the outcome. Baveye et al. [2] (p. 17) state that “in the vast literature on the ES of soils, it is symptomatic that no publication to date has reported explicitly on the direct measurement of a single function or service. […] there are currently no solid data at all on any function or service of soils.” In his recent article, Baveye [56] further confirmed the need for actual measurements of ES of soils at field scale, which is still lacking. The present study provides some of this as well.

5. Conclusions

Despite all the limitations and challenges mentioned above, the methodology presented for assessing impacts on ES was highly effective in evaluating the trialled measures. It has allowed us to study the impacts of the trialled measures through the lenses of ES, which was taken even a step further in the stakeholder workshop on the valuation of ES. Although this stakeholder valuation, which is based on this ES assessment, was an integral part of the overall methodology as applied in the RECARE project, it was not possible to present and discuss it in detail in this paper.
Furthermore, our assessment provided the opportunity to compare monitoring results across the case study sites. Through the assignment of magnitudes of change, the monitoring data became directly comparable and independent of the parameter used or the unit of measurement applied. Additionally, the request to estimate changes even if no measured data were available enhanced the comprehensiveness of the assessment, taking into account drawbacks on its accuracy and reliability.
Methodologically, we consider our study to make an important contribution to the contemporary discussion on the role of soils for ES. Although there have been many studies defining the linkages of soil properties to ES, very few studies directly link soil properties to the services [1,53]. This was indeed the biggest methodological challenge, as reported above, and more research is urgently needed here.
Overall, we conclude that, with this method, we were able to successfully collect and compare data regarding the impact of land management on 15 different ES from 26 different trialled measures from 16 different case study sites across Europe. Without claiming that this would reflect reality in detail, we believe that this has not been done before in such a comprehensive and holistic way.

Supplementary Materials

The RECARE ES Assessment Tool is available online at https://www.mdpi.com/2071-1050/10/12/4416/s1, File S1: RECARE_Tool_ES_Assessment.zip. S2 presents the CICES 4.3 table adapted for RECARE, File S2: RECARE_CICES_adapted.doc.

Author Contributions

Conceptualization, G.S., T.L., H.v.D., S.V., and R.H.; Investigation, T.L., Ö.B., C.C., A.C., I.N.D., S.K., D.K., T.M., R.R., G.S., J.T., M.T., S.V., J.v.d.A., N.O.V., and C.Z.; Methodology, G.S., T.L., and S.V.; Visualization, T.L.; Writing—original draft, G.S. and T.L.; Writing—review & editing, G.S., T.L., Ö.B., C.C., A.C., I.N.D., S.K., D.K., T.M., R.R., G.S., J.T., M.T., S.V., H.v.D., J.v.d.A., S.V., N.O.V., C.Z., and R.H.

Funding

The research leading to these results received funding from the European Union Seventh Framework Program (FP7/2007-2013) under grant agreement no. 603498 (RECARE project). It was also supported by the Slovak Research and Development Agency under contract no. 15-0497 and VEGA grant no. 1/0710/15.

Acknowledgments

The authors wish to thank all partners and stakeholders of RECARE for their input and feedback. We specifically thank Felicitas Bachmann (CDE); Jan Jacob Keizer and Cláudia Fernandes (UA); Adriana Bruggeman, Elias Giannakis, Hakan Djuma, and Marinos Eliades (The Cyprus Institute); Corrado Camera (UniMi); Ioannis K. Tsanis (TUC); Per Schjønning and Mathieu Lamandé (AU); Artur Łopatka (IUNG); Saskia D. Keesstra (WUR); Jannes Stolte and Frederik Bøe (NIBIO); Lenka Korbeľová (SUT); Kerstin Berglund (SLU); Franceso Morari and Nicola Dal Ferro (UNIPD); M.T. Domínguez, M. Gil-Martínez, E. Madejón, P. Madejón, and C.M. Navarro-Fernández (CSIC); Mihail Dumitru and D.M. Motelică (ICPA); and Tandra Frazer and Sarah Duddigan (Reading). We thank Maria Ruipérez (ISRIC) for her support for the Excel-based tool and the R coding. Finally, we thank Tina Hirschbuehl of CDE for editing this paper.

Conflicts of Interest

The authors declare no conflict of interest. The founding sponsors had no role in the design of the study; in the collection, analyses, or interpretation of data; in the writing of the manuscript, or in the decision to publish the results.

References

  1. Adhikari, K.; Hartemink, A.E. Linking soils to ecosystem services—A global review. Geoderma 2016, 262, 101–111. [Google Scholar] [CrossRef]
  2. Baveye, P.C.; Baveye, J.; Gowdy, J. Soil “Ecosystem” Services and Natural Capital: Critical Appraisal of Research on Uncertain Ground. Front. Environ. Sci. 2016, 4, 41. [Google Scholar] [CrossRef]
  3. Schwilch, G.; Bernet, L.; Fleskens, L.; Giannakis, E.; Leventon, J.; Marañón, T.; Mills, J.; Short, C.; Stolte, J.; van Delden, H.; Verzandvoort, S. Operationalizing ecosystem services for the mitigation of soil threats: A proposed framework. Ecol. Indic. 2016, 67, 586–597. [Google Scholar] [CrossRef] [Green Version]
  4. Rutgers, M.; van Wijnen, H.J.; Schouten, A.J.; Mulder, C.; Kuiten, A.M.P.; Brussaard, L.; Breure, A.M. A method to assess ecosystem services developed from soil attributes with stakeholders and data of four arable farms. Sci. of The Total Environ. 2012, 415, 39–48. [Google Scholar] [CrossRef] [PubMed]
  5. Schulte, R.P.O.; Creamer, R.E.; Donnellan, T.; Farrelly, N.; Fealy, R.; O’Donoghue, C.; O’hUallachain, D. Functional land management: A framework for managing soil-based ecosystem services for the sustainable intensification of agriculture. Environ. Sci. Policy 2014, 38, 45–58. [Google Scholar] [CrossRef]
  6. Dominati, E.; Mackay, A.; Green, S.; Patterson, M. A soil change-based methodology for the quantification and valuation of ecosystem services from agro-ecosystems: A case study of pastoral agriculture in New Zealand. Ecol. Econ. 2014, 100, 119–129. [Google Scholar] [CrossRef]
  7. van Oudenhoven, A.P.E.; Petz, K.; Alkemade, R.; Hein, L.; de Groot, R.S. Framework for systematic indicator selection to assess effects of land management on ecosystem services. Ecol. Indic. 2012, 21, 110–122. [Google Scholar] [CrossRef]
  8. Haines-Young, R.; Potschin, M. Proposal for a Common International Classification of Ecosystem Goods and Services (CICES) for Integrated Environmental and Economic Accounting. Report to the European Environment Agency; The University of Nottingham: Nottingham, UK, 2010. [Google Scholar]
  9. RECARE—Preventing and Remediating degradation of soils in Europe through Land Care. Available online: https://cordis.europa.eu/project/rcn/110887_en.html (accessed on 24 November 2018).
  10. Chan, K.M.A.; Satterfield, T.; Goldstein, J. Rethinking ecosystem services to better address and navigate cultural values. Ecol. Econ. 2012, 74, 8–18. [Google Scholar] [CrossRef]
  11. CATENA Special Issue “Quantifying the Effectiveness of Stakeholder-Selected Measures against Individual and Combined Soil Threats”. Available online: https://www.sciencedirect.com/journal/catena/special-issue/1063L2HD49J (accessed on 24 November 2018).
  12. Lemann, T.; Sprafke, T.; Bachmann, F.; Prasuhn, V.; Schwilch, G. The effect of the Dyker on infiltration, soil erosion, and waterlogging on conventionally farmed potato fields in the Swiss Plateau. CATENA 2019, 174, 130–141, (accepted). [Google Scholar]
  13. Keizer, J.J.; Silva, F.C.; Vieira, D.C.S.; González-Pelayo, O.; Campos, I.; Vieira, A.M.D.; Valente, S.; Prats, S.A. The effectiveness of two contrasting mulch application rates to reduce post-fire erosion in a Portuguese eucalypt plantation. CATENA 2018, 169, 21–30. [Google Scholar] [CrossRef]
  14. Zoumides, C.; Bruggeman, A.; Giannakis, E.; Camera, C.; Djuma, H.; Eliades, M.; Charalambous, K. Community-Based Rehabilitation of Mountain Terraces in Cyprus. Land Degrad. Dev. 2017, 28, 95–105. [Google Scholar] [CrossRef]
  15. Camera, C.; Djuma, H.; Bruggeman, A.; Zoumides, C.; Eliades, M.; Charalambous, K.; Abate, D.; Faka, M. Quantifying the effectiveness of mountain terraces on soil erosion protection with sediment traps and dry-stone wall laser scans. CATENA 2018, 171, 251–264. [Google Scholar] [CrossRef]
  16. Daliakopoulos, I.N.; Apostolakis, A.; Wagner, K.; Deligianni, A.; Koutskoudis, D.; Stamatakis, A.; Tsanis, I.K. Effectiveness of T. harzianum in soil and yield conservation of tomato crops under saline irrigation. CATENA 2018. under review. [Google Scholar] [CrossRef]
  17. Panagea, I.S.; Daliakopoulos, I.N.; Tsanis, I.K.; Schwilch, G. Evaluation of promising technologies for soil salinity amelioration in Timpaki (Crete): a participatory approach. Solid Earth 2016, 7, 177–190. [Google Scholar] [CrossRef] [Green Version]
  18. Keesstra, S.D.; Rodrigo-Comino, J.; Novara, A.; Giménez-Morera, A.; Pulido, M.; di Prima, S.; Cerdà, A. Straw mulch as a sustainable solution to decrease runoff and erosion in glyphosate treated clementine plantations in Eastern Spain. An assessment using rainfall simulation experiments. CATENA 2019, 174, 95–103. [Google Scholar] [CrossRef]
  19. Krzeminska, D.; Kerkhof, T.; Skaalsveen, K.; Stolte, J. Effect of riparian vegetation on stream bank stability in small agricultural catchments. CATENA 2019, 172, 87–96. [Google Scholar] [CrossRef]
  20. Hlavčová, K.; Danáčová, M.; Kohnová, S.; Szolgay, J.; Valent, P.; Výleta, R. Estimating the effectiveness of crop management on reducing flood risk and sediment transport on hilly agricultural land—A Myjava case study, Slovakia. CATENA 2019, 172, 678–690. [Google Scholar] [CrossRef]
  21. Hlavčová, K.; Kohnová, S.; Velísková, Y.; Studvová, Z.; Sočuvka, V.; Ivan, P. Comparison of two concepts for assessment of sediment transport in small agricultural catchments. J. Hydrol. Hydromech. 2018, 66, 404–415. [Google Scholar] [CrossRef]
  22. Berglund, Ö.; Berglund, K.; Jordan, S.; Norberg, L. Carbon capture efficiency, yield, nutrient uptake and trafficability of different grass species on a cultivated peat soil. CATENA 2019, 173, 175–182. [Google Scholar] [CrossRef]
  23. Rienks, W.A.; Leever, H. Gezond Zand—organische stof als sleutel voor een vruchtbare bodem en schoon water. ROM3D en Stichting Marke Haarlose Veld Olden Eibergen. «Gezond Zand –organic matter as a key for a fertile soil and clean water» 2014. Available online: http://hoeduurzaam.nl/wp-content/uploads/2016/03/BrochureHoeduurzaam-Definitief.pdf (accessed on 24 November 2018).
  24. Camarotto, C.; Dal Ferro, N.; Piccoli, I.; Polese, R.; Furlan, L.; Chiarini, F.; Morari, F. Conservation agriculture and cover crop practices to regulate water, carbon and nitrogen cycles in the low-lying Venetian plain. CATENA 2018, 167, 236–249. [Google Scholar] [CrossRef]
  25. Madejón, P.; Domínguez, M.T.; Gil-Martínez, M.; Navarro-Fernández, C.M.; Montiel-Rozas, M.M.; Madejón, E.; Murillo, J.M.; Cabrera, F.; Marañón, T. Evaluation of amendment addition and tree planting as measures to remediate contaminated soils: The Guadiamar case study (SW Spain). CATENA 2018, 166, 34–43. [Google Scholar] [CrossRef]
  26. Vrînceanu, N.O.; Motelică, D.M.; Dumitru, M.; Calciu, I.; Tănase, V.; Preda, M. Assessment of Using Bentonite, Dolomite, Natural Zeolite and Manure for the Immobilization of Heavy Metals in a Contaminated Soil: The Copșa Mică Case Study (Romania). CATENA 2018. under review. [Google Scholar]
  27. Tibbett, M.; Gil-Martínez, M.; Fraser, T.; Green, I.D.; Duddigan, S.; De Oliveira, V.; Raulund-Rasmussen, K.; Sizmur, T.; Diaz, A. Experimental acidification of pasture: Effects of long-term pH adjustment on soil biodiversity, fertility and function in comparison to heathland and acidic grassland. CATENA 2018. under review. [Google Scholar]
  28. Turner, K.G.; Anderson, S.; Gonzales-Chang, M.; Costanza, R.; Courville, S.; Dalgaard, T.; Dominati, E.; Kubiszewski, I.; Ogilvy, S.; Porfirio, L.; et al. A review of methods, data, and models to assess changes in the value of ecosystem services from land degradation and restoration. Ecol. Model. 2016, 319, 190–207. [Google Scholar] [CrossRef]
  29. Bagstad, K.J.; Semmens, D.J.; Waage, S.; Winthrop, R. A comparative assessment of decision-support tools for ecosystem services quantification and valuation. Ecosyst. Serv. 2013, 5, 27–39. [Google Scholar] [CrossRef]
  30. Burkhard, B.; Kroll, F.; Nedkov, S.; Müller, F. Mapping ecosystem service supply, demand and budgets. Ecol. Indic. 2012, 21, 17–29. [Google Scholar] [CrossRef]
  31. Jackson, B.; Pagella, T.; Sinclair, F.; Orellana, B.; Henshaw, A.; Reynolds, B.; Mcintyre, N.; Wheater, H.; Eycott, A. Polyscape: A GIS mapping framework providing efficient and spatially explicit landscape-scale valuation of multiple ecosystem services. Landsc. Urban Plan. 2013, 112, 74–88. [Google Scholar] [CrossRef]
  32. Peh, K.S.-H.; Balmford, A.; Bradbury, R.B.; Brown, C.; Butchart, S.H.M.; Hughes, F.M.R.; Stattersfield, A.; Thomas, D.H.L.; Walpole, M.; Bayliss, J.; et al. TESSA: A toolkit for rapid assessment of ecosystem services at sites of biodiversity conservation importance. Ecosyst. Serv. 2013, 5, 51–57. [Google Scholar] [CrossRef] [Green Version]
  33. Ghaley, B.B.; Vesterdal, L.; Porter, J.R. Quantification and valuation of ecosystem services in diverse production systems for informed decision-making. Environ. Sci. Policy 2014, 39, 139–149. [Google Scholar] [CrossRef]
  34. Volchko, Y.; Norrman, J.; Rosén, L.; Bergknut, M.; Josefsson, S.; Söderqvist, T.; Norberg, T.; Wiberg, K.; Tysklind, M. Using soil function evaluation in multi-criteria decision analysis for sustainability appraisal of remediation alternatives. Sci. Total Environ. 2014, 485–486, 785–791. [Google Scholar] [CrossRef] [PubMed]
  35. Volchko, Y.; Norrman, J.; Rosén, L.; Norberg, T. SF Box—A tool for evaluating the effects on soil functions in remediation projects. Integr. Environ. Assess. Manag. 2014. [Google Scholar] [CrossRef] [PubMed]
  36. Schwilch, G.; Mills, J.; Verzandvoort, S. The RECARE Ecosystem services framework and its operationalization for soil management decision making. In Proceedings of the Global Soil Week, Berlin, Germany, 19–23 April 2015. [Google Scholar]
  37. Schwilch, G.; Bernet, L.; Fleskens, L.; Mills, J.; Stolte, J.; van Delden, H.; Verzandvoort, S. A proposed framework to operationalize ESS for the mitigation of soil threats. In Proceedings of the EGU General Assembly 2015, Vienna, Austria, 12–17 April 2015; Volume 17. [Google Scholar]
  38. Schwilch, G.; Verzandvoort, S.; van Delden, H.; Fleskens, L.; Giannakis, E.; Marañón, T.; Mills, J.; Short, C.; Stolte, J. Operationalizing ecosystem services for the mitigation of soil threats. In Proceedings of the European Ecosystem Services Conference, Antwerp, Belgium, 19 September 2016. [Google Scholar]
  39. Maes, J.; Liquete, C.; Teller, A.; Erhard, M.; Paracchini, M.L.; Barredo, J.I.; Grizzetti, B.; Cardoso, A.; Somma, F.; Petersen, J.-E.; et al. An indicator framework for assessing ecosystem services in support of the EU Biodiversity Strategy to 2020. Ecosyst. Serv. 2016, 17, 14–23. [Google Scholar] [CrossRef] [Green Version]
  40. Mapping and Assessment of Ecosystems and Their Services (MAES). Available online: https://biodiversity.europa.eu/maes (accessed on 24 November 2018).
  41. Heink, U.; Hauck, J.; Jax, K.; Sukopp, U. Requirements for the selection of ecosystem service indicators—The case of MAES indicators. Ecol. Indic. 2016, 61, 18–26. [Google Scholar] [CrossRef]
  42. Schröder, J.J.; Schulte, R.P.O.; Creamer, R.E.; Delgado, A.; van Leeuwen, J.; Lehtinen, T.; Rutgers, M.; Spiegel, H.; Staes, J.; Tóth, G.; et al. The elusive role of soil quality in nutrient cycling: A review. Soil Use Manag. 2016, 32, 476–486. [Google Scholar] [CrossRef]
  43. Haines-Young, R.; Potschin, M. Common International Classification of Ecosystem Services (CICES), Version 4.3. Report to the European Environment Agency; The University of Nottingham: Nottingham, UK, 2013. [Google Scholar]
  44. The Economics of Ecosystem and Biodiversity (TEEB). Ecological and Economic Foundations; Earthscan: London, UK, 2010. [Google Scholar]
  45. Fisher, B.; Turner, R.K.; Morling, P. Defining and classifying ecosystem services for decision making. Ecol. Econ. 2009, 68, 643–653. [Google Scholar] [CrossRef] [Green Version]
  46. Raudsepp-Hearne, C.; Peterson, G.D.; Bennett, E.M. Ecosystem service bundles for analyzing tradeoffs in diverse landscapes. Proc. Natl. Acad. Sci. USA 2010, 107, 5242–5247. [Google Scholar] [CrossRef] [PubMed] [Green Version]
  47. Bachmann, F.; Schwilch, G.; Lemann, T.; Schneider, F. RECARE Stakeholder Workshop 3.: Stakeholder Valuation of Ecosystem Services—Guidelines WP 4.3. 2017. Available online: http://www.recare-project.eu/downloads-by-category/other-project-reports/415-report-30-stakeholder-workshop-3-wp4-3-guidelines-bachmann-full/file (accessed on 24 November 2018).
  48. Bachmann, F.; Schwilch, G.; Lemann, T. Report About Stakeholder Valuation of Ecosystem Services 2018. Available online: http://www.recare-project.eu/downloads-by-category/project-deliverables-2/398-report-24-d4-2-report-about-stakeholder-valuation-of-ecosystem-services-f-bachmann-full/file (accessed on 24 November 2018).
  49. Egoh, B.; Reyers, B.; Rouget, M.; Richardson, D.M.; Le Maitre, D.C.; van Jaarsveld, A.S. Mapping ecosystem services for planning and management. Agric. Ecosyst. Environ. 2008, 127, 135–140. [Google Scholar] [CrossRef]
  50. Francesconi, W.; Srinivasan, R.; Pérez-Miñana, E.; Willcock, S.P.; Quintero, M. Using the Soil and Water Assessment Tool (SWAT) to model ecosystem services: A systematic review. J. Hydrol. 2016, 535, 625–636. [Google Scholar] [CrossRef]
  51. Schwilch, G.; Liniger, H.P.; Hurni, H. Sustainable Land Management (SLM) Practices in Drylands: How Do They Address Desertification Threats? Environ. Manag. 2014, 54, 983–1004. [Google Scholar] [CrossRef] [PubMed]
  52. Jacobs, S.; Burkhard, B.; Van Daele, T.; Staes, J.; Schneiders, A. ‘The Matrix Reloaded’: A review of expert knowledge use for mapping ecosystem services. Ecol. Model. 2015, 295, 21–30. [Google Scholar] [CrossRef]
  53. Bünemann, E.K.; Bongiorno, G.; Bai, Z.; Creamer, R.E.; De Deyn, G.; de Goede, R.; Fleskens, L.; Geissen, V.; Kuyper, T.W.; Mäder, P.; et al. Soil quality—A critical review. Soil Biol. Biochem. 2018, 120, 105–125. [Google Scholar] [CrossRef]
  54. Lima, A.C.R.; Brussaard, L.; Totola, M.R.; Hoogmoed, W.B.; de Goede, R.G.M. A functional evaluation of three indicator sets for assessing soil quality. Appl. Soil Ecol. 2013, 64, 194–200. [Google Scholar] [CrossRef]
  55. Braat, L.C.; de Groot, R. The ecosystem services agenda:bridging the worlds of natural science and economics, conservation and development, and public and private policy. Ecosyst. Serv. 2012, 1, 4–15. [Google Scholar] [CrossRef]
  56. Baveye, P.C. Quantification of ecosystem services: Beyond all the “guesstimates”, how do we get real data? Ecosyst. Serv. 2017, 24, 47–49. [Google Scholar] [CrossRef]
Figure 1. Ecosystem service framework for RECARE. Reprinted from Ecological Indicators, Vol. 67, Schwilch et al., Operationalizing ecosystem services for the mitigation of soil threats: A proposed framework, 586–597, 2016, with permission from Elsevier [3].
Sustainability 10 04416 g001
Figure 2. Framework and processes of the ecosystem service assessment tool.
Sustainability 10 04416 g002
Figure 3. Relative weight of properties explaining changes in the nutrition biomass ES. (Left) default. (Right) NL—Olden Eibergen trial ‘grass undersowing of maize’.
Sustainability 10 04416 g003
Figure 4. Example of graph presenting the ES change for a 10-year scenario on a wider area from the conservation agriculture trials in Veneto, Italy.
Sustainability 10 04416 g004
Figure 5. Number of properties assessed by the case studies (red = total count, blue = measured, green = estimated).
Sustainability 10 04416 g005
Figure 6. Comparison of measured values (left column) and the appraisal of magnitude of change (right column) of selected properties in the 16 case studies.
Sustainability 10 04416 g006
Figure 7. Number of indicators of the 15 ES services assessed by the case studies (red = total count, blue = measured, green = estimated).
Sustainability 10 04416 g007
Figure 8. Appraisal of magnitude for assessed provisioning services (illustrative selection from those services with more than seven mentions).
Sustainability 10 04416 g008
Figure 9. Appraisal of magnitude for assessed regulating services (illustrative selection from those services with more than 11 mentions).
Sustainability 10 04416 g009
Figure 10. Appraisal of magnitude for assessed cultural services (only for services with more than seven mentions).
Sustainability 10 04416 g010
Figure 11. Final ES changes at plot level.
Sustainability 10 04416 g011
Figure 12. Changes in selected ES services after the implementation period and after 10 years.
Sustainability 10 04416 g012
Table 1. List of the 16 case study sites and their 26 trialled measures—sorted according to their main soil threats addressed. Further details about the trials and their results can be found in the papers cited in the last column. Most of these papers are part of the CATENA special issue “Quantifying the effectiveness of stakeholder-selected measures against individual and combined soil threats” [11].
Study Site no.Study Site NameCountryTrialled MeasureMain Soil ThreatReferences
01FrienisbergSwitzerlandDyker on potato fields (shovels digging holes into the bottom of the furrows)Soil erosion by water[12]
02CaramuloPortugalMulching—Low application rate (2.5 Mg ha−1)Soil erosion by water[13]
02CaramuloPortugalPloughingSoil erosion by water
03PeristeronaCyprusTerrace rehabilitationSoil erosion by water[14,15]
04TimpakiGreeceRainwater harvesting system installed in greenhousesSoil salinization[16,17]
04TimpakiGreeceApplication of T. harzianum in tomato rootstock for alleviation of high soil salinity effectsSoil salinization[16,17]
06WroclawPolandRegulations limiting soil sealingSoil sealing
07CanyolesSpainStraw mulchDesertification[18]
08GunnarsholtIcelandLand reclamationDesertification
09Vansjø-Hobøl NorwayFlood retention pondsFlooding and landslides
09Vansjø-HobølNorwayStream bank vegetationFlooding and landslides[19]
10MyjavaSlovakiaChanges in crop and land use managementFlooding and landslides[20,21]
10MyjavaSlovakiaSmall wooden check damsFlooding and landslides[20,21]
10MyjavaSlovakiaChanges in vegetation coverFlooding and landslides[20,21]
11VeenweidegebiedNetherlandsSubmerged drains (positioned below the groundwater level)Loss of organic matter in peat soils
12BroddboSwedenDifferent grass cropsLoss of organic matter in peat soils[22]
13Olden EibergenNetherlandsLocal Biomass (from e.g., tree pruning, mowing applied on/into the soil)Loss of organic matter in mineral soils[23]
13Olden EibergenNetherlandsGrass undersowing of maizeLoss of organic matter in mineral soils[23]
14VenetoItalyCover crops (CC)Loss of organic matter in mineral soils[24]
14VenetoItaly Conservation agriculture (CA)Loss of organic matter in mineral soils[24]
15GuadiamarSpainAmendment addition: biosolid compostSoil contamination[25]
15GuadiamarSpainUse of tree species: plantation of Olea europaea var. sylvestrisSoil contamination[25]
16Copşa MicăRomaniaInorganic soil amendments (bentonite, zeolite, dolomite)Soil contamination[26]
16Copşa MicăRomaniaOrganic soil amendmentsSoil contamination[26]
17Isle of PurbeckUKElemental sulphur treatmentSoil biodiversity[27]
17Isle of PurbeckUKFerrous sulphate treatmentSoil biodiversity[27]

