1. Introduction
Of late, green behavior in the construction industry has received greater attention from researchers, who have focused on topics such as environmental behavior during construction, reducing the carbon emissions of buildings, and improving the energy performance of buildings [
1]. Because of the vast scale of mega projects, the complex natural environment of areas where they are built, long construction period, and massive, long-lasting impact on the surrounding environment, green behavior is of great significance to such projects. At present, both owners and contractors tend to focus on the green supply chain during the construction period. For example, in the construction of high-speed railways in China, the concrete box girder is prefabricated and the green supply chain is realized through overall optimization of design; this reduces waste pollution and energy consumption during construction, thereby improving the project’s public reputation and leading to a win-win situation for the construction industry and environmental protection enthusiasts. Thus, the idea of a green supply chain is of great significance in the management of mega projects.
Green supply chain management is a type of management that considers both economic and environmental benefits [
2,
3,
4]. The development of green supply chain management is driven by the deterioration of the environment brought about by urbanization, scarcity of resources, and rising pollution levels [
5]. It involves key areas in supply chain management, such as industrial design, supplier evaluation, product production, packaging, transportation, sales, and resource recovery, to ensure that the issue of environmental protection is thoroughly addressed [
6,
7]. Specifically, green supply chain management combines the environmental life cycle analysis of products with the supply chain process, encouraging the inclusion of environmental management theory into the suppliers’ organizational structure and urging suppliers to implement green supply chains [
8]. Currently, under pressure from government supervision and public awareness about the environment, the best choice for enterprises seeking to survive competition in the long-term is to assume social responsibility, adopt green behavior, and provide green products [
9,
10]; as a technical means to achieve this goal, building information modeling technology has received more and more attention [
11]. It has been found that many manufacturers also benefit from green behavior [
12].
The rapid development of the construction industry has had some adverse impact on the environment; thus, the concept of sustainability is becoming increasingly important in the industry and being continuously developed by it [
13]. Sustainable building methods have profound impacts on the relationship between society and the built environment. Green buildings can meet the growing demand for a sustainable building environment and healthy living, and are, thus, becoming widely recognized in the construction industry [
14]. Thus, the implementation of green behavior in the construction industry should be supported by the use of advanced green technologies [
15]; further, factors, such as financial feasibility, project manager’s ability, coordination between designer and contractor, and support from designer and owner, that constrain the application of green technologies should be addressed [
16,
17]. Because a green building is the result of an on-site construction project commissioned by the owner, the joint cooperation of all stakeholders involved in the project is crucial for its successful completion.
The existing research on green supply chain in the field of construction mainly focuses on its technological realization, the selection method of green suppliers, and so on [
18,
19,
20]; however, studies on multi-party cooperation in the construction industry’s green supply chain are still lacking. Further, most studies on cooperation in the field of engineering management are static, with less consideration being given to the dynamic evolution of the entire industry. Mega projects often have a long construction period, and it is necessary to study the evolutionary direction of a contractor’s decision-making behavior from a dynamic perspective. Therefore, this paper studies the dynamic evolution of the green supply chain in the construction industry; at the same time, it considers the opportunistic behavior of the participants. This paper proposes a method to analyze the evolution of contractor’s opportunistic behavior in the green supply chain of mega projects, and provides a point of reference for decision making regarding the government’s and the owner’s subsidy settings and the mechanism of subsidy allocation by the main contractor.
The remainder of this paper is organized as follows.
Section 2 reviews the relevant literature. In
Section 3, a dynamic game model is formulated.
Section 4 solves and analyzes the model.
Section 5 carries out the numerical simulation. Finally, conclusions and future research directions are presented in
Section 6.
2. Literature Review
The construction process of a project has a significant impact on the environment. The popularization of the “green” concept and the greater attention paid to environmental issues have had a major impact on the traditional construction industry. Thus, the concept of a green supply chain plays an important role in the sustainable development of the construction industry, especially for mega projects. An example is the Hong Kong–Zhuhai–Macao Bridge which passes through the Chinese White Dolphin Nature Reserve; its main project involves a large number of offshore operations, such as excavation of the foundation groove of the immersed tunnel and sinking of the steel cylinder [
21]. This means that the construction of the bridge conflicts with the environmental protection of white dolphins, which, in turn, increases the importance of green environmental protection behavior exhibited by the bridge contractor during the construction process. As a result, the green behavior of such large-scale projects requires the close cooperation of multiple agents. Further, owing to the long construction period of such mega projects, these problems also need to be studied from the dynamic and evolutionary perspectives.
Cooperative behavior is a way to pursue common goals through cooperation [
22,
23,
24,
25], and many scholars have studied the benefits of cooperative behavior in engineering. For instance, Mohebbi and Li [
26] proposed a supplier cooperation algorithm and their simulation results show that long-term cooperation between a network of suppliers can increase the average personal profit of the network’s members. Zhang et al. [
27] considered that the owner’s contract terms would have a negative impact on the contractor’s cooperative behavior, and provide advice to the project owner on better design of the contract. Lu and Hao [
28] pointed out that trust and rights are the two necessary mechanisms to promote cooperation among construction partners, and established a model on the relationship between trust and rights. The incentive mechanism of the owner also plays a key role in promoting cooperation with the contractor [
29]. For mega projects, multi-party cooperation is even more significant; because of the greater uncertainty, technical complexity, strict requirements on quality, and time limits in the construction process, it is necessary to cooperate with various functional units, such as exploration, design, consulting, construction, and supervision [
30]. Because the objectives of project participants are, to some extent, consistent, the parties involved in the construction process can realize benefits and achieve risk sharing through cooperation, thereby contributing to the realization of project objectives. In other words, owing to the special nature of mega projects, there is a need for close interaction and a high level of cooperation among the participating units; this can sometimes even lead to the formation of a joint-venture. For example, the Hong Kong–Zhuhai–Macao Bridge adopts the design-construction venture mode. Further, the joint-venture has the advantage of increasing synergy among members and enhancing competitiveness. Specifically, a project-based joint-venture enables the rapid integration of the resources needed over the short-term without the need for significant investment [
31]. Therefore, in the field of engineering construction, cooperation is frequent and widespread. However, there are still many problems regarding cooperation. For example, project stakeholders may adopt citizenship behavior that benefits others [
32], but are also prone to opportunistic behaviors that harm others’ interests [
33]. Opportunistic behavior greatly hinders the success of a project by increasing transaction costs and adversely affecting partnerships [
34,
35].
Opportunism is often defined as “seeking self-interest by trickery” [
36]; it includes misleading, disguising, and resorting to other deceptive or immoral behaviors, and is one of the major risks faced by the parties involved in cooperation [
37]. Once opportunistic behavior occurs, it will have a negative impact on the performance of the cooperative project and even lead to disputes between partners [
38]. Many scholars have hitherto conducted research on the determinants, consequences, and the mechanism governing opportunistic behavior. For example, Walter et al. [
39] distinguished between two opportunistic behaviors under the R & D alliance problem and hold that improving communication quality can encourage the parties to pursue long-term mutual benefits, thus restraining the opportunistic behavior. Bhattacharya et al. [
40] found that in outsourcing, the buyer’s opportunism can be controlled by altering the frequency of transactions. In supply chain relationships, Pavlou et al. [
41] pointed out that suppliers evade responsibilities and fail to fulfill relevant commitments by choosing opportunistic behavior. Huo et al. [
42] found that supplier opportunism can be contained through better communication with the buyer; however, it increases owing to the buyer’s specific investments by using empirical testing.
In engineering construction, the contractors’ opportunistic behaviors have been widely considered and studied. Shi et al. [
43] concluded that asset specificity has a positive effect on both the strong and weak opportunism of contractors, with the influence being stronger on the latter. Zhang and Qian [
44] argued that the contractor’s relationship and performance risk perceptions have a positive impact on opportunism tendencies. Yan [
45] found that the impact of contract application, rather than the contract’s content, on the contractor’s opportunistic behavior was mainly owing to the ambiguity in quality performance. Kadefors [
46] showed that contract incentives and close monitoring of contractor performance may lead to opportunism, whereas a higher level of trust may improve project performance. Maestrini et al. [
47] also found that incentives increase the opportunities for supplier’s opportunistic behavior and, at the same time, weaken supplier performance.
Evolutionary game theory combines game theory with biological dynamic evolution processes to emphasize the interaction between different players. In other words, with different strategies, the interaction between players will directly affect their income [
48]. Thus, evolutionary game theory is widely used in economic and social systems. For instance, Anastasopoulos and Anastasopoulos [
49] established an evolutionary game model for audit/fraud detection and tested the stability of an audit/fraud detection game. Wu et al. [
50] established a low-carbon strategy evolution model based on a government-enterprise game in a complex network environment. Wood et al. [
51] analyzed the global oil market by combining evolutionary game theory with an agent-based model. Ji et al. [
52] used evolutionary game modeling to observe the trend of multi-stakeholder cooperation during the green procurement process. Recently, in the field of engineering management, Liu et al. [
53] used evolutionary game theory to analyze the strategic choice of opportunistic behaviors by the government and private investors during project operation. Requejo and Camacho [
54] also studied the evolution of cooperative behavior under finite resources by combining a resource-based model with evolutionary game theory. Shi [
55] and Zhu [
56] studied multi-supplier cooperation and competition during the prefabricated production of key components for mega projects using an evolutionary perspective.
3. The Model
The problem analyzed in this paper is the cooperation between contractors involved in the green supply chain of mega projects. Considering the construction scale of mega projects and their large environmental and social impacts, owners are generally concerned about the contractor’s material supply and green behavior during the construction process; the behavior is usually enforced through contracts or additional clauses about incentives that encourage green behavior by the contractor. The green behavior of a contractor means that the contractor needs to improve many aspects—material, process, personnel, and equipment—of the existing construction process, typically resulting in a cost increase. However, with the improvement in green behavior and green level of the project, the overall efficiency—which is the responsibility of the owner—gradually reduces and the economic burden increases; this which leads to a decline in the contractor’s income. Faced with such a situation, the contractor can, on one hand, obtain subsidies from the owner and government by means of cooperation or, on the other hand, can adopt opportunistic behavior to benefit from the green behavior of the other contractors. We assume that the contractor is bounded rational and unable to make the optimal decision at first, but can then modify his or her decision by comparing and observing profit. Based on these assumptions, we propose an evolutionary game model to explore the factors affecting contractor decision-making. In the model, we use the following variables in
Table 1.
We assume there are two kinds of contractors in the market: main contractor and subcontractor. There is no difference between the products provided by the two contractors, but the main contractor is dominant in the cooperation with the project owner and can distribute subsidies from the government and owner. The owner subsidizes green behavior, but no subsidy is provided if no contractor adopts green behavior. Similarly, the government subsidizes green behavior, but does not provide subsidies if no contractor adopts green behavior. Green product or service pricing follows a linear inverse demand pricing model, p = 1 − k(q1 + q2).
Next, we build the model in two steps:
Step 1: Establishing a payoff matrix. In
Table 2, we establish a game model, wherein both the main contractor and subcontractor are finite rational, with different revenue functions. They have two pure strategies—participating in market competition and opportunism. That is, the pure strategy of the main contractor is (1) to participate in the market competition of the green supply chain and share subsidies from the owner and government or (2) to adopt opportunism, expecting the owner to subsidize. The pure strategy of the subcontractor is (1) to participate in the market competition of the green supply chain and hope to receive subsidies from the owner and government or (2) to adopt opportunism and hope to get a share of the owner’s subsidy.
Step 2: Formulating a dynamic game system. In the model, x is the probability that the main contractor participates in the competition strategy; thus, the probability of opportunistic behavior is 1 − x. Similarly, if the subcontractor participates in the competition strategy with probability y, the probability of opportunistic behavior is 1 − y. The two parties will compare the benefits within the group and adjust their own strategies, thus changing the probabilities of the parties adopting different strategies.
For the main contractor, when the subcontractor adopts the competition strategy, the benefits of its first and second strategies are ∏
m1 and ∏
m3, respectively. When the subcontractor adopts the opportunism strategy, the benefits from the first and second strategies are ∏
m2 and ∏
m4, respectively.
Therefore, the average revenue of the main contractor when adopting the competition strategy is
and the average revenue of the main contractor when adopting the opportunism strategy is
Similarly, for the subcontractor, when the main contractor adopts the competition strategy, the benefits of its first and second strategies are ∏
s1 and ∏
s2, respectively. When the main contractor adopts the opportunism strategy, the benefits from the first and second strategies are ∏
s3 and ∏
s4, respectively.
Therefore, the average revenue of the subcontractor when adopting the competition strategy is
The average revenue of the main contractor when adopting the opportunism strategy is
For the two contractors, the average revenues are
In a replicator dynamic system, the trend and speed of evolution depends on the rate of change in the strategy of each group in the system. In the model, we refer to the classical theory that the rate of change is the difference between the expected return for the current strategy and the average expected return for the entire group. Therefore, we get obtain the replicator dynamic equations of the main contractor and the subcontractor as follows
Further, we calculate the parameters to obtain
4. Discussion
To check the stability of the replicator dynamic system, we explore the nature of its Jacobian matrix.
The Jacobian matrix of the system is given by
Further, we can get the determinant as
Theorem 1. For such a dynamic system, under certain conditions, the following are the five equalization points
, , , , and .
Proof. Let
and
the four equilibrium points of
,
,
, and
are clear. When the condition
is satisfied, for the sake of simplifying, let
. Thus, we can obtain
□
Obviously, as the value of changes, when falls out of plane 1 × 1, the direction of the evolution direction of the system follows a singularity. Owing to space limitations, this paper studies . For the sake of simplifying, let . At this point, the direction of evolution of the system is more varied.
Theorem 2. When andthe equilibrium point (0, 0) is an ESS; equilibrium point is an unstable point; equilibrium point is an unstable point; equilibrium point is an ESS; and equilibrium point is the saddle point. Proof. When and
, we can obtain:
Obviously, at point , and ; thus, the equilibrium point is an ESS.
At point , when , and , the equilibrium point is an unstable point.
At point , when , and , and the equilibrium point is an unstable point.
At point , when , and , the equilibrium point is an ESS.
Finally, at point , and thus, the equilibrium point is the saddle point. □
Theorem 3. The increase in the unit cost of the main contractor and the unit cost of the subcontractor increases the probability of opportunistic behavior by both parties; the increase in the cost reduction owing to cooperation reduces the probability of opportunistic behavior; and there is an optimal distribution coefficient for government subsidy that minimizes the probability of opportunistic behavior by both parties.
It is possible to define area M as the s formed by the line between
,
,
, and
. The direction of evolution falling in area M will be toward the point (0, 0), while that falling in the remaining area N will be toward the point (1, 1). Then, the size of area M can be obtained as
Proof. To solve the partial derivative of s, we obtain (1) and . Therefore, as the unit cost of the main contractor and the subcontractor increases, the area of s increases; this means that the probability of it falling in area M increases, and, thus, the probability of opportunism increases. (2) and with the increase in government subsidy and owner subsidy, the area of s is reduced, which means that the probability of opportunism is reduced. Letting , we can obtain the optimal distribution coefficient for government subsidy . When , increases, the probability of opportunism decreases; in contrast , as increases, the probability of opportunism increases. □
The above analysis explores the existence of system equilibrium points and the conditions that need to be met; further, it explores the stability of equilibrium points in specific situations and the determinants of opportunistic behavior among contractors. As the range of different parameters varies, so do the equilibrium points of the system. This paper considers the specific situation of and . When the subsidies of the owners and government meet this condition, both parties may move either toward green supply chain behavior or opportunistic behavior. The evolution of the system can, thus, follow two directions. Thus, this section analyzed the stability of the equilibrium points of the system and the conditions that the two ESS points and the saddle point should satisfy. Additionally, the impact of costs and subsidies on the direction of evolution is further discussed. The increase in the costs incurred by both parties will lead to opportunism, whereas an increase in subsidies will lead to green behavior. Moreover, there is an optimal distribution coefficient on the government subsidy that minimizes the probability of both parties moving towards opportunism.
5. Numerical Simulation
In
Section 3, some properties of the replicator equation were discussed. This section uses numerical simulation to understand the evolution and characteristics of the system more intuitively. The main purpose of this section is to explore the evolutionary trends of the system under different initial conditions. The initial values are set as shown in
Table 3.
5.1. Parameter Setting
Five scenarios are considered in this section. The first three, all of which concern the evolution of contractors 1 and 2 for initial values X = 0.68 and Y = 0.34, respectively, are placed in one group. The last two are place in another grouped; further, the evolution of contractor 1 and contractor 2 for initial values X = 0.55 and Y = 0.28, respectively, is discussed. In the first three scenarios, the proportion of the main contractor and the subcontractor who initially adopt the competition strategy is very high; in the second scenario, both types of contractors shift partly to the opportunism strategy, with the main contractor accounting for a larger proportion of changes. This setting is close to the real situation because we analyze the impact of the initial proportion on the direction of evolution, as well as the requirements of the owner and the government for the construction methods that are, in general, more acceptable to the main contractor.
For contractor 1, the following parameters are determined, the distribution coefficient of the owner subsidy, distribution coefficient of the government subsidy, quantity of green behavior products provided, and the corresponding unit cost. For contractor 2, it is necessary to determine the quantity of green behavior products provided and the corresponding unit cost. Additionally, the external variable setting includes the subsidies in the green supply chain determined by the owner and government, as well as the coefficient on pricing determined by the market. Further, we study the effects of different parameters on the results of the evolution in more detail. Among the first three scenarios, the competitive advantage of the subcontractor in the market in scenario 2 is more than that in scenario 1, and the government subsidy received is also higher; in scenario 3, the competitive advantage of the main contractor is enhanced, and the owner subsidy received also increases. The five scenarios provide us with rich evolutionary information, considering the fact that the main contractor and the subcontractor have different competitive advantages in the market, and under different subsidy settings, the main contractor adopts the strategy of different distribution coefficients, which suppresses or aggravates the opportunistic behavior of both parties.
5.2. Result Analysis
Here, we discuss five sets of related variable settings, each of which represents a different market position chosen by the two types of contractors. Through the different variable settings, the influence of changes in the market position on the evolutionary trend can be demonstrated; further, and the occurrence and evolution of opportunistic behavior can be intuitively displayed.
Figure 1,
Figure 2 and
Figure 3 show the evolution of the initial probabilities X = 0.68 and Y = 0.34;
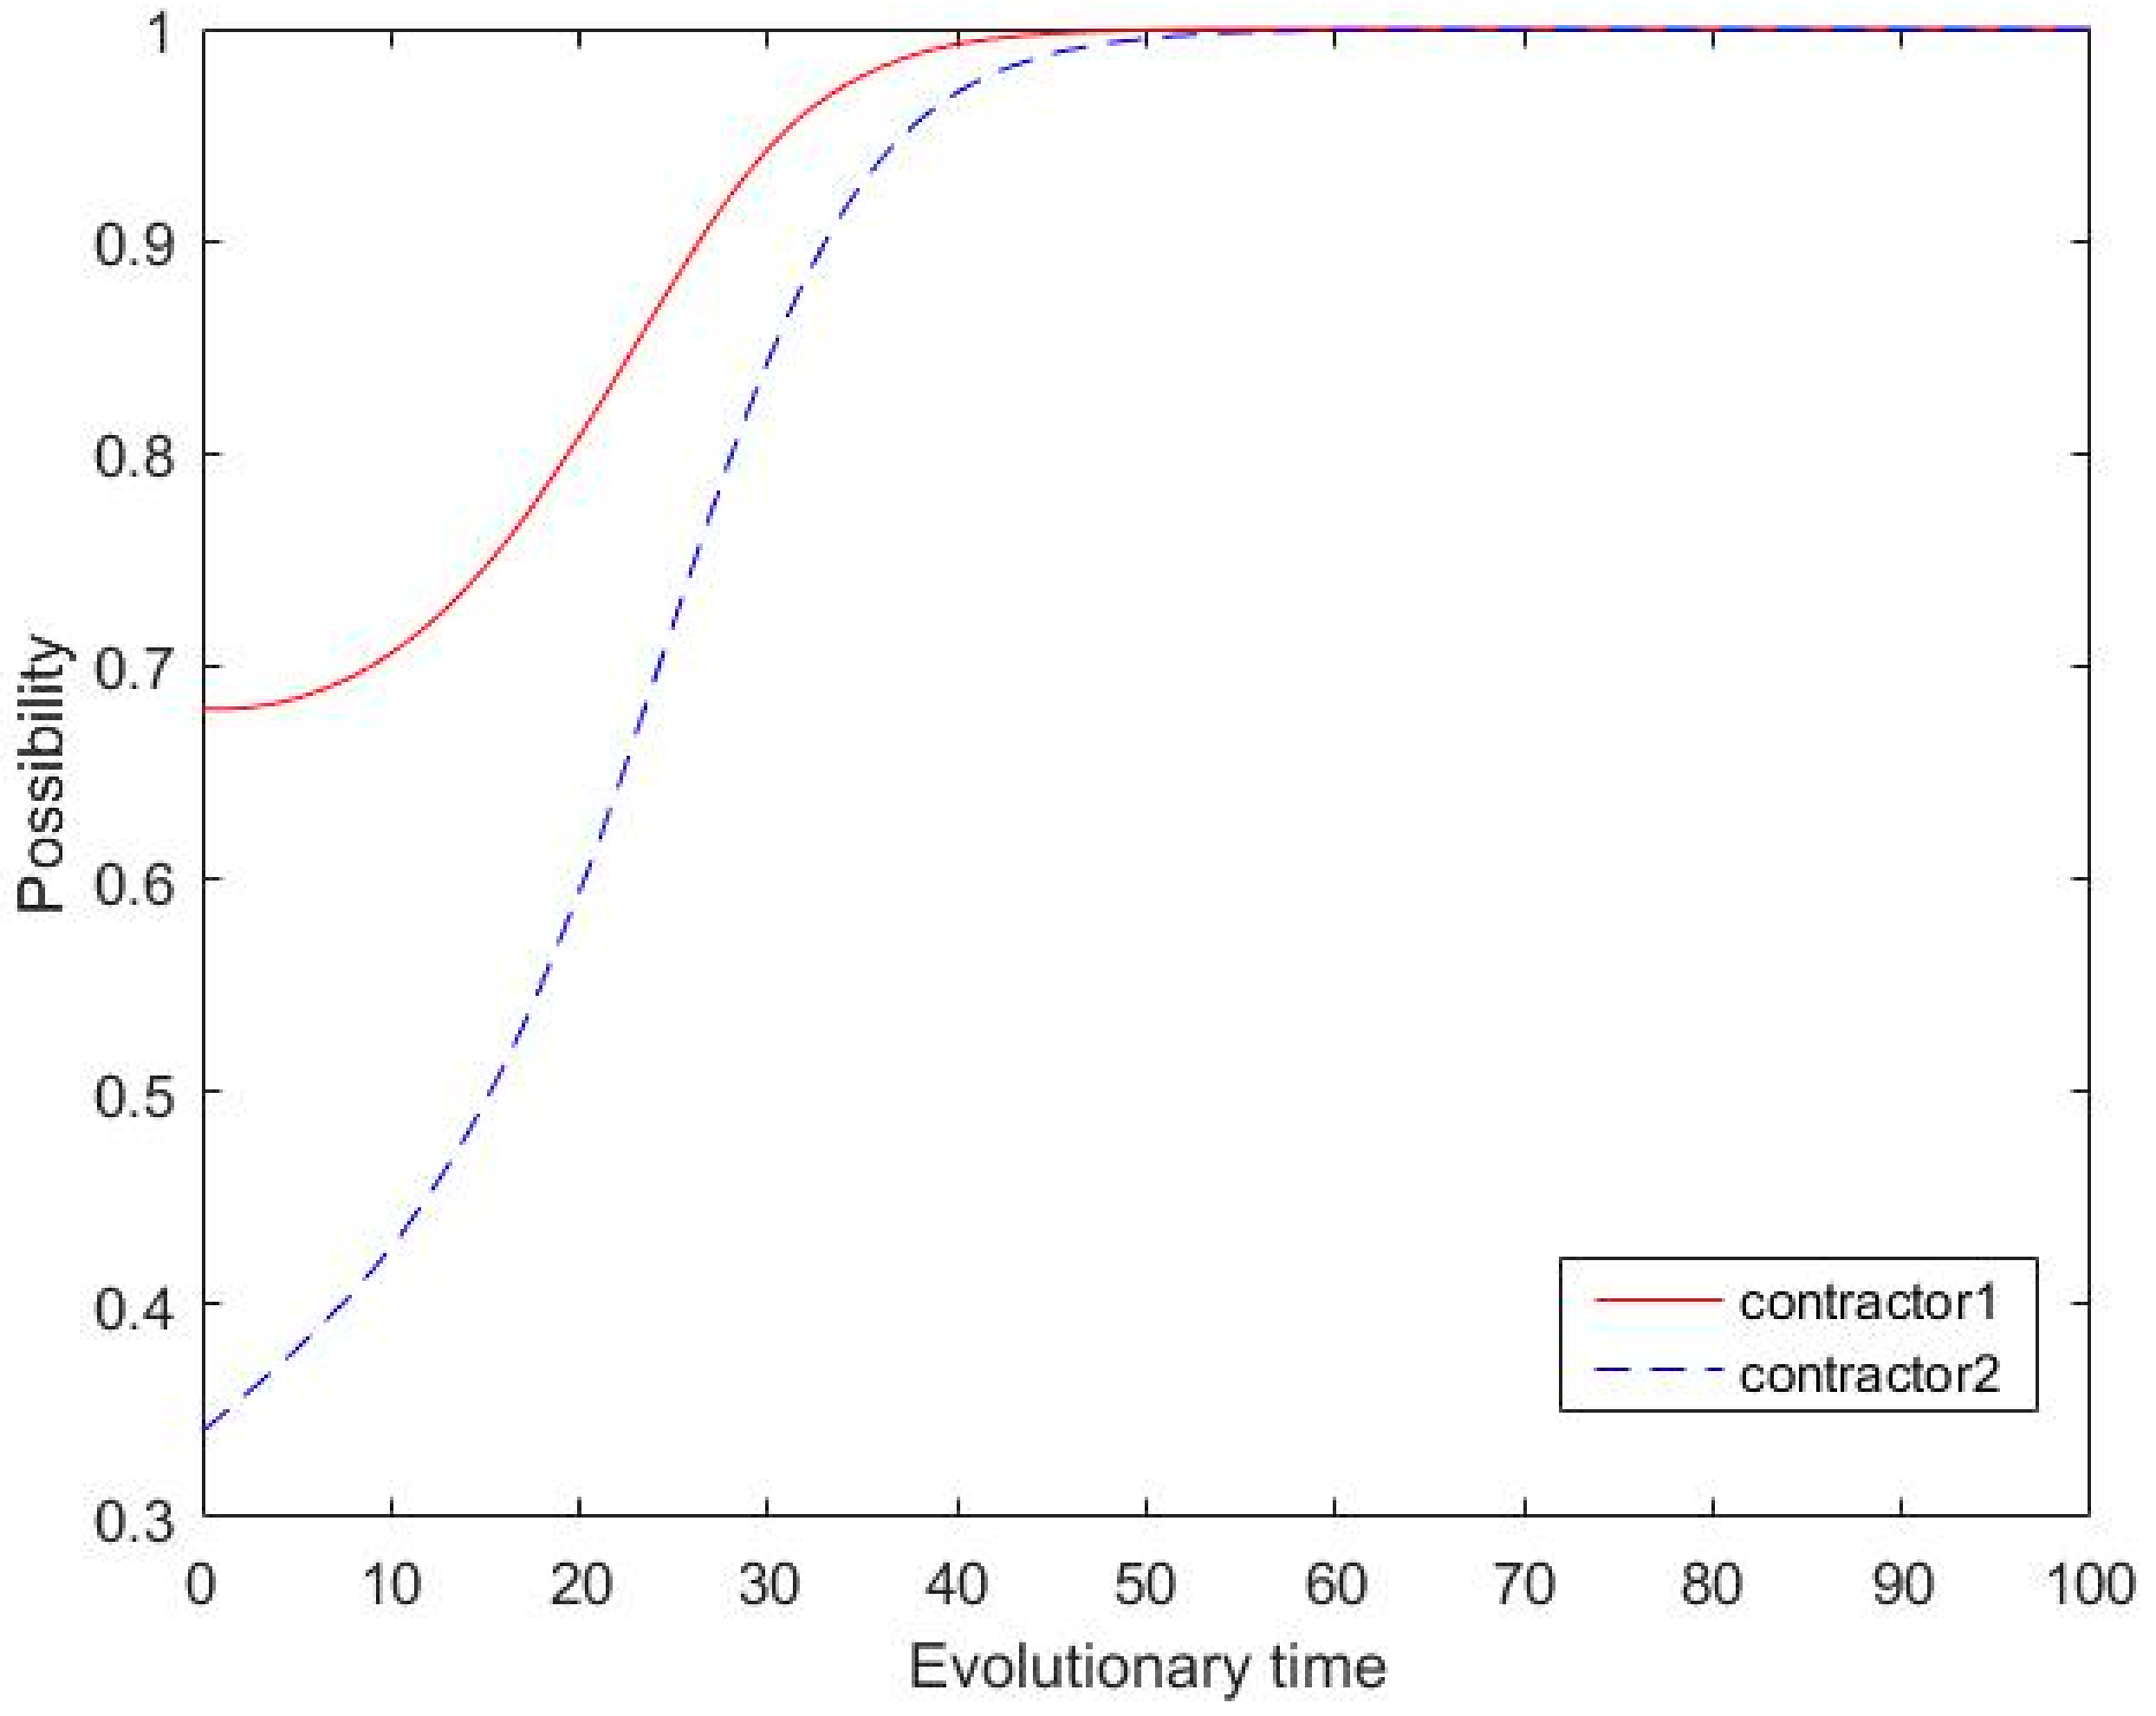
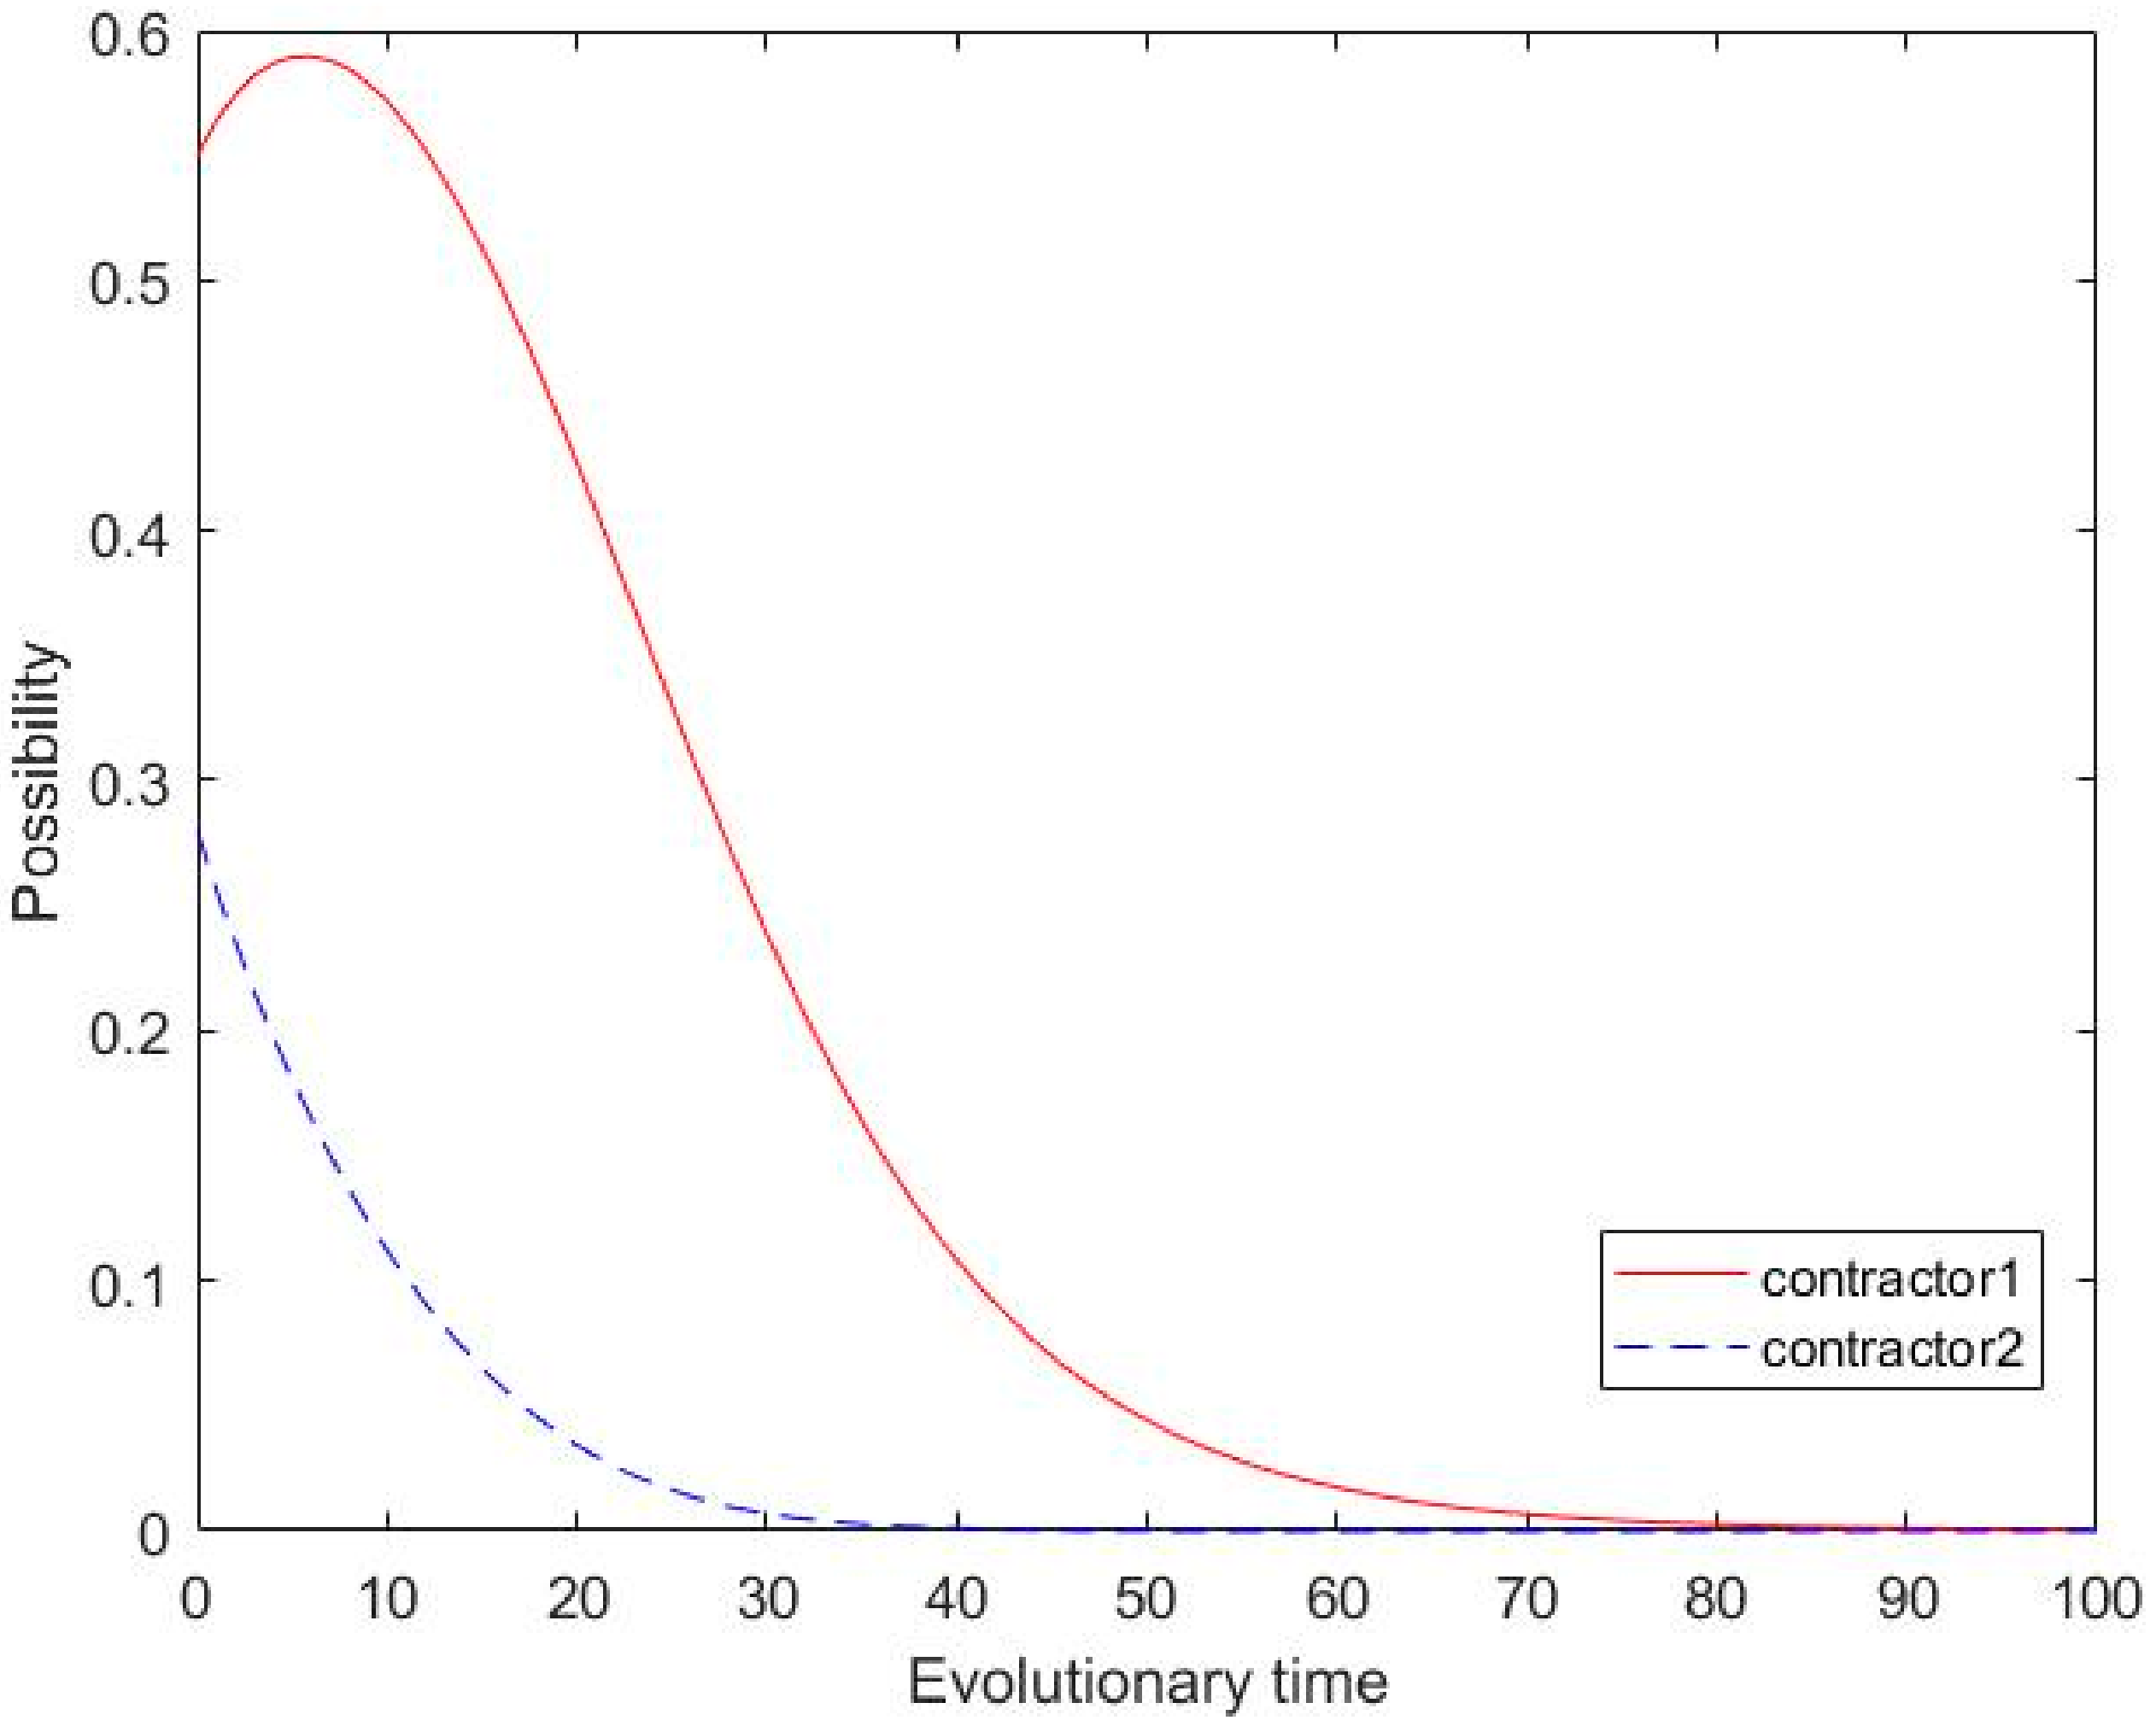
Figure 4 and
Figure 5 show the evolution of the initial probabilities X = 0.55 and Y = 0.28. In these figures, the red lines represent the tendency of the main contractor, whereas the blue lines represent the tendency of the subcontractor.
1. Results for the first category
In
Figure 1 and
Figure 3, the system evolves toward ESS (1, 1), indicating that
X = 0.68 and
Y = 0.34 fall in area N, where both parties will cooperate. In
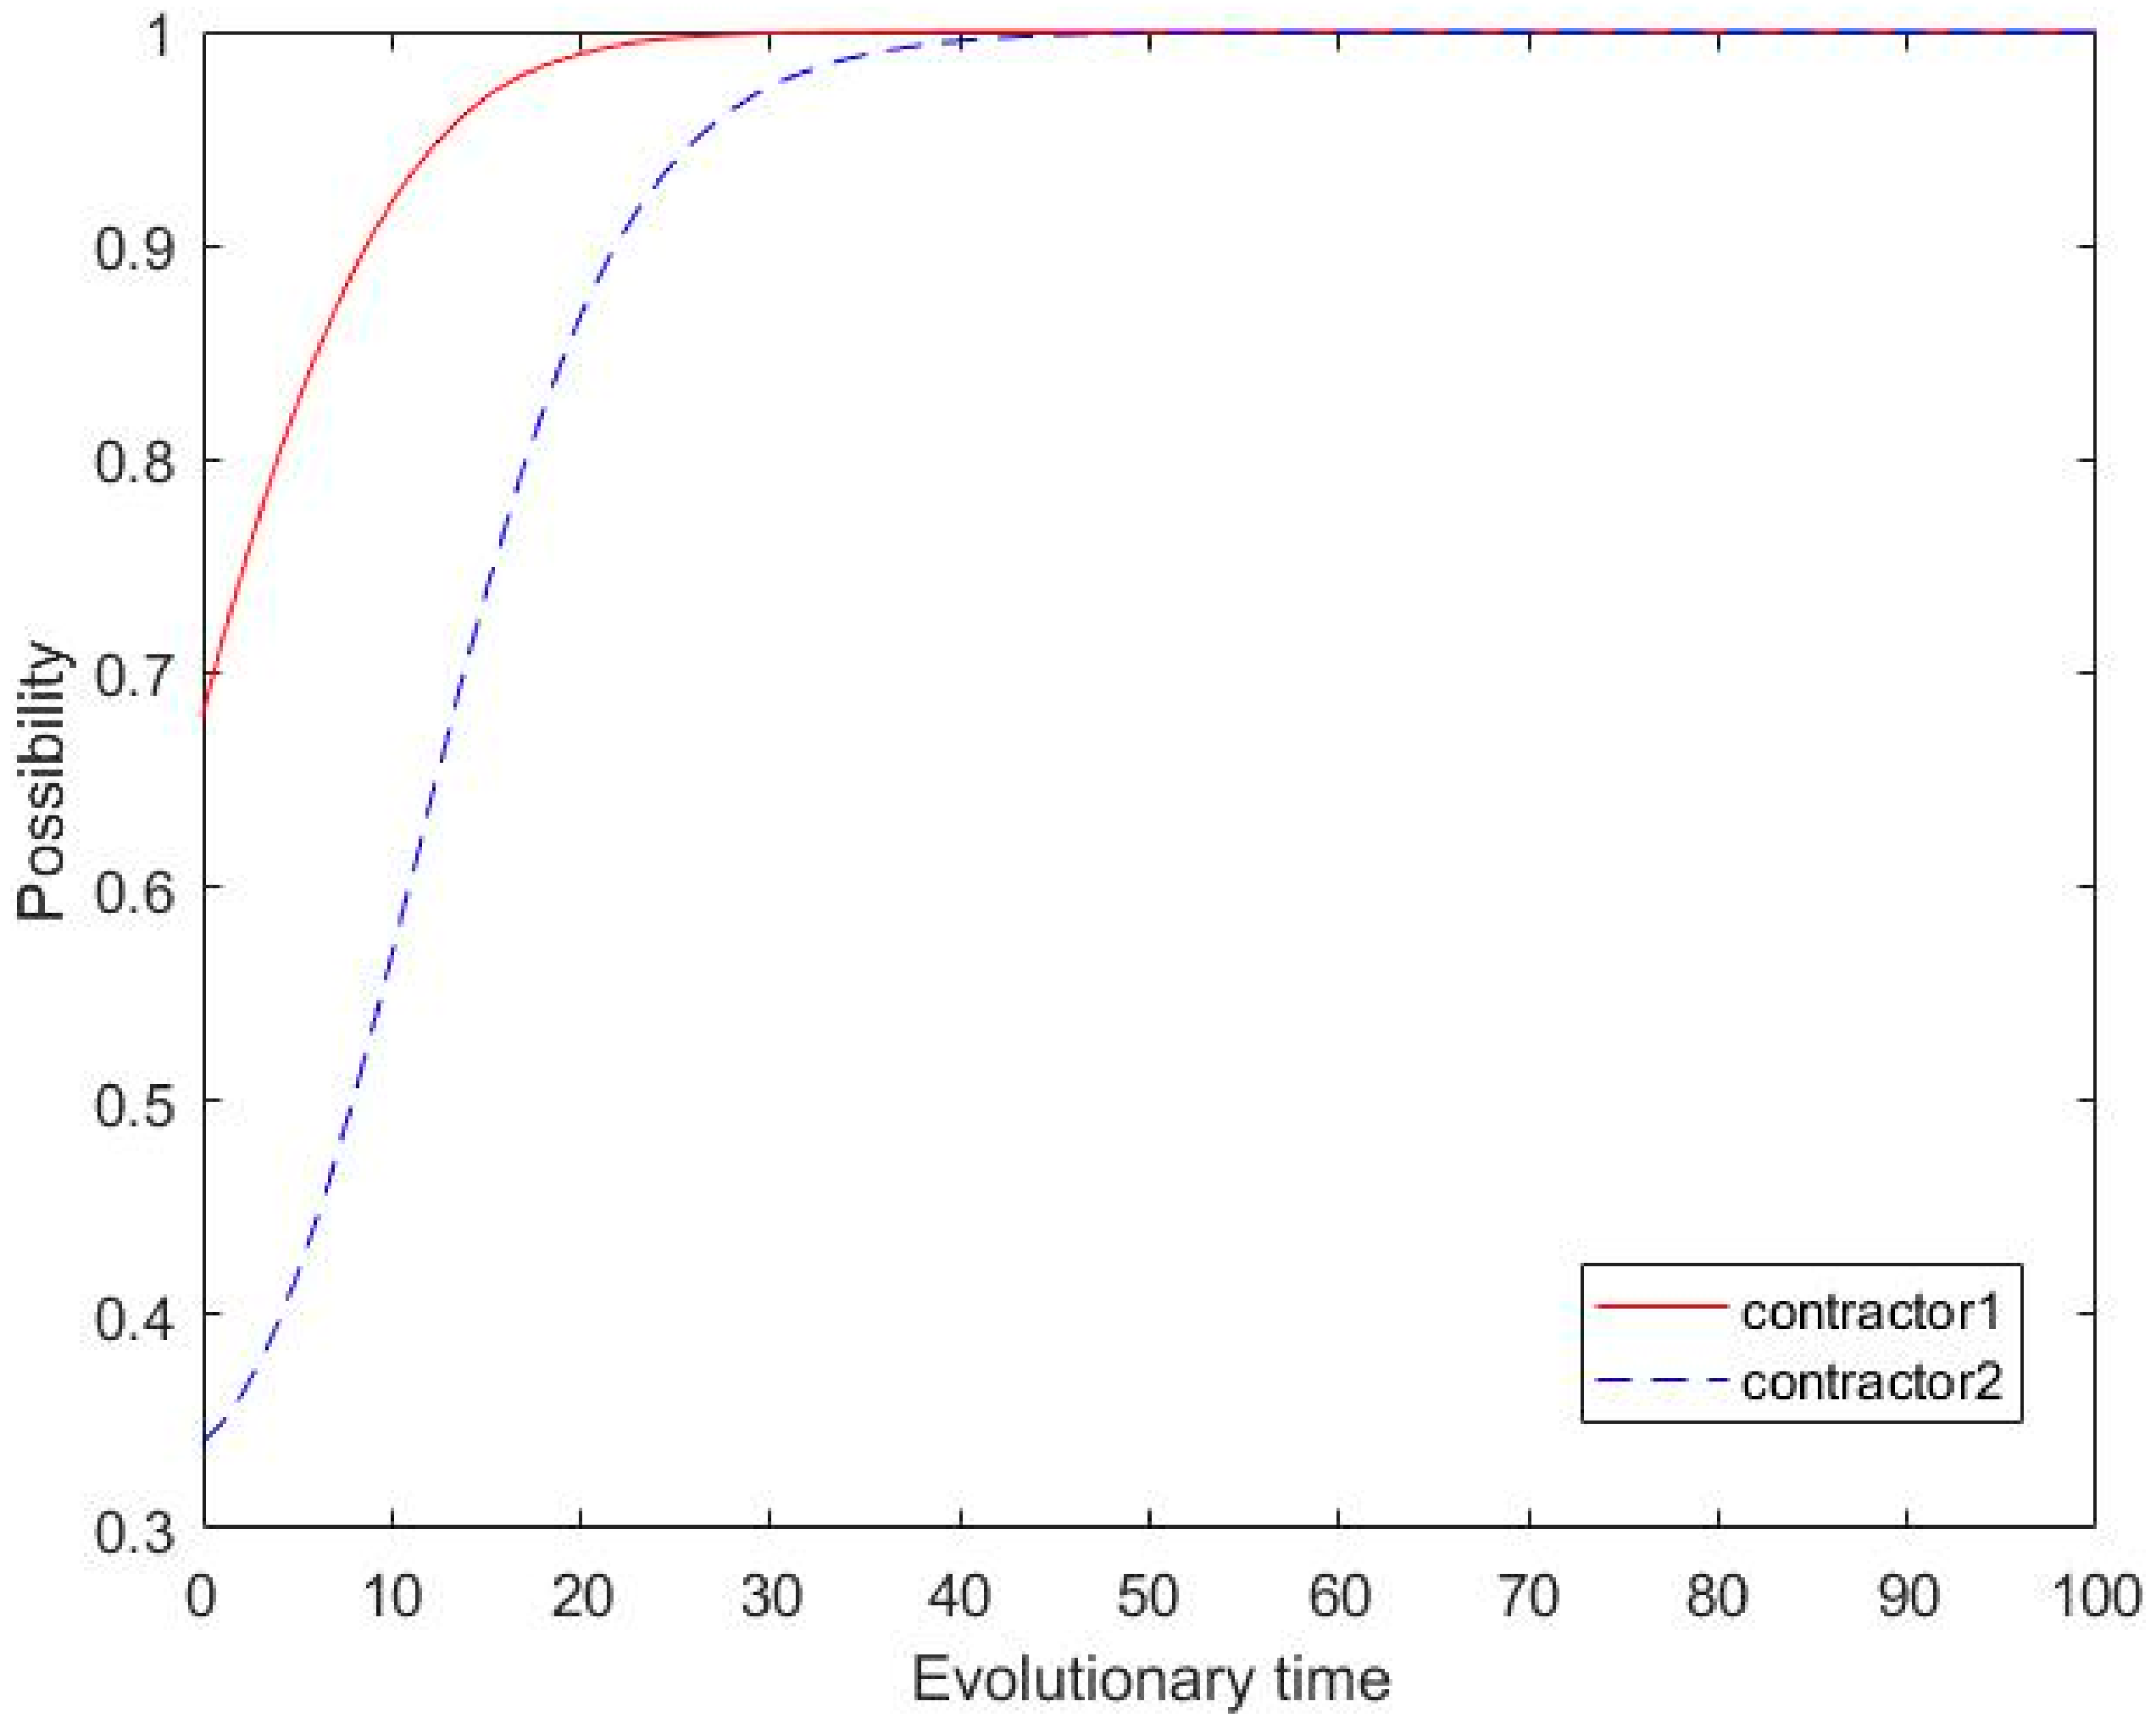
Figure 1, the probability of competition between the main contractor and subcontractor increases, with the rate of increase for the subcontractor being relatively high and that of the main contractor being on the lower side. Because of the difference in the initial probabilities, the probability of the main contractor increases to 1 around period 45 and the probability of the subcontractor increases to 1 around period 55. In
Figure 3, the initial probabilities of both parties are consistent with
Figure 1, but the competitive advantage of the main contractor 1 is more obvious. The red line does not go through the smooth part of
Figure 1, but approaches the value 1 in a straight line and eventually increases to 1 at about period 28. Under the influence of contractor 1, the probability of the subcontractor also increased rapidly, increasing to 1 at approximately period 45. Therefore, although the competitive advantage of the subcontractor is decreasing compared to the main contractor, due to the clear evolution direction of the main contractor, subcontractors are also encouraged to cooperate rather than choose opportunism.
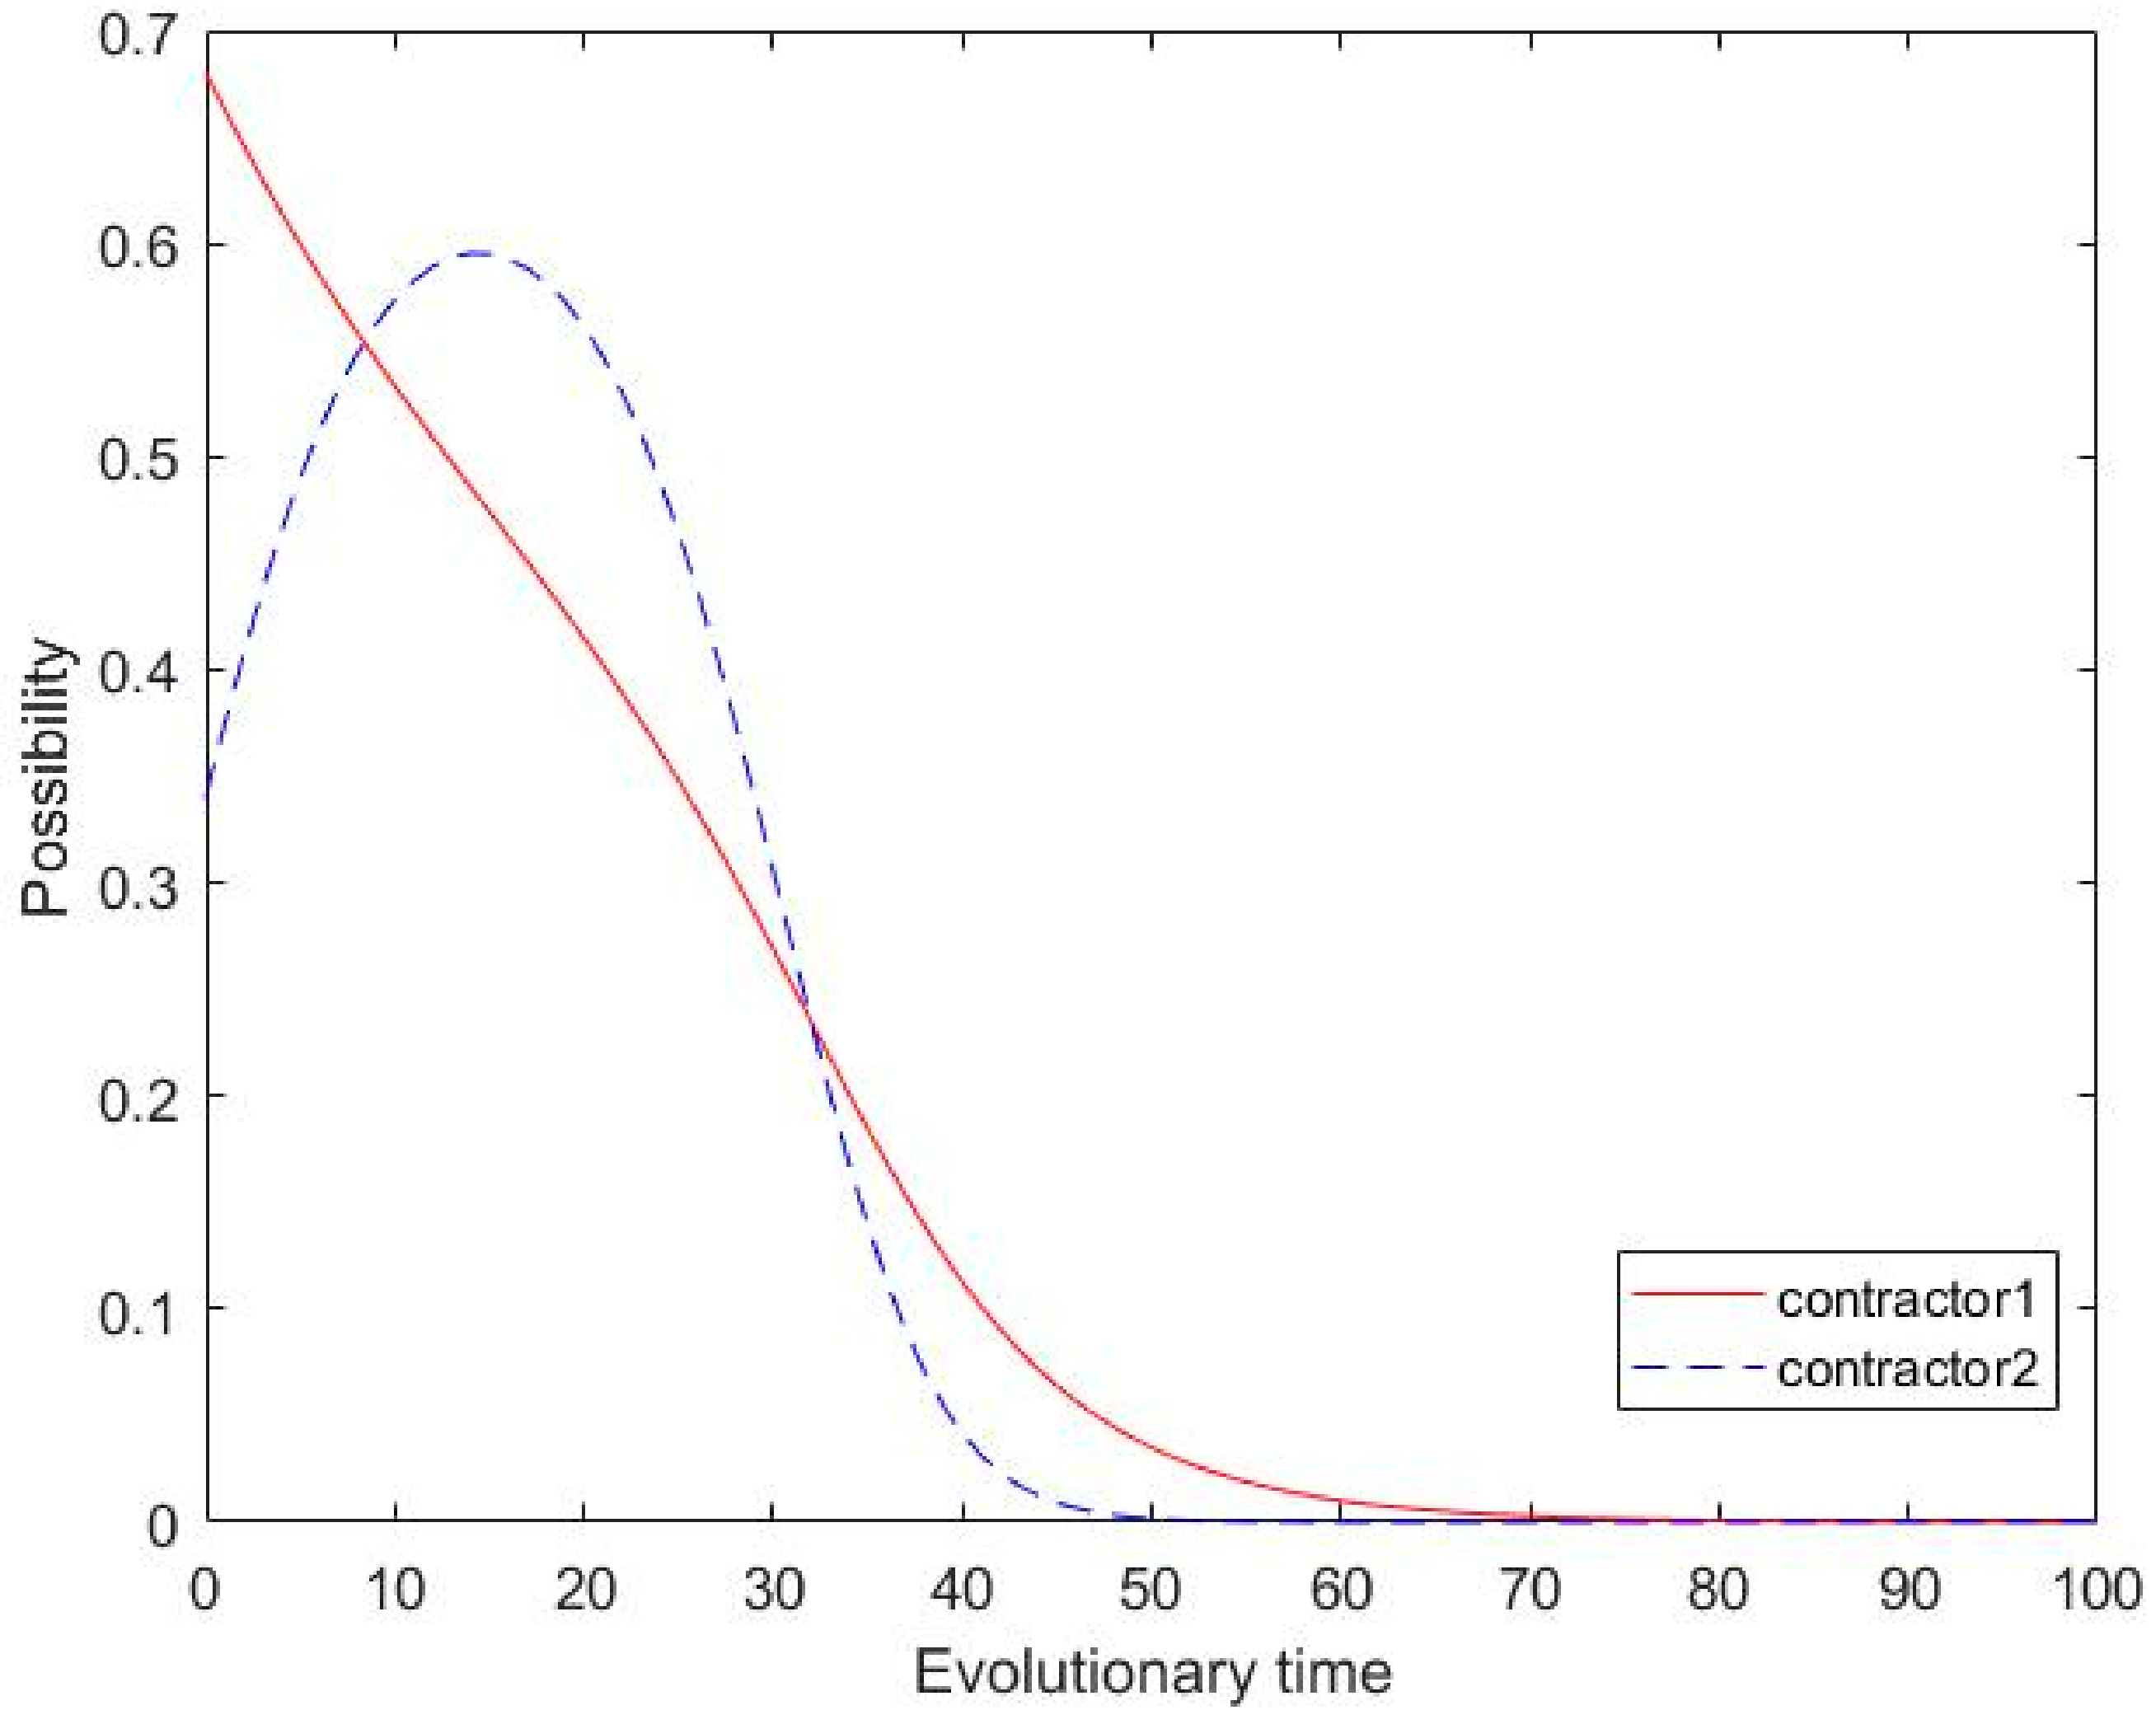
2. Results for the second category
In
Figure 2,
Figure 4 and
Figure 5, the system evolves toward ESS (0, 0); this indicates that
X = 0.68 and
Y = 0.34 under scenario 2 and
X = 0.55 and
Y = 0.28 under scenarios 4 and 5, both fall into area M. Compared with
Figure 1 and
Figure 3, under the parameter setting shown in
Figure 2, for the same initial probability, the subcontractor is more competitive; this is because of the change in parameters. At this point, the main contractor is linearly approaching 0; this represents the evolution toward opportunism. Although the subcontractor moved towards cooperation in the early stages, this does not reverse the direction of evolution of the main contractor. Moreover, near period 20, the direction of evolution of the subcontractor also changes to opportunism. Finally, the main contractor and subcontractor evolve to opportunism around period 50 and 70, respectively. In
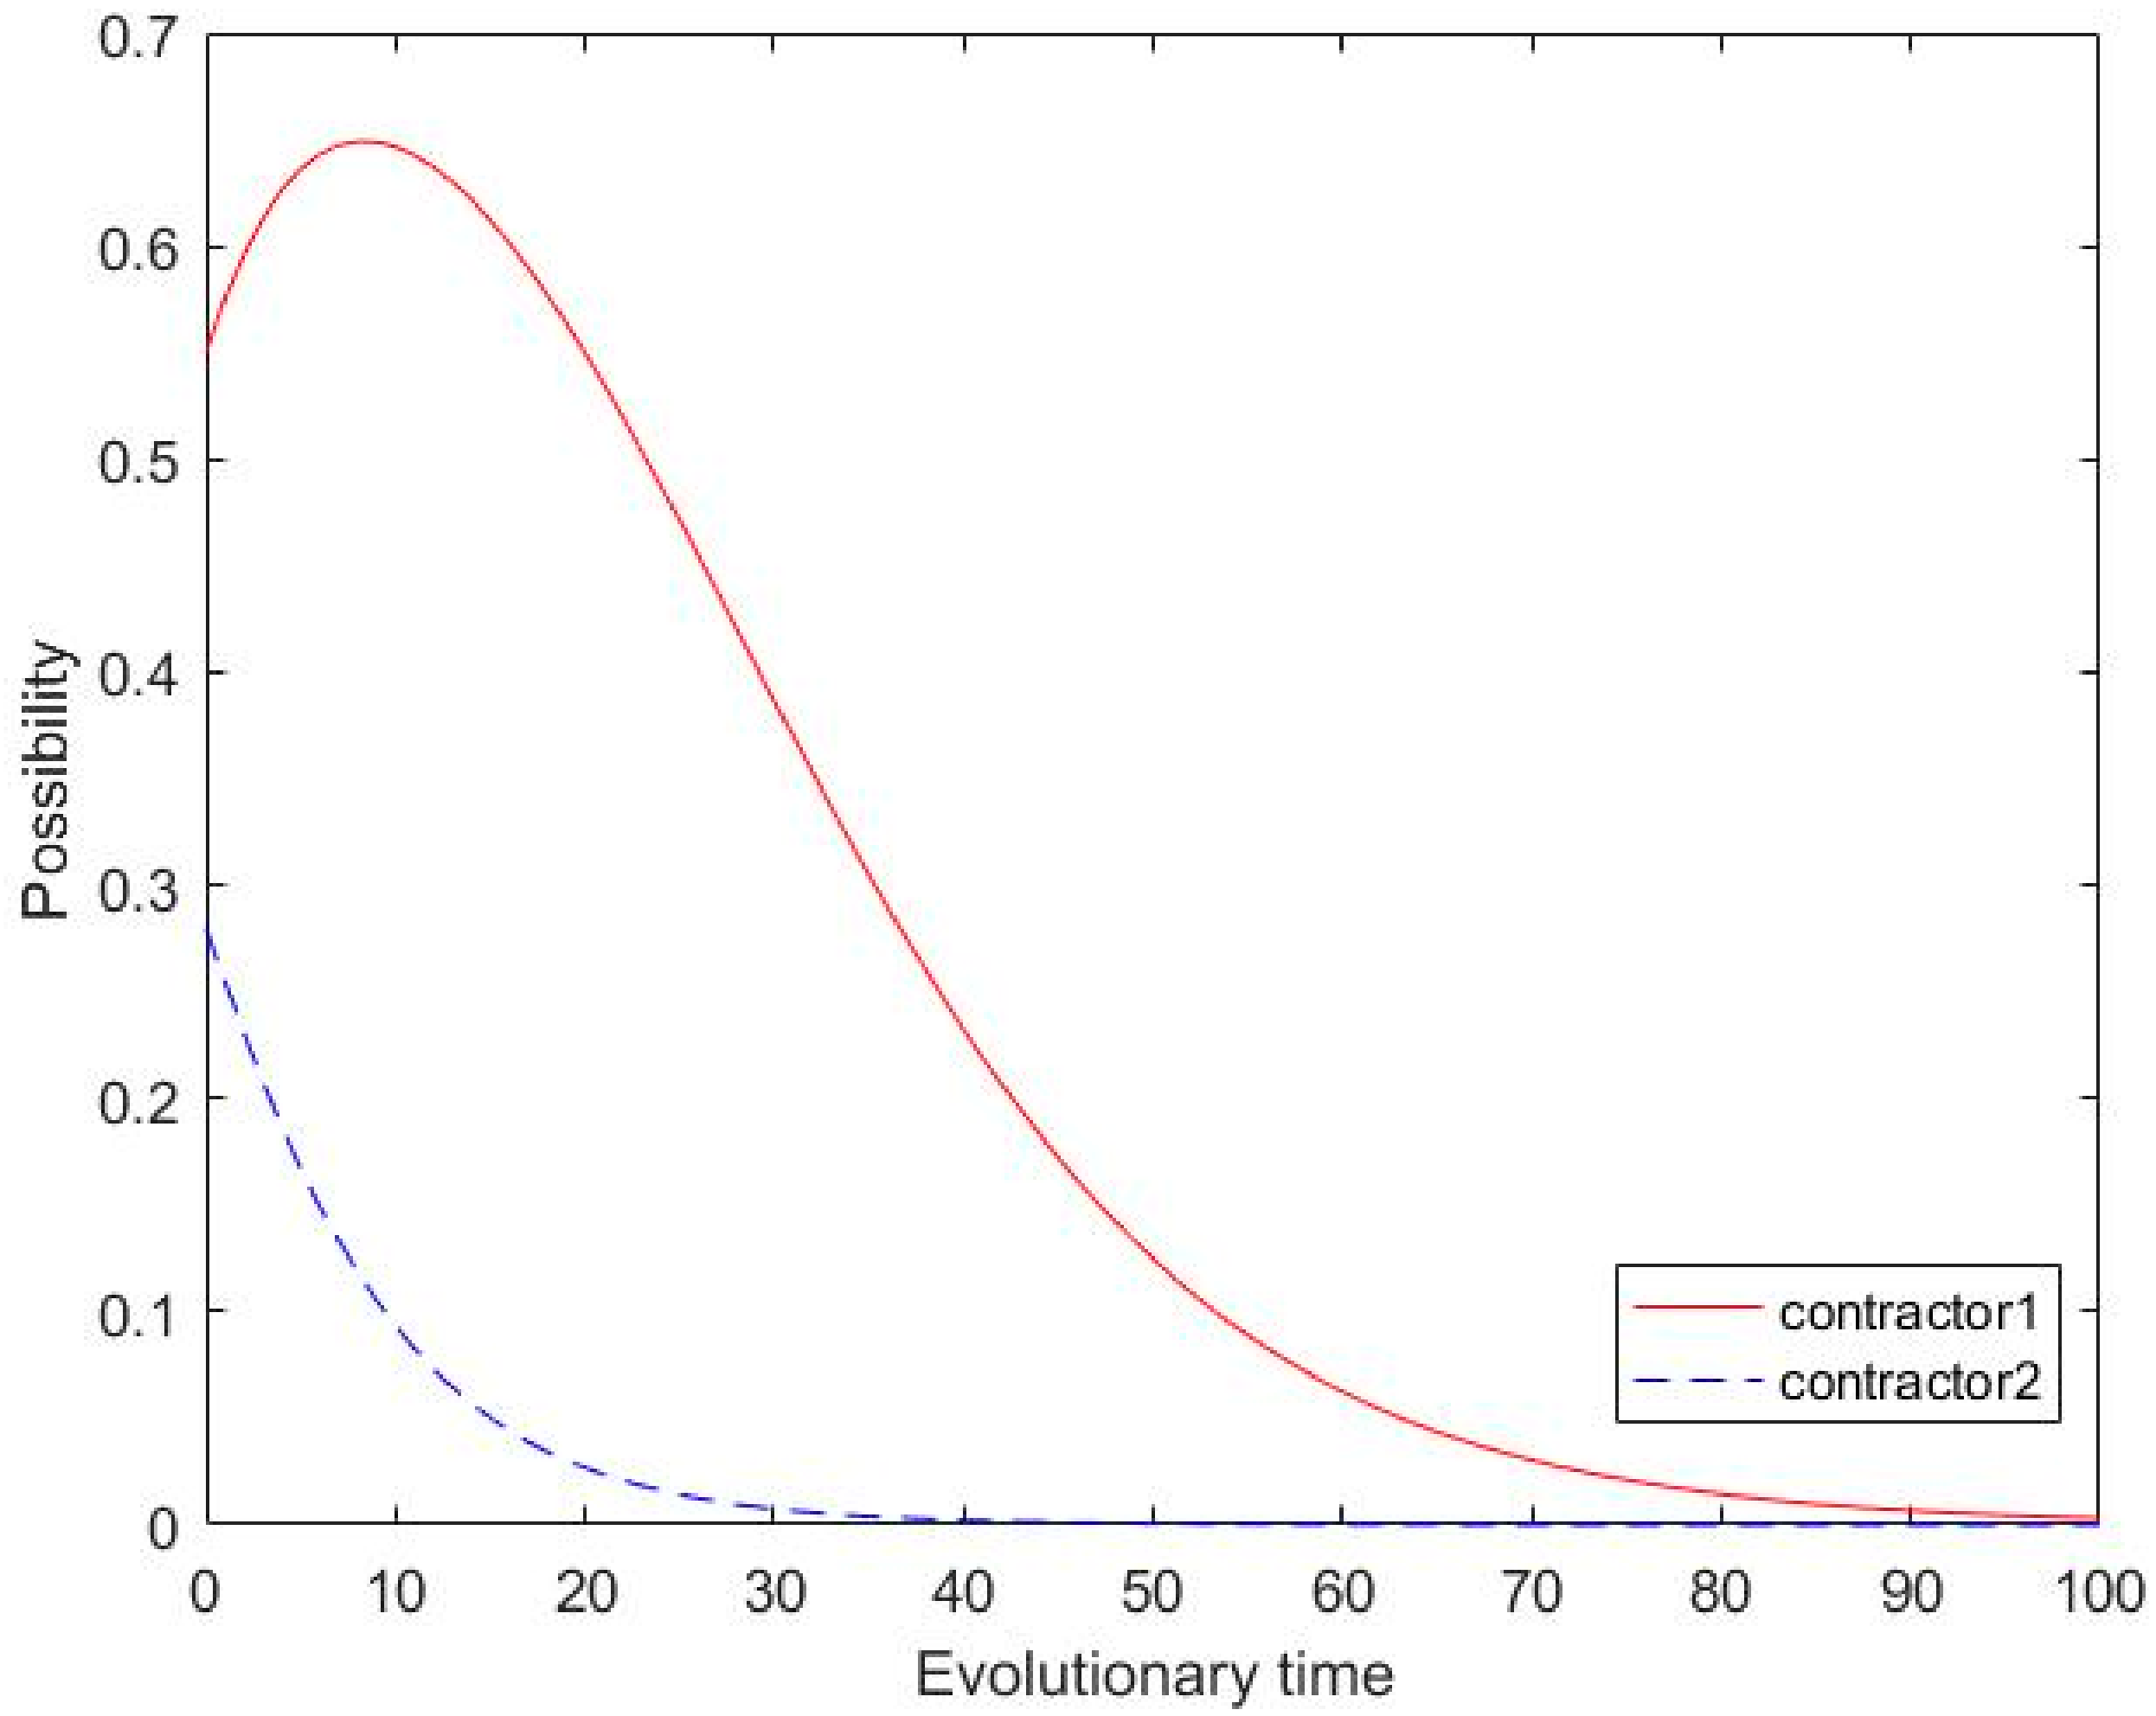
Figure 4 and
Figure 5, the ratio of cooperation between the two parties (
X = 0.55 and
Y = 0.28) is lower than that in the first three scenarios. In this case, the enthusiasm for promoting green behavior in the market is not too high, and the probability of opportunistic behavior among the two contractors is relatively high. The initial probabilities of both parties fall in region M and both evolve toward ESS (0, 0). The subcontractor’s weak position in the market leads to his or her switch to opportunism in both cases. In the case of the main contractor, we can observe that, in the initial stage of evolution, there is an effort to adopt a cooperative strategy; this is because he or she has benefited significantly from cooperation. However, because the subcontractor’s attitude is too firm and the main contractor’s efforts prove ineffective, the latter eventually chooses opportunism. Furthermore, the market position of the main contractor in
Figure 5 is stronger than that in
Figure 4. The unbalanced market position makes both parties move toward opportunism more quickly.
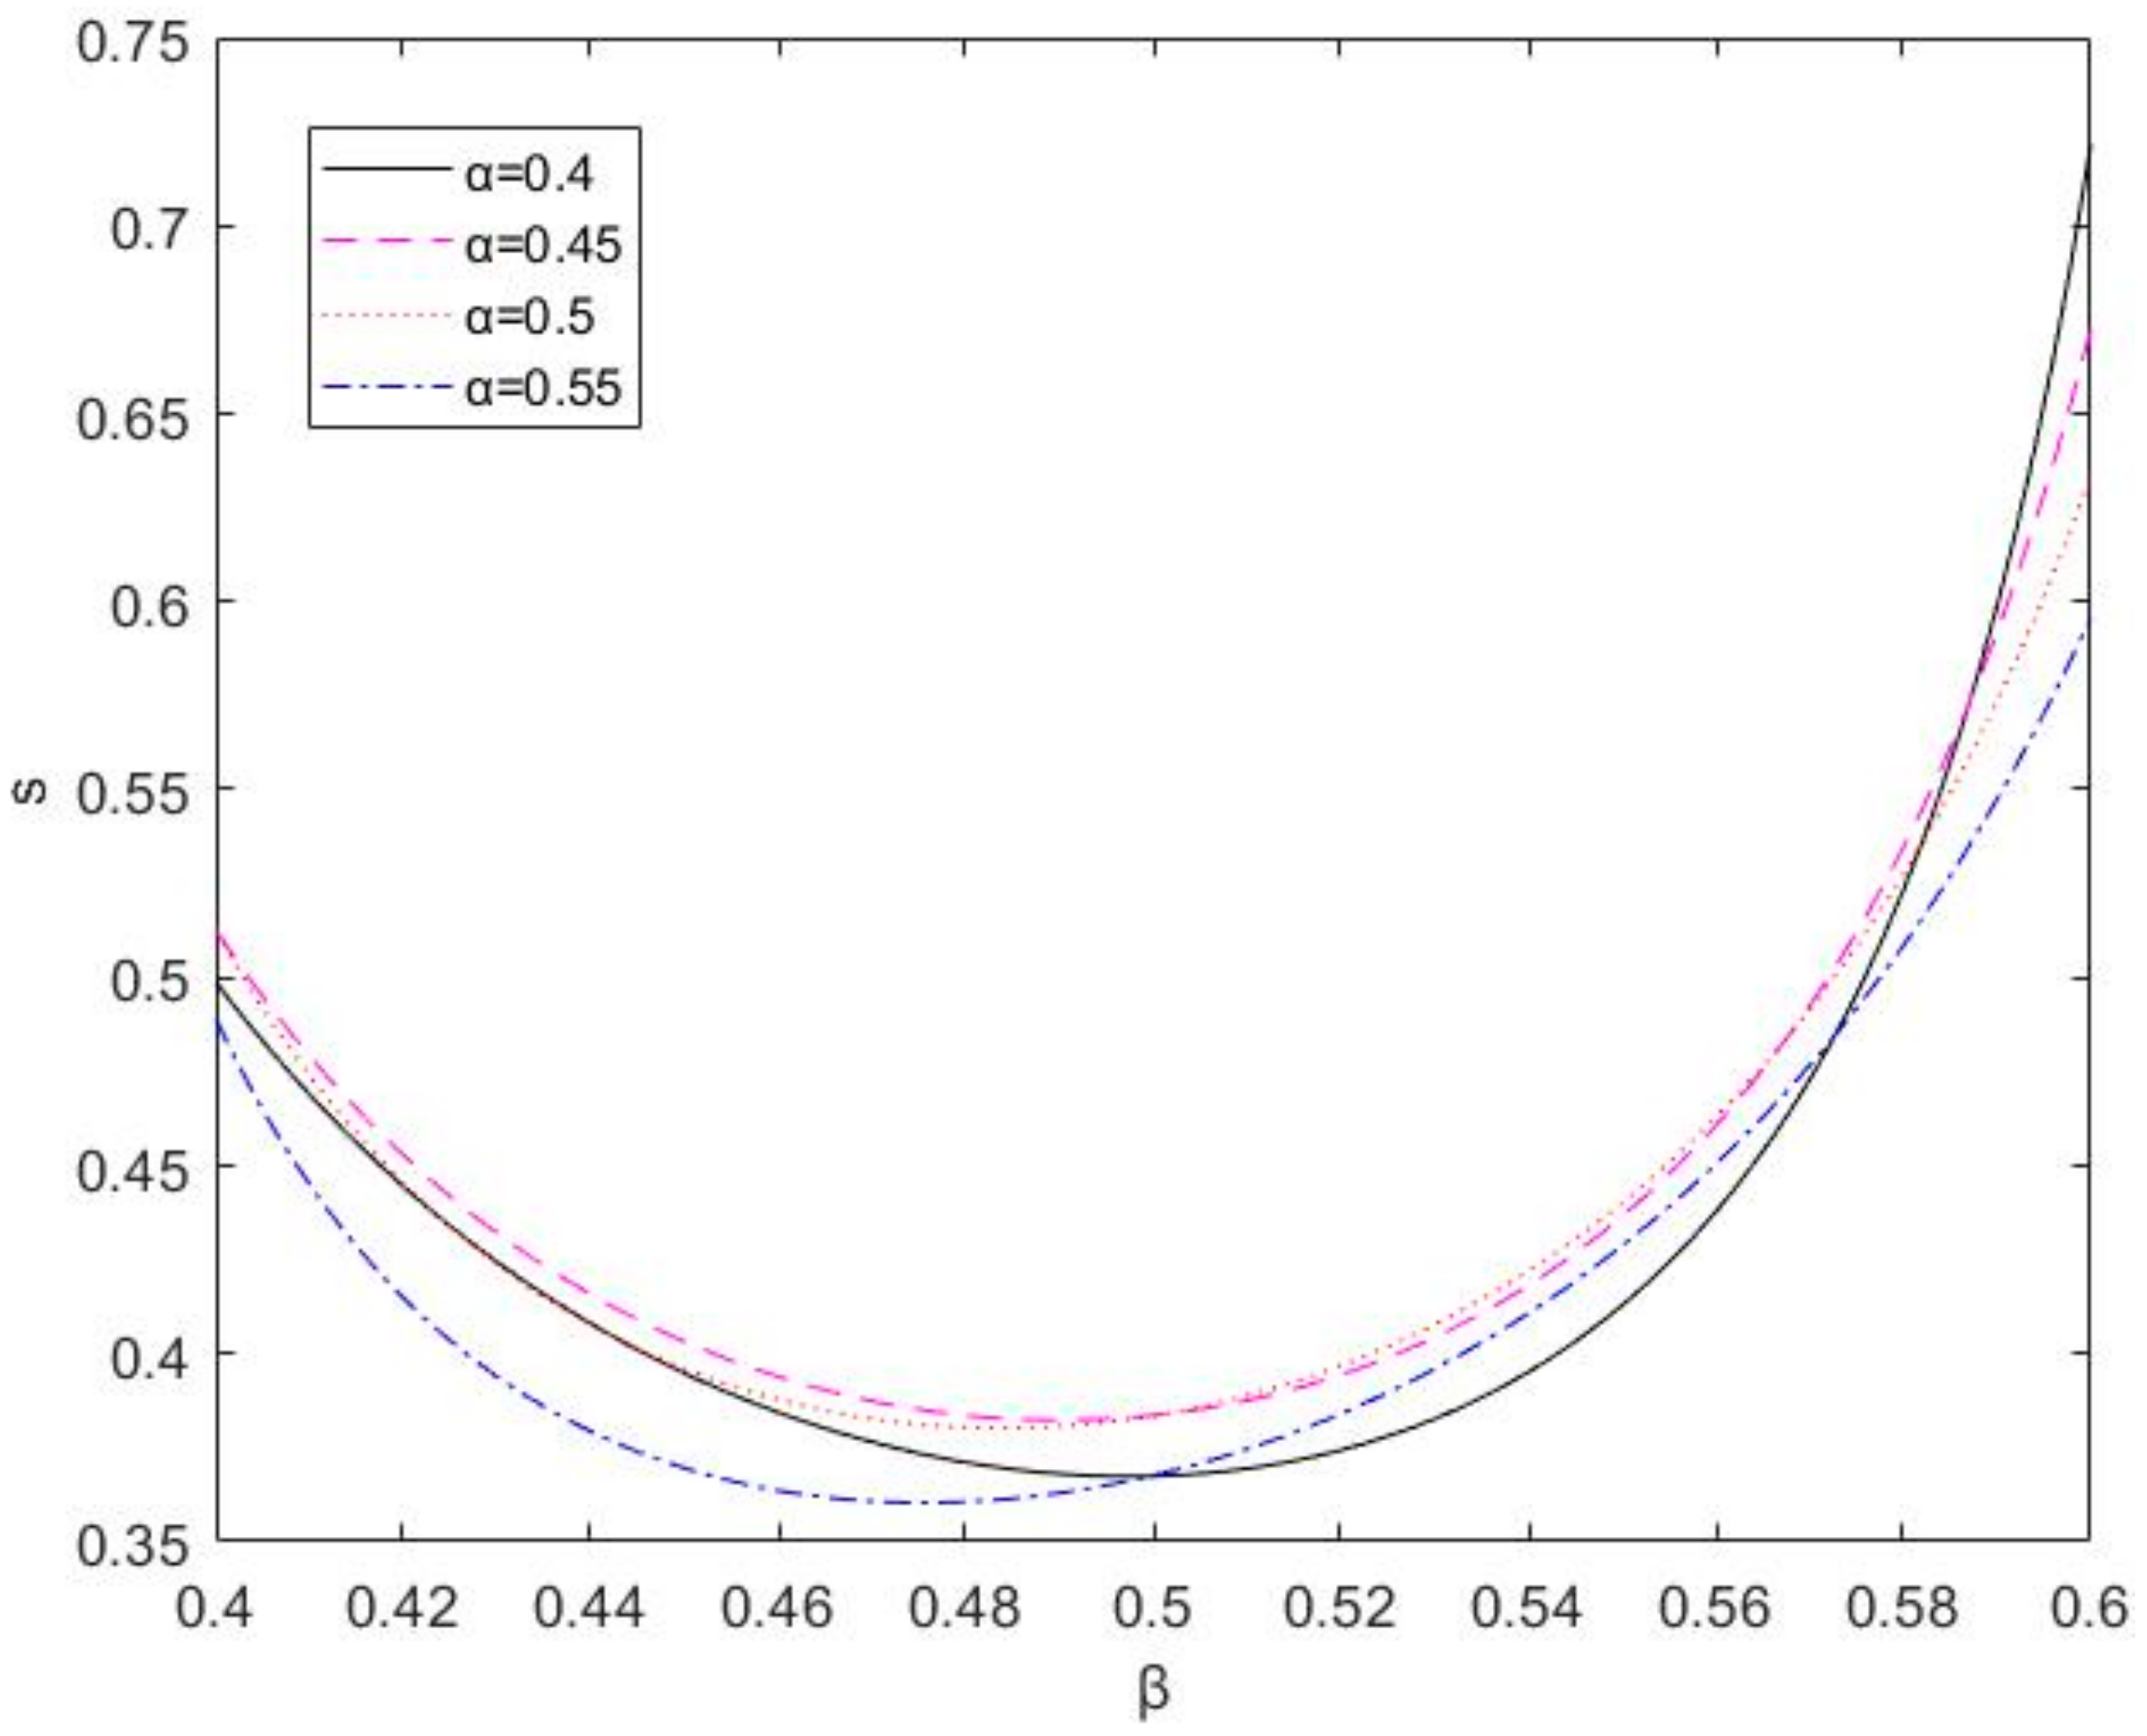
Next, under the setting of parameter 1, we set
,
,
, and
, sequentially. As shown in
Figure 6, the value of area s has undergone a U-type change with the change in
. Additionally, there is a point
that makes area s smallest; this result is consistent with the conclusion of Theorem 3.
When , the distribution coefficient of government subsidy increases, the probabilities of opportunistic behavior by both parties decrease. Therefore, the main contractor can improve its own distribution of the government subsidy; this is conducive to both parties moving toward cooperation, thereby reducing the occurrence of opportunism. When , the distribution coefficient of government subsidy β increases, the probability of opportunistic behavior by both parties gradually increases. Thus, the overly selfish behavior of the main contractor has worsened the subcontractor’s profitability, leading to opportunism.
6. Conclusions
This study focuses on green supply chain cooperation in mega projects. To analyze the cooperation trend between the main contractor and a subcontractor, an evolutionary game model is proposed to evaluate their cooperative relationship. This paper considers owner and government subsidies, pricing rules, cost, and other factors; further, it proposes the payment matrix and the replicator dynamic equations for both the parties involved. Moreover, the paper analyzes the stability of equilibrium points in specific situations and the determinants of the evolution of opportunistic behavior. Finally, numerical simulation verifies the theoretical results.
This paper focuses on the case when the direction of evolution of the main contractor and subcontractor are different, and studies the influence of the coefficients on the owner and government subsidies on the stability of the equilibrium points and the conditions that need to be satisfied. The results show that an increase in the costs of the main contractor and subcontractor is not conducive to cooperation between the two parties, whereas subsidies from the project owner and government can effectively curb the occurrence of opportunism. Further, there is an optimal distribution coefficient of the government subsidy that minimizes the probability of opportunism. The initial probabilities of the adoption of a strategy by the two parties play a decisive role on the direction of evolution. As an excessively strong market position by one party leaves the other unprofitable, the probability of opportunism increases significantly, preventing both parties from cooperating. However, a sufficient transfer of interests by a strong party can effectively curb the occurrence of opportunism. Therefore, this paper provides an idea for analyzing the direction of evolution of a contractor’s cooperative or opportunistic behavior over the long term. This helps the main contractor to design a reasonable subsidy mechanism and provide advice for decision making on the owner and government subsidy settings. The research results also suggest that if the party with the competitive advantage adopts an excessively aggressive competition strategy, the other party will stop participating in the market competition and place its hope on the allocation of subsidies; this will lead both parties to move toward opportunism.
Our research is helpful for the main contractor and subcontractor to analyze their evolutionary trends for long-term cooperation. Of course, this paper also has some limitations, such as considering cost sharing under cooperation, knowledge spillover effects, and fairness preference psychology; these can be addressed by future studies. Considering these factors can bring the proposed model closer to reality and help contractors make more accurate decisions.


