1. Introduction
From economic, ecological, and social points of view, all trans-boundary rivers are extremely significant. Since Lithuania has joined the European Union in 2004, all water quality standards used EN (European Norms) and ISO (International Standards) to detect some of the pollutants in different water bodies. A few of them covered measurements on international scales during different periods adopting various laboratory techniques, solutions, and methods. The previous measurements also used local (only Belarus) and EN (European Union Member States) methods for analysing pollutants detected on the different trans-boundary scales of the rivers. Still, the measurements of EN and ISO at the trans-boundary level have not covered the river in Belarus. Quite a few attempts have been made to assess the impact of pollution on the trans-boundary river in some parts. However, such measurements are very limited in the trans-boundary region across the Viliya (Neris). In this context, the present research is aimed at finding the qualitative and quantitative analysis of pollutants and at assessing measurements made applying different laboratory methods in the area of trans-boundary River Viliya (Neris) in Belarus and Lithuania for the period from 2012 to 2017.
The main goals of this research include exploring qualitative variations in water within the trans-boundary region and correlation driving these changes considering the combined effects of pollutant variability and precipitation flows on water quality dynamics in the rainy seasons for the period from 2012 to 2017. Changes in pollution within the rainy season (January, April, July, and October) were evaluated according to the data from winter, spring, summer, and autumn seasons to broaden a deeper understanding of water quality dynamics.
Thus, the specific objectives of this research were to:
(1) Quantify the correlation between pollutants during both the rainy season and the rest of the year on the trans-boundary region scale using measurement data encompassing the period from 2012 to 2017;
(2) investigate the relationship between qualitative changes, concentration, and water flow pollutants; and
(3) apply the natural filtration method for differentiating water flow and pollutant removal taking into consideration improvement in water quality within the trans-boundary river. The River Neris (named Viliya in Belarus) covers an area of 276 km throughout the country with the other 234 km belonging to Lithuania [
1]. The catchment area within Belarus occupies 10,920 km
2. Vileyka is a town in Belarus and is located on the River Viliya, operating the largest artificial water reservoir with a total area of 63.3 km
2 and a volume of 238 mln m
3. In recent years, the volume of storm-water collected in the town of Vileyka has increased to 130,000 m
3, whereas at the maximum (storm-water accumulated and estimated by month), it has made 135,000 m
3. This is evident from the data provided annually and monthly by the town-responsible institution, according to which, 73% of storm-water are affected by the individual pollution level that is higher than European Requirements for storm-water pollution. From a geopolitical point of view, Vileyka County is an important transition region, and thus European support can be used for storm-water collection and accumulation as well as for developing treatment facilities. Some methods for decreasing runoff are suggested in the article by John R. Freeborn, David J. Sample, and Laurie J. Fox [
2]. The authors of this paper pointed out conventional practices used in decreasing storm-water runoff and controlling maximum runoff by employing storage facilities, such as detention and retention ponds, the estimated volumes of which depend on the reliable and statistically evaluated data on collected storm-water [
3]. Investigated storm-water detention practices are commonly used for accumulating and treating storm-water runoff prior to discharging it from the collection site. Artificial storm-water wetlands have become useful storm water control measures in rural-related environments, thus offering a hybrid between larger detention practices (wet ponds) and newer green infrastructure technologies [
4]. Regional water accumulation, according to the co-authors from Virginia, USA, changes management focus from a large, regional scale to the site one [
2]; however, a critical approach from both Lithuanian and Belarusian experts to large-scale storm-water management facilities is still under consideration. The researchers from Auburn University [
3] decided that ‘sediment basins were storm-water detention practices commonly used for capturing and treating sediment-laden runoff prior to discharging’. The last statement cannot be implemented because a large territory needs to be occupied using sediment basins from storm-water detention, and local municipalities both from Belarus and Lithuania disagree with such an engineering decision. Following the authors from North Carolina State University, the constructed storm-water wetlands have become popular storm-water control measures [
4] when only few constructed wetlands were operated in Lithuania and some started operating in Belarus. Lithuanian scientists published the results of some research about water quality of different water bodies in Lithuania according to storm-water management facilities [
1,
5,
6,
7] analysing in-country rivers. A positive impact of ponds on water quality in a small stream was investigated by the scientists from the Czech Republic [
8], which is opposite to the findings provided by the United States geological survey of the high capture rate of river-borne sediments from two reservoirs [
9]. Some other authors referred to the shrinking reservoir and increased river discharge related to higher sediment loads from seasonal rainfall that released the copious volumes of sediments to the river [
10]. Along the course of the river, seasonally varying concentrations of the total suspended matter, particulate organic carbon, dissolved oxygen, and inorganic nitrogen (nitrate, nitrite, ammonium) were investigated by the co-authors from Germany and Indonesia [
11], concluding that the observed carbon and ammonium input and resultant oxygen depletion would probably become a quasi-permanent feature, having long-term deleterious effects on water quality. The findings presented in the last article [
11] inspired the evaluation of similar pollutants in the trans-boundary river on both Lithuanian and Belarusian riversides. An advanced point of view in the journal, showed that ‘decisions regarding these dams would require balancing risks, a continued economic function and the potential for ecologic restoration’ [
12], with some forecast about reservoir removal in the USA. Environmental data (hydrologic and climatic) on variables displayed considerable inter-annual variations in the research results provided by Australian scientists [
13], and lead the evaluation of statistical data to the interdisciplinary approach. Investigation into the influence of sediment properties on the evolution of reservoir deposits provides some useful information about accumulation facilities [
3]. A stepwise-cluster inference model is able to tackle the nonlinear relationships among different contaminant removal process in multi-soil-layering systems [
14]. Water quality indexes that had a relationship with contaminants’ removal were used as state variables in the developed stepwise-cluster inference model. Estimated phosphorus flows into the hydrosphere should be considered when considering suitable water sources in the future [
15]. Following this statements, all phosphorus related indicators were evaluated statistically and attentively in this investigation.
The evaluation of statistical data provided in this article allowed environmental engineers to select the best strategy used in storm-water treatment facilities following the findings of the maximum and minimum runoff quantities obtained annually and monthly for the period of five years from 2012 to 2017.
2. Materials and Methods
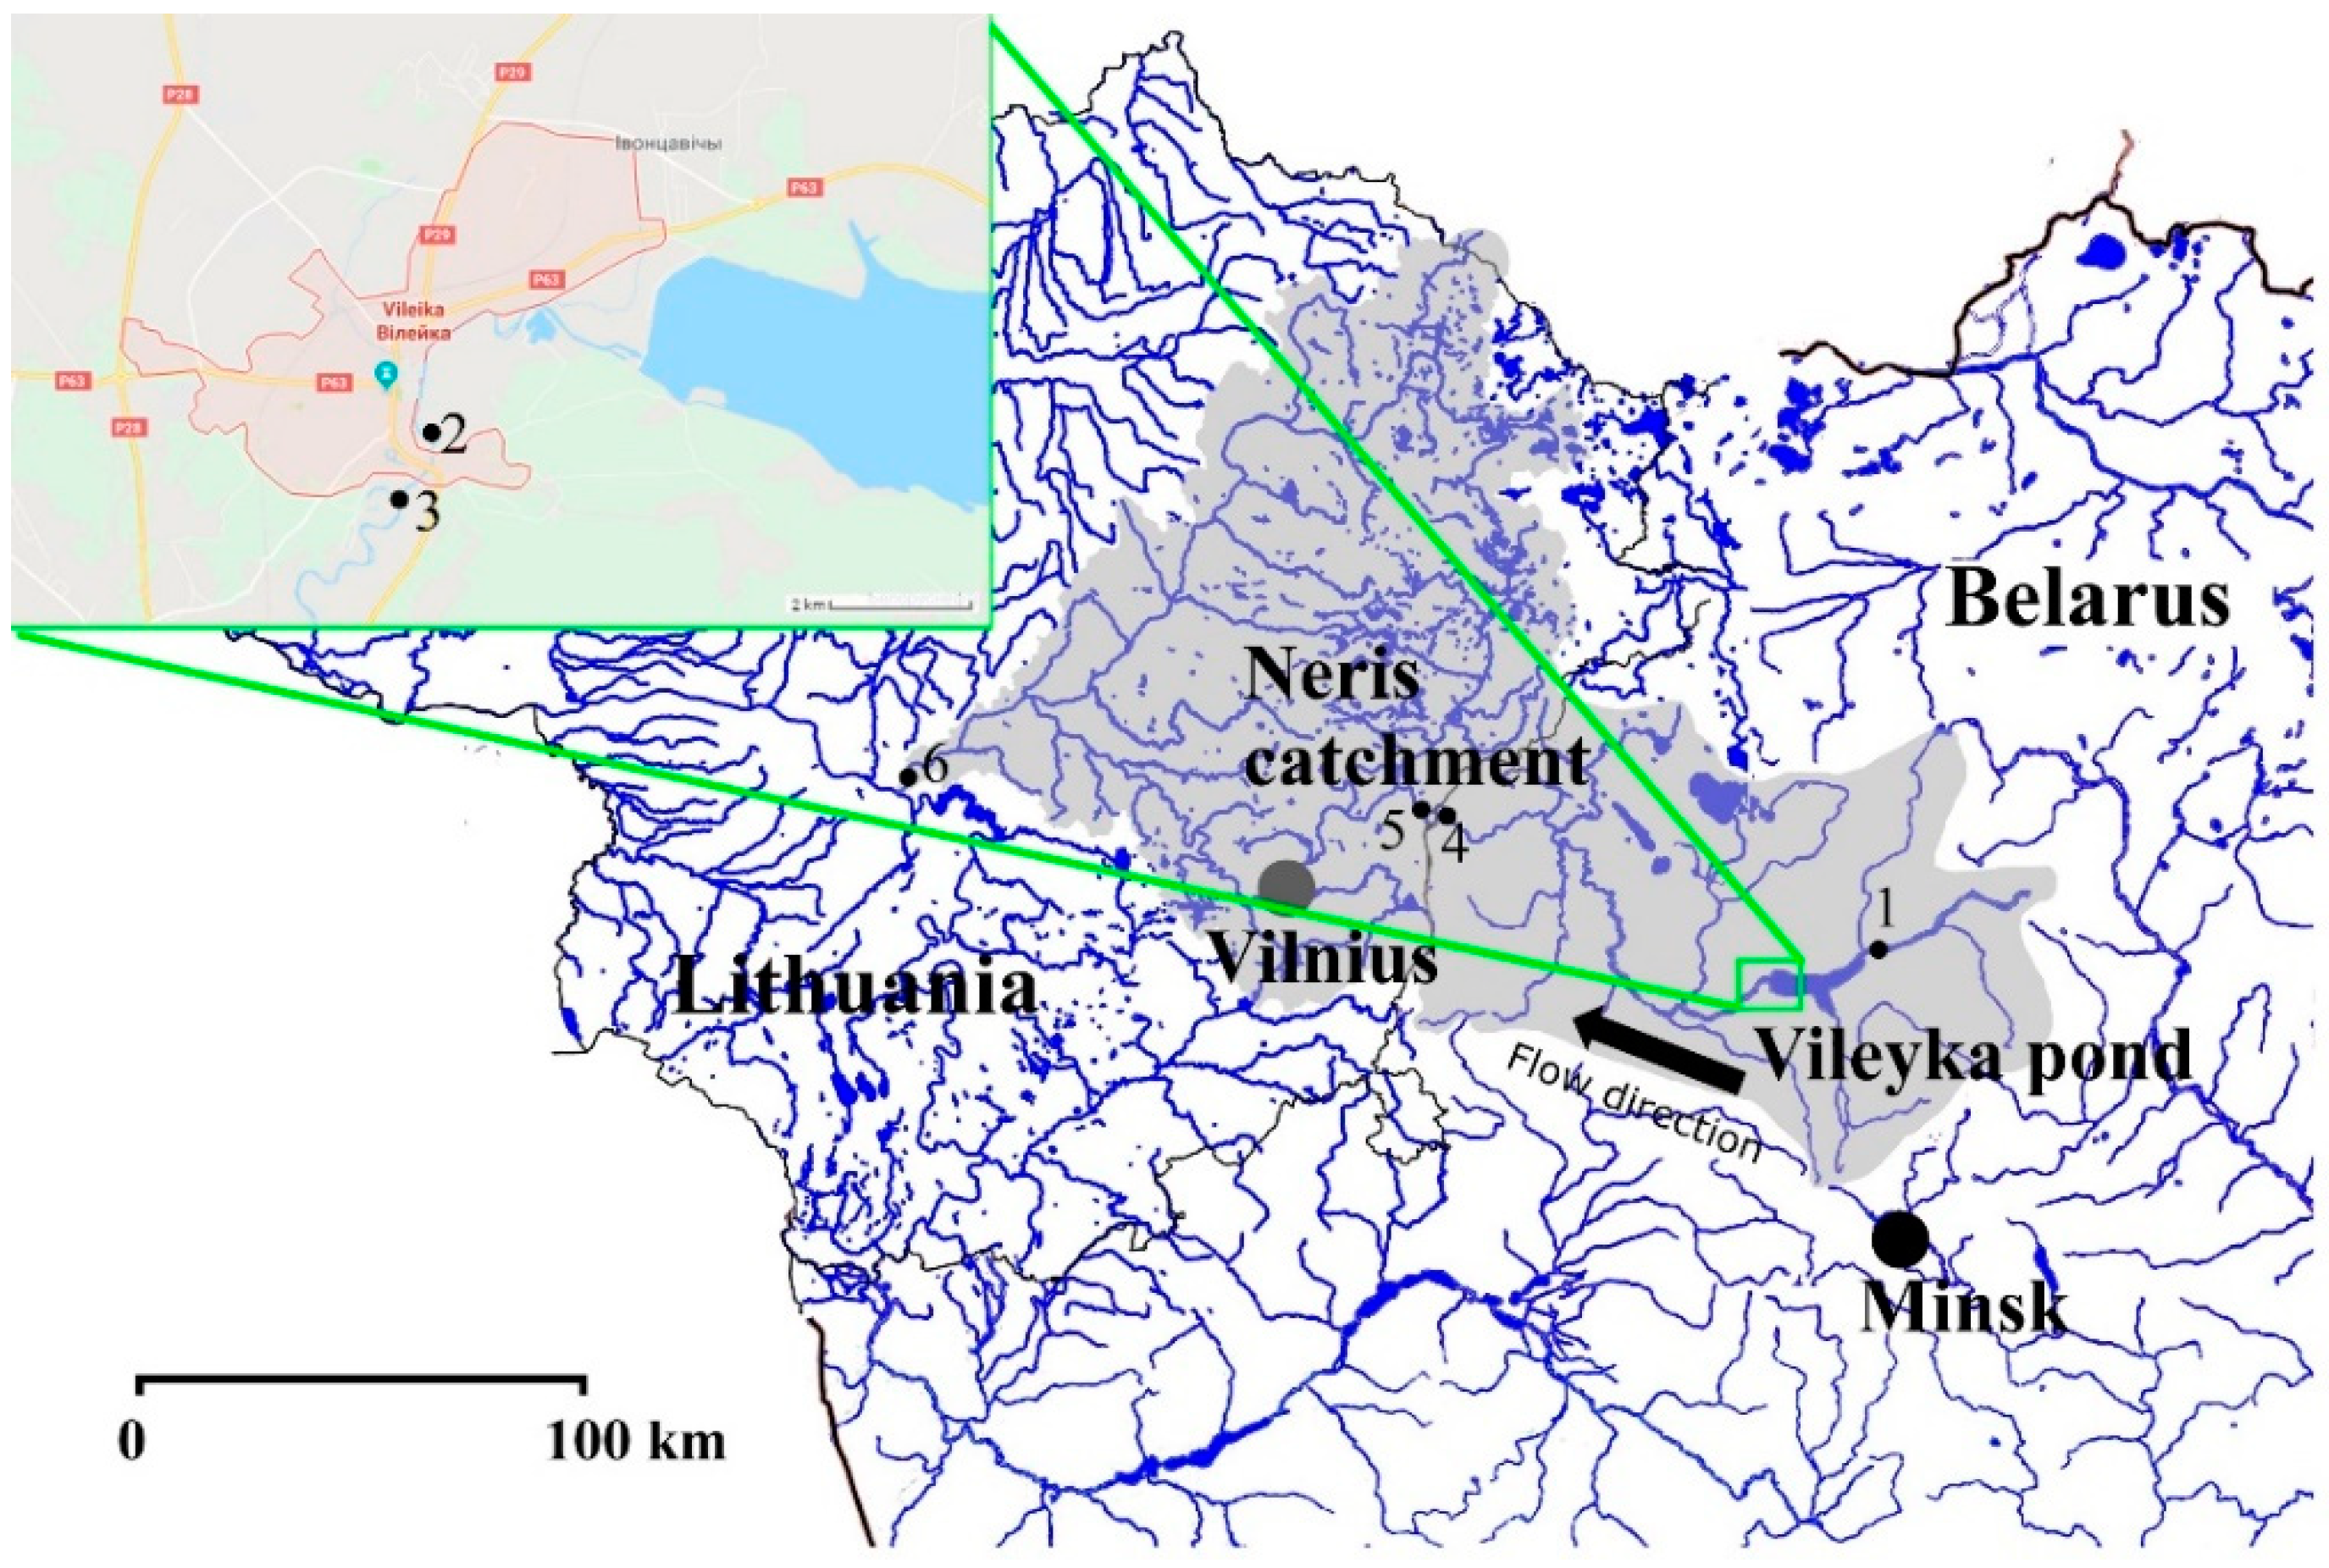
The total watershed of the drains of the Neris river is 25,100 km
2 (
Figure 1). An excavating segment of the river is preserved in the biggest artificial water reservoir between the hydropower station in Vileyka town and the auto-railway bridge.
The investigated segment of the river is around 5 km in length and lies within the central part of the town. The discharge average rate approximately makes 116 m
3/s. The middle part of this area was the subject of a detailed research project initiated by the authors. Until recent days, the river has not been excavated for another distance downstream; hence, this area has not been taken under consideration. The section of the river situated within the investigated part is referred to as the storm-water intake system [
5]. Storm water outlets have been developed within a coastal area where original river sediments are mostly gravel and coarse sands.
Water quantity and distribution aspects of storm-water outlets and their environmental impacts have been the subject of many studies. Storm-water quantity was studied by the ‘Laboratory Wilejskij Wodokanal’ of Vileyka, and the intake was measured by a responsible institution (water-related laboratory). Measurement work was carried out in January, April, July, and October within the period from 2012 to 2017.
Water was regularly monthly sampled from four sites in this area: Incoming flows to storm-water collectors, outgoing flows from storm-water outlets, the River Viliya before the release of storm-water through outlets, and the River Viliya after the release of storm-water through outlets. A sampling profile is located below the Vileyka reservoir, and incoming flows to storm-water collectors and outgoing flows from storm-water outlets are situated below the reservoir. The River Viliya before the release of storm-water through outlets and the River Viliya after the release of storm-water through outlets were sampled in Vilejka town and in the end municipality, Vileyka. At each sampling place, pH and temperature in the field were determined using a portable pH-meter instrument. Each sample was repeatedly taken four times, put directly into a polyethylene container, and rinsed five times with a sample of water.
The samples were refrigerated at a temperature of 4 °C and processed within 24 h. Several monthly measured indicators are as follows:
Nitrate nitrogen, NO3-N (N. Nitrogen); the spectrometric method was applied using sulfosalicylic acid (LST ISO 7890-3:1998). The spectrometric measurement of a yellow compound formed by nitrate ions reacting with sulphosalicylic acid (the latter was formed by adding sodium salicylate and sulfuric acid) in the alkaline medium. Disodium (ethylenedenitrilo) tetraacetate dihydrate (EDTANa2) is added to alkali to prevent the deposition of calcium and magnesium salts. Sodium azide is added to remove the interference of nitrite ions;
nitrite nitrogen, NO2-N (Nitrite); the molecular absorption spectrometric method was applied. When nitrites in the analyte react with the 4-aminobenzene sulfonamide reagent and with orthophosphoric acid, the pH of the solution reaches 1.9 and produces diazonium salt, which, along with N-(1-naphthyl)-1,2-diaminomethane dihydrochloride (enters the 4-aminobenzene sulfonamide reagent), forms a colorant, thus making a solution pink. Absorption is measured at 540 nm;
ammonium nitrogen, NH4-N (A. Nitrogen) and total nitrogen Nb (T. Nitrogen); the manual spectrometry method (LST ISO 7150-1:1998) was applied. The colorimetric measurement of the blue colour at a wavelength of 655 nm was made. The compound is formed by reacting ammonium with salicylate and hypochlorite ions and acting as a catalyst for sodium nitroprusside. Hypochlorite ions are formed by the alkaline hydrolysis of N,N-dichloro-1,3,5-triazine 2, 4, 6 (1H, 3H, 5H) trionic Na salt (sodium dichloroisocyanurate). The chloramine reaction with Na salicylate takes place at a pH of 12.6 and acts as a catalyst for sodium nitroprusside. This determines the total amount of chloramine present in the sample. Sodium citrate, which is a part of the reagent, eliminates the negative effects of cations, especially those of calcium and magnesium;
phosphorus, PO4-P (Phosphorus), total phosphorus; the spectrometric method using ammonium molybdate (LST EN 1189:2000) was applied. Orthophosphate ions react with molybdate and antimony ions to form a complex of antimony phosphomolybdate in the acidic medium. Reducing this complex with ascorbic acid produces an intense blue-blue molybdenum complex. The concentration of orthophosphate is calculated by measuring the absorption of the complex. Polyphosphates and some organic phosphorus compounds are determined by hydrolysis with sulfuric acid, which results in orthophosphates reacting with molybdate. A large proportion of organic phosphorus compounds are converted into orthophosphates by the re-mineralization of persulfate. If stronger treatment is required, then, sulfur and nitric acid are used for mineralization;
biochemical oxygen demand in 7 days (BOD). The treated water sample is diluted with different amounts of water saturated with dissolved oxygen, aerobic microorganisms, and a nitrification inhibitor. The sample is incubated at 20 °C in a dark, full-filled, and sealed vial for a period of 7 days. The dissolved oxygen concentration was measured before and after incubation. The amount of oxygen consumed per litre per sample was calculated (ISO 5815-1:2003); and
dissolved oxygen (Dc) was measured using the portable device, Oximeter, on the sites.
For determining the chosen indicators, the samples were filtered and subsequently treated according to the manual. The precise uptake (the sample and the blank sample) and subsequent addition of reagents were properly mixed, keeping the given time intervals, and inserting both samples into the spectrophotometer according to the calibrated instrument.
Handling water samples used for determining microelements in water followed ISO and EN standard procedures for refrigerated storage under laboratory conditions according to Water Quality–Sampling—Part 1: Guidance on the design of sampling programmes and sampling techniques (ISO 5667-1:2006). All plastic sampling bottles were properly washed prior to determining microelements by immersion in the warmed 5% (V/V) aqueous nitric acid solution for a minimum of 6 h by rinsing with deionized water before use. All sampling bottles and caps were rinsed three times using water taken from sampling sites. All samples were obtained directly from the river after allowing storm water to run for 500 m. The samples were then acidified by employing 1% nitric acid, and stored in 1 L hermetically closed plastic bottles at 4 °C for as short a time as possible before analysis. These samples were analysed applying the ICP emission instrument on Perkin Elmer ICP-400 (The Perkin–Elmer Plasma 400 ICP Emission Spectrometer). All microelements evaluated in this research were within the method-specified acceptance criterion of ±10% of the known value. A typical deviation for most elements made less than 3%.
The data were analysed using MathCad statistical software with a type I error (a) of 0.05. Also, appropriate normal and nonparametric statistics were applied. The statistical values, such as maximum, minimum, median, standard deviation, and the coefficient of determination, were calculated.
The statistical evaluation of related storm-water quantities included the main data on collected runoff water calculated using proper software and the main hypothesis about the maximum obtained water flows.
The study presents descriptive statistics that describes the characteristics of the main features of the surveyed data [
16]. The carried-out research deals with uncertainty about the analysis of the measured water quality scores stemming from the application of statistical estimation methods. We have analyzed the performance of two possible combination approaches that have recently curried favour with various water quality related research, such as statistically evaluated averages (AVG) and the maximum (MAX) scores of water quality parameters across a variety of methods. Descriptive statistics provides simple summaries of the sample and measures. Together with a simple analysis of graphics, it forms the basis of a virtually quantitative analysis of data. Statistical evaluations are made using free software, R, that is an integrated suite of software facilities for data manipulation, calculation, and graphical display.
Statistical analysis was performed using the statistical software package, R. Pearson correlation coefficient (
r) was calculated by analysing the chemical indicators.
where
and
are the averages of observations,
x and
y, respectively;
and
are standard deviations; and
n is the number of observations.
As for the formulation of the correlation matrix of different chemical indicators, the correlation coefficients of the different pairs of chemical elements were calculated using the estimated value of p to determine significant correlations. The correlation between the indicators is considered significant if p < 0.05 and p < 0.01 and is determined as insignificant if p > 0.05.
Correlation analysis involves the assessment of correlation strength (
r) and its statistical significance. To make sure that the obtained is not random coincidence, the following hypothesis is tested:
i.e., the confirmation of the initial hypothesis should mean that the linear dependence between the variables under consideration is not significant; accordingly, the alternative hypothesis should confirm statistically significant dependence. Up-to-date statistical software packages calculate the value of
p to verify a hypothesis about the significance of the correlation coefficient compared with a significance level of α = 0.05. If the calculated value of
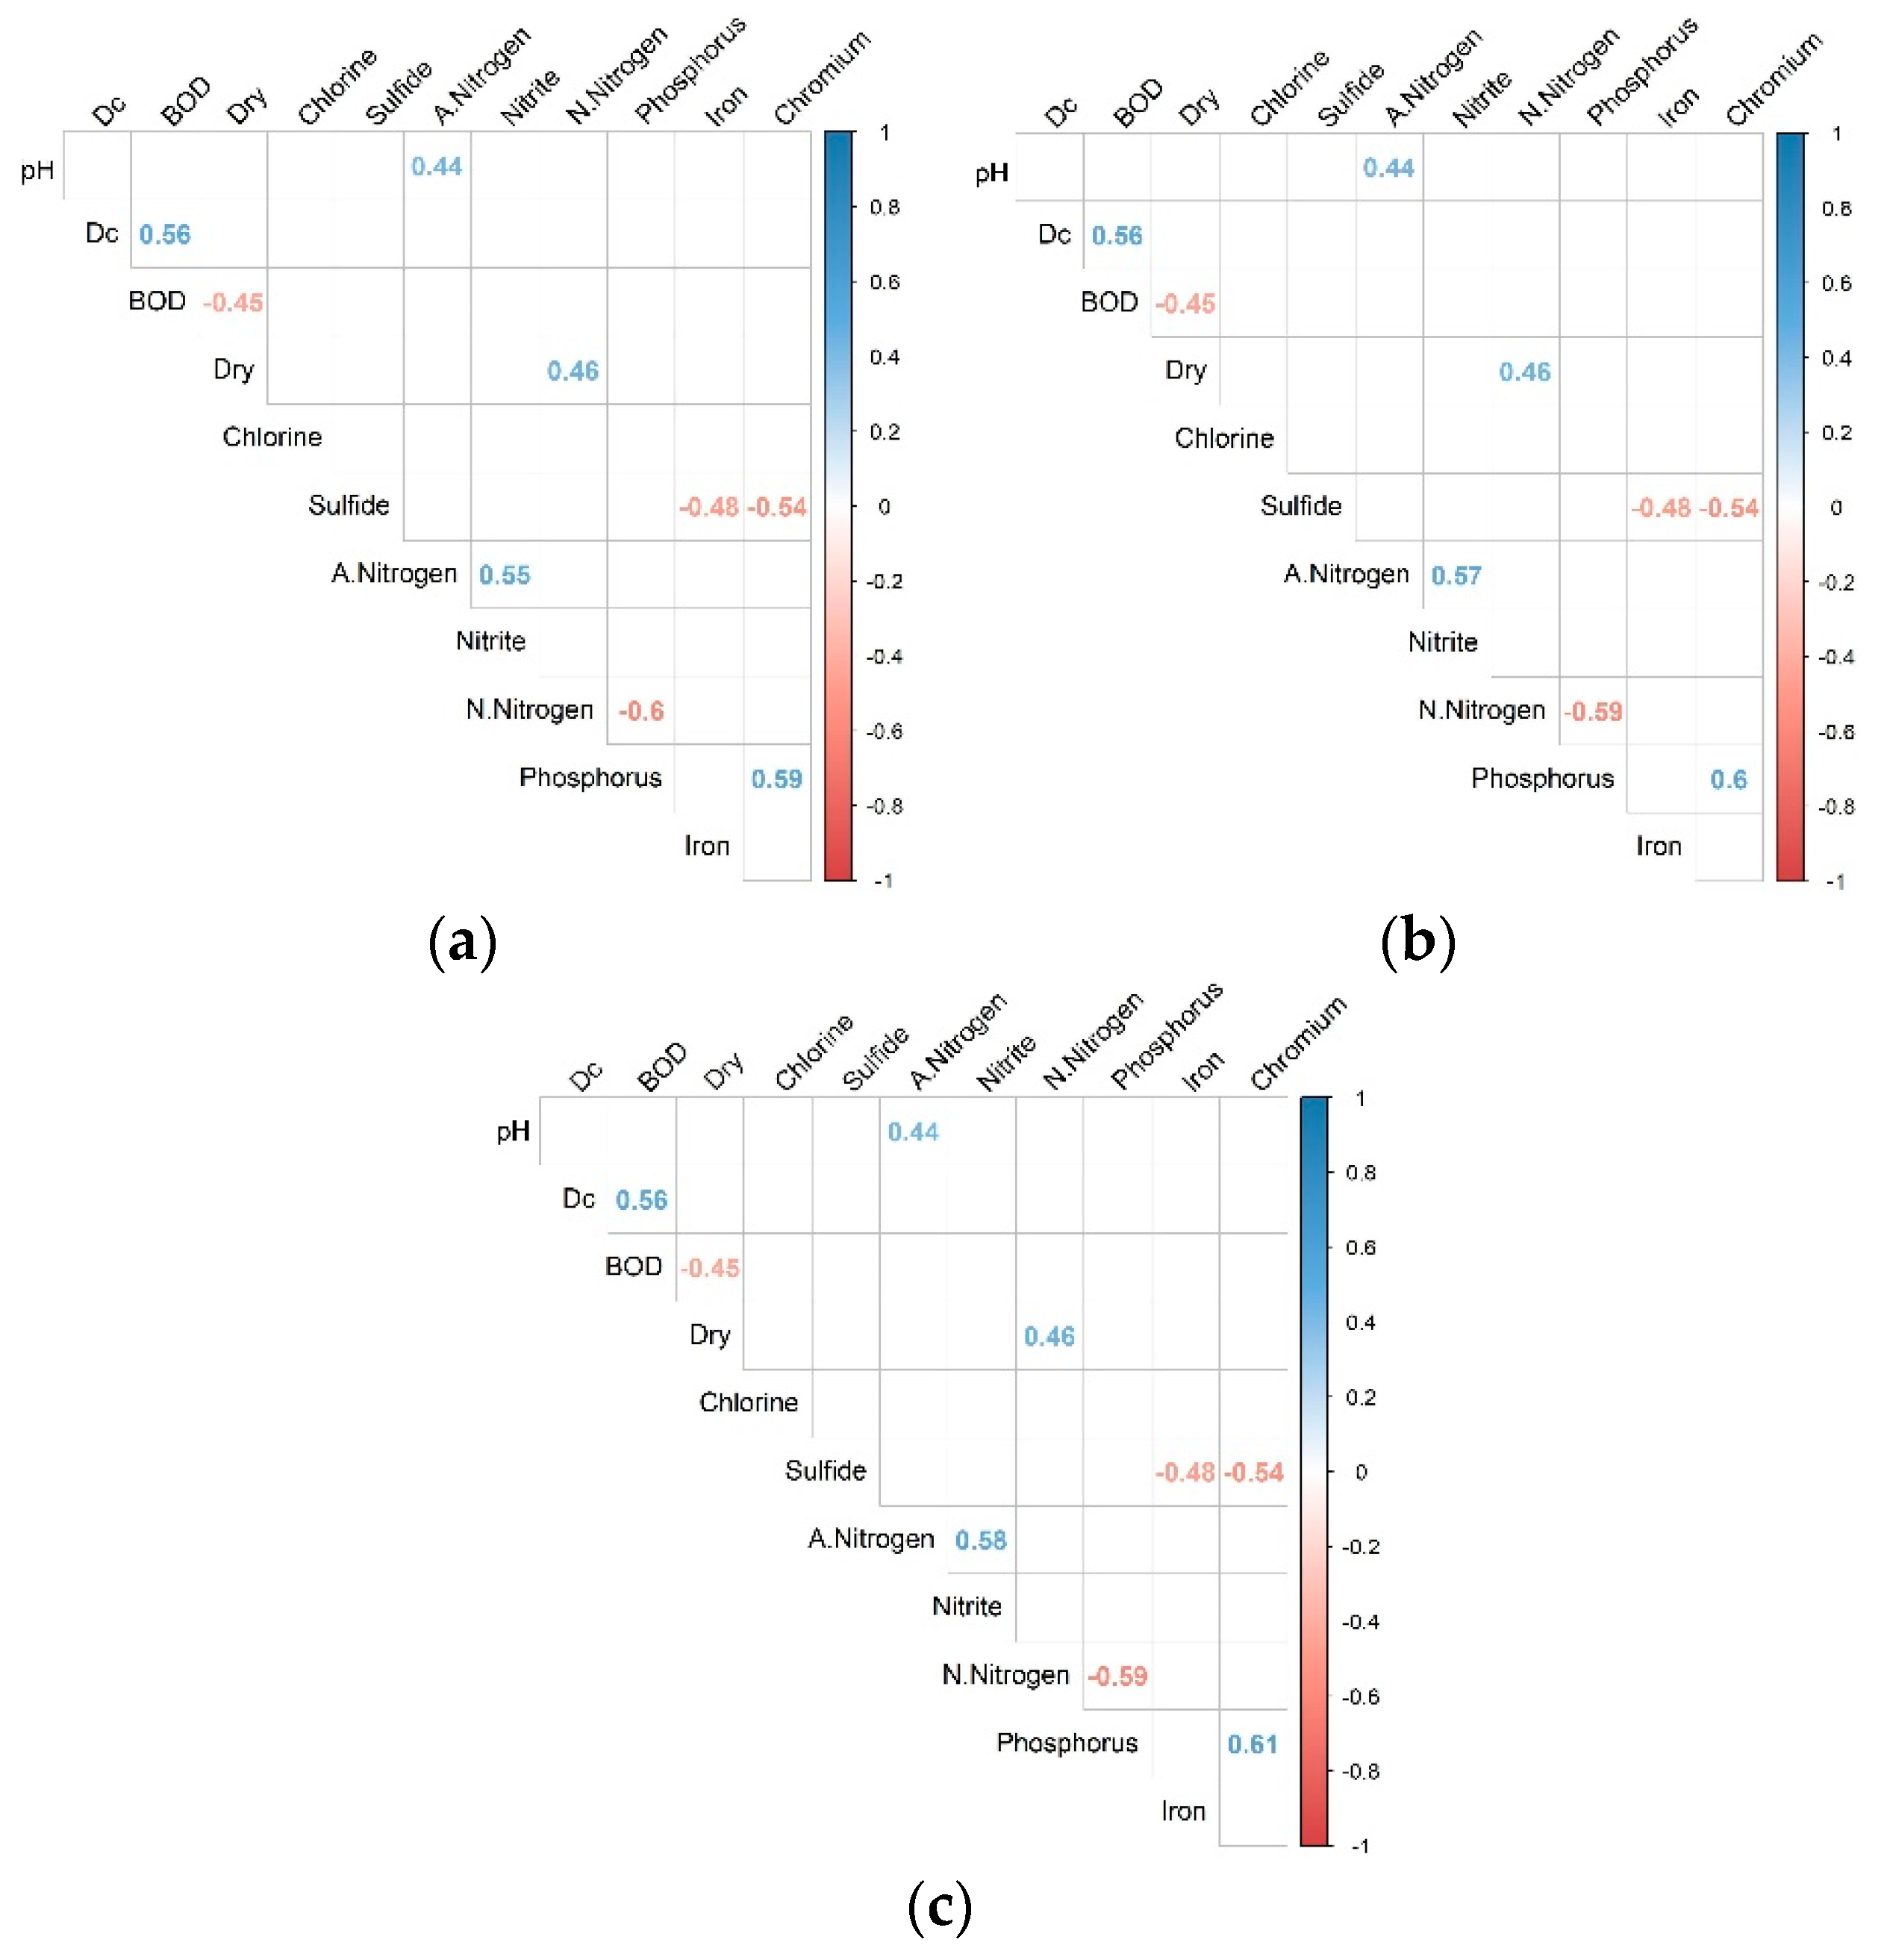
p is less than 0.05, the initial hypothesis is rejected and a statistically significant correlation is selected; otherwise, a statistically insignificant correlation remains valid. The below figures show the values of significant correlation coefficients among the observed variables checking a hypothesis about the value of the correlation coefficient equal to 0 that was rejected. Empty boxes at intersections denote that correlation coefficients are not statistically significant.
3. Results and Discussion
The River Neris is the longest tributary (510 km) and the largest nourishing basin (24,942 km
2) of the River Nemunas. The headwaters of the stream are found in Belarus and reach the peripheries of Lithuania as a mature river, the length of which is 275 km with a catchment area covering 10,961 km
2. The Neris flows along the Lithuanian-Belarusian border for around 6.5 km. Belarus takes the complete upriver of the Neris. It is fed by a huge river basin (44% of the total catchment area) widely spread on the plain between the uplands of Minsk, Asmena, and Svencionys-Narutis. Lithuanian middle reaches cross uplands in Belarus, and the downriver descends to the middle of Lithuania. Soils permeable to water prevail in the basin, with the density of forests making up 28%: That of wetlands—approximately 10%, and that of lakes—2.5%. The basin of the River Neris is clearly asymmetrical: The right side takes 70% of the total basin area (basin symmetry coefficient Ks = −0.40). The length of the watershed is around 980 km and includes three anthropogenic catchment basins carrying water to the neighbouring basins: Water from the Viliya pond set up in the upriver reaches the River Svislach (the Black Sea basin), flows from Kavarskas pond (Sventoji River basin) to the River Nevezis, and, through Zagarine waterway and Voke streamline, from the River Merkys runs in the opposite direction to the River Neris. Ten tributaries more than 50 km in length (Asmena and Sventoji are longer than 100 km) enter the Neris, however, only four of those are found in Lithuania [
1].
In 1976, the Vileyka-Minsk water system started functioning in the upriver of the Neris in the territory of Belarus with the aim of improving water supply to Minsk. For that purpose, a pond on the River Neris next to Vileyka was installed. A part of water from this area is pumped and directed to the River Svislach that belongs to the River Dnieper basin and passes Minsk. The Vileyka-Minsk system includes a hydro-unit and a 15-m ground pile. At a height of 12 m, the Vileyka pond covers an area of 67 km2 with a volume of 260 million m3. The average depth of the pond reaches 3.7 m. For erecting the structure, nine settlements were removed and 13 more were protected by specific piles, thus losing 2000 hectares of arable land and 3600 hectares of forest. The height of the working pond is 6 m with a useful volume of 235 million m3. The 62 km long channel uses five pumping stations to connect the Vileyka pond with the one built in Zaslavsky on the River Svislach that covers an area of 31 km2 and a useful volume of 50 million m3. The relative height between the two ponds is 77 m., the maximum discharge of pumps is 22 m3/s, and the discharge of water redirected from the Vileyka pond is 12 m3/s.
The precipitation rate was the lowest in February during the research period and made an average of 30 mm. Most precipitation falls in June in this location, thus averaging at 82 mm. Considering the driest and wettest months, the difference in precipitation makes 52 mm. Local hydrodynamic conditions [
7,
8,
9] that generate storm-water quantities influence the size and degree of sorting runoff effluents within and on the surface of the related streets and roads. Strom-water collection or the development of the segregated levels of runoff water in the river stream can occur over the long stretches of riverbed development.
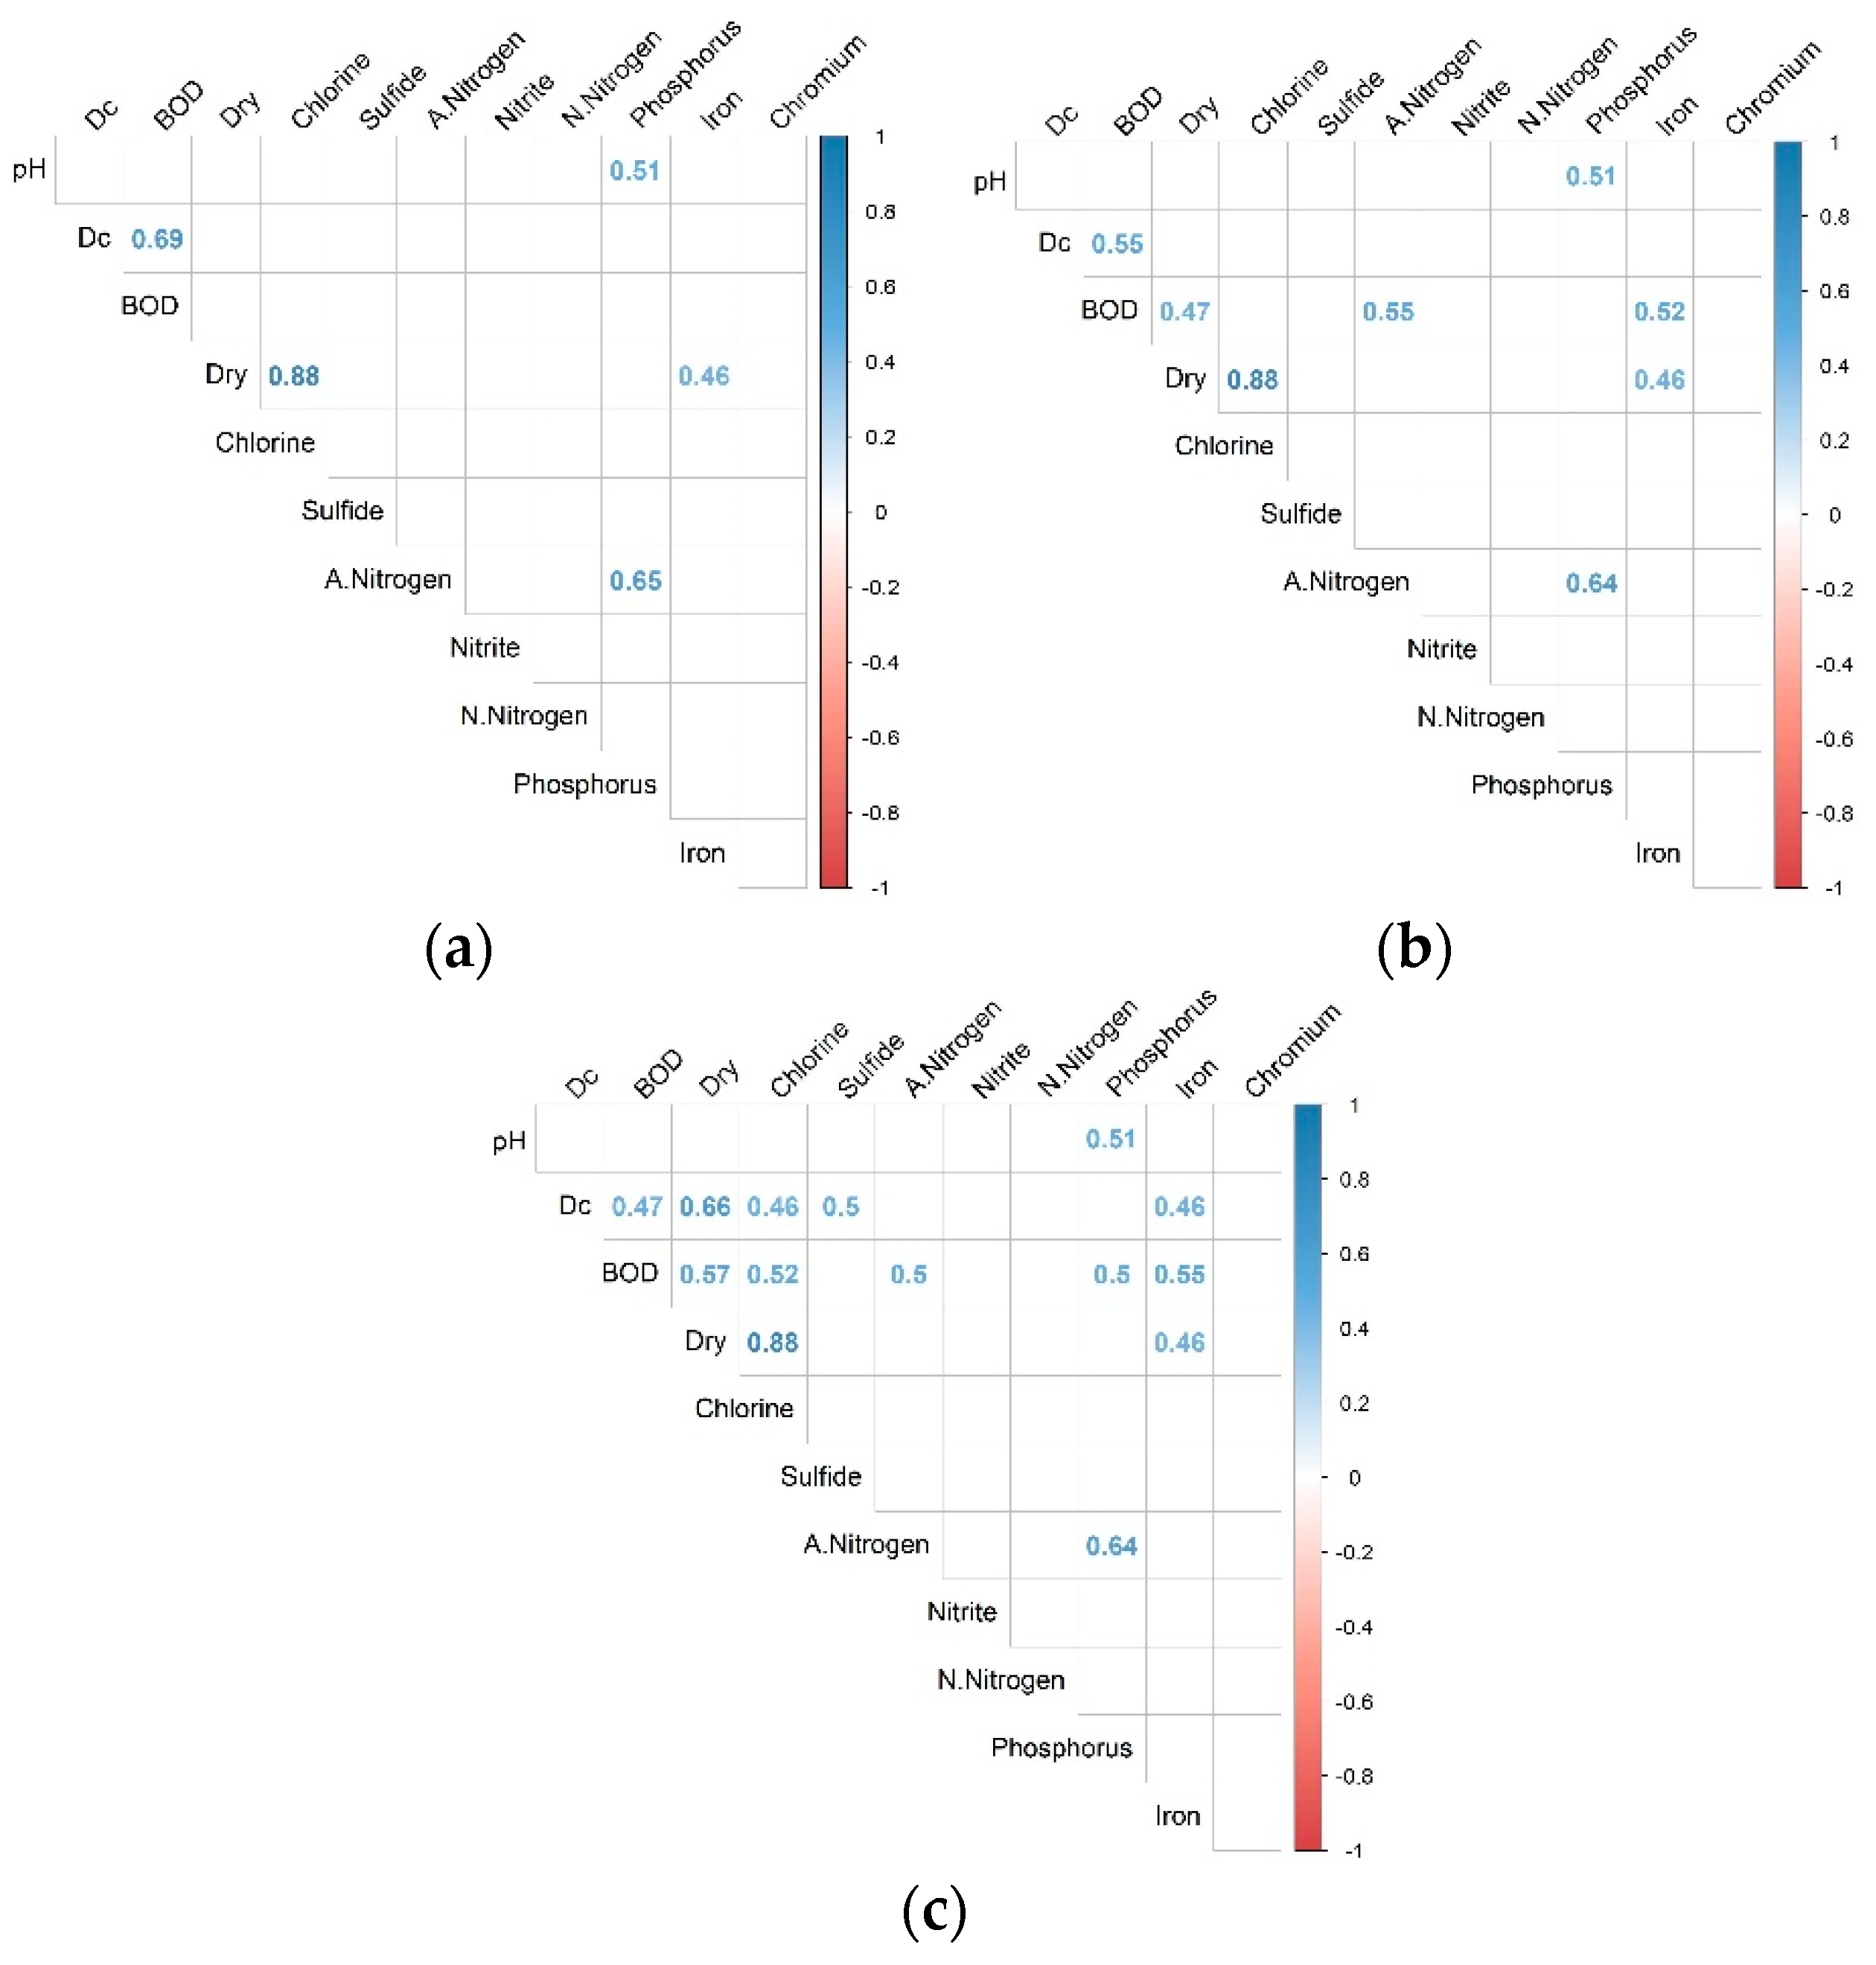
Only a small number of variables have a certain significant linear relationship. The examination of incoming and outgoing flows involved monitoring direct linear dependence, and, in the majority of cases, correlation coefficients, were found to be significant (blue). For instance, the analysis of data blocks of incoming flows to Vileyka (
Table 1,
Table 2,
Table 3 and
Table 4) disclosed that, under certain circumstances, the nature of linear dependence changed from direct to inverse as the negative values of correlation coefficients (red) already appeared (
Figure 2,
Figure 3,
Figure 4 and
Figure 5). However, this should be under the effect of appropriate environmental factors.
Only a few elements significantly correlate with the examined minimum values of incoming flows. There are more comet elements in the average values, and the maximum number of correlating elements on examining the maximum values. The number of significant correlation is mostly influenced by indicators, Dc and BOD, i.e., no matter what values (Min, Avg, or Max) are taken, the correlation between water quality indicators, such as pH and phosphorus, Dry (dry solids) and chlorine, dry and iron, or ammonium nitrogen and phosphorus, is the same. Oxygen concentration Dc and BOD correlated with other indicators, using Avg and Max. There are more significant correlations that have not been addressed in Min or Avg values (
Figure 2).
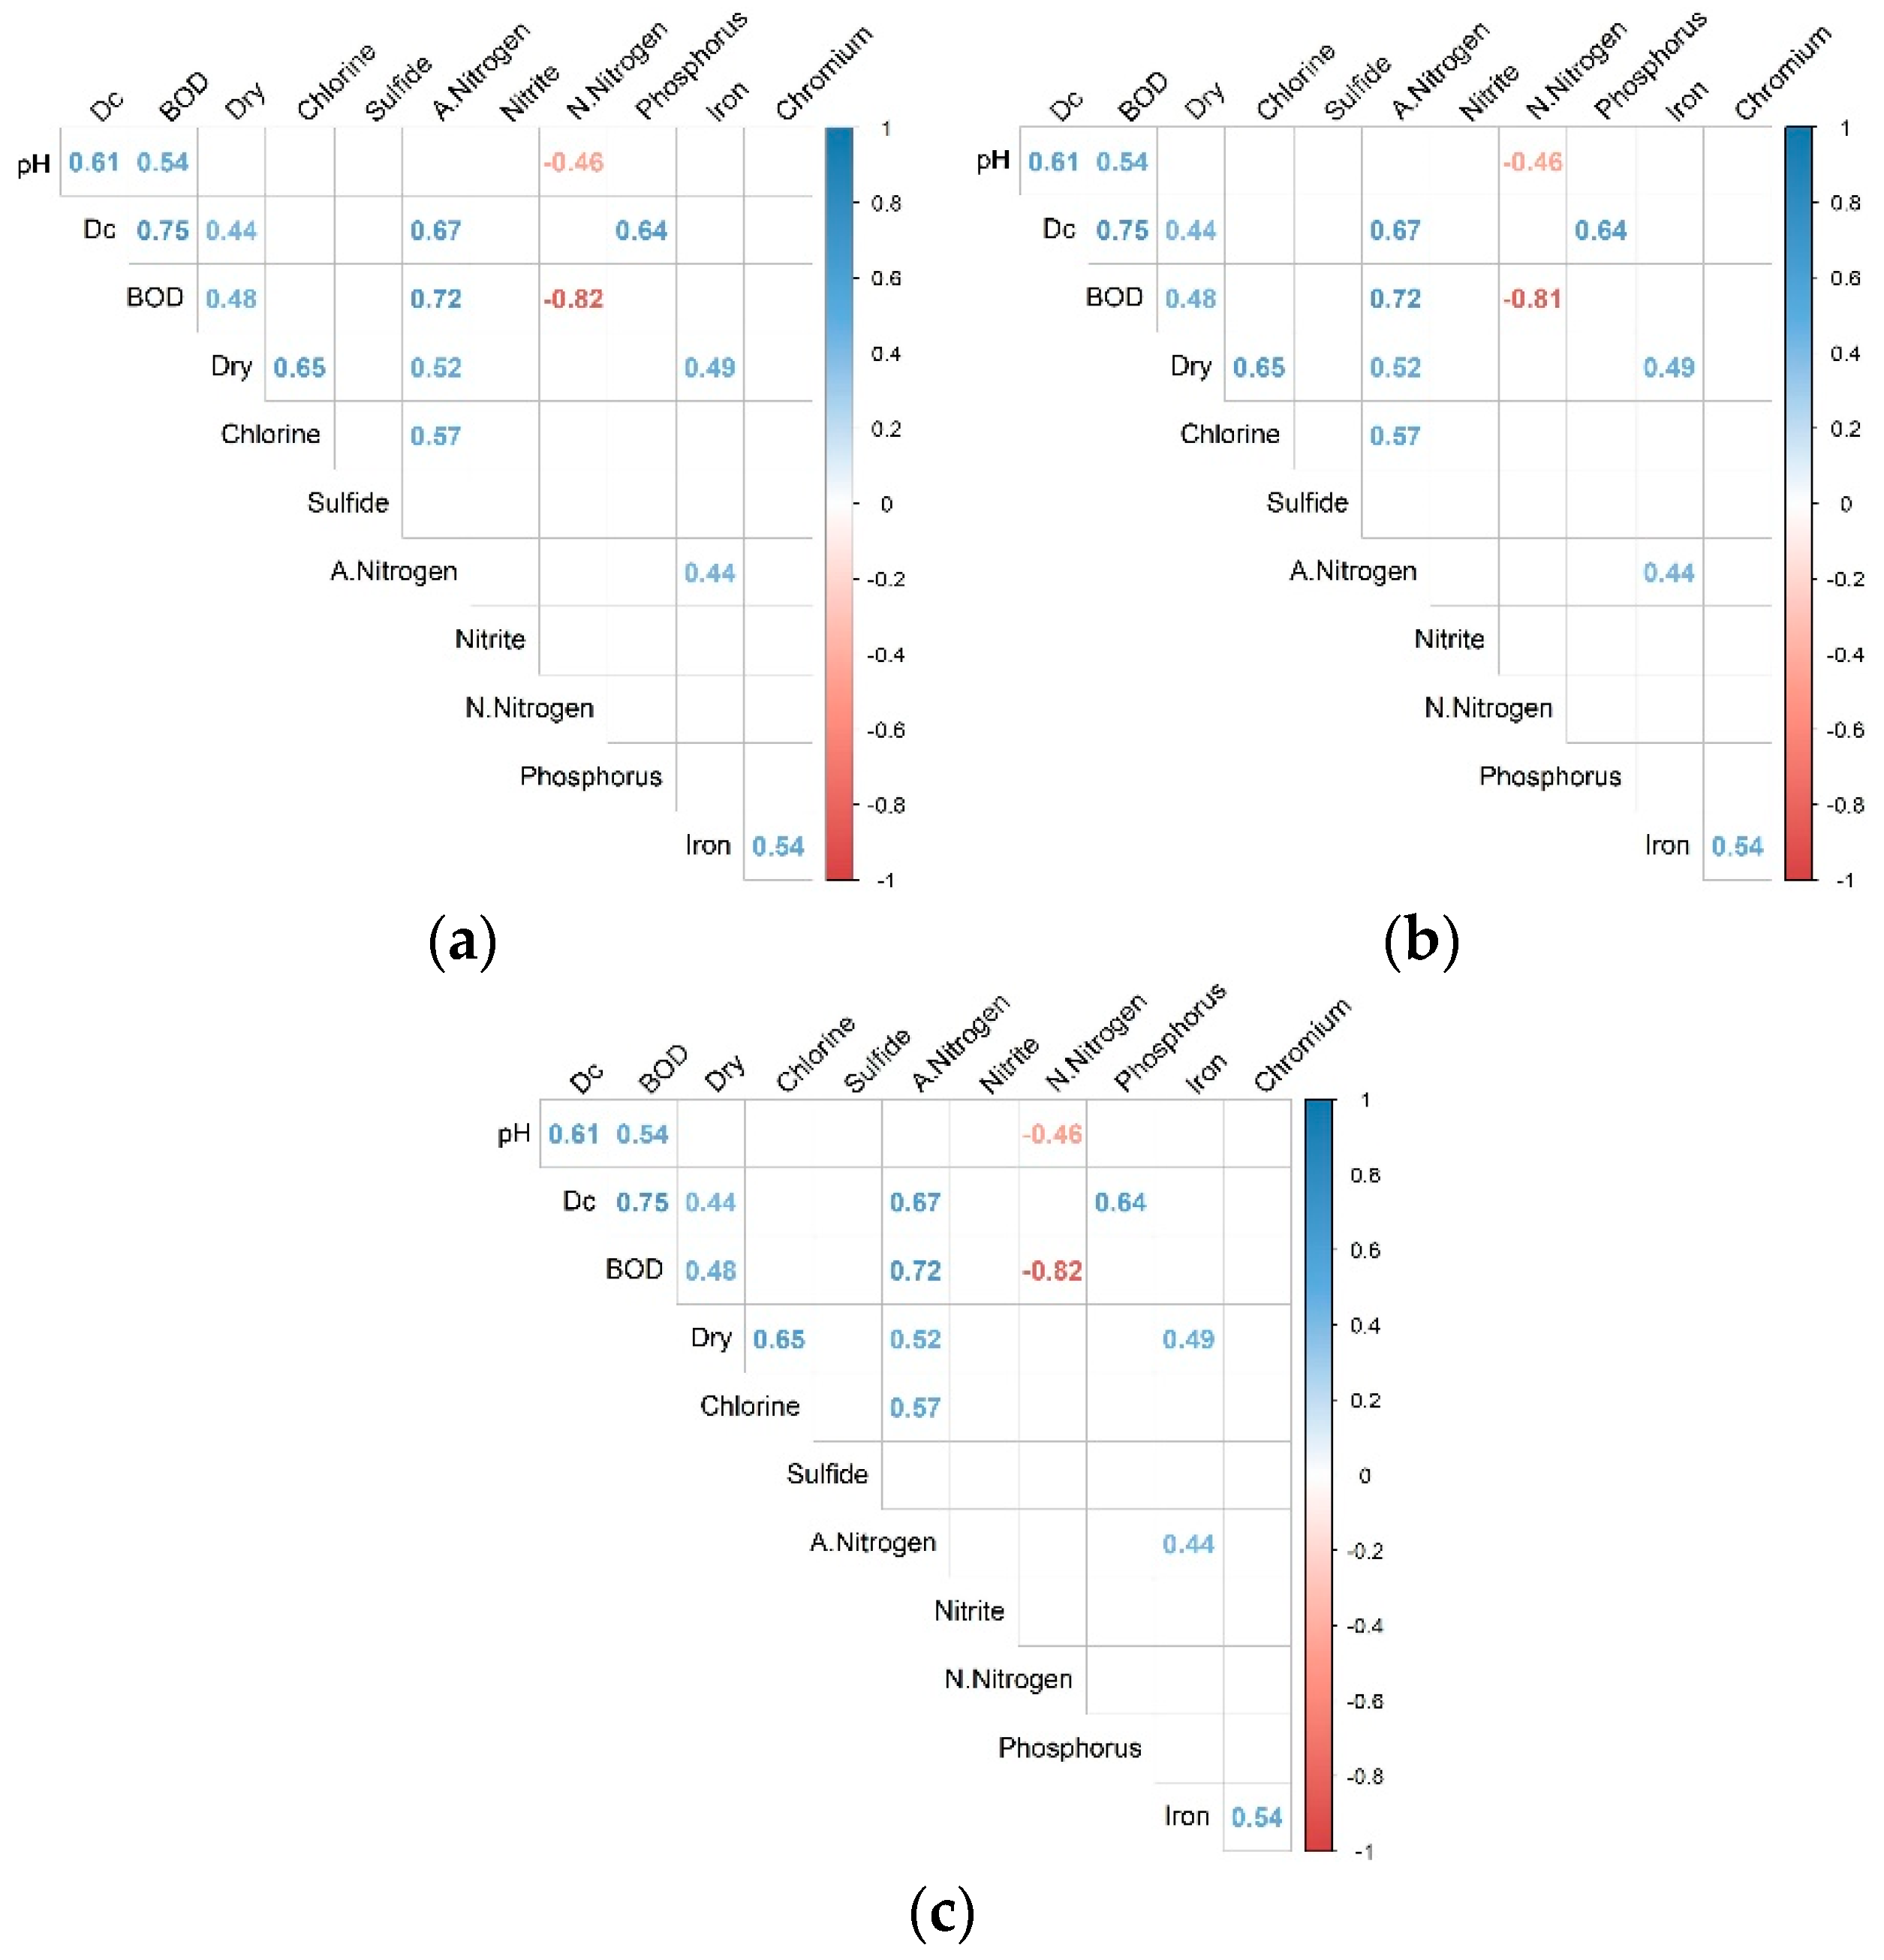
In the case of the River Viliya before the release, the dependencies of the indicators also do not completely affect the values (Min, Avg, or Max choice). In all cases, the same indicators are significantly correlated. Compared to the other cases investigated previously,
Figure 2 and
Figure 3 show a significant dependence of other indicators: Sulfide and phosphorus, sulfide and iron, sulfide and chromium, and nitrate nitrogen and phosphorus (in all these cases, negative dependence is observed, which means the increase in the values of one indicator means the other indicator decreases), and it has a significant positive correlation of ammonium nitrogen and nitrate nitrogen, and of phosphorus and chromium (
Figure 4).
The dependencies of the investigated indicators in the case of outgoing flows demonstrate it does not matter which values (Min, Avg, or Max) change the number of significant correlations or remain the same. However, in comparison with incoming flows, their number is higher, and there is a significant relationship between pH and Dc, BOD and nitrate nitrogen; between oxygen concentration Dc and ammonium nitrogen and phosphorus; between dry residual and ammonium nitrogen; between chlorine and ammonium nitrogen; between ammonium nitrogen and iron; and between chromium and iron (
Figure 3).
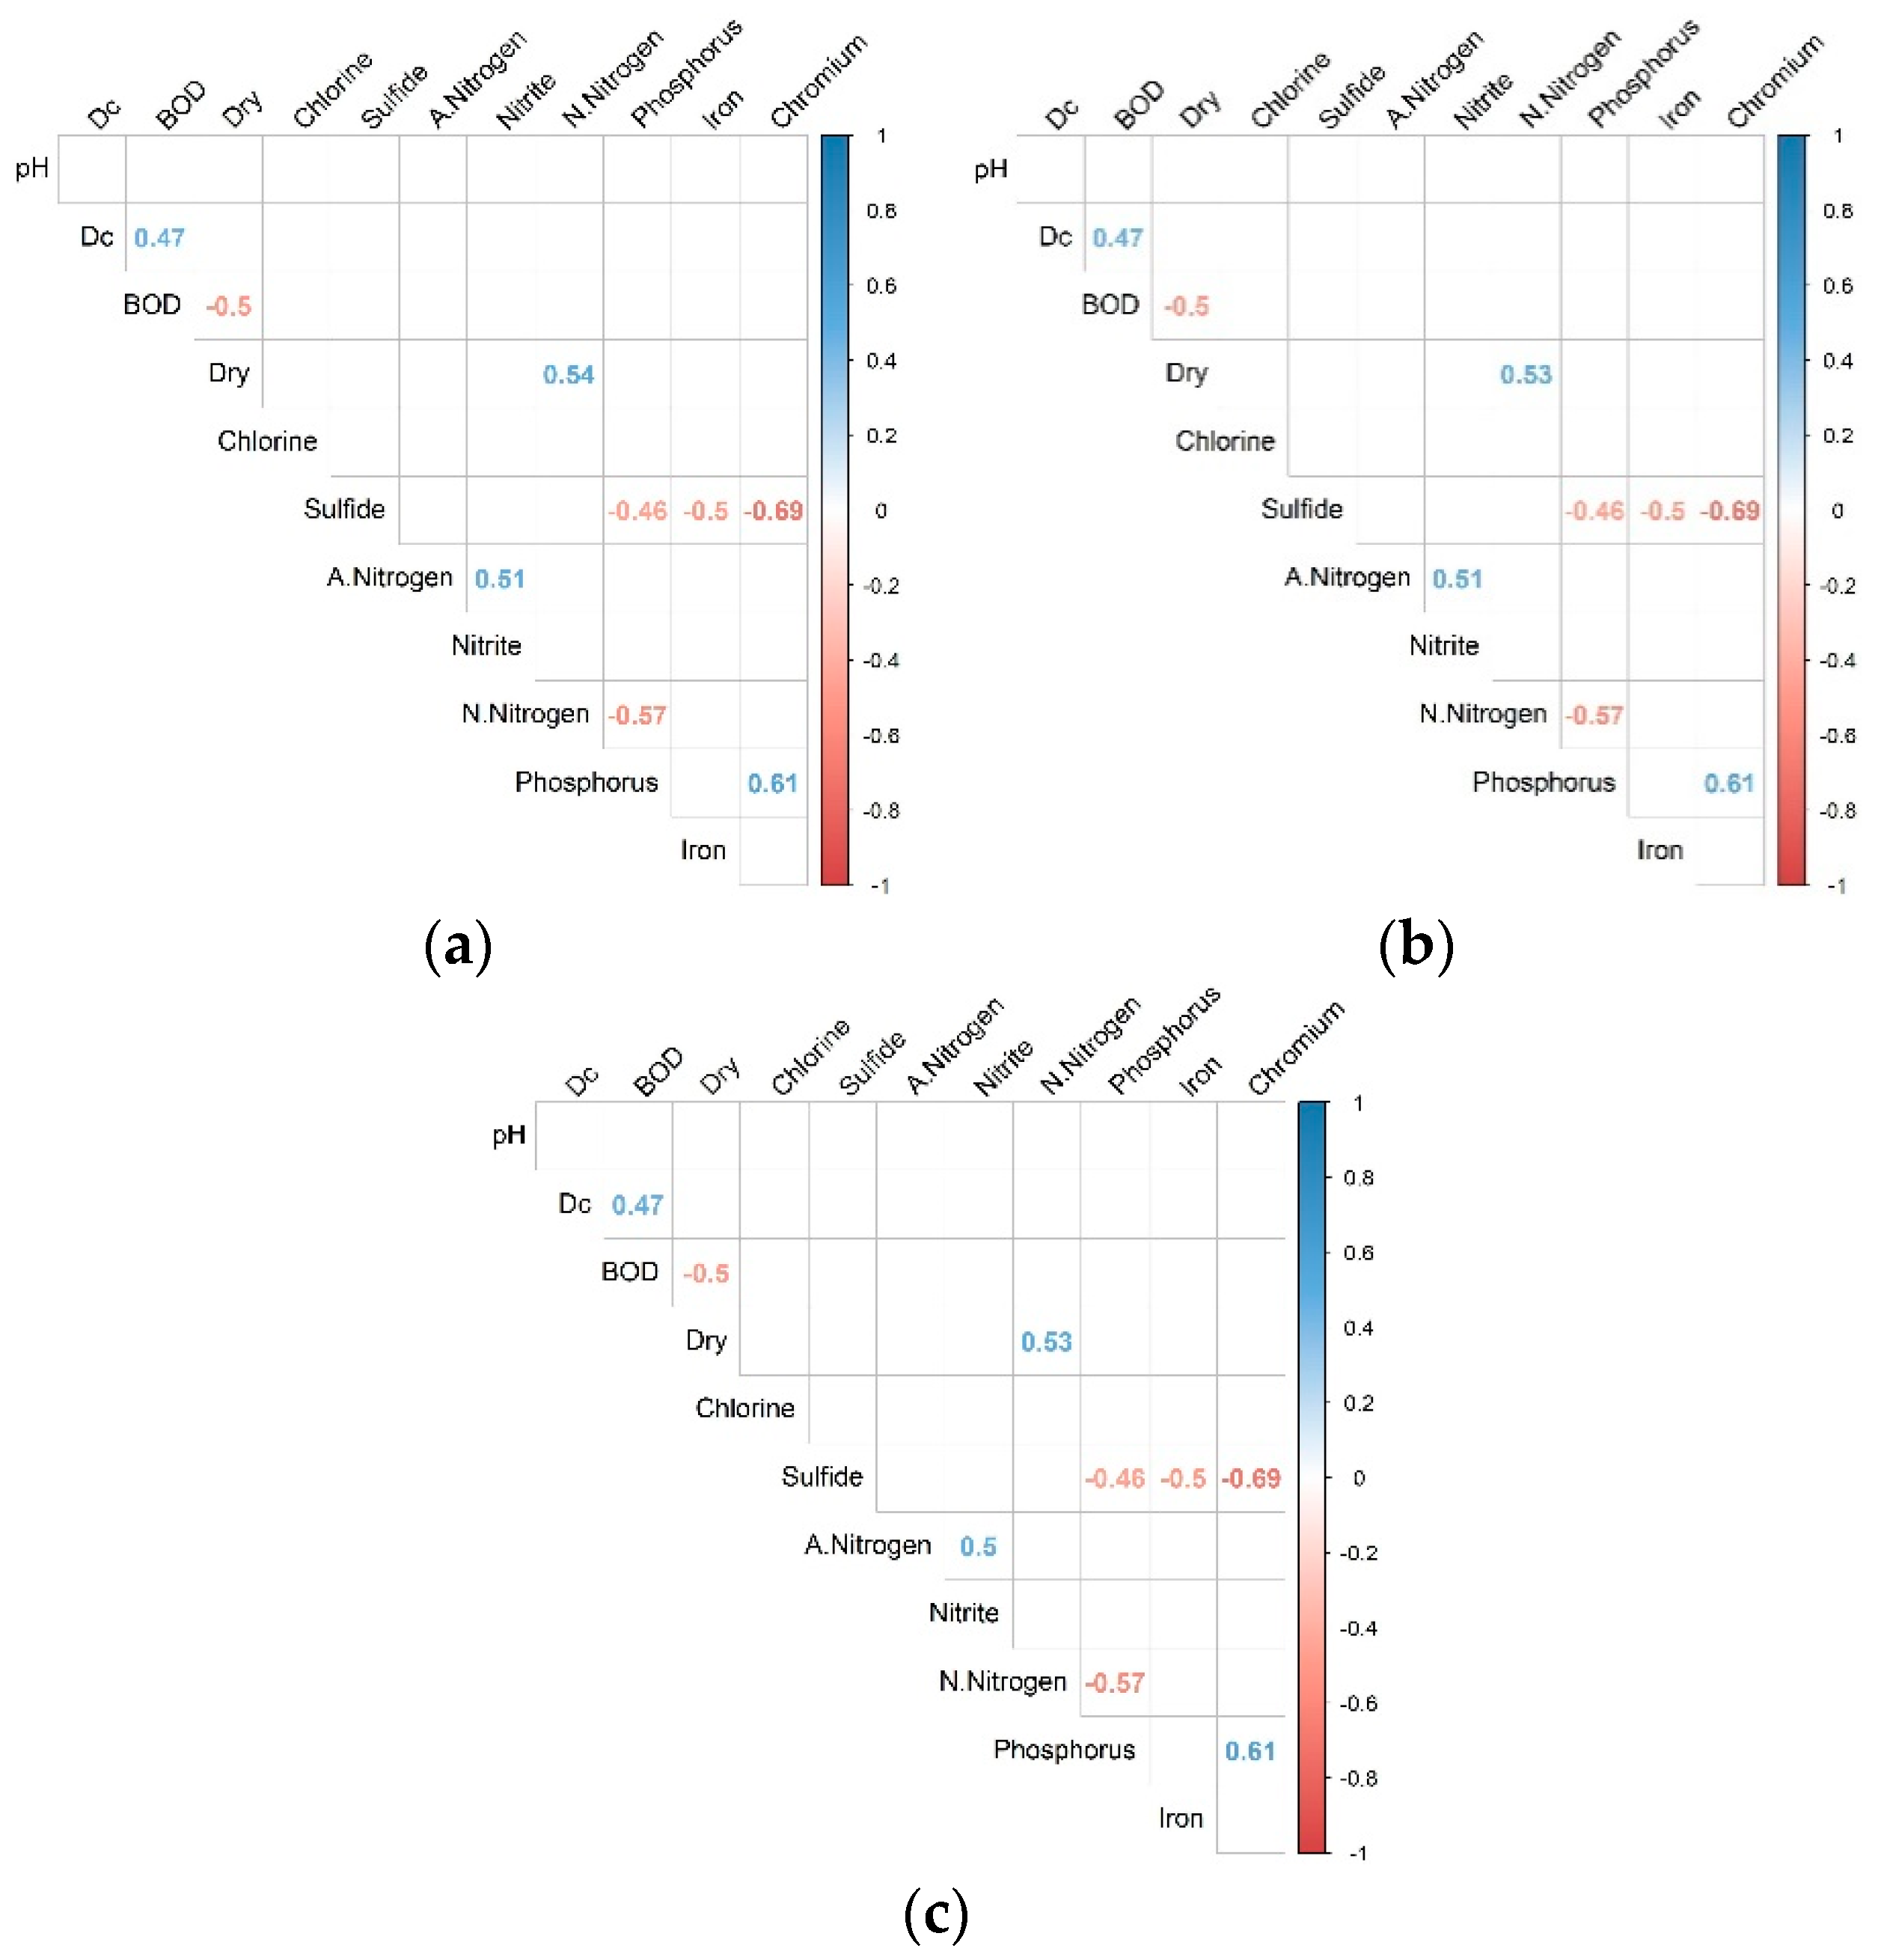
In the case of the River Viliya before the release, the dependencies of the indicators also do not completely affect the values (Min, Avg, or Max). In all cases, the same indicators significantly correlate. Compared to the other previously investigated cases,
Figure 3 show a significant dependence of other indicators, such as sulfide and phosphorus, sulfide and iron, sulfide and chromium, and nitrate nitrogen and phosphorus (in all these cases, negative dependence is observed, which means an increase in the values of one indicator and a decrease in the other), which has a significant positive correlation between ammonium nitrogen and nitrate nitrogen as well as between phosphorus and chromium (
Figure 4).
The case of the River Viliya below the release, as in the preceding two cases shown in
Figure 3 and
Figure 4, discloses that dependencies do not affect Min, Avg, or Max values. Comparing the correlation values given, only a new significant relationship between two indicators, pH and ammonium nitrogen, was observed, and the relationship between sulfide and phosphorus has become insignificant (
Figure 5).
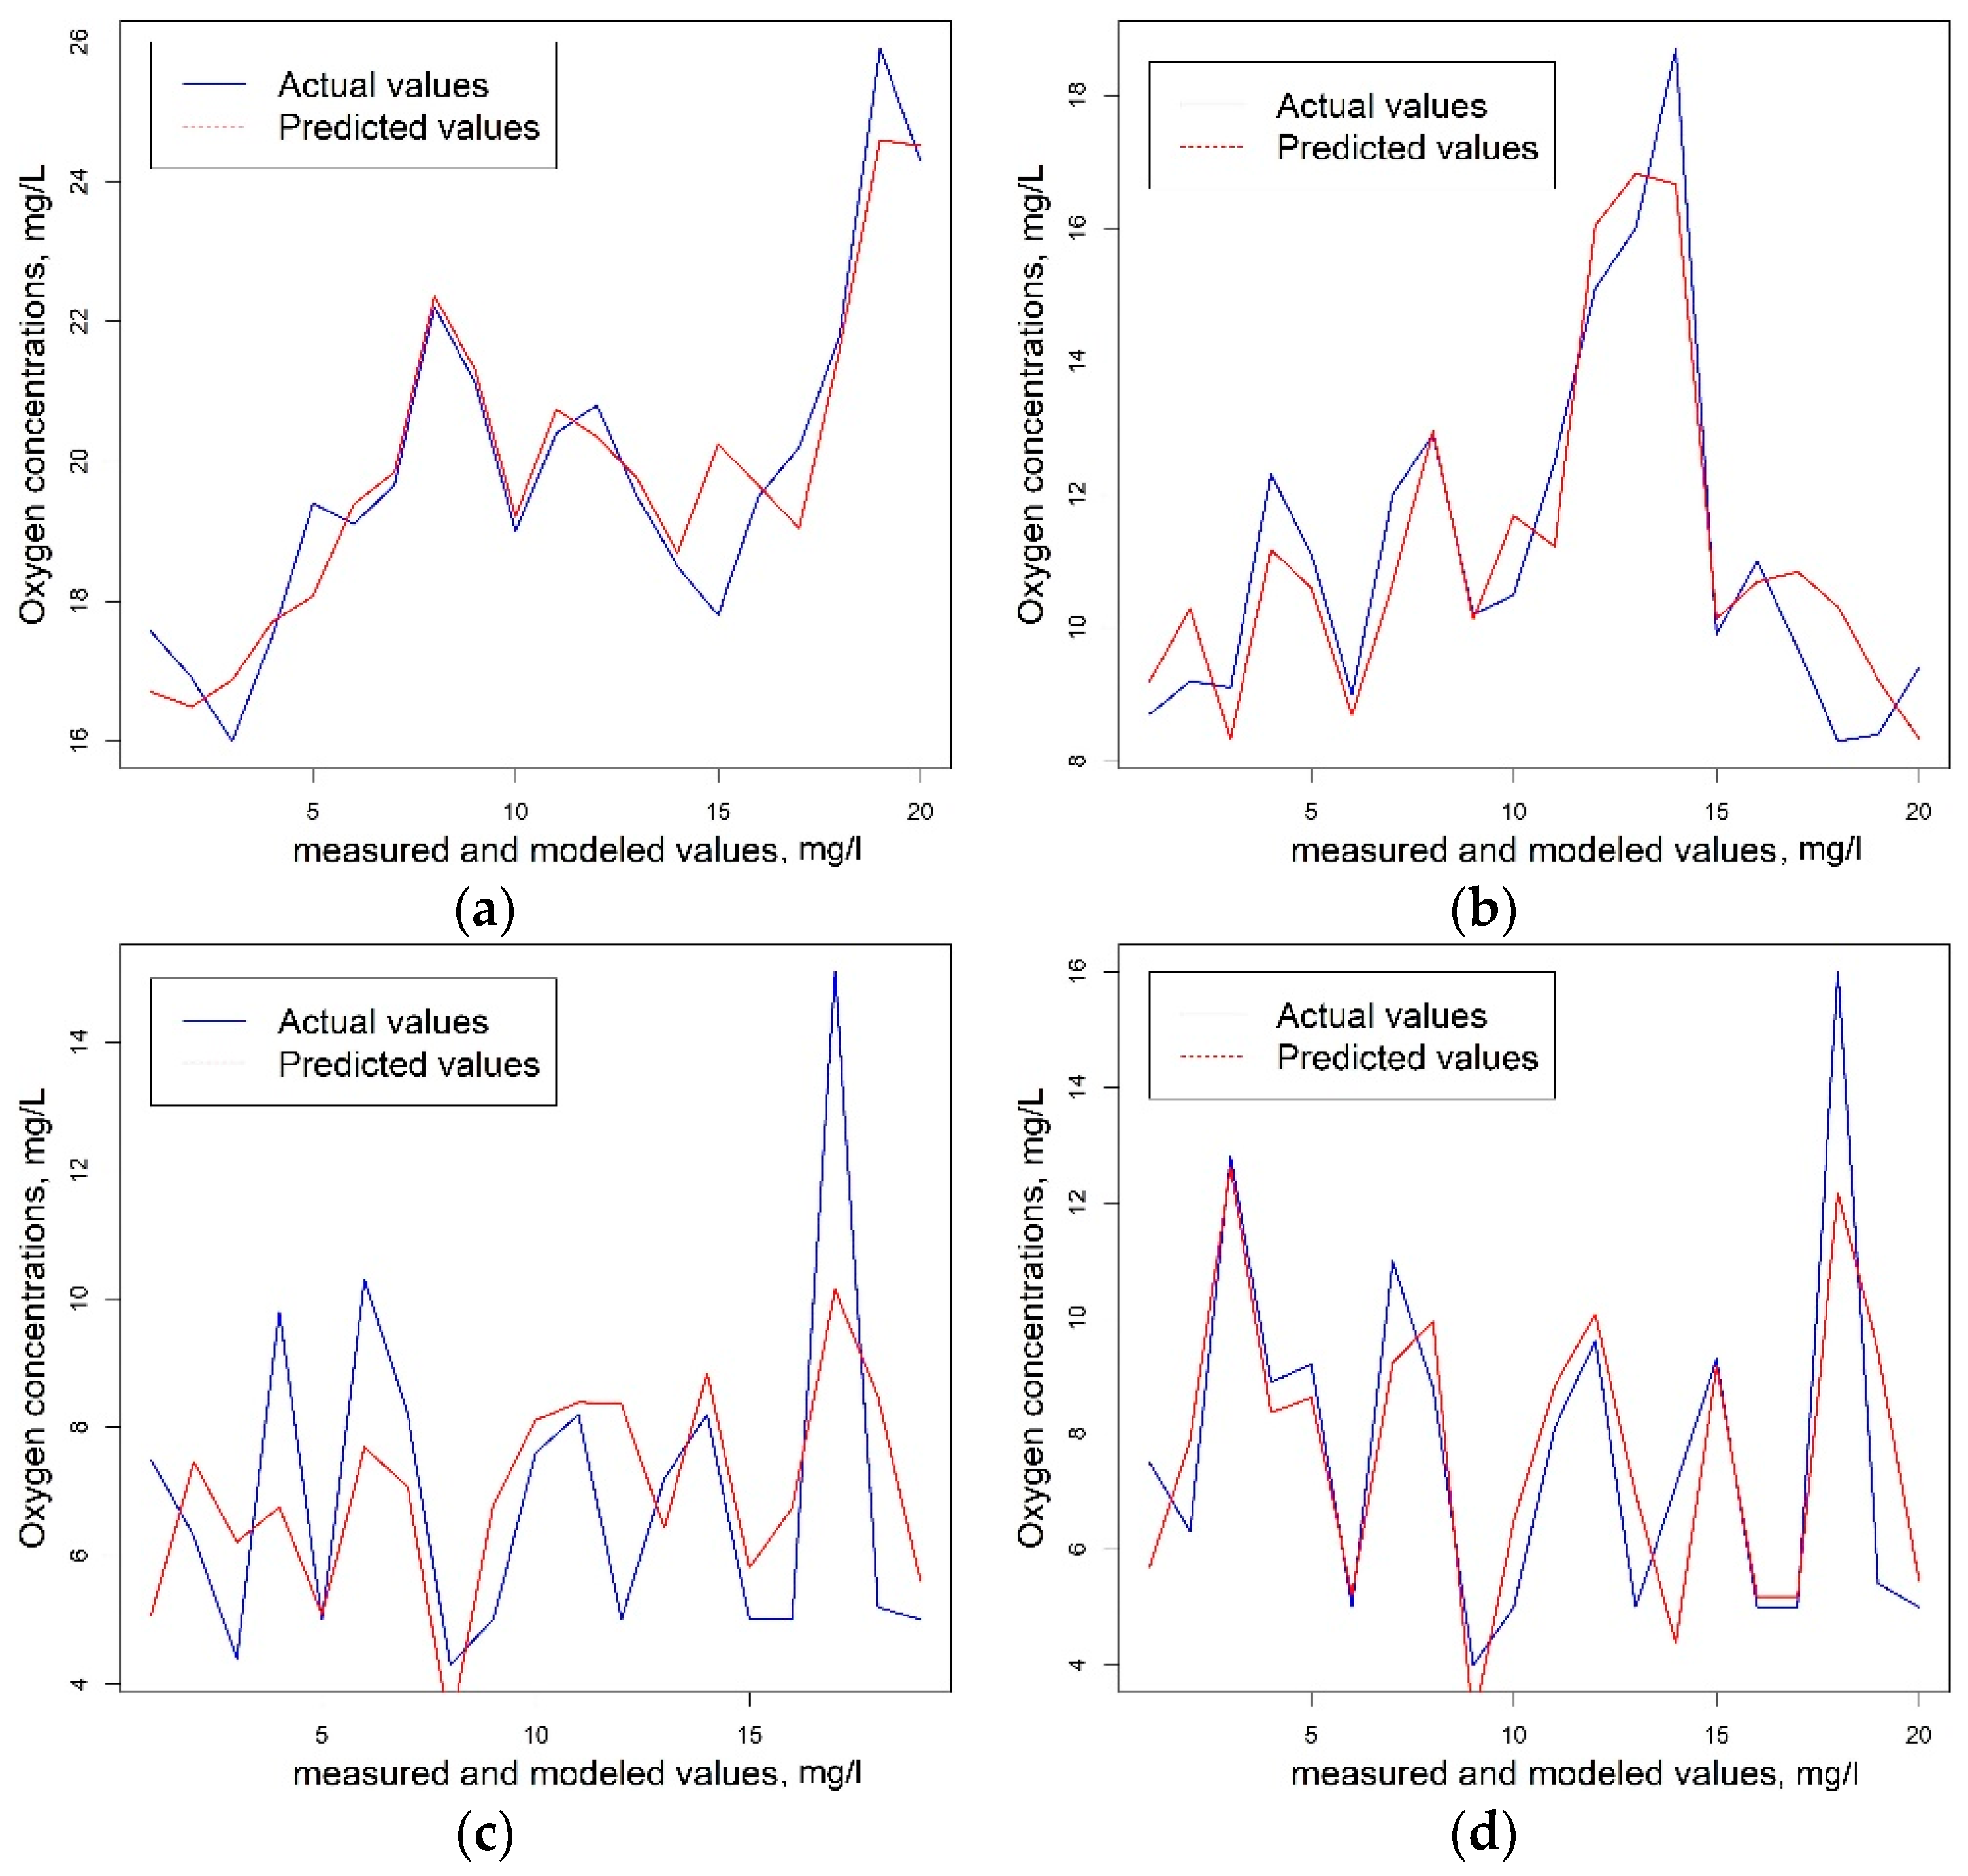
A range of surface water quality data were examined in the present work for a comprehensive water quality evaluation. An analysis of the data, based on multiple regression, was attempted. This was done to examine whether seasonal variation in different parameters can be explained and predicted based upon their interrelationship in terms of source. From an analysis point of view, all parameters that do we have were selected to set up the regression model. Models were made for all four cases: Incoming flows from Belarus (
Table 5), outgoing flows from Belarus (
Table 6), the River Viliya before the release (
Table 7), and the River Viliya below the release (
Table 8), taking the maximum values of the variables.
The dependent variable was dissolved oxygen (DC) and the independent variables were pH, biochemical oxygen demand (BOD), dry solids (Dry), chlorine, sulfide, amonium nitrogen (A. Nitrogen), nitrite, nitrate nitrogen (N. Nitrogen), phosphorus, iron, and chromium. From these data, multiple regression analysis was done using the data analysis program, R, and the regression equations relating DC with its dependent water quality parameters was obtained. For the analysis of the data sample using regression analysis, an 80% confidence level was fixed. Therefore, the
p value should be within a 20% confidence level, i.e.,
p value should be less than 0.20 for the analysis to be accurate within the assumed confidence level. All necessary assumptions for obtaining a good model were checked: Homoscedasticy, independent errors, outliers/influential cases, multicollinearity, and normally distributed residuals. A summary of the regression analysis results is presented in
Table 5,
Table 6,
Table 7 and
Table 8 and
Figure 6.
The redirection of water from the Vileyka pond to the Dnieper basin greatly suppresses the natural hydrological regime of the Neris, particularly in the dry year. This has an impact on all water users located below the Vileyka-Minsk water system. The amount of water accumulated during the flood in the Vileyka pond does not enter the Neris, Nemunas, and Curonian Lagoon, which adversely affects the development of aquatic ecosystems.
An evaluation of the natural attenuation process was developed specifically for each site to determine that natural attenuation is occurring to expectations. This research was designed to detect changes in water quality that may reduce the efficiency of the process and identify some potential toxic or more mobile transformation compounds (chromium and nitrite). The operation of the Vileyka pond reduces the runoff of the Neris, and therefore the project on the Vileyka-Minsk water system revealed it was necessary to ensure there was a 95% probability of monthly discharge in the Neris close to Vilnius (51.5 m3/s in summer and 45 m3/s in winter). However, it is necessary to observe the year when the discharge of the River Neris was lower than the predicted one making 51.5 m3/s.
The scientists of the Hydrology Laboratory of the Lithuanian Energy Institute analyzed the effect of the Vileyka system on the hydrological regime of the River Neris [
1]. The simulation of the modified hydrological regime of the Neris showed that the values of extracting water from the Vileykay backwater were accepted according to the project (12 m
3/s). The calculated statistical parameters for the runoff of the Neris indicate that the effect of the Vileyka pond can be felt along the whole River Neris and even in the Nemunas (
Table 9).
The characteristics of the runoff mostly change in the hydrometric stations located close to the Vileyka pond. For example, under the operating system, Q decreased by 2.5 times, Cv increased by 2.5 times and d increased by almost 2 times at the Vileyka station. The effect of the pond varies moving further from the Vileyka. The runoff of the Neris to the confluence increases, and therefore the volume of water taken from the Vileyka pond forms a relatively smaller part of the discharge of the river. Discharge Q of the regime changed in the River Zalesje decreased by 37% compared to the unchanged regime of the river, by 24% at the Michailishkis station, by 15% nearby Vilnius, by 10% nearby Jonava, by 4% nearby Lampedziai, and by 3% nearby Smalininkai. The results of statistical simulation show that the runoff close to Vilnius decreases by 8–9 m
3/s in the wet year, by 6–7 m
3/s in the medium wet year, and by 5–6 m
3/s in the dry year under the operation of the Vileyka-Minsk system. The number of dry years increases from 46 to 60% [
1].
All this may have an effect on the quality of river water due to insufficient water dilution [
7,
10,
11]. To conduct statistical analysis, data on discharge, water temperature, precipitation, and the general amounts of ammonium nitrogen, nitrite nitrogen, nitrate nitrogen, and phosphorus at different seasonal periods in the two monitored areas of the Neris at Buivydziai (LTR43) and above Kaunas (LTR50) have been used. The main numerical characteristics of the observed variables have been calculated and are presented in
Table 10.
Accordingly,
Table 11 and
Table 12 show the calculated main numerical characteristics of the variables subject to the location of data collection. A comparison of the values presented in
Table 11 and
Table 12 demonstrates a surprisingly large difference in the mean values of discharge considering the fact that the data were collected from two locations. The average discharge in the Vilnius area is 69.086 compared to 177.928 in the Kaunas region, which indicates a difference of more than three times.
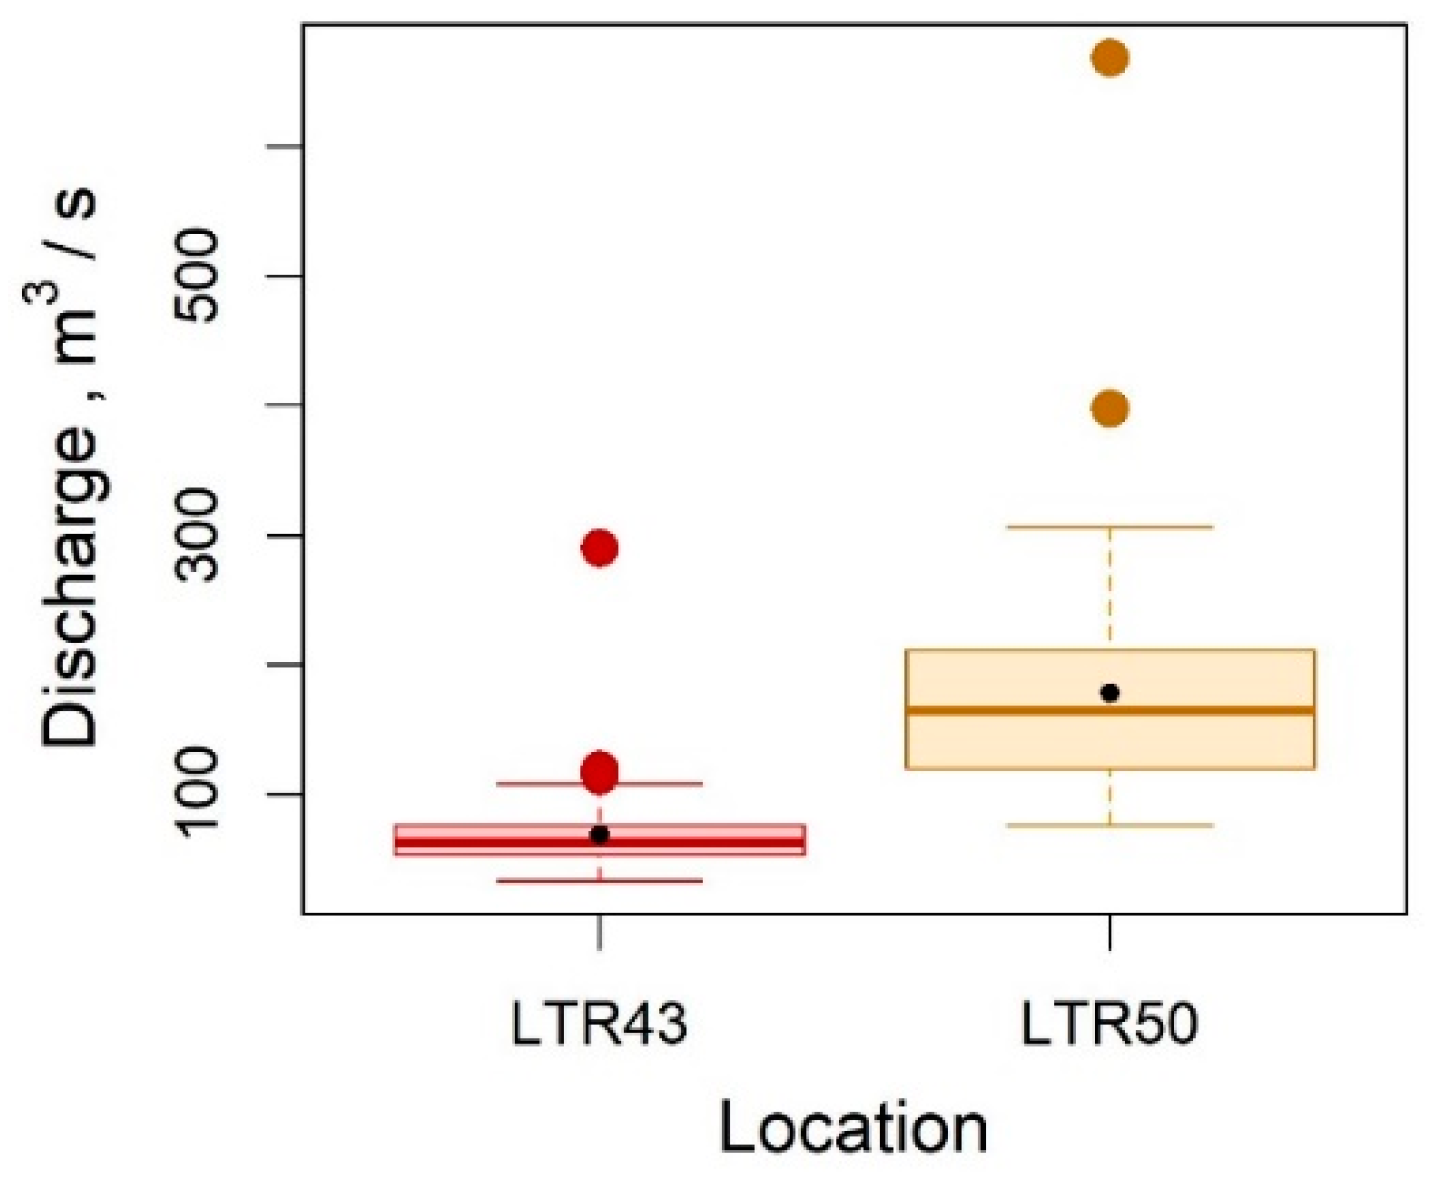
Figure 7 shows a graphical comparison of discharge rates with the help of rectangular diagrams.
Rectangles cover 50% of the values of variables on both sides of the median. The beginning of the rectangles show the first quartiles of the values of variables, and the end of the rectangles point to third quartiles. Horizontal lines dividing rectangles into two parts are the medians of the values of variables (second quartile). The black dot indicates the averages of the values of variables, and the circles point to exceptions. The heights of rectangles show spreadsheets. The depicted diagrams display there are several distinct observable values of discharge in both Vilnius and Kaunas regions, and, as a result, the average values of discharge are higher than the median ones. The spread of discharge values is wider in the Kaunas area compared to that of Vilnius. The charts of a similar type are presented in
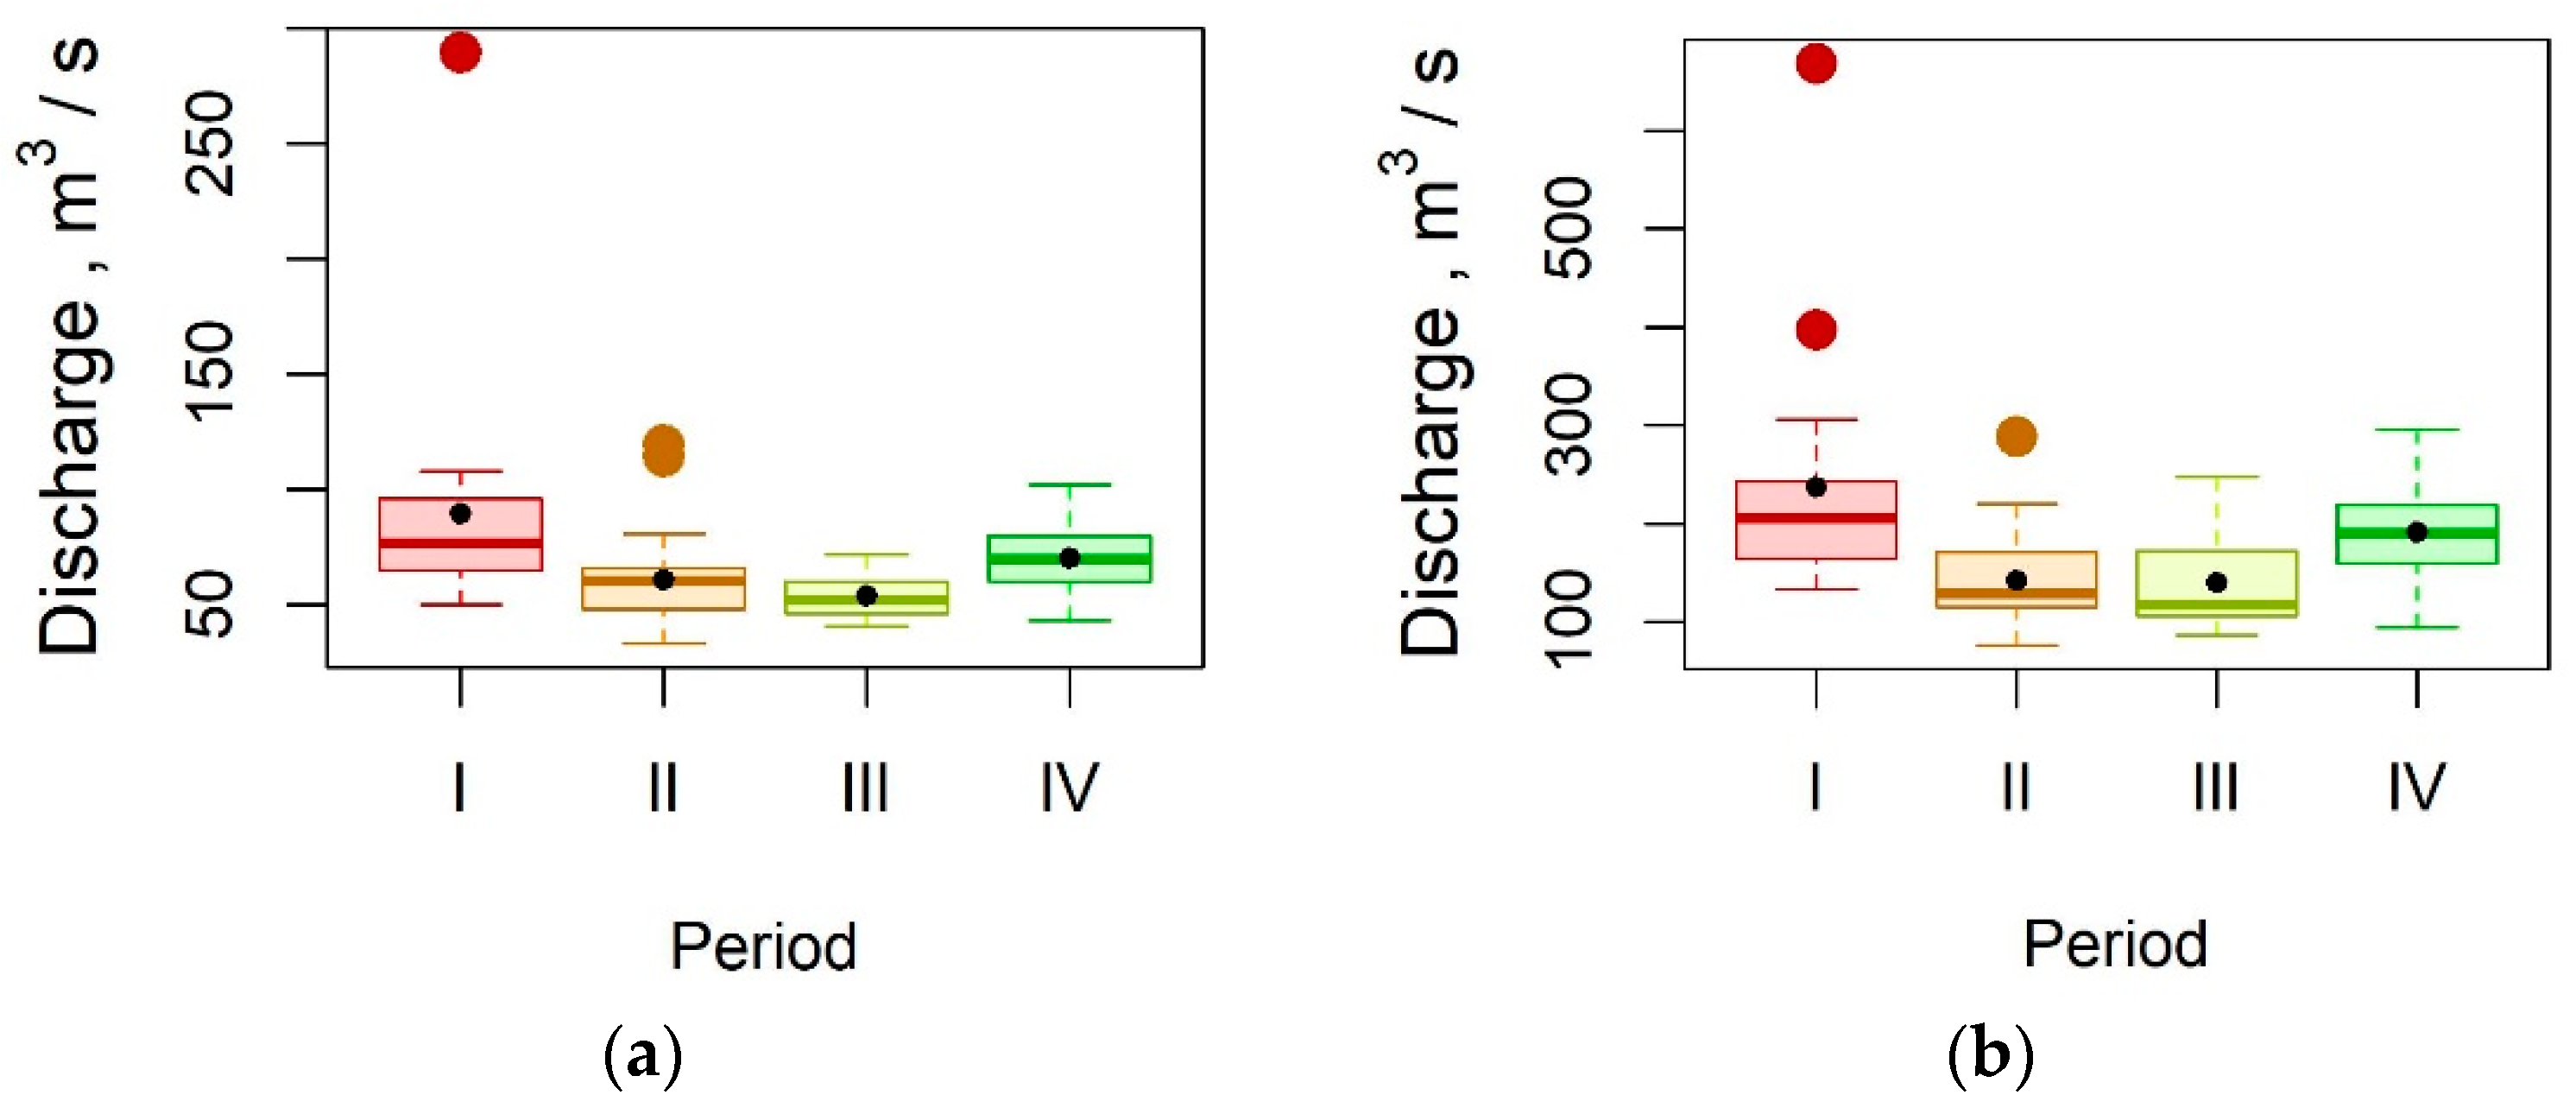
Figure 8 and assist in comparing discharge values in each of the locations according to the distinguished four seasonal periods: Period I (March, April, and May), period II (June, July, August, and September), period III (October and November), and period IV (December, January, and February).
Similar trends in collecting data on discharge were observed in both locations. In all cases, the mean values of discharge were higher than the median values. A larger difference between these two characteristics can be noticed in the periods that had very distinct values of discharge, for example, in the Vilnius and Kaunas areas during the first period.
The permitted rate of contacted catalytic iron filtration was estimated according to the empirical formula adapted from Germany [
17]:
where
—the temperature of raw water, °C;
—the thickness of the filtering filler, m;
—the overall content of iron in raw water, mg/L;
—the overall content of iron in the filtrate, mg/L; and
—the effective diameter of the grains of the filtering filler, mm. With reference to data on the town of Vileyka for the period of 2012–2016, the rates of filtering iron, oil products, and chrome were calculated according to the formula adapted from Germany, where
—temperature from the accumulated data under the thickness of the filtering filler equal to
m,
—the amounts of iron, oil products, and chrome incoming (entering) from the collected data (mg/dm
3), and
—the amounts of iron, oil products, and chrome. The effective diameter of the grains of the filtering filler was accepted to be equal to
mm, pH—from collected data. The graphical visualization of the filtration rates of iron, chromium, and oil products calculated according to the available data and applied formula is given in
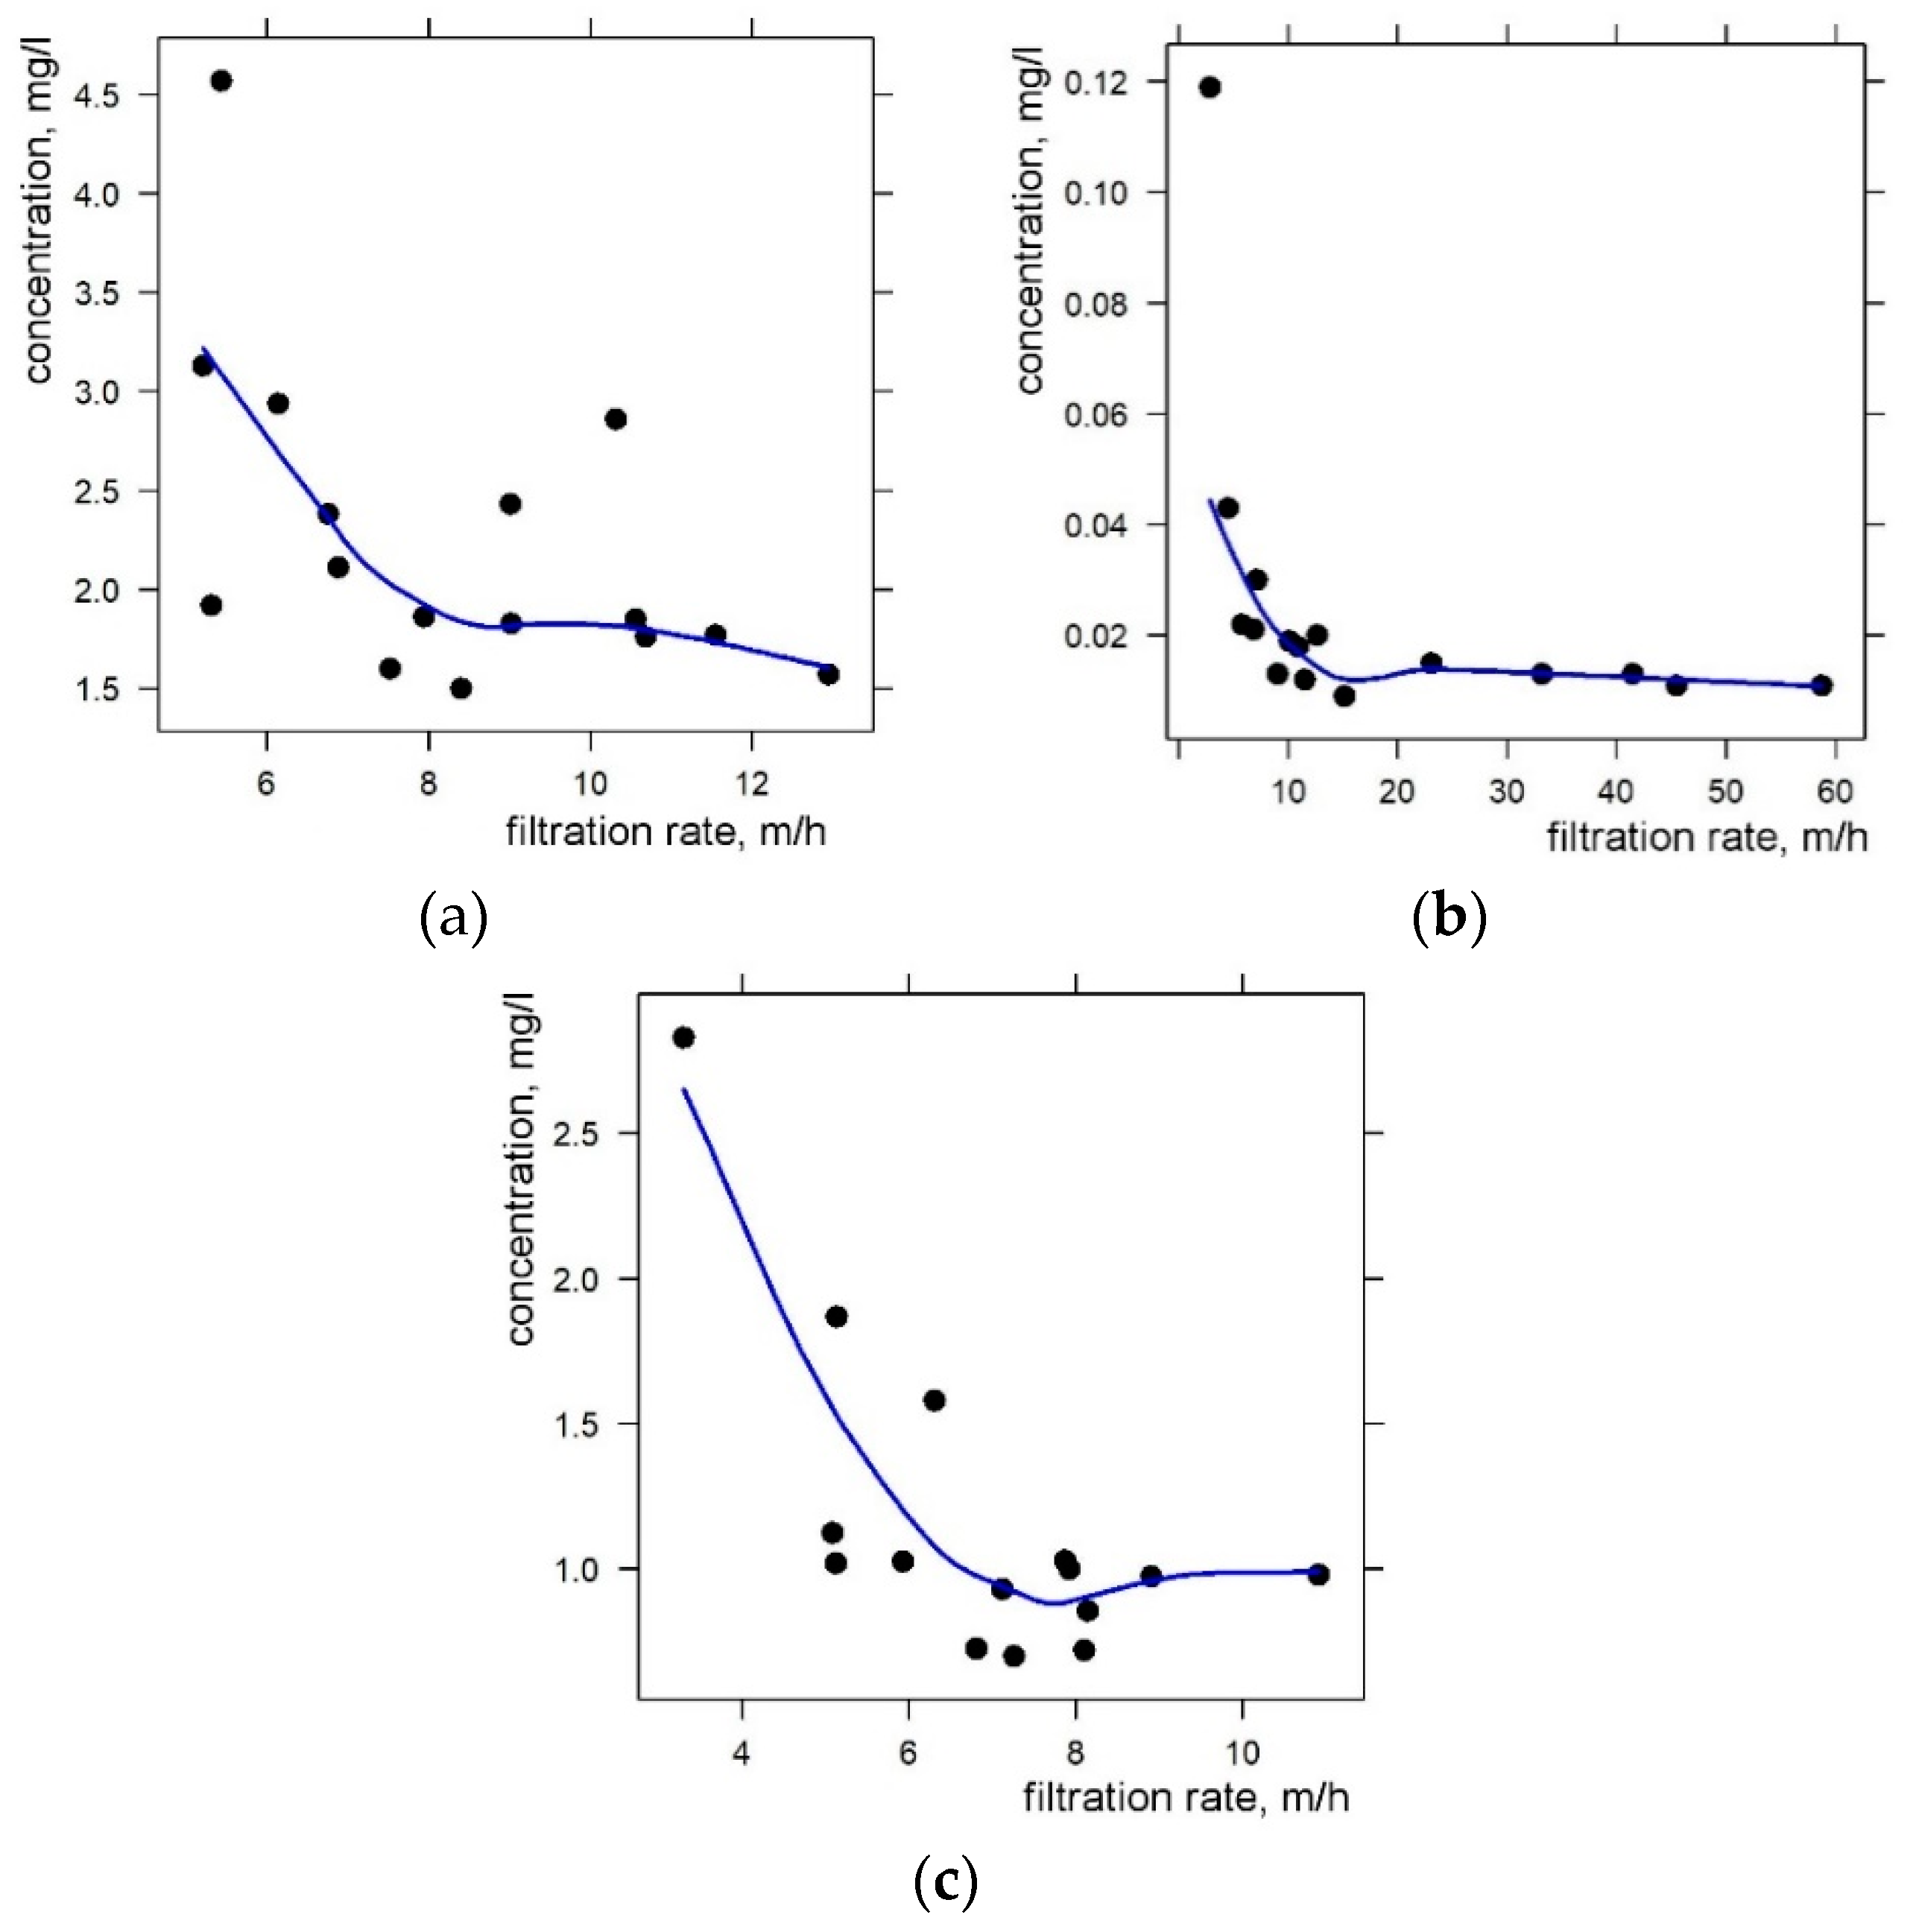
Figure 9.
Filtration has been the conventional way of separating oil products, Cr, and Fe compounds from storm-water in Lithuanian storm-water treatment plants. This technique was adopted at the Vileyka storm-water treatment plant in Belarus. Both investigated metals, Fe and Cr, are believed to function in their simple cationic forms. Our working hypothesis is based on the suggestion that the accumulation of oil compounds and metals in filtration media in storm-water treatment plants depends on the filtration rate in the thickness of the filtering filler equal to 0.5 m. Therefore, the study was aimed at investigating the effect of the filtration rate, such as fast and slow filtration, on oil products and the concentration of both metals in the storm-water accumulation system by analysing (1) the content of oil products in storm-water filtered at different rates and (2) the quantities of iron and chromium in these filtration rates.
This estimation confirms the suggestion that the filtering filler equal to 0.5 m accumulates both investigated metals, but was found to be mostly effective in a filtration rate approximately equal to 10 m/h (
Figure 9a,b). The highest concentration of Cr was observed in the case of a lower than 10 m/h filtration rate (
Figure 9b), i.e., approximately two times higher than in the highest filtration rates when the filtering filler was able to accumulate related chromium concentrations. The highest concentrations of Fe (3.0–4.5 mg/L) were obtained calculating a filtration rate up to 6 m/h (
Figure 9a). This value was approximately twice higher than the lowest concentration from a filtration rate between 10 and 12 m/h. The highest concentrations of oil products were found in association with the lowest filtration rate (
Figure 9c).
This can be explained by the formation of organic complexes in storm-water accumulation facilities. Iron and chromium can be accumulated in the filtering filler (0.5 m) from storm-water pipes. Under appropriate hydraulic conditions, such as high storm-water flow velocity following stagnation, it will appear in storm-water from outgoing flows. Iron and chromium compounds are found in linear statistical correlations because of the simplifying assumptions of the presented models (
Figure 2,
Figure 3,
Figure 4 and
Figure 5). The formation of concentrations below 1 mg/L of the investigated oil products with filtration rates between 6 and 10 m/h reflects the nature of reactions controlling their sorption and is actually dominated by different functions, such as adsorption and desorption. The frequency of the failure to fully utilize the system (approximately 57% of the designed output) indicates that parameters for the water system have not been accurately determined. Although ponds are an integral part of our landscape, there is no doubt they have an effect on the quality of river water [
3,
8,
14,
15,
16].

 ,
, 


