Article

How to Effectively Improve Pesticide Waste Governance: A Perspective of Reverse Logistics

1
School of Political Science and Public Administration, East China University of Political Science and Law, Shanghai 201620, China
2
College of Environmental Sciences and Engineering, Peking University, Beijing 100871, China
*
Author to whom correspondence should be addressed.
Sustainability 2018, 10(10), 3622; https://doi.org/10.3390/su10103622
Submission received: 19 September 2018 / Revised: 5 October 2018 / Accepted: 6 October 2018 / Published: 10 October 2018
(This article belongs to the Special Issue Rural Sustainable Environmental Management)

Abstract

:
With the development of modern science and technology, agricultural production and quality have made major breakthroughs, followed by more and more pesticide waste. Pesticide waste refers to the packaging of pesticide residues. Pesticide waste will cause great damage to soil, water and human health, seriously affecting the ecological sustainability. Most of the existing literature is theoretical articles, and few empirical studies are provided on how to improve pesticide waste management. In this paper, a set of reverse logistics network models of pesticide wastes is constructed, and the framework of reverse logistics is used to realize the efficient recovery and treatment of pesticide wastes. The problem of how to collect pesticide wastes and how to optimize the location and flow allocation of facilities such as recycling center and treatment center was solved. The weights of the factors affecting the reverse logistics network model are determined by using the network analytic hierarchy process. Under the conditions of minimizing the cost and minimizing the negative externality, the mixed integer model programming method is used to make the optimal location decision and flow distribution. Finally, taking the JT area of China as an example, the results of the reverse logistics network model of pesticide wastes are demonstrated. The results show that the scheme is feasible.

1. Introduction

Pesticide wastes have become one of the most serious environmental pains and difficulties in the world because of their high risk and universal use. Forming a better environmental control mechanism and gradually solving the environmental pollution caused by pesticide wastes is the main topic of environmental control at this stage [1]. Pesticide waste refers to the packaging containing pesticide residues. If this waste is discarded at will, it will cause irreversible damage to soil, water and human health [2]. In view of the high risk of pesticide wastes, this paper proposes a recycling mechanism based on reverse logistics network [3]. Reverse logistics refers to the process in which product information flows from the downstream of the supply chain to the upstream efficiently and cheaply [4]. Reverse logistics network of pesticide wastes starts from the individual farmers, and realizes the efficient logistics of pesticide wastes and alleviates the damage of pesticide wastes to the environment by optimizing the location and flow allocation of the recovery and treatment links. In terms of writing arrangement, this paper examines the relevant theories of pesticide waste management, then reviews the theoretical context of reverse logistics, and finally puts forward a theoretical framework for pesticide waste recycling and applies the theoretical framework to the construction and analysis of the full text.

1.1. Review of Pesticide Waste Governance Theory

Due to the irreversible damage to the environment pesticide wastes can cause, how to deal with pesticide wastes has aroused extensive discussion among scholars. Generally speaking, there are mainly three types of solutions: Biochemistry, investigation and evaluation, and policy recommendations [2,5,6,7,8,9]. Biochemistry focuses on exploring the treatment process of pesticide wastes by applying new technologies to decompose and harmless pesticide wastes. Foo and Hameed discussed the great harm of pesticide waste to surface water and groundwater, and proposed the method of using activated carbon to control the waste water of pesticide [5]. Some scholars have proved by experiments that nano titanium dioxide can remove harmful substances from pesticide wastes [7]. Biobeds has also been proven to be a low-cost and feasible way to treat pesticide waste [8]. Biofilters and organic reactors can effectively clarify pesticide wastes and reduce the toxicity of pesticide wastes [10]. The use of Fenton Agents can effectively deal with phosphorus containing pesticide waste and reduce its harm [11].
Investigation and evaluation usually reveal the enormous harmfulness of pesticide wastes to the environment by case or experiment, and use both evaluation models. In the rural area of Pieria in Greece, 30.2% of peasants dumped empty containers in the fields, 33.3% of peasants threw them into irrigation canals and streams, 17.9% of farmers burned empty containers in the open flames, and 11.1% of peasants threw empty containers in the public waste [6]. Some scholars have conducted structured surveys of rural areas in northern Thailand, and found that farmers do not have a good response to pesticide waste and are prone to purchase or use inappropriate pesticides [12]. The report on pesticide waste in Tanzania shows that farmers generally lack the knowledge of safe use of pesticides. Specifically, they do not have the habit of keeping pesticide waste labels and cannot properly handle pesticide waste. Thus, pesticide safety education for farmers needs to be improved urgently [13].
Policy recommendations emphasize the use of policies, systems and norms to restrain pesticide wastes, so as to make them in a controllable state and reduce environmental pollution. In view of the pesticide hazards and poisoning in Costa Rica and Nicaragua, some scholars have conducted in-depth case studies to clarify that international regulation and supervision and national sustainable development policies are the only way to reduce pesticide waste poisoning [14]. Family-level pesticide management is an ideal policy tool for the treatment of pesticide wastes in the Mekong Delta, Vietnam [15]. Some scholars have investigated the farmers’ knowledge of pesticides in the Weihe River Basin of China, and put forward that it is an inevitable requirement for modern pesticide waste management to strengthen propaganda and education among grass-roots farmers and popularize pesticide waste knowledge [16]. The treatment process of pesticide wastes should comprehensively consider land treatment, sludge treatment and sewage management, and formulate better plans to solve the environmental hazards of pesticide wastes to the greatest extent [17,18].

1.2. Collation of the Theory of Reverse Logistics

Reverse Logistics (RL) is a series of activities which includes fix, reuse, reproduction and recycle [4]. Some scholars believe that reverse logistics refers to a series of operations which is from collections of products at consumer level to reprocessing such collections [19]. Fleischmann argued that, contrary to the traditional forward logistics, reverse logistics refers to the planning, implementation and control process of efficient and economical reverse logistics flow from the downstream of the supply chain to the upstream members in order to obtain the recyclable value of second-hand products and dispose of final waste reasonably [20]. There are four driving factors of reverse logistics: Economic, legislation, corporate responsibility and environmental protection [21]. What is more/besides, reverse logistics generally includes recovery, inspection and treatment decision-making, product disassembly, reprocessing, final waste disposal and so on. Recycling refers to the collection, transportation, storage and baling of waste [22]. The research contents of reverse logistics can be divided into two parts: Network structure design, inventory and distribution management of reverse chain [23]. This paper will discuss the reverse logistics mechanism of pesticide waste from the perspective of network structure design.

1.3. An Analysis Framework of Pesticide Waste Recycling Based on Reverse Logistics

At present, academia focuses on the study of reverse logistics of packaging waste. Kroon [24] used a stochastic programming method to establish a mathematical model of reverse logistics for reusable transport packaging, and planned the storage quantity and transportation route of waste packaging. Pati [25] studied the reverse logistics network of paper packaging waste recycling. Through the in-depth analysis of the reverse logistics network structure, a solution to the location problem was proposed. Castillo [26] modeled the production and distribution of reusable bottled containers, using differential equations to analyze the reverse logistics network design model that combines production and distribution models. Regarding the research on reverse logistics of pesticide waste, some scholars believe that there are two main objectives to sort out the reverse logistics of pesticide wastes. One is to improve the utilization of resources. The second is to recover the waste which is harmful to the environment and avoid long-term harm [27].
Reverse logistics generally include commercial returns, maintenance services, end of product life, and packaging recycling, while the reverse logistics of pesticide waste belongs to packaging recycling [28]. However, the extant application of reverse logistics framework mostly focuses on the process and flow data design of network structure, with less attention paid to the network structure environment of pesticide waste, especially the quantity and relationship of various subjects. Lee and Dong [29] divided reverse logistics participants into five categories: Recycling suppliers, recycling collectors, recycling processors, re-distributors, and customer markets. The quantitative reverse logistics model of pesticide waste is lacking in the current academic circles and is undoubtedly of great significance. In view of this, this paper attempts to establish a quantitative recovery mechanism for pesticide waste reverse logistics [1].

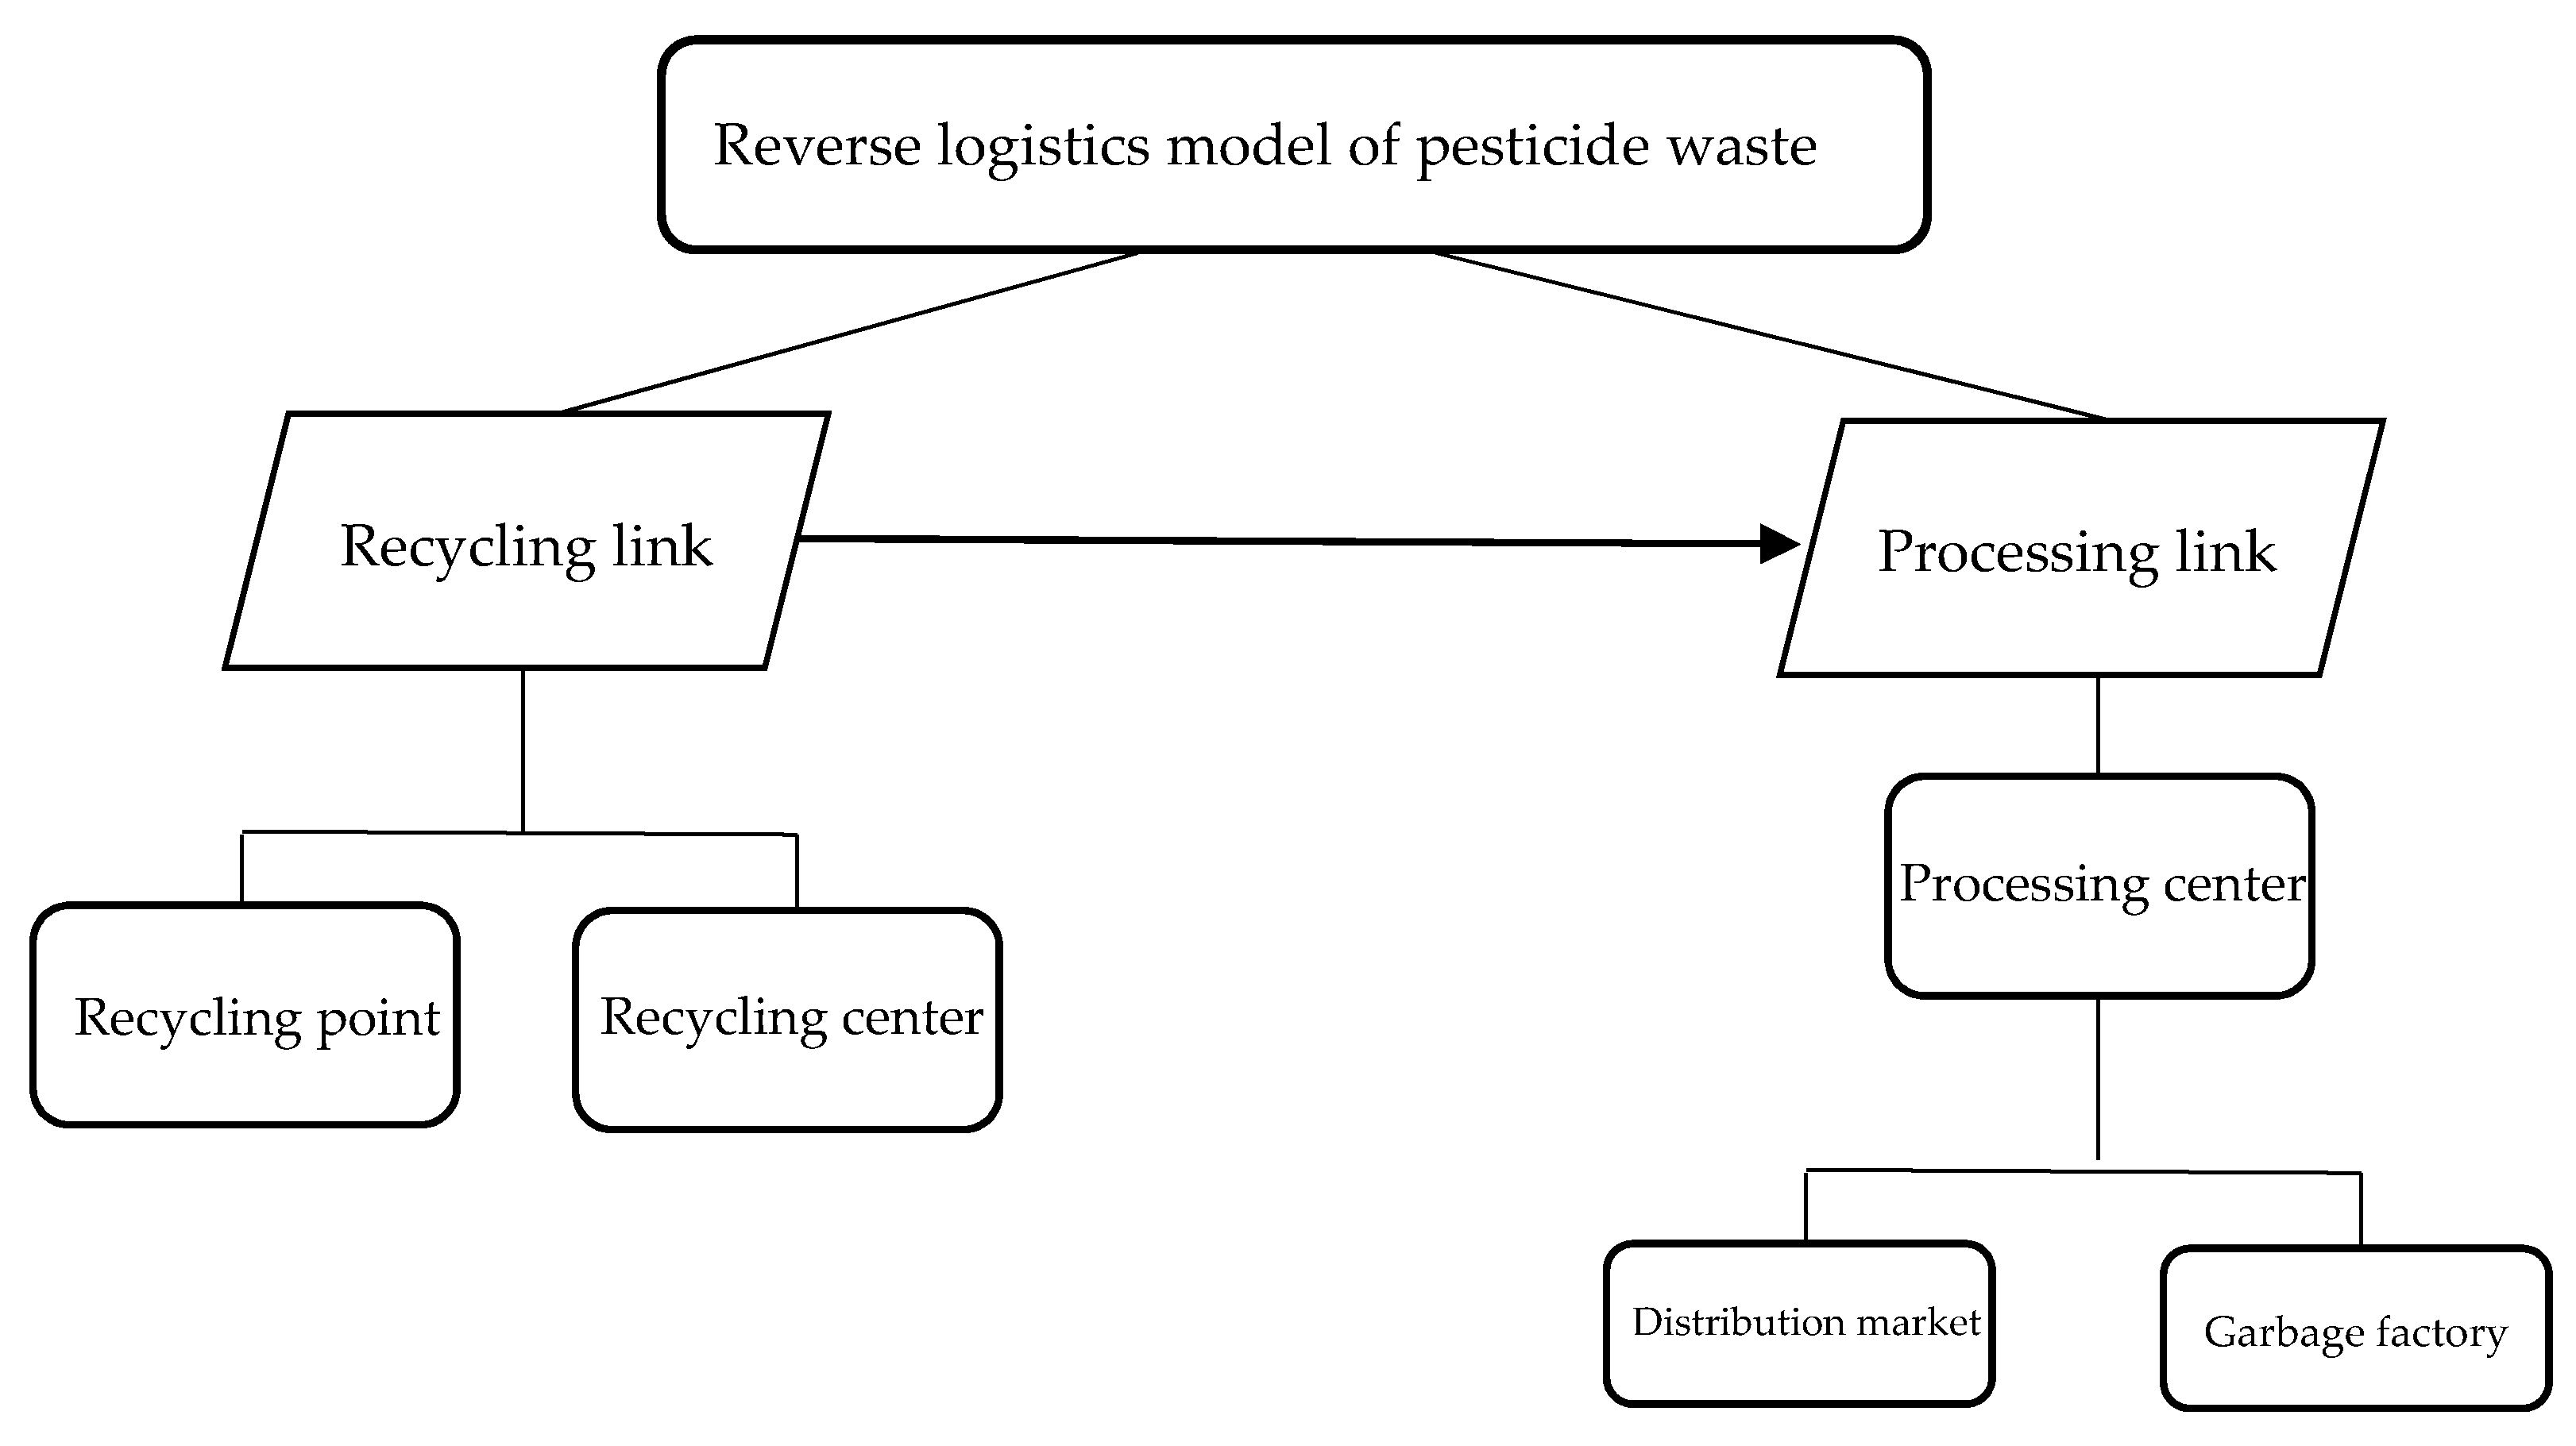
2. Reverse Logistics Model of Pesticide Waste

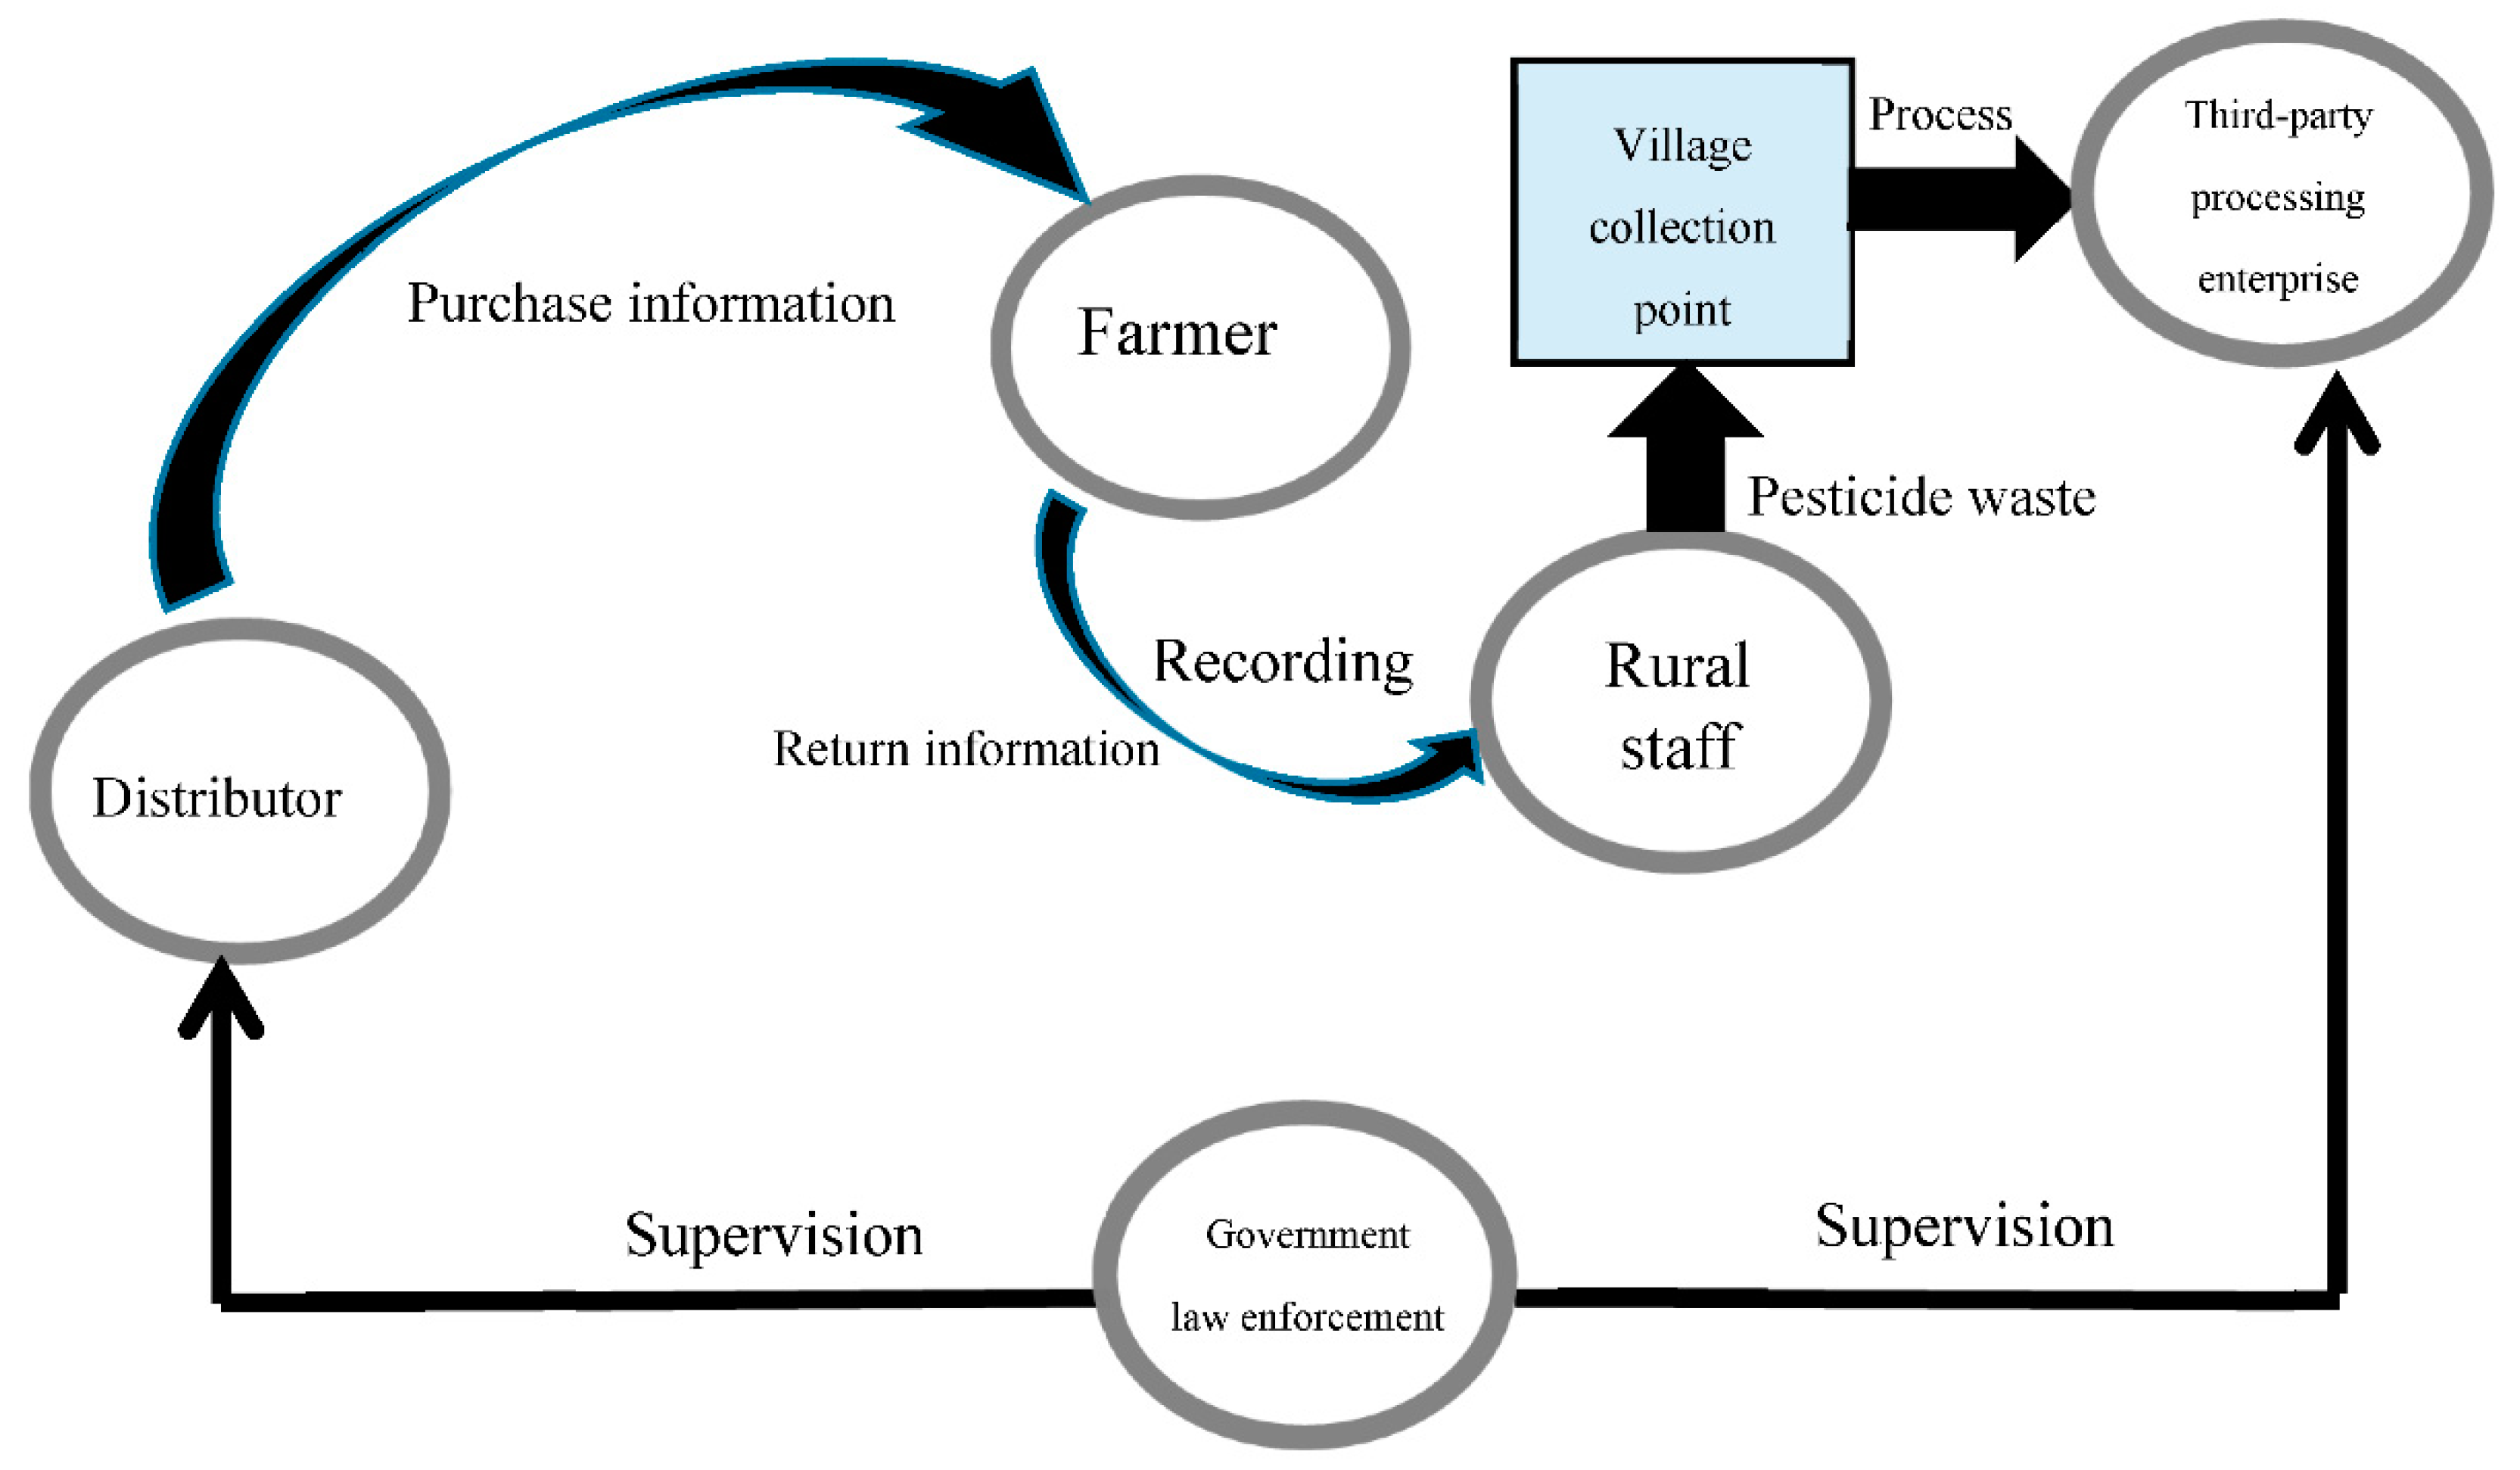
2.1. Overview of Pesticide Waste Reverse Logistics Model

In this section, we will introduce the operation mechanism of reverse logistics in pesticide waste, including how it is collected, and how to transfer etc. As shown in the Figure 1, there are two main links in our reverse logistics model of pesticide waste, namely, recycling and disposal. The recycling link is the starting point of the reverse logistics model of pesticide wastes, and the recycling point is the smallest recycling base, mainly distributed in rural areas, responsible for receiving individual pesticide wastes or pesticide wastes scattered in villages; the recycling center is the recycling base under each urban area, and its service scale is larger than that of other cities. The recycling point: Usually every village has a recycling point; the processing link is a general process of reverse logistics of pesticide wastes, usually transferred from each recycling center to each treatment center, according to the quality and harmfulness of pesticide wastes received by the treatment center will be divided into two categories, one can be processed and reused. This kind of agriculture drug wastes are generally less harmful; the other kind is transported to solid waste treatment centers or garbage factories and cannot be reused. This kind of pesticide wastes is more harmful.
In order to put it into practice, several questions need to be addressed: First, how to set up the location of the recycling center, so that the transfer cost between the recycling point and the recycling center is smaller; similarly, the location decision of the treatment center, the distribution market and the garbage factory is needed; After that, according to the actual local pesticide waste recovery, the network analysis model is used to optimize the flow distribution of each recycling center, treatment center, distribution market and garbage factory.

2.2. Recovery Link

The recovery link is the starting point of reverse logistics of pesticide wastes. Effective recovery links can make the reverse logistics mechanism run smoothly. In pesticide waste recycling, our primary objective is to make farmers, without concealing, hand over all their purchased and used pesticide waste, as much as possible, to control its pollution. Therefore, in the recycling process, we discuss how to recycle the recycling points more effectively. This paper constructs a set of methods similar to library lending information management, through the management of pesticide wholesale and retail information (involving pesticide dealers’, from pesticide manufacturers, purchase information, and farmers’ purchase information from distributors), and in accordance with the recovery standard of not less than 90%, farmers are strictly required to return the purchased pesticides waste. The scheme mainly consists of three steps: (1) Input registration and verification; this stage focuses on pesticide purchases, including the quantity, batch, model and so on. Pesticide manufacturers distribute a batch of pesticides to pesticide distributors (agents, retailers), and then local government agricultural staff verify and register the sales and purchase of pesticides from distributors and manufacturers to grasp the main source work of the region; (2) registration of the sales side; this phase of the theme is pesticides. When farmers purchase pesticides, they should provide identity cards to qualified pesticide dealers. The dealers should do a good job in the registration of the date, model and quantity of the purchaser’s pesticide purchases to provide information for the recycling work; (3) the registration and verification of the output port. This stage is the follow-up process of return of pesticide wastes by farmers. Local government agricultural workers are responsible for registering agricultural pesticide wastes returned by farmers and verifying the authenticity and regularly assessing them.

2.3. Location Decision and Traffic Optimization

At the recycling point level, we pay attention to establishing an effective mechanism to ensure the amount of recovery as much as possible. In the process of reverse logistics model, calculation and quantification are the basis. We need to accurately allocate the location of recycling center, treatment center, distribution market and garbage yard according to the local amount of pesticide waste recycling, and reasonably plan its flow, so as to minimize the overall cost of reverse logistics network. Additionally, the number of pesticide waste disposals have reached the maximum.

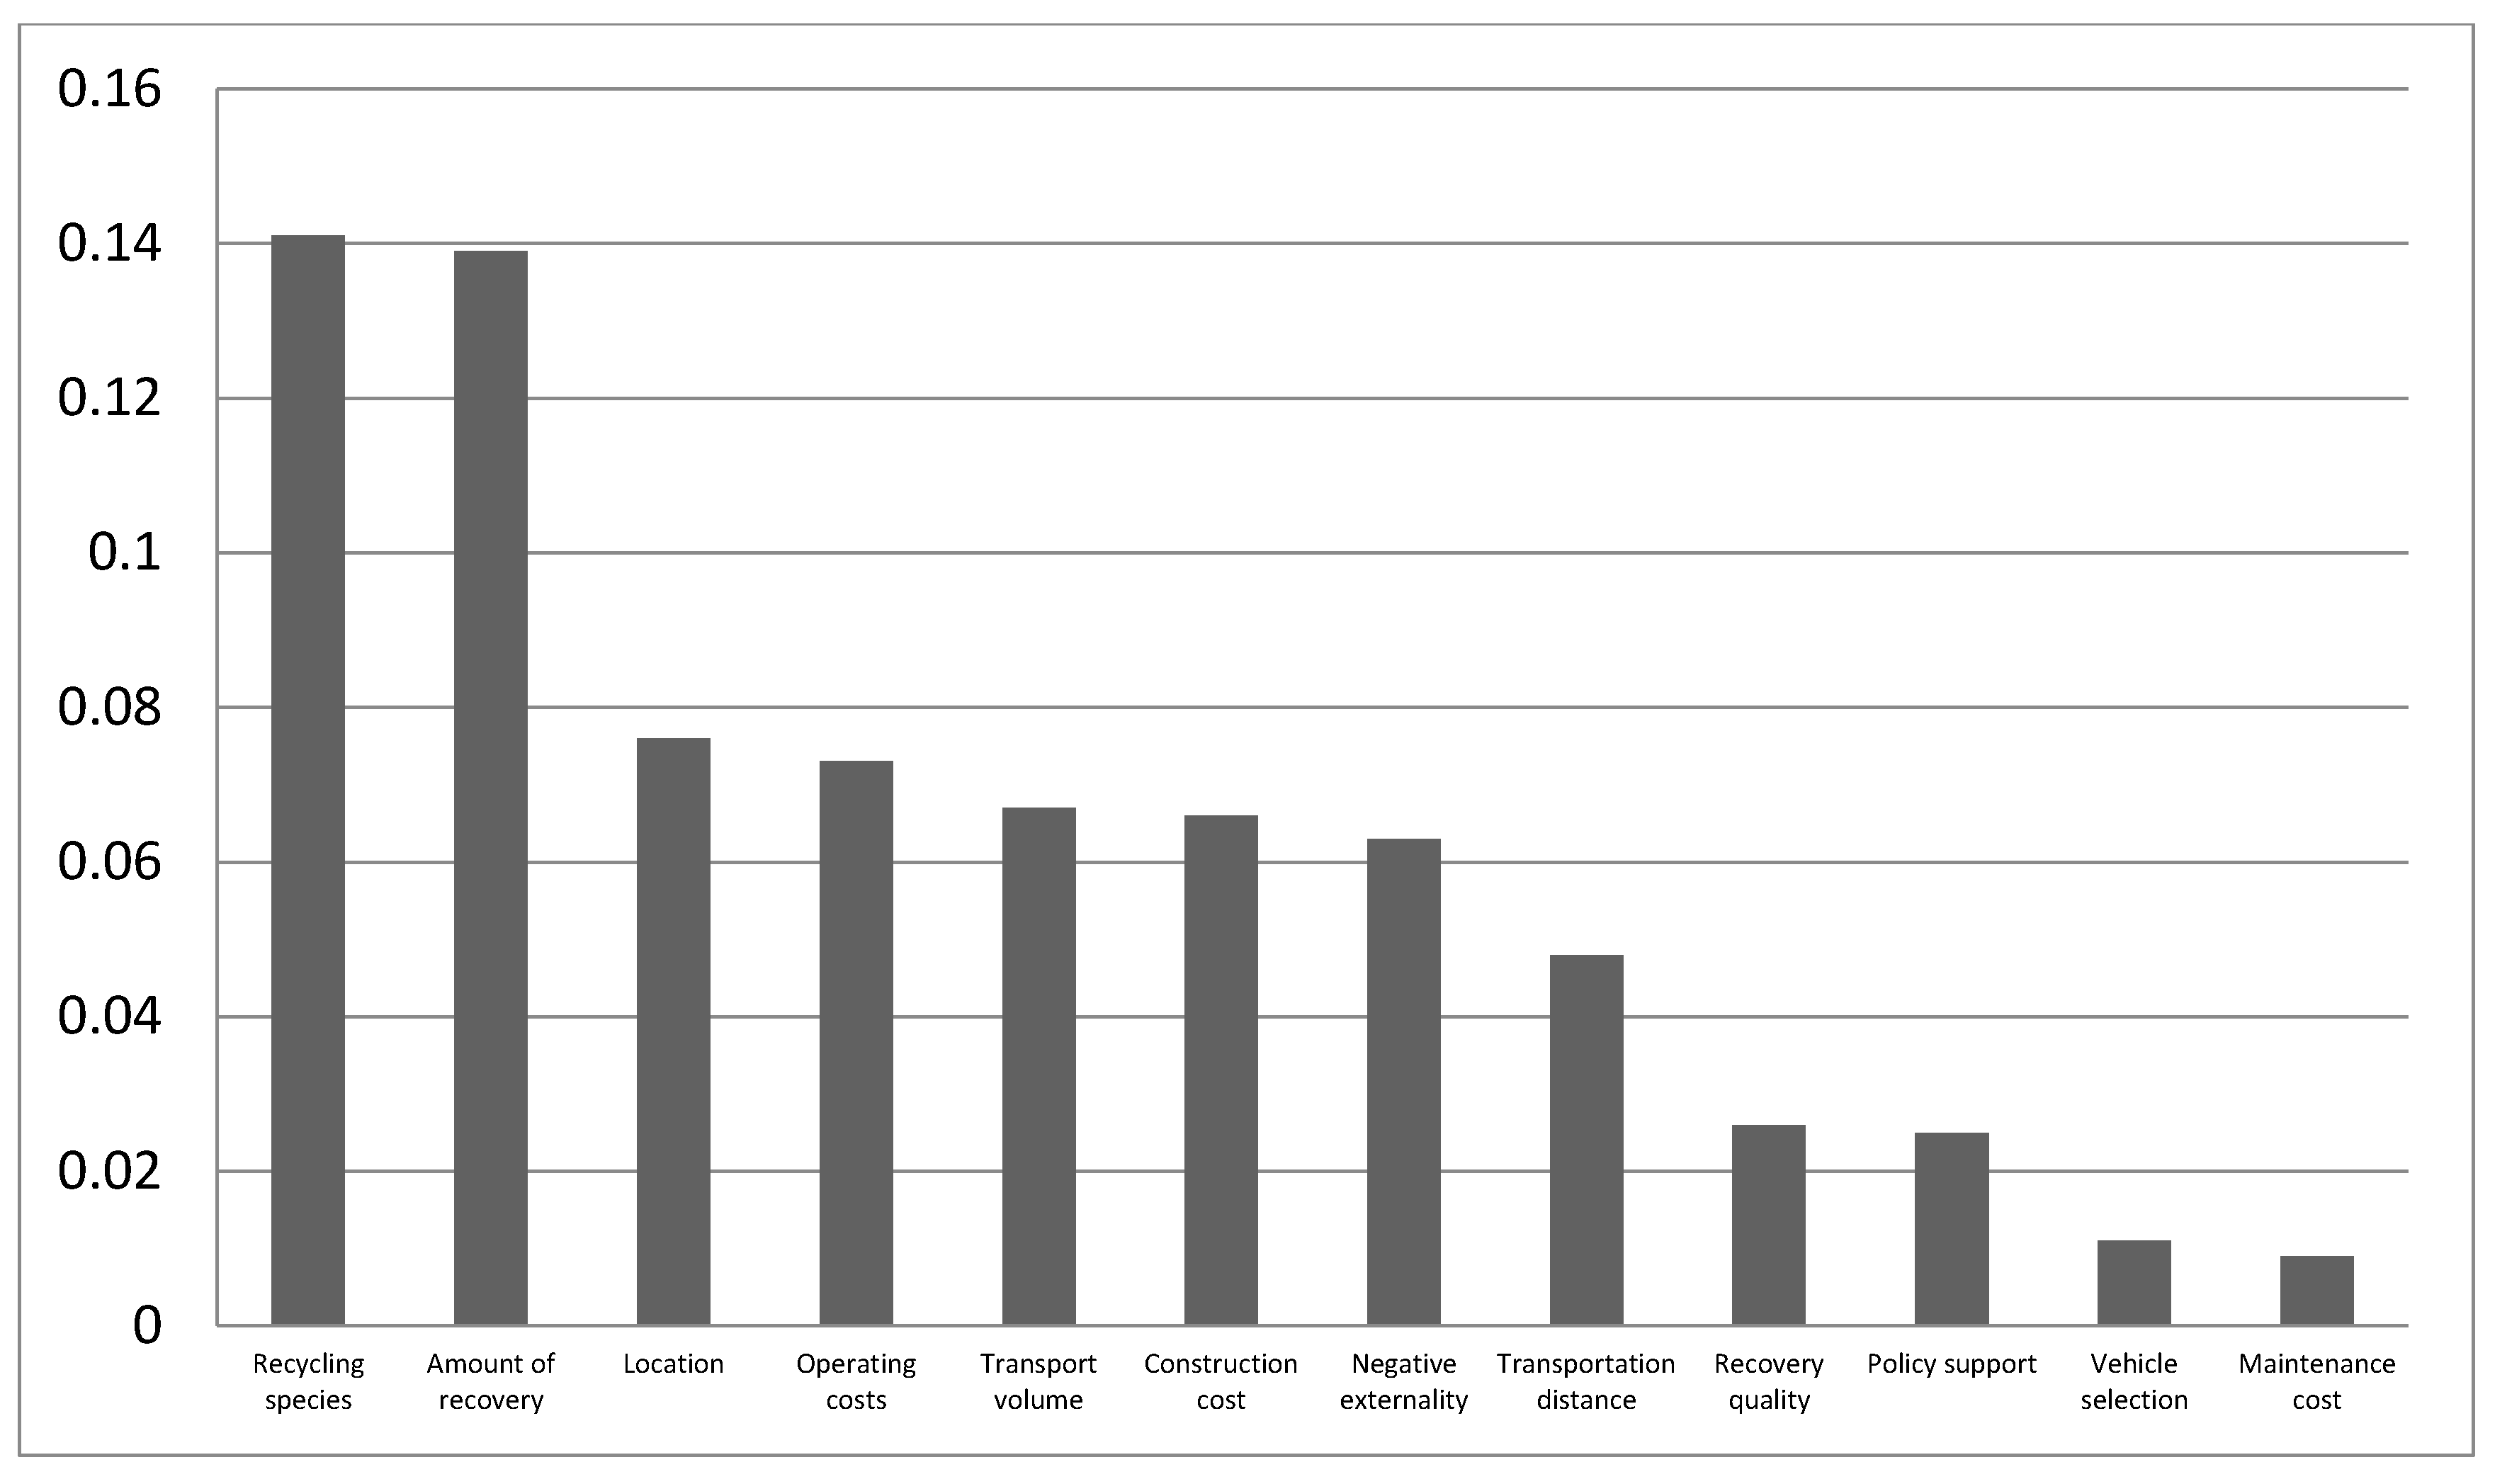
2.3.1. Weight of Factors Affecting Reverse Logistics Network

Many factors affect the pesticide waste reverse logistics network, so it is necessary to define the weight of many factors clearly. However, there is a complex coupling relationship between the various influencing factors, which constitutes a complex network, and the ranking of influencing factors can be obtained only through network analysis. The Analytic Network Process (ANP) provides a scientific decision-making method for the sequencing analysis of influencing factors and is a systematic method for solving complex problems. ANP has a relatively simplified quantitative function, which requires a certain step of quantitative solution process, can be analyzed by Super Decision software.
As shown in the Figure 2, ANP divides the network system into two parts: The control layer and the network layer. The first part is the control layer, which means that all decision-making criteria are governed by objectives; the second part is the network layer, which refers to the interaction between the elements in the element group layer, and the two parts constitute the network of ANP.
The basic solution process of network analytic hierarchy process is as follow:
(1)
Establish a hierarchical network structure and analyze the relationship between elements.
(2)
Construct pairwise judgment matrix. A judgment matrix is constructed for each element of the network model in which the mutual dependence is present. That is, the importance of the i factor and the j factor of the same level with respect to an influence factor of the upper layer is represented by a relative weight a i j .
(3)
Consistency test. The consistency test is mainly to verify the rationality of the judgement matrix and prevent the inconsistent logic. If the consistency coefficient CR < 0.1, then the weight can be accepted. Among them, it is necessary to judge the maximum eigenvalue λ max of the matrix.
λ max = 1 n i n S W i W i , S W i = ( a 11 a 12 a 13 a 21 a 22 a 23 a 31 a 32 a 33 ) ( w 1 w 2 w 3 )
Calculate the judgment matrix consistency C R = C I R I , C I = λ max n n 1 , and perform a table lookup analysis of R I .
(4)
Constructing an unweighted hypermatrix will fill in the hypermatrix vector through the normalized weight vector of consistency test. Then get the super matrix w . The normalized vector A is obtained by comparing two pairs of importance with the general objective as criterion and the element group as sub-criterion.
(5)
Establish a weighted supermatrix and calculate the limit super matrix. By multiplying matrix w and A , we can get the weighted super matrix w ¯ , and the column of weighted matrix is 1.
w ¯ = w i j a i j ,   i = 1 , 2 , , n ;   j = 1 , 2 , , n
Limit hypermatrix is the stability of weighted hypermatrices, that is, the power of the weighted hypermatrices is large enough to make the values of each row of the weighted hypermatrices the same, and the column vectors of the matrix represent the global weights of each factor.
lim r w ¯ r
(6)
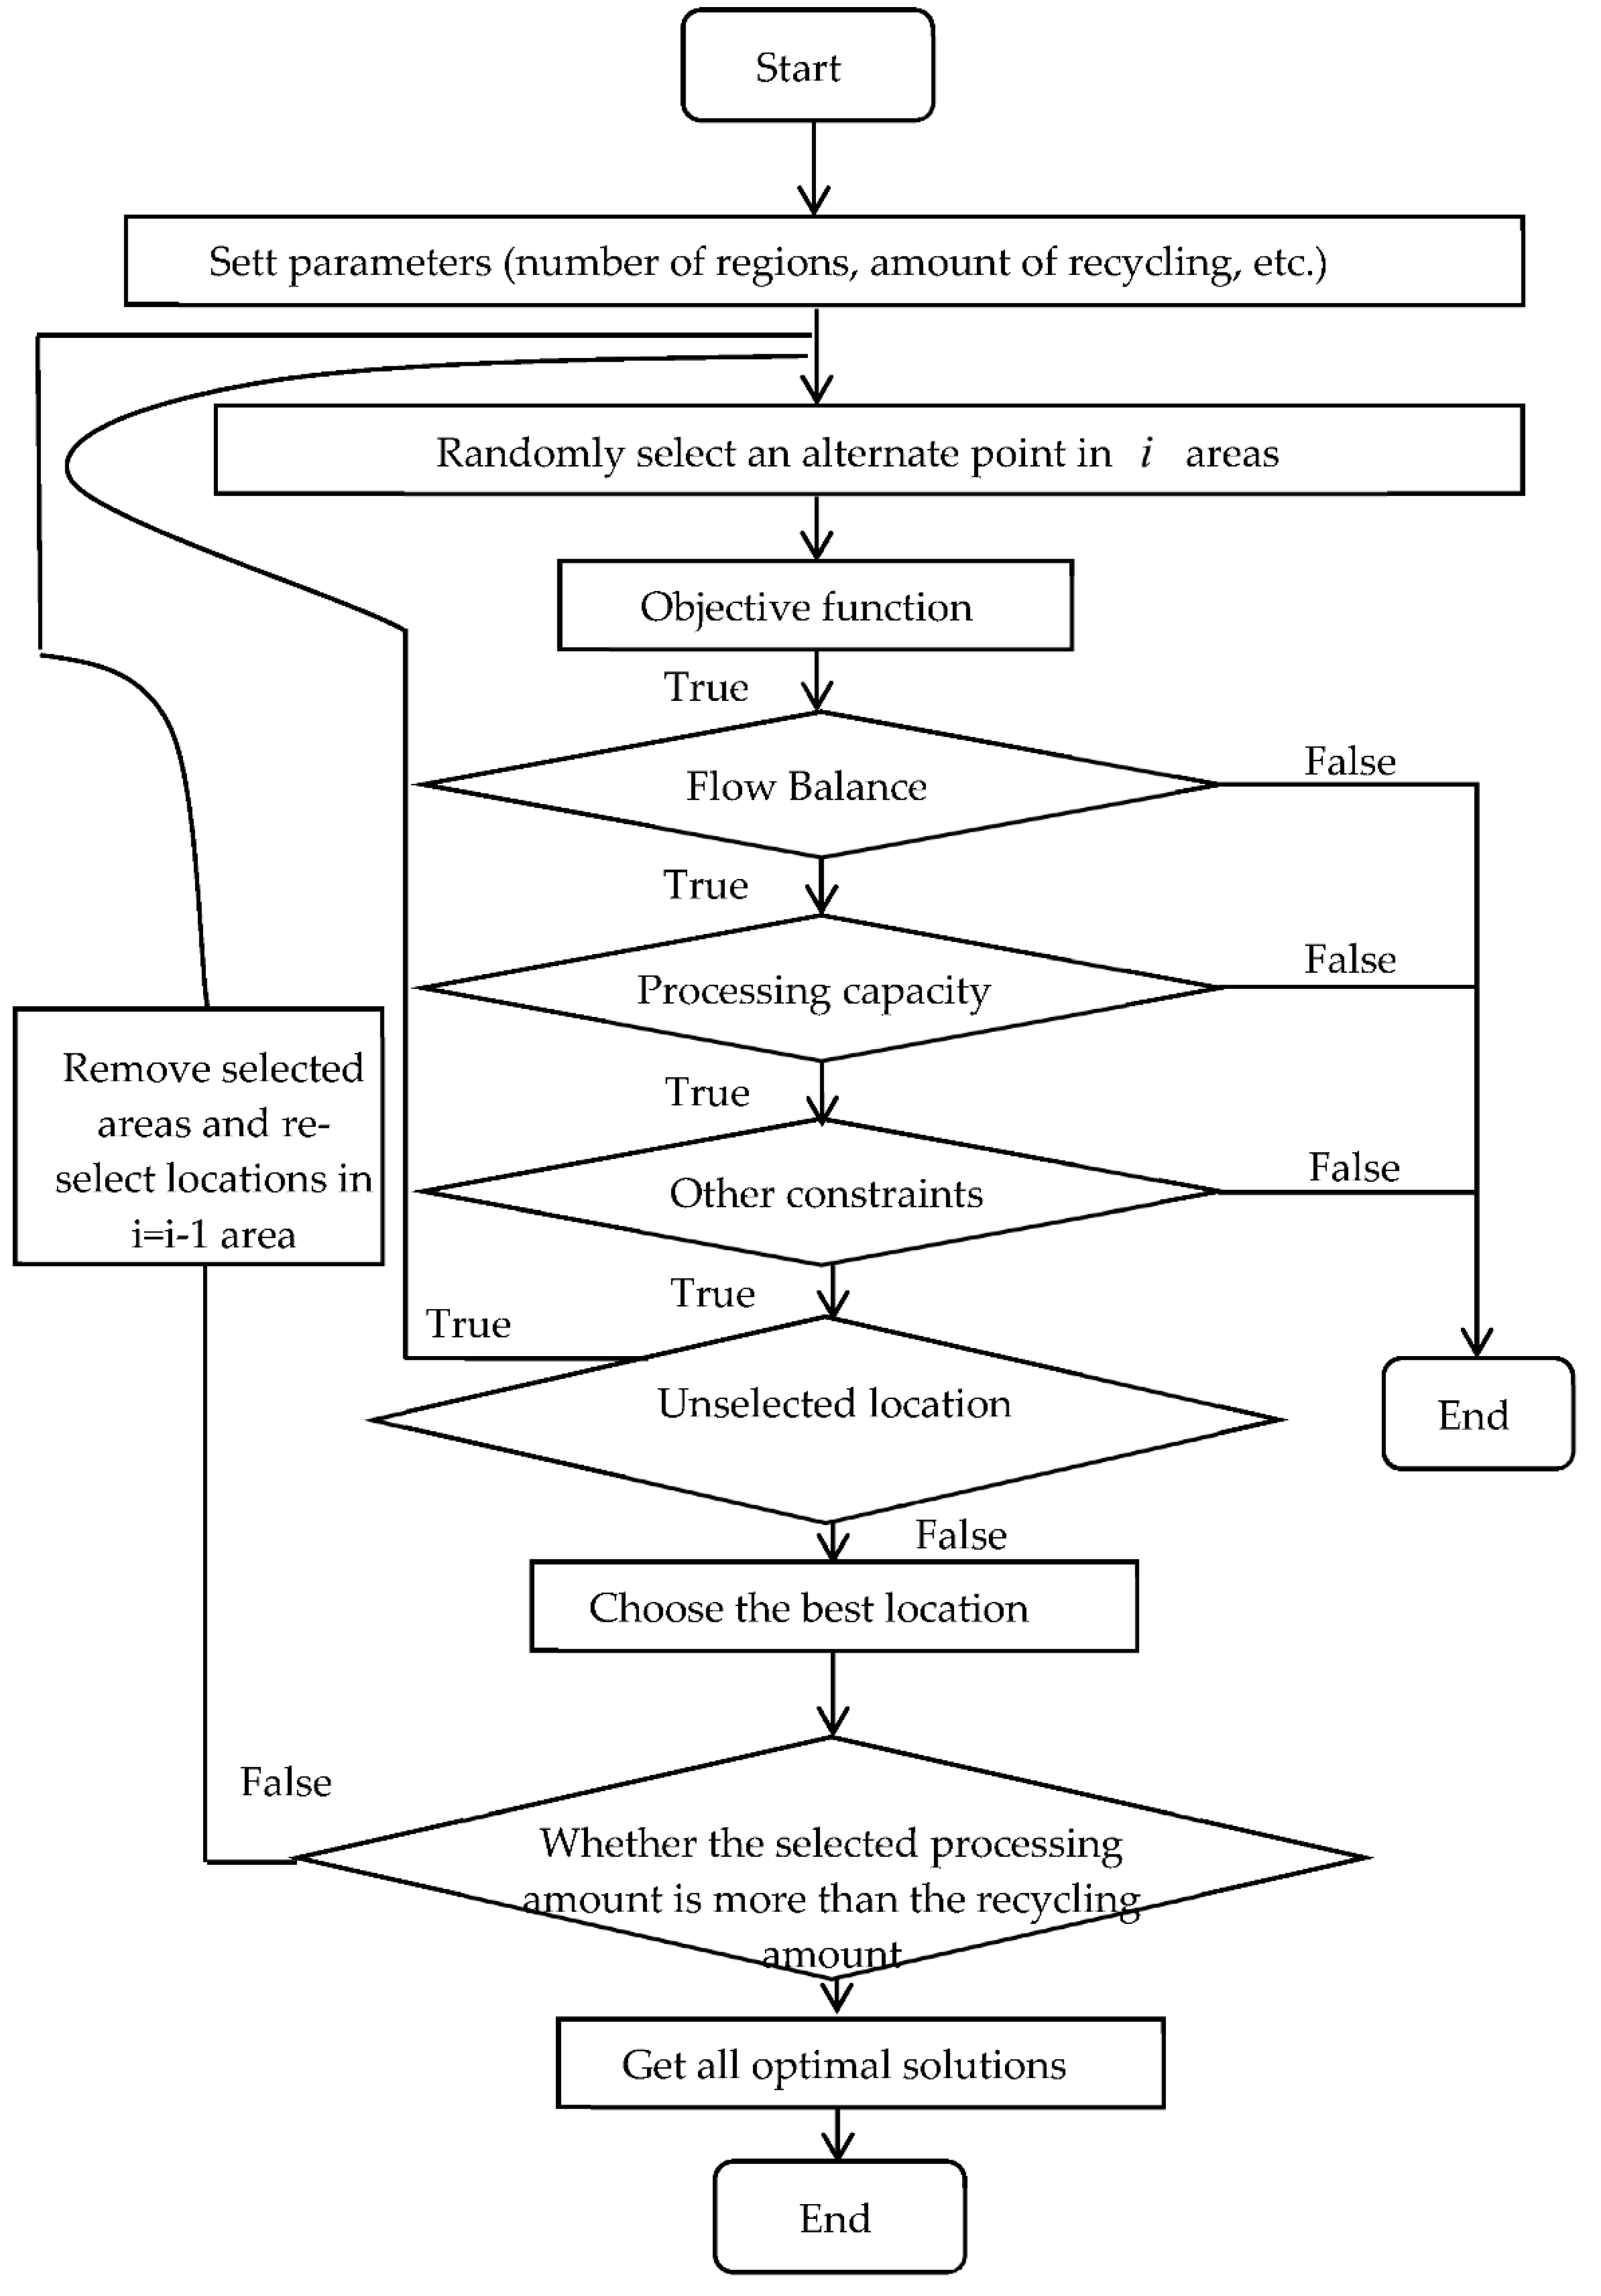
Generating the global weight of the index and ranking the dominance. Figure 3 is the flow chart of Super Decision Software.
Figure 4 is the ANP network structure model of influencing factors of the pesticide waste reverse logistics system. There are four factors affecting the reverse logistics network of pesticide wastes, which are infrastructure, social impact, transportation cost and recycle attributes. The infrastructure category can be divided into “construction cost”, “operation cost”, “maintenance cost” and “location selection”; the social impact category can be divided into “negative externality” and “policy support”; the transportation cost category can be divided into the “transport volume”, “transport distance” and “vehicle choice” three indicators. The attributes of recycled materials can be divided into three indexes: Quantity, type and quality. It should be noted that there are many kinds of pesticide waste recycling, including glass bottles, cartons, plastic bottles, trays and bags. For example, water soluble packaging is hot all over the world, including China [30]. In order to improve the model, new trends such as water-soluble packaging were given corresponding weights to the recycled species. According to the formulas above, an ANP model is constructed as follows: Since each column of the limit matrix is the global weight value corresponding to each index, the global weight value is as follows:
R = [ 0.026   0.139   0.141   0.066   0.009   0.073   0.076   0.025   0.063   0.011   0.048   0.067 ]
Figure 5 is the weights of indicators. Consider the large weight of recycling category, recycling quantity, location, operation cost, transportation volume, construction cost, negative externality and transportation distance in the establishment of pesticide waste reverse logistics network model is necessary.

2.3.2. Model Selection

The responsibility of constructing a reverse logistics network is to arrange the location, quantity and flow of facilities in the system which includes different facilities nodes and different logistics lines. The operation efficiency of the system is affected by the layout of facilities. In view of this, the location decision of facilities in the reverse logistics network plays a decisive role in the function of the whole pesticide waste model, and is also the main problem of reverse logistics network research. Currently, there are three different methods for location decision-making, namely transportation cost model, storage cost model and hybrid model.
(1) Transportation Cost Model
The transportation cost model [31] often applies the center of gravity method. The center of gravity method is a single facility location method, which is suitable for the simplest location problem. The idea is to put the logistics network demand point on a system plane, then compare the demand of each point to the weight of the object, and use the center of gravity of the object system to determine the location of the logistics network, the logistics center. In a certain area, there are several demand points with different coordinates, and the coordinates of the logistics center are calculated by mathematical methods. The goal of the solution:
min Z = l i f i d i
Through mathematical processing, the coordinates of the location of the candidate facility can be obtained, that is:
d i = ( X c x 0 ) 2 + ( Y c y 0 ) 2 ,   X c = ( i n l i f i x i / d i ) ( i n l i f i / d i )
Y c = ( i n l i f i y i / d i ) ( i n l i f i / d i )
The center of gravity method does not consider local restrictions, and the degree of freedom of choice is large. Only the transportation cost is considered in the modeling, the fixed cost of the logistics facility construction and the operating cost are neglected, and the actual transportation distance is simplified, and the best place calculated by the model is difficult to find in reality.
(2) Storage Cost Model
For the storage cost modeling, Baumer-Wolff has made a successful attempt, and proposed the Baumer-Wolff method. The baumer-Wolff method is a nonlinear function to describe the relationship between the storage cost and the network size in a certain logistics level by knowing the location and demand in advance and choosing a reasonable scale of facilities to minimize the storage cost.
Z c = s c u c , v c = u c s c 2 s c
Among them, z c is the storage cost of node C, s c is dot size, u c is constant coefficient, and v c is marginal cost.
Baum’s method is used to find the best solution along the direction of decreasing storage cost. It is based on heuristic algorithm and cannot guarantee the optimal solution. Figure 6 is the schematic diagram of transportation cost model and storage cost model.
(3) Integrated Model
Mixed integer programming is an effective tool for building comprehensive models. Mixed integer model programming usually takes the lowest total cost of reverse logistics network as the objective, uses integer variables to represent facility decision variables, uses continuous variables to represent the number of facilities, facility capacity and flow, and uses constraints to represent the flow relationship between facilities to solve the large-scale and large-scale reverse logistics network system. The greatest advantage of this method is that it can reflect the overall situation of the reverse logistics system, not only reflect the fixed cost, but also reflect the variable cost, and finally get the best facilities location and construction quantity, as well as the flow of each link. Although the solution method is complex, with the help of the relevant computer software, the calculation difficulty can be greatly reduced.
Mixed Integer Model Programming (MIMP) is used to select the best location from s candidate points to minimize the logistics cost. c i j is the unit transportation cost from A i to D j . d j k represents unit transportation cost from D j to B k . P i j is the traffic volume from A i to D j . Q j k represents the traffic volume from D j to B k . Suppose Y = ( Y 1 , Y 2 , Y j ) , Y j = 1 is built on D j . Based on this, the integrated model is:
min f ( x ) = j J ( i I c i j p i j + k = K d j k Q j k ) Y j
Therefore, the mixed integer programming model is used to build the reverse logistics optimization model of pesticide waste.

2.3.3. Model Assumptions and Symbol Definitions

In this paper, the linear mixed integer programming method is used to model the mathematical model. Under the goal of minimizing the cost, the optimal location, quantity of facilities and the logistics volume between facilities are obtained. Before establishing the mathematical model, the following assumptions and simplifications need to be made: (1) Assuming that the initial recovery point capacity is infinite, other facilities investment costs, unit operating costs and transportation costs are deterministic values, independent of the period; (2) The collection of all the packages in the corresponding jurisdiction area at each collection point; (3) The transportation cost is positively correlated with the distance between the facilities and the volume of transportation. The intelligent distance of Google Map Search is used to approximate the distance between the facilities; (4) At least one equivalent facility is built for each candidate point; (5) There is no backlog of waste at the initial recycling point, that is, the waste produced on that day is recovered; (6) Waste packaging will not be damaged in the course of transportation and neglect the environmental impact of the exhaust emissions from transport vehicles; (7) Only considering environmental costs, fixed costs, transportation costs and processing costs.
a : Collection of reverse logistics collection points, a A ; b: Collection of recycling centers, b B ; c : Processing center collection, c C ; d : Distribution center; k : Landfill; m a : Recycling amount of packaging in the recycling area; N b : Fixed cost of building recycling centers; N c : Fixed cost of building a processing center; W b : Recycling center’s maximum processing capacity; l a b : Unit transportation cost of waste from collection point to recycling center; l b c : Unit transportation cost of waste from recycling center to processing center; l b d : Unit transportation cost of waste from recycling center to distribution center; l b k : Unit transportation cost of waste from recycling center to landfill; l c d : Unit transportation cost of waste from processing center to distribution center; d a b : The distance from the collection point to the recycling center; d b c : Distance from recycling center to processing center; d c d : Distance from the processing center to the distribution center; d c k : Unit transportation cost of recycled products from the processing center to the distribution center; f a : Packaging recycling cost; f b : Recycling center unit operating costs; f c : Processing center unit operating costs; f k : Treatment plant unit operating cost; X a b : Amount of packaging materials transported from the recycling area to the recycling center; X b c : Amount of packages shipped from the recycling center to the processing center; X b d : Amount of packages shipped from the recycling center to the distribution center; X c k : Amount of packages shipped from the processing center to the garbage factory; X c d : Amount of packages shipped from the processing center to the distribution center.
Based on the model assumptions and parameter definitions, and considering the weights of each parameter, we can construct a location model of the dual-objective packaging waste reverse logistics network with the lowest economic cost and the least negative social negative effect. In order to reduce the difficulty of solving, the double target is transformed into a single target.

2.3.4. Cost Accounting and Model Calculation Steps

(1) Economic Cost
The reverse logistics of pesticide wastes is recycling in a cycle form. It is transported from the recycling point to the recycling center, classified, and transported to the processing center. The processing center is processed and sent to the distribution market, thus forming a recycling cycle. Therefore, the construction function of this model is composed of three sub-functions, namely, the cost function of facility construction, the cost function of operation and the cost function of transportation.
Facility Construction Costs
The fixed cost of the facility refers to the construction cost of the establishment of the facility. The cost of the facility includes the cost of establishing the recycling center, the integrated processing center, and the distribution center.
u 1 = b B N b Y b + b C N c Y c + N d Y d
Transportation Costs
The cost of urban transportation is usually the product of three factors: Transport volume, transportation distance, and unit transportation cost.
u 2 = a A b B l a b X a b d a b + b B c C l b c X b c d b c + c C k K l c k X c k d c k + c C d D l c d X c d d c d
Operation Cost
According to the actual situation, this paper takes the product of the processing amount and the unit processing cost as the operating cost.
u 3 = a A m a f a + a A b B X a b f b + b B c C X b c f c + c C k K X c k f k
Total Economic Cost
The total economic cost is the sum of fixed cost, transportation cost and operating cost of establishing a reverse logistics network for packaging waste.
(2) Negative utility cost
The establishment of a treatment center will affect the quality of life of the surrounding residents more or less. Therefore, when establishing the objective function, it is not possible to consider the economic cost to the minimum, and at the same time, it is necessary to consider the negative environmental effects that affect residents. As the scale of facilities and processing capacity increase, the negative impact on the environment will also increase.
min ζ = ( X b c P c ( Q ) e i Y 2 )
(3) Simplification of Objectives
Convert the objective function to the following constraint:
c C ( X b c P c ( Q ) e i Y 2 ) M
(4) Establish the Objective Function
Convert the double objective function into a single objective function to find the minimum cost.
min ζ = b B N b Y b + c C N c Y c + d D N d Y d + a A b B l a b X a b d a b + b B c C l b c X b c d b c + c C k K l c k X c k d c k + c C d D l c d X c d d c d + b B a A X a b f b + b B c C X b c f c + k K c K X c k f k + c C ( X b c P c ( Q ) e i Y c )
S . t { a A b B X a b = m a a A b B X a b = b B c C X b c c C d D X c d = ε b B c C X b c c C k K X c k = ( 1 ε ) b B c C X b c b B c C X b c c C w c · Y c a A b B X a b b B w b · Y b X a b , X b c , X c k , X c d > 0 Y b { 0 , 1 } Y c { 0 , 1 } c C ( X b c P c ( Q ) e i Y 2 ) M }
Thus, the model has been established.

3. Application Analysis of Pesticide Waste Reverse Logistics Network Model

3.1. Summary

Many countries and regions in the world have corresponding pesticide waste policies and recycling systems, such as Brazil, the United States and Southeast Asia and other countries [2,32]. Brazil, which lacks advanced agricultural technology, chooses to strengthen pesticide waste publicity, achieve special education and tighten legislation to reduce pesticide waste hazards [33]. The United States has implemented strict pesticide sales registration system, starting from the beginning to reduce pesticide and waste hazards [14]. Thailand, one of the world’s major grain exporters, has chosen to develop a special management system for pesticides, strengthen the supervision of pesticides and expand restrictions so as to reduce the enormous harm of pesticide waste to environmental sustainability [34]. The most important reason for not choosing the United States, Brazil and other countries as the case background is that the agricultural development model of the United States and Brazil is large-scale mechanization, the use of mechanical spraying of pesticides, such as unmanned aerial vehicles [35,36]. This agricultural model is not complicated, and pesticide wastes do not cause great damage to the human body and the environment [37]. The reason why China is the case is that China is the largest developing country in the world [38]. In many rural areas of China, the situation is more complicated. It is normal to sow by hand and spray pesticides. Under these conditions, pesticide waste tends to cause more irreversible damage to water, soil and human body [39]. At the same time, there are still vast developing countries in the world, whose rural areas are densely populated, backward in technology, rigid in system, and have similarities and differences with China’s rural areas. Therefore, China is an ideal case background for this article [40].
It also needs to be frank that the use of China as a case background is, to a certain extent, based on the convenience of the results test. In August 2017, the author was dispatched by the Ministry of Environmental Protection of China to practice with the Environmental Protection Bureau of the JIUTAI Prefecture in Northeast China. JIUTAI (hereinafter referred to as JT) is an area in China. The main work was to visit the countryside, investigate the environmental pollution of pesticide wastes, grasp the actual situation of a large number of first-hand countryside, and understand the wishes of many farmers. The author tried this set of work in the local area. The recovery network has achieved remarkable results. The recovery mode of the local trial run is shown in the Figure 7.
The author’s investigation also covers all the main agricultural units in the JT area, including EPA, Agricultural Bureau (Agricultural Technology Extension Center, Plant Quarantine Center, Agricultural Law Enforcement Brigade), Pesticide Dealers (Agents), Farmers, Pesticide Manufacturers and so on. The investigation unit is docked with other units (government departments) by EPA through a formal process, investigating the dealers (agents) and farmers, according to the research needs and feasibility, and following the principle of as heterogeneous as possible, obtained a large number of first-hand pesticide waste treatment data.

3.2. Application of Reverse Logistics Model for Pesticide Waste—A Case Study of the JT Area

This paper takes the JT area as the experimental application area, determines the model structure according to the actual needs, uses the collected data and data as the basic data for this study, and then applies the goal optimization method to modeling and analysis. The Table 1 is the population distribution map of the JT area and the recovery of pesticide waste.
For a certain period of pesticide waste recovery, through network analysis and model optimization, the location of the lowest cost can be obtained, and the flow distribution optimization results based on the original data and location decision-making conditions can be generated.
As it is a complicated linear model, it is difficult to solve manually. In theory, absolute optimal solution cannot be obtained by means of mathematical method. Generally, relatively optimal feasible solution can only be obtained by operational research method. Therefore, we used the programming software Lingo to analyze and solve the problem, and used the branch and bound method to solve the problem. The solution process is shown in the Figure 8.
As shown in the Figure 9, by running the Lingo software, the optimal location of the recycling center, the processing center, the redistribution center and the garbage factory can be obtained through iterative calculation. The recycling centers were built in G, E, D, L and F; the treatment center was built in C, K and F. The redistribution center is built in I and garbage plant is built in the E area. After completing the location decision of facilities, the algorithm can simultaneously make the flow distribution between facilities corresponding to the location decision. Due to the large number of datas, we do not list one by one here. We only list the traffic assignment values of some non-zero decision variables. Based on the results of the flow distribution, the traffic flow distribution between the facilities shown in the Table 2 can be obtained.
In practical applications, we often encounter problems, such as whether there is enough market for redistribution, and how to deal with contaminated pesticide packaging. Therefore, in the process of establishing the model, the author, as a staff member of the local environmental protection bureau, went to the redistribution area many times to do market research. The research objects included pesticide distributors and individual buyers. According to the results of market feedback, the redistribution products were welcomed by the market because of their faster liquidity and lower prices. At the same time, for the pesticide packaging which is seriously polluted and less likely to be re-processed, it is usually chosen to be transported directly to the garbage yard or hazardous waste treatment center. In the JT area, the original hazardous waste treatment center is located at E. In the model design, in order to minimize the cost and minimize the construction facilities, the hazardous packaging will be sent to E for disposal and destruction.

4. Discussion: Positive Effect of Pesticide Waste Reverse Logistics Mechanism on the Environment

When discussing the positive effects of the reverse logistics mechanism of pesticide wastes on the environment, we first need to sort out the ecological and social harm of pesticide wastes. First of all, pesticide packaging itself is difficult to degrade, waste can remain in the natural environment for hundreds of years, and form barriers in the soil, affecting soil ventilation, and reducing crop yields; secondly, the residue of pesticides in waste has brought serious harm to the environment. Harmful ingredients can enter the air through volatilization or into the soil and groundwater under the erosion of rainwater, and further into the biological chain, which has long-term and potential hazards to environmental organisms and human health; thirdly, discarded pesticide wastes will also pose a direct threat to the lives of people or animals in villages [41]. The purpose of reverse logistics mechanism of pesticide wastes is to avoid the above hazards and gradually realize ecological and social benefits [42].
The improvement of ecological benefits by the reverse logistics recovery mechanism of pesticide wastes can be seen from the following aspects: (1) Reducing non-point source pollution in rural areas. Pesticide and chemical fertilizer, solid waste and domestic waste are the main sources of rural non-point source pollution. They are characterized by dispersibility, concealment, randomness, uncertainty, difficult monitoring and spatial heterogeneity. Many pollution sources enter the receiving water bodies (rivers, lakes, reservoirs, bays) through farmland surface runoff, farmland drainage and underground leakage, which makes recovery more difficult and the cost of treatment higher. The recovery mechanism of pesticide wastes can effectively reduce the discarding, leakage and volatilization of pesticide wastes in gully and canal fields, so as to effectively reduce non-point source pollution; (2) reduce the volatilization of toxic organic compounds in the atmosphere. Disposal of pesticide wastes at random, scattered in the field ditches, through the sun, rain and day-night temperature difference changes, and pesticide waste residues of harmful gases volatilized: Esters, aromatic hydrocarbons, ethers and other toxic organic compounds diffuse in the countryside fields, the atmosphere around the canal, and gas flow with the wind, for the countryside as a whole. The atmospheric environment of the body has a negative impact. The pesticide waste recovery mechanism can effectively reduce the distribution of pesticide waste in the field, thereby reducing the probability of volatilization of toxic organic compounds; (3) maintain the soil activity in the farmland and stabilize crop yield. The pesticide wastes are mainly made of PET, PEPA, HDPE, F-HDPE and PE, which are difficult to be separated and degraded. Over time, these materials deposit in the soil, forming barriers, affecting soil aeration, resulting in plant absorption of water, nutrient capacity is limited, resulting in crop yield reduction. In addition, the residual organic compounds in pesticide wastes also leak into the soil, causing soil contamination. The recovery mechanism of pesticide wastes can effectively solve this problem, make soil revitalization, make crop yield tend to be stable; (4) reduce food chain toxicity, protect animals and plants. With the discarding of pesticide wastes, the related plants are polluted by the liquid or volatile gases leaked from pesticide wastes. When these plants enter the food chain of ducks and other animals, the food chain tosses and turns repeatedly. At last, most organisms are exposed to pesticide harmful organic residues, which greatly destroy the ecological benefits. The reverse logistics mechanism of abandoned goods is a strong response to this phenomenon.
The improvement of pesticide waste reverse logistics recovery mechanism for social benefits can be seen from the following aspects: (1) Reducing the probability of pesticide accidents. In some developing countries, the probability of death due to pesticide poisoning is increasing [43]. The reverse logistics mechanism of pesticide wastes reduces the amount of pesticide packaging stored in households and reduces the probability of death. (2) At the same time, the reverse logistics mechanism saves a lot of raw materials and energy because of the recycling and reprocessing of the products, and because the processing links follow the principle of “close to”, generally close to the recovery, near to the redistribution, thus avoiding the long distance from the original manufacturer to the place of sale, reducing the cost of transportation and storage [44]. (3) The reverse logistics mechanism has recovered a large amount of pesticide wastes from farmers, preventing farmers from burning them in the fields, improving air quality and effectively responding to climate change [45].

5. Conclusions

In this paper, a set of reverse logistics network models of pesticide wastes was constructed, and the framework of reverse logistics was used to realize the efficient recovery and treatment of pesticide wastes. The problem of how to collect pesticide wastes and how to optimize the location and flow allocation of facilities such as recycling centers and treatment centers was solved.
In this paper, we first designed a plan for effective recovery from the most basic recycling points. With the transparent and efficient pesticide purchase information system, it can be more effective for farmers to return pesticide waste supervision. Secondly, the network analytic hierarchy process was used to rank the factors affecting the reverse logistics model of pesticide wastes, among which the categories quantity, location, operation cost, transportation volume, construction cost, negative externality and transportation distance weigh more. Secondly, a bi-objective optimization function with minimal cost and minimal negative externality was established, which is transformed into a single-objective optimization function. The mixed integer model programming method was used to make the optimal location decision and flow distribution, and the programming software Lingo was used to calculate the process. Finally, taking the JT area of China as an example, the optimal location and flow allocation of recycling centers, treatment centers, redistribution centers and refuse factories were obtained.
The innovation of this paper was to design a set of practical and empirical mechanisms, so that pesticide wastes can be effectively controlled and treated, greatly reducing the damage of pesticide wastes to water, soil and human health, making agricultural development more sustainable.

Author Contributions

Conceptualization, Z.L. Methodology, J.H.; Validation, Z.L. and J.H.; Formal Analysis, Z.L. and J.H. Writing—Original Draft Preparation, J.H.; Writing—Review and Editing, Z.L. Supervision, Z.L.

Funding

This research was funded by [National Natural Science Foundation of China] grant number [71772028].

Acknowledgments

We are grateful for Tang Fu, Jia RU and Liao Li for their great help in writing on the early draft.

Conflicts of Interest

The authors declare no conflict of interest. The founding sponsors had no role in the design of the study; in the collection, analyses, or interpretation of data; in the writing of the manuscript and in the decision to publish the results.

References

  1. Chau, N.D.; Sebesvari, Z.; Amelung, W.; Renaud, F.G. Pesticide pollution of multiple drinking water sources in the Mekong Delta, Vietnam: Evidence from two provinces. Environ. Sci. Pollut. Res. 2015, 22, 9042–9058. [Google Scholar] [CrossRef] [PubMed]
  2. Felsot, A.S.; Racke, K.D.; Hamilton, D.J. Disposal and degradation of pesticide waste. In Reviews of Environmental Contamination and Toxicology; Springer: New York, NY, USA, 2003; pp. 123–200. [Google Scholar]
  3. Jin, S.; Bluemling, B.; Mol, A.P.J. Mitigating land pollution through pesticide packages—The case of a collection scheme in Rural China. Sci. Total Environ. 2018, 622, 502–509. [Google Scholar] [CrossRef] [PubMed]
  4. Agrawal, S.; Singh, R.K.; Murtaza, Q. A literature review and perspectives in reverse logistics. Resour. Conserv. Recycl. 2015, 97, 76–92. [Google Scholar] [CrossRef]
  5. Foo, K.Y.; Hameed, B.H. Detoxification of pesticide waste via activated carbon adsorption process. J. Hazard. Mater. 2010, 175, 1–11. [Google Scholar] [CrossRef] [PubMed]
  6. Damalas, C.A.; Telidis, G.K.; Thanos, S.D. Assessing farmers’ practices on disposal of pesticide waste after use. Sci. Total Environ. 2008, 390, 341–345. [Google Scholar] [CrossRef] [PubMed]
  7. Mehrizad, A.; Zare, K.; Aghaie, H.; Dastmalchi, S. Removal of 4-chloro-2-nitrophenol occurring in drug and pesticide waste by adsorption onto nano-titanium dioxide. Int. J. Environ. Sci. Technol. 2012, 9, 355–360. [Google Scholar] [CrossRef] [Green Version]
  8. Fogg, P.; Boxall, A.B.; Walker, A.; Jukes, A.A. Pesticide degradation in a ‘biobed’composting substrate. Pest Manag. Sci. 2003, 59, 527–537. [Google Scholar] [CrossRef] [PubMed]
  9. Sivanesan, S.D.; Krishnamurthi, K.; Wachasunder, S.D.; Chakrabarti, T. Genotoxicity of pesticide waste contaminated soil and its leachate. Biomed. Environ. Sci. 2004, 17, 257–265. [Google Scholar] [PubMed]
  10. Vischetti, C.; Capri, E.; Trevisan, M.; Casucci, C.; Perucci, P. Biomassbed: A biological system to reduce pesticide point contamination at farm level. Chemosphere 2004, 55, 823–828. [Google Scholar] [CrossRef] [PubMed]
  11. Jiang, J. Research on Pretreatment of Phosphate Pesticide Waste Water with Fenton Agent. J. Anhui Agric. Sci. 2010, 28, 099. [Google Scholar]
  12. Plianbangchang, P.; Jetiyanon, K.; Wittaya-Areekul, S. Pesticide use patterns among small-scale farmers: A case study from Phitsanulok, Thailand. Southeast Asian J. Trop. Med. Public Health 2009, 40, 401. [Google Scholar] [PubMed]
  13. Stadlinger, N.; Mmochi, A.J.; Dobo, S.; Gyllbäck, E. Pesticide use among smallholder rice farmers in Tanzania. Environ. Dev. Sustain. 2011, 13, 641–656. [Google Scholar] [CrossRef]
  14. Wesseling, C.; Corriols, M.; Bravo, V. Acute pesticide poisoning and pesticide registration in Central America. Toxicol. Appl. Pharmacol. 2005, 207, 697–705. [Google Scholar] [CrossRef] [PubMed]
  15. Van Toan, P.; Sebesvari, Z.; Bläsing, M.; Rosendahl, I.; Renaud, F.G. Pesticide management and their residues in sediments and surface and drinking water in the Mekong Delta, Vietnam. Sci. Total Environ. 2013, 452, 28–39. [Google Scholar] [CrossRef] [PubMed]
  16. Yang, X.; Wang, F.; Meng, L.; Zhang, W.; Fan, L.; Geissen, V.; Ritsema, C.J. Farmer and retailer knowledge and awareness of the risks from pesticide use: A case study in the Wei River catchment, China. Sci. Total Environ. 2014, 497, 172–179. [Google Scholar] [CrossRef] [PubMed]
  17. LaGrega, M.D.; Buckingham, P.L.; Evans, J.C. Hazardous Waste Management; Waveland Press: Long Grove, IL, USA, 2010. [Google Scholar]
  18. Loehr, R. Agricultural Waste Management: Problems, Processes, and Approaches; Elsevier: Amsterdam, The Netherlands, 2012. [Google Scholar]
  19. Alshamsi, A.; Diabat, A. A reverse logistics network design. J. Manuf. Syst. 2015, 37, 589–598. [Google Scholar] [CrossRef]
  20. Fleischmann, M.; Krikke, H.R.; Dekker, R.; Flapper, S.D. A characterisation of logistics networks for product recovery. Omega 2000, 28, 653–666. [Google Scholar] [CrossRef]
  21. Ravi, V.; Shankar, R.; Tiwari, M.K. Analyzing alternatives in reverse logistics for end-of-life computers: ANP and balanced scorecard approach. Comput. Ind. Eng. 2005, 48, 327–356. [Google Scholar] [CrossRef]
  22. Wang, C. Logistics Systems Engineering; Higher Education Press: Beijing, China, 2007. [Google Scholar]
  23. Zhou, C.; Liang, L.; Xu, C.; Zha, Y. Research progress of reverse logistics: A review of the literature. Sci. Res. Manag. 2007, 28, 123–132. [Google Scholar]
  24. Kroon, L.; Vrijens, G. Returnable containers: An example of reverse logistics. Int. J. Phys. Distrib. Logist. Manag. 1996, 25, 56–68. [Google Scholar] [CrossRef] [Green Version]
  25. Pati, R.K.; Vrat, P.; Kumar, P. A goal programming model for paper recycling system. Omega 2008, 36, 405–417. [Google Scholar] [CrossRef]
  26. Castillo, E.D.; Cochran, J.K. Optimal Short Horizon Distribution Operations in Reusable Container Systems. J. Oper. Res. Soc. 1996, 47, 48–60. [Google Scholar] [CrossRef]
  27. Yue, H. Research on the Reuse of Reverse Logistics Network under Uncertain Environment. Ph.D. Thesis, Southwest Jiao Tong University, Chengdu, China, 2007. [Google Scholar]
  28. Brito, M.P.D. Managing Reverse Logistics or Reversing Logistics Management? Erasmus University Rotterdam: Rotterdam, The Netherlands, 2004. [Google Scholar]
  29. Lee, D.H.; Dong, M. A heuristic approach to logistics network design for end-of-lease computer products recovery. Transp. Res. Part E Logist. Transp. Rev. 2008, 44, 455–474. [Google Scholar] [CrossRef]
  30. Liu, H.; Xu, W.; Li, D. Development of new plastic packaging film for food packaging. In Applied Sciences in Graphic Communication and Packaging; Springer: Singapore, 2018; pp. 805–810. [Google Scholar]
  31. Zhang, J. Research on Location of Logistics Centers Based on Gravity Method; Sichuan Digital User: Chengdu, China, 2013. [Google Scholar]
  32. Jansen, K. The unspeakable ban: The translation of global pesticide governance into Honduran national regulation. World Dev. 2008, 36, 575–589. [Google Scholar] [CrossRef]
  33. Recena, M.C.; Caldas, E.D.; Pires, D.X.; Pontes, E.R. Pesticides exposure in Culturama, Brazil—Knowledge, attitudes, and practices. Environ. Res. 2006, 102, 230–236. [Google Scholar] [CrossRef] [PubMed]
  34. Panuwet, P.; Siriwong, W.; Prapamontol, T.; Ryan, P.B.; Fiedler, N.; Robson, M.G.; Barr, D.B. Agricultural pesticide management in Thailand: Status and population health risk. Environ. Sci. Policy 2012, 17, 72–81. [Google Scholar] [CrossRef] [PubMed]
  35. Kay, C. Rural Latin America: Exclusionary and uneven agricultural development. In Capital, Power, and Inequality in Latin America; Routledge: Abingdon, UK, 2018; pp. 21–52. [Google Scholar]
  36. Jasinski, E.; Morton, D.; DeFries, R.; Shimabukuro, Y.; Anderson, L.; Hansen, M. Physical landscape correlates of the expansion of mechanized agriculture in Mato Grosso, Brazil. Earth Interact. 2005, 9, 1–18. [Google Scholar] [CrossRef]
  37. Faiçal, B.S.; Freitas, H.; Gomes, P.H.; Mano, L.Y.; Pessin, G.; de Carvalho, A.C.; Krishnamachari, B.; Ueyama, J. An adaptive approach for UAV-based pesticide spraying in dynamic environments. Comput. Electron. Agric. 2017, 138, 210–223. [Google Scholar] [CrossRef]
  38. Morscher, C. By All Means Necessary: How China’s Resource Quest Is Changing the World; Oxford University Press: Oxford, UK, 2015. [Google Scholar]
  39. Hu, Z.; Rahman, S. Beyond a bottle of liquid: Pesticide dependence in transitional rural China. Local Environ. 2016, 21, 919–938. [Google Scholar] [CrossRef]
  40. Henderson, H.; Corral, L.; Simning, E.; Winters, P. Land accumulation dynamics in developing country agriculture. J. Dev. Stud. 2015, 51, 743–761. [Google Scholar] [CrossRef]
  41. Tijani, A.A. Pesticide use practices and safety issues: The case of cocoa farmers in Ondo State, Nigeria. J. Hum. Ecol. 2006, 19, 183–190. [Google Scholar] [CrossRef]
  42. Damalas, C.A. Understanding benefits and risks of pesticide use. Sci. Res. Essays 2009, 4, 945–949. [Google Scholar]
  43. Gunnell, D.; Eddleston, M. Suicide by Intentional Ingestion of Pesticides: A Continuing Tragedy in Developing Countries. Int. J. Epidemiol. 2003, 32, 902–909. [Google Scholar] [CrossRef] [PubMed]
  44. Lee, C.K.M.; Lam, J.S.L. Managing reverse logistics to enhance sustainability of industrial marketing. Ind. Mark. Manag. 2012, 41, 589–598. [Google Scholar] [CrossRef]
  45. Tomlin, C.D.S. The Pesticide Manual: A World Compendium; British Crop Production Council: Hampshire, UK, 2009. [Google Scholar]
Figure 1. Schematic diagram of pesticide waste reverse logistics model.
Sustainability 10 03622 g001
Figure 2. The typical Analytic Network Process (ANP) network structure.
Sustainability 10 03622 g002
Figure 3. The flow chart of Super Decision Software.
Sustainability 10 03622 g003
Figure 4. ANP network structure model of influencing factors of the pesticide waste reverse logistics system. Note. The elements in the arrowhead element group affect the elements in the element grouped by the arrow.
Sustainability 10 03622 g004
Figure 5. Weights of indicators.
Sustainability 10 03622 g005
Figure 6. Transportation cost model and storage cost model.
Sustainability 10 03622 g006
Figure 7. Schematic diagram of recovery point operation mode.
Sustainability 10 03622 g007
Figure 8. The solution flow.
Sustainability 10 03622 g008
Figure 9. The most preferred address and algorithm iteration number of the five transfer stations (Note: The left picture is the most preferred address of the recycle bin, and the right picture is the number of iterations).
Sustainability 10 03622 g009
Table 1. The population number and quantity of recycled packaging in each region.
AreaPopulationAcreage/KM2Population DensityRecycling of Pesticide Waste/10,000
A37,41416.250.434329395345.42
B49,32113.280.269256503690.18
C67,94211.310.166465515714.05
D40,92414.070.343808034973.49
E77,10810.390.13474607501.61
F53,42112.030.22519234452.16
G57,69311.320.196210979378.01
H44,10917.980.407626561545.26
I50,33116.510.328028452434.13
J32,41813.920.429391079392.30
K77,60215.740.202829824488.12
L51,37318.330.356802211501.37
Table 2. The facility layout results of the JT pesticides waste reverse logistics network in 2017.
Type of ConstructionAreaRecovery Area and Transport Volume
Recycling CenterGC(714.05) G(378.01) H(545.26)
EE(501.61) I(434.13)
DB(690.18) D(973.49) K(488.12)
LJ(392.30) L(501.37)
FA(345.42) F(452.16)
Processing CenterCC(1037.21) E(932.45)
KH(1221.48) K(913.39)
FF(1133.57)
Redistribution CenterIB(3063.18) C(1446.09) E(1355.47)
LandfillEB(1332.64) C(1523.33) E(767.14)

