Article

Sustainability in Organizations: Perceptions of Corporate Social Responsibility and Spanish Employees’ Attitudes and Behaviors

by
Sergio Pérez
,
Samuel Fernández-Salinero
and
Gabriela Topa
*
Department of Social and Organizational Psychology, National Distance Education University, UNED, 28040 Madrid, Spain
*
Author to whom correspondence should be addressed.
Sustainability 2018, 10(10), 3423; https://doi.org/10.3390/su10103423
Submission received: 19 August 2018 / Revised: 20 September 2018 / Accepted: 23 September 2018 / Published: 25 September 2018
(This article belongs to the Special Issue Psychology of Sustainability and Sustainable Development)

Abstract

:
The fields of psychology of sustainability and sustainable development have been recently highlighted by their contributions to employee’s wellbeing in organizations. The present study is aimed to empirically explore the relationship between perceptions of Corporate Social Responsibility of IBEX 35 (Spanish Exchange Index) companies’ employees, and their attitudes and behaviors. The relationship between the employees’ perception of Corporate Social Responsibility of the IBEX 35 companies with their job satisfaction and Organizational citizenships behaviors is empirically analyzed. The sample includes 600 employees of the IBEX 35 companies. The results supported that the three dimensions of Corporate Social Responsibility (CSR) perceived by the workers are different from each other, and that they are related positively, and significantly, with their job satisfaction, the Organizational Citizenships Behaviors oriented to the company and to other co-workers. We found that two dimensions of perceived CSR—sustainable economic development, and environmental protection—have a greater impact, whereas the CSR of social equity has an almost null explanatory power, compared to the other two dimensions. The study contributions will link the Firms’ CSR activities with the degree of wellbeing of employees: Relationships that become essential when designing companies’ products and/or services.

1. Introduction

The aim of the psychology of sustainability’s [1] is to explore the psychological mechanisms that underlie sustainable development. The word ‘sustainable’ refers actions that are intended to maintain something of value in its present form, without threatening its future survival or that of other resources [2]. Whereas for decades, the main goal of companies was to increase their economic profits with the sole limitation of respecting the law [3], the latest positive approaches emphasize Corporate Social Responsibility (hereinafter, CSR). This innovative vision goes beyond avoiding the exploitation and depletion of resources and places the emphasis on the contribution of CSR for the improvement of the quality of life of individuals, groups, and organizations [4].
CSR consists of the company’s commitment to maximize its long-term economic benefit, and at the same time, to take care of social welfare and sustainable environmental development, supervising its practices, policies, and business resources [5]. Multiple studies have provided evidence that relates CSR with benefits for the organizations, such as productivity, efficiency, and improvements in the quality of products and services [6,7]. Therefore, the contribution of CSR to the sustainability of the company and to society in general nowadays seems unquestionable.
One of the ways, in which the contribution of CSR to sustainability occurs, is through its positive impact on customers’ attitudes and behaviors, as is shown in other research [8]. Another promising pathway to explore is the potential of CSR to promote the well-being of employees, as they are one of the most relevant stakeholders of the company. As CSR implies both external and internal decisions and actions, employees’ attitudes and behaviors could be influenced through the two pathways. The external CSR express the most relevant values that the firm actually defends allowing the employees feeling proud in base of their organizational belonginess. The internal CSR could create a people-friendly environment—where the employees found social support, meaningfulness and responsiveness to their needs and problems, which in turn would influence their related behaviors to the firm. Hence, the relationships between CSR and employees’ attitudes and behaviors seem a topic that deserves further exploration.
Employees’ welfare should be analyzed in its twofold facet, hedonic and eudaimonic. Hedonic well-being consists of self-realization, but also of social integration, contribution, and actualization, among other facets [9]. Based on this approach, affective job satisfaction has been considered a direct indicator of hedonic well-being at work [10]. From an eudaimonic perspective, well-being would include employees’ behaviors positively oriented towards other people in the work environment or towards their organization, such as organizational citizenship behaviors (hereafter, OCB). Although there is a growing number of studies on the impact of CSR on employees’ attitudes and behavior [11,12,13,14], research is still fragmentary [15], and there are few empirical works in the Spanish context.
The IBEX 35 (Spanish Exchange Index) is the benchmark stock market index of the Spain’s stock exchanges at Madrid, Barcelona, Bilbao, and Valencia. It is a market capitalization-weighted index comprising the 35 most liquid Spanish stocks, including banks, hotels, food retailers, insurance, electricity and gas companies, among others. Companies that are grouped in the IBEX 35 are some of the most important according to their size, volume of business, and number of employees. These organizations have a high visibility in their respective sectors, which grants them a paradigmatic value. In relation to the CSR of these companies, previous research has been focused on economic prospects [16], but employees’ perceptions of CSR in their companies has not been empirically analyzed.
Considering these gaps in previous research, this study aims to provide empirical evidence of the relationship between CSR and employees’ attitudes and behaviors in the IBEX 35 companies. This evidence will contribute to reflection on the links of CSR with personal well-being, such as job satisfaction and OCB, both those oriented toward people and toward the organization. The novelty of our study is that it will help companies and human resources managers to properly assess the impact of internal and external CSR in intra-organizational sustainability, focusing on the IBEX35 Spanish firms and employees.
Hence, we first explore the previous empirical research supporting the relationships between CSR and employees’ wellbeing, and then we expose our empirical study and its findings, in order to provide additional insight on the topic.

1.1. CSR and Employee’s Well-Being: Job Satisfaction and OCB

Generally, CSR can be defined as actions and specific organizational policies of the companies that take into account the expectations of the stakeholders and the economic, social, and environmental performance [17]. This definition ensures the operationalization of employees’ perceptions of CSR in relation to the three key dimensions: (1) Sustainable economic development, (2) social equity, and (3) environmental Protection [5]. According to this definition, all levels of the organization can become involved in CSR and can also be affected by it [18].
The empirical evidence that relates employees’ perceptions of CSR to their attitudes and behaviors is growing [7,19]. From the point of view of psychology, some researchers have explored the impact of CSR in the company on employees’ attitudes and behavior. Among others, on organizational commitment [20], employee creativity [21], employee cynicism [22], and job performance [23]. In the same vein, the impact of the perceptions of CSR on job satisfaction is easily defensible [24]. Recent studies show that Chinese enterprises have emphasized the pursuit of job satisfaction as part of CSR practices to achieve sustainable development [25]. Moreover, a study in eight universities of Pakistan reveals the relationship between perceived CSR and job satisfaction [26].
Related to the underlying process that could account for these relationships between CSR and employees’ attitudes and behaviors, some explanations have been proposed. On the one hand, offering to the employees the opportunity to participate more actively in CSR initiatives influences employees’ engagement, according to some studies [27]. On another hand, engaging in CSR may lead to a sense of justice that can have an impact on the satisfaction of certain needs, which would otherwise be unsatisfied [28].
OCB is understood as individual behaviors that are not directly or explicitly recognized by the formal system of rewards [29]. These behaviors are not required in the employment contract or in the role of the post. The behavior is a personal choice, and its omission is not usually considered punishable. OCB is described as a prosocial behavior that can be oriented toward individuals or toward the Organization as a whole [29,30]. Several authors [31] have suggested that if an organization wants to promote the development of OCB, it must promote a culture, in which the values and characteristics of cooperation, mutual help, respect, and loyalty are present. In summary, the foregoing evidence allows hypothesizing that the CSR of the company promotes employees’ job satisfaction and OCB directed toward the organization and toward coworkers.

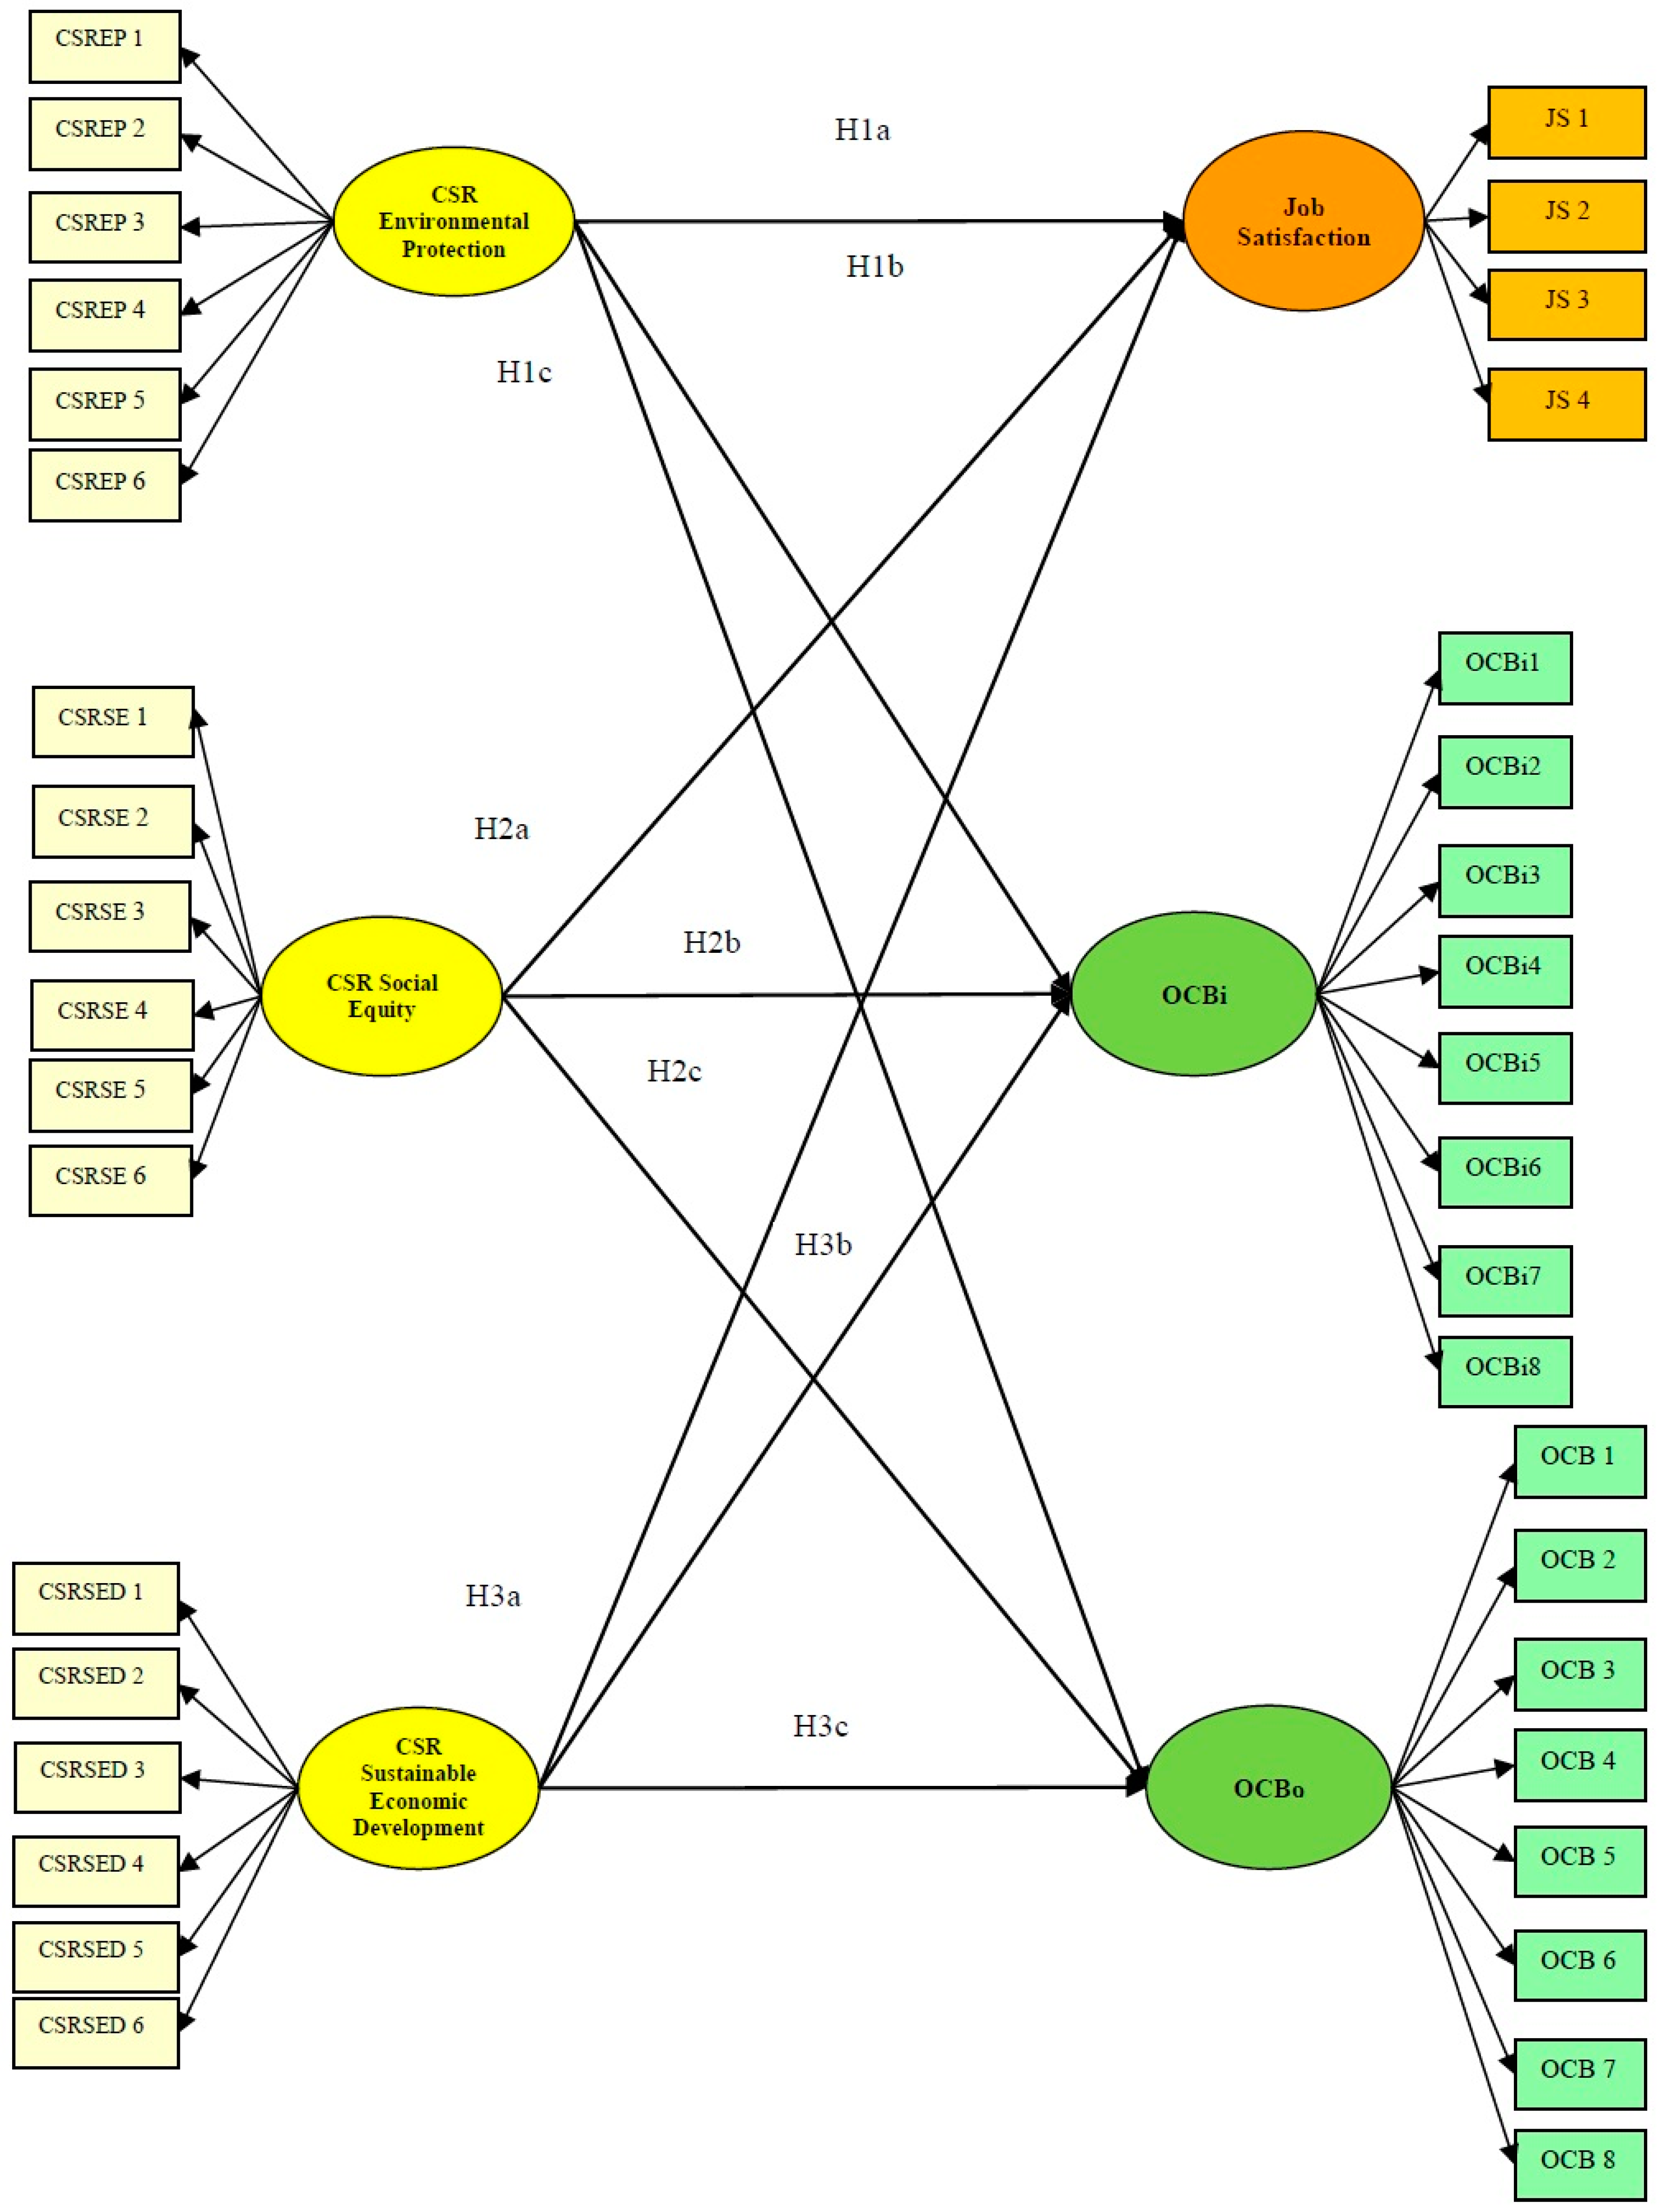
1.2. Research Hypotheses

Based on the literature reviewed to date, in the present study, the following hypotheses are proposed.
As CSR in the company offers the workers an organizational environment, in which the employee feels protected and is therefore satisfied, we propose that:
Hypothesis 1.
Employees’ perceptions of enterprises’ CSR, in its three dimensions of environmental protection (H1a), social equity (H1b), and sustainable economic development (H1c), will be positively related to job satisfaction.
As CSR policies could support an internal environment where the employee perceives well treatment, equity and respect, we propose that:
Hypothesis 2.
Employees’ perceptions of enterprises’ CSR, in its three dimensions of environmental protection (H2a), social equity (H2b), and sustainable economic development (H2c), will be positively related to OCB directed toward individuals.
As some authors have proposed, the relationship of CSR with organizational identification is a key aspect, because employees perceive these practices, and it will be easier for them to feel identified with their organizations and proud of belonging to them. Since, considering this underlying process, we propose that:
Hypothesis 3.
Employees’ perceptions of enterprises’ CSR, in its three dimensions of environmental protection (H3a), social equity (H3b), and sustainable economic development (H3c), will be positively related to OCB directed toward the organization.
The theoretical model and the hypotheses proposed in this research are summarized in Figure 1. Each latent variable, representing the dimensions of CSR, influences each employee’s wellbeing indicator, also represented by latent variables. The rectangles represent the observed indicators constituted by the items of the survey.

2. Materials and Methods

2.1. Ethical Information

We requested and received authorization and approval from the Bioethics Committee of the National Distance Education University (UNED) for this study. It has been approved with the Protocol n° 18/19/02. To recruit participants, the study was disseminated through social networks, using an anonymous link to an online form made with Google Forms. The members of the research team did not have access to the email addresses or any other personal information of potential participants, in order to maintain their anonymity.

2.2. Participants

This study was conducted with a sample of 602 employees of IBEX 35 companies. The mean age of the participants is 37.9 years (SD = 10.4), 47% are male, and the mean job tenure as employees is 8.9 years (SD = 8.6). Regarding the company about which they responded, 24.9% referred to various banks, 19.4% referred to a textile group, 15.4% to supermarket chains, 15.3% to phone companies, 13.3% to companies in the energy sector, and 3.5% to construction companies and public works. In relation to their level of studies, 15.3% had basic studies, 17.1% had completed high school, 34.9% had middle studies, and 33.6% were graduates or engineers. Regarding work schedules, 77.2% worked full-time, 17.4% worked part-time, and 5.3% were unemployed. Regarding the sector in which they worked, 35.2% worked in service companies, 23.8% in industry, 24.1% in banking, and 16.9% in companies of the telecommunications sector. In relation to the professional category of their posts, 5.8% were managers, 15.9% were middle managers, 59.5% were qualified workers, and 18.8% were unskilled workers.

2.3. Instruments

2.3.1. CSR Perceived by Employees

The Corporate Social Responsibility Perception Scale (CSRPerScale) was used to assess employees’ perceptions of the socially responsible performance of the companies in three dimensions of environmental protection, social equity, and sustainable economic development. The original scale [5] contains six items for each dimension. Appendix A contains the full scale.
In the original study of its developers, the reliability of the dimensions was adequate, as in all cases, it exceeded 0.90 (environmental protection = 0.95, social equity = 0.92, and sustainable economic development = 0.96). The original Likert-type response scale, without a half-way point, was adapted in this study to include the middle value of indifference, with the possible answers ranging between 1 (Completely disagree) and 5 (Completely agree).

2.3.2. Job Satisfaction

We used the Brief Index of Affective Job Satisfaction, Spanish version [10], which contains four items, and was designed to assess emotional satisfaction, as a global and positive emotional response to the post in general. Despite its reduced length, the scale has shown adequate reliability (α = 0.83) in the validation study to Spanish [10]. Appendix A contains the full scale.

2.3.3. OCB

We used the Spanish OCB Scale [29], which assesses OCB, both behaviors oriented toward the organization and those oriented toward individuals [30]. This scale, made up of 16 items with a 5-point Likert-type response format, requests participants to report the frequency with which each statement of the questionnaire matches their own behaviors at the work setting. The items are divided into two subscales, one of behaviors directed toward the organization and the other directed toward individuals, with 8 items each. Examples of items are: “I show that I’m interested in the image of the organization”; “I dedicate time to help others who have problems related or unrelated with the task”. The Likert-type response scale ranges between 1 (not at all frequent) and 5 (very frequent). Reliability analysis showed a satisfactory internal consistency for both subscales in other studies [31,32].
Sociodemographic data: Various questions were posed relating to the participants’ sociodemographic characteristics, such as gender, age, years of tenure as an employee of the company about which the participant is responding, the organizational level of the post, the company’s professional or economic sector of activity, the province in which the main activity of the company is located, and the participant’s employment status.
Control questions (Careless response items). A potential disadvantage of online surveys is that participants cannot be adequately monitored, and they may respond to the questions without paying attention. Different procedures are recommended as a way of monitoring inattentive or careless responses [33]. One of them is to include some fake items to ensure that participants are paying attention to what you are asking. These fake items have a single correct answer, and the choice of wrong answers suggests that the participant is not taking the study seriously. In the present study, two types of items were used: “I’m carefully reading the questions on this survey”; “I am completing this questionnaire at full speed”. These items were mixed in the middle of the scale of CSR perceived by employees, because of its importance for this investigation. After filtering the answers to detect participants with an inattentive response style, those who scored 3 or less on the first question, and 3 or more on the second were eliminated.

2.4. Procedures

We explained to the participants the inclusion criteria (to be working as an employee in any of the companies belonging to the IBEX 35). The participants were informed at the beginning of the questionnaire about the objectives of the study, their anonymity, their voluntary and free participation, the confidentiality of the information that they provided, and the possibility of dropping out of the study at any time without negative repercussions. Of the total number of completed surveys (N = 617), 602 were retained, as the surveys in which we detected inadequate responses to the two control questions were eliminated (careless response items).

2.5. Data Analyses

Data were analyzed using Smart PLS 3.0 [34], a recent software implementation of the Partial Least Squares (PLS) approach. The objective of PLS is to predict dependent variables, latent and manifest, maximizing the explained variance (R2) of the dependent variables and minimizing the residual variance of endogenous variables in any regression run of the model. To evaluate the model against observed data, an iterative procedure matches observed measures to corresponding latent variables, and then estimates the relationships among the latent variables. At each stage of the iteration, a least-squares fit between observed and modeled parameters is computed, and the model is considered a best-fit solution when the least squares function stabilizes between iterations.
PLS has two strengths that make it well suited to this study. First, PLS was developed to avoid the necessity of large sample sizes and hard assumptions of normality. Second, PLS accounts for measurement error and should provide more accurate estimates of standardized regression coefficients [34]. Finally, to better understand which the areas for improvement are, we conducted an Importance-Performance Map Analysis (IPMA) [35] for each criterion variable with Smart PLS 3.0 [34]. This analysis provides information on the relative importance of constructs in the explanation of other constructs. The IPMA provides performance scores on a scale from 0 to 100. As a result, interventions could aim primarily at focusing on improving the performance of constructs with high importance—but, at the same time, that have a relatively low performance.

3. Results

3.1. Descriptive Statistics and Pearson’s Correlations

Firstly, descriptive statistics and correlations among the variables of study were calculated, which are shown in Table 1. PLS results are presented in two parts: Tests of validity and reliability of the measures (outer model), and the tests of hypotheses (inner model). Table 1 and Table 2 present results concerning the reliability and validity of the scales, and Figure 2 shows the relevant path coefficients to hypothesis testing. The three dimensions of CSR showed positive and significant Pearson’s correlations, as expected. Also, the relationships between wellbeing indicators, satisfaction and OCB are positive and significant, as well with CSR dimensions.

3.2. Reliability and Validity of the Constructs: The Outer Model

The outer model consists of the relationships between the manifest indicators and the hypothesized latent constructs. First, the individual reliability of each indicator is given by the loadings or correlations between the indicator and the construct (λ). Researchers postulate that a latent variable should explain a substantial part of each indicator’s variance (usually at least 50%). Accordingly, the standardized outer loadings should be higher than 0.60 [36], as shown in Table 2.
Second, the scale reliability allows measuring the internal coherency of all the indicators in relation to the construct. The composite reliability (CR) is a preferred alternative to Cronbach’s alpha as a measure of internal consistency reliability. While Cronbach’s alpha assumes that all indicators are equally reliable, PLS prioritizes indicators according to their reliability, resulting in a more reliable composite [36]. The acceptable cutoff for CR would be the same as the one the researcher sets for Cronbach’s alpha, as both attempt to measure internal consistency reliability. Consequently, CR value should be above 0.70, whereas a value below 0.60 indicates a lack of reliability. Convergent validity represents the common variance between the indicators and their construct, and it means that a set of indicators represents the same underlying construct [36]. Fornell and Lacker [37] recommend using the average variance extracted (AVE) as a criterion. The higher the AVE value, the more representative are the indicators of the construct on which they load. In general, it is suggested that its value should be above 0.50. As shown in Table 1, the AVE for each construct was satisfactory. To assess discriminant validity among constructs, the AVE square root should be higher than the squared correlation with all other constructs [37]. Thereby, each construct should share more variance with its own block of indicators than with another construct representing a different block of indicators [35]. Table 1 shows the correlations between the constructs and, along the diagonal, the AVE square root. The information presented in Table 1 shows that there is discriminant validity between all the constructs of the proposed theoretical model, although the correlation between the three subdimensions of perception of CSR are high, as expected.

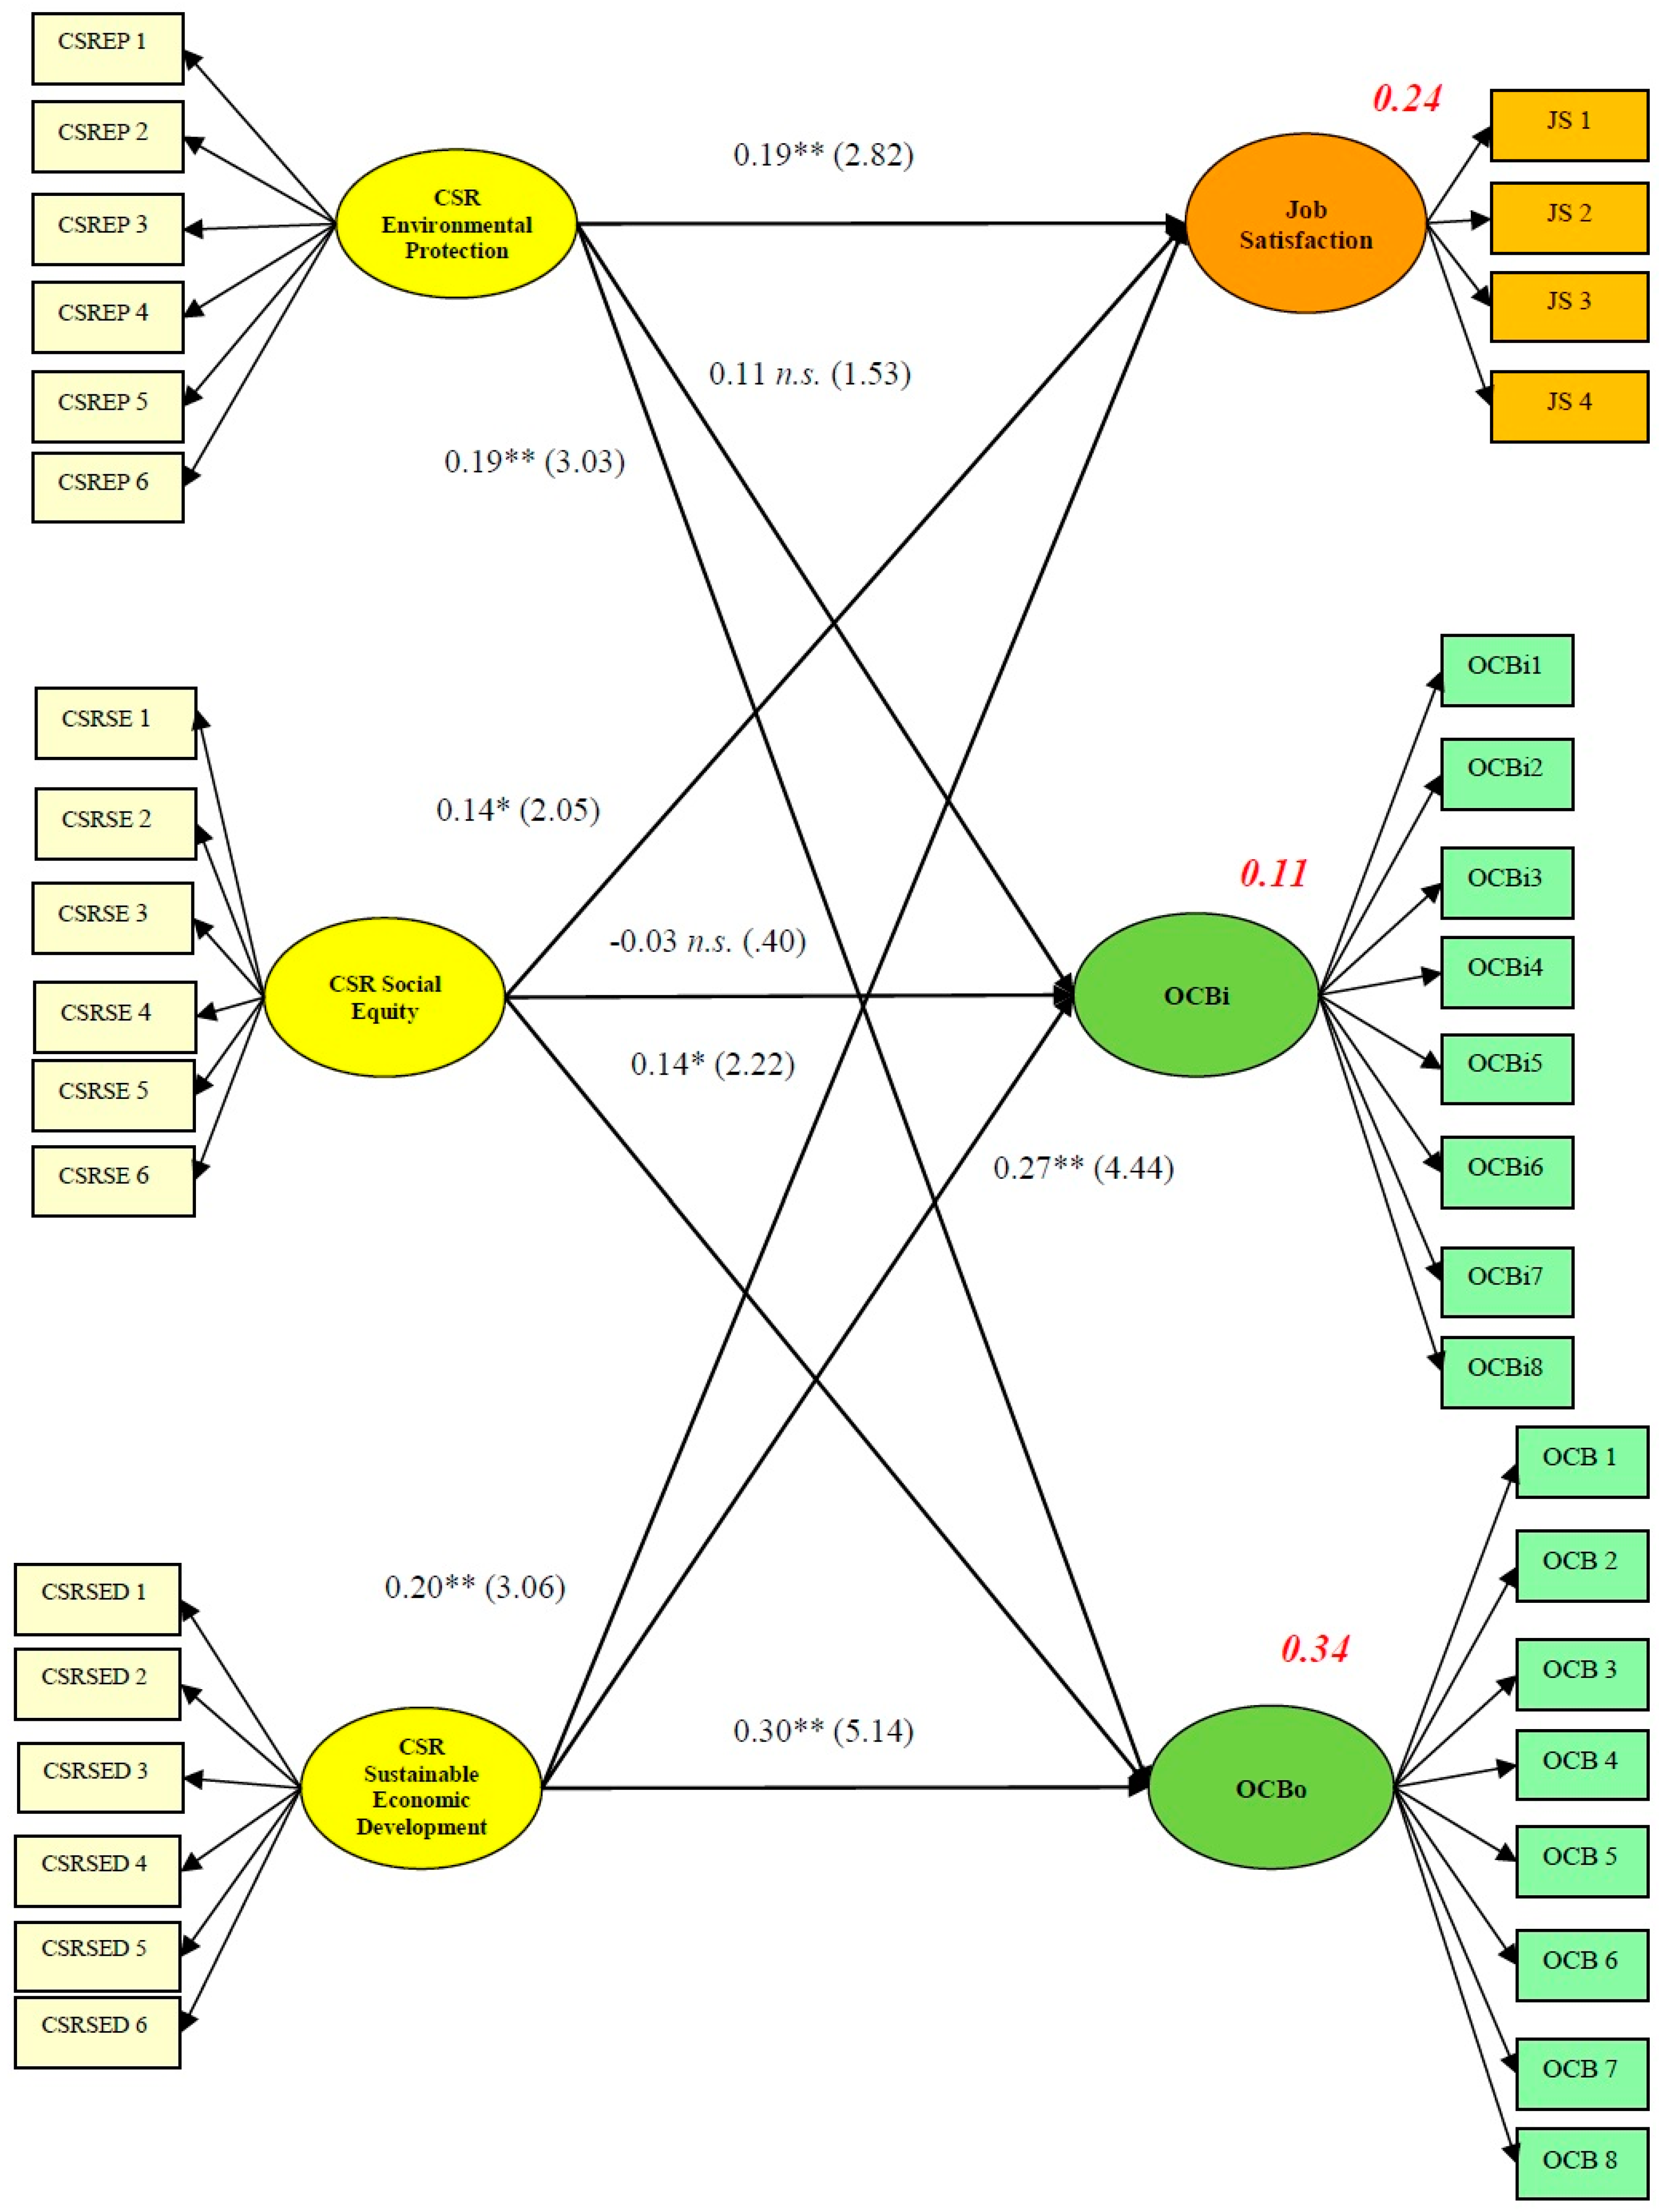
3.3. Testing Hypotheses: The Inner Model

The inner model is the structural relationship (i.e., path model) among constructs [36]. It involves an evaluation of the pathways between latent constructs using linear regression, in which the regressors can be interpreted as standardized beta coefficients. The confidence intervals of the path coefficients are based on a bootstrapping of 500 samples that permits the generalization of the results and the computation of Student’s t-test for each hypothesis. The essential criterion for assessing the structural model is the coefficient of determination (R2) of each endogenous latent variable [36], which should exceed 0.10. In this model we included the relationship between the perception of CSR of environmental protection, the perception of CSR of social equity, the perception of CSR of sustainable economic development, on the one hand, and job satisfaction and OCB directed toward individuals and the organization, on the other hand. The model explains 23.5% of the variance of employees’ job satisfaction, 11% of OCB directed toward individuals and 34% of OCB directed toward the organization. However, even though most of the relations proposed between the dimensions of CSR and the results reached statistical significance, two of them were nonsignificant. As shown in Figure 2, the relations between CSR of environmental protection and OCB directed toward individuals were nonsignificant. The same is true of the relationship between CSR of Social equity and OCB directed toward individuals.

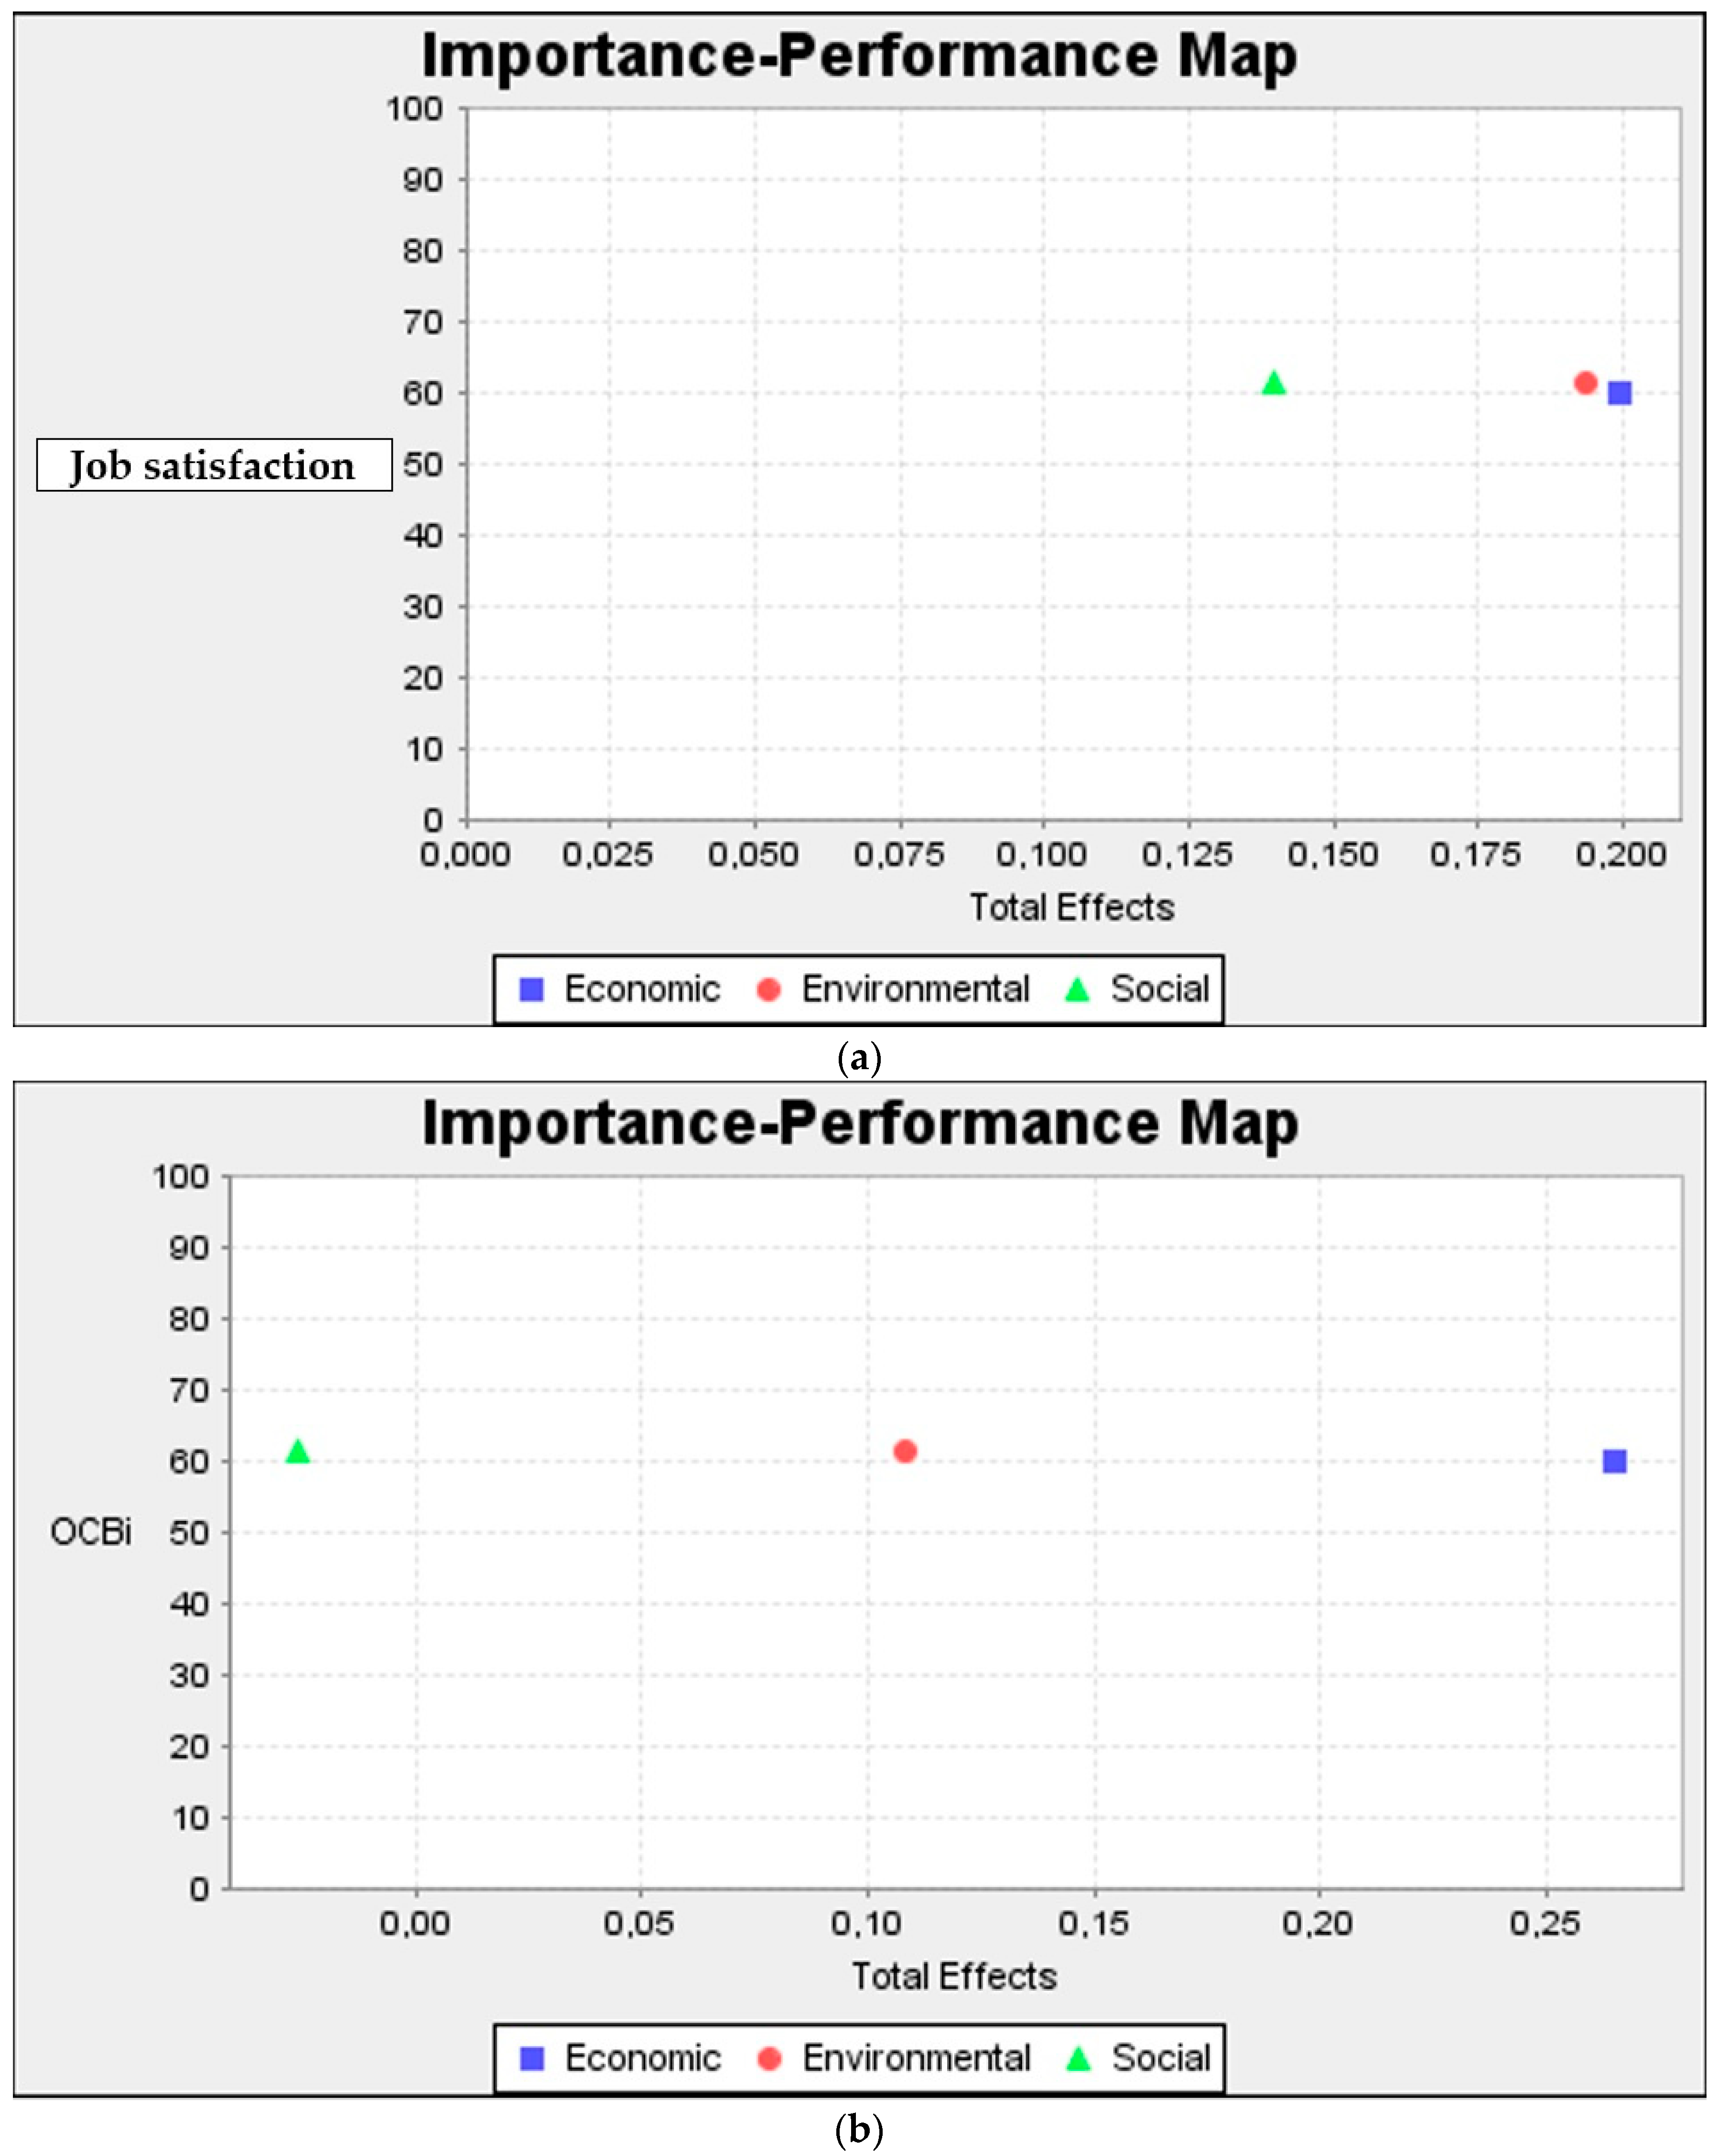
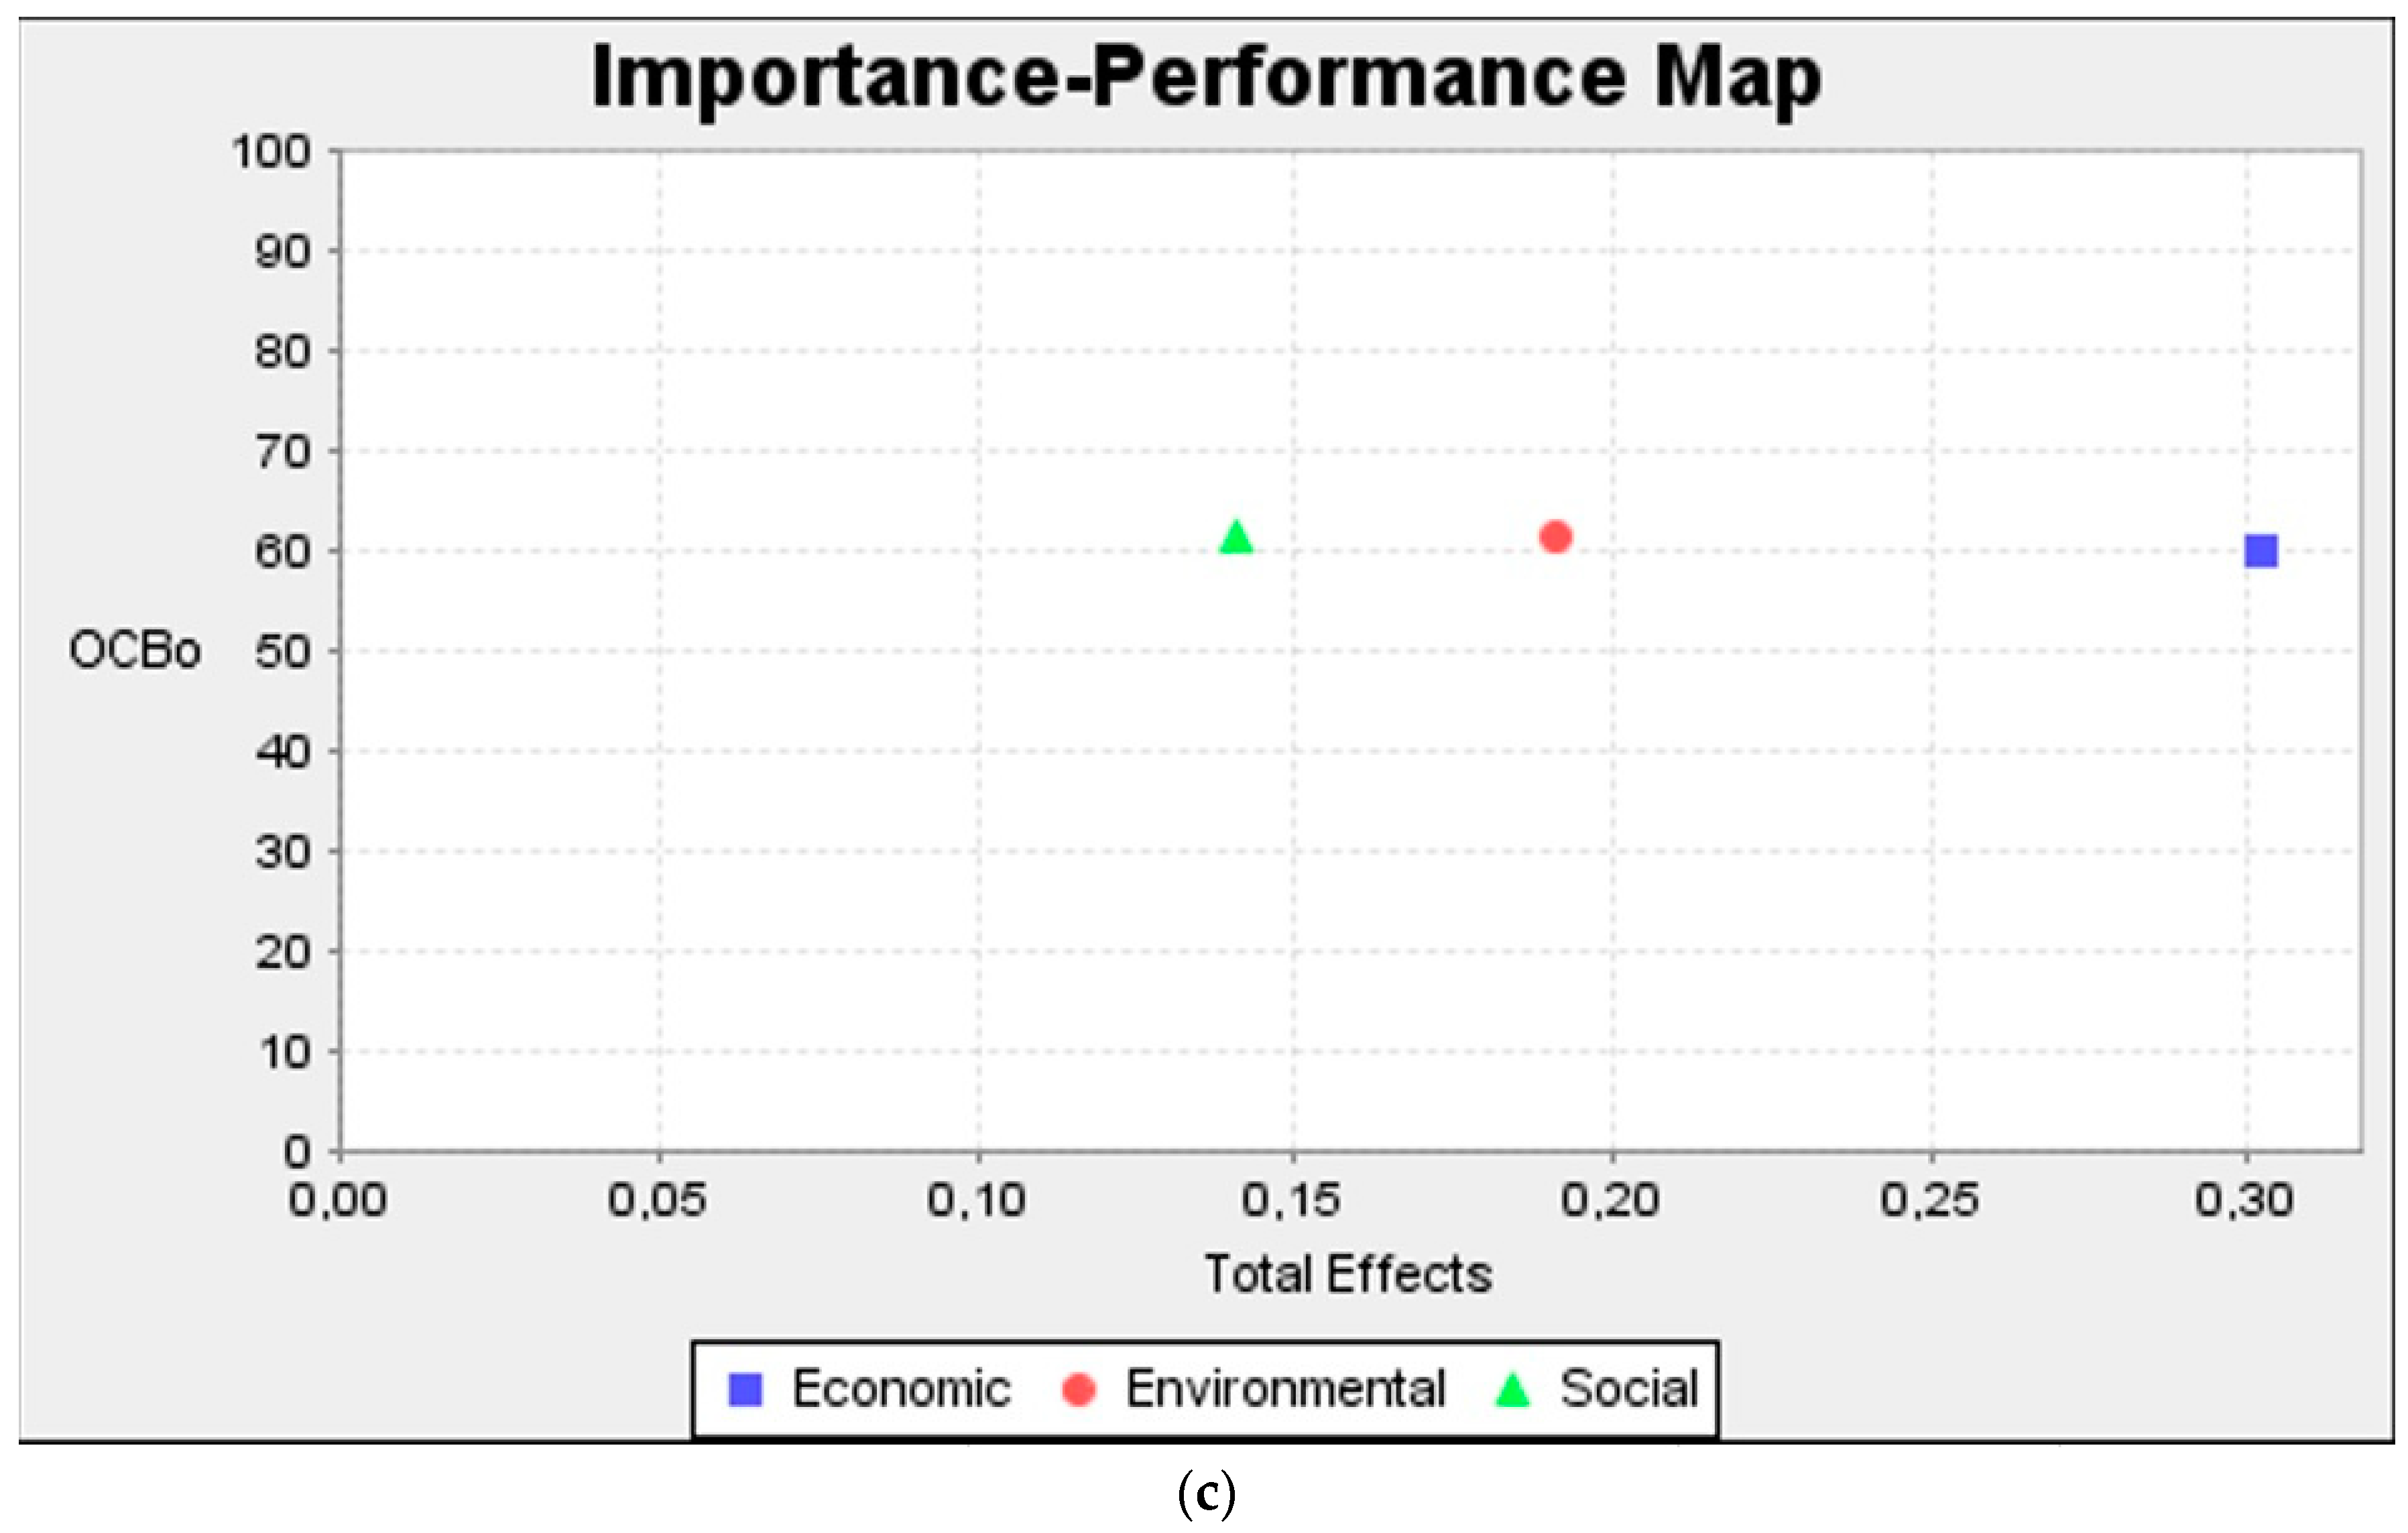
3.4. Suggesting Interventions: The Importance-Performance Map Analyses

In order to suggest interventions aimed at increasing employees’ job satisfaction and their OCB based on the relation of these behaviors with their perceptions of the companies’ CSR, we analyzed the Importance-Performance Matrix (IPMA) [35]. As shown in Figure 3, the IPMA showed that, to understand employees’ job satisfaction, CSR in its three dimensions is of similar importance, but the CSR of social equity clearly performs lower than the average in comparison with the other constructs, specifically with the CSR of sustainable economic development. On the other hand, Figure 3 shows that, when predicting OCB directed toward coworkers, the CSR of social equity again has an almost null performance, whereas the performance of CSR of environmental protection is somewhat better, and the CSR of sustainable economic development has a high relative performance compared to the other two dimensions.
Lastly, the third part of Figure 3 shows that the prediction of OCB directed toward the organization is based on the dimensions of the CSR of sustainable economic development and, in second place, of environmental protection, and again, the performance of CSR of social equity is poor. Consequently, these results could provide further information on how to influence employees’ appraisals, attitudes, and behaviors at work based on the information provided about the different CSR dimensions of the companies.

4. Discussion

The positive approach of psychology of sustainability [1,4,38,39,40] prioritizes the promotion of personal well-being, the optimization of resources, and the long-term objective of improving quality of life, while protecting sustainable economic development and social equity. This interest in sustainability and sustainable development is recognized as an axis of the current CSR [6,7,15]. Therefore, this study was intended to relate CSR as perceived by the employees of the IBEX 35 companies to their personal well-being, specifically, their job satisfaction and their OCB directed toward the organization and the employees. In view of the overall results, we can state that the main objective is met, although with some acknowledged limitations.
The findings showed that employees’ perceptions of the CSR of their companies is related to their behavior and attitudes, in particular, to their job satisfaction, and that the three dimensions of CSR are of similar importance. Hypothesis 1 obtained support, since the CSR dimensions predicted job satisfaction. The fact that the dimension of social equity clearly had a below-average performance in comparison with the other constructs is noteworthy, especially if compared with the CSR of sustainable economic development. This result is somewhat surprising, as the content of the participants’ perceptions that includes the dimension of social equity may be the closest to their concerns that could directly influence job satisfaction, such as concern for the ethical principles that govern the company.
Hypotheses 2 and 3 obtained support, since the CSR dimensions predicted OCB. In this sense, when accounting for OCB directed toward coworkers, we again found that the other two dimensions of perceived CSR—sustainable economic development, and environmental protection—have a greater impact, whereas the CSR of social equity has an almost null performance, compared to the other two dimensions. Finally, and always in relation to the above, a similar pattern for the prediction of OCB directed toward the organization was confirmed, as this is mainly done from the dimensions of CSR of sustainable economic development, and of environmental protection in second place. The poor performance of CSR of social equity in the prediction of all the outcomes considered in the present investigation is evident.
Our findings suggest as different underlying processes that could explain why employees’ perceptions of the CSR of their companies could affect their job satisfaction and contextual performance. On the one hand, as CSR enact a set of values that the firm translate into actions, policies, decisions, the employee might feel proud of the firm and, in turn, satisfaction. On the other, a social responsible internal climate, characterized by equity and fair treatment, could also promote satisfaction, as well as OCB.
It is clear that the findings of this study have a relevant limitation, as we did not analyze the policies of “effective” CSR of the companies, but rather the employees’ perceptions of these policies. Additionally, the sample size and lack of representativeness, as the use of self-report measures should be stated. Since, all the IBEX 35 companies are assessed under the CSR principles and provide information available in the Annual Report of the Corporate Social Responsibility Observatory, we could consider that they have a strong compromise with sustainable development principles. But, not all of them are implemented at a similar stage in the different firms. The Corporate Social Responsibility Observatory accumulates the information provided by the firms, and compare them to display their accomplishment of the CSR standards’ and their evolution. It is in this sense that we recommend expanding future research to seek objective measures that may make the empirical results more valid. In any case, it is very difficult to link the policies of companies to indicators at the individual level, such as attitudes and behaviors, and therefore an important challenge for CSR in the present decade is to connect the micro and macro-social levels, as some authors have recently suggested [6,7,15].
Finally, CSR could be also considered as an endogenous variable, and it is highly influenced by other factors. While CSR might be improved, because of employees’ behaviors (i.e., saving resources, wasting only those necessary), it would be also affected by high level variables, as well-designed benchmarking processes [41].

5. Conclusions

The added value of this research is that it has important practical implications. CSR perceptions seems to be a useful way to improve not only firms’ performance, but also employee’s wellbeing. At the same time, if employees feel that the firm respect them and search the satisfaction of their needs, they would be more oriented to contribute to the organizational aims, positively influencing the corporate performance. Professionals in the Human Resource Management could develop Internal CSR programs in order to provide a better working environment for individuals and medium and long-term results for the firms. In this sense, a direct link between CSR and sustainability could be announced through employee’s wellbeing. Consistent with the psychology of sustainability [42,43], the findings encourage the design of interventions aimed at promoting the well-being of employees, through new constructs that promote sustainable resources [44,45].

Author Contributions

S.P., S.F.-S. and G.T. conceptualized the study and choose the theoretical framework, collected the data, analyzed them and wrote the paper together, revising the manuscript several times.

Funding

This research received no external funding.

Conflicts of Interest

The authors declare no conflict of interest.

Appendix A

CSRConsPERScale [5] (Consumer Perceptions of Corporate Social Responsibility) (Alvarado-Herrera, A., Bigne, E., Aldas-Manzano, J.; Curras-Perez, R.)
Equidad social
  • En mi opinión, en relación con la sociedad, la… empresa está realmente tratando de apoyar programas educativos
  • En mi opinión, en relación con la sociedad, la… empresa está realmente tratando de apoyar a los programas de salud publica
  • En mi opinión, en relación con la sociedad, la… empresa está totalmente comprometida con principios éticos bien definidos
  • En mi opinión, en relación con la sociedad, la… empresa está realmente tratando de apoyar a los programas culturales
  • En mi opinión, en relación con la sociedad, la… empresa está realmente tratando de hacer donaciones a causas sociales
  • En mi opinión, en relación con la sociedad, la… empresa está realmente tratando de mejorar la calidad de vida de la comunidad local
Environmental protection
7.
En mi opinión, en relación con el medio ambiente, la… empresa está tratando de llevar a cabo programas pro-ambientales.
8.
En mi opinión, en relación con el medio ambiente, la… empresa está tratando de asignar recursos para ofrecer servicios compatibles con el medio ambiente.
9.
En mi opinión, en relación con el medio ambiente, la… empresa está tratando de llevar a cabo programas para reducir la contaminación
10.
En mi opinión, en relación con el medio ambiente, la empresa… está tratando de proteger el medio ambiente
11.
En mi opinión, en relación con el medio ambiente, la empresa… está tratando de llevar a cabo programas para utilizar los materiales de manera adecuada.
12.
En mi opinión, en relación con el medio ambiente, la empresa… está tratando de llevar a cabo programas para utilizar sólo los recursos naturales necesarios
Desarrollo económico sostenible
13.
En mi opinión, en relación con la economía, la empresa… está realmente tratando de maximizar sus beneficios para asegurar su continuidad.
14.
En mi opinión, en relación con la economía, la empresa… está realmente tratando de establecer relaciones sólidas con sus clientes para asegurar su éxito a largo plazo;
15.
En mi opinión, en relación con la economía, la… empresa está realmente tratando de mejorar continuamente la calidad de los servicios ofrecidos.
16.
En mi opinión, en relación con la economía, la empresa… está realmente tratando de establecer una política de precios competitiva
17.
En mi opinión, en relación con la economía, la empresa… está realmente tratando de mejorar constantemente sus logros financieros
18.
En mi opinión, en relación con la economía, la empresa… está realmente tratando de hacer lo mejor para ser productiva
Brief Index of Affective Job Satisfaction [10] Spanish Version (Fernández Muñoz and Topa, 2018)
  • La mayor parte de los días estoy entusiasmado en mi trabajo
  • Disfruto realmente de mi trabajo
  • Me gusta mi trabajo más que a la mayoría de las personas
  • Me siento realmente muy satisfecho con mi trabajo

References

  1. Di Fabio, A. The psychology of sustainability and sustainable development for well-being in organizations. Front. Psychol. 2017, 8, 1534. [Google Scholar] [CrossRef] [PubMed]
  2. Harris, J.M. Sustainability and sustainable development. Int. Soc. Ecol. Econ. 2003, 1, 1–12. [Google Scholar]
  3. Friedman, H.M. The public interest derivative suit: A proposal for enforcing corporate responsibility. Case West. Res. Law Rev. 1972, 24, 294. [Google Scholar]
  4. Di Fabio, A.; Peiró, J.M. Human Capital Sustainability Leadership to Promote Sustainable Development and Healthy Organizations: A New Scale. Sustainability 2018, 10, 2413. [Google Scholar] [CrossRef]
  5. Alvarado-Herrera, A.; Bigne, E.; Aldas-Manzano, J.; Curras-Perez, R. A scale for measuring consumer perceptions of corporate social responsibility following the sustainable development paradigm. J. Bus. Eth. 2017, 140, 243–262. [Google Scholar] [CrossRef]
  6. Glavas, A. Corporate social responsibility and organizational psychology: An integrative review. Front. Psychol. 2016, 7, 144. [Google Scholar] [CrossRef] [PubMed]
  7. Glavas, A. Corporate social responsibility and employee engagement: Enabling employees to employ more of their whole selves at work. Front. Psychol. 2016, 7, 796. [Google Scholar] [CrossRef] [PubMed]
  8. Alshehhi, A.; Nobanee, H.; Khare, N. The impact of sustainability practices on corporate financial performance: Literature trends and future research potential. Sustainability 2018, 10, 494. [Google Scholar] [CrossRef]
  9. Joshanloo, M.; Capone, V.; Petrillo, G.; Caso, D. Discriminant validity of hedonic, social, and psychological well-being in two Italian samples. Personal. Individ. Differ. 2017, 109, 23–27. [Google Scholar] [CrossRef]
  10. Fernández-Muñoz, J.; Topa, G. Older workers and affective job satisfaction: Gender invariance in Spain. Front. Psychol. 2018, 9, 930. [Google Scholar] [CrossRef] [PubMed]
  11. Hameed, I.; Riaz, Z.; Arain, G.A.; Farooq, O. How do internal and external CSR affect employees’ organizational identification? A perspective from the group engagement model. Front. Psychol. 2016, 7, 788. [Google Scholar] [CrossRef] [PubMed]
  12. Jones, D.A.; Willness, C.R.; Glavas, A. When Corporate Social Responsibility (CSR) Meets Organizational Psychology: New Frontiers in Micro-CSR Research, and Fulfilling a Quid Pro Quo through Multilevel Insights. Front. Psychol. 2017, 8, 520. [Google Scholar] [CrossRef] [PubMed]
  13. Voliotis, S.; Vlachos, P.A.; Epitropaki, O. Perception-induced effects of corporate social irresponsibility (CSiR) for stereotypical and admired firms. Front. Psychol. 2016, 7, 970. [Google Scholar] [CrossRef] [PubMed]
  14. Wang, W.; Fu, Y.; Qiu, H.; Moore, J.H.; Wang, Z. Corporate Social Responsibility and Employee Outcomes: A Moderated Mediation Model of Organizational Identification and Moral Identity. Front. Psychol. 2017, 8, 1906. [Google Scholar] [CrossRef] [PubMed]
  15. Glavas, A.; Willness, C.R.; Jones, D.A. (Eds.) Corporate Social Responsibility and Organizational Psychology: Quid pro Quo; Frontiers Media: Lausanne, Switzerland, 2017. [Google Scholar]
  16. Pérez-López, D.; Moreno-Romero, A.; Barkemeyer, R. Exploring the relationship between sustainability reporting and sustainability management practices. Bus. Strategy Environ. 2015, 24, 720–734. [Google Scholar] [CrossRef]
  17. Frederick, W.C. Commentary: Corporate social responsibility: Deep roots, flourishing growth, promising future. Front. Psychol. 2016, 7, 129. [Google Scholar] [CrossRef] [PubMed]
  18. Bridoux, F.; Stofberg, N.; Den Hartog, D. Stakeholders’ responses to CSR tradeoffs: When other-orientation and trust trump material self-interest. Front. Psychol. 2016, 6, 1992. [Google Scholar] [CrossRef] [PubMed]
  19. Sarfraz, M.; Qun, W.; Abdullah, M.I.; Alvi, A.T. Employees’ Perception of Corporate Social Responsibility Impact on Employee Outcomes: Mediating Role of Organizational Justice for Small and Medium Enterprises (SMEs). Sustainability 2018, 10, 2429. [Google Scholar] [CrossRef]
  20. Brammer, S.; Millington, A.; Rayton, B. The contribution of corporate social responsibility to organizational commitment. Int. J. Hum. Resour. Manag. 2007, 18, 1701–1719. [Google Scholar] [CrossRef] [Green Version]
  21. Malik, O.F.; Shahzad, A.; Raziq, M.M.; Khan, M.M.; Yusaf, S.; Khan, A. Perceptions of organizational politics, knowledge hiding, and employee creativity: The moderating role of professional commitment. Personal. Individ. Differ. 2018. [CrossRef]
  22. Sheel, R.C.; Vohra, N. Relationship between perceptions of corporate social responsibility and organizational cynicism: The role of employee volunteering. Int. J. Hum. Res. Manag. 2016, 27, 1373–1392. [Google Scholar] [CrossRef]
  23. Korschun, D.; Bhattacharya, C.B.; Swain, S.D. Corporate social responsibility, customer orientation, and the job performance of frontline employees. J. Mark. 2014, 78, 20–37. [Google Scholar] [CrossRef]
  24. Pérez-Martínez, S.; Topa, G. Percepciones sobre la responsabilidad social corporativa de las empresas: Relación con las actitudes y conductas de sus clientes [Perceptions of corporate social responsibility: Relationship with customers’ attitudes and behaviors]. Acción Psicol. 2018, 15, 103–120. [Google Scholar] [CrossRef]
  25. Zhu, Q.; Yin, H.; Liu, J.; Lai, K.H. How is employee perception of organizational efforts in corporate social responsibility related to their satisfaction and loyalty towards developing harmonious society in Chinese enterprises? Corp. Soc. Responsib. Environ. Manag. 2014, 21, 28–40. [Google Scholar] [CrossRef]
  26. Asrar-ul-Haq, M.; Kuchinke, K.P.; Iqbal, A. The relationship between corporate social responsibility, job satisfaction, and organizational commitment: Case of Pakistani higher education. J. Clean. Prod. 2017, 142, 2352–2363. [Google Scholar] [CrossRef]
  27. Rupp, D.E.; Ganapathi, J.; Aguilera, R.V.; Williams, C.A. Employee reactions to corporate social responsibility: An organizational justice framework. J. Organ. Behav. 2006, 27, 537–543. [Google Scholar] [CrossRef]
  28. Kim, H.R.; Lee, M.; Kim, N.M. Corporate social responsibility and employee-company identification. J. Bus. Eth. 2010, 95, 557–569. [Google Scholar] [CrossRef]
  29. Dávila, M.C.; Finkelstein, M.A. Predicting organizational citizenship behavior from the functional analysis and role identity perspectives: Further evidence in Spanish employees. Span. J. Psychol. 2010, 13, 277–283. [Google Scholar] [CrossRef] [PubMed]
  30. Szabó, Z.P.; Czibor, A.; Restás, P.; Bereczkei, T. “The Darkest of all” The relationship between the Dark Triad traits and organizational citizenship behavior. Personal. Individ. Differ. 2018. [Google Scholar] [CrossRef]
  31. Aranda, M.; Hurtado, M.D.; Topa, G. Breach of psychological contract and organizational citizenship behaviors in volunteerism: The mediator role of affect and the moderation of volunteers’ age. VOLUNTAS Int. J. Volunt. Nonprofit Organ. 2018, 29, 59–70. [Google Scholar] [CrossRef]
  32. Dávila, M.; Finkelstein, M.A. Organizational Citizenship Behaviour and Well-being. Int. J. Psychol. Psychol. Ther. 2016, 16, 35–48. [Google Scholar]
  33. Meade, A.W.; Craig, S.B. Identifying careless responses in survey data. Psychol. Methods 2012, 17, 437. [Google Scholar] [CrossRef] [PubMed]
  34. Ringle, C.; Wende, S.; Becker, J. SmartPLS 3; SmartPLS: Bönningstedt, Germany, 2015. [Google Scholar]
  35. Ringle, C.M.; Sarstedt, M. Gain More Insight from Your PLS-SEM Results: The Importance-Performance Map Analysis. Ind. Manag. Data Syst. 2016, 119, 1865–1886. [Google Scholar] [CrossRef]
  36. Ringle, C.M.; Sarstedt, M.; Mitchell, R.; Gudergan, S.P. Partial least squares structural equation modeling in HRM research. Int. J. Hum. Res Manag. 2018, 1–27. [Google Scholar] [CrossRef]
  37. Fornell, C.; Larcker, D.F. Structural equation models with unobservable variables and measurement error: Algebra and statistics. J. Mark. Res. 1981, 382–388. [Google Scholar] [CrossRef]
  38. Di Fabio, A.; Bucci, O. Green positive guidance and green positive life counseling for decent work and decent lives: Some empirical results. Front. Psychol. 2016, 7, 261. [Google Scholar] [CrossRef] [PubMed]
  39. Di Fabio, A.; Kenny, E.M. From decent work to decent lives: Positive Self and Relational Management (PS&RM) in the twenty-first century. Front. Psychol. 2016, 7, 361. [Google Scholar] [PubMed]
  40. Di Fabio, A.; Kenny, M.E. Promoting well-being: The contribution of emotional intelligence. Front. Psychol. 2016, 7, 1182. [Google Scholar] [CrossRef] [PubMed]
  41. Cruz, D.; Ferreira, N.; Marques, R.C. Scorecards for sustainable local governments. Cities 2014, 39, 165–170. [Google Scholar] [CrossRef] [Green Version]
  42. Di Fabio, A. Positive Healthy Organizations: Promoting well-being, meaningfulness, and sustainability in organizations. Front. Psychol. 2017, 8, 1938. [Google Scholar] [CrossRef] [PubMed]
  43. Di Fabio, A. Intrapreneurial Self-Capital: A new construct for the 21st century. J. Employ. Couns. 2014, 51, 98–111. [Google Scholar] [CrossRef]
  44. Segura-Camacho, A.; Topa, G. Identificación con los trabajadores mayores y absentismo: Moderación de la Selección, Optimización y Compensación. [Identification with older workers and absenteeism: Moderation of Selection, Optimization and Compensation]. Acción Psicol. 2016, 13, 169–188. [Google Scholar] [CrossRef]
  45. Hategan, C.D.; Sirghi, N.; Curea-Pitorac, R.I.; Hategan, V.P. doing well or doing good: The relationship between corporate social responsibility and profit in Romanian companies. Sustainability 2018, 10, 1041. [Google Scholar] [CrossRef]
Figure 1. Hypothesized model. CSRSED: Corporate social responsibility—sustainable economic development; CSRSE: Corporate social responsibility—social equity; CSREP: Corporate social responsibility—environmental protection.
Sustainability 10 03423 g001
Figure 2. Structural Model. Black values above the arrows are standardized regression coefficients and t values in brackets. Red values above the circles are the percentages of explained variance of the criterion variables. CSRSED: Corporate social responsibility—sustainable economic development; CSRSE: Corporate social responsibility—social equity; CSREP: Corporate social responsibility—environmental protection. * p < 0.05, ** p < 0.001.
Sustainability 10 03423 g002
Figure 3. Importance-Performance Map Analysis (IPMA) for the three dimensions of CSR on the three criterion variables. (a) IPMA on job satisfaction; (b) IPMA on organizational citizenship behavior directed to the individuals, and (c) IPMA on organizational citizenship behavior directed to the organization.
Sustainability 10 03423 g003aSustainability 10 03423 g003b
Table 1. Descriptive statistics and Pearson’s correlation matrix. Discriminant validity results following the Fornell and Larcker’s criteria.
VariablesMSD123456
1. CSR Environmental Protection3.420.810.75
2. CSR Social Equity3.430.850.750.80
3. CSRSED3.370.810.73 **0.72 **0.80
4. Job satisfaction3.180.920.46 **0.43 **0.45 **0.90
5. OCBi3.480.790.29 **0.24 **0.33 **0.37 **0.78
6. OCBo3.210.930.53 **0.51 **0.55 **0.68 **0.49 **0.81
Note: N = 602. The values in the diagonal are squared root of AVE; CSRSED: Corporate social responsibility—sustainable economic development; OCBi: Organizational citizenship behaviors towards individuals; OCBo: Organizational citizenship behaviors towards the organization. ** p < 0.001.
Table 2. Outer model: Reliability and convergent validity results.
Latent VariableÍtemλ 1CR 2αAVE 3
CSR Environmental ProtectionCSREP1.0.790.890.850.57
CSREP2.0.79
CSREP3.0.74
CSREP4.0.75
CSREP5.0.78
CSREP6.0.66
CSR Social EquityCSRSE1.0.860.910.880.64
CSRSE2.0.86
CSRSE3.0.81
CSRSE4.0.74
CSRSE5.0.75
CSRSE6.0.76
CSRSEDCSRSED1.0.900.880.880.64
CSRSED2.0.86
CSRSED30.83
CSRSED4.0.74
CSRSED5.0.79
CSRSED6.0.65
Job satisfactionJS10.910.950.920.81
JS20.88
JS30.90
JS40.91
OCBiOCBi 10.830.930.910.61
OCBi 20.83
OCBi 30.73
OCBi 40.75
OCBi 50.80
OCBi 60.82
OCBi 70.83
OCBi 80.68
OCBoOCBo 10.660.940.930.66
OCBo 20.75
OCBo 30.87
OCBo 40.88
OCBo 50.82
OCBo 60.83
OCBo 70.83
OCBo 80.84
CSRSED: Corporate social responsibility—sustainable Economic Development; OCBi: Organizational citizenship behaviors towards individuals; OCBo: Organizational citizenship behaviors towards the organization. 1 Factor Loadings; 2 Composite Reliability; 3 Average Extracted Variance.

