1. Introduction
The scramble for energy security following the terrorist attacks of 2001 transformed overnight a small movement dominated by environmentalists into a much bigger tent. This surge in support is for the most part a welcome development, but it has attracted its fair share of quacks and opportunists who cannot let a crisis go to waste. The peoples of early civilizations paid a heavy price when the productivity of their soils and fisheries were undermined by poor stewardship. Unlike our distant ancestors, we have many tools for anticipating the consequences of how we use our natural resources. But this knowledge is of little use when only a fraction of the citizenry understands it. Emotional appeals are unreliable because many can play at this game. Furthermore, this method of persuasion is less effective in the absence of relevant personal experience, and since affluent countries regularly outsource their most polluting industries to poorer nations that welcome the jobs, most of us in the developed world remain out of touch with the environmental consequences of how we live. Biofuels may end up taking part in this controversial policy if they are imported in order to comply with government mandates for “renewable” energy. Now more than ever high school students should learn how to audit these options for alternative energy to make comparisons that are based on numbers, not feelings. Armed with reasoned awareness, these energy-literate citizens would be better at appreciating lessons from the past and resisting the siren song of proposals that are too good to be true.
2. The Collapse of the Rapa Nui and the Return to Biofuels
The enigmatic giant stone heads made famous by Thor Heyerdahl's 1958 bestseller “Aku-Aku” are a melancholy reminder of a once-bountiful environment that gave the inhabitants of Easter Island the spare time to carve these monuments to their gods. But when the first Europeans visited the island in the early 18th century, they encountered a barren landscape with natives who went fishing on flimsy rafts made of reeds. By this time the land no longer provided materials for building the dugout canoes that characterized other Polynesian groups living farther to the west. Archeological records show that when the Rapa Nui first settled the island about 1,000 years ago, it was covered with lush vegetation and large trees. Today we know that the sophisticated civilization of the Rapa Nui suffered a spectacular collapse that had been preceded by deforestation and overfishing. To add insult to injury, the lack of building materials for seaworthy vessels ruled out emigration from the island. Consequently, starvation had decimated the captive population by the time Europeans made contact.
Fast-forward to the 21st century and the renewed interest in biofuels for transportation. The proponents of this pre-industrial practice of harvesting fuel from the land come from both ends of the political spectrum. Supporters on the right claim that biofuels enhance national security by reducing dependence on oil imports from the Middle East. Supporters on the left claim that biofuels are “carbon neutral” because they consume the products of present-day photosynthesis that are renewable. The fact remains that modern agriculture is fossil fuel intensive and the USDA’s calculated 34% fossil fuel “credit” for corn ethanol (whereby 1 unit of fossil fuel energy is needed to produce 1.34 units of ethanol energy) leaves much to be desired [
1]. In fact, the conversion of Indonesian peat bogs to palm nut orchards for the production of biodiesel is not only threatening many endangered species, it may also be releasing as much as 150 metric tons of carbon dioxide for each hectare of swampland that is modified [
2,
3].
3. Deconstructing the Myths about Switchgrass and Flex-Fuel Vehicles
Recent food shortages and the widespread belief that they were exacerbated by the diversion of food crops to biofuels has shifted the interest towards non edible feedstocks for the production of ethanol. Switchgrass is widely regarded as the “good” alternative to corn for a number of reasons. First, it is not a food, so using it for fuel should not directly affect grain prices. Second, since it can grow on marginal land it does have to displace land that is used for conventional crops. Third, since it is perennial it does not have to be plowed every year. Fourth, it requires little in terms of pesticide and fertilizers. What's there not to like about this native species whose cultivation has been regarded by some as a form of “restoration” ecology?
First, producing ethanol from cellulose is still more expensive than producing it from sugar or starch based feedstocks, even though the USDA and the Department of Energy (DOE) claim that 10 units of ethanol energy can be obtained for each unit of fossil fuel energy invested [
4]. Second, the cultivation of switchgrass also requires significant amounts of land and the need to harvest the bulk of its biomass means that it cannot serve as a viable wildlife refuge. Third, the soil nutrients which are being depleted by the constant biomass removal will have to be replenished. This hardly qualifies as “restorative” ecology. But let's suppose for the sake of argument that through technological improvements it is possible to make cellulose ethanol competitive with other biofuels. How many acres would need to be dedicated to switchgrass in order to replace all the gasoline consumed in the U.S.?
According to the DOE website, Americans consumed 9.3 million barrels of gasoline per day in 2007 [
5]. Since ethanol has about 67% the energy value of gasoline, 14 million barrels of ethanol are needed to replace this gasoline. At 42 gallons per barrel, this comes out to 580 million gallons per day or 210 billion gallons per year. Based on studies in Iowa and Nebraska, switchgrass can produce between 3.4 to 4 tons per acre per year [
6]. When this is averaged with 11.5 tons that was produced a study in Alabama you get a rough estimate of 8 tons per acre from which 774 gallons of ethanol can be
theoretically produced [
7,
8]. This means that 271 million acres will need to be dedicated to switchgrass production. At 640 acres per square mile, this adds up to 430,000 square miles. This is slightly larger than the combined area of Texas and Montana. Remember that these calculations do not take into account any of the fossil fuels that are needed to fertilize, harvest, and process this dubious ethanol feedstock.
Table 1.
Approximate Square Miles of Land Needed to Replace Gasoline with Ethanol.
Table 1.
Approximate Square Miles of Land Needed to Replace Gasoline with Ethanol.
| U.S. daily gasoline use (2007) | Divide by 0.67 (mpg ethanol /mpg gasoline) | Multiply by 42 gal./ barrel | Multiply by 365 days/ year | Divide by 97 gal./ ton switch-grass | Divide by 8 ton/ acre switch-grass | Divide by 640 acre/ sq. mile |
|---|
| 9.3 million bbl./day gasoline | 14 million bbl. / day ethanol | 580 million gal. / day ethanol | 210 billion gal. / year ethanol | 2.20 billion ton / year switch-grass | 270 million acres / year | 430,000 sq. mi. / yr. |
The so-called “flex-fuel” vehicles which can run on gasoline, ethanol, and methanol are part of the same scam. The main argument in their defense is that these cars are much more affordable than plug-in hybrids or fuel cell vehicles, and even if we cannot grow all of the ethanol we need today we can always import all the sugarcane ethanol we need from Brazil. After all, most cars in Brazil have been running on ethanol for decades. But Brazilians can run their cars on ethanol without drastic ecological consequences only because there are not enough cars in Brazil to make huge demands on the land. According to NationMaster.com, car ownership in Brazil is about 10 times lower than it is in the U.S. Consequently, the large scale importation of ethanol to supplement American energy needs would only serve to outsource environmental degradation to one of the world's most important ecosystems. Methanol may seem like a better option for flex-fuel vehicles because it is made from natural gas. But the energy value of methanol is even lower than that of ethanol, and it is currently more efficient and cost-effective to modify internal combustion engines to run directly on natural gas than to convert the gas to methanol for flex-fuel vehicles. In effect, flex-fuel vehicles only encourage the use of alternative fuels that are less efficient and often more ecologically harmful than gasoline.
4. Coming to Terms with Our Relationship to Fossil Fuels
Jared Diamond's 2005 bestseller “Collapse: How Societies Choose to Fail or Succeed” is a timely account of pre-industrial societies that suffered rapid decline and the lessons they provide for today. Without exception, from the Mayans to the Greenland Vikings the story is one of deforestation followed by soil degradation which in turn was followed by a precipitous decline in the standard of living. This allegory can be witnessed in real time on the island of Hispaniola, where airline passengers can observe the tree line that marks the border between the Dominican Republic and Haiti. Sadly, much of the deforestation in Haiti continues to this day as wood is harvested to produce charcoal for cooking. According to Diamond, the Dominican Republic avoided this fate by way of aggressive government policies that protected the forests and promoted the use of natural gas as an alternative to biofuels [
9]. While some may regard the use of fossil fuel as a means to spare the environment as counterintuitive, it shouldn't be: The first large-scale use of fossil fuels took place in Britain, when the forests could not supply enough firewood to fuel the Industrial Revolution.
Fossil fuels greatly improved the standard of living during the 19th century because they satisfied a rapidly growing fuel demand while sparing the land. For the first time in history, rapid population growth was not followed by a comparable level of deforestation and soil degradation. Granted, the problems associated with fossil fuels are real, and given the low cost of domestic coal and Middle East petroleum we cannot rely entirely on the free market to improve energy security or reduce air pollution. But this does not justify raping the Great Plains to benefit an interest group (whose trump card is the Iowa Caucus). In order to surpass the critical thinking skills of the people we voted into office, we must acknowledge the following inconvenient truths about energy, economics, and politics:
First, we must distinguish between energy
sources and energy
carriers. Energy sources such as sunlight, fossil fuels and fissionable uranium are ready-made. Energy carriers such as ethanol, rechargeable batteries, and hydrogen (obtained from water), require significant inputs of present-day energy. In all of these cases the energy input exceeds the useful energy you get back. For example, for every 50 kilowatt hours of electricity you apply to produce 1 kg of hydrogen, you get back 34 kilowatt hours when this same amount of hydrogen is consumed in a fuel cell [
10,
11]. This is slightly below the average charging efficiency of a lead acid battery [
12]. Hydrogen can be extracted from natural gas with much less effort, but the energy consumed in order to compress the hydrogen for storage and transportation is much higher than that which is needed for natural gas. Therefore, only careful “well-to-wheel” analysis (net energy from the source that is left over to turn the wheels) can reveal the true cost of an energy carrier.
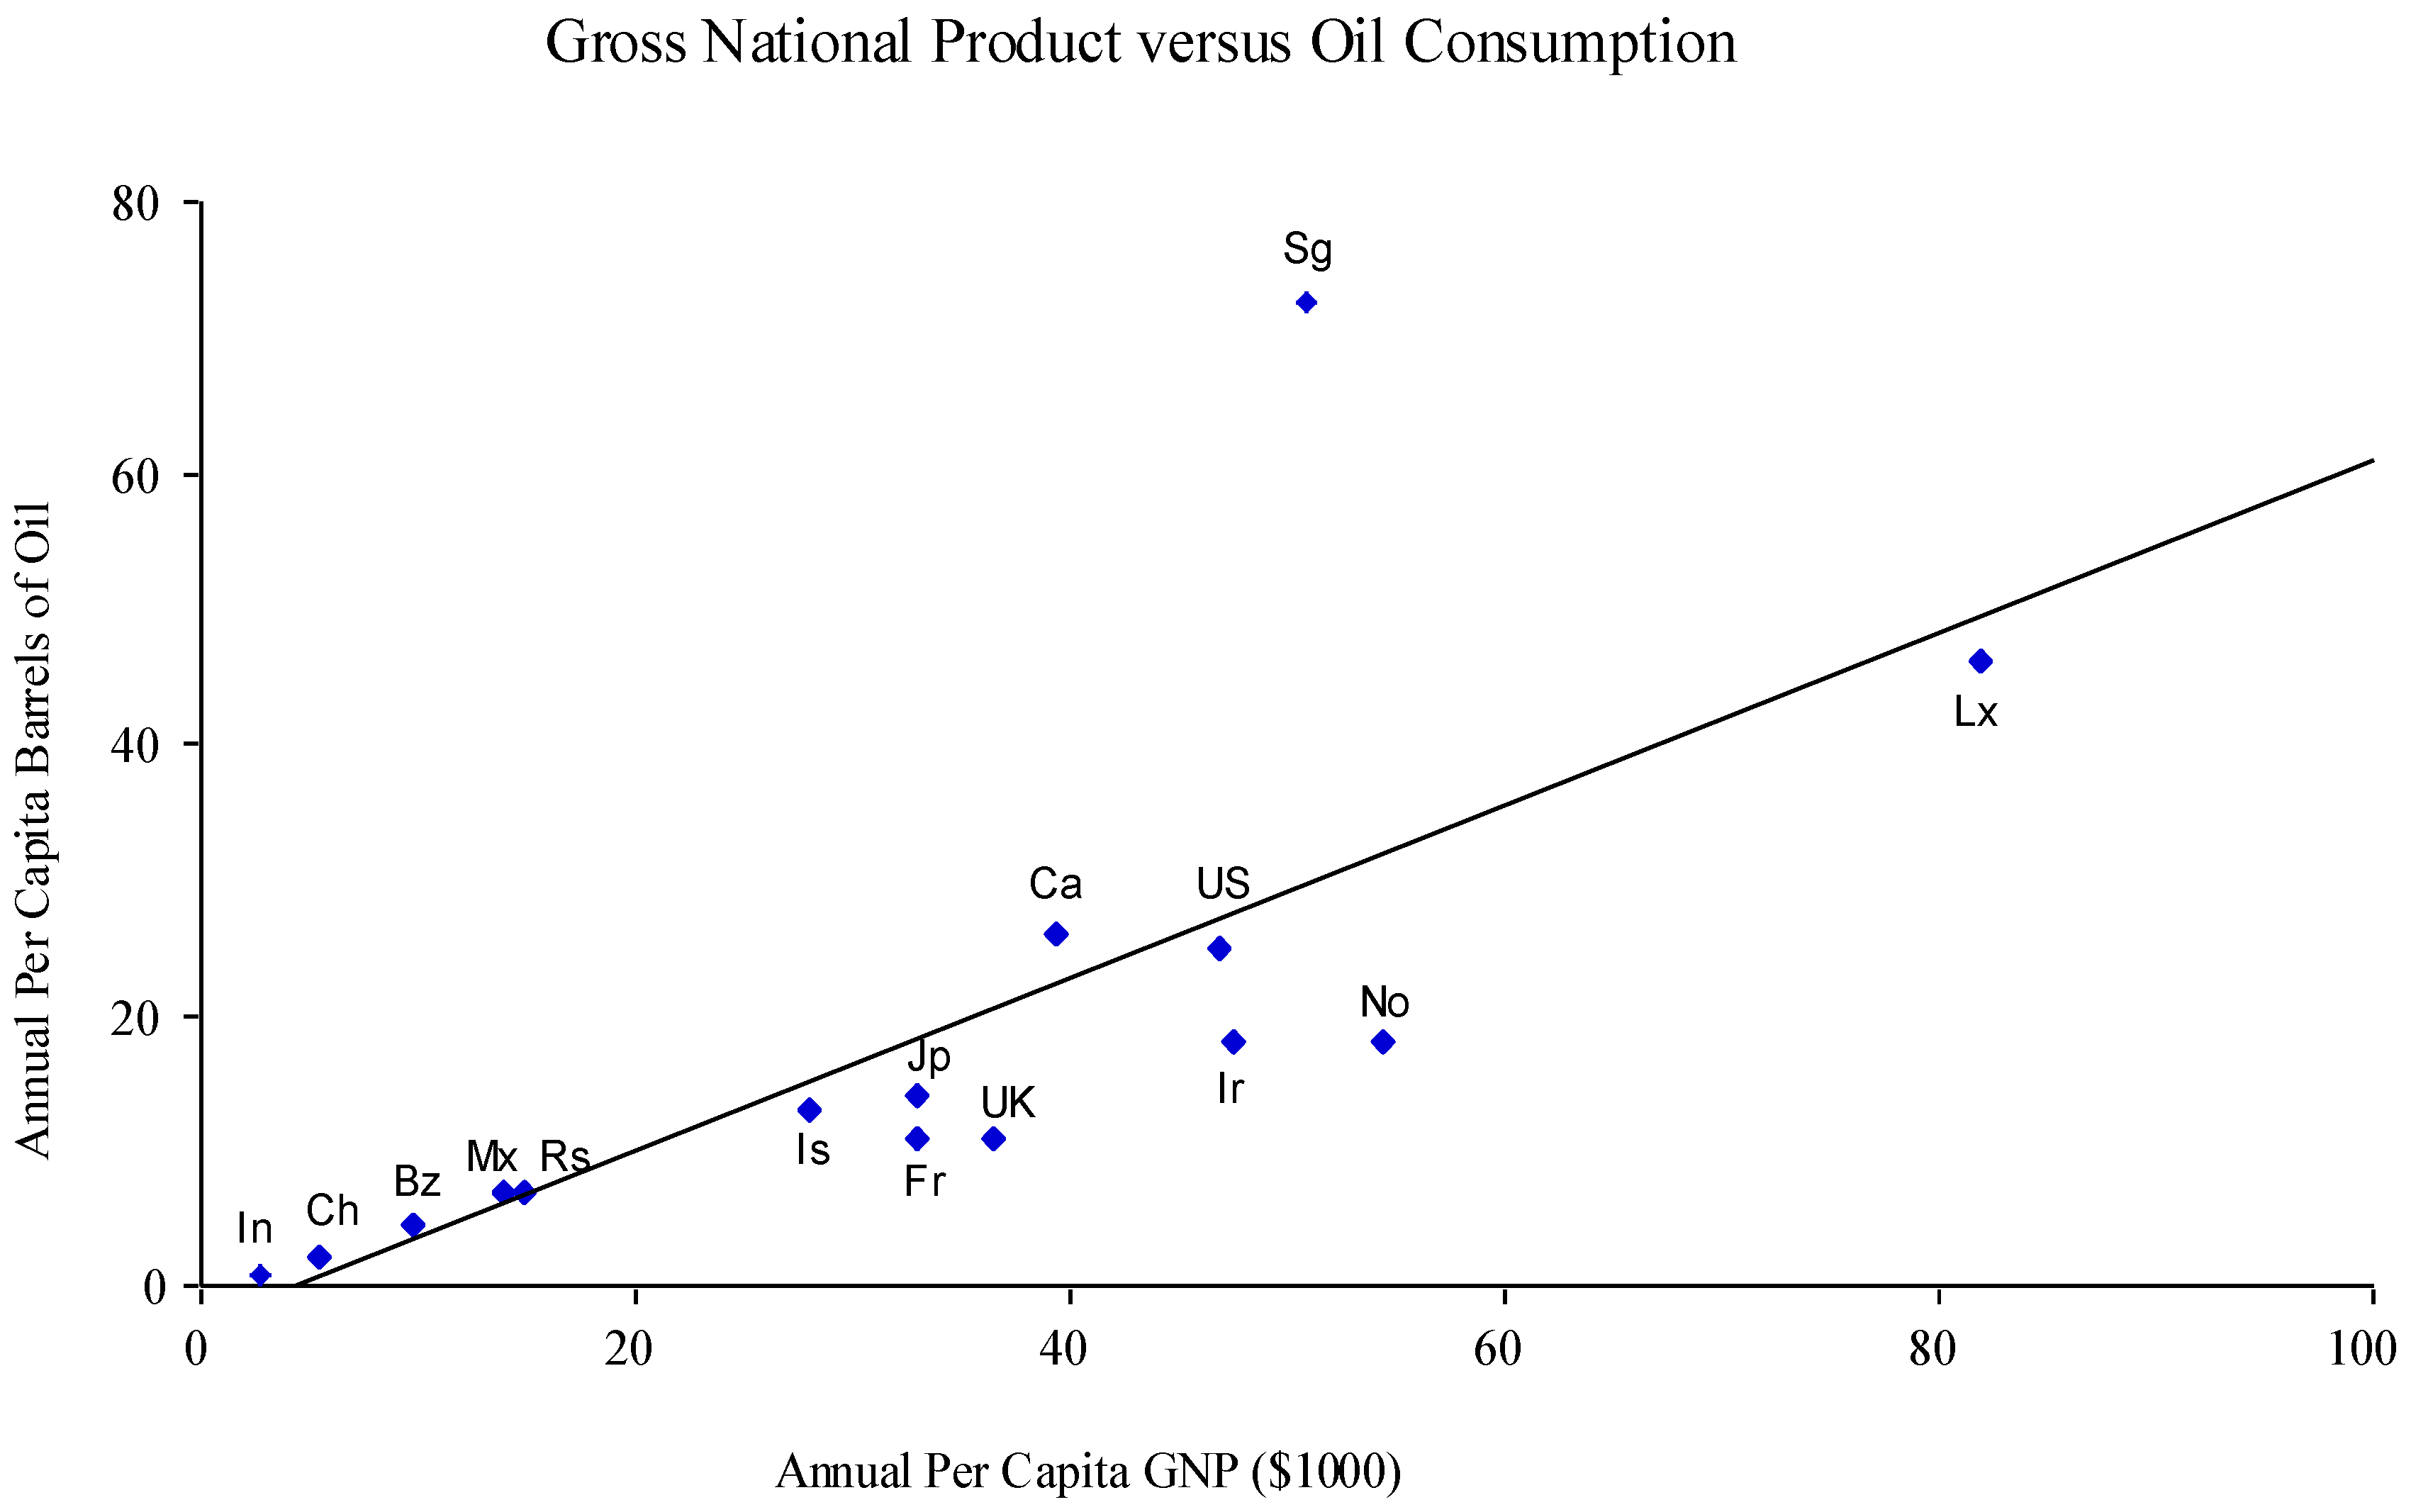
Second, countries usually generate wealth in proportion to the amount of energy they consume (See
Figure 1 and
Figure 2). This is particularly true for petroleum because it is the most convenient source of energy for transportation. This does not mean that poverty is the only “proven” way to save energy. It does mean that policy-makers will really need to think out of the box to develop comprehensive solutions that do not wreck the economy.
Third, the Middle East contains about two thirds of the world's oil reserves. As oil demand increases these countries will gain a larger share of the world market.
Figure 1.
Gross national product and oil consumption in selected countries (2007). Countries include Brazil (Bz), Canada (Ca), People’s Republic of China (Ch), France (Fr), India (In), Israel (Is), Republic of Ireland (Ir), Japan (Jp), Luxembourg (Lx), Mexico (Mx), Norway (No), Russia (Rs), Singapore (Sg), United Kingdom (UK), and United States (US). Nations that lie below the line are more “efficient” in their use of petroleum in relation to GNP. Singapore appears to be the energy “villain” despite its excellent public transportation system and severe restrictions on car ownership. This is a statistical artifact that can be attributed to Singapore’s role as a major refueling port for cargo vessels from other countries (source: The CIA World Factbook.
https://www.cia.gov/library/ publications/the-world-factbook/; all data from 2007).
Taken together, these facts present a “Catch-22” situation: If we do not diversify our sources of energy, we will find ourselves increasingly dependent on the Middle East. If on the other hand we substitute an inferior product for petroleum, we risk undermining both the economy and our ability to finance our national security. In this war of ideas, too much is at stake for politicians and voters to rely on experts whose methodology they do not grasp. All too often this favors salesmanship over sound science.
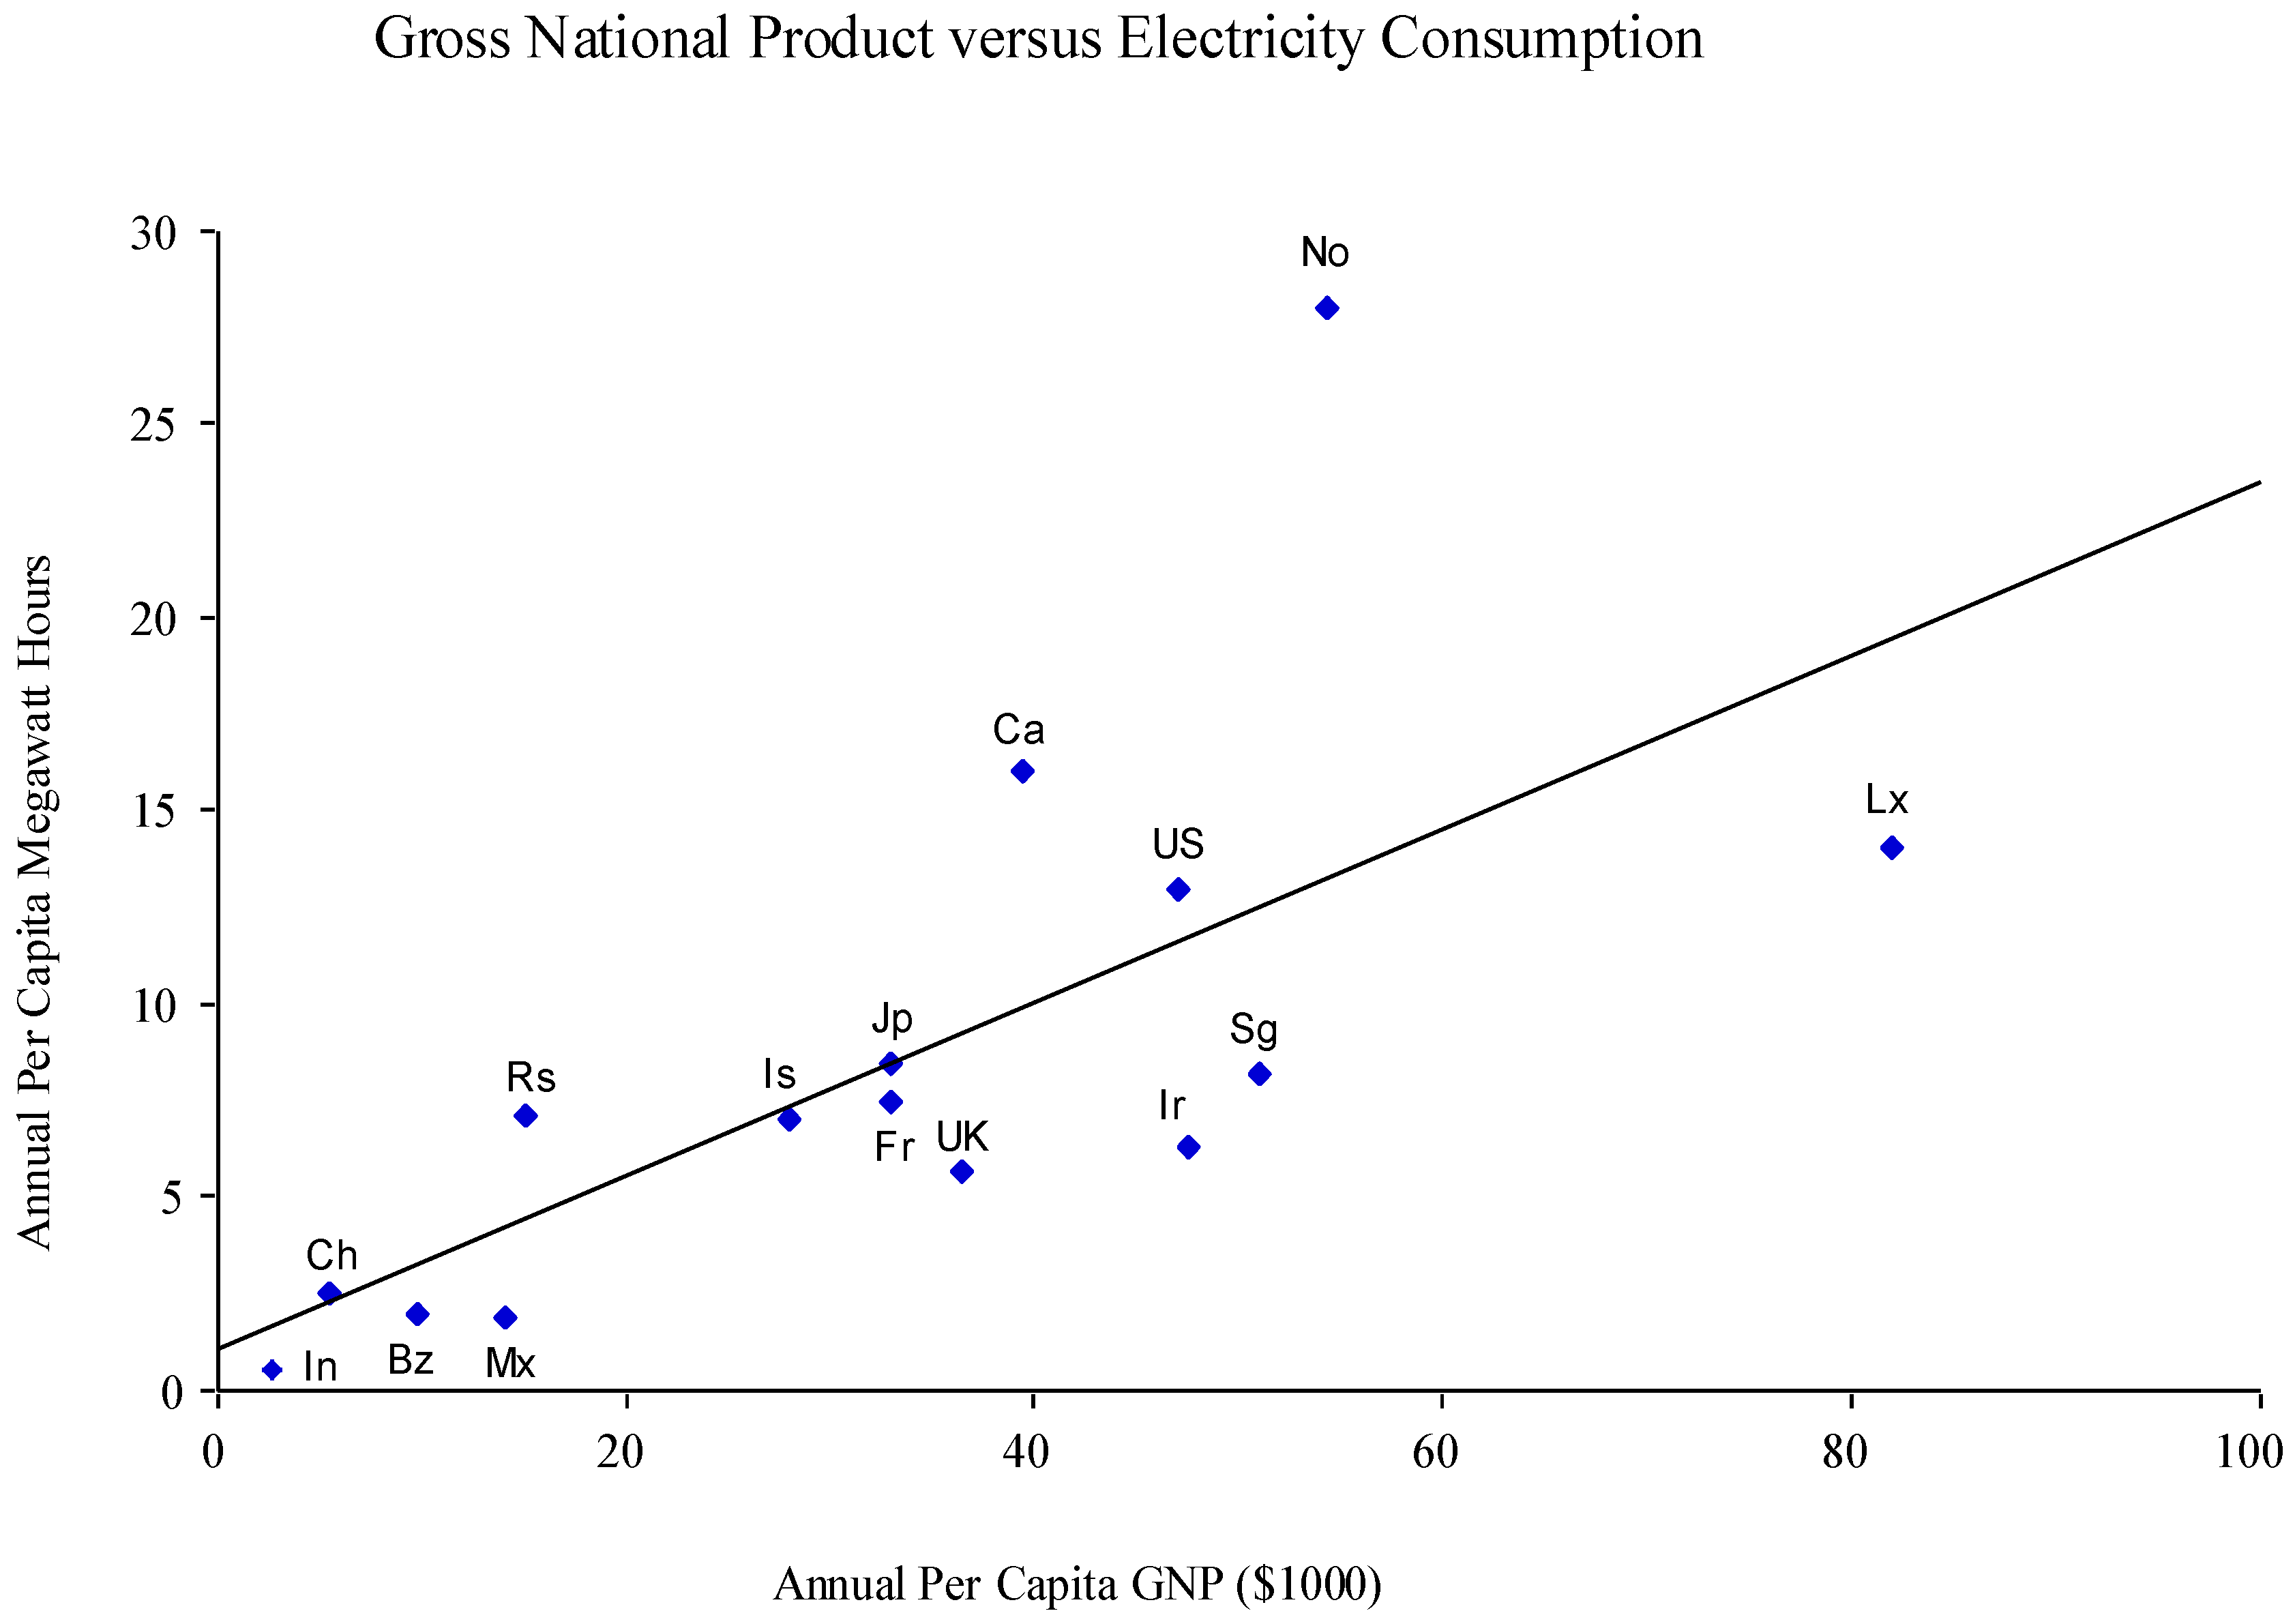
Figure 2.
Gross national product and electricity consumption in selected countries (2006-2008). Countries include Brazil (Bz), Canada (Ca), People’s Republic of China (Ch), France (Fr), India (In), Israel (Is), Republic of Ireland (Ir), Japan (Jp), Luxembourg (Lx), Mexico (Mx), Norway (No), Russia (Rs), Singapore (Sg), United Kingdom (UK), and United States (US). Note that high latitude countries such as Russia, Canada, and Norway use disproportionate amounts of electricity. This can be attributed to long winter nights that require more hours of artificial lighting (source: The CIA World Factbook.
https://www.cia.gov/library/publications/the-world-factbook/; GNP data from 2007; electricity data from 2006-2008).
5. The Teaching of “Pathway Analysis” in High School
One effective way to improve energy literacy is to incorporate well-to-wheel analysis into the high school curricula. In its standard form, this sometimes involves arcane calculations that a layman can only accept on faith in the expert who is presenting it. This is not conducive to rational debate, so I present my Environmental Science students a more accessible form of well-to-wheel that focuses on alternate pathways for conventional fuels using indisputable raw data from the DOE. Let’s call it “pathway analysis”. For example, a Ford F-150 pick-up truck running on natural gas gets an average of 13 miles per gallon of natural gas [
13]. At 1.2 gallons per 100 cubic feet, this comes out to roughly 16 miles per 100 cubic feet of natural gas [
14]. One alternative is to use this gas to generate electricity that is used to charge a similarly sized electric Ford Explorer that gets an average of 1.8 miles per kilowatt hour [
15]. According to DOE records, U.S. utility companies produced an average of 0.118 kilowatt hours of electricity per cubic foot of natural gas in 2006 [
16]. After multiplying this by 0.85 and 0.75 to take into account 15% transmission losses and 75% charging efficiency for the lead-acid batteries of the Explorer, there are 7.5 kilowatt hours to power the motor [
12,
17]. After multiplying by 1.8 miles per kilowatt hour the final result is 14 miles per 100 cubic feet of natural gas. This efficiency is comparable to that of the pick-up truck that uses an internal combustion engine, but the biggest dividend for this indirect pathway is the wider variety of options for generating electricity, making electric cars the ultimate flex-fuel vehicle.
Table 2 is a summary of these calculations starting with total electricity produced in 2006 multiplied by the raio of kilowatt hours produced using natural gas, then divided by all of the gas consumed for electricity during this same year (not itemized in the previous paragrah) [
16]:
Table 2.
Natural Gas to Electricity to Battery-Powered Ford Explorer.
Table 2.
Natural Gas to Electricity to Battery-Powered Ford Explorer.
| U.S. total kWh (2006) | Multiply by 0.200 (20.0% of total) | Divide by 6.87 trillion cubic ft. gas | Multiply by 0.85 trans-mission loss | Multiply by 0.75 battery efficiency | Multiply by 1.8 miles / kWh | Multiply by 100 |
|---|
| 4.065 trillion kWh | 0.813 trillion kWh from gas only | 0.118 kWh / cubic foot gas | 0.100 kWh / cubic foot gas | 0.075 kWh / cubic foot gas | 0.14 miles / cubic foot gas | 14 miles / 100 cubic feet gas |
Table 3.
Natural Gas to Internal Combustion Engine Ford F-150.
Table 3.
Natural Gas to Internal Combustion Engine Ford F-150.
| Average gas mileage | Multiply by 1.2 gal./100 cubic feet gas |
|---|
| 13 miles/ gallon gas | 16 miles/ 100 cubic feet gas |
6. The Application of Pathway Analysis to Switchgrass
What if we were to apply pathway analysis to compare the efficiency of cellulose-derived ethanol to biomass-derived electricity? Based on the aforementioned data, 4.84 gallons of ethanol can be theoretically produced from 100 lbs of switchgrass [
8]. Since a conventional Ford Explorer gets an average of 17 miles per gallon of gasoline, its flex-fuel equivalent will get about 12 miles per gallon of ethanol. This is roughly 58 miles per 100 pounds of switchgrass. As for the other pathway, 1.29 lbs of switchgrass produces the same amount of heat as 1.00 lb of coal and DOE records show that 1 lb of coal produces 0.962 kilowatt hours of electricity [
16,
18]. Putting this together we can deduce that the same mass of switchgrass produces 0.746 killowatt hours when it is burned in at an electric plant. As in the previous example involving natural gas, this electric energy must be multiplied by 0.85 and 0.75 to account for transmission and charging losses before multiplying by 1.8 miles per kilowatt hour. The end result is 86 miles per 100 lbs of switchgrass biomass - a 50% energy dividend over the ethanol pathway. Based on a study carried out at the University of California, this pathway can earn as much as 81% more kilometers [
19]. Granted, our crude analysis does not take into account the energy cost of producing ethanol from cellulose nor the energy credit from unfermented biomass that can still be burned, but even a high school student can do this math.
Table 4 is a summary of these calculations starting with total electricity produced in 2006 multiplied by the raio of kilowatt hours produced using coal and divided by all of the coal consumed for electricity during this same year (not itemized in the previous paragrah) [
16]:
Table 4.
Switchgrass to Electricity to Battery-Powered Ford Explorer.
Table 4.
Switchgrass to Electricity to Battery-Powered Ford Explorer.
| U.S. total kWh (2006) | Multiply by 0.490 (49.0% of total) | Divide by 1.035 billion tons | Divide by 2,000 lbs/ton | Divide by 1.29 lbs switch./lb coal | Multiply by 0.85 transm. loss | Multiply by 0.75 battery efficiency | Multiply by 100 | Multiply by 1.8 miles /kWh |
|---|
| 4.065 trillion kWh | 1.99 trillion kWh from coal only | 1,920 kWh/ton coal | 0.962 kWh/lb coal | 0.746 kWh/lb switch-grass | 0.63 kWh/lb switch-grass | 0.48 kWh/lb switch-grass | 48 kWh/100 lbs switch-grass | 86 miles/100 lbs switch-grass |
Table 5.
Switchgrass to Ethanol to Internal Combustion Engine Ford Explorer.
Table 5.
Switchgrass to Ethanol to Internal Combustion Engine Ford Explorer.
| Average gas milege | Multiply by 0.67 (mpg ethanol/mpg gasoline) | Multiply by 4.84 gal. per 100 lbs |
|---|
| 17 miles/gal. gasoline | 12 miles/gal. ethanol | 58 miles/100 lbs switch-grass |
7. Conclusions
I do not present these models in order to promote the burning of switchgrass nor even the mass production of sport utility vehicles with lead-acid batteries. I want to provide a clearer perspective on how energy can be extracted from waste biomass like corn stalks and lay to rest (in layman’s terms) the widespread belief that electric cars always consume more fuel due to energy conversion losses (these losses are compensated by the efficiency of the massive turbine engines being used to generate the electricity). Perhaps in the near future this skill will help my students evaluate better options (like lighter batteries that are both safe and affordable), but the use of land for the express purpose of energy production should never be regarded as an option because soil is a non-renewable resource. Algae culture on the other hand, whether it is used to make biodiesel or even combustible biomass is a legitimate avenue for research because it spares the land and it can be integrated with sewage facilities, power plants, and cement factories as a means to reduce nutrient overload and carbon dioxide emissions. On a good day algae can double its biomass in a matter of hours, but for this to become a cost effective biofuel, breakthroughs for reducing energy cost of harvesting these microorganisms from the water are needed.
It is unlikely that President Obama or any future president will need to approve of placing hundreds or even tens of thousands of square miles under the plow in order to appease the grain lobby, but great damage may occur along the way in terms of wasted resources and complacency. The more likely worst case scenario for America is not a collapse like that of the Rapa Nui in Easter Island, but a gradual decline in living standards and national security -much like the future that Jared Diamond predicts for Australia, as sheep nibble away at what is left of the fragile ecosystem [
20]. In the final analysis, our transportation system is far from sustainable, and improved standards of living in China and India will no doubt create enormous strains on natural resources. Therefore, only an interdisciplinary approach that integrates other factors that affect transportation like urban planning, internet technology, and even “full world” economics can fully address this crisis [
21].
While the laws of thermodynamics make it clear that there is no such thing as a free lunch, meticulous and carefully itemized well-to-wheel studies (carried out by independent scientists who are not beholden to the Archer Daniels Midland Company or the politics du jour) can at least sort out the bargains from the boondoggles. Complimenting this should be a critical mass of energy literate politicians and voters providing the political will to do the right thing.


