Article

Health Risks from Intake and Contact with Toxic Metal-Contaminated Water from Pager River, Uganda

1
Department of Chemistry, University of Kerala, Thiruvananthapuram 695581, India
2
Department of Chemistry, Faculty of Education and Humanities, Gulu University, Gulu P.O. Box 166, Uganda
3
Department of Chemistry, Faculty of Science, Mbarara University of Science and Technology, Mbarara P.O. Box 1410, Uganda
4
Department of Nutritional Sciences and Dietetics, Kyambogo University, Kampala P.O. Box 1, Uganda
5
Department of Environmental Health and Disease Prevention, Faculty of Public Health, Lira University, Lira P.O. Box 1035, Uganda
6
School of Water, Energy and Environment, Water Science Institute, Cranfield University, College Road, Cranfield MK43 0AL, UK
7
Department of Physical Sciences, Kampala International University, Kampala P.O. Box 20000, Uganda
8
Department of Science and Vocational Education, Lira University, Lira P.O. Box 1035, Uganda
9
Chemistry Division, Testing Department, Uganda National Bureau of Standards, Kampala P.O. Box 6329, Uganda
*
Author to whom correspondence should be addressed.
J. Xenobiot. 2023, 13(4), 544-559; https://doi.org/10.3390/jox13040035
Submission received: 29 August 2023 / Revised: 20 September 2023 / Accepted: 22 September 2023 / Published: 26 September 2023

Abstract

:
Pollution of water resources is one of the major impediments to the realization of Sustainable Development Goals, especially in developing countries. The aim of this study was to investigate the physicochemical quality and potentially toxic element (lead and cadmium) concentrations in surface water sampled from Pager River, a tributary of the Nile River in Northern Uganda. Water samples (n = 18) were taken from six different points upstream (A, B, and C) and downstream (D, E, and F) of the river and analyzed following standard methods for their physiochemical properties. Atomic absorption spectroscopy was used to quantify lead and cadmium concentrations. Human health risks from ingestion and dermal contact with potentially toxic metal-contaminated water were calculated. The results obtained indicated that the mean temperature (27.7 ± 0.5–29.5 ± 0.8 °C), turbidity (40.7 ± 2.1–50.1 ± 1.1 NTU), lead (0.296 ± 0.030–0.576 ± 0.163 mg/L) and cadmium (0.278 ± 0.040–0.524 ± 0.040 mg/L) occurred at levels that surpassed their permissible limits as per World Health Organization guidelines for drinking water. Human health risk assessment showed that there are potential non-cancer risks from the ingestion of water from Pager River by adults, as the total hazard quotients were greater than one. These results emphasize the urgency to restrict the dumping of wastes into the river to minimize chances of impacting the Nile River, which flows northwards to the Mediterranean Sea. Further studies should perform routine monitoring of the river during both dry and wet seasons to establish the spatiotemporal variations of physicochemical, microbial, and trace metal profiles of the river and the associated health risks.

1. Introduction

Water is one of the most important and infinite resources with an increasingly growing demand. It is a fundamental resource for life as well as economic development [1,2]. In the simplest definition, water is life [3], but its availability is becoming compromised by the increasing global population, resource-intensive economic development, and the introduction of anthropogenic contaminants [4]. One of the “Global Goals”, i.e., the sixth Sustainable Development Goal, emphasizes maintenance of water quality and availability. However, deterioration of water quality by inorganic, legacy, and emerging organic pollutants has led to water insecurity, nutrient–climate synergized eutrophication, and harmful algal blooms [5,6]. Thus, the protection and regulation of water quality only transcend national boundaries in the developed countries, i.e., in developing countries, water pollution is less regulated [4].
Africa has one of the largest numbers of water resources. The continent has some of the most unique freshwater systems worldwide [7,8]. Eastern Africa is among the most environmentally diverse regions of Africa, and this diversity is reflected in its hydrology, characterized by various water resources such as Lake Victoria, Lake Tanganyika, Lake Malawi, and the Nile River [9]. Contamination of water resources in the region by both legacy and emerging organic and inorganic contaminants has been reported [10]. Of these, contamination by potentially toxic elements (PTEs) has been the most pronounced, and it is one of the critical parameters being monitored in drinking water in the region [11]. PTEs, previously termed as heavy metals, are elements with high molecular weights (or densities that are at least five-fold greater than that of water) [12]. They include lead (Pb), cadmium (Cd), copper, iron, zinc, nickel, vanadium, arsenic, chromium, and mercury, among others [13]. These PTEs are toxic, especially at higher concentrations, but their levels of toxicity are influenced by valence states, exposure routes and times, bioavailable forms and levels, and the ingested quantity [14].
Lead (density = 11.34 g/cm3) is a relatively unreactive post-transition element that is known to be neurotoxic [15,16]. Long-term exposure causes Pb poisoning and hypertension [17,18]. According to available statistics from the World Health Organization (WHO), exposure to Pb causes at least 900,000 deaths per year and up to 30% of the global burden of developmental intellectual disability [19]. Inorganic Pb compounds are also listed as probable human carcinogens (Group 2A) [20]. Although there has been global compliance with the United States Environmental Protection Agency (US EPA) 1991 Lead and Copper Rule and the ban on the use of leaded fuel, drinking water remains an important source of exposure to Pb [21]. Thus, the WHO has enlisted Pb as a priority chemical hazard that should be rigorously monitored in drinking water [19]. Cadmium (density = 8.65 g/cm3), on the other hand, is a silvery element implicated in the etiology of hypertension, hepatic injury, malignancies, kidney dysfunction, and arteriosclerosis [22]. Short-term exposure to high levels of Cd can induce vomiting, diarrhea, coughing, chest pain, muscle cramps, loss of dental alveola, osteotoxicity, salivation, and sensory imbalances [23,24]. Similar to Pb, Cd is classified as a probable human carcinogen (Group B1) by the US EPA and International Agency for Research on cancer [25]. It is, therefore, one of the 10 WHO priority elements that has to be monitored in drinking water [19].
This study considered the Pager River, one of the rivers in Uganda. According to a recent study [26], the physicochemical and microbiological parameters of water in the Pager River are above the regulatory limits set by the Uganda National Environmental Management Authority. The river is majorly polluted by dumped wastes [27], and anecdotal reports have positioned that there are some illnesses due to using water from the Pager River [28]. In 2021, the Pager and Akeca Rivers were reportedly polluted by a strange whitish chemical that caused fish, lizard, and tortoise deaths [29]. The aim of this study was, therefore, to investigate the physicochemical quality and Pb and Cd concentrations in water sampled from the Pager River, a tributary of the Nile River in Northern Uganda. The human health risk assessment model proposed by the US EPA [30] was used to establish potential health risks that could be experienced by the local population after dermal contact and drinking water from the river.

2. Materials and Methods
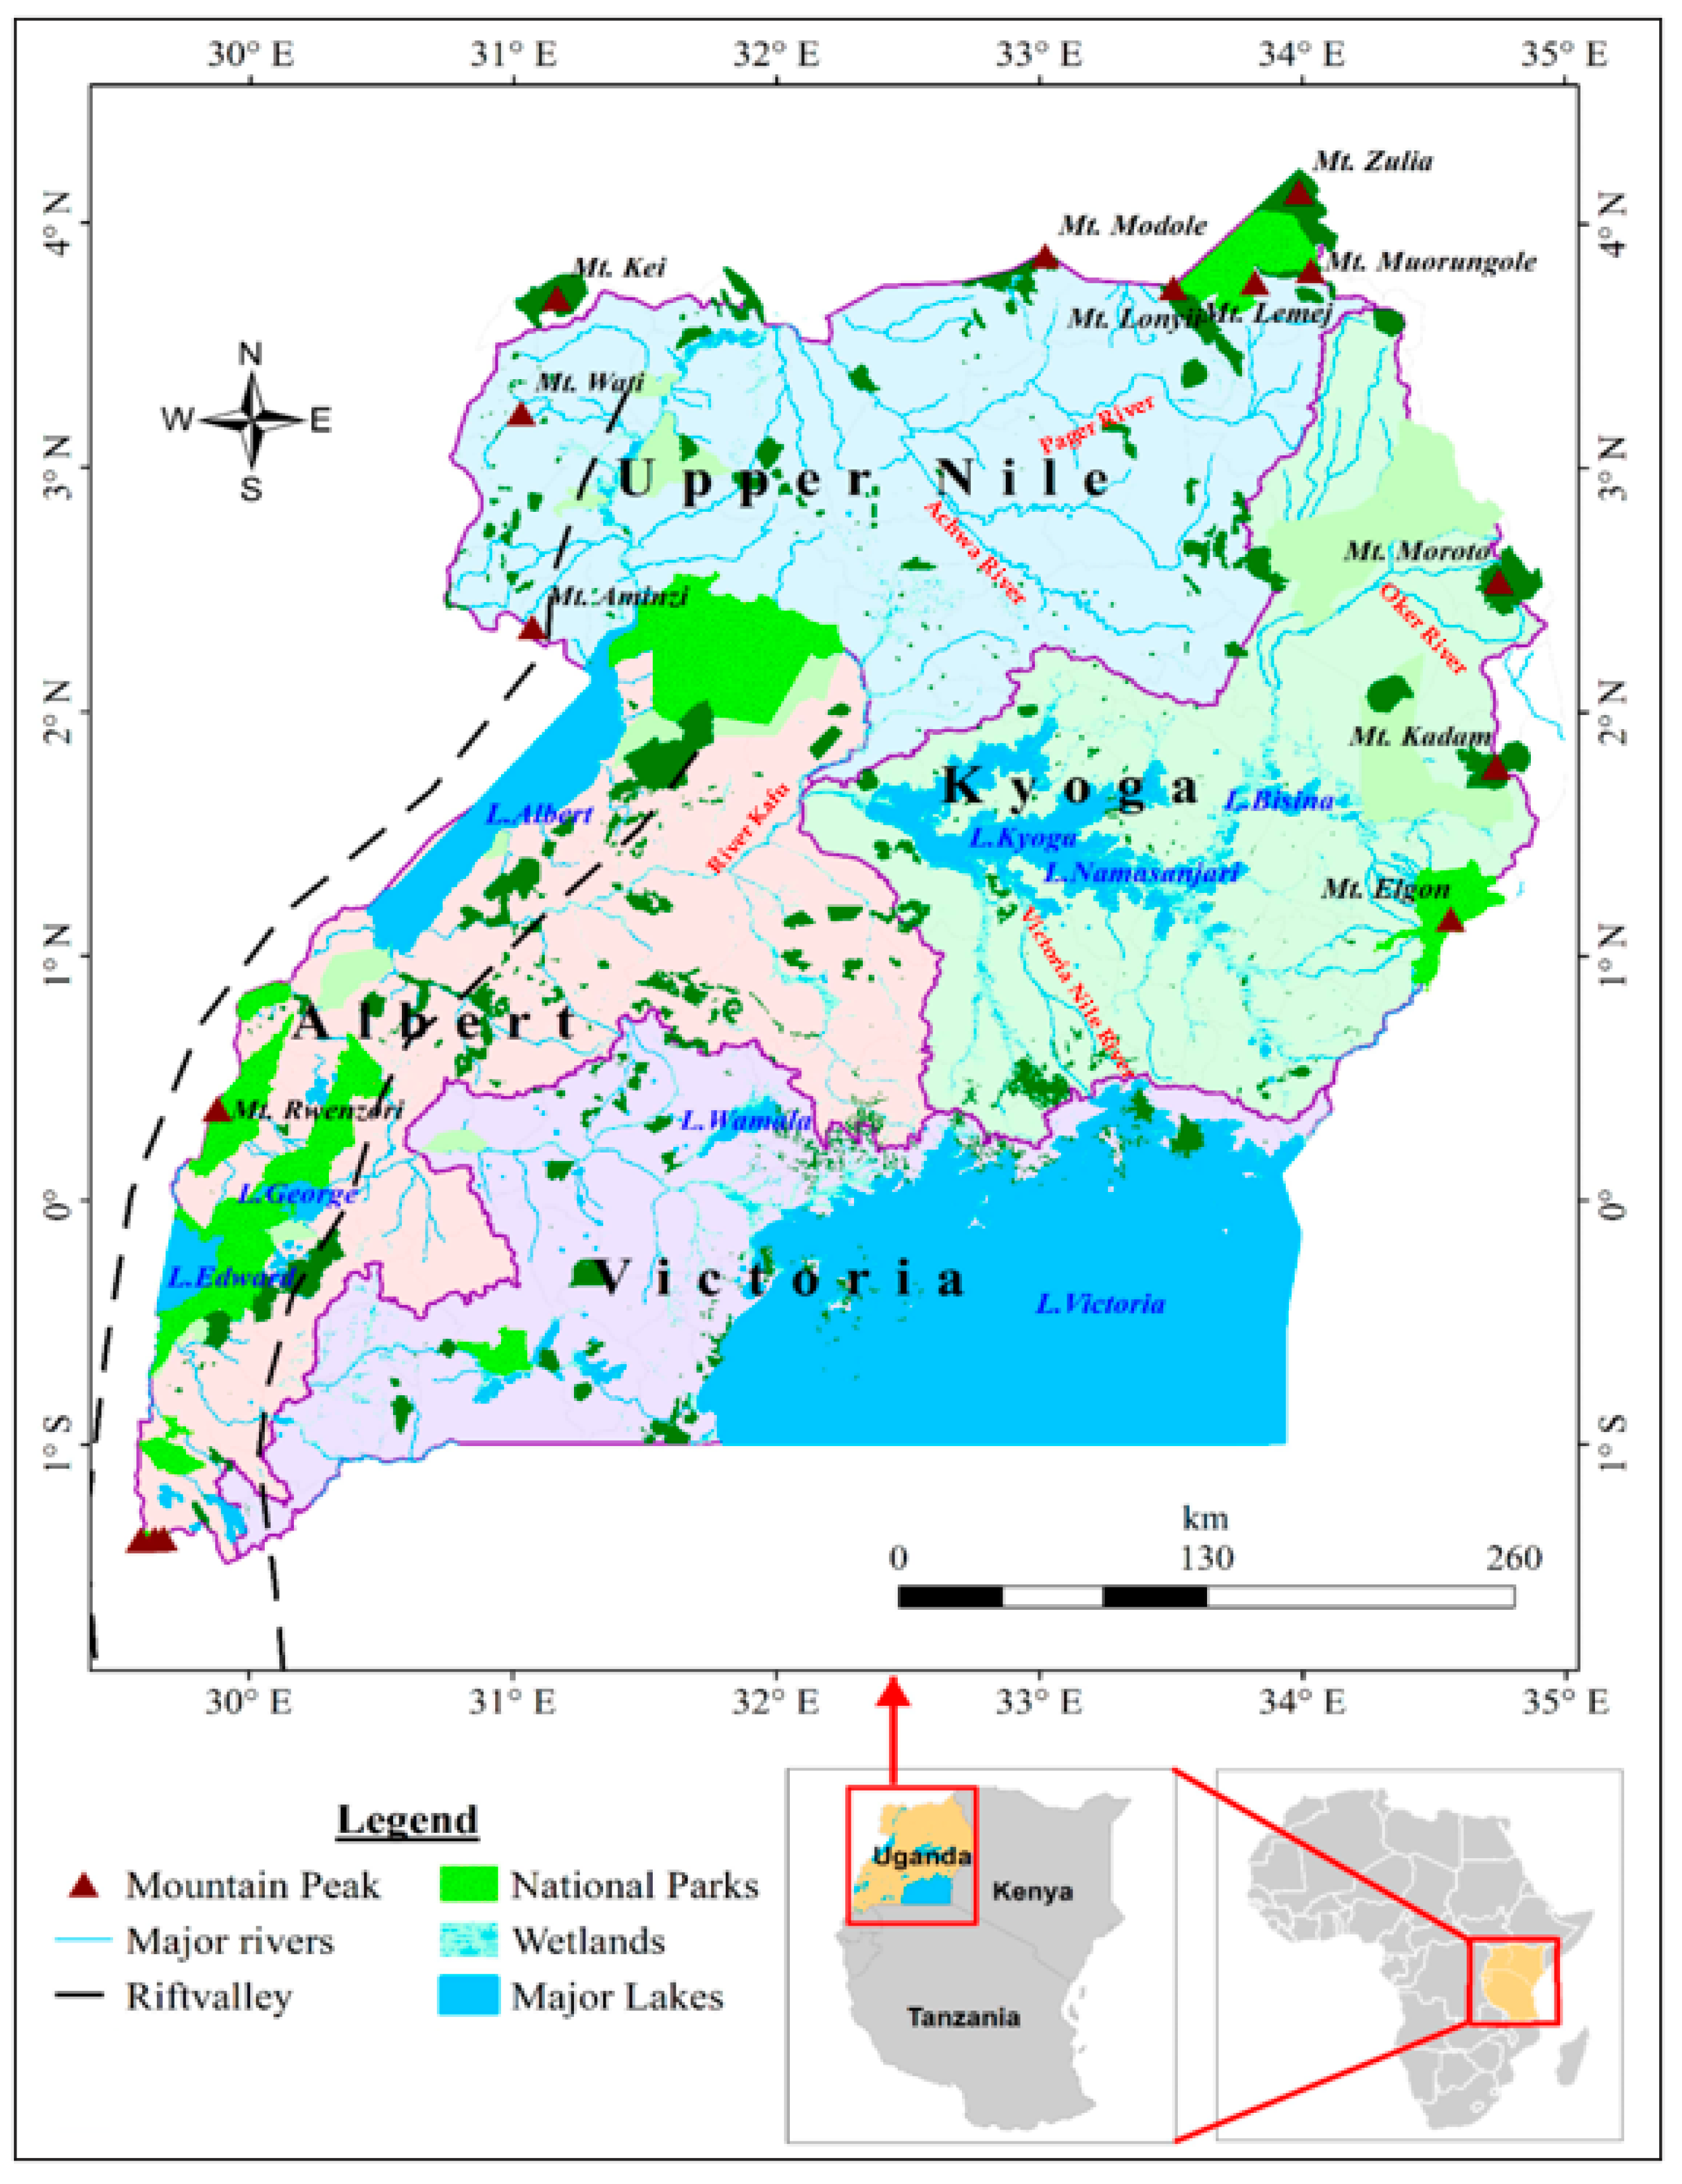
2.1. Study Area

The Pager River (latitude: 3°16′2.28″, longitude: 33°5′29.4″) is the longest perennial river and tributary of the Nile River, the longest river in Africa. The river is located in the Kitgum District (“the place of good luck”), Northern Uganda, East Africa at an elevation of 973 m above sea level (Figure 1) [31]. It flows through the sub-counties of Labongo Layamo, Labongo Akwang, and Labongo Amida, Kitgum municipality and joins the Achwa River with the Agago River after covering a distance of 194.79 km [32,33,34,35]. The Pager River is part of the Achwa River basin, and it was chosen in this study because: (i) its banks have dense settlements (Kitgum Matidi), agricultural farm lands, and car-washing bays that are prone to flooding after its banks burst [28,31,36,37]; (ii) its location in one of the three districts that suffered the brunt of the Lord’s Resistance Army civil wars in Northern Uganda (between 1986 and 2006) and therefore had the highest number of internally displaced persons in camps [38]; and (iii) it covers both the nodding syndrome and onchocerciasis-hyperendemic foci that is in proximity to blackfly breeding sites. Along with the Aswa and Agago Rivers, the Pager River was aerially sprayed in 2012 to eradicate blackflies in the region [39,40].

2.2. Chemicals and Reagents Used

Deionized water (conductivity < 1.0 µS/cm, with undetectable Pb and Cd contents) was from the Uganda National Bureau of Standards (UNBS), Chemistry Laboratory, Kampala, Uganda. All the other reagents and chemicals were of high analytical purity and were supplied by Merck (Darmstadt, Germany), Sigma-Aldrich (St. Louis, MO, USA), or HiMedia Pvt Laboratories (Mumbai, India).

2.3. Sampling Procedures

To characterize water quality and its spatial variability along the river network, two different sampling sites were chosen to study the physiochemical parameters of the Pager River. These sites were the Guu A Parish and the Westland A Parish. The Guu A Parish is where the river approaches the Kitgum municipality and is characterized by activities such as cattle bathing, cloth laundering, and agriculture. It includes the northern pediment slopes of the flat-topped granitic Pandwong inselberg, which is encircled on all its sides by the Pager River [31]. Westland A Parish, on the other hand, is located at the center of the Kitgum municipality (next to the Kitgum main market, with over 500 salespersons) and is the most densely populated part of the district, with grass-thatched houses (slums) and very poor sanitation, drainage, and waste-disposal practices [27,41]. It has small-scale industries and local brewers who discharge untreated industrial wastes into the Pager River [27].
A total of eighteen (18) water samples were collected from six sites designated as A, B, and C in the Guu A Parish (upstream) and D, E, and F in the Westland A parish (downstream). Sampling was performed in June 2023 at a depth of 10–15 cm below the water surface using clean 500 mL polyethylene terephthalate bottles with screw caps.

2.4. Physiochemical Analysis of Samples

Non-conservable parameters (temperature, pH, electrical conductivity, and total dissolved solids) of the samples were measured onsite using an HI 98129-HI 98130 pH/TDS/temperature/conductivity meter (Hanna Instruments Inc., Woonsocket, RI, USA). Turbidity was measured using a calibrated Palintest photometer 7100 (Palintest®, Gateshead Tyne & Wear, UK) following the manufacturer’s instructions.
Figure 1. Map showing the location of the Pager River and some other major rivers in Uganda. Adapted from Onyutha et al. [42].
Jox 13 00035 g001

2.5. Lead and Cadmium Contents of the Water Samples

The collected samples from each site were evaporated to dryness. Concentrated nitric acid (10 mL), perchloric acid (2 mL), and hydrofluoric acid (4 mL) were added to the residue and then heated to dryness once more. The final residue was thereafter reconstituted in 2 mL of 2M hydrochloric acid, transferred into a 25 mL volumetric flask, and topped to the mark with deionized water. The solution was then analyzed for PTEs (Pb and Cd) using a double-beam, microcomputer-controlled Perkin-Elmer 2380 atomic absorption spectrophotometer (Perkin Elmer Inc., Waltham, MA, USA). These were achieved at wavelengths of 283.3 nm for Pb and 228.8 nm for Cd. The PTEs’ concentrations were obtained from regression equations of calibration curves prepared using absorbances of working concentrations diluted from 1000 mg/L stock solutions of Pb nitrate and Cd chloride.

2.6. Human Health Risk Assessment Due to PTEs Intake and Dermal Contact

For human health risks associated with PTEs, the assessment is performed by taking into consideration the potential cancer and non-cancer health effects in adults (“as the general population”) and children (“as a sensitive group”). For non-carcinogenic health risks, the average daily doses are computed to cater for the direct intake of water (DITwater) and dermal contact (DCwater) (Equations (1) and (2)) [43,44].
D I T w a t e r = P T E C × W I G × E F Q × E D T W B × T A E
D C w a t e r = H C M × S A F × S D A F × A F × E F Q × E D T W B × T A E × 10 6
where PTEC = PTE’s concentration in water (mg/L); WIG (water intake rate; L/day) = 1.8 and 21 for children and adults; EFQ = exposure frequency (365 days/year); EDT = exposure time, equal to the average lifetime (58.65 years) for Ugandans [44,45]; WB = average body weight (=15 kg for children and 60 kg for adults); TAE = average exposure time, expressed as EFQ × EDT [46]; SAF is the exposed dermal surface area = 2800 and 24,350 cm2 for children and adults [43]; DAFC is the dermal absorption factor = 0.01 for carcinogenic metals [47]; and SADF is the skin adherence factor = 0.2 and 0.7 mg/cm2/day for children and adults [48].
To assess non-carcinogenic health risks, the target hazard quotient (THQ) is calculated (Equations (3) and (4)). In consequence, THQ ≤ 1 shows unlikely occurrence of adverse health effects in an exposed individual and vice versa [44,48]. Because such effects are augmentative for PTEs, the cumulative health risks per exposure pathway (total THQ DITwater and total THQ DCwater) may be calculated (Equations (5) and (6)) [30].
T H Q   D I T w a t e r = D I T w a t e r R f D I T
T H Q   D C w a t e r = D C w a t e r   R f D C
T o t a l   T H Q   D I T w a t e r = D I T w a t e r R f D I T  
T o t a l   T H Q   D C w a t e r = D C w a t e r   R f D C
From these, RfDIT is the oral reference dose, while RfDC is the dermal reference dose, with established toxicological values [30]. A reference dose of a potentially toxic element is defined as the highest amount of it which, when ingested through a given pathway, may not result in the development of deleterious health effects by an individual in their lifetime [49].
Cancer risks for PTEs that are probable carcinogens (CRV) are usually estimated as the incremental lifetime cancer risk (Equation (7)). The total risk values (TCRV) can also be calculated (Equation (8)) by considering the cumulative toxic effects of PTEs [47,50].
CRV = DITwater × ICSF
T C R V = i = 1 n C R V  
where the ingestion cancer slope factor (ICSF) represents the contaminant-specific risk generated by an average lifetime amount of 1 mg/kg/day of the carcinogenic, potentially toxic element [47].

2.7. Quality Assurance and Quality Control of Data

All experiments were performed in triplicate. For PTE analyses, linearities of the calibration curves were checked, and these were within acceptable limits (R2 > 0.995 in all cases). Further, the analytical quality of absorbances obtained was guaranteed through the analysis of blanks and spikes, whose recoveries (range: 97–101%) were analytically considered acceptable. Relative standard deviations of the experiments (analytical precision) ranged between 3.9% and 4.7%.

2.8. Data Analysis

Experimental results data from triplicate analyses were entered into Excel, averaged, and tabulated as the mean ± standard deviation of replicates. Statistically significant differences in the physicochemical quality of water among the sampling sites on the Pager River were evaluated using one-way analysis of variance with Tukey’s test. Pearson’s bivariate correlation and principal component analysis (PCA) were used to explore the inter-relationships between PTE concentrations and the physicochemical parameters of the samples. The analyses were executed at a 95% confidence interval, employing GraphPad Prism for Windows (version 9, GraphPad Software, San Diego, CA, USA).

3. Results

3.1. Physiochemical Parameters of the Water Samples

The physiochemical properties of water samples from the Pager River, Northern Uganda are shown in Table 1. The temperature (27.7 ± 0.5–29.5 ± 0.8 °C) and turbidity (40.7 ± 2.1–50.1 ± 1.1 NTU) recorded were outside the recommended guidelines provided by the WHO for potable water [51].

3.2. PTE Contents of the Water Samples

In this study, Pb and Cd were quantified in water samples taken from the Pager River, Uganda (Figure 2). They occurred at mean concentrations of 0.296 ± 0.030–0.576 ± 0.163 mg/L and 0.278 ± 0.040–0.524 ± 0.040 mg/L, respectively. Higher metal concentrations were recorded downstream (sites D, E, and F). These values surpassed the recommended WHO limits of 0.01 and 0.003 mg/L for Pb and Cd in drinking water [51].

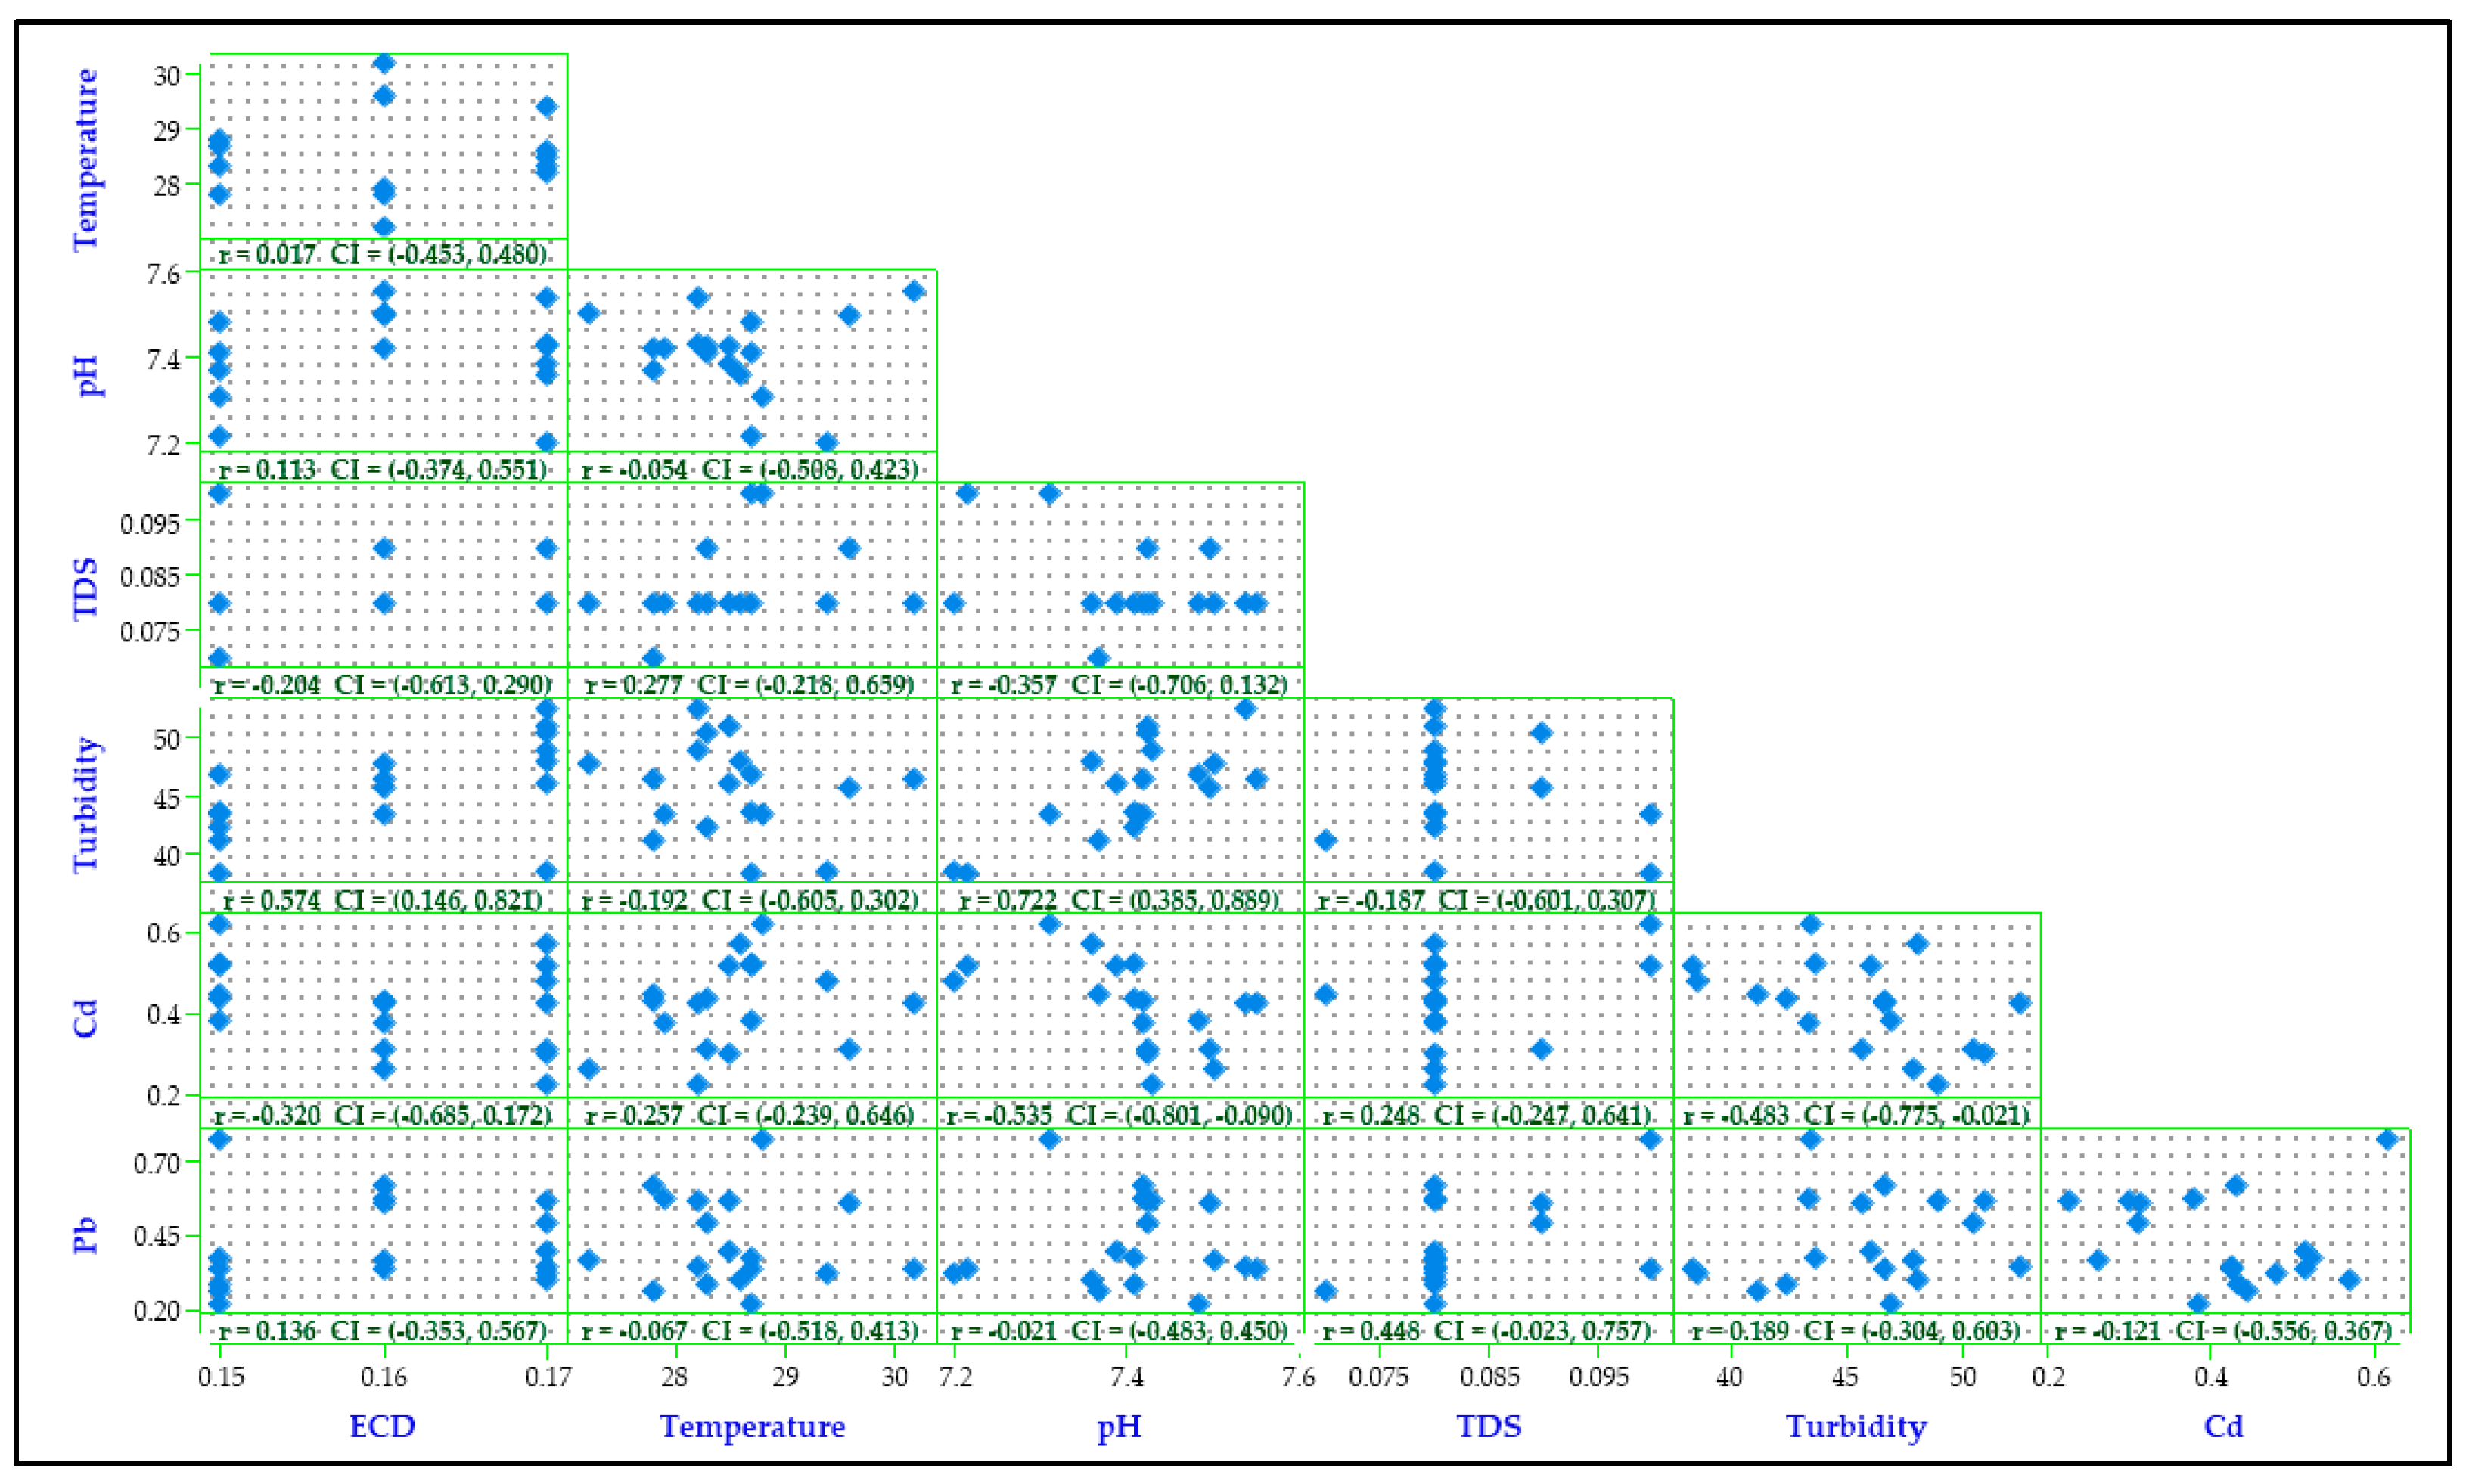
3.3. Interrelationships between Physicochemical Parameters and PTEs

As shown in the Pearson’s correlation matrix plot (Figure 3), most of the parameters had weak and insignificant negative correlations (Supplementary materials: Table S1). Weak but significant negative correlations were observed between Cd and turbidity (r = −0.483, p = 0.042), as well as Cd and pH (r = −0.535, p = 0.022). A negative correlation was also observed between Pb and Cd concentrations (r = −0.121, p = 0.633). However, turbidity and pH (r = 0.722, p = 0.001), turbidity and ECD (r = 0.574, p = 0.013), Pb and TDS (r = 0.448, p = 0.062), and Cd and TDS (r = 0.248, p = 0.320) had positive correlations. These results agreed well with PCA results (Figure 4). With consideration of eigenvalues greater than 1 (for p < 0.05), the first three principal components explained up to 73.6% of the total variance observed. However, major correlations could only be observed in the first principal component (Supplementary materials: Table S2).

3.4. Human Health Risks from Intake and Dermal Contact with Contaminated Water

The calculated daily doses for the direct intake of contaminated water were from 3.34 × 10⁻² mg/kg/day for Cd from point B by children to 2.01 × 10⁻¹ mg/kg/day for Pb in water at point E drunk by adults (Table 2). These values were higher than the oral reference doses for the metals in the case of adults. The (total) target hazard quotients were greater than 1 for all the sampled points (Table 3), and Cd was the major contributor to these effects.
For dermal contact, the daily doses spanned from 1.03 × 10⁻⁷ mg/L/day for Cd ingested by children in water from point B to 1.64 × 10⁻⁶ mg/L/day for Pb in water at point E consumed by adults. These values were all lower than the dermal reference doses of Pb and Cd. As shown by the calculated THQ and TTHQ values (Table 3), no deleterious health effects are likely to be experience by individuals who come into dermal contact with water contaminated with Pb and Cd at the sampled stations of the river.
Contrastingly, the potential cancer risks calculated (Table 4) spanned from 0.0009 × 10⁻⁴ for Pb at point F for water drunk by adults to 0.68 × 10⁻⁴ for Pb in water at point E drunk by adults. In all cases, the cancer risk values as well as the total (cumulative) cancer risk values fell within the US EPA permissible limit of 10−6–10−4 [47].

4. Discussion

4.1. Physicochemical Profile of Water Samples

Temperature is the degree of hotness or coldness of a substance [52]. It affects the physical, chemical, and microbiological processes in water bodies (including the flowing water in rivers). It is an essential parameter used to evaluate the quality of drinking water, and the WHO limit is 15 °C, which was surpassed in this study. In reference to a previous study in the Turag River (Bangladesh), a similarly high temperature was found (23.9–31.2 °C) [53]. Such high temperatures may alter the color, viscosity, solubility, and taste of water [54,55,56], thereby reducing its palatability.
Similarly, the hydrogen potential (pH) of water measured in this study fell outside the acceptable range of the WHO. Undoubtingly, pH affects several parameters of water, including taste and hardness. Broadly speaking, low pH of water can result in the release of hydrogen sulphide, which is toxic [52]. Corrosion of water pipes also occurs in water with low pH, while high pH values above 9.0 affect the chlorination of water, reduce the concentration of iron, phosphates, and sulphates, and lead to the conversion of carbon dioxide into hydrogen carbonates and carbonates [52,57]. It is positioned that the intake of acidic or alkaline water may be harmful to the body [58]. Moreover, such pH values tend to make water unpleasant, i.e., conferring a bitter or metallic taste [59]. Compared to previous studies, the pH values recorded in our study were comparable to 6.44–8.19 in Uganda’s Manafwa and Nyamwamba Rivers [60,61], 5.85–8.30 in the Rwandese Nyabarongo and Nyabugogo rivers[50], the Mohokare River of Lesotho [62], and the Rwimi, Nyamugasani, and Aturukuku Rivers in Uganda [63,64,65]. These values were higher than the 5.58–6.80 values found in the Mubuku and Nyamwamba Rivers [64].
We also measured the electrical conductivity (ECD) of the river water samples. ECD is the measure of electric current flowing through a solution of water due to ions in it. It is related to the TDS, as well as the water’s temperature [51]. The permissible limit of ECD lies in the range of 750 to 1000 µS/cm, as per WHO guidelines on drinking water [51]. In reference to previous reports, the ECD values obtained were lower than 37.9–3780 and 30–150 µS/cm [61] for the River Nyamwamba and River Mubuku, 88.7–122.2 µS/cm (River Manafwa) [60], 118.57 µS/cm (River Sio), 140.82 µS/cm (River Victoria Nile), 80.44 µS/cm (River Lhubiriha), 63.15 and 12–119 µS/cm (River Mobuku), 460.51 µS/cm (River Lubigi), 946.08 µS/cm (River Nyamugasani), 43–103 and 81–220 µS/cm (River Rwimi), 108–1524 µS/cm (River Musamya), and 99.91 µS/cm (River Nyamwamba) of Uganda [63,66,67]. In the Rwandese Nyabarongo and Nyabugogo rivers, ECDs of 74.3–102.0 µS/cm were reported [50]. Other reports for the Mohokare River (Lesotho) [62] and River Rido (Nigeria) [68] showed ECDs of 2000–3800 µS/cm and 79–146.3 µS/cm, which are higher than those obtained in this study.
For turbidity, the values obtained were eight- to ten-fold higher than the value of <5 NTU indicated for potable water. Such turbidity values suggest the presence of pathogens or particles that can shield pathogenic organisms from disinfectants. Lastly, the TDS of the water samples were determined because it affects the taste of water if its value is >2000 mg/L [51,52]. TDS ranged from 0.07 ± 0.00 to 0.10 ± 0.00 mg/L across the sampling sites. Statistically, TDS did not vary significantly among the sampled sites (p > 0.05) and were within the recommendable limit of 1000 mg/L [51]. Studies performed on the Mubuku and Nyamwamba Rivers of Uganda [61] and the Jamuna and Turag Rivers of Bangladesh [53,69] found much higher TDS values (1937–6580, 1344.0, 106–131 and 0–1244 mg/L, respectively) than found in this study.

4.2. PTE Concentrations in the Water Samples

In this study, the concentrations of Pb and Cd in water samples from the Pager River, Uganda ranged from 0.278 to 0.576 mg/L. These results were higher than that of Cd and Pb in the Turag River (Bangladesh) [53], the Bolong and Rongna Rivers (China) [70], the Dzindi, Madanzhe, and Mvudi Rivers (South Africa), the Manafwa River and River Mubuku (Uganda) [60,64], the Mara River (Tanzania) [71], and the Tisa River (Romania) [72] (Table 3). Higher Pb and Cd concentrations than found in this study were previously reported in water samples from the Nyamwamba River (Uganda) [61], the Sosiani River (Kenya) [73], the River Kabul (Pakistan) [74], and the Kor River (Iran) [75] (Table 5).
Both Pb and Cd are non-essential metal ions in the human body. In the context of Pb, the high levels recorded in this river may be related to metal fabrication activities and irresponsible disposal of used Pb-based batteries, as well as the continued use of leaded gasoline [76,77]. Thus, exposure to Pb in the water may result in conditions such as kidney failure, high blood pressure, anemia, Pb poisoning, neurotoxicity, cancer, weakness, and brain damage (for higher doses) [15,16,17,18]. On the other hand, the high levels of Cd found in the Pager River may be explained by mobilized runoff water from metal fabrication works, the use of Cd-based phosphate fertilizers, disposed nickel–Cd batteries, and sewage [78]. In terms of toxicity, short-term exposure to such high levels of Cd can induce vomiting, diarrhea, coughing, chest pain, muscle cramps, salivation, sensory imbalances, hepatic injury, and renal failure [23]. Epidemiological data have pointed out that high-level exposure to Cd has been associated with a high risk of developing lung, kidney, and prostate cancers [79].
Table 5. Comparison of concentrations (mg/L) of toxic metals in water from the Pager River with previous studies.
River (Country)PbCd References
Pager River (Uganda)0.296–0.5760.278–0.524This study
Manafwa River (Uganda)0.002–0.0100.001–0.002Opolot et al. [60]
River Nyamwamba (Uganda)0.40–8.210.05–1.40Masereka et al. [61]
0.27–0.40Mwesigye and Tumwebaze [80]
0.047Mukisa et al. [64]
River Mubuku (Uganda)0.053
River Rwimi (Uganda)0.067
Kagera River & tributaries (Rwanda)0.0450.965Nshimiyimana et al. [81]
Mara River (Tanzania)0.01–0.71BDL–0.11Kihampa and Wenaty [71]
Tisa River (Romania)0.0016–0.005140.00011–0.00206Dippong et al. [72]
Turag River (Bangladesh)0.0068–0.017Ahmed et al. [53]
Bolong river (China)0.00034–0.000640.00011–0.00054Luo et al. [70]
Rongna River (China)0.00049–0.002410.00012–0.00064
Nyabarongo river (Rwanda)0.05–0.75BDL-0.106Omara et al. [50,82]
Nyabugogo river (Rwanda)0.59BDLOmara et al. [50]
Sosiani river (Kenya)0.02–1.89Amadi [73]
Marimba River (Zimbabwe)0.213–0.544Mvungi et al. [83]
Dzindi, Mvudi, and Madanzhe Rivers (South Africa)0.0105–0.02010.0016–0.0093Okonkwo et al. [84]
River Ganga (India)0.037–0.1630.001–0.059Gupta et al. [85]
Akcay River (Turkey)BDL–0.00036Leventeli and Yalcin [86]
River Kabul (Pakistan)0.337–0.810.015–0.038Afzaal et al. [74]
Kor River (Iran)0.02–17.36Mokarram et al. [75]
— means not determined. BDL = Below method detection limit.

4.3. Interrelationships between Physicochemical Parameters and PTEs of the Water Samples

The PTEs were not strongly correlated with the water quality parameters determined. In environmental studies, such weak and negative correlations suggest that the parameters do not strongly influence the contamination levels of the PTEs. Specifically, negative correlations between Pb and Cd showed that they originated from different sources and possessed different characteristics and transport behaviors [87,88,89,90], and therefore, any increase or decrease in their concentrations in the river water could only occur disproportionately. On the other hand, turbidity and pH, turbidity and ECD, Pb and TDS, Cd and TDS with positive correlations suggested that the presence of the PTEs in the water positively influenced the levels of these parameters. Multivariate statistical analysis (PCA) indicated that the observed levels of PTEs in the water from the Pager River were due to anthropogenic contributions from different sources.

4.4. Human Health Risk Assessment Results

For non-cancer risks, the computed average daily doses through the intake of contaminated water were higher than the oral reference doses for the PTEs in the case of adults, indicating that there are discernable non-carcinogenic health effects that may be experienced by the general population who drink water from the Pager River. In our previous study on the Manafwa River (Eastern Uganda), we found that non-carcinogenic health effects could be experienced in both children and adults only when water was taken during the dry season [60]. Masereka et al. [61] reported that the total target hazard quotients for water from the Nyamwamba River exceeded 1 for both direct ingestion and dermal contact, supporting the occurrence of several non-carcinogenic health effects reported in the Kilembe Mines region of Western Uganda. These reports underscore the need to examine the health risks of water from the Pager River during both the dry and wet seasons to examine whether the health risks may be higher in the dry season than observed for samples collected in June 2023, which was a wet season.
For cancer risks, all the individual cancer risk values, as well as the total cancer risk values, were within the safe limit of 1 × 10⁻⁶ to 1 × 10⁻⁴. This implies that there are no potential cancer risks from drinking water from the different stretches of the Pager River. Our findings align well with Opolot et al. [60], who found that cancer risk values for Ugandans who drink water from Manafwa River did not suggest any carcinogenic health risks. A study in the Nyamwamba River of Western Uganda, however, found cancer risk values through the ingestion of PTEs to range from 0.119× 10⁻⁶ for Pb ingested by adults to 7.815 × 10⁻¹ for arsenic ingested by children [61], which suggested cancer risks in both age groups. Taken together, the results of the human health risk assessment in our study may not point to the potential occurrence of deleterious health effects, due to the limited number of PTEs studied. Since the effects of PTEs are known to be cumulative, a further study considering a larger number of PTEs in the river water should be undertaken.

5. Conclusions and Future Perspectives

In this study, the physicochemical profile, including the Pb and Cd contents of surface water sampled from the Pager River, a tributary of the Nile River in Northern Uganda, was investigated. We found that the mean temperature (27.7 ± 0.5–29.5 ± 0.8 °C), turbidity (40.7 ± 2.1–50.1 ± 1.1 NTU), Pb (0.296 ± 0.030–0.576 ± 0.163 mg/L), and Cd (0.278 ± 0.040–0.524 ± 0.040 mg/L) levels of the water surpassed the compliance limits set by the WHO for drinking water. This could cause adverse health effects, especially in adults, where the computed average daily doses through ingestion of water were higher than the oral reference doses for the metals. The results obtained in our study were lower than those reported in some studies from Uganda and Africa. Further studies should investigate the levels of PTEs in the Pager River during both the dry and wet seasons, so as to establish the potential variations in the PTE concentrations and the associated health risks. Assessment of the concentrations of other contaminants such as pesticides, per- and polyfluoroalkyl substances, active pharmaceutical ingredients, and microplastics should be initiated, since this river was aerially sprayed during onchocerciasis elimination campaigns.

Supplementary Materials

The following supporting information can be downloaded at: https://www.mdpi.com/article/10.3390/jox13040035/s1, Table S1. Pairwise Pearson correlations between the studied physicochemical parameters and potentially toxic elements in water samples from the Pager River, Northern Uganda; Table S2. Eigen-vectors and eigen-analysis of the correlation matrix for the PTEs and physicochemical parameters of water samples from the Pager River, Northern Uganda.

Author Contributions

Conceptualization, P.O., R.A., C.A. and T.O.; methodology, P.O., C.A. and T.O.; software, C.K.N., A.V.K. and T.O.; validation, D.H.R., A.V.K. and T.O.; formal analysis, T.O.; investigation, P.O.; data curation, T.O.; writing—original draft preparation, P.O. and T.O.; writing—review and editing, R.A., D.N., G.B., B.O. and A.G.; visualization, T.O.; project administration, P.O. All authors have read and agreed to the published version of the manuscript.

Funding

This research received no external funding.

Institutional Review Board Statement

Not applicable.

Informed Consent Statement

Not applicable.

Data Availability Statement

Data supporting the conclusions of this study are available upon request from the authors.

Conflicts of Interest

The authors declare no conflict of interest.

References

  1. United Nations. Water ‘Vital to Human Survival, Economic Development, Prosperity of Every Nation’, Says Secretary-General in Message for World Day Observance. Available online: https://press.un.org/en/2023/sgsm21727.doc.htm#:~:text=Water%20is%20the%20lifeblood%20of,and%20prosperity%20of%20every%20nation (accessed on 5 June 2023).
  2. Kılıç, Z. The importance of water and conscious use ofwater. Int. J. Hydrol. 2020, 4, 239–241. [Google Scholar] [CrossRef]
  3. Popkin, B.M.; D’Anci, K.E.; Rosenberg, I.H. Water, hydration, and health. Nutr. Revs. 2010, 68, 439–458. [Google Scholar] [CrossRef]
  4. Biswas, A.K. Urban water security for developing countries. River 2022, 1, 15–24. [Google Scholar] [CrossRef]
  5. Boretti, A.; Rosa, L. Reassessing the projections of the World Water Development Report. NPJ Clean Water 2019, 2, 15. [Google Scholar] [CrossRef]
  6. Li, J.; Yang, J.; Liu, M.; Ma, Z.; Fang, W.; Bi, J. Quality matters: Pollution exacerbates water scarcity and sectoral output risks in China. Water Res. 2022, 224, 119059. [Google Scholar] [CrossRef] [PubMed]
  7. Papa, F.; Crétaux, J.-F.; Grippa, M.; Robert, E.; Trigg, M.; Tshimanga, R.M.; Kitambo, B.; Calmant, S. Water Resources in Africa under Global Change: Monitoring Surface Waters from Space. Surv. Geophys. 2023, 44, 43–93. [Google Scholar] [CrossRef]
  8. UN Water/Africa. The Africa Water Vision for 2025: Equitable and Sustainable Use of Water for Socioeconomic Development. 2020. Available online: https://www.afdb.org/fileadmin/uploads/afdb/Documents/Generic-Documents/african%20water%20vision%202025%20to%20be%20sent%20to%20wwf5.pdf (accessed on 5 June 2023).
  9. Bender, M. Water Management in East Africa. In Oxford Research Encyclopedia of African History; Oxford University Press: Oxford, UK, 2019. [Google Scholar]
  10. Shehu, Z.; Nyakairu, G.W.A.; Tebandeke, E.; Odume, O.N. Overview of African water resources contamination by contaminants of emerging concern. Sci. Total Environ. 2022, 852, 158303. [Google Scholar] [CrossRef]
  11. Ligate, F.; Ijumulana, J.; Ahmad, A.; Kimambo, V.; Irunde, R.; Mtamba, J.O.; Mtalo, F.; Bhattacharya, P. Groundwater resources in the East African Rift Valley: Understanding the geogenic contamination and water quality challenges in Tanzania. Sci. Afr. 2021, 13, e00831. [Google Scholar] [CrossRef]
  12. Tchounwou, P.B.; Yedjou, C.G.; Patlolla, A.K.; Sutton, D.J. Heavy metal toxicity and the environment. Exp. Suppl. 2012, 101, 133–164. [Google Scholar]
  13. Edelstein, M.; Ben-Hur, M. Heavy metals and metalloids: Sources, risks and strategies to reduce their accumulation in horticultural crops. Sci. Hortic. 2018, 234, 431–444. [Google Scholar] [CrossRef]
  14. Eid, R.; Arab, N.T.; Greenwood, M.T. Iron mediated toxicity and programmed cell death: A review and a re-examination of existing paradigms. Biochim. Biophys. Acta Mol. Cell Res. 2017, 1864, 399–430. [Google Scholar] [CrossRef] [PubMed]
  15. Salem, H.M.; Eweida, E.A.; Farag, A. Heavy metals in drinking water and their environmental impact on human health. In Proceedings of the International Conference for Environmental Hazard Mitigation ICEHM 2000, Giza, Egypt, 9–12 September 2000; Cairo University: Cairo, Egypt, 2000. [Google Scholar]
  16. Debnath, B.; Singh, S.W.; Manna, K. Sources and toxicological effects of lead on human health. Indian J. Med. Spec. 2019, 10, 66. [Google Scholar]
  17. WHO. Exposure to Lead: A Major Public Health Concern, 2nd ed.; World Health Organization: Geneva, Switzerland, 2021; Available online: https://www.who.int/publications/i/item/9789240037656 (accessed on 6 September 2023).
  18. Saeed, S.; Hasan, S.; Kuldeep, K.; Choudhury, P. Lead Poisoning: A Persistent health Hazard-General and oral aspects. Biomed Pharmacol. J. 2017, 10, 439–445. [Google Scholar] [CrossRef]
  19. WHO. Lead in Drinking-Water: Health Risks, Monitoring and Corrective Actions. 2022. Available online: https://apps.who.int/iris/rest/bitstreams/1460455/retrieve (accessed on 5 September 2023).
  20. Kim, H.C.; Jang, T.W.; Chae, H.J.; Choi, W.J.; Ha, M.N.; Ye, B.J.; Kim, B.G.; Jeon, M.J.; Kim, S.Y.; Hong, Y.S. Evaluation and management of lead exposure. Ann. Occup. Environ. Med. 2015, 27, 30. [Google Scholar] [CrossRef] [PubMed]
  21. Wenxin, L.; Levin, R.; Schwartz, J. Lead contamination of public drinking water and academic achievements among children in Massachusetts: A panel study. BMC Public Health 2022, 22, 107. [Google Scholar]
  22. Demchenkov, E.L.; Nagdalian, A.A.; Budkevich, R.O.; Oboturova, N.P.; Okolelova, A.I. Usage of atomic force microscopy for detection of the damaging effect of CdCl2 on red blood cells membrane. Ecotoxicol. Environ. Saf. 2021, 208, 111683. [Google Scholar] [CrossRef]
  23. Idrees, N.; Tabassum, B.; Abd Allah, E.F.; Hashem, A.; Sarah, R.; Hashim, M. Groundwater contamination with cadmium concentrations in some West U.P. Regions, India. Saudi J. Biol. Sci. 2018, 25, 1365–1368. [Google Scholar] [CrossRef]
  24. Browar, A.W.; Leavitt, L.L.; Prozialeck, W.C.; Edwards, J.R. Levels of Cadmium in Human Mandibular Bone. Toxics 2019, 7, 31. [Google Scholar] [CrossRef]
  25. Haney, I., Jr. Development of an inhalation unit risk factor for cadmium. Regul. Toxicol. Pharmacol. 2016, 77, 175–183. [Google Scholar] [CrossRef]
  26. Abalo, D.O. Assessment of the Water Quality of River Pager in Areas of Kitgum Municipality in Kitgum District. Ph.D. Thesis, Makerere University, Kampala, Uganda, 2022. [Google Scholar]
  27. UN-Habitat. Kitgum Urban Profile. 2012. Available online: https://unhabitat.org/sites/default/files/download-manager-files/Kitgum%20Urban%20Profile%20%20Uganda.pdf (accessed on 6 September 2023).
  28. Ocungi, J. Kitgum Residents Dump Waste in Pager River. 2019. Available online: https://ugandaradionetwork.net/story/kitgum-residents-dump-waste-in-pager-river (accessed on 5 June 2023).
  29. Komakech, D.M. Pager, Akeca Rivers Polluted by Strange Whitish Chemical. 2021. Available online: https://ugandaradionetwork.net/story/pager-akeca-rivers-polluted-by-chemicals-?districtId=545 (accessed on 5 June 2023).
  30. US EPA. Risk-Based Concentration Table; United States Environmental Protection Agency: Washington, DC, USA, 2009.
  31. Ocitti, J.P. Kitgum: An Urban Study. E Afr. Geogr. Rev. 1966, 4, 37–48. [Google Scholar]
  32. Open Street Map. Pager River. Available online: https://ug.geoview.info/pager_river,141321125w (accessed on 7 June 2023).
  33. Onen, P.; Niringiyimana, E.; Odokonyero, I.; Kissa, J.; Byaruhanga, I.; Ampaire, W.; Jogunomi, T.B.; Ogenrwot, A.D. Production and Physiochemical Characterization of Biodiesel from Nile cabbage grown in Pager River, Kitgum Municipality, Northern-Uganda. Bull Sci. Res. 2023, 5, 33–41. [Google Scholar] [CrossRef]
  34. USAID. Uganda Water Resources Profile Overview. 2021. Available online: https://winrock.org/wp-content/uploads/2021/08/Uganda_Country_Profile_Final.pdf (accessed on 4 September 2023).
  35. Hendy, A. Blackfly Ecology and Onchocerca Volvulus Transmission in Three Formerly Hyperendemic Foci in Uganda, Tanzania and Cameroon. Ph.D. Thesis, University of Antwerp, Antwerp, Belgium, 2018. [Google Scholar]
  36. The Independent. Government to Construct 20 Fish Ponds in Kitgum. 2020. Available online: https://www.independent.co.ug/government-to-construct-20-fish-ponds-in-kitgum/ (accessed on 6 September 2023).
  37. The Independent. Minister Anywar Asks Kitgum Locals to Vacate River Banks. 2021. Available online: https://www.independent.co.ug/minister-anywar-asks-kitgum-locals-to-vacate-river-banks/ (accessed on 6 September 2023).
  38. Kulabako, R.; Kinobe, J.; Mujunga, J.; Olwenyi, S.; Sleytr, K. Greywater use in peri-urban households in Kitgum, Uganda. Sust. Sanit Pract. 2009, 1, 16–24. [Google Scholar]
  39. Gumisiriza, N.; Mubiru, F.; Siewe Fodjo, J.N.; Kayitale, M.M.; Hotterbeekx, A.; Idro, R.; Makumbi, I.; Lakwo, T.; Opar, B.; Kaducu, J.; et al. Prevalence and incidence of nodding syndrome and other forms of epilepsy in onchocerciasis-endemic areas in northern Uganda after the implementation of onchocerciasis control measures. Infect. Dis. Poverty 2020, 9, 12. [Google Scholar] [CrossRef] [PubMed]
  40. Oguttu, D.W. Interventions and Progress towards Onchocerciasis Elimination in Uganda. DNDi Partners’ Meeting, 3 October 2018. Available online: https://dndi.org/wp-content/uploads/2018/05/Oguttu_CountryProgressUganda_UgandaMeeting2018.pdf (accessed on 4 September 2023).
  41. Kilama, D.; Ayella, D.O.; Asiimwe, I.; Nakibuuka, B.; Laker, F.; Bongomin, F. Undiagnosed Hypertension Among Market Salespersons in Kitgum Central Market, Northern Uganda. Integr. Blood Press Control 2023, 16, 37–46. [Google Scholar] [CrossRef]
  42. Onyutha, C.; Asiimwe, A.; Ayugi, B.; Ngoma, H.; Ongoma, V.; Tabari, H. Observed and Future Precipitation and Evapotranspiration in Water Management Zones of Uganda: CMIP6 Projections. Atmosphere 2021, 12, 887. [Google Scholar] [CrossRef]
  43. Ordonez, A.; Alvarez, R.; Charlesworth, S.; De Miguel, E.; Loredo, J. Risk assessment of soils contaminated by mercury mining, Northern Spain. J. Environ. Monit. 2011, 128, 136. [Google Scholar] [CrossRef]
  44. Omara, T.; Karungi, S.; Kalukusu, R.; Nakabuye, B.; Kagoya, S.; Musau, B. Mercuric pollution of surface water, superficial sediments, Nile tilapia (Oreochromis nilotica Linnaeus 1758 [Cichlidae]) and yams (Dioscorea alata) in auriferous areas of Namukombe stream, Syanyonja, Busia, Uganda. PeerJ 2019, 7, e7919. [Google Scholar] [CrossRef]
  45. Bamuwamye, M.; Ogwok, P.; Tumuhairwe, V.; Eragu, R.; Nakisozi, H.; Ogwang, P. Dietary content and potential health risks of metals in commercial black tea in Kampala (Uganda). J. Food Res. 2017, 6, 1–12. [Google Scholar] [CrossRef]
  46. Saha, N.; Zaman, M. Evaluation of possible health risks of heavy metals by consumption of foodstuffs available in the central market of Rajshahi City, Bangladesh. Environ. Monit. Assess 2012, 185, 3867–3878. [Google Scholar] [CrossRef]
  47. Alidadi, H.; Tavakoly, S.S.B.; Zarif, G.O.B.; Mohamad, T.; Shamszade, H.; Fakhari, M. Health risk assessments of arsenic and toxic heavy metal exposure in drinking water in Northeast Iran. Environ. Health Prev. Med. 2019, 24, 59. [Google Scholar] [CrossRef]
  48. Wojciechowska, E.; Nawrot, N.; Walkusz-Miotk, J.; Matej-Łukowicz, K.; Pazdro, K. Heavy Metals in Sediments of Urban Streams: Contamination and Health Risk Assessment of Influencing Factors. Sustainability 2019, 11, 563. [Google Scholar] [CrossRef]
  49. Qing, X.; Yutong, Z.; Shenggao, L. Assessment of heavy metal pollution and human health risk in urban soils of steel industrial city (Anshan), Liaoning, Northeast China. Ecotoxicol. Environ. Saf. 2015, 120, 377–385. [Google Scholar] [CrossRef]
  50. Omara, T.; Nteziyaremye, P.; Akaganyira, S.; Opio, D.W.; Karanja, L.N.; Nyangena, D.M.; Maiyo, A. Physicochemical quality of water and health risks associated with consumption of African lung fish (Protopterus annectens) from Nyabarongo and Nyabugogo rivers, Rwanda. BMC Res Notes 2020, 13, 66. [Google Scholar] [CrossRef] [PubMed]
  51. WHO. Guidelines for Drinking-Water Quality, 4th ed.; Incorporating the 1st Addendum; World Health Organization: Geneva, Switzerland, 2017. [Google Scholar]
  52. WHO. Guidelines for Drinking-Water Quality, 3rd ed.; Volume 1—Recommendations Incorporating the First and Second Addenda; 2008; Available online: https://www.who.int/publications/i/item/9789241547611 (accessed on 4 September 2023).
  53. Ahmed, K.S.; Rahman, A.K.M.L.; Sarkar, M.; Islam, J.B.; Jahan, I.A.; Moniruzzaman, M.; Saha, B.; Bhoumi, N.C. Assessment on the level of contamination of Turag river at Tongi area in Dhaka. Bangladesh J. Sci. Ind. Res. 2016, 51, 193–202. [Google Scholar] [CrossRef]
  54. Nkurunziza, G.; Omara, T.; Nakiguli, C.K.; Mukasa, P.; Byamugisha, D.; Ntambi, E. Physicochemical Quality of Water from Chuho Springs, Kisoro District, Uganda. Fr-Uk. J. Chem. 2021, 09, 12–26. [Google Scholar] [CrossRef]
  55. Olajire, A.A.; Imeokparia, F.E. Water Quality Assessment of Osun River: Studies on Inorganic Nutrients. Environ. Monit. Assess 2001, 69, 17–22. [Google Scholar] [CrossRef]
  56. Palamuleni, L.; Akoth, M. Physico-Chemical and Microbial Analysis of Selected Borehole Water in Mahikeng, South Africa. J. Environ. Res. Public Health 2015, 12, 8619–8630. [Google Scholar] [CrossRef]
  57. Reda, A.H. Physico-Chemical Analysis of Drinking Water Quality of Arbaminch Town. J. Environ. Anal. Toxicol. 2016, 6, 356. [Google Scholar]
  58. Hansen, T.H.; Thomassen, M.T.; Madsen, M.L.; Kern, T.; Bak, E.G.; Kashani, A.; Allin, K.H.; Hansen, T.; Pedersen, O. The effect of drinking water pH on the human gut microbiota and glucose regulation: Results of a randomized controlled cross-over intervention. Sci. Rep. 2018, 8, 16626. [Google Scholar] [CrossRef]
  59. Omara, T.; Nassazi, W.; Adokorach, M.; Kagoya, S. Physicochemical and Microbiological Quality of Springs in Kyambogo University Propinquity. OALib J. 2019, 6, e5100. [Google Scholar] [CrossRef]
  60. Opolot, M.; Omara, T.; Adaku, C.; Ntambi, E. Spatio-temporal Variations and Potential Health Risks of Heavy Metals in Water from River Manafwa, Uganda. Letts. Appl. NanoBioSci. 2022, 13, 23. [Google Scholar]
  61. Masereka, J.; Byamugisha, D.; Adaku, C. Physicochemical Quality and Health Risks Associated with Use of Water from Nyamwamba River, Kasese, Western Uganda. Asian J. Appl. Chem. Res. 2022, 12, 19–33. [Google Scholar] [CrossRef]
  62. Chatanga, P.; Ntuli, V.; Mugomeri, E.; Keketsi, T.; Chikowore, N.V.T. Situational analysis of physico-chemical, biochemical and microbiological quality of water along Mohokare River, Lesotho. Egypt. J. Aquat. Res. 2019, 45, 45–51. [Google Scholar] [CrossRef]
  63. Busulwa, H.S.; Bailey, R.G. Aspects of the physico-chemical environment of the Rwenzori rivers, Uganda. Afr. J. Ecol. 2004, 42, 87–92. [Google Scholar] [CrossRef]
  64. Mukisa, W.; Yatuha, J.; Andama, M.; Aventino, K. Heavy metal pollution in the main rivers of Rwenzori region, Kasese district South-western Uganda. Octa J. Environ. Res. 2020, 8, 078–090. [Google Scholar]
  65. Ochieng, H.; Odong, R.; Okot-Okumu, J. Comparison of temperate and tropical versions of Biological Monitoring Working Party (BMWP) index for assessing water quality of River Aturukuku in Eastern Uganda. Glob. Ecol. Conserv. 2020, 23, e01183. [Google Scholar] [CrossRef]
  66. Bwire, G.; Sack, D.A.; Kagirita, A.; Obala, T.; Debes, A.K.; Ram, M.; Komakech, H.; George, C.M.; Orach, C.G. The quality of drinking and domestic water from the surface water sources (lakes, rivers, irrigation canals and ponds) and springs in cholera prone communities of Uganda: An analysis of vital physicochemical parameters. BMC Publ. Health 2020, 20, 1128. [Google Scholar] [CrossRef] [PubMed]
  67. Turinayo, Y.K. Physicochemical Properties of Sugar Industry and Molasses Based Distillery Effluent and its Effect on Water Quality of River Musamya in Uganda. Int. J. Environ. Agric. Biotechnol. 2017, 2, 1064–1069. [Google Scholar] [CrossRef]
  68. Butu, A.W.; Emeribe, C.N.; Muoka, I.O.; Emeribe, O.F.; Ogbomida, E.T. Downstream Effects of Industrial Effluents Discharge on Some Physicochemical Parameters and Water Quality Index of River Rido, Kaduna State, Nigeria. Trop. Aqua. Soil Pollut. 2022, 2, 90–108. [Google Scholar] [CrossRef]
  69. Uddin, M.N.; Alam, M.S.; Mobin, M.N.; Miah, M.A. An Assessment of the River Water Quality Parameters: A case of Jamuna River. J. Environ. Sci. Nat. Resour. 2014, 7, 253–260. [Google Scholar] [CrossRef]
  70. Luo, Y.; Rao, J.; Jia, Q. Heavy metal pollution and environmental risks in the water of Rongna River caused by natural AMD around Tiegelongnan copper deposit, Northern Tibet, China. PLoS ONE 2022, 17, e0266700. [Google Scholar] [CrossRef] [PubMed]
  71. Kihampa, C.; Wenaty, A. Impact of mining and farming activities on water and sediment quality of the Mara river basin, Tanzania. Res. J. Chem. Sci. 2013, 3, 15–24. [Google Scholar]
  72. Dippong, T.; Mihali, C.; Marian, M.; Rosca, O.M.; Resz, M.-A. Correlations between chemical, hydrological and biotic factors in rivers from the protected area of Tisa Superioară, Romania. Process Safe Environ. Prot. 2023, 176, 40–55. [Google Scholar] [CrossRef]
  73. Amadi, E.K. Nutrient loads and heavy metals assessment along Sosiani River, Kenya. Chem. Mat. Res. 2013, 3, 14–20. [Google Scholar]
  74. Afzaal, M.; Hameed, S.; Liaqat, I.; Khan, A.A.A.; Manan, H.A.; Shahid, R.; Altaf, M. Heavy metals contamination in water, sediments and fish of freshwater ecosystems in Pakistan. Water Pract. Technol. 2022, 17, 253–1272. [Google Scholar] [CrossRef]
  75. Mokarram, M.; Saber, A.; Sheykhi, V. Effects of heavy metal contamination on river water quality due to release of industrial effluents. J. Clean. Prod. 2020, 277, 123380. [Google Scholar]
  76. Huang, X.; Luo, D.; Zhao, D.; Li, N.; Xiao, T.; Liu, J.; Liu, G. Distribution, source and risk assessment of heavy metal(oid)s in water, sediments, and Corbicula Fluminea of Xijiang River, China. Int. J. Environ. Res. Public Health 2019, 16, 1823. [Google Scholar] [CrossRef]
  77. Algül, F.; Beyhan, M. Concentrations and sources of heavy metals in shallow sediments in Lake Bafa, Turkey. Sci. Rep. 2020, 10, 11782. [Google Scholar] [CrossRef]
  78. Sidhu, G.P.S.; Bali, A.S. Cd in the environment: Uptake, toxicity and management. In Appraisal of Metal (Loids) in the Ecosystem; Elsevier: Amsterdam, The Netherlands, 2022; pp. 283–300. [Google Scholar]
  79. Vijayakumar, V.; Abern, M.R.; Jagai, J.S.; Kajdacsy-Balla, A. Observational Study of the Association between Air Cadmium Exposure and Prostate Cancer Aggressiveness at Diagnosis among a Nationwide Retrospective Cohort of 230,540 Patients in the United States. Int. J. Environ. Res. Public Health 2021, 18, 8333. [Google Scholar] [CrossRef]
  80. Mwesigye, A.R.; Tumwebaze, S.B. Water contamination with heavy metals and trace elements from Kilembe copper mine and tailing sites in Western Uganda; implications for domestic water quality. Chemosphere 2017, 169, 281–287. [Google Scholar]
  81. Nshimiyimana, F.; Nhapi, I.; Wali, U.G.; Nsengimana, H.; Banadda, N.; Nansubuga, I.; Kansiime, F. Assessment of Heavy Metal Pollution in a Trans-Boundary River: The Case of the Akagera River. Int. J. Math. Comput. 2010, 9, 10. [Google Scholar]
  82. Nteziyaremye, P.; Omara, T. Bioaccumulation of priority trace metals in edible muscles of West African lungfish (Protopterus annectens Owen, 1839) from Nyabarongo River, Rwanda. Cogent Environ. Sci. 2020, 6, 1779557. [Google Scholar] [CrossRef]
  83. Mvungi, A.; Hranova, R.K.; Love, D. Impact of home industries on water quality in a tributary of the Marimba River, Harare: Implications for urban water management. Phys. Chem. Earth. 2003, 28, 1131–1137. [Google Scholar] [CrossRef]
  84. Okonkwo, J.O.; Mothiba, M. Physico-chemical characteristics and pollution levels of heavy metals in the rivers in Thohoyandou, South Africa. J. Hydrol. 2005, 308, 122–127. [Google Scholar] [CrossRef]
  85. Gupta, V.; Kumar, D.; Dwivedi, A.; Vishwakarma, U.; Malik, D.S.; Paroha, S.; Mohan, N.; Gupta, N. Heavy metal contamination in river water, sediment, groundwater and human blood, from Kanpur, Uttar Pradesh, India. Environ. Geochem. Health 2023, 45, 1807–1818. [Google Scholar] [CrossRef]
  86. Leventeli, Y.; Yalcin, F. Data analysis of heavy metal content in riverwater: Multivariate statistical analysis and inequality expressions. J. Inequal. Appl. 2021, 2021, 14. [Google Scholar] [CrossRef]
  87. Khan, T.A. Trace Elements in the Drinking Water and Their Possible Health Effects in Aligarh City, India. J. Water Res. Protect. 2011, 3, 522–530. [Google Scholar] [CrossRef]
  88. Baguma, G.; Musasizi, A.; Twinomuhwezi, H.; Gonzaga, A.; Nakiguli, C.K.; Onen, P.; Angiro, C.; Okwir, A.; Opio, B.; Otema, T.; et al. Heavy Metal Contamination of Sediments from an Exoreic African Great Lakes’ Shores (Port Bell, Lake Victoria), Uganda. Pollutants 2022, 2, 407–421. [Google Scholar] [CrossRef]
  89. Opolot, M.; Omara, T.; Adaku, C.; Ntambi, E. Pollution Status, Source Apportionment, Ecological and Human Health Risks of Potentially (Eco)toxic Element-Laden Dusts from Urban Roads, Highways and Pedestrian Bridges in Uganda. Pollutants 2023, 3, 74–88. [Google Scholar] [CrossRef]
  90. Nazzal, Y.; Ghrefat, H.; Rosen, M.A. Heavy Metal Contamination of Roadside Dusts: A Case Study for Selected Highways of the Greater Toronto Area, Canada Involving Multivariate Geostatistics. Res. J. Environ. Sci. 2014, 8, 259–273. [Google Scholar] [CrossRef]
Figure 2. Concentrations of lead and cadmium along the sampled stretch of the Pager River, Northern Uganda. Sites A, B, and C are in the Guu A Parish (upstream), while D, E, and F are in the Westland A parish (downstream).
Jox 13 00035 g002
Figure 3. Pearson’s correlation matrix plot for the physicochemical parameters and PTEs of water from the sampled stretch of the Pager River, Northern Uganda.
Jox 13 00035 g003
Figure 4. PCA loading plot showing the effect of physicochemical parameters influencing the variation of PTEs of water from the sampled stretch of the Pager River, Northern Uganda.
Jox 13 00035 g004
Table 1. Physiochemical parameters of water from different points along the Pager River, Uganda.
Parameter 1ABCDEFWHO [51]
pH7.49 ± 0.067.43 ± 0.007.32 ± 0.017.51 ± 0.047.38 ± 0.067.33 ± 0.106.5–8.5
Electrical conductivity (µS/cm)0.163 ± 0.0060.170 ± 0.0000.170± 0.0000.157 ± 0.0060.153 ± 0.0060.150 ± 0.0001500
Temperature (°C)27.7 ± 0.528.3 ± 0.528.3 ± 0.529.5 ± 0.828.5 ± 0.528.3 ± 0.515
Total dissolved solids (mg/L)0.10 ± 0.000.09 ± 0.010.09 ± 0.000.08 ± 0.000.08 ± 0.000.07 ± 0.001000
Turbidity (NTU)49.0 ± 3.150.1 ± 1.142.3 ± 5.046.4 ± 0.643.5 ± 0.240.7 ± 2.15.0
1 Results are presented as means ± standard deviation of triplicates. Sites A, B, and C are in the Guu A Parish (upstream), while D, E, and F are in the Westland A parish (downstream).
Table 2. Average daily doses of water samples from the Pager River, Uganda.
Daily Dose Age Group Sampling Point PbCd
DITwater (×10−2 mg/kg/day)ChildrenA5.354.48
B 6.523.34
C4.096.29
D4.484.50
E6.916.11
F3.555.59
DCwater (×10−7 mg/L/day)A1.67 1.39
B 2.031.03
C1.271.96
D1.391.40
E2.151.90
F1.111.74
DITwater (×10−1 mg/kg/day)AdultsA1.561.31
B 1.900.97
C1.191.83
D1.311.31
E2.011.78
F1.041.63
DCwater (×10−6 mg/L/day)A1.271.06
B 1.540.79
C0.971.49
D1.061.07
E1.641.45
F0.841.32
Oral reference dose (mg/kg/day) [47]1.4 × 10−11 × 10−3
Dermal reference dose (mg/L/day) [30]5.25 × 10−46.0 × 10−5
Sites A, B, and C are in the Guu A Parish (upstream), while D, E, and F are in the Westland A parish (downstream).
Table 3. Target hazard quotients for ingestion and dermal contact with water from the Pager River, Uganda.
Age GroupPathwaySampling PointTarget Hazard QuotientTotal Target Hazard Quotient
PbCd
ChildrenIngestionA0.38244.845.182
B 0.46633.433.866
C0.29262.963.192
D0.32045.045.320
E0.49461.161.594
F0.25455.956.154
Dermal contactA0.00032 0.00230.00262
B 0.000390.00170.00209
C0.000240.00330.0354
D0.000260.00230.00256
E0.000410.00320.00361
F0.000210.00290.00311
AdultsIngestionA1.11131132.11
B 1.369798.36
C0.85183183.85
D0.94131131.94
E1.44178179.44
F0.74163163.74
Dermal contactA0.00240.01770.0201
B 0.00290.01320.0161
C0.00180.02480.0266
D0.00200.01780.0198
E0.00310.02410.0272
F0.00160.02200.0236
Sites A, B, and C are in the Guu A Parish (upstream), while D, E, and F are in the Westland A parish (downstream).
Table 4. Cancer risk values (×10−4) for drinking water from the Pager River, Uganda.
Age GroupSampling Point Cancer Risk Value Total Cancer Risk Value
PbCd
Children A0.45480.17000.6248
B 0.55420.12700.6812
C0.38050.23900.6195
D0.38080.17100.5518
E0.58740.23200.8194
F0.03020.21200.2422
Adults A0.01330.05000.0633
B 0.01620.37000.3862
C0.01200.70000.7120
D0.01100.50000.5110
E0.00200.68000.6820
F0.00090.62000.6209
Ingestion cancer slope factor (kg day/mg) [47]8.5 × 10−63.8 × 10−4
Sites A, B, and C are in the Guu A Parish (upstream), while D, E, and F are in the Westland A parish (downstream).
Disclaimer/Publisher’s Note: The statements, opinions and data contained in all publications are solely those of the individual author(s) and contributor(s) and not of MDPI and/or the editor(s). MDPI and/or the editor(s) disclaim responsibility for any injury to people or property resulting from any ideas, methods, instructions or products referred to in the content.

