
Item Response Theory Investigation of Misophonia Auditory Triggers

 ,
, 
 ,
,  , and
, and 
Abstract
:1. Introduction
2. Materials and Methods
2.1. Sample
2.2. Measures
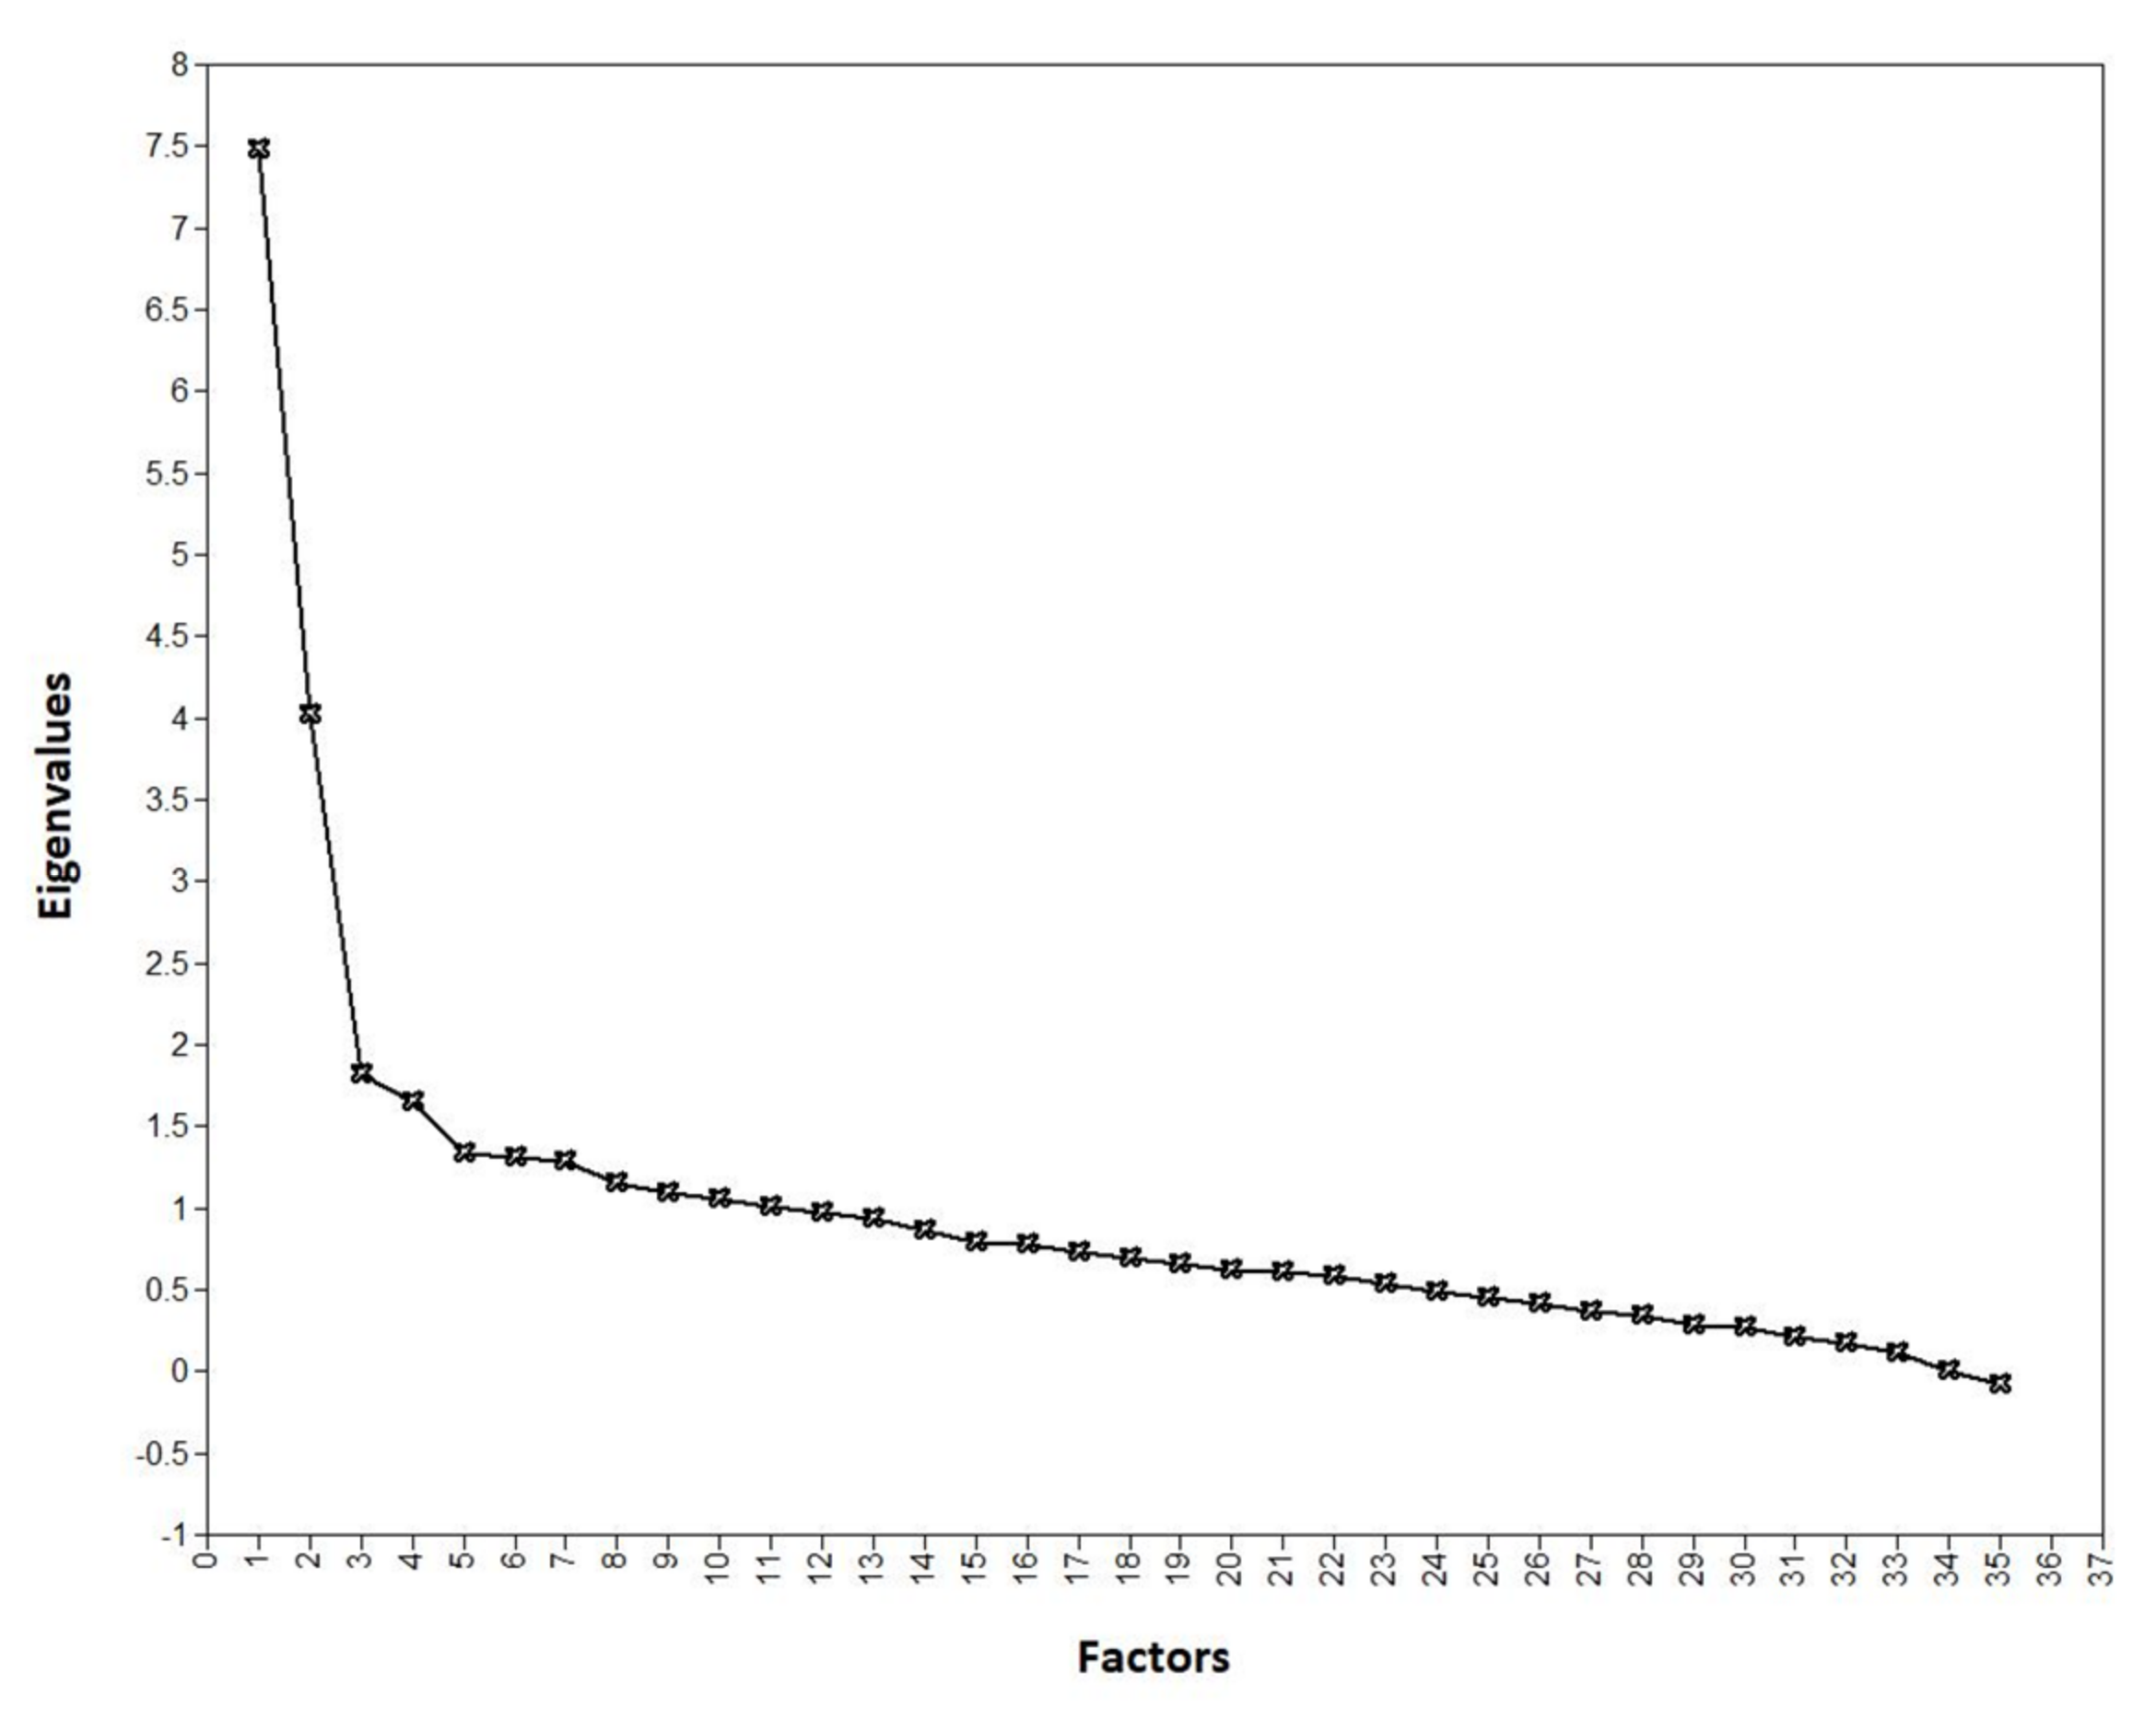
2.3. Factor Analysis
2.4. Item Response Theory
2.5. Reliability
2.6. Hypothesis Testing
3. Results
3.1. Sample: Demographic and Clinical Characteristics
3.2. Trigger Psychometric Properties-Misophonia Specific Population
3.2.1. Intensity of Misophonic Triggers
3.2.2. Endorsement of Misophonic Triggers
Factor Analysis
Reliability
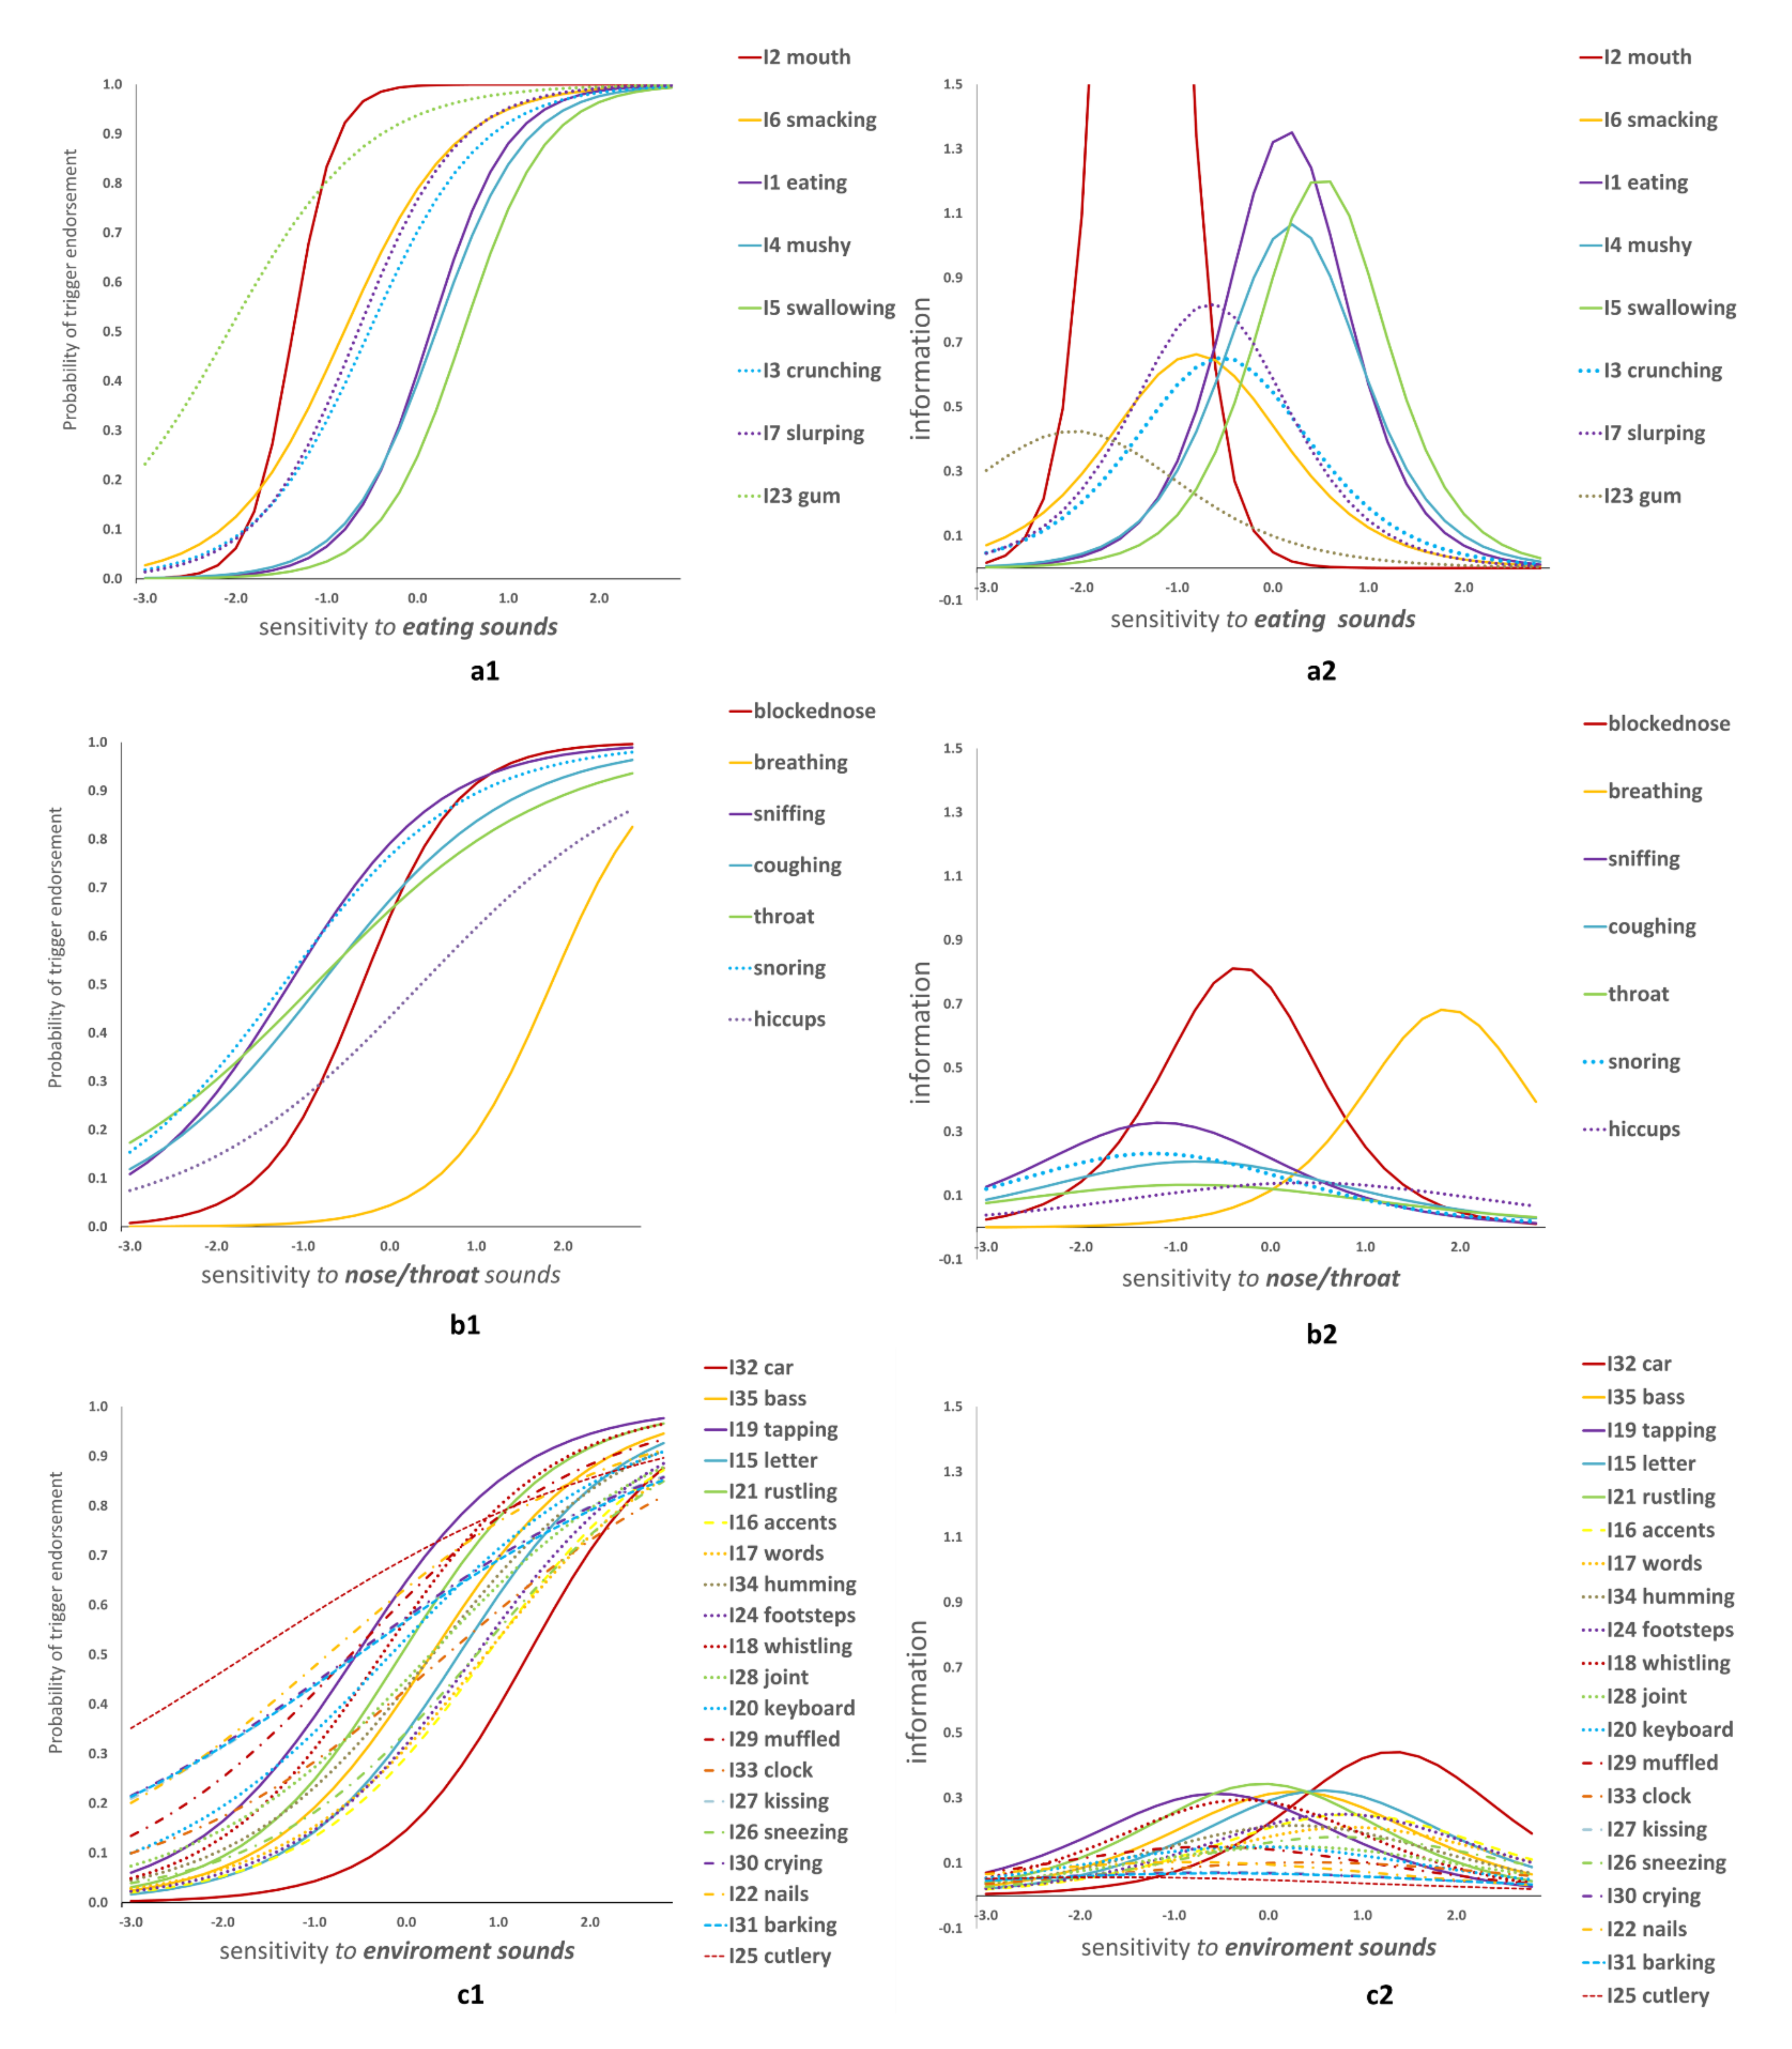
Item Response Theory
3.3. Hypothesis Testing—Misophonia Non-Specific Sample MNS
4. Discussion
5. Conclusions
Author Contributions
Funding
Institutional Review Board Statement
Informed Consent Statement
Data Availability Statement
Conflicts of Interest
References
- Brout, J.J.; Edelstein, M.; Erfanian, M.; Mannino, M.; Miller, L.J.; Rouw, R.; Kumar, S.; Rosenthal, M.Z. Investigating Misophonia: A Review of the Empirical Literature, Clinical Implications, and a Research Agenda. Front. Neurosci. 2018, 12, 36. [Google Scholar] [CrossRef] [Green Version]
- Edelstein, M.; Brang, D.; Rouw, R.; Ramachandran, V.S. Misophonia: Physiological investigations and case descriptions. Front. Hum. Neurosci. 2013, 7, 296. [Google Scholar] [CrossRef] [PubMed] [Green Version]
- Erfanian, M.; Kartsonaki, C.; Keshavarz, A. Misophonia and comorbid psychiatric symptoms: A preliminary study of clinical findings. Nord. J. Psychiatry 2019, 73, 219–228. [Google Scholar] [CrossRef] [PubMed]
- Kumar, S.; Tansley-Hancock, O.; Sedley, W.; Winston, J.S.; Callaghan, M.F.; Allen, M.; Cope, T.E.; Gander, P.E.; Bamiou, D.-E.; Griffiths, T.D. The Brain Basis for Misophonia. Curr. Biol. 2017, 27, 527–533. [Google Scholar] [CrossRef] [PubMed] [Green Version]
- Jastreboff, P.J.; Hazell, J. Tinnitus Retraining Therapy; Cambridge University Press: Cambridge, UK, 2008. [Google Scholar]
- Jastreboff, M.M.; Jastreboff, P.J. Components of decreased sound tolerance: Hyperacusis, misophonia, phonophobia. ITHS News Lett. 2001, 2, 5–7. [Google Scholar]
- Jager, I.; De Koning, P.; Bost, T.; Denys, D.; Vulink, N. Misophonia: Phenomenology, comorbidity and demographics in a large sample. PLoS ONE 2020, 15, e0231390. [Google Scholar] [CrossRef] [PubMed] [Green Version]
- Cavanna, A. What is misophonia and how can we treat it? Expert Rev. Neurother. 2014, 14, 357–359. [Google Scholar] [CrossRef] [Green Version]
- Hansen, H.; Leber, A.B.; Saygin, Z.M. What sound sources trigger misophonia? Not just chewing and breathing. J. Clin. Psychol. 2021. [Google Scholar] [CrossRef]
- Rouw, R.; Erfanian, M. A Large-Scale Study of Misophonia. J. Clin. Psychol. 2018, 74, 453–479. [Google Scholar] [CrossRef]
- Schröder, A.E.; Vulink, N.; Denys, D. Misophonia: Diagnostic Criteria for a New Psychiatric Disorder. PLoS ONE 2013, 8, e54706. [Google Scholar] [CrossRef]
- Wu, M.S.; Lewin, A.B.; Murphy, T.K.; Storch, E.A. Misophonia: Incidence, Phenomenology, and Clinical Correlates in an Undergraduate Student Sample. J. Clin. Psychol. 2014, 70, 994–1007. [Google Scholar] [CrossRef] [PubMed]
- Møller, A.R. Misophonia, phonophobia, and “exploding head” syndrome. In Textbook of Tinnitus; Springer Science + Business Media: New York, NY, USA, 2011; pp. 25–27. [Google Scholar]
- Zhou, X.; Wu, M.S.; Storch, E.A. Misophonia symptoms among Chinese university students: Incidence, associated impairment, and clinical correlates. J. Obs.-Compuls. Relat. Disord. 2017, 14, 7–12. [Google Scholar] [CrossRef]
- Johnson, M.A. Rating Misophonia Severity: The Misophonia Assessment Questionnaire. Unpublished. 2013. [Google Scholar]
- Danesh, A.; Aazh, H. Misophonia: A Neurologic, Psychologic, and Audiologic Complex. Hear. J. 2020, 73, 20–23. [Google Scholar] [CrossRef]
- Taylor, S.; Conelea, C.A.; McKay, D.; Crowe, K.B.; Abramowitz, J.S. Sensory intolerance: Latent structure and psychopathologic correlates. Compr. Psychiatry 2014, 55, 1279–1284. [Google Scholar] [CrossRef] [Green Version]
- Taylor, S. Misophonia: A new mental disorder? Med. Hypotheses 2017, 103, 109–117. [Google Scholar] [CrossRef]
- Cavanna, A.E.; Seri, S. Misophonia: Current perspectives. Neuropsychiatr. Dis. Treat. 2015, 11, 2117–2123. [Google Scholar] [CrossRef] [Green Version]
- Sanchez, T.G.; Silva, F.E.D. Familial misophonia or selective sound sensitivity syndrome: Evidence for autosomal dominant inheritance? Braz. J. Otorhinolaryngol. 2018, 84, 553–559. [Google Scholar] [CrossRef] [PubMed]
- Schneider, R.L.; Arch, J.J. Letter to the editor: Potential treatment targets for misophonia. Gen. Hosp. Psychiatry 2015, 37, 370–371. [Google Scholar] [CrossRef]
- Vitoratou, S.; Uglik-Marucha, N.; Hayes, C.; Gregory, J. Listening to people with misophonia: Exploring the multiple dimensions of sound intolerance using a new psychometric tool, the S-Five, in a large sample of individuals identifying with the condition. Manuscript submitted for publication. 2021. [Google Scholar]
- Muthén, B. A general structural equation model with dichotomous, ordered categorical, and continuous latent variable indicators. Psychometrika 1984, 49, 115–132. [Google Scholar] [CrossRef] [Green Version]
- Muthen, L.K.; Muthén, B.O. Mplus User’s Guide, 8th ed.; Muthén, B.O., Ed.; Muthén & Muthén: Los Angeles, CA, USA, 2017. [Google Scholar]
- Guttman, L. Some necessary conditions for common factor analysis. Psychometrika 1954, 19, 149–161. [Google Scholar] [CrossRef]
- Kaiser, H.F. The Application of Electronic Computers to Factor Analysis. Educ. Psychol. Meas. 1960, 20, 141–151. [Google Scholar] [CrossRef]
- Cattell, R.B. The Scree Test For The Number Of Factors. Multivar. Behav. Res. 1966, 1, 245–276. [Google Scholar] [CrossRef]
- Nunnally, J.C.; Bernstein, I.H. Psychometric Theory; McGraw-Hill: New York, NY, USA, 1994. [Google Scholar]
- Hu, L.; Bentler, P. Cutoff criteria for fit indexes in covariance structure analysis: Conventional criteria versus new alternatives. Struct. Equ. Model. Multidiscip. J. 1999, 6, 1–55. [Google Scholar] [CrossRef]
- Hoelter, J. The Analysis of Covariance Structures. Sociol. Methods Res. 1983, 11, 325–344. [Google Scholar] [CrossRef]
- Bentler, P.M. Comparative fit indexes in structural models. Psychol. Bull. 1990, 107, 238–246. [Google Scholar] [CrossRef] [PubMed]
- Bentler, P.M.; Bonett, D. Significance tests and goodness of fit in the analysis of covariance structures. Psychol. Bull. 1980, 88, 588–606. [Google Scholar] [CrossRef]
- Baker, F. The Basics of Item Response Theory; ERIC Clearinghouse on Assessment and Evaluation, University of Maryland: College Park, MD, USA, 2001. [Google Scholar]
- Cronbach, L. Coefficient alpha and the internal structure of tests. Psychometrika 1951, 16, 297–334. [Google Scholar] [CrossRef] [Green Version]
- Cohen, J. Weighted kappa: Nominal scale agreement with provision for scaled disagreement or partial credit. Psychol. Bull. 1968, 70, 213–220. [Google Scholar] [CrossRef]
- Landis, J.R.; Koch, G.G. The measurement of observer agreement for categorical data. Biometrics 1977, 33, 159–174. [Google Scholar] [CrossRef] [PubMed] [Green Version]
- Kuiper, R.; Hoogenboezem, R. Nopaco: A Non-Parametric Concordance Coefficient, Version 1.0.5; 2019. Available online: https://CRAN.R-project.org/package=nopaco (accessed on 16 August 2021).
- Benjamini, Y.; Hochberg, Y. Controlling the False Discovery Rate: A Practical and Powerful Approach to Multiple Testing. J. R. Stat. Soc. Ser. B (Methodol.) 1995, 57, 289–300. [Google Scholar] [CrossRef]
- R Core Team. R: A Language and Environment for Statistical Computing; R Foundation for Statistical Computing: Vienna, Austria, 2017. [Google Scholar]
- Hocaoglu, C. A little known topic misophonia: Two case reports. Dusunen Adam J. Psychiatry Neurol. Sci. 2018, 31, 89–96. [Google Scholar] [CrossRef] [Green Version]
- Jastreboff, M.M.; Jastreboff, P.J. Treatments for Decreased Sound Tolerance (Hyperacusis and Misophonia). Semin. Hear. 2014, 35, 105–120. [Google Scholar] [CrossRef] [Green Version]
- Quek, T.C.; Ho, C.S.; Choo, C.C.; Nguyen, L.H.; Tran, B.X.; Ho, R.C. Misophonia in Singaporean Psychiatric Patients: A Cross-Sectional Study. Int J. Environ. Res. Public Health 2018, 15, 1410. [Google Scholar] [CrossRef] [PubMed] [Green Version]
- Schröder, A.E.; Vulink, N.; Van Loon, A.; Denys, D. Cognitive behavioral therapy is effective in misophonia: An open trial. J. Affect. Disord. 2017, 217, 289–294. [Google Scholar] [CrossRef] [PubMed]
- Cox, T. Scraping sounds and disgusting noises. Appl. Acoust. 2008, 69, 1195–1204. [Google Scholar] [CrossRef] [Green Version]
- McKay, D.; Acevedo, B.P. Clinical characteristics of misophonia and its relation to sensory processing sensitivity: A critical analysis. In The Highly Sensitive Brain; Acevedo, B.P., Ed.; Academic Press: Cambridge, MA, USA, 2020; pp. 165–185. [Google Scholar]
- Salkovskis, P.M.; Forrester, E.; Richards, C. Cognitive–behavioural approach to understanding obsessional thinking. Br. J. Psychiatry 1998, 173, 53–63. [Google Scholar] [CrossRef]
- Kumar, S.; Dheerendra, P.; Erfanian, M.; Benzaquén, E.; Sedley, W.; Gander, P.; Lad, M.; Bamiou, D.E.; Griffiths, T.D. The motor basis for misophonia. J. Neurosci. 2021, 41, 5762–5770. [Google Scholar] [CrossRef] [PubMed]
- Siepsiak, M.; Sliwerski, A.; Lukasz Dragan, W. Development and Psychometric Properties of MisoQuest-A New Self-Report Questionnaire for Misophonia. Int. J. Environ. Res. Public Health 2020, 17, 1797. [Google Scholar] [CrossRef] [Green Version]
- Baranek, G.T.; David, F.J.; Poe, M.D.; Stone, W.L.; Watson, L.R. Sensory Experiences Questionnaire: Discriminating sensory features in young children with autism, developmental delays, and typical development. J. Child Psychol. Psychiatry 2006, 47, 591–601. [Google Scholar] [CrossRef]


| Sound | Mean (sd) | Median (Q1–Q3) | Agreement in Time | Weighted Cohen’s k | Psi (95% CI) |
|---|---|---|---|---|---|
| I1 Normal eating | 2.2 (1.2) | 2 (1–3) | 0.96 | 0.81 | 0.86 (0.82, 1) |
| I2 Chewing/Mouth open | 3.5 (0.8) | 4 (3–4) | 0.98 | 0.82 | 0.79 (0.74, 1) |
| I3 Crunching | 2.7 (1.3) | 3 (2–4) | 0.97 | 0.91 | 0.89 (0.86, 1) |
| I4 Mushy foods | 2.0 (1.4) | 2 (1–3) | 0.92 | 0.70 | 0.83 (0.78, 1) |
| I5 Swallowing | 1.8 (1.3) | 2 (1–3) | 0.97 | 0.86 | 0.87 (0.83, 1) |
| I6 Lip smacking | 2.9 (1.1) | 3 (2–4) | 0.94 | 0.71 | 0.84 (0.79, 1) |
| I7 Slurping | 2.8 (1.2) | 3 (2–4) | 0.97 | 0.88 | 0.87 (0.83, 1) |
| I8 Normal breathing | 0.9 (1.1) | 1 (0–1) | 0.96 | 0.57 | 0.83 (0.79, 1) |
| I9 Loud/unusual breathing (blocked nose) | 2.6 (1.2) | 3 (2–4) | 0.96 | 0.80 | 0.84 (0.80, 1) |
| I10 Throat clearing | 1.9 (1.3) | 2 (1–3) | 0.94 | 0.63 | 0.83 (0.77, 1) |
| I11 Repetitive coughing | 2.1 (1.2) | 2 (1–3) | 0.95 | 0.78 | 0.85 (0.81, 1) |
| I12 Repetitive sniffing | 2.6 (1.2) | 3 (2–4) | 0.98 | 0.83 | 0.88 (0.84, 1) |
| I13 Hiccups | 0.9 (1) | 1 (0–1) | 0.94 | 0.52 | 0.79 (0.74, 1) |
| I14 Snoring | 2.6 (1.4) | 3 (2–4) | 0.96 | 0.85 | 0.87 (0.83, 1) |
| I15 Certain letter sounds | 1.0 (1.3) | 0 (0–2) | 0.98 | 0.92 | 0.82 (0.77, 1) |
| I16 Certain accents | 0.8 (1.2) | 0 (0–1) | 0.97 | 0.76 | 0.75 (0.70, 1) |
| I17 Certain words | 0.9 (1.2) | 0 (0–2) | 0.96 | 0.66 | 0.77 (0.71, 1) |
| I18 Whistling sound | 1.8 (1.4) | 2 (1–3) | 0.94 | 0.80 | 0.85 (0.81, 1) |
| I19 Sound of tapping (pen, foot, finger) | 2.2 (1.3) | 2 (1–3) | 0.95 | 0.81 | 0.86 (0.82, 1) |
| I20 Keyboard tapping | 1.5 (1.3) | 1 (0–3) | 0.97 | 0.85 | 0.86 (0.82, 1) |
| I21 Rustling plastic or paper | 1.5 (1.4) | 1 (0–3) | 0.96 | 0.80 | 0.85 (0.81, 1) |
| I22 Cutting nails | 2.1 (1.4) | 2 (1–3) | 0.95 | 0.77 | 0.85 (0.81, 1) |
| I23 Chewing gum | 3.4 (1) | 4 (3–4) | 0.97 | 0.82 | 0.83 (0.78, 1) |
| I24 Footsteps | 0.8 (1.1) | 0 (0–1) | 0.95 | 0.66 | 0.77 (0.72, 1) |
| I25 Cutlery noises | 2.3 (1.4) | 2 (1–4) | 0.94 | 0.76 | 0.84 (0.79, 1) |
| I26 Sneezing | 0.8 (1.1) | 0 (0–1) | 0.96 | 0.70 | 0.83 (0.78, 1) |
| I27 Kissing | 1.5 (1.4) | 1 (0–3) | 0.96 | 0.72 | 0.87 (0.82, 1) |
| I28 Joint cracking | 1.2 (1.3) | 1 (0–2) | 0.97 | 0.82 | 0.83 (0.79, 1) |
| I29 Muffled | 2.0 (1.4) | 2 (1–3) | 0.97 | 0.89 | 0.89 (0.85, 1) |
| I30 Baby crying | 1.7 (1.4) | 1 (0–3) | 0.97 | 0.88 | 0.87 (0.83, 1) |
| I31 Repetitive barking | 1.8 (1.3) | 2 (1–3) | 0.97 | 0.85 | 0.87 (0.83, 1) |
| I32 Car engine | 0.5 (0.9) | 0 (0–1) | 0.95 | 0.50 | 0.76 (0.71, 1) |
| I33 Clock ticking | 1.2 (1.3) | 1 (0–2) | 0.96 | 0.80 | 0.84 (0.79, 1) |
| I34 Humming of object | 1.2 (1.2) | 1 (0–2) | 0.95 | 0.81 | 0.84 (0.81, 1) |
| I35 Bass sounds | 1.4 (1.5) | 1 (0–3) | 0.92 | 0.70 | 0.82 (0.78, 1) |
| Item | Trigger Endorsement | EFA Loadings (Promax Rotation) | Internal Consistency * | 2-PL IRT Model Parameters | ||||
|---|---|---|---|---|---|---|---|---|
| N (%) | F1 | F2 | F3 | AID | ITC | a (sd) | b (sd) | |
| I2 mouth | 549 (89.9) | 1.03 | 0.75 | 0.60 | 4.3 (0.9) | −1.4 (0.1) | ||
| I6 smacking | 438 (71.5) | 0.75 | 0.75 | 0.61 | 1.6 (0.2) | −0.8 (0.1) | ||
| I1 eating | 279 (45.6) | 0.73 | 0.74 | 0.69 | 2.3 (0.3) | 0.1 (0.1) | ||
| I4 mushy | 268 (43.8) | 0.72 | 0.74 | 0.67 | 2.1 (0.3) | 0.2 (0.1) | ||
| I5 swallowing | 209 (34.3) | 0.66 | 0.31 | 0.75 | 0.64 | 2.2 (0.3) | 0.5 (0.1) | |
| I3 crunching | 396 (64.6) | 0.64 | 0.75 | 0.64 | 1.6 (0.2) | −0.5 (0.1) | ||
| I7 slurping | 421 (68.7) | 0.64 | 0.25 | 0.74 | 0.66 | 1.8 (0.2) | −0.7 (0.1) | |
| I23 gum | 548 (89.4) | 0.58 | 0.77 | 0.45 | 1.3 (0.2) | −2.1 (0.2) | ||
| I9 blocked nose | 361 (59.1) | 0.69 | 0.48 | 0.61 | 1.8 (0.4) | −0.3 (0.1) | ||
| I8 breathing | 62 (10.1) | 0.63 | 0.54 | 0.39 | 1.7 (0.4) | 1.9 (0.3) | ||
| I12 sniffing | 455 (74.3) | 0.57 | 0.52 | 0.53 | 1.1 (0.2) | −1.2 (0.2) | ||
| I11 coughing | 397 (65.0) | 0.45 | 0.51 | 0.56 | 0.9 (0.2) | −0.8 (0.2) | ||
| I10 throat | 390 (63.8) | 0.40 | 0.53 | 0.52 | 0.7 (0.2) | −0.9 (0.2) | ||
| I14 snoring | 447 (73.0) | 0.33 | 0.25 | 0.53 | 0.50 | 1.0 (0.2) | −1.2 (0.2) | |
| I13 hiccups | 269 (44.0) | 0.31 | 0.27 | 0.53 | 0.53 | 0.7 (0.1) | 0.4 (0.1) | |
| I32 car | 126 (20.7) | 0.63 | 0.73 | 0.44 | 1.3 (0.2) | 1.3 (0.2) | ||
| I35 bass | 269 (44.0) | 0.59 | 0.72 | 0.49 | 1.1 (0.1) | 0.3 (0.1) | ||
| I19 tapping | 380 (62.1) | 0.56 | 0.72 | 0.48 | 1.1 (0.1) | −0.5 (0.1) | ||
| I15 letter | 229 (37.4) | 0.55 | 0.72 | 0.47 | 1.1 (0.2) | 0.6 (0.1) | ||
| I21 rustling | 314 (51.5) | 0.55 | 0.72 | 0.50 | 1.2 (0.2) | −0.1 (0.1) | ||
| I16 accents | 199 (32.6) | 0.55 | 0.73 | 0.44 | 1.0 (0.1) | 0.9 (0.1) | ||
| I17 words | 207 (33.8) | 0.49 | 0.73 | 0.41 | 0.9 (0.1) | 0.9 (0.1) | ||
| I34 humming | 271 (44.4) | 0.49 | 0.73 | 0.44 | 0.9 (0.1) | 0.3 (0.1) | ||
| I24 footsteps | 213 (34.9) | 0.46 | 0.73 | 0.45 | 1.0 (0.1) | 0.8 (0.1) | ||
| I18 whistling | 342 (55.9) | 0.44 | 0.72 | 0.47 | 1.1 (0.1) | −0.3 (0.1) | ||
| I28 joint | 278 (45.6) | 0.43 | 0.73 | 0.41 | 0.8 (0.1) | 0.3 (0.1) | ||
| I20 keyboard | 323 (53.0) | 0.39 | 0.73 | 0.39 | 0.8 (0.1) | −0.2 (0.1) | ||
| I29 muffled | 369 (60.3) | 0.38 | 0.73 | 0.39 | 0.8 (0.1) | −0.6 (0.1) | ||
| I33 clock | 267 (43.6) | 0.36 | 0.73 | 0.37 | 0.6 (0.1) | 0.4 (0.2) | ||
| I27 kissing | 347 (56.9) | 0.36 | 0.74 | 0.33 | 0.5 (0.1) | −0.5 (0.2) | ||
| I26 sneezing | 222 (36.3) | 0.27 | 0.34 | 0.73 | 0.42 | 0.9 (0.1) | 0.8 (0.1) | |
| I30 crying | 349 (57.1) | 0.34 | 0.74 | 0.34 | 0.5 (0.1) | −0.6 (0.2) | ||
| I22 nails | 381 (62.4) | 0.29 | 0.73 | 0.37 | 0.6 (0.1) | −0.9 (0.2) | ||
| I31 barking | 346 (56.4) | 0.26 | 0.74 | 0.33 | 0.5 (0.1) | −0.5 (0.2) | ||
| I25 cutlery | 420 (68.6) | 0.21 | 0.74 | 0.29 | 0.5 (0.1) | −1.7 (0.4) | ||
| Trigger Sound | Dimension | Odds Ratio | Unadjusted p-Value | B&H p-Value |
|---|---|---|---|---|
| I1 Normal eating | EaS | 42.9 | <0.001 | <0.001 |
| I2 Chewing/Mouth open | EaS | 43.6 | <0.001 | <0.001 |
| I3 Crunching | EaS | 107.5 | <0.001 | <0.001 |
| I4 Mushy foods | EaS | 18.8 | <0.001 | <0.001 |
| I5 Swallowing | EaS | 15.1 | 0.010 | 0.027 |
| I6 Lip smacking | EaS | 28.1 | <0.001 | <0.001 |
| I7 Slurping | EaS | 23.0 | <0.001 | <0.001 |
| I8 Normal breathing | N/TS | - | - | - |
| I9 Loud/unusual breathing (blocked nose) | N/TS | 21.8 | <0.001 | <0.001 |
| I10 Throat clearing | N/TS | 1.0 | 0.905 | 0.994 |
| I11 Repetitive coughing | N/TS | 1.8 | 0.107 | 0.208 |
| I12 Repetitive sniffing | N/TS | 3.4 | 0.002 | 0.008 |
| I13 Hiccups | N/TS | 1.0 | 0.983 | 0.994 |
| I14 Snoring | N/TS | 2.4 | 0.026 | 0.061 |
| I15 Certain letter sounds | GES | 2.6 | 0.113 | 0.208 |
| I16 Certain accents | GES | 1.0 | 0.952 | 0.994 |
| I17 Certain words | GES | 1.7 | 0.200 | 0.333 |
| I18 Whistling sound | GES | 2.9 | 0.007 | 0.022 |
| I19 Sound of tapping (pen, foot, finger) | GES | 1.2 | 0.708 | 0.918 |
| I20 Keyboard tapping | GES | 2.6 | 0.013 | 0.032 |
| I21 Rustling plastic or paper | GES | 3.0 | 0.005 | 0.018 |
| I22 Cutting nails | GES | 2.7 | 0.009 | 0.026 |
| I23 Chewing gum | EaS | 12.1 | <0.001 | <0.001 |
| I24 Footsteps | GES | 1.2 | 0.618 | 0.865 |
| I25 Cutlery noises | GES | 3.5 | 0.002 | 0.008 |
| I26 Sneezing | GES | 0.7 | 0.334 | 0.531 |
| I27 Kissing | GES | 1.3 | 0.444 | 0.648 |
| I28 Joint cracking | GES | 0.9 | 0.859 | 0.994 |
| I29 Muffled | GES | 1.9 | 0.086 | 0.177 |
| I30 Baby crying | GES | 1.1 | 0.901 | 0.994 |
| I31 Repetitive barking | GES | 1.6 | 0.185 | 0.324 |
| I32 Car engine | GES | 0.9 | 0.823 | 0.994 |
| I33 Clock ticking | GES | 1.4 | 0.421 | 0.641 |
| I34 Humming of object | GES | 1.2 | 0.673 | 0.906 |
| I35 Bass sounds | GES | 2.4 | 0.031 | 0.068 |
Publisher’s Note: MDPI stays neutral with regard to jurisdictional claims in published maps and institutional affiliations. |
© 2021 by the authors. Licensee MDPI, Basel, Switzerland. This article is an open access article distributed under the terms and conditions of the Creative Commons Attribution (CC BY) license (https://creativecommons.org/licenses/by/4.0/).
Share and Cite
Vitoratou, S.; Uglik-Marucha, N.; Hayes, C.; Erfanian, M.; Pearson, O.; Gregory, J. Item Response Theory Investigation of Misophonia Auditory Triggers. Audiol. Res. 2021, 11, 567-581. https://doi.org/10.3390/audiolres11040051
Vitoratou S, Uglik-Marucha N, Hayes C, Erfanian M, Pearson O, Gregory J. Item Response Theory Investigation of Misophonia Auditory Triggers. Audiology Research. 2021; 11(4):567-581. https://doi.org/10.3390/audiolres11040051
Chicago/Turabian StyleVitoratou, Silia, Nora Uglik-Marucha, Chloe Hayes, Mercede Erfanian, Oliver Pearson, and Jane Gregory. 2021. "Item Response Theory Investigation of Misophonia Auditory Triggers" Audiology Research 11, no. 4: 567-581. https://doi.org/10.3390/audiolres11040051