Article

Salt Tolerance and Ion Accumulation in Several Halophytic Plant Species Depending on the Type of Anion

Department of Plant Physiology, Faculty of Biology, University of Latvia, 1 Jelgavas Str., LV-1004 Rīga, Latvia
*
Author to whom correspondence should be addressed.
Int. J. Plant Biol. 2023, 14(4), 1131-1154; https://doi.org/10.3390/ijpb14040083
Submission received: 18 October 2023 / Revised: 29 November 2023 / Accepted: 29 November 2023 / Published: 1 December 2023
(This article belongs to the Section Plant Response to Stresses)

Abstract

:
The question of the effect of the anion type on halophyte salt tolerance and ion accumulation is still far from the necessary generalization due to the lack of comparative studies. The aim of the present study was to compare the relatively long-term effect of treatment with various salts formed by different anions on the growth and ion accumulation of several halophyte species in controlled conditions. The main experiments with the largest variety of individual salt types were performed with Cochlearia officinalis L. and two cultivars of Limonium sinuatum (L.) Mill. In addition, experiments with Lobularia maritima (L.) Desv., Plantago maritima L., and Tripolium pannonicum (Jacq.) Dobrocz. focused on the comparison of neutral (NaCl) and alkaline (NaHCO3) salts as well as NaNO3. Acetate salts appeared to be the most toxic, with only Plantago and Tripolium plants being able to withstand full treatment while having a pronounced inhibition in growth. Only the two Limonium cultivars were more susceptible to treatment with alkaline salts in comparison to that with neutral salts. In treatments with alkaline salts, the ion accumulation potential was lower in comparison to plants treated with chlorides and nitrates. It can be concluded that the type of anion is a significant determinant of salinity tolerance and ion accumulation in halophytes, but a high genotype dependence of the responses makes it difficult to generalize the obtained results.

Graphical Abstract

1. Introduction

The rapid increase in soil salinization is a serious global environmental issue that limits the growth of crop plants, as most of them are sensitive to high concentrations of salts in the soil [1]. By 2050, salt-affected areas are predicted to occupy about half of the total agricultural land [2]. Therefore, research on salt-tolerant plants, especially halophytes, provides an opportunity to understand the regulatory mechanisms of salt tolerance in plant species that can be cultivated under saline conditions. The results obtained may be helpful in generating stress-tolerant crop varieties.
Although soil salinization refers to the dominance of sodium and chloride ions, the excessive presence of soluble salt ions such as bicarbonate, magnesium, sulfate, potassium, calcium, and carbonate are also frequently found in considerable amounts in such soils [1]. The salinity of seawater is mainly due to the presence of Na+ and Cl. However, the chemical composition of inland salt lakes exhibits a remarkable diversity of ions; therefore, their composition tends to be characteristic of certain physiographic regions. Commonly, salt lakes are dominated by sodium, magnesium, and sulfate [3]. So, in addition to NaCl, the effects of other salts on plants must also be analyzed in the context of salinity. However, such available information is quite fragmentary and regards a limited number of plant species.
Plants respond to saline conditions with a number of molecular, cellular, biochemical, and physiological mechanisms to tolerate the stress [4,5]. As the ion balance is disrupted in plants by salt stress, the plant capability to reestablish ion homeostasis is a critical strategy to retain improved salt tolerance [6]. Research on Na+ and K+ homeostasis in plants has enhanced our understanding of the mechanisms of salt stress tolerance. The findings suggest that when K+ is a limiting factor in soil, Na+ can substitute for K+ in some cellular functions, but for others it is toxic [7]. A low amount of Na+ is unlikely to be toxic in the cytoplasm, and even high amounts of Na+ are not toxic in the vacuole; in addition, Na+ can undertake osmotic functions, reducing the total K+ requirements and improving plant growth [8,9,10].
The chloride ion (Cl) has traditionally been considered a toxic anion rather than a plant nutrient. It is largely excluded by plants due to its antagonism with nitrate (NO3), especially when accumulated at high concentrations. In recent years, there has been a paradigm shift in this regard, since Cl has gone from being considered a harmful ion that is accidentally absorbed through NO3 transporters to being regarded as beneficial macronutrient whose transport is finely regulated by plants [11]. Several studies have shown that halophytes require Cl as an osmoticum for growth, and these plants invest metabolic energy for its uptake, even under saline conditions [12].
So far, besides NaCl salinity, the effects of alkaline salts (carbonates and bicarbonates) on plants have been mostly studied without paying attention to the possible different physiological functions of these anions. Thus, the toxicity of Na2CO3 or NaHCO3 has been mainly associated with both sodium toxicity as well as a high pH [13]. While the impact of salt stress generally comprises osmotic and ionic stress effects, alkali stress adds the influence of a high pH, which inhibits ion uptake and disrupts the ionic balance of plant cells. Alkalinity stress appears to be more harmful than salinity stress, as reported in many studies [14,15,16,17,18].
Nitrate (NO3) is an essential anion for plant growth that is taken up from the soil in large quantities if available. For most plants, NO3 and NH4+ are the prevalent nitrogen sources [19,20]. Although ammonium is preferred to nitrate for most plants, it has been observed that ammonium uptake by roots is tightly regulated, as an elevated cytosolic ammonium concentration becomes toxic to plants [20,21]. Consequently, plants grown in the presence of NO3 take up and accumulate more K+ than when grown with NH4+. However, little is known about the direct effects produced by one ion on the transport of the other [22]. The effects of sodium nitrate salinity on plants have been only seldomly accessed [23].
Salt-tolerant plants can be broadly classified as either salt excluders or salt accumulators [24]. Salt excluders limit the translocation of ions to above-ground parts, but salt accumulators can either tolerate high intracellular salt levels or are able to remove excess salt accumulation from sensitive cellular compartments or tissues. Presumably, salt tolerance in salt accumulators is related to the ability to withstand high concentrations of electrolytes in the internal environment [25]. Therefore, salt-accumulating halophytes seem to be suitable models for a comparative study of the effects of different salt anions on plant salt tolerance.
Cochlearia officinalis is a flowering plant species of Brassicaceae classified as a typical halophyte confined to maritime and saline habitats like sea cliffs, coastal marshes, areas near salt mines, or saline springs [26,27]. C. officinalis is presumed to be a potential vegetable halophyte crop [28]. This biennial to short-lived perennial plant species occurs especially in the coastal areas of Northwest Europe, but subspecies are also found in the Arctic region. C. officinalis is mostly confined to brackish water conditions, whereas the closely related Cochlearia anglica can be found in more saline salt marshes [28]. Previous studies have evaluated the effect of NaCl on the growth of C. anglica [29] and the effect of increasing salinity on the germination of C. officinalis and C. anglica, among others [26], but not the effect of increasing salinity on the whole plant growth of C. officinalis.
Limonium (Plumbaginaceae) is a nearly cosmopolitan halophytic genus, and its center of diversity is the Mediterranean region, where ca. 70% of all Limonium species are endemic [30,31]. The number of Limonium species is estimated to be around 400, but when including the numerous microspecies recently described as endemic to small territories, the total number can reach ca. 600 species [31]. Many species flourish in saline soils, and they are therefore common near coasts, in salt marshes, and on saline, gypsum, and alkaline soils inland. Limonium sinuatum (L.) Mill. is widely cultivated in gardens and used in dried arrangements. Different L. sinuatum varieties are usually identified based on flower color. The flower petals are white, while the calyxes can be differently colored (e.g., white, blue, pink, yellow, and purple) [32]. In previous studies, the salt tolerance of different color varieties has been evaluated to identify the optimal variety suitable for planting in saline lands [33].
Lobularia maritima (L.) Desv. (Brassicaceae) is another coastal halophyte species widely used as a model in studies of molecular mechanisms of salinity tolerance [34,35,36,37]. L. maritima plants exhibit a high salt tolerance; they are able to survive even in the presence of 500 mM of NaCl in hydroponic conditions [34] and are tolerant to different heavy metals [38,39]. Two more ion-accumulating halophytic plant species with maximum growth potential at about 50 mM of NaCl salinity are Plantago maritima L. (Plantaginaceae) [40,41] and Tripolium pannonicum (Jacq.) Dobrocz. (syn. Aster tripolium L.) (Asteraceae) [42,43].
Given their potentially high tolerance against salt and other pollutants, these species can be used for practical purposes as ornamental plants (L. sinuatum, L. maritima), food plants (C. officinalis), or in environmental remediation technologies (C. officinalis, L. maritima, P. maritima, and T. pannonicum). For this purpose, information is needed on the tolerance of these species to various salts that may be present in the soil or used in fertilization systems. Possible differences in salt tolerance using sodium or potassium salts with various anions have not been investigated in any of these halophyte species. The aim of the present study was to compare the relatively long-term response of C. officinalis, L. sinuatum, L. maritima, P. maritima, and T. pannonicum plants to treatment with salts formed by different anions. It was hypothesized that both the salinity tolerance and ion accumulation potential would depend on the type of anion used for salinity treatment and could be associated with the specific physiological role of the particular anion in plants.

2. Materials and Methods
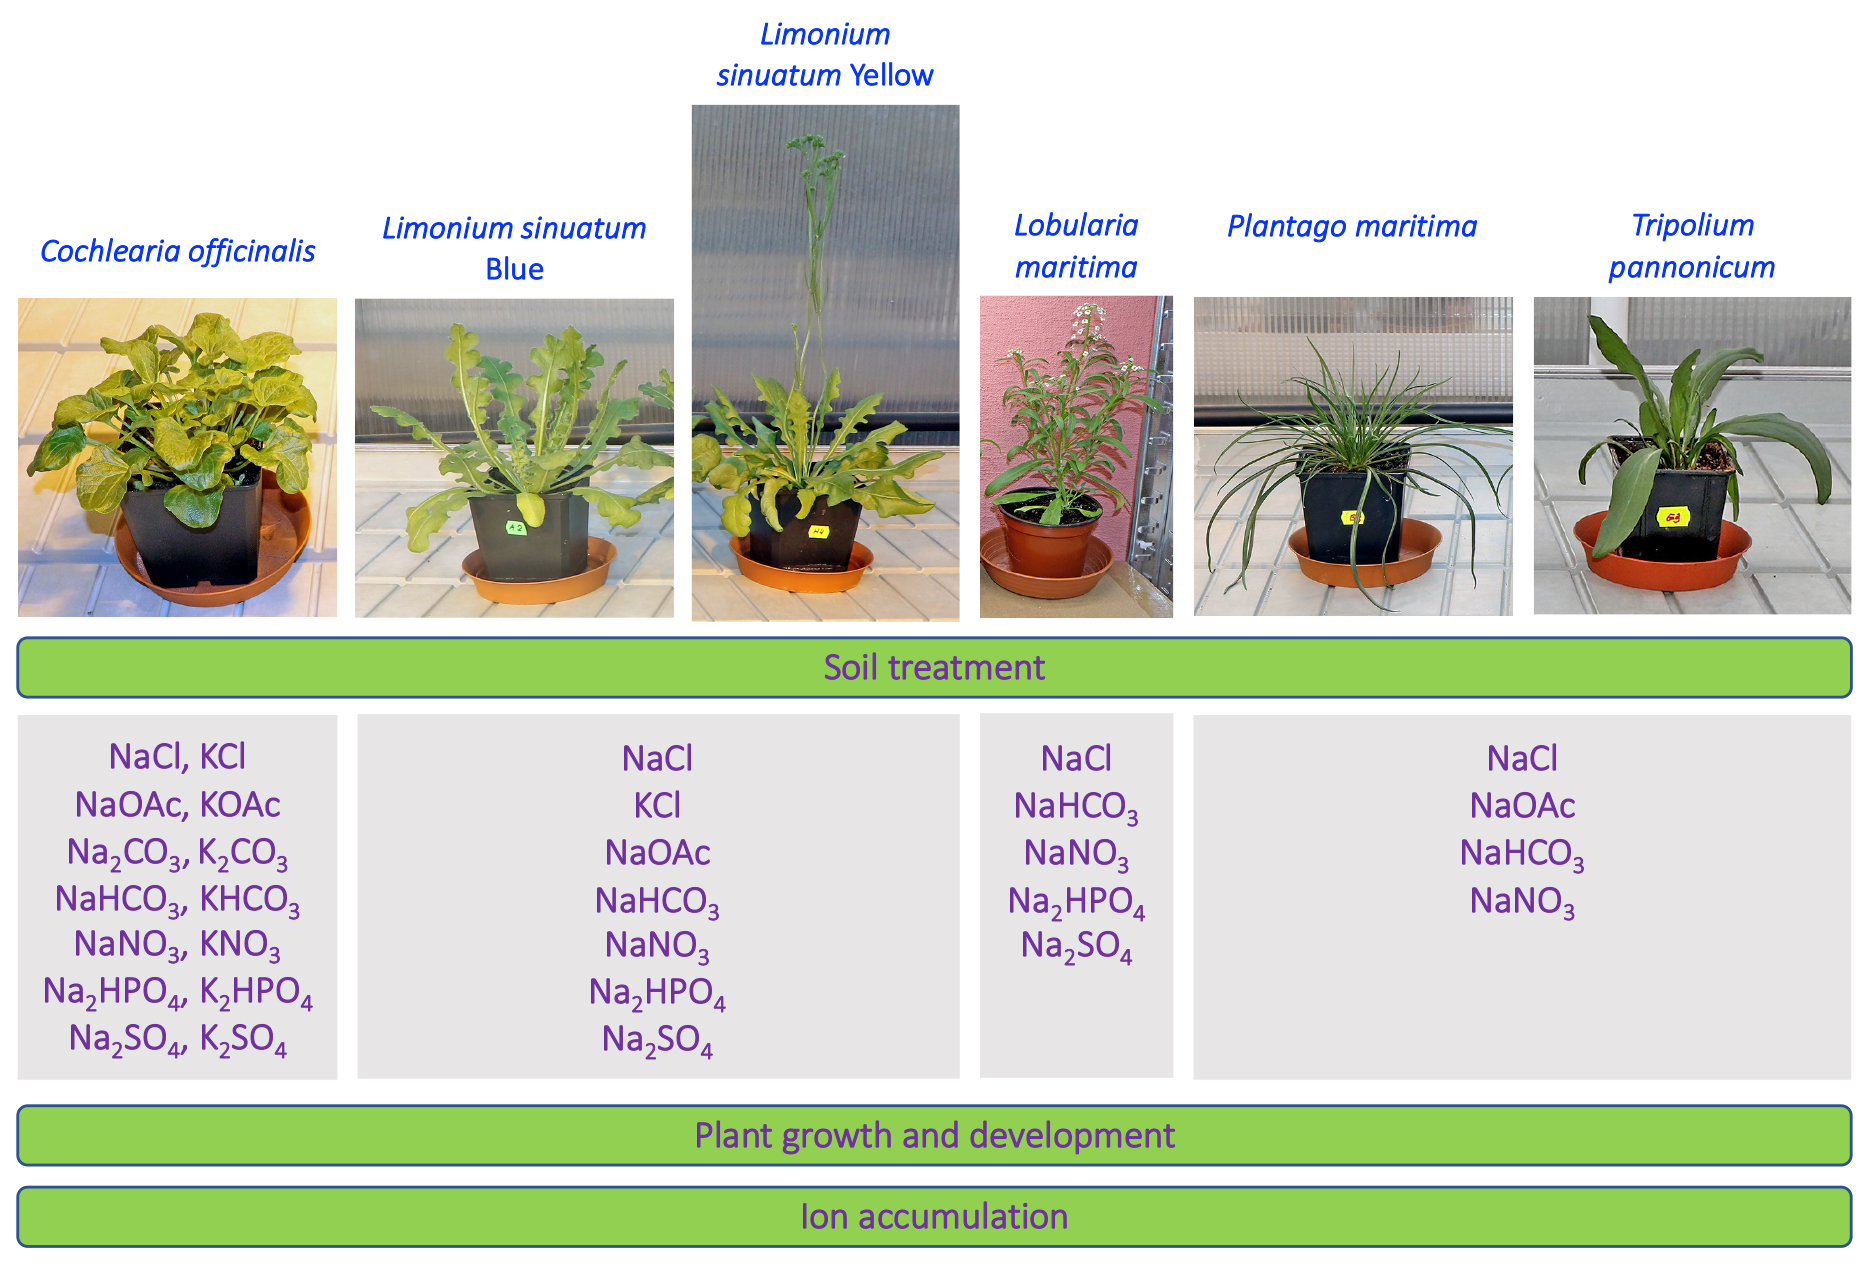
2.1. Plant Material

Two experiments with the largest variety of individual salts were performed with Cochlearia officinalis L. and two cultivars of Limonium sinuatum (L.) Mill. (with yellow flowers (cv. Gold Coast) and with blue flowers (cv. Middle Blue); Table 1).
In addition, in experiments with Lobularia maritima (L.) Desv., Plantago maritima L., and Tripolium pannonicum (Jacq.) Dobrocz., fewer salts were used, with the main focus on comparison between neutral (NaCl) and alkaline (NaHCO3) salts and nitrate (NaNO3). In addition, acetate salts were used for the treatment of C. officinalis, L. sinuatum, P. maritima, and T. pannonicum. The concentration of salts used for the specific model plant species was adjusted so that NaCl at this concentration would likely cause a moderate reduction in growth.
Seeds of C. officinalis were purchased from Magic Garden Seeds, Regensburg, Germany, and those of L. sinuatum and L. maritima were purchased from Kurzemes Sēklas, Talsi, Latvia. Seeds of P. maritima and T. pannonicum were collected in the wild in salt-affected coastal habitats on the island of Saaremaa, Estonia. For a better understanding of the information, the model plants will be referred to as Cochlearia (Cochlearia officinalis), Limonium B (Limonium sinuatum with blue flowers), Limonium Y (Limonium sinuatum with yellow flowers), Lobularia (Lobularia maritima), Plantago (Plantgao maritima), and Tripolium (Tripolium pannonicum).

2.2. Plant Establishment and Cultivation Conditions

Experiments were performed during a winter–spring season in partially controlled conditions. The seeds were sown in autoclaved commercial garden soil (Biolan, Eura, Finland) mixed with sterile deionized water in closed 1 L tissue culture containers. The containers were kept in an MLR-352H plant growth cabinet (Sanyo Electric, Osaka, Japan) and exposed to photoperiodic light (16/8 h light/darkness, 40 µmol m−2 s−1) with day/night temperatures of 25/15 °C. After approximately three weeks, when seedlings had formed the first two true leaves, they were individually transplanted into 250 mL plastic containers filled with a mixture of garden soil (Biolan, Eura, Finland) and quartz sand (Saulkalne S, Saulkalne, Latvia (5:1, v/v)). The containers were arranged in 48 L transparent plastic boxes closed with lids and placed in the experimental automated greenhouse (HortiMaX, Maasdijk, the Netherlands) at a day/night temperature of 23/16 °C and a relative air humidity of 65 ± 5%. Additional lighting with a 16 h photoperiod was supplemented by Master SON-TPIA Green Power CG T 400W (Philips, Amsterdam, the Netherlands) and Powerstar HQI-BT 400 W/D PRO (Osram, Munich, Germany) lamps (with a photon flux density of photosynthetically active radiation of 380 mol m−2 s−1 at the plant level). When the seedlings reached a stage of 4–5 true leaves, they were transplanted into 1.2 L (Cochlearia, Limonium, Plantago) or 0.5 L plastic containers (Lobularia, Tripolium) containing the same substrate as used previously.
Individual containers were randomly arranged on the greenhouse table and repositioned weekly. The water content in substrate was monitored with an HH2 moisture meter equipped with a WET-2 sensor (Delta-T Devices, Burwell, UK) and maintained at the minimum 50% throughout the experiment. Deionized water was used for watering. Every other week, the plants were fertilized with Yara Tera Kristalon Red and Yara Tera Calcinit fertilizers (Yara International, Oslo, Norway). A stock solution was prepared for each fertilizer (100 g L−1), and the working solution contained 25 mL of each per 10 L of deionized water used at a rate 100 or 50 mL per container for the 1.2 and 0.5 L containers, respectively.

2.3. Treatments

One week after the final transplantation, the plants were randomly divided into treatment groups with five individual plants per treatment. For Cochlearia, eight plants per treatment were used. Treatment with individual salts was performed gradually (twice a week) with doses of 50 mmol of the respective salt per 1 L of substrate equilibrated by the amount of metal until the final concentration in the substrate was reached (Table 1). The necessary amount of salt was dissolved in deionized water, and 100 or 50 mL per container for the 1.2 and 0.5 L containers, respectively, was applied to the substrate. Control plants received deionized water.
For Cochlearia and Limonium, the first treatment with acetate salts already resulted in turgor loss followed by plant death within three days. These plants were excluded from the experiment. For the Plantago and Tripolium plants, the first treatment with acetate resulted in some turgor loss, but the plants recovered and were further used for subsequent treatments with no immediate unfavorable consequences.

2.4. Physiological Measurements

The physiological status of the plants during cultivation was evaluated by means of a non-destructive measurement of the chlorophyll concentration and chlorophyll a fluorescence. For each treatment, five individual plants were used, with two or three independent measurements per plant. The chlorophyll concentration in the plant leaves was measured with a CCM-300 chlorophyll meter (Opti-Sciences, Hudson, NH, USA). The chlorophyll a fluorescence was measured in leaves dark-adapted for at least 20 min with a Handy PEA fluorometer (Hansatech Instruments, King’s Lynn, UK).

2.5. Plant Harvest and Measurements

The soil pH and electrical conductivity (EC) were measured in some experiments after the full treatment or at the end of the experiment. The substrate pH was measured using a pH 3000 pH meter (STEP Systems, Nuremberg, Germany). For EC, an HH2 moisture meter equipped with a WET-2 sensor (Delta-T Devices, Burwell, UK) was used. For every container, four separate readings on all sides of the container were performed for both measurements.
Experiments were terminated 4 to 5 weeks after reaching the final treatment concentration. Upon harvest, plant shoots were cut and separated into parts: leaf petioles and leaf blades for Cochlearia; dry leaves, large leaves, middle leaves, new leaves, flower stalks, and flowers for Limonium; leaves, stems, flower stalks, and flowers for Lobularia; and old leaves, middle leaves, and new leaves for Plantago and Tripolium. The roots were separated from the substrate and carefully washed to remove any adhered substrate particles. All plant parts were individually weighed before and after drying in an oven at 60 °C until reaching a constant mass. The tissue water content was calculated on a dry mass basis.
For the Cochlearia plants, an analysis of the relative electrolyte leakage was performed [44]. Leaf discs (0.5 cm in diameter) were cut from leaf blades (10 from each of three plants per treatment). The discs were placed in test tubes with 10 mL of deionized water for 24 h at room temperature. After that, the electrical conductivity of the solution (EC1) was measured using a LAQUAtwin B-771 compact conductivity meter (Horiba Scientific, Osaka, Japan). The tubes were incubated in a water bath at 80 °C for 2 h and cooled to room temperature, and the final electrical conductivity (EC2) was measured. The relative electrolyte leakage (EL) was measured as EC1 × 100/EC2.
Dried plant material was used for measurement of the electrical conductivity and Na+ and K+ concentrations. The plant material was homogenized by crushing by hand, and a 0.2 g sample was ground to a fine powder with a mortar and pestle. After adding 10 mL of deionized water and stirring with the pestle for 1 min, the homogenate was filtered through nylon mesh cloth (No. 80) and was used for measurement of the ion concentration with LAQUAtwin B-722 (Na+) and B-731 (K+) compact meters; the EC was measured with a LAQUAtwin B-771 conductivity meter (Horiba, Kyoto, Japan). Three analytical replicates were performed for each of three to five biological replicates per treatment.

2.6. Data Analysis

The results were analyzed with KaleidaGraph (v. 5.0, Synergy Software, Reading, PA, USA). The statistical significance of differences was evaluated via one-way ANOVA using post-hoc analysis with a minimum significant difference. Significant differences were indicated at p < 0.05. Multivariate analysis was used in order to discover which anions had similar effects on plant growth and ion accumulation. The analysis was performed with the freely available web program ClustVis (http://biit.cs.ut.ee/clustvis/; accessed on 30 June 2023) [45]. Unit variance scaling was applied to rows; singular value decomposition with imputation was used to calculate principal components.

3. Results

3.1. Experiment with Cochlearia officinalis

The first treatment with acetate salts (NaOAc and KOAc; 50 mmol per L of substrate) resulted in a loss in turgor by the Cochlearia plants followed by wilting and plant death within the three days. Plants treated with other salts did not show any signs of toxicity. Three weeks after the full treatment, Cochlearia plants showed no visible morphological differences (Figures S1 and S2).
Treatment with different individual salts resulted in significant differences in the substrate EC (Figure 1A) and pH (Figure 1B). The highest EC was evident for KNO3 treatment, followed by KCl and NaCl. The substrate EC decreased during plant cultivation for all treatments. The largest decreases were by 1662 mS m−1 (a 61% decrease) for the KNO3 treatment and by 1297 mS m−1 (a 53% decrease) for the KCl treatment, followed by 867 mS m−1 (NaCl, 50%), 750 mS m−1 (K2SO4, 56%), and 665 mS m−1 (Na2SO4, 52%), indicating plant uptake of electrolytically active ions.
Treatment with alkaline salts (Na2CO3, K2CO3, NaHCO3, or KHCO3) resulted in significantly higher substrate pH values in comparison to that with neutral salts (Figure 1B). The pH values for Na2HPO4 and K2HPO4 treatments also were significantly higher than the control values. In general, the pH tended to increase during plant cultivation, especially for the NaCl and KCl treatments (both by 0.72 units).
The effects of different salts on the growth and development of the Cochlearia plants were only negligible (Table 2). There were no significant differences between the control plants and plants treated with any of the salts for the number of leaves or the dry biomass of leaf petioles, leaf blades, and roots. However, significant differences between different salt treatments were evident for the dry mass of leaf petioles and the water content of leaf petioles. In addition, treatment with NaCl resulted in a significantly higher water content in leaf blades in comparison to that in control plants. There was no pronounced relationship between the alkalinity of salts and their effect on growth.
In contrast to the plant morphology, the photosynthesis-related parameters were significantly affected by different treatments, and this effect increased with time (Table 3). Thus, the leaf chlorophyll concentration three weeks after the full treatment was increased significantly for plants treated with NaCl, NaNO3, KNO3, and Na2SO4 in comparison to the control plants. The chlorophyll a fluorescence parameter Performance Index Total at the same time point was significantly increased over the control values for plants under all treatments except K2SO4.
Accumulation of Na+, K+, and the total amount of electrolytically active substances was measured separately in the leaf petioles, leaf blades, and roots of the Cochlearia plants (Table S1). The EC tended to be higher in petioles in comparison to that in blades, with an even lower level in roots. When leaves were considered, plants treated with NaCl accumulated the highest Na+ concentration among treatments with sodium salts. For plants treated with potassium salts, the highest K+ concentrations accumulated in the KCl and KNO3 treatments. The summed concentration of Na+ and K+ in leaf petioles was the highest for plants treated with NaCl, KCl, and KNO3 and in leaf blades for plants treated with NaCl.
The relative electrolyte leakage was measured in leaf blades, and it was evident that the highest proportion level of leakage was in plants treated with NaCl and KCl, followed by the KHCO3, NaNOs, and Na2HPO4 treatments (Figure 2). While the correlation between the proportion of electrolyte leakage from leaf discs and the EC in tissue extracts was relatively low (Figure 2B), the correlation between electrolyte leakage and the summed Na+ and K+ concentration was more pronounced (Figure 2C).
A multivariate analysis was performed to compare the effects of different salts on the growth and ion accumulation in the Cochlearia plants (Figure 3). According to similarity in effects, three groups of salts were evident. The highest similarities were seen between Na2CO3 and K2SO4 and between K2CO3 and KHCO3, and these four salts formed one cluster. A second group was formed by both chloride and both nitrate salts. The effects of Na2HPO4 and K2HPO4 were relatively similar and were related to those of NaHCO3 and Na2SO4, forming the third cluster together with the control plants.
When examining the relationship between the changes in plant characteristics, it could be seen that the accumulation potential for Na+ + K+ was strongly associated with the tissue EC and electrolyte leakage from leaf discs and partially related to the water content in the leaves. However, the root dry mass and root water content were strongly associated and were more related to the number of leaves and their biomass (Figure 3B).

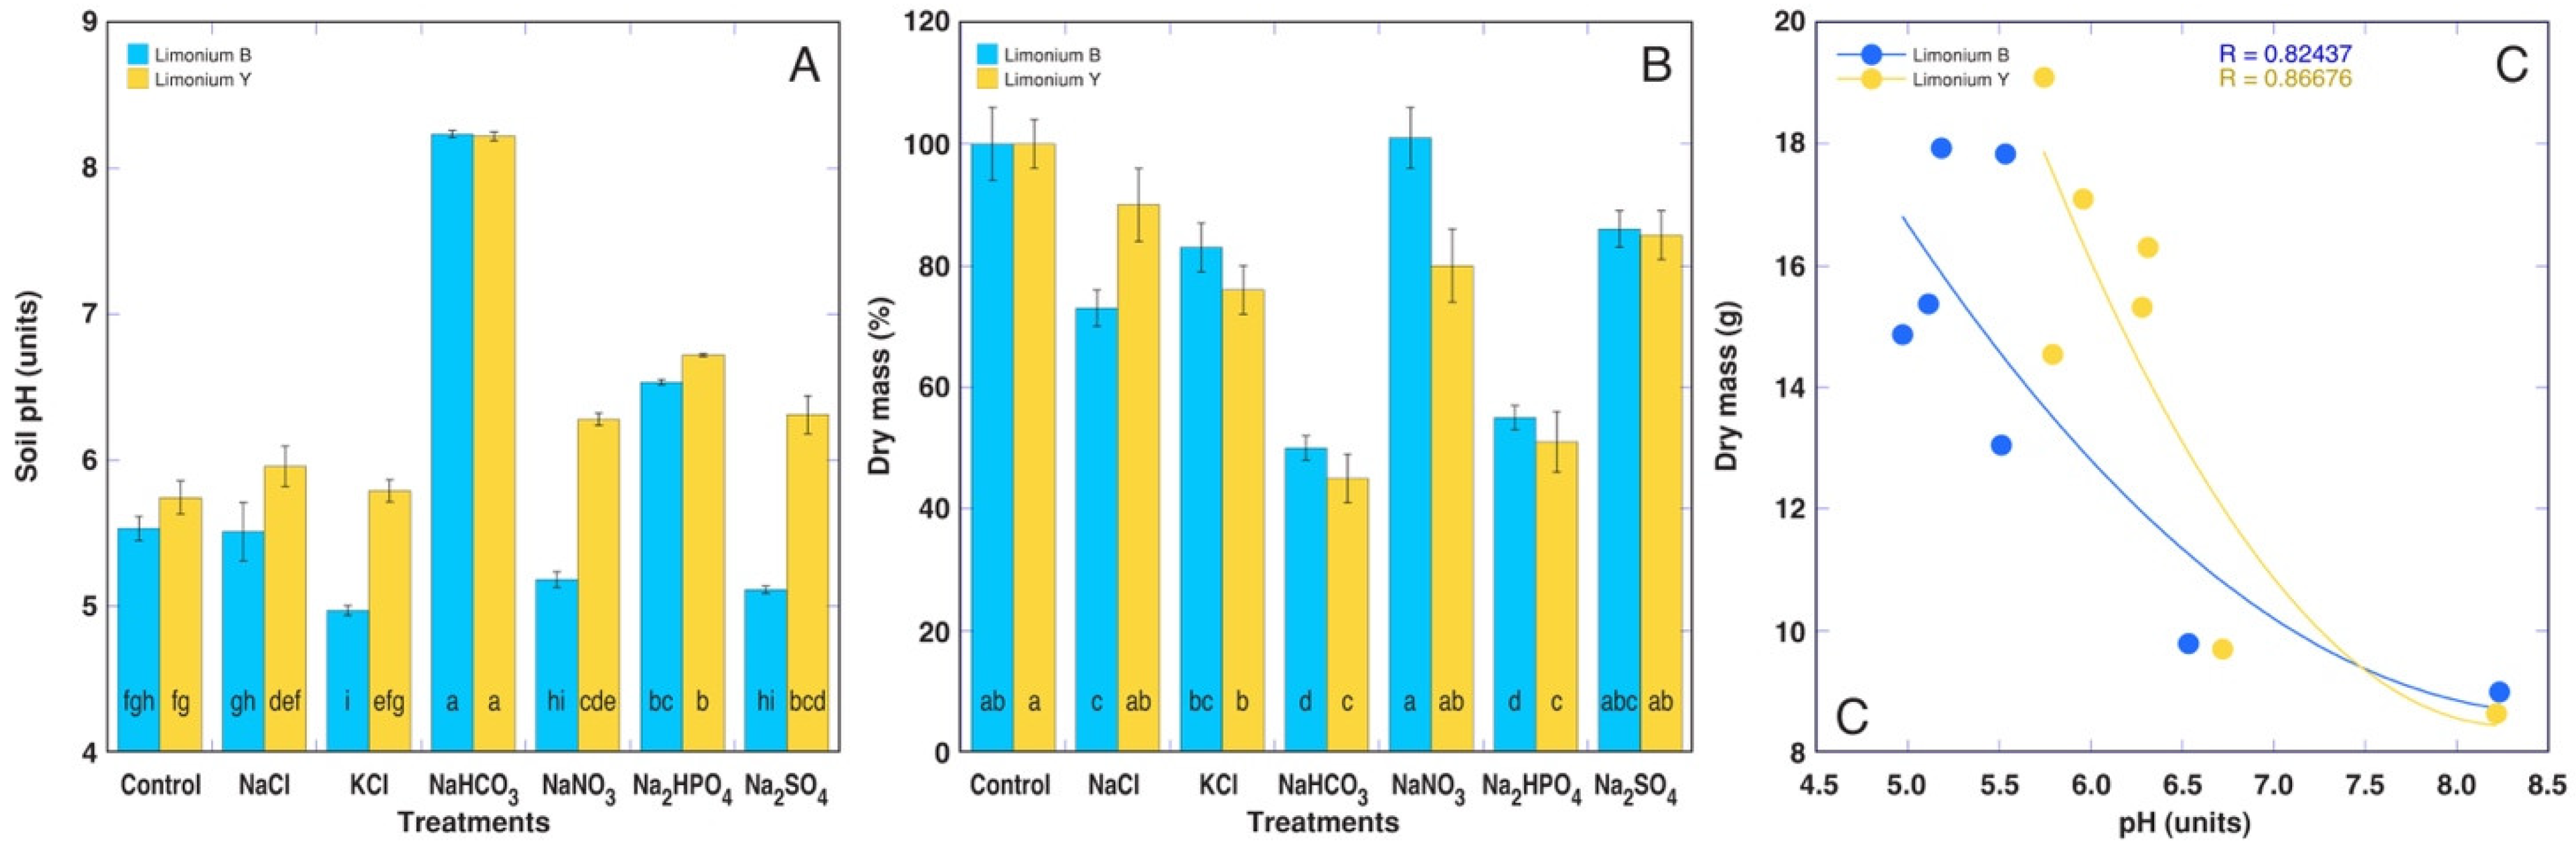
3.2. Experiment with Limonium sinuatum

The first treatment with acetate salts (NaOAc and KOAc; 50 mmol per L of substrate) resulted in a loss in turgor of the Limonium plants of both cultivars, followed by wilting and plant death within the three days. Plants treated with other salts did not show any immediate signs of toxicity. However, two weeks after the full treatment, the Limonium plants treated with NaHCO3 and Na2HPO4 began to show signs of toxicity that were visible as a cessation in growth in younger leaves followed by gradual drying in older leaves (Figures S3 and S4). Only the Limonium Y plants formed generative structures in the conditions of the experiment.
Treatment with NaHCO3 resulted in the highest increase in the soil pH for both Limonium cultivars, followed by treatment with Na2HPO4 (Figure 4A). Interestingly, differences in pH between the cultivars could be observed for treatments with KCl, NaNO3, and Na2SO4, with lower pH values for Limonium B plants. Treatment with NaCl for Limonium B, KCl for Limonium Y, and NaHCO3 and Na2HPO4 for both cultivars resulted in a significant decrease in dry biomass in comparison to the control plants (Figure 4B). Most importantly, the decrease in biomass was clearly related to the increase in the soil pH (Figure 4C). Among morphological parameters, the total plant biomass significantly decreased for both cultivars with NaHCO3 and Na2HPO4, with a significant decrease also in the treatment with NaCl for Limonium B and KCl for Limonium Y (Table 4). The decrease in total plant biomass for Limonium B (not forming generative structures) was associated with a decrease in both the leaf and root mass, but for the flowering Limonium Y plants, it was associated with a decrease in the root and flower mass. In addition, the root water content tended to decrease under the NaHCO3 and Na2HPO4 treatments, but the effect was significant only for the Limonium B plants.
An analysis of the photosynthesis-related parameters one week after the full treatment clearly revealed that the Limonium plants treated with NaHCO3 and Na2HPO4 were in a worse physiological state in comparison to those subjected to the other treatments (Figure 5). The chlorophyll a fluorescence parameter Performance Index Inst seemed to be an especially sensitive indicator of unfavorable conditions for the Limonium B plants (Figure 5B).
Distinct differences in the nature of ion accumulation could be observed between the two Limonium cultivars (Table S2). A pronounced gradient in the ion accumulation was evident for the Limonium B plants, with the EC and Na+ and Na+ + K+ concentrations decreasing in the order of dry leaves > large leaves > middle leaves > new leaves > roots. However, this was not so pronounced for the Limonium Y plants. For the flowering Limonium Y plants, the ion accumulation capacity in flower stalks and flowers was similar to that in new leaves. Among the different salts, treatment with KCl resulted in the highest levels of EC and Na+ + K+ concentration in leaves, but the lowest was in the NaHCO3 and Na2HPO4 treatments. Treatment with these two salts also resulted in the lowest Na+ accumulation capacity.
According to the results of the multivariate analysis, treatment with NaHCO3 and Na2HPO4 had a similar effect on plant growth and ion accumulation for both the Limonium cultivars (Figure 6). In addition, the NaCl and KCl treatments resulted in similar effects for the Limonium B plants, but the effects of the Na2SO4 treatment were the most similar to those on the control plants (Figure 6A). For the Limonium Y plants, a certain similarity was observed between treatments with NaNO3 and Na2SO4.

3.3. Experiment with Lobularia maritima

The Lobularia plants showed no visible morphological differences after treatment with different salts except that flowering was accelerated in the plants treated with NaNO3 (Figure S5). The dry biomass of vegetative plant parts was not significantly affected by any of the treatments, while the root mass tended to increase in saline conditions (Table 5). However, the dry mass of flowers significantly decreased in all treatments in comparison to that in the control plants, while the total biomass did not change significantly. Also, the leaf water content was not affected. As a result, the relative contribution of the root mass increased, but that of generative structures decreased in the Lobularia plants under salinity (Figure 7).
An ability to accumulate ions was most pronounced in the plants that had been treated with NaCl, and it noticeably decreased in the order of NaNO3 > Na2SO4 > NaHCO3 (Table S3). In general, the Na+ accumulation was higher in leaves than in stems, and it was low in roots. However, the K+ concentration significantly decreased in plant leaves in all salinity treatments, but the effect in other plant parts was variable.
The multivariate analysis revealed that each anion had quite a different effect, but some similarity was observable between plants treated with NaHCO3 and Na2SO4 and those treated with NaCl and NaNO3 (Figure 8).

3.4. Experiment with Plantago maritima and Tripolium pannonicum

Both the Plantago and Tripolium plants were able to withstand treatment with NaOAc, but some signs of turgor loss were visible after the first treatment. Morphological differences between the Plantago plants were not observed depending on the type of salt (Figure S6), but the Tripolium plants treated with NaOAc clearly showed reduced growth and development (Figure S7). Measurements of the pH in the substrate after plant cultivation clearly showed that treatment with NaOAc resulted in an increase in pH similar to that caused by NaHCO3 treatment for both Plantago and Tripolium (Figure 9A). However, for the Plantago plants, substrate acidification was evident in the case of the NaCl and NaNO3 treatments. A significantly negative effect of the NaOAc treatment on plant growth and development was evident for both the Plantago and Tripolium plants at the levels of leaf formation (Figure 9B), dry mass of leaves (Figure 9C), and dry mass of roots (Figure 9D). Treatment with other salts had no negative effect on Tripolium plants, and treatment with NaNO3 even resulted in a significantly increased number of leaves (Figure 9B). In contrast, the growth and development of the Plantago plants also was significantly negatively affected by treatment with NaCl and NaHCO3, but treatment with NaNO3 decreased only the leaf mass. The leaf water content was relatively little affected for both species, with NaOAc treatment resulting in a significant decrease (Figure 9E), but the root water content was negatively affected by NaOAc and NaHCO3 for the Plantago plants and by all treatments for the Tripolium plants (Figure 9F). Moreover, treatment with NaNO3 resulted in increased root water content for the Tripolium plants.
The capacity of ion accumulation had a tendency to decrease from older to younger leaves, with the lowest level in roots (Table S4). The EC in plant parts was relatively little affected by salinity for the Plantago plants. In old leaves, the EC significantly increased only for plants treated with NaCl and NaNO3, in middle leaves treated with NaOAc and NaNO3, and in new leaves treated with NaNO3. The Na+ concentration increased significantly in all parts of the Plantago plants for all treatments, but the K+ concentration significantly decreased. In the Tripolium plants, the salinity treatments resulted in a significant increase in EC values in all plant parts except all leaves in the case of NaHCO3 treatment and new leaves of the NaOAc- and NaHCO3-treated plants. The K+ concentration in Tripolium changed less in comparison to that in Plantago plants, with the only significantly negative effect in old leaves of NaHCO3-treated plants.
Overall, treatment with salts containing different anions resulted in quite different effects on Plantago and Tripolium plant growth and ion accumulation, as shown by the results of the multivariate analysis (Figure 10). The closest similarity was observed between the effects of NaCl and NaNO3 on Plantago as well as between the effects of NaHCO3 and NaNO3 on Tripolium plants.

4. Discussion

4.1. General Aspects

Seawater-affected soils mostly contain Na+ and Cl as the major contributors to salinity. In addition to Na+, Ca2+, and Mg2+, different inland saline lakes can be dominated by either Cl or HCO3 and CO32−, but SO42− also can be present at a high concentration [46]. HCO3 and CO32− are the main unfavorable factors in alkaline saline soils and alkaline saline-sodic soils together with Na+ [45]. SO42− can be a dominant anion in neutral saline-sodic soils together with Cl [47]. Typical neutral salts in scientific studies are usually represented by NaCl and Na2SO4, and typical alkaline salts are usually represented by NaHCO3 and Na2CO3 [48].
The salt concentrations used in the experiments were based on knowledge of the potential salt tolerance of the particular species and were chosen to be likely to cause relatively moderate growth inhibition. For Cochlearia, a 200 mmol L−1 dose for treatments was chosen because at this concentration, both NaCl and KCl resulted in significant growth reduction in the previous study [41]. The Plantago plants showed a higher salinity tolerance; therefore, a higher salt concentration was chosen for treatments.
So far, no comparative study has been performed to evaluate the effects of a number of different anion components in salinity responses of plants except for four Rumex species [23]. Previous plant studies have focused mostly on differences in pH as a result of the application of alkaline and neutral salts [14,17,49]. An increased soil pH can interfere with the uptake of several essential elements and thus change the ion balance in the plant [14]. However, a recent study of saline lake bacteria revealed that mainly the anion type instead of the pH affects the growth and survival of microorganisms [50]. In particular, it was established that sodium carbonate represented the strongest selective force, but a majority of the bacterial strains were able to grow in the presence of sodium sulfate [50]. In addition, plants can actively change the substrate pH through release of H+ or OH in the rhizosphere [51]. In the present study, both acidification (as for the Limonium B (Figure 4A) and Plantago (Figure 9A) plants) and alkalinization (as for the Cochlearia plants (Figure 1B)) were evident.
Different salts can affect not only the pH level of the soil but also lead to a different electrical conductivity of the soil even at similar concentrations because various anions have different abilities to transfer electrical current. The soil EC was measured only in the experiment with Cochlearia plants, and it was evident that the highest values immediately after the full treatment were seen for soils treated with NaCl, KCl, and KNO3 followed by those treated with NaNO3, Na2SO4, and K2SO4 (Figure 1A). The EC levels in the soil treated with carbonates, bicarbonates, and hydrogen orthophosphates were the lowest. The decrease in EC during plant cultivation indicated the uptake of both mineral nutrients and added salt ions, roughly corresponding to the plant’s ability in soil desalinization.

4.2. Salinity Tolerance as Affected by Anion Type

The present study aimed to determine if treatment of several halophytes with salts formed by different anions results in anion-type- and genotype-dependent responses at the levels of growth and ion accumulation. It was proposed that differences in plant responses to salts containing different anions are associated with the distinctive metabolic fates of these anions in plants [23].
Since salt tolerance is typically studied using NaCl, most studies of salinity effects also should be related to those of chloride, but usually all effects are attributed only to sodium. In reality, it can be proposed that both Na+ and Cl contribute to the negative effects of salinity in glycophyte species [52,53], but the situation can differ for halophytes. Thus, species of the genus Beta have been shown to be exceptionally tolerant to Cl [54].
In the present study, acetate salts appeared to be the most toxic, with only the Plantago and Tripolium plants being able to withstand full treatment. Even in this case, NaOAc treatment resulted in the greatest negative impact on plant growth. Treatment with exogenous acetate or manipulation of increased endogenous levels of acetate [55,56,57] both led to plant growth inhibition. An early study of detached tobacco leaves showed that acetate taken up in leaf tissues was first transformed into water soluble substances and later respired as CO2 [58]. Toxicity symptoms of acetate included a loss in turgor starting from the leaf tips. Adding an acetate solution to soil had a similar effect in the present experiment.
Acetate generation in tissues is a component of normal plant metabolism, but acetate homeostasis is being tightly controlled during undisturbed growth [57]. Endogenous acetate in plants is mostly in the form of acetyl-CoA generated by ATP-citrate lyase in cytosol, fatty acid β-oxidation in peroxisomes, the pyruvate dehydrogenase complex in mitochondria, or acetyl-CoA synthetase in plastids. Accumulation of acetate at harmful levels could occur in plant root tissues in flooded soil from acetaldehyde through ethanol oxidation or from decarboxylation of pyruvate [57]. Consequently, soil waterlogging with seawater could result in interaction between increased Na+ and acetate. A recent analysis indicated that long-distance ethanol and acetate transport in plants is an important component of adaptation to flooding and drought, involving both reprograming of transcription as well as acetate fermentation [59].
Alkaline salts have been long assumed to be more toxic than neutral salts [48]. Of the all tested plants, only both Limonium cultivars were more susceptible to treatment with alkaline salts in comparison to that with neutral salts, showing a tight relationship between the increase in substrate pH and the decrease in plant biomass (Figure 4C). Several cases have been described in the literature in which alkaline salts had had distinctly more negative effects on plants than neutral salts. In early field studies of wheat plants, it was shown that Na+ in a form of carbonate and bicarbonate is four times more toxic than NaCl and eight times more toxic than Na2SO4 [60]. It was also established that carbonates and bicarbonates in soil are mutually interchangeable. The effects of the salt concentration gradient (performed as treatment with NaCl + Na2SO4) and alkali stress (performed as treatment with NaHCO3 + Na2CO3) was compared for soil-cultivated Triticum aestivum seedlings [14]. The relative growth rate and physiological parameters decreased more under alkali stress when compared to an identical salinity level of neutral salts.
Sometimes, not single salts but a salt mixture of different neutral (NaCl and Na2SO4) or alkaline (NaHCO3 and Na2CO3) salts has been used, as in a study of glycophyte Zea mays plants in sand culture [17]. Both the shoot and root growth in the plants as well as the photosynthesis-related parameters were suppressed more by alkaline salts in comparison to neutral salts at a 100 mM salinity. Similar results were obtained even when using the halophyte species Chloris virgata [47]. As in other studies, a more negative effect of alkaline salts was associated with an inhibition in Na+ exclusion by the lack of protons, leading to excessive Na+ accumulation [14,17]. The responses of the halophytes Suaeda glauca and Suaeda salsa cultivated in conditions of hydroponics to NaCl and Na2CO3 were compared [18]. Both species tolerated 400 mM of NaCl without any growth reduction, but the biomass accumulation already was significantly suppressed at 28 mM of Na2CO3. The shoot K+ concentration was significantly decreased by both treatments (even at low salinity) in both species.
Another approach was used in a study in which sugar beet plants cultivated in a soil-like substrate in the presence of 50 mM of Na+ were subjected to different substrate pHs (5.0, 7.5, and 9.5) [61]. Plant growth and physiological indices were optimal at pH 9.5 and decreased with decreasing pH in the substrate. For example, the plant biomass decreased by 43% at pH 7.5 and further by 15% at pH 5.0 in comparison to plants cultivated at pH 9.5. Together with the present results, these examples contradict the accepted setting that “alkalinity” is more harmful than “salinity” and show that a high soil pH alone cannot explain the general toxicity of alkaline salts, at least not for all plant species. It appears that alkalinity alone cannot explain the more negative effect of carbonates and bicarbonates on the growth in some plant species.
The effects of carbonate and bicarbonate salts can usually be identical, as the carbonate–bicarbonate equilibrium in aqueous media highly depends on pH [62]. This was supported by the results of the present study for Cochlearia plants (Figure 3) and in a study of Ranunculus sceleratus [63]. Endogenous bicarbonate in plant tissues is formed by carbonic anhydrases and is involved in carboxylation reactions (either acetyl-CoA to malonyl-CoA or phosphoenolpyruvate to oxalacetate) [64]. There are no detailed studies on other putative toxicity mechanisms of carbonate/bicarbonate in plants besides alkalinity, but it can be speculated that a high tissue concentration of cytoplasmic bicarbonate can act as a signal for oversaturation with reduced carbon products in further progression to stomatal closure and an inhibition in photosynthesis [65].
The growth in the halophyte Prosopis stromubulifera in conditions of hydroponics was compared under NaCl and Na2SO4 treatments, and a negative effect on growth was more pronounced under the sulfate treatment [66]. These differences were not due to differences in the Na+ and K+ concentrations [67]. In addition, the growth in the halophyte Halostachys caspica seedlings was more negatively affected by Na2SO4 than by NaCl [68] Also, it was suggested that differences in the Na+ accumulation in the glycophyte Brassica rapa could not explain differences in toxicity between chlorides and sulfates [69]. Earlier studies have shown that products of sulfate reduction or even sulfate itself can be toxic to plants [70]. Apart from purely salinity studies, the effects of the cation and anion type on growth and the cation–anion balance in Hordeum vulgare (glycophyte) and Kochia scroparia (halophyte) in sand culture has been studied [71]. The effects of a chloride salt system (NaCl + CaCl2) and sulfate salt system (Na2SO4 + CaSO4) were compared. Sulfates decreased the K. scroparia growth by 29% and that of H. vulgare by 78%, but chlorides decreased the K. scroparia growth by 38% and that of H. vulgare by 83%.
As nitrate is the major source of nitrogen for plants, it seems to be logical to assume that a high nitrate availability in the form of sodium or potassium salts will have a beneficial effect on plant growth and physiological status. A positive role of exogenous nitrate in plant salinity tolerance has been relatively frequently reported. For hydroponically cultivated halophyte Suaeda physophora plants treated with NaCl, the addition of Ca(NO3)2 improved their salinity tolerance [72]. As the salinity treatment contained both Na and Cl, it is possible that the presence of additional NO3 was necessary to counteract the negative impact of Cl on the overall nitrogen uptake. It would be a different situation if NaNO3 was used for the salt treatment, similar to the present study. Previously, NaNO3-dependent stimulation of plant growth has been described for several halophytic species, such as Salicornia europaea [73] and Sesuvium portulacastrum [74], as well as several Rumex species [23].
When the environmental condition or the metabolic situation is unfavorable to photosynthesis-dependent nitrate assimilation to ammonium, this leads to excessive nitrate accumulation in plant tissues [75]. Therefore, it can be proposed that in conditions of luxury availability of soil nitrate, this anion is accumulated in leaf tissues, further contributing to an increase in the EC level. Nitrate stored in leaf vacuoles is considered to be a buffer pool for maintaining plant growth in a situation of soil nitrogen deficiency and also acts as an osmoticum [76,77].
Phosphate salts are widely used as fertilizers due the fact that H2PO4 is the predominant form for phosphorus uptake in plants [78]. Excessive phosphate levels were shown to inhibit plant growth and interfere with mineral nutrition [79]. Both Na2HPO4 and K2HPO4 are basic salts; therefore, it can be expected that treatment with these salts will lead to effects similar to those with carbonate/bicarbonate treatment. A high similarity in the growth and ion accumulation effects was indeed seen between treatment with NaHCO3 and Na2HPO4 in the Limonium plants that negatively responded to a decrease in the soil pH (Figure 6). However, in the Cochlearia plants that did not exhibit negative consequences of increased soil pH on growth, plants treated with Na2HPO4 and K2HPO4 were most similar to the control plants (Figure 3).

4.3. Ion Accumulation Capacity

Most halophyte species accumulate more potassium in comparison to sodium and can be called potassiophilic in contrast to only a limited number of species being sodiophilic because of preferential accumulation of sodium [80]. This means that high Na+ accumulation is not absolutely necessary for a plant to be tolerant to salinity. However, it seems that salt-accumulating halophytes can generally be characterized as species able to tolerate a high electrolyte concentration in their tissues [25]. Therefore, measurement of EC in plant extracts can be used as a means for assessing the total ion accumulation ability in plants as a result of growth in saline soil. Experimental evidence confirms that the major electrolytically active ions in plants growing in saline soils are Na+, K+, and Cl [41].
In the Cochlearia plants, the EC tended to be higher in the plant material obtained from plants treated with potassium salts compared to plants treated with sodium salts, indicating that the plants were better able to accumulate K+ than Na+ at an identical substrate concentration of these metals (Table S1). However, the summed concentration of Na+ + K+ in plant tissues usually was similar in the Na- and K-treated plants. In both Limonium cultivars, the EC was significantly higher in plants treated with KCl in comparison to that in NaCl-treated plants, and the summed concentration of Na+ + K+ was also higher in the KCl-treated plants (Table S2). In general, the type of anion significantly affected the tissue EC in the model plants. Consequently, the EC in plant tissues was affected by the electrolytical activity of a particular anion, especially if the particular form was stored instead of being metabolized.
In general, in treatments with alkaline salts (carbonates and bicarbonates), both the Na+ and K+ (Cochlearia) and Na+ (Limonium, Lobularia, Plantago, and Tripolium) accumulation potential was lower in comparison to the plants treated with chlorides and nitrates. In the Plantago plants treated with another alkaline salt (NaOAc), the Na+ accumulation was significantly lower than in other treatments, but this was not the case for the Tripolium plants. Therefore, it is not possible to generalize that the Na+ accumulation potential is always lower in the case of treatment with alkaline salts in comparison to that with neutral salts.

4.4. Genotype-Related Differences

Pronounced genotype-related differences in the tolerance of the plants used in the study to different anions could be observed. Thus, all studied species were extremely sensitive to acetate treatment except the Plantago and Tripolium plants, which were moderately tolerant to this anion. Few results can be found in the literature on the sensitivity of different plant species to NaOAc. Plants of the halophytic species Sesuvium portulacastrum in hydroponic conditions could tolerate 200 mM of NaOAc or KOAc when the pH was adjusted to 7.0, but there was pronounced growth inhibition [74]. Additional evidence on the existence of acetate-tolerant plants can be obtained from studies using heavy metals. Thus, Pb acetate, as one of the three soluble salts of Pb, is used relatively frequently to assess Pb tolerance and metal accumulation potential. There is reason to believe that, especially at high concentrations of Pb acetate, the acetate ion may play a significant role in the adverse effects of the salt on plant growth. However, when pretreated with a relatively low concentration of Pb acetate, several halophyte species have shown a high tolerance to the treatment, including Ranunculus sceleratus [63] and Rumex hydrolapathum [81].
Sensitivity to carbonate/bicarbonate also showed a high genotype specificity possibly related to the alkalinity of these salts. Both cultivars of Limonium were sensitive to alkaline salts, but Cochlearia, Lobularia, and Tripolium were highly tolerant to all salts regardless of their pH except acetate. Another coastal halophyte species that is sensitive to carbonate/bicarbonate is Ranunculus sceleratus [63], and many more examples can be found among different halophyte species. Several nitrophilic coastal species are the least sensitive to sodium in the form of nitrate [23,63], but the Plantago plants in the present study were equally sensitive to NaCl, NaNO3, and NaHCO3.
All model species used in the present study represented typical salt accumulators, with shoot Na+ concentrations exceeding those in roots. The highest accumulation capacity of Na+ in leaves was for Cochlearia (155 g kg−1), followed by Limonium and Lobularia (70 g kg−1) and Plantago and Tripolium (58 g kg−1). Thus, in the moderate salinity conditions used in the present study (200–300 mmol L−1 substrate), the Na+ accumulation potential for all species significantly exceeded the threshold for defining hyperaccumulation (18–30 g kg−1) [25]. In previous studies, generally variable results were achieved with respect to the maximum Na+ accumulation capacity in these species. In hydroponics, Cochearia officinalis accumulated 131 g kg−1 Na+ in leaves, which is in a range reported in the present study [28]. Substrate-cultivated Limonium sinuatum accumulated 56 g kg−1 Na+ in leaves [32] but only 8 g kg−1 in leaves in another study [82]. In contrast to the present results, in conditions of hydroponics, Lobularia maritima plants accumulated more Na+ in roots (150 g kg−1) than in leaves (100 g kg−1) [34]. Plantago maritima accumulated 85 g kg−1 in shoots and 46 g kg−1 in roots in hydroponic conditions [83] and 53 g kg−1 in shoots in an inert substrate [40]. When cultivated in vermiculite, Tripolium pannonicum (syn. Aster tripolium) plants accumulated 51 g kg−1 Na in leaves [84], 12 g kg−1 in hydroponics [85], 110 g kg−1 Na in leaves in soil [86], 65 g kg−1 in leaves, 60 g kg−1 in roots in soil [87], and 64 g kg−1 in leaves in soil [88]. In addition to variation in experimental conditions, these differences can be also related to the use of various ecotypes of the species, as ecotype-related differences in salinity tolerance and ion accumulation have been established for several halophyte species, such as Armeria maritima [89] and Trifolium fragiferum [90].
With respect to the general ability to accumulate electrolytically active substances (as indicated by leaf tissue EC levels), Cochlearia, Limonium, and Lobularia had similarly high levels (460–467 mS m−1 in leaf petioles and 358–390 mS m−1 in leaf blades for Cochlearia, 483 mS m−1 for Limonium, and 451 mS m−1 for Lobularia), but these were lower in Plantago (253 mS m−1) and even less in the Tripolium (150–160 mS m−1) plants. For comparison, the middle 50% values for EC in the leaves of coastal plant species natively growing in salt-affected habitats were in a range of 85–150 mS m−1 [25]. Consequently, all tested plants can be characterized as highly electrolythophytic species that are able to tolerate high electrolyte levels, presumably related to the efficient compartmentalization capacity of ions in vacuoles of cells in photosynthetic tissues.
It seems that an ability to regulate the total tissue EC in conditions of increased soil salinity via changes in either the Na+ or K+ concentration is a genotype-specific feature of halophytic plants, as shown previously [25]. Changes in the K+ concentration in plant tissues under salinity is an important physiological aspect that is often related to salinity tolerance. For the majority of glycophyte species, inhibiting growth by increasing the NaCl salinity has been associated with the suppression of K+ absorption by excessive Na+ accumulation [91]. However, in salt-accumulating halophytes, Na+ can contribute to typical K+ functions; namely, ensuring the osmotic balance and ionic strength.
Many salt-tolerant species indeed show a decrease in K+ concentration with increased Na+ concentration in tissues due to raising the substrate’s NaCl concentration even if there are no negative effects of the treatment on plant growth [41,73,74,92]. In the present study, however, both genotype- and organ-specific effects of sodium salts on the K+ concentration were evident. Thus, K+ decreased in leaf petioles of the Cochlearia plants treated with NaCl but did not change in other treatments (Table S1). However, in leaf blades, K+ tended to decrease in plants treated with Na2CO3 and NaHCO3 and did not change in other treatments. The K+ concentration showed relatively little reactivity to the salinity treatments in the Limonium plants (Table S2), but it decreased in leaves of the Lobularia plants (Table S3). For Plantago, K+ was significantly decreased in all plant parts by salt treatments, but little effect was evident for Tripolium, in which only NaHCO3 treatment resulted in a significant decrease in K+ (Table 4).

5. Conclusions

The results of the present study have established a rationale for revising several dogmas regarding salt tolerance in halophytes. First, it is becoming clear that sodium and potassium are equally “toxic” at high concentrations for relatively salt-tolerant species. Second, the negative effect of salts on these species depends not so much on the type of cation (sodium or potassium) but rather on the type of anion. Third, as many halophytes respond in the same way to chloride and carbonate salinity, a more deleterious influence of alkaline salts on plants is not only due to the effect of a high pH. Fourth, changes in tissue K+ levels after treatment with sodium salts are both genotype- and organ-specific and cannot be used as a general indicator of salinity tolerance. The obtained results open up possibilities for further studies of the mechanisms of the observed differences in salinity responses to different anions. In addition, the results can help to choose plant species that are suitable for specific salinity conditions or for cultivation with the use of saline waters for fertilization.

Supplementary Materials

The following supporting information can be downloaded at: https://www.mdpi.com/article/10.3390/ijpb14040083/s1, Figure S1: Typical Cochlearia officinalis plants 3 weeks after the full treatment; Figure S2: Typical Cochlearia officinalis plants 3 weeks after the full treatment; Figure S3: Typical Limonium sinuatum Blue plants 4 weeks after the full treatment; Figure S4: Typical Limonium sinuatum Yellow plants 4 weeks after the full treatment; Figure S5: Typical Lobularia maritima plants 2 weeks after the full treatment; Figure S6: Typical Plantago maritima plants 3 weeks after the full treatment; Figure S7: Typical Tripolium pannonicum plants 3 weeks after the full treatment; Table S1: Effect of different salts on electrical conductivity, Na+ concentration, K+ concentration, and Na+ + K+ concentration in different parts of Cochlearia officinalis plants; Table S2: Effect of different salts on electrical conductivity, Na+ concentration, and K+ concentration in different parts of Limonium sinuatum plants; Table S3: Effect of different salts on electrical conductivity, Na+ concentration, K+ concentration, and Na+ + K+ concentration in different parts of Lobularia maritima plants; Table S4: Effect of different salts on electrical conductivity, Na+ concentration, K+ concentration, and Na+ + K+ concentration in different parts of Plantago maritima and Tripolium pannonicum plants.

Author Contributions

G.I. proposed the research; A.J., J.K., M.R., U.A.-O. and G.I. performed the experiments and analyzed the data; A.J., J.K. and G.I. drafted the manuscript; U.A.-O. revised the manuscript. All authors have read and agreed to the published version of the manuscript.

Funding

This study was supported by the University of Latvia project “Functional diversity of ecosystems and their contribution to ecosystem services II”. The funding source had no involvement in any phase of the study.

Institutional Review Board Statement

Not applicable.

Informed Consent Statement

Not applicable.

Data Availability Statement

All data reported here are available from the authors upon request.

Acknowledgments

The reported results are part of the bachelor’s thesis of Jekaterina Kuļika and the master’s thesis of Māris Romanovs at the University of Latvia.

Conflicts of Interest

The authors declare no conflict of interest. The funders had no role in the design of the study; in the collection, analyses, or interpretation of data; in the writing of the manuscript; or in the decision to publish the results.

References

  1. Ondrasek, G.; Rengel, Z. Environmental salinization processes: Detection, implications & solutions. Sci. Total Environ. 2021, 754, 142432. [Google Scholar]
  2. Uri, N. Cropland salinization and associated hydrology: Trends, processes and examples. Water 2018, 10, 1030. [Google Scholar] [CrossRef]
  3. Hammer, U.T. The saline lakes of Saskatchewan. III. Chemical characterization. Hydrobiology 1978, 63, 311–335. [Google Scholar] [CrossRef]
  4. Shahid, M.A.; Sarkhosh, A.; Khan, N.; Balal, R.M.; Ali, S.; Rossi, L.; Gómez, C.; Mattson, N.; Nasim, W.; Garcia-Sanchez, F. Insights into the physiological and biochemical impacts of salt stress on plant growth and development. Agronomy 2020, 10, 938. [Google Scholar] [CrossRef]
  5. Hao, S.; Wang, Y.; Yan, Y.; Liu, Y.; Wang, J.; Chen, S. A review on plant responses to salt stress and their mechanisms of salt resistance. Horticulturae 2021, 7, 132. [Google Scholar] [CrossRef]
  6. Balasubramaniam, T.; Shen, G.; Esmaeili, N.; Zhang, H. Plants’ response mechanisms to salinity stress. Plants 2023, 12, 2253. [Google Scholar] [CrossRef]
  7. Carden, D.E.; Walker, D.J.; Flowers, T.J.; Miller, A.J. Single-cell measurements of the contribution of cytosolic Na+ and K+ to salt tolerance. Plant Physiol. 2003, 131, 676–683. [Google Scholar] [CrossRef]
  8. Flowers, T.J.; Läuchli, A. Sodium versus potassium: Substitution and compartmentation. In Inorganic Plant Nutrition; Läuchli, A., Bieleski, R.L., Eds.; Springer: Berlin/Heidelberg, Germany, 1983; Volume 15B, pp. 651–681. [Google Scholar]
  9. Subbarao, G.V.; Ito, O.; Berry, W.L.; Wheeler, R.M. Sodium: A functional plant nutrient. Crit. Rev. Plant Sci. 2003, 22, 391–416. [Google Scholar]
  10. Rodriguez-Navarro, A. High-affinity potassium and sodium transport systems in plants. J. Exp. Bot. 2006, 57, 1149–1160. [Google Scholar] [CrossRef]
  11. Colmenero-Flores, J.M.; Franco-Navarro, J.D.; Cubero-Font, P.; Peinado-Torrubia, P.; Rosales, M.A. Chloride as a beneficial macronutrient in higher plants: New roles and regulation. Int. J. Mol. Sci. 2019, 20, 4686. [Google Scholar] [CrossRef]
  12. Bazihizina, N.; Colmer, T.D.; Cuin, T.A.; Mancuso, S.; Shabala, S. Friend or foe? Chloride patterning in halophytes. Trends Plant Sci. 2018, 24, 142–151. [Google Scholar] [CrossRef]
  13. Chen, S.; Xing, J.; Lan, H. Comparative effects of neutral salt and alkaline salt stress on seed germination, early seedling growth and physiological response of a halophyte species Chenopodium glaucum. Afr. J. Biotechnol. 2012, 11, 9572–9581. [Google Scholar]
  14. Yang, C.W.; Wang, P.; Li, C.Y.; Shi, D.C.; Wang, D.L. Comparison of effects of salt and alkali stresses on the growth and photosynthesis of wheat. Photosynthetica 2008, 46, 107–114. [Google Scholar] [CrossRef]
  15. Guo, R.; Shi, L.X.; Ding, X.M.; Hu, Y.; Tian, S.Y.; Yan, D.F.; Shao, S.; Gao, Y.; Liu, R.; Yang, Y.F. Effects of saline and alkaline stress on germination, seedling growth, and ion balance in wheat. Agron. J. 2010, 102, 1252–1260. [Google Scholar] [CrossRef]
  16. Wang, H.; Wu, Z.; Chen, Y.; Yang, C.; Shi, D. Effects of salt and alkali stresses on growth and ion balance in rice (Oryza sativa L.). Plant Soil Environ. 2011, 57, 286–294. [Google Scholar] [CrossRef]
  17. Guo, R.; Shi, L.X.; Yan, C.; Zhong, X.; Gu, F.X.; Liu, Q.; Xa, X.; Li, H. Ionomic and metabolic responses to neutral salt or alkaline salt stresses in maize (Zea mays L.) seedlings. BMC Plant Biol. 2017, 17, 41. [Google Scholar] [CrossRef]
  18. Li, J.; Hussain, T.; Feng, X.; Guo, K.; Chen, H.; Yang, C.; Liu, X. Comparative study on the resistance of Suaeda glauca and Suaeda salsa to drought, salt, and alkali stresses. Ecol. Eng. 2019, 140, 105593. [Google Scholar] [CrossRef]
  19. Crawford, N.M. Nitrate: Nutrient and signal for plant growth. Plant Cell 1995, 7, 859–868. [Google Scholar]
  20. Gazzarrini, S.; Lejay, L.; Gojon, A.; Ninnemann, O.; Frommer, W.B.; von Wiren, N. Three functional transporters for constitutive, diurnally regulated, and starvation-induced uptake of ammonium into Arabidopsis roots. Plant Cell 1999, 11, 937–948. [Google Scholar] [CrossRef]
  21. Raddatz, N.; de los Rios, L.M.; Lindahl, M.; Quintero, F.J.; Pardo, J.M. Coordinated transport of nitrate, potassium, and sodium. Front. Plant Sci. 2020, 11, 247. [Google Scholar] [CrossRef] [PubMed]
  22. Coskun, D.; Britto, D.T.; Kronzucker, H.J. The nitrogen-potassium intersection: Membranes, metabolism, and mechanism. Plant Cell Environ. 2017, 40, 2029–2041. [Google Scholar] [CrossRef] [PubMed]
  23. Landorfa-Svalbe, Z.; Andersone-Ozola, U.; Ievinsh, G. Type of anion largely determines salinity tolerance in four Rumex species. Plants 2023, 12, 92. [Google Scholar] [CrossRef] [PubMed]
  24. Flowers, T.J.; Colmer, T.D. Plant salt tolerance: Adaptations in halophytes. Ann. Bot. 2015, 115, 327–331. [Google Scholar] [CrossRef] [PubMed]
  25. Ievinsh, G.; Ieviņa, S.; Andersone-Ozola, U.; Samsone, I. Leaf sodium, potassium and electrolyte accumulation capacity of plant species from salt-affected coastal habitats of the Baltic Sea: Towards a definition of Na hyperaccumulation. Flora 2021, 274, 151748. [Google Scholar] [CrossRef]
  26. Pegtel, D.M. Effect of ploidy level on fruit morphology, seed germination and juvenile growth in scurvy grass (Cochlearia officinalis L. s.l., Brassicaceae). Plant Species Biol. 1999, 14, 201–215. [Google Scholar] [CrossRef]
  27. Lepping, O.; Daniels, F.J.A. Phytosociology of beach and salt marsh vegetation in Northern West Greenland. Polarforschung 2006, 76, 95–108. [Google Scholar]
  28. de Vos, A.C.; Broekman, R.; de Almeida Guerra, C.C.; van Rijsselberghe, M.; Rozema, J. Developing and testing new halophyte crops: A case study of salt tolerance of two species of the Brassicaceae, Diplotaxis tenuifolia and Cochlearia officinalis. Environ. Exp. Bot. 2013, 92, 154–164. [Google Scholar] [CrossRef]
  29. Le Saos, J. Effets du NaCl et du CaCl2 sur la croissance du Cochlearia anglica. Bull. Soc. Bot. France Act. Bot. 1978, 3–4, 53–59. [Google Scholar] [CrossRef]
  30. Malekmohammadi, M.; Akhani, H.; Borsch, T. Phylogenetic relationships of Limonium (Plumbaginaceae) inferred from multiple chloroplast and nuclear loci. Taxon 2017, 66, 1128–1146. [Google Scholar] [CrossRef]
  31. Koutroumpa, K.; Theodoridis, S.; Warren, B.H.; Jiménez, A.; Celep, F.; Doğan, M.; Romeiras, M.M.; Santos-Guerra, A.; Fernández-Palacios, J.M.; Caujapé-Castells, J.; et al. An expanded molecular phylogeny of Plumbaginaceae, with emphasis on Limonium (sea lavenders): Taxonomic implications and biogeographic considerations. Ecol. Evol. 2018, 8, 12397–12424. [Google Scholar] [CrossRef]
  32. Grieve, C.; Poss, J.A. Productivity and mineral nutrition of Limonium species irrigated with saline wastewaters. HortScience 2005, 40, 654–658. [Google Scholar] [CrossRef]
  33. Xu, X.; Zhou, Y.; Mi, P.; Wang, B.; Yuan, F. Salt-tolerance screening in Limonium sinuatum varieties with different flower colors. Sci. Rep. 2021, 11, 14562. [Google Scholar] [CrossRef] [PubMed]
  34. Popova, O.V.; Golldack, D. In the halotolerant Lobularia maritima (Brassicaceae) salt adaptation correlates with activation of the vacuolar H+-ATPase and the vacuolar Na+/H+ antiporter. J. Plant Physiol. 2007, 164, 1278–1288. [Google Scholar] [CrossRef] [PubMed]
  35. Popova, O.V.; Yang, O.; Dietz, K.-J.; Golldack, D. Differential transcript regulation in Arabidopsis thaliana and the halotolerant Lobularia maritima indicates genes with potential function in plant salt adaptation. Gene 2008, 423, 142–148. [Google Scholar] [CrossRef] [PubMed]
  36. Ben Hsouna, A.; Michalak, M.; Kukula-Koch, W.; Ben Saad, R.; ben Romdhane, W.; Zeljković, S.Ć.; Mnif, W. Evaluation of halophyte biopotential as an unused natural resource: The case of Lobularia maritima. Biomolecules 2022, 12, 1583. [Google Scholar] [CrossRef] [PubMed]
  37. Ben Hsouna, A.; Ghneim-Herrera, T.; Ben Romdhane, W.; Dabbous, A.; Ben Saad, R.; Brini, F.; Abdelly, C.; Ben Hamed, K. Early effects of salt stress on the physiological and oxidative status of the halophyte Lobularia maritima. Funct. Plant Biol. 2020, 47, 912–924. [Google Scholar] [CrossRef] [PubMed]
  38. Ben Saad, R.; Ben Romdhane, W.; Baazaoui, N.; Bouteraa, M.; Ben Hsouna, A.; Mishra, A.; Zelković, B.Ć. Assessment of the cadmium and copper phytoremediation potential of the Lobularia maritima thioredoxin 2 gene using genetically engineered tobacco. Agronomy 2023, 13, 399. [Google Scholar] [CrossRef]
  39. Wiszniewska, A.; Makowski, W. Assessment of shoot priming efficiency to counteract complex metal stress in halotolerant Lobularia maritima. Plants 2023, 12, 1440. [Google Scholar] [CrossRef]
  40. Sleimi, N.; Guerfali, S.; Bankaji, I. Biochemical indicators of salt stress in Plantago maritima: Implications for environmental stress assessment. Ecol. Indic. 2015, 48, 570–577. [Google Scholar] [CrossRef]
  41. Ievinsh, G.; Andersone-Ozola, U.; Jēkabsone, A. Similar responses of relatively salt tolerant plants to Na and K during chloride salinity: Comparison of growth, water content and ion accumulation. Life 2022, 12, 1577. [Google Scholar] [CrossRef]
  42. Andersone, U.; Samsone, I.; Ievinsh, G. Protection of photosynthesis in coastal marsh plants Aster tripolium and Hydrocotyle vulgaris in conditions of increased soil salinity. Environ. Exp. Biol. 2012, 10, 89–97. [Google Scholar]
  43. Ludwiczak, A.; Ciarkowska, A.; Dehnavi, A.R.; Cárdenas-Pérez, S.; Piernik, A. Growth stage-, organ- and time-dependent salt tolerance of halophyte Tripolium pannonicum (Jacq.) Dobrocz. Life 2023, 13, 462. [Google Scholar] [CrossRef] [PubMed]
  44. Luo, Q.; Yu, B.; Liu, Y. Differential sensitivity to chloride and sodium ions in seedlings of Glycine max and G. soja under NaCl stress. J. Plant Physiol. 2005, 162, 1003–1012. [Google Scholar] [CrossRef] [PubMed]
  45. Metsalu, T.; Vilo, J. ClustVis: A web tool for visualizing clustering of multivariate data using Principal Component Analysis and heatmap. Nucl. Acids Res. 2015, 43, W566–W570. [Google Scholar] [CrossRef]
  46. Boros, E.; Kolpakova, M. A review of the defining chemical properties of soda lakes and pans: An assessment on a large geographic scale of Eurasian inland saline surface waters. PLoS ONE 2018, 13, 0202205. [Google Scholar] [CrossRef] [PubMed]
  47. Pengasamy, P. Soil chemistry factors confounding crop salinity tolerance—A review. Agronomy 2016, 6, 53. [Google Scholar] [CrossRef]
  48. Fang, S.; Hou, X.; Liang, X. Response mechanisms of plants under saline-alkali stress. Front. Plant Sci. 2021, 12, 667458. [Google Scholar] [CrossRef]
  49. Yang, C.W.; Jianaer, A.; Li, C.Y.; Shi, D.C.; Wang, D.L. Comparison of the effects of salt-stress and alkali-stress on photosynthesis and energy storage of an alkali-resistant halophyte Chloris virgata. Photosynthetica 2008, 46, 273–278. [Google Scholar] [CrossRef]
  50. Csitári, B.; Bedics, A.; Felföldi, T.; Boros, E.; Nagy, H.; Máthé, I.; Szkely, A.J. Anion-type modulates the effect of salt stress on saline lake bacteria. Extremophiles 2022, 26, 12. [Google Scholar] [CrossRef]
  51. Faget, M.; Blossfeld, S.; von Gillhaussen, P.; Schurr, U.; Temperton, V.M. Disentangling who is who during rhizosphere acidification in root interactions: Combining fluorescence with optode techniques. Front. Plant Sci. 2013, 4, 392. [Google Scholar] [CrossRef]
  52. Martin, P.K.; Koebner, R.M.D. Sodium and chloride ions contribute synergistically to salt toxicity in wheat. Biol. Plant. 1995, 37, 265–271. [Google Scholar] [CrossRef]
  53. Tavakkoli, E.; Renagasamy, P.; McDonald, G.K. High concentrations of Na+ and Cl ions in soil have simultaneous detrimental effect on growth of faba bean under salinity stress. J. Exp. Bot. 2010, 61, 4449–4459. [Google Scholar] [CrossRef] [PubMed]
  54. Xu, G.; Magen, H.; Tarchitzky, J.; Kafkafi, U. Advances in chloride nutrition of plants. In Advances in Agronomy; Academic Press: Cambridge, MA, USA, 2000; Volume 68, pp. 97–150. [Google Scholar]
  55. Turner, J.E.; Greville, K.; Murphy, E.C.; Hooks, M.A. Characterization of Arabidopsis fluoroacetate-resistant mutants reveals the principal mechanism of acetate activation for entry into the glyoxylate cycle. J. Biol. Chem. 2005, 280, 2780–2787. [Google Scholar] [CrossRef]
  56. Lin, M.; Oliver, D.J. The role of acetyl-coenzyme A synthetase in Arabidopsis. Plant Physiol. 2008, 147, 1822–1829. [Google Scholar] [CrossRef] [PubMed]
  57. Fu, X.; Yang, H.; Pangestu, F.; Nikolau, B.J. Failure to maintain acetate homeostasis by acetate-activating enzymes impacts plant development. Plant Physiol. 2020, 182, 1256–1271. [Google Scholar] [CrossRef] [PubMed]
  58. Krotkov, G.; Barker, H.A. Utilization of acetate by tobacco leaves, as determined with C14. Amer. J. Bot. 1948, 35, 12–15. [Google Scholar] [CrossRef]
  59. Jardine, K.J.; McDowell, N. Fermentation-mediated growth, signaling, and defense in plants. New Phytol. 2023, 239, 839–851. [Google Scholar] [CrossRef]
  60. Headley, F.B.; Curtis, E.W.; Scofield, C.S. Effect on plant growth of sodium salts in the soil. J. Agric. Res. 1916, 6, 857–869. [Google Scholar]
  61. Geng, G.; Wang, G.; Stevanato, P.; Lv, C.; Wang, Q.; Yu, L.; Wang, Y. Physiological and proteomic analysis of different molecular mechanisms of sugar beet response to acidic and alkaline pH environment. Front. Plant Sci. 2021, 12, 682799. [Google Scholar] [CrossRef]
  62. Cole, J.J.; Prairie, Y.T. Dissolved CO2 in freshwater systems. In Encyclopedia of Inland Waters; Elsevier: Amsterdam, The Netherlands, 2009; pp. 30–34. [Google Scholar]
  63. Ievinsh, G.; Landorfa-Svalbe, Z.; Andersone-Ozola, U.; Karlsons, A.; Osvalde, A. Salinity and heavy metal tolerance, and phytoextraction potential of Ranunculus sceleratus plants from a sandy coastal beach. Life 2022, 12, 1959. [Google Scholar] [CrossRef]
  64. Poschenrieder, C.; Fernández, J.A.; Rubio, L.; Pérez, L.; Terés, J.; Barcélo, J. Transport and use of bicarbonate in plants: Current knowledge and challenges ahead. Int. J. Mol. Sci. 2018, 19, 1352. [Google Scholar] [CrossRef] [PubMed]
  65. Xue, S.; Hu, H.; Ries, A.; Merilo, E.; Kollist, H.; Schroeder, J.I. Central functions of bicarbonate in S-type anion channel activation and OST1 protein kinase in CO2 signal transduction guard cell. EMBO J. 2011, 30, 1645–1658. [Google Scholar] [CrossRef]
  66. Devinar, G.; Llanes, A.; Masciarelli, O.; Luna, V. Different relative humidity conditions combined with chloride and sulfate salinity treatments modify abscisic acid and salicylic acid levels in the halophyte Prosopis strombulifera. Plant Growth Reg. 2013, 70, 247–256. [Google Scholar] [CrossRef]
  67. Reginato, M.; Sosa, L.; Llanes, A.; Hampp, E.; Vettorazzi, N.; Reinoso, H.; Luna, V. Growth responses and ion accumulation in the halophytic legume Prosopis strombulifera are determined by Na2SO4 and NaCl. Plant Biol. 2014, 16, 97–106. [Google Scholar] [CrossRef]
  68. Assareh, M.H.; Rasouli, B.; Amiri, B. Effects of NaCl and Na2SO4 on germination and initial growth phase of Halostachys caspica. Desert 2010, 15, 119–125. [Google Scholar]
  69. Reich, M.; Aghajanzadeh, T.; Helm, J.; Parmar, S.; Hawkesford, M.J.; De Kok, L.J. Chloride and sulfate salinity differently affect biomass, mineral nutrient composition and expression of sulfate transport and assimilation genes in Brassica rapa. Plant Soil 2017, 411, 319–332. [Google Scholar] [CrossRef] [PubMed]
  70. Rennenberg, H. The fate of excess sulfur in higher plants. Annu. Rev. Plant Physiol. 1984, 35, 121–153. [Google Scholar] [CrossRef]
  71. Curtin, D.; Wen, G. Plant cation-anion balance as affected by the ionic composition of the growing medium. Plant Soil 2004, 267, 109–115. [Google Scholar] [CrossRef]
  72. Yuan, J.-F.; Feng, G.; Ma, H.-Y.; Tian, C.-Y. Effect of nitrate on root development and nitrogen uptake of Suaeda physophora under NaCl salinity. Pedosphere 2010, 20, 536–544. [Google Scholar] [CrossRef]
  73. Ushakova, S.A.; Kovaleva, N.P.; Tikhomirova, N.A.; Gribovskaya, I.V.; Kolmakova, A.A. Effect of photosynthetically active radiation, salinization, and type of nitrogen nutrition on growth of Salicornia europaea. Russ. J. Plant Physiol. 2006, 53, 785–793. [Google Scholar] [CrossRef]
  74. Wang, D.; Wang, H.; Han, B.; Wang, B.; Guo, A.; Zheng, D.; Liu, C.; Chang, L.; Peng, M.; Wang, X. Sodium instead of potassium and chloride is an important macronutrient to improve leaf succulence and shoot development for halophyte Sesuvium portulacastrum. Plant Physiol. Biochem. 2012, 51, 53–62. [Google Scholar] [CrossRef] [PubMed]
  75. Xu, G.; Fan, X.; Miller, A.J. Plant nitrogen assimilation and use efficiency. Annu. Rev. Plant Biol. 2012, 63, 153–182. [Google Scholar] [CrossRef] [PubMed]
  76. Martinoia, E.; Heck, U.; Wiemken, A. Vacuoles as storage compartments for nitrate in barley leaves. Nature 1981, 289, 292–294. [Google Scholar] [CrossRef]
  77. Liu, T.; Ren, T.; White, P.J.; Cong, R.; Lu, J. Storage nitrogen co-ordinates leaf expansion and photosynthetic capacity in winter oilseed rape. J. Exp. Bot. 2018, 69, 2995–3007. [Google Scholar] [CrossRef] [PubMed]
  78. Młodzińska, E.; Zboińska, M. Phosphate uptake and allocation—A closer look at Arabidopsis thaliana L. and Oryza sativa L. Front. Plant Sci. 2016, 7, 198. [Google Scholar] [CrossRef] [PubMed]
  79. Shukla, D.; Rinehart, C.A.; Sahi, S.V. Comprehensive study of excess phosphate response reveals ethylene mediated signaling that negatively regulates plant growth and development. Sci. Rep. 2017, 7, 3074. [Google Scholar] [CrossRef]
  80. Breckle, S.-W. Salinity, halophytes and salt affected natural ecosystems. In Salinity: Environment–Plants–Molecules; Lauchli, A., Luttge, U., Eds.; Kluwer Academic Publishers: Dordrecht, The Netherlands, 2002; pp. 53–77. [Google Scholar]
  81. Ieviņa, S.; Karlsons, A.; Osvalde, A.; Andersone-Ozola, U.; Ievinsh, G. Coastal wetland species Rumex hydrolapathum: Tolerance against flooding, salinity and heavy metals for its potential use in phytoremediation and environmental restoration technologies. Life 2023, 13, 1604. [Google Scholar] [CrossRef]
  82. Mi, P.; Yuan, F.; Guo, J.; Han, G.; Wang, B. Salt glands play a pivotal role in the salt stress resistance of four recretohalophyte Limonium Mill. species. Plant Biol. 2021, 23, 1063–1073. [Google Scholar] [CrossRef]
  83. Ahmad, I.; Larher, F.; Stewart, G.R. Sorbitol, a compatible solute in Plantago maritima. New Phytol. 1979, 82, 671–678. [Google Scholar] [CrossRef]
  84. Ueda, A.; Kanechi, M.; Uno, Y.; Inagaki, N. Photosynthetic limitations of a halophyte sea aster (Aster tripolium L.) under water stress and NaCl stress. J. Plant Res. 2003, 11, 65–70. [Google Scholar] [CrossRef]
  85. Geissler, N.; Hussin, S.; Koyro, H.-W. Interactive effects of NaCl salinity and elevated atmospheric CO2 concentration on growth, photosynthesis, water relations and chemical composition of the potential cash crop halophyte Aster tripolium L. Environ. Exp. Bot. 2009, 65, 220–231. [Google Scholar] [CrossRef]
  86. Wiszniewska, A.; Koźmińska, A.; Hanus-Fajerska, E.; Dziurka, K.; Dziurka, M. Insight into phytohormonal modulation of defense mechanisms to salt excess in a halophyte and a glycophyte from Asteraceae family. Plant Soil 2021, 463, 55–76. [Google Scholar] [CrossRef]
  87. Karlsons, A.; Osvalde, A.; Nečajeva, J.; Ievinsh, G. Changes in nutritional status of coastal plants Hydrocotyle vulgaris and Aster tripolium at elevated soil salinity. Acta Univ. Latv. 2008, 745, 165–177. [Google Scholar]
  88. Ramani, B.; Reeck, T.; Debez, A.; Stelzer, R.; Huchzermeyer, B.; Schmidt, A.; Papenbrock, J. Aster tripolium L. and Sesuvium portulacastrum L.: Two halophytes, two strategies to survive in saline habitats. Plant Physiol. Biochem. 2006, 44, 395–408. [Google Scholar] [CrossRef]
  89. Purmale, L.; Jēkabsone, A.; Andersone-Ozola, U.; Ievinsh, G. Salinity tolerance and ion accumulation potential in vitro and in planta of different Armeria maritima accessions from a dry coastal meadow. Plants 2022, 11, 2570. [Google Scholar] [CrossRef]
  90. Jēkabsone, A.; Andersone-Ozola, U.; Karlsons, A.; Romanovs, M.; Ievinsh, G. Effect of salinity on growth, ion accumulation and mineral nutrition of different accessions of a crop wild relative legume species, Trifolium fragiferum. Plants 2022, 11, 797. [Google Scholar] [CrossRef]
  91. Maathuis, F.J.M.; Amtmann, A. K+ nutrition and Na+ toxicity: The basis of cellular K+/Na+ ratios. Ann. Bot. 1999, 84, 123–133. [Google Scholar] [CrossRef]
  92. Yamada, M.; Kuroda, C.; Fujiyama, H. Function of sodium and potassium in growth of sodium-loving Amaranthaceae species. Soil Sci. Plant Nutr. 2016, 62, 20–26. [Google Scholar] [CrossRef]
Figure 1. Effects of different salts on the soil electrical conductivity (A) and soil pH (B) during cultivation of the Cochlearia officinalis plants. The results are means ± SE from 5 replicates with 4 independent measurements each. Different letters indicate statistically significant (p < 0.05) differences between treatments separately for each time point.
Ijpb 14 00083 g001
Figure 2. Effects of different salts on electrolyte leakage in leaves of the Cochlearia officinalis plants (A), the relationship between electrolyte leakage and electrical conductivity in leaf tissue extracts (B), and the summed concentration of Na+ and K+ in leaves (C). Data are means from 5 replicates ± SE per treatment. Different letters indicate statistically significant (p < 0.05) differences between treatments.
Ijpb 14 00083 g002
Figure 3. Principal component analysis (A) and the generated heat map and cluster analysis (B) of the effects of different salts on the morphological parameters and ion accumulation in the Cochlearia officinalis plants. For the principal component analysis, unit variance scaling was applied to rows, and singular value decomposition with imputation was used to calculate the principal components. Hierarchical clusters were generated by using the average linkage method with correlation distance; the color scale shows the relative intensity of normalized parameter values. LP, leaf petioles; LB, leaf blades; EL, electrolyte leakage; EC, electrical conductivity; R, roots; DM, dry mass; L, leaves; n, number.
Ijpb 14 00083 g003
Figure 4. Effects of different salts on the soil pH (A) and dry mass (B) of the Limonium sinuatum plants from two cultivars at the end of the experiment. Data are means from 5 replicates ± SE per treatment. Different letters indicate statistically significant (p < 0.05) differences between treatments separately for each cultivar. (C) Relationship between the soil pH and dry mass of the Limonium sinuatum plants.
Ijpb 14 00083 g004
Figure 5. Effects of different salts on the leaf chlorophyll concentration (A) and the chlorophyll a fluorescence parameters Performance Index Inst (B) and Performance Index Total (C) of the Limonium sinuatum plants one week after the full treatment. Data are means from 5 replicates ± SE per treatment for each cultivar with 3 independent measurements each. Different letters indicate statistically significant (p < 0.05) differences between treatments separately for each cultivar.
Ijpb 14 00083 g005
Figure 6. Principal component analysis (A,B) and the generated heat map and cluster analysis (C,D) of the effects of different salts on the morphological parameters and ion accumulation in the Limonium B (A,C) and Limonium Y (B,D) plants. For the principal component analysis, unit variance scaling was applied to rows, and singular value decomposition with imputation was used to calculate the principal components. Hierarchical clusters were generated by using the average linkage method with correlation distance; the color scale shows the relative intensity of normalized parameter values. EC, electrical conductivity; DL, dry leaves; DM, dry mass; F, flowers; FS, flower stalks; L, leaves; LL, large leaves; ML, middle leaves; n, number; NL, new leaves; R, roots.
Ijpb 14 00083 g006
Figure 7. Effects of different salts on the relative biomass distribution between parts of the Lobularia maritima plants.
Ijpb 14 00083 g007
Figure 8. Principal component analysis (A) and the generated heat map and cluster analysis (B) of the effects of different salts on the morphological parameters and ion accumulation in the Lobularia maritima plants. For the principal component analysis, unit variance scaling was applied to rows, and singular value decomposition with imputation was used to calculate the principal components. Hierarchical clusters were generated by using the average linkage method with correlation distance; the color scale shows the relative intensity of normalized parameter values. EC, electrical conductivity F, flowers, FR, fine roots; FS, flower stalks; L, leaves; LR, large roots; R, roots; S, stems.
Ijpb 14 00083 g008
Figure 9. Effects of different salts on soil pH (A), number of leaves (B), dry mass of leaves (C), dry mass of roots (D), leaf water content (E), and root water content (F) of the Plantago maritima and Tripolium pannonicum plants. Data are means from 5 replicates ± SE per treatment. Different letters indicate statistically significant (p < 0.05) differences between treatments separately for each species.
Ijpb 14 00083 g009
Figure 10. Principal component analysis (A,B) and the generated heat map and cluster analysis (C,D) of the effects of different salts on the morphological parameters and ion accumulation in the Plantago maritima (A,C) and Tripolium pannonicum (B,D) plants. For the principal component analysis, unit variance scaling was applied to rows, and singular value decomposition with imputation was used to calculate the principal components. Hierarchical clusters were generated by using the average linkage method with correlation distance; the color scale shows the relative intensity of normalized parameter values. EC, electrical conductivity; DM, dry mass; F, flowers; FS, flower stalks; L, leaves; ML, middle leaves; NL, new leaves; n, number; OL, old leaves; R, roots.
Ijpb 14 00083 g010
Table 1. The experiments with individual salts applied to the halophytic model plants used in the present study.
SaltTypeCochlearia
officinalis
Limonium sinuatum BlueLimonium sinuatum
Yellow
Lobularia maritimaPlantago
maritima
Tripolium pannonicum
NaClN200250250200300300
KClN200250250
NaOAcB200250250300300
KOAcB200
Na2CO3B200
K2CO3B200
NaHCO3B200250250200300300
KHCO3B200
NaNO3N200250250200300300
KNO3N200
Na2HPO4B200250250
K2HPO4B200
Na2SO4N200250250200
K2SO4N200
N, neutral; B, basic. The numbers indicate the final concentration (mmol L−1) of the salt in substrate.
Table 2. Effects of different salts on morphological parameters of the Cochlearia officinalis plants.
TreatmentLeaf Number (n)Leaf Petiole DM (g plant−1)Leaf Blade DM (g plant−1)Root DM
(g plant−1)
Leaf Petiole H2O (g g−1)Leaf Blade H2O
(g g−1 DM)
Root H2O
(g g−1 DM)
Control65 ± 2 a1.5 ± 0.1 ab5.7 ± 0.8 a0.73 ± 0.15 a5.8 ± 0.2 abcd4.0 ± 0.3 bc6.1 ± 0.6 a
NaCl64 ± 8 a1.0 ± 0.1 ab5.0 ± 0.4 a0.58 ± 0.02 a7.3 ± 0.4 a5.9 ± 0.4 a5.2 ± 0.1 a
KCl66 ± 5 a1.2 ± 0.2 ab5.7 ± 0.6 a0.51 ± 0.08 a6.7 ± 0.4 ab5.1 ± 0.2 abc5.5 ± 0.2 a
Na2CO368 ± 10 a1.2 ± 0.1 ab4.3 ± 0.3 a0.78 ± 0.18 a6.0 ± 0.1 abcd5.3 ± 0.8 ab6.5 ± 0.1 a
K2CO352 ± 12 a0.9 ± 0.1 b4.3 ± 0.3 a0.66 ± 0.11 a5.5 ± 0.5 bcd4.0 ± 0.4 bc6.8 ± 0.4 a
NaHCO3102 ± 17 a1.4 ± 0.2 ab4.9 ± 0.4 a0.96 ± 0.07 a5.5 ± 0.3 bcd4.3 ± 0.3 abc6.5 ± 0.9 a
KHCO355 ± 9 a0.9 ± 0.1 b4.4 ± 0.2 a0.80 ± 0.18 a5.4 ± 0.4 bcd4.3 ± 0.3 abc5.9 ± 0.7 a
NaNO355 ± 10 a0.9 ± 0.1 b4.9 ± 0.5 a0.51 ± 0.02 a4.9 ± 0.3 cd4.3 ± 0.4 abc5.5 ± 0.5 a
KNO363 ± 8 a1.3 ± 0.1 ab5.1 ± 0.6 a0.39 ± 0.03 a4.7 ± 0.3 cd4.2 ± 0.3 abc5.2 ± 0.6 a
Na2HPO458 ± 7 a1.3 ± 0.2 ab5.6 ± 0.9 a0.62 ± 0.20 a4.9 ± 0.1 cd3.7 ± 0.5 bc4.8 ± 0.2 a
K2HPO476 ± 12 a1.3 ± 0.2 ab5.0 ± 0.6 a0.74 ± 0.03 a4.5 ± 0.2 d3.4 ± 0.1 c4.6 ± 0.4 a
Na2SO485 ± 21 a1.7 ± 0.2 a4.6 ± 0.5 a0.55 ± 0.12 a5.6 ± 0.2 bcd4.2 ± 0.1 abc6.0 ± 0.2 a
K2SO468 ± 6 a1.5 ± 0.1 ab4.4 ± 0.4 a0.84 ± 0.23 a6.3 ± 0.7 abc4.7 ± 0.4 abc6.9 ± 1.2 a
DM, dry mass. Data are means from 5 replicates ± SE per treatment. Different letters for each parameter indicate statistically significant differences (p < 0.05).
Table 3. Effects of different salts on the leaf chlorophyll concentration and Performance Index Total of the Cochlearia officinalis plants.
TreatmentLeaf Chlorophyll Concentration (mg m−2)Performance Index Total (Relative Units)
Week 1Week 2Week 3Week 1Week 2Week 3
Control1216 ± 9 ab1191 ± 16 b1190 ± 17 c3.6 ± 0.3 d4.4 ± 0.4 e2.9 ± 0.2 e
NaCl1246 ± 11 ab1330 ± 15 a1319 ± 14 ab9.4 ± 0.5 a9.9 ± 0.7 a9.8 ± 0.5 a
KCl1245 ± 22 ab1281 ± 26 ab1248 ± 27 abc9.2 ± 0.5 a6.8 ± 0.6 bcd7.1 ± 0.3 bc
Na2CO31231 ± 9 ab1282 ± 16 ab1281 ± 14 abc6.7 ± 0.5 bc6.6 ± 0.6 bcde4.8 ± 0.5 d
K2CO31258 ± 15 ab1304 ± 29 a1282 ± 26 abc7.7 ± 0.7 b5.9 ± 0.4 bcde5.3 ± 0.4 cd
NaHCO31243 ± 21 ab1267 ± 13 ab1256 ± 11 abc5.3 ± 0.2 cd5.6 ± 0.3 cde5.3 ± 0.4 cd
KHCO31185 ± 33 b1257 ± 30 ab1281 ± 32 abc6.4 ± 0.5 bc4.9 ± 0.3 de4.9 ± 0.2 d
NaNO31274 ± 12 a1337 ± 10 a1291 ± 8 ab9.6 ± 0.5 a7.9 ± 0.5 ab10.0 ± 0.4 a
KNO31263 ± 25 ab1347 ± 31 a1328 ± 25 a7.5 ± 0.5 b7.7 ± 0.4 abc8.9 ± 0.6 ab
Na2HPO41241 ± 16 ab1280 ± 14 ab1259 ± 14 abc6.7 ± 0.5 bc6.6 ± 0.8 bcde5.6 ± 0.5 cd
K2HPO41214 ± 10 ab1262 ± 24 ab1228 ± 22 bc5.1 ± 0.4 cd5.2 ± 0.3 de4.8 ± 0.3 d
Na2SO41246 ± 12 ab1321 ± 19 a1302 ± 16 ab6.5 ± 0.5 bc4.7 ± 0.5 de4.9 ± 0.4 d
K2SO41236 ± 8 ab1305 ± 18 a1251 ± 16 abc5.2 ± 0.3 cd4.9 ± 0.2 de4.3 ± 0.3 de
Data are means from 5 replicates ± SE per treatment with 3 independent measurements each. Different letters for each parameter indicate statistically significant differences (p < 0.05).
Table 4. Effects of different salts on the morphological parameters of the Limonium sinuatum plants from two different cultivars.
TreatmentLeaf Number (n)Leaf DM
(g plant−1)
Root DM
(g plant−1)
Flower DM
(g plant–1)
Total DM
(g plant−1)
Root H2O
(g g−1)
Limonium sinuatum Blue
Control113 ± 25 a14.1 ± 0.8 ab3.8 ± 0.3 a17.8 ± 1.1 ab3.8 ± 0.1 a
NaCl74 ± 8 ab10.6 ± 0.5 c2.4 ± 0.2 bc13.1 ± 0.6 c4.0 ± 0.1 a
KCl77 ± 9 ab12.5 ± 0.5 bc2.4 ± 0.2 bc14.9 ± 0.6 bc4.0 ± 0.1 a
NaHCO340 ± 2 b7.9 ± 0.2 d1.1 ± 0.1 d9.0 ± 0.3 d2.7 ± 0.5 b
NaNO389 ± 15 ab15.7 ± 0.9 a2.2 ± 0.1 bc17.9 ± 0.9 a4.5 ± 0.1 a
Na2HPO444 ± 2 b8.0 ± 0.2 d1.8 ± 0.1 cd9.8 ± 0.3 d2.7 ± 0.1 b
Na2SO489 ± 13 ab12.4 ± 0.5 bc3.0 ± 0.2 ab15.4 ± 0.6 abc4.4 ± 0.2 a
Limonium sinuatum Yellow
Control52 ± 11 a6.9 ± 0.7 a1.8 ± 0.2 ab10.5 ± 1.1 a19.1 ± 0.7 a4.2 ± 0.2 ab
NaCl56 ± 10 a4.5 ± 0.4 a2.0 ± 0.3 a8.6 ± 0.7 a17.1 ± 1.1 ab4.7 ± 0.1 a
KCl38 ± 3 a3.8 ± 0.4 a0.8 ± 0.1 c9.8 ± 0.4 a14.5 ± 0.8 b4.6 ± 0.9 a
NaHCO336 ± 6 a6.0 ± 1.0 a0.7 ± 0.1 c1.7 ± 0.3 b8.6 ± 0.8 c2.8 ± 0.3 b
NaNO375 ± 16 a6.4 ± 0.9 a1.1 ± 0.2 c8.0 ± 0.7 a15.3 ± 1.2 ab4.0 ± 0.1 ab
Na2HPO436 ± 4 a6.3 ± 1.1 a1.4 ± 0.1 b2.6 ± 0.5 b9.7 ± 0.9 c3.0 ± 0.1 b
Na2SO454 ± 10 a5.0 ± 0.5 a1.3 ± 0.2 bc10.0 ± 1.2 a16.3 ± 0.7 ab3.6 ± 0.2 ab
DM, dry mass. Data are means from 5 replicates ± SE per treatment. Different letters for each parameter indicate statistically significant differences (p < 0.05).
Table 5. Effects of different salts on the morphological parameters of the Lobularia maritima plants. DM, dry mass.
TreatmentLeaf DM
(g plant−1)
Stem DM
(g plant−1)
Flower DM
(g plant−1)
Root DM
(g plant−1)
Total DM
(g plant−1)
Leaf H2O
(g g−1)
Control0.75 ± 0.07 a0.69 ± 0.07 a0.65 ± 0.12 a0.15 ± 0.01 a2.24 ± 0.14 a9.2 ± 0.4 a
NaCl0.77 ± 0.12 a0.56 ± 0.03 a0.33 ± 0.04 b0.24 ±0.06 a1.89 ± 0.10 a10.0 ± 0.6 a
NaNO30.98 ± 0.06 a0.61 ± 0.05 a0.28 ± 0.03 b0.22 ± 0.06 a2.08 ± 0.07 a9.2 ± 0.9 a
NaHCO30.74 ± 0.05 a0.81 ± 0.16 a0.39 ± 0.06 b0.21 ± 0.02 a2.14 ± 0.23 a10.2 ± 1.4 a
Na2SO40.84 ± 0.06 a0.66 ± 0.13 a0.28 ± 0.04 b0.24 ± 0.02 a2.02 ± 0.24 a9.8 ± 0.8 a
DM, dry mass. Data are means from 5 replicates ± SE per treatment. Different letters for each parameter indicate statistically significant differences (p < 0.05).
Disclaimer/Publisher’s Note: The statements, opinions and data contained in all publications are solely those of the individual author(s) and contributor(s) and not of MDPI and/or the editor(s). MDPI and/or the editor(s) disclaim responsibility for any injury to people or property resulting from any ideas, methods, instructions or products referred to in the content.

