Article

Blue Carbon in Mangroves of the Arid Zones of San Ignacio and El Dátil Lagoons, El Vizcaino Biosphere Reserve, Baja California, Mexico

by
Jony R. Torres
1,
Tannia Frausto-Illescas
2,
Celeste Ortega-Trasviña
2,
Ramón H. Barraza-Guardado
3,*,
Zulia M. Sanchez-Mejía
4 and
Francisco Choix-Ley
5,*
1
Tecnológico Nacional de México/I. T. del Valle del Yaqui, Academy of Biology (Laboratory of Ecology in Coastal Zones), Av. Tecnológico, Block 611, Bacum 85276, Mexico
2
WildCoast/CostaSalvaje, Blvd. Las Dunas 160, Ensenada 22880, Mexico
3
Departamento de Investigaciones Científicas y Tecnológicas (DICTUS), Universidad de Sonora, Blvd. Colosio s/n, Hermosillo 83000, Mexico
4
Departamento de Ciencias del Agua Y Medio Ambiente, Instituto Tecnológico de Sonora (ITSON), 5 de Febrero 818 Sur, Col. Centro, Cd. Obregón 85000, Mexico
5
CONACYT—Facultad de Ciencias Químicas, Universidad Autónoma de Chihuahua, Circuito Interior S/N, Chihuahua 31125, Mexico
*
Authors to whom correspondence should be addressed.
Int. J. Plant Biol. 2023, 14(4), 1078-1091; https://doi.org/10.3390/ijpb14040078
Submission received: 3 August 2023 / Revised: 6 November 2023 / Accepted: 11 November 2023 / Published: 20 November 2023
(This article belongs to the Topic Tolerance to Drought and Salt Stress in Plants)

Abstract

:
Estimation of carbon (C) stocks revealed a very high carbon sequestration potential of mangroves, which play a major role in the global C cycle. The C stored in the biomass of live trees can be estimated from above- and below-ground measurements, i.e., tree diameter and height, leaf litter, root biomass, necromass, and soil. The allocation of biomass and C in the scrub mangrove forest is influenced by various factors, including low structural development. The objective of this study was to estimate the carbon stock (in relation to biomass) and storage in the soil of the San Ignacio and El Dátil lagoons in an arid region of the north Pacific. Above-ground biomass (AGB) was estimated based on mangrove structure and leaf litter; below-ground biomass (BGB) was measured by extracting root cores (45 cm depth) and soil (1.2 m depth). Biomass values were converted to carbon with allometric equations. We found an inverse relationship between BGB content (roots) and above-ground structural development, with a mean total biomass (AGB + BGB) of 101.7 MgC ha−1. Below-ground carbon content (roots, necromass, and soil) was 2.8 times higher than above-ground carbon content (trees and litter). Control sites (devoid of vegetation) adjacent to the mangrove have recorded low carbon stocks of 7.3 MgC ha−1, which supports the recommendations for conserving and restoring degraded areas. The present study contributes valuable information on carbon related to mangrove biomass and stored in the soil of arid mangrove areas of northwestern Mexico.

1. Introduction

Increasing greenhouse gas emissions and associated impacts on global warming [1] have led to an urgent need to identify and protect ecosystems with a high carbon (C) stock capacity [2,3]. Coastal ecosystems with vegetation produce and sequester significant amounts of organic carbon [4,5]. Mangroves, seagrasses, and salt marshes are known as blue-carbon ecosystems; they sequester greenhouse gases and store more organic carbon per unit area than terrestrial forests over the long term [6]. Estimation of C-stocks revealed a very high carbon sequestration potential by mangroves, which play a central role in the global carbon cycle [7].
The C stored in the biomass of live trees can be estimated from above- and below-ground measurements, i.e., tree diameter and height, leaf litter, root biomass, necromass, and soil [8,9]. In general, studies about biomass production by mangrove forests [10] have focused on above-ground biomass (AGB) [11,12]. Only a few have addressed below-ground biomass (BGB) [13], and none have focused specifically on the BGB of scrub or dwarf mangrove forests [14]. In the latter, the amount of below-ground root biomass (BRB) in arid regions is inversely related to the structural development of the mangrove forest, probably as a response to high salinity and low organic matter content, among other factors [8,9].
Carbon stocks related to biomass in the scrub mangrove forest are influenced by several factors, including low structural development [15,16], particularly in response to environmental stressors [17]. In addition, soil organic carbon (Corg) increases as roots grow, die, and accumulate carbon [18]. Currently, there are few studies on carbon stores in tropical and subtropical mangrove areas. Recently, academia, nongovernmental organizations, and governmental groups have created synergies to increase scientific knowledge concerning blue-carbon ecosystems, and the Corg reserves of several ecosystems have been quantified and mapped [19].
In this context, the objective of this study was to estimate the carbon stock (in relation to biomass) and storage in the soil of the San Ignacio and El Datil lagoons, located in an arid region of northwest Mexico. Furthermore, we hypothesized that mangroves of subtropical arid zones have (i) low carbon stocks due to their low structure development relative to mangroves of tropical zones and (ii) high below-ground carbon content (carbon in roots, necromass, and soil) related to high root biomass.

2. Materials and Methods
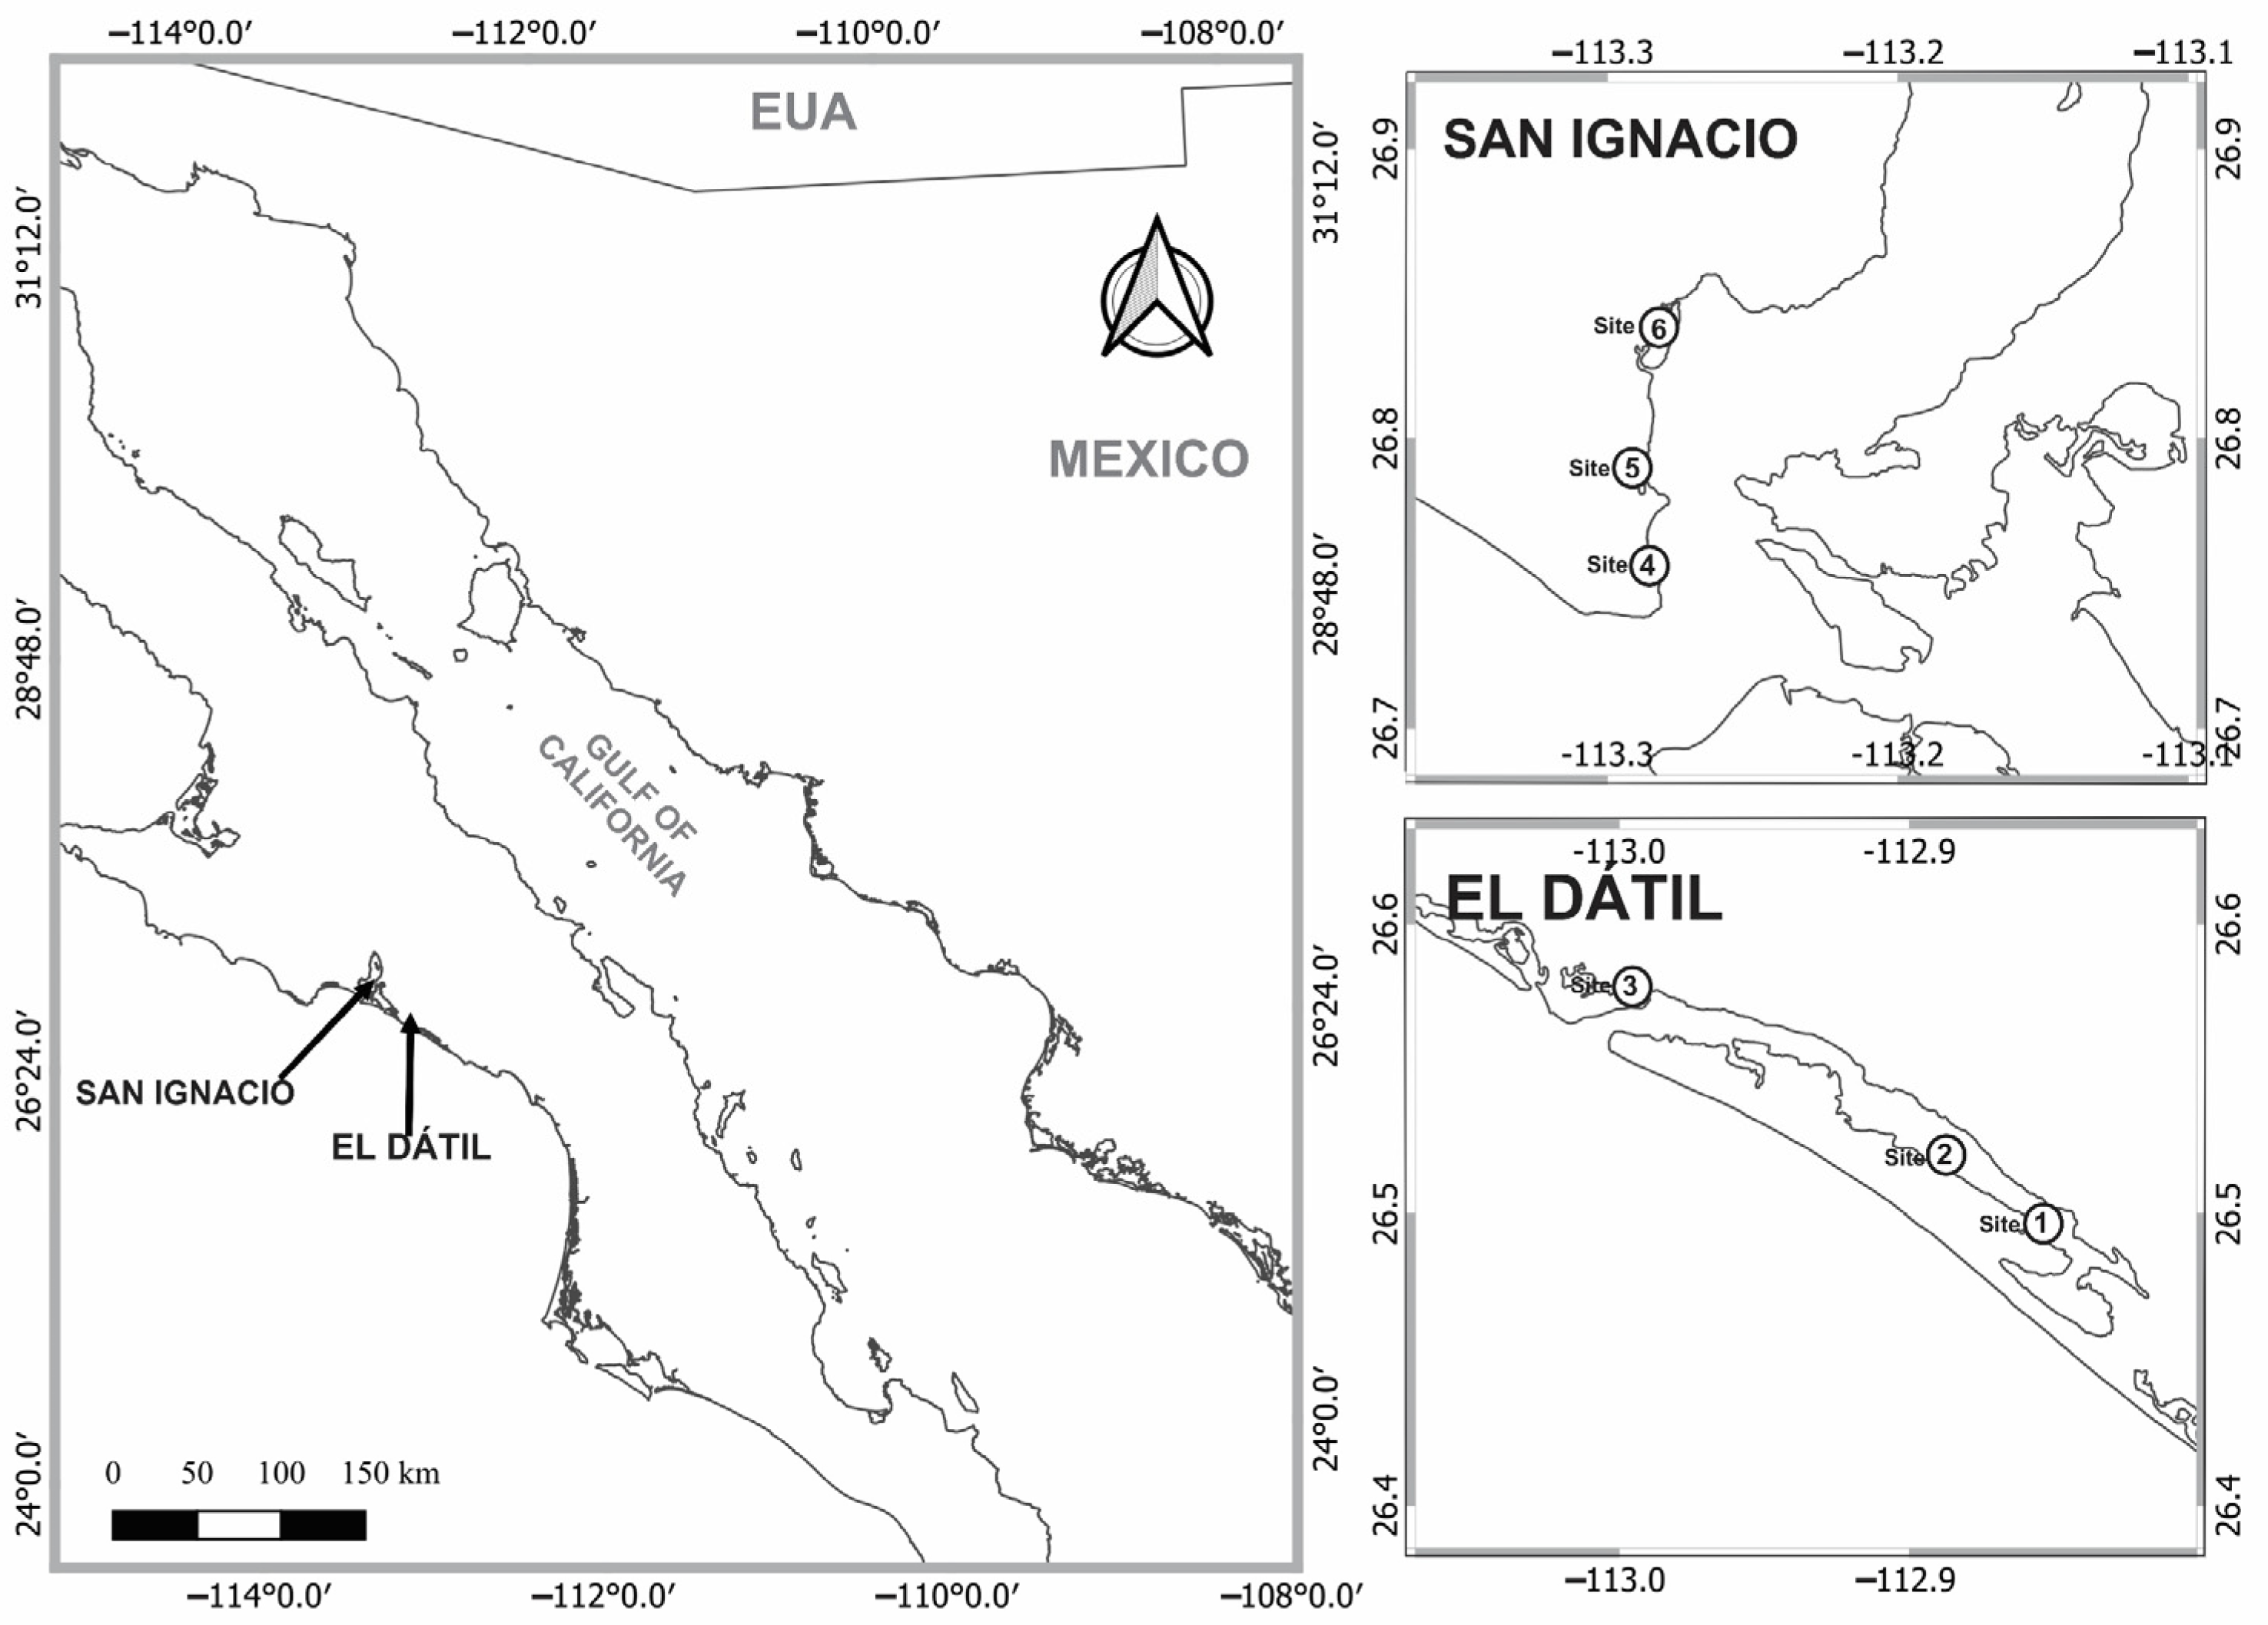
2.1. Study Site

The study site is located at coordinates 26.941721 N and −113.739291 W, characterized by an arid and warm climate with a mean annual temperature ≥22 °C, a temperature of the coldest month ˂18 °C, and a winter precipitation regime ≥36% of the annual total [20]. The mangrove species present are Laguncularia racemosa [L.] Gaertn (white mangrove) and Rhizophora mangle [L.] (red mangrove) [21]. The study site includes two lagoons located within the area of influence of El Vizcaino Biosphere Reserve [22,23], an area of importance for conservation [21], and Ramsar Site number 1341 [24] (Figure 1).
The monitoring was designed to establish three study sites in the mangrove ecosystem of each lagoon (San Ignacio and El Dátil), with two monitoring units (MU) at each site, in addition to two sites with no vegetation coverage (control sites) for the comparison of carbon stocks (total of 20 MU). The monitoring was carried out in November 2021.

2.2. Physico-Chemical Characteristics of Water and Sediment

In each mangrove ecosystem MU, a sample of interstitial water (50 cm depth) was collected with a piezometer, according to Moreno-Casasola and Warner [25]. The piezometers were built with 1 inch PVC tubing, and in the 20 cm of the buried tube, alternating grooves were cut every 2 cm and covered with a 250 μ mesh affixed with plastic fasteners [25]. Surface water samples were collected from the water column since the sites were flooded. Water salinity (practical salinity units: PSU), redox potential (mV), temperature (°C), and pH were measured with a Hanna HI 9828 multiparameter portable meter. Two sediment samples were collected from the upper 20 cm of soil (24 samples) with a corer (0.0033 m2). These samples were used to determine soil texture according to the Bouyucos method, which allows for the determination of the particle size distribution of fine-grained soils by means of a hydrometer [26], pH by electrometry in a 1:2 ratio with water, and organic matter (OM) content by ignition according to Heiri et al. [27]. In addition, two sediment samples of known volume were collected in each MU (24 samples) to determine soil bulk density and moisture content, according to Moreno-Casasola and Warner [25]. Soil moisture content is the percentage of water stored in one gram of soil; a value of 100% would mean that 1 g of soil stores 1 g of water [28].

2.3. Mangrove Forest Structure

The method to estimate the structural attributes was according to Velázquez-Salazar et al. [29]. In each MU, a 10 m × 10 m quadrant was established to determine the abundance of each mangrove species and the height and diameter of the stem (DS > 2.5 cm). DS was measured at 30 cm above ground level [30]; afterward, we estimated the tree basal area and coverage.

2.4. Primary Productivity Based on Above-Ground Leaf Litter

Above-ground leaf litter was estimated by collecting samples from four 50 cm × 50 cm quadrants in each MU (48 quadrants in total) using the planar intersections methodology described by Barrios-Calderón [31], with four planar intersection lines measuring 10 m long.

2.5. Below-Ground Root Biomass (BRB)

BRB was determined according to Adame et al. [8]. Two cores were collected from each MU (24 cores in total) using a stainless steel corer measuring 11 cm in diameter, reaching a depth of 45 cm, corresponding to the most active portion of the roots [32]. Each sample was divided into depth strata to analyze the distribution of the roots: the first stratum was from 0 to 15 cm, the second from 15 to 30 cm, and the third from 30 to 45 cm. Each sample was kept cold (4 °C) and transported to the laboratory. Afterward, it was washed with fresh water through a 500-micron mesh to separate roots from sediment. Roots were immersed in water; the floating live roots were sorted manually from sunken dead roots, as proposed by Castañeda-Moya et al. [32]. Necromass (dead roots) in each depth stratum was dry-weighed. Live roots were separated into three diameter classes: thin (<2 mm), medium (2–5 mm), and large (>5 mm); then, leaves were oven-dried at 60 °C and weighed [32]. Data are shown in grams’ dry weight per square meter (gDw·m−2) for each diameter class and depth stratum. No pneumatophores were observed at the study sites.

2.6. Biomass-Related Carbon

Above-ground biomass was determined for L. racemosa and R. mangle using allometric equations (Table 1), as proposed by Smith and Whelan [33] for South Florida, United States, where mangrove forests show structural attributes similar to those of forests in northwestern Mexico. Wood density values for each species were used according to the proposals by Howard et al. [34].
The conversion factor used to estimate carbon content from tree biomass was as proposed by Kauffman and Donato [33]: carbon content of each tree (MgC ha−1) = tree biomass * carbon conversion factor (0.48) [35].
Carbon in the leaf litter component (MgCorg ha−1) = (mean leaf litter biomass × carbon conversion factor (0.45))/area [36].
Jaramillo et al. [37] reported that the carbon content of tropical forest roots ranges between 36% and 42%. A suitable value for the carbon content of roots is 39% (median). Carbon content of below-ground roots (MgCorg ha−1) = below-ground biomass * carbon conversion factor (0.39).
The carbon content of necromass was estimated using the acceptable default value based on the carbon content of dead wood in tropical forests (50%). Carbon content in necromass (MgCorg ha−1) = Necromass biomass × carbon conversion factor (0.5) [34].

2.7. Carbon in Soil

At each site, plots were selected to collect a core sample at 1 m [34]. Each core was divided by depth from 0–15 cm, 15–30 cm, 30–50 cm, and 50–100 cm; samples were collected using a 50 mL falcon tube [38]. Samples were stored at 4 °C and transported for laboratory testing [34,38]. We followed the standardized laboratory and calculation protocols established by the blue carbon community [34]. The percentages of total and organic C were determined in a Flash 2000 Elemental Analyzer, (Thermo Fisher Scientific) Waltham, MA, USA, (www.thermofisher.com accessed on 16 November 2023), The equipment is located in Obregón city, Mexico, in the Regional Headquarters of the National Laboratory of Geochemistry and Mineralogy, (LANGEM, https://www.langem.org/, (accessed on 16 November 2023). The percentage of organic carbon was calculated by subtracting the percent inorganic carbon from the percent total carbon.

2.8. AGC/BGC Ratio

One approach to gaining a deeper understanding of carbon distribution has been to explore the ratio between above-ground and below-ground content. This ratio is defined as above-ground carbon (AGC), which considers structure and soil leaf litter, divided by below-ground carbon (BGC), which corresponds to the carbon content in roots, necromass, and soil [39].

2.9. Statistical Analysis

Data were processed using the software IBM SPSS Statistics version 23 The data were analyzed by the Kolmogorov-Smirnov test (normality) and Levene’s test (homoscedasticity). The differences between groups regarding water and sediment physico-chemical characteristics, structure, leaf litter, necromass, and below-ground root biomass, arranged spatially (sites), were assessed with Tukey’s one-way ANOVA, considering a 5% significance level [40].

3. Results

3.1. Water Physico-Chemical Characteristics

The pH did not show significant differences between surface and interstitial water; maximum values were recorded at San Ignacio Site 2, with 7.6 ± 0.02 in surface water, and the lowest at El Dátil Site 4, with 6.3 ± 0.01 in interstitial water, with a low range of variation at both levels. Surface water temperature showed significant differences (F = 11.2, p = 0.04, N = 18), with low mean values in San Ignacio (20.2 ± 0.09 °C) and higher values in El Dátil (22.4 ± 0.14 °C). Interstitial water temperature ranged from 21.2 °C to 25.3 °C. Conductivity showed similar values in surface and interstitial water, ranging from 55.4 mS/cm to 67.4 mS/cm, with no significant differences (Table 2 and Table 3).
The mean salinity was similar in the two lagoons in surface water, with 39.4 ± 0.9 on average, and in interstitial water, with 38.6 ± 1.1. Peak values were recorded at El Dátil Site 6, with 46.1 ± 2.3. The oxide reduction potential showed that the surface water of Lagoon San Ignacio had more oxidative conditions, with values of −125 ± 2.7 mV, and was more reductive in El Dátil, with values of −248 ± 3.3 mV. In interstitial water, more reductive values were recorded at El Dátil Sites 4 and 5 (−416 ± 9.7 and −338 ± 6.1 mV, respectively) (Table 3).

3.2. Sediment Physico-Chemical Characteristics

Soil pH showed minor variations in the study lagoons, from 6.5 to 7.2, with significant differences relative to restored sites, which recorded high values of 9.1 ± 0.11 on average. Soil bulk density was similar at Sites 1 to 5, with 1.01 ± 0.06 g/cm3, except for Site 6, which recorded a minimum value of 0.4 ± 0.02 g/cm3 with a high moisture content of 62 ± 0.9%. Control sites showed high soil bulk density (1.5 ± 0.02 g/cm3) and low moisture content (18 ± 0.4%) (Table 4).
Organic matter content in control sites was low, from 1.5 ± 0.5 to 3.1 ± 0.4%, except for Site 6, which recorded a high organic matter content with a mean of 14.8 ± 1.34%; in addition, control sites showed very low contents of 0.06%. With regard to the soil textural classification, high sand contents were observed in all mangrove sites, with mean values of 86.8 ± 0.9%, and in the control sites, with 92.4 ± 0.7% of sand (Table 4).

3.3. Mangrove Structural Attributes

Less structural development was recorded in El Datil than in San Ignacio (DS of 4.9 ± 0.4 cm vs. 6.5 ± 0.4 cm, respectively); this difference was significant (F = 4.4, p = 0.01, N = 244). As a result, basal areas were higher in San Ignacio, with 9.5 ± 1.3 cm; differences between sites were statistically significant (F = 3.1, p < 0.009, N = 244). Tree height showed an irregular variation between sites, with a mean height of 1.33 ± 0.01 m; the highest tree height was recorded in San Ignacio Site 6, with 1.71 ± 0.11 m (F = 7.3; p < 0.05, N = 244) (Table 5). Separately, tree coverage was higher in San Ignacio Sites 4 and 6 (2.6 ± 0.032 and 2.7 ± 0.033 m, respectively). Only two mangrove species were identified, namely, Rhizophora mangle and Laguncularia racemosa; R. mangle was more abundant in almost all sites. The highest mangrove densities were found at El Dátil Sites 1 and 3 (5800 and 5000 trees/ha, respectively). R. mangle showed the highest density in the two lagoons, except at El Dátil Site 3, where L. racemosa showed a higher density, with 3300 trees/ha (Table 5).

3.4. Soil Leaf Litter

Leaf litter deposited on the ground recorded a considerable variation, with significant differences (F = 17.8, p = 0.01, N = 48). Peak values were observed at San Ignacio Site 6, with 124.5 ± 18.3 g/m2, and the lowest at Site 5, with 22.9 ± 4.6 g/m2 (Figure 2).

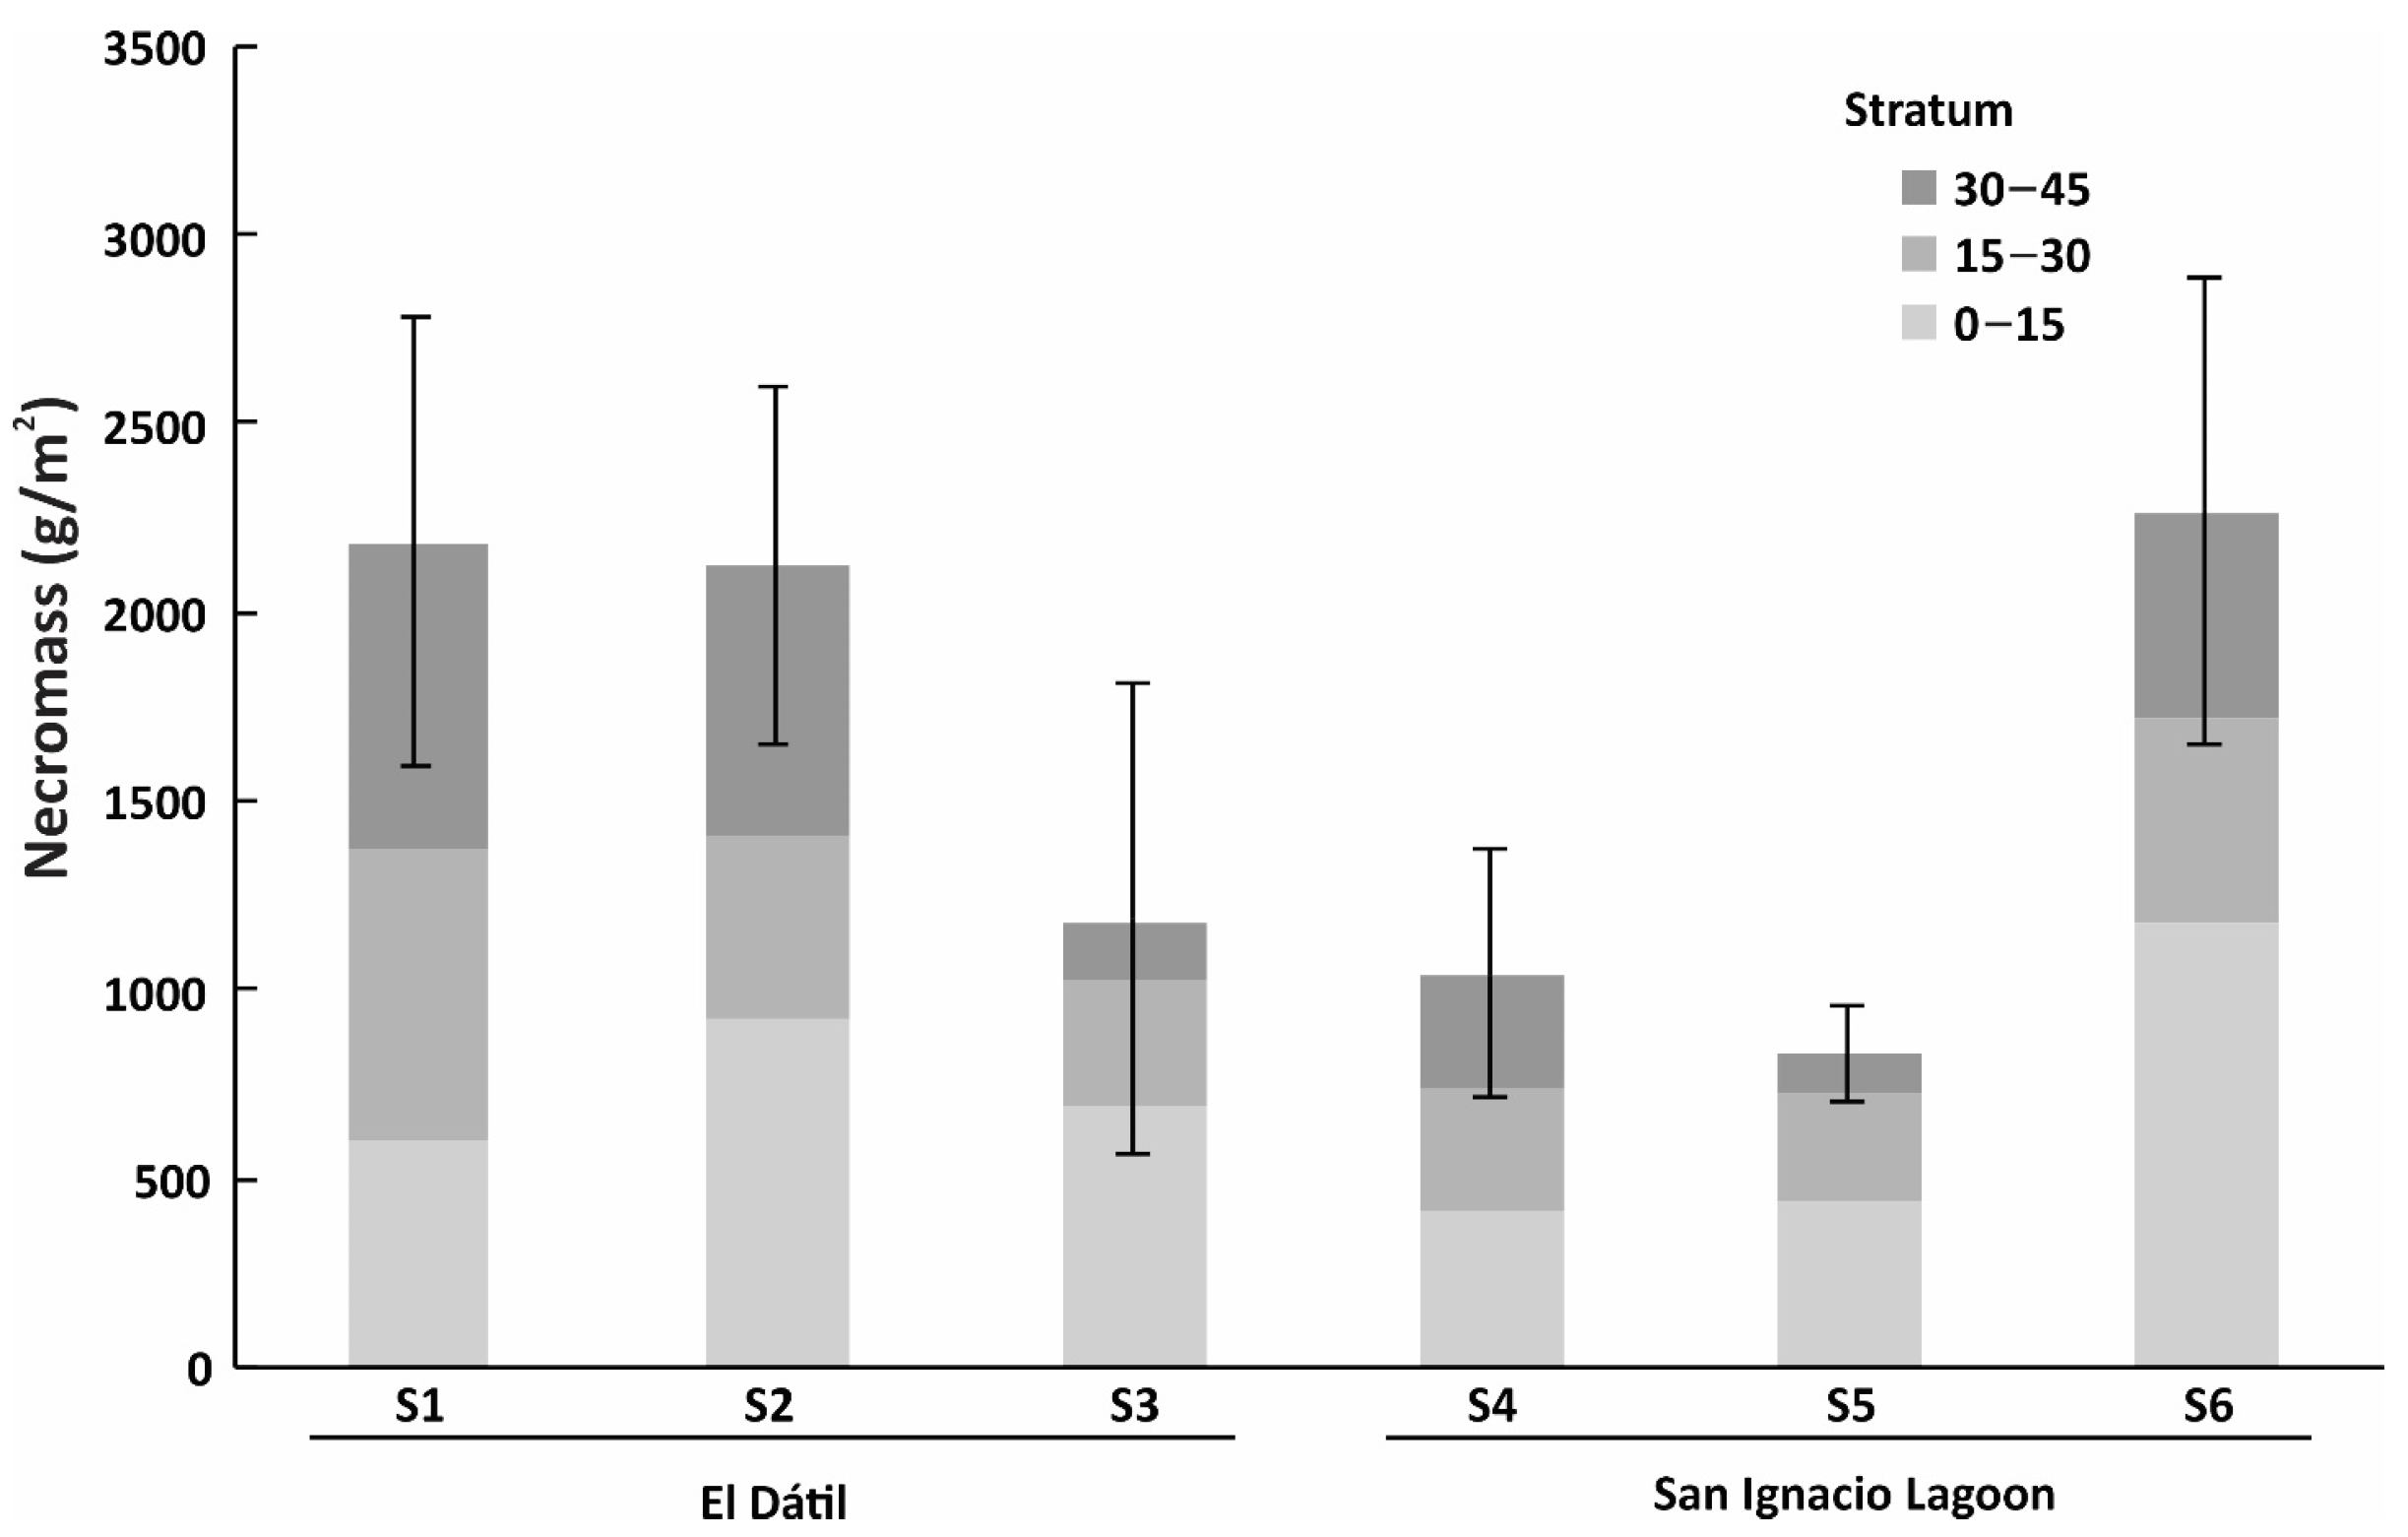
3.5. Below-Ground Root Biomass

Fine root biomass was high at Site 1 (El Datil) and Site 6 (San Ignacio) (6175 ± 979 and 4398 ± 920 g/m2, respectively). The fine-diameter class was also identified as the one with the greatest contribution to total root biomass, except at Site 4, where large roots represented higher biomass. Medium roots recorded their highest contribution at Site 3, with 2081 ± 297 g/m2, while other sites showed similar values, with an average of 833 ± 191.5 g/m2. Medium roots were also the diameter class with the lowest contribution to the below-ground biomass. Large roots showed minor variations, with a mean value of 2998 ± 644 g/m2 (Table 6).
The analysis by depth stratum reveals that fine roots attained their highest biomass in the upper 15 cm at most sites. Medium roots were irregularly distributed in the three depth layers, while large roots, similar to fine roots, presented the highest biomass in the upper depth layer. Regarding total biomass, Site 1 (El Datil) and Site 6 (San Ignacio) showed the highest biomass, with 11,862 ± 2024 g/m2 and 8299 ± 1905 g/m2, respectively (Table 6).
The soil necromass contents showed peak values in the upper depth stratum in all sites (except for Site 1), with mean total necromass values of 711 ± 242 g/m2 in the upper stratum, 462 ± 130 g/m2 in the medium stratum, and 434.5 ± 90.1 g/m2 in the bottom stratum. The total mean necromass was 1607.7 ± 462 g/m2 (Figure 3).

3.6. Carbon Stock Related to Mangrove Biomass

The sites with the highest carbon stock derived from mangrove biomass were El Datil Site 1 and San Ignacio Site 6, with 87.3 ± 14.5 MgC ha−1 and 62.7 ± 13.2 MgC ha−1, respectively, where the highest contents corresponded to roots, with a mean value of 28.7 ± 6.5 MgC ha−1. Above-ground biomass (leaf litter and trees) recorded a mean value of 22.5 ± 4.9 MgC ha−1, while below-ground biomass (roots and necromass) showed a mean of 36.7 ± 15.3 MgC ha−1. The below-ground/above-ground (root/shoot) carbon ratio recorded high values at Site 2, with below-ground values being 3.3 times higher than above-ground carbon. The lowest root/shoot ratio was recorded at Site 5, with below-ground carbon being 0.7 times the amount of above-ground carbon (Table 7).

3.7. Carbon in the Soil

The estimated amount of carbon stored in soil averaged 34.9 MgC ha−1 in El Dátil and 47.1 MgC ha−1 in San Ignacio, with a peak of 96.9 MgC ha−1 at Site 6. The sites proposed for restoration showed low carbon contents: 0 in San Ignacio and 7.3 MgC ha−1 in El Dátil (Table 8).
The total carbon stock (biomass plus soil) recorded mean values of 103 MgC ha−1 in El Dátil and 100.3 MgC ha−1 in San Ignacio. The above- and below-ground carbon biomass represented 36.1%, respectively, while the carbon stored in soil was 63.9%. The AGC/BGC ratio in relation to biomass was higher than 1 (except at Site 5), with a maximum ratio of 3.3 at El Dátil Site 2. The total AGC/BGC ratio showed a high variation, from 1.5 at El Dátil Site 3 to 7.5 at San Ignacio Site 6 (Table 9).

4. Discussion

Mangrove forests in arid zones face high salinity and nutrient scarcity, growing at their physiological limits. This results in low productivity and slow growth [41], as observed in the mangroves of northwestern Mexico [42]. The present study found low organic matter contents (4.4% on average), similar to those reported by Torres et al. [9] for the Gulf of California (6.4% on average). The high value of organic matter content in Site 6 (14.8%) was due to a basin-type microtopography that led to the accumulation of litter in the soil. The study sites have high tree densities characteristic of dwarf mangroves (<2 m) located in the high-intertidal zone in arid climates, classified as scrub mangroves [43]. Mangrove tree height was similar to that reported by Adame et al. [44] for arid areas of America, Africa, and Australia, with high tree densities averaging 5775 trees ha−1.
This study confirmed the hypothesis (i) of low carbon stocks compared to mangrove forests growing in tropical areas since the average total carbon content recorded herein was 101.7 MgC ha−1, contrasting with values of 264.6 MgC ha−1 in the Gulf of Mexico, 258.5 MgC ha−1 in the southern Pacific of Mexico [43], 432.3 MgC ha−1 in Brazil, 507.7 MgC ha−1 in Ecuador, and 648.2 MgC ha−1 in Colombia [18]. Arid zones produce physiological stress in mangrove trees as low freshwater availability and low humidity reduce photosynthetic carbon gain [45]. As a result, these mangroves have relatively low productivity compared to mangroves in humid regions [44].
Corg storage in blue carbon ecosystems mainly depends on community structural characteristics and extension [19]. Organic carbon stocks are low in arid zones due to the limited structural development and low sediment accumulation, as shown by Adame et al. [44] and reported for hyper-arid areas in the Red Sea and Arabian Gulf [46,47] and semi-arid Senegal [48], showing low soil carbon stocks compared to mangroves in humid regions. In addition, control sites (devoid of vegetation) adjacent to the mangrove had carbon stocks of 7.3 MgC ha−1, representing 14% of the values for mangrove areas. These findings support the recommendations for the conservation and restoration of degraded areas. Adame et al. [44] mentions that the low productivity of arid mangrove forests is 10 to 60 times higher compared to adjacent terrestrial ecosystems (6.5 MgC ha−1 in Southern Baja California and 18.7 MgC ha−1 in Baja California).
The study also confirmed hypothesis (ii) about the relationship between high BGC content and high root biomass since an inverse relationship between above-ground structural development and below-ground biomass was observed in the scrub mangrove studied, consistent with the findings reported by Virgulino-Júnior et al. [14] for the Ajuruteua Peninsula, Brazil, and Torres et al. [9] for the Gulf of California. Above-ground carbon recorded values of up to 29.95 and 26.3 MgC ha−1 (El Dátil and San Ignacio, respectively) and below-ground values of 79.1 MgC ha−1; these values are similar to those reported by Herrera-Silveira et al. [49] for above-ground (42.09 MgC ha−1) and below-ground (92.3 MgC ha−1) carbon in the north Pacific. Below-ground carbon in the study sites accounted for 74% of the total, similar to the value reported by Herrera Silveira et al. [19] of 77% for mangroves in Mexico.
Below-ground biomass is considered one of the five primary carbon reserves in forested areas [50]. This study estimated an average below-ground root biomass of 73.9 ± 16.6 Mg ha−1, similar to the figure reported by Torres et al. [9] for the Gulf of California (74.05 ± 15.2 Mg ha−1) and also within the range reported by Adame et al. [8] of 6.1 to 85.4 MgC ha−1. In addition, fine roots made the greatest contribution to the total root biomass, distributed mainly in the surface layer (upper 15 cm). Therefore, fine roots are a major component of below-ground Corg sequestration due to their high productivity and decomposition rates [51,52]. Root biomass decreased with depth, as reported by Castañeda-Moya et al. [32] for Florida, USA, Torres et al. [9] for the Gulf of California, and Torres et al. [16] for the Gulf of Mexico.
Above-ground biomass is an important parameter to estimate carbon accumulation in a forest, and updated information is required to assess the importance of forest distribution on total biomass [53]. However, root biomass and its carbon content are higher than the above-ground biomass in scrub mangroves. For this reason, roots are highly important in carbon capture and storage in these arid regions due to their high rates of below-ground carbon rotation and fixation. In fact, higher below-ground carbon values relative to biomass have been reported in several studies of mangroves [54,55]. As forests age, forest biomass and C stocks increase. Our data indicate that mangrove Corg levels increase in the soil as roots grow, die, and accumulate [18]. Carbon in plant biomass is stored for years or decades, while carbon in soil can remain sequestered for millennia [56].
The total carbon values of the present study are similar to those recorded in other arid zone regions; for example, Kauffman et al. [57] recorded values of 217 Mg C/ha on average in hyperarid and hypersaline regions of the Middle East mangroves; Schile et al. [47] identified total carbon stores of 218.4 Mg C/ha in mangroves in arid areas of the United Arab Emirates; Kauffman and Bhomia [48] in 2017 recorded carbon stores of 463 Mg C ha−1 for mangroves in arid environments in Senegal. It must be considered that these studies include values for the mass of dead and downed wood. Arid zone mangroves have low carbon stores relative to mangroves in tropical temperate regions, as identified in Central/West Africa mangroves with 801 Mg C/ha and those of Central/North America and Southeast Asia with 949 and 1017 Mg C/ha, respectively.
Separating dead from live roots is necessary for estimating below-ground carbon stocks [8]. Chalermchatwilai et al. [58] reported 28% of dead roots in relation to live roots for Rhizophora forests, similar to the percentage observed in the present study (21.8%). Moreover, dead root contents do not decrease with depth, similar to the findings observed by Torres et al. [9] for the Gulf of California. This can be attributed to different root decomposition rates according to mangrove species, forest age, and soil composition [8,59].
Mangrove blue carbon stocks are the sum of carbon stored in tree shoots, roots, downed wood, and soil [56]; their dynamics are based on long periods of gradual biomass buildup (a sink) [60]. The present study did not consider carbon associated with the downed wood stock; this component represents up to 12% of the Corg above-ground reservoir [19].

5. Conclusions

The present study provides valuable information on carbon in mangrove biomass and carbon stored in the soil. We identified that below-ground biomass (roots) is inversely related to above-ground structural development, with an average carbon stock of 101.7 MgC ha−1. The below-ground carbon content estimated (roots, necromass, and soil) was 2.8 times higher than the above-ground carbon content (trees and leaf litter). The control sites (devoid of vegetation) adjacent to the mangrove recorded carbon stocks of 14% relative to the mangrove forest, supporting the recommendations to conserve and restore degraded areas aiming to build carbon stocks. Managing coastal ecosystems for carbon sequestration services in arid environments requires identifying the factors that account for their relatively small soil carbon pools [47]. The methods for studying scrub mangroves growing in arid zones should be standardized. Moreover, it is recommended to carry out studies that contemplate the variation of carbon flows (leaf litter) over time and include dead wood and detritus carbon to better understand the distribution of carbon stocks in the mangrove ecosystem.

Author Contributions

J.R.T.: conceptualization, methodology, investigation, supervision, formal analysis, writing, and funding acquisition. T.F.-I.: conceptualization, methodology, supervision, and writing. C.O.-T.: formal analysis, R.H.B.-G.: formal analysis, writing—review and editing, visualization, and writing—original draft. Z.M.S.-M.: formal analysis, investigation, and writing—original draft. F.C.-L.: formal analysis, validation, and visualization. All authors have read and agreed to the published version of the manuscript.

Funding

This research was fully funded by CostaSalvaje/WildCoast, an international team that conserves and restore degraded areas aiming to build carbon stocks. COSTASALVAJE has been engaged in initiatives like mangrove restoration efforts in the region starting from 2019. https://costasalvaje.org/ (accessed on 16 November 2023), Contacto en info@costasalvaje.org.

Institutional Review Board Statement

Not applicable for studies not involving humans or animals.

Informed Consent Statement

Not applicable.

Data Availability Statement

Data support can be requested by email to the main author, clearly specifying the desired data.

Acknowledgments

The authors are grateful for the support of the Coastal Zone Ecology Laboratory (LEZCO) of the Yaqui Valley Technological Institute, as well as the residents of the Biology course for processing the field samples: Cota Herrera Rolando and Christian Alejandro Aguilera Bórquez.

Conflicts of Interest

The authors declare no conflict of interest. The funders had no role in the design of the study, in the collection, analysis, or interpretation of data, in the writing of the manuscript, or in the decision to publish the results.

References

  1. IPCC. Summary for Policymakers. In Climate Change 2021: The Physical Science Basis. Contribution of Working Group I to the Sixth Assessment Report of the Intergovernmental Panel on Climate Change; Masson-Delmotte, V.P., Zhai, A., Pirani, S.L., Connors, C., Péan, S., Berger, N., Caud, Y., Chen, L., Goldfarb, M.I., Gomis, M., et al., Eds.; Cambridge University Press: Cambridge, UK, 2021; p. 1535. Available online: https://reliefweb.int/report/world/climate-change-2021-physical-science-basis?gclid=CjwKCAjw_aemBhBLEiwAT98FMjxUZr_pmpK8C-rVg3xi3xAj2FZa2Eeh6RsAnFdFezGlI_Om__tSxBoCK4AQAvD_BwE (accessed on 16 November 2023).
  2. Canadell, J.G.; Raupach, M.R. Managing forests for climate change mitigation. Science 2008, 320, 1456–1457. [Google Scholar] [CrossRef]
  3. Bulmer, R.H.; Stephenson, F.; Jones, H.F.E.; Townsend, M.; Hillman, J.R.; Schwendenmann, L.; Lundquist, C.J. Blue Carbon Stocks and Cross-Habitat Subsidies. Front. Mar. Sci. 2020, 7, 380. [Google Scholar] [CrossRef]
  4. McLeod, K.W.; Chmura, G.L.; Bouillon, S.; Salm, R.; Bjork, M.; Duarte, C.M.; Lovelock, C.E.; Schlesinger, W.H.; Silliman, B.R. A blueprint for blue carbon: Toward an improved understanding of the role of vegetated coastal hábitats in sequestering CO2. Front. Ecol. Environ. 2011, 9, 552–560. [Google Scholar] [CrossRef] [PubMed]
  5. Fourqurean, J.W.; Duarte, C.M.; Kennedy, H.; Marbà, N.; Holmer, M.; Mateo, M.A.; Apostolaki, E.T.; Kendrick, G.A.; Krause-Jensen, D.; McGlathery, K.J. Seagrass ecosystems as a globally significant carbon stock. Nat. Geosci. 2012, 5, 505–509. [Google Scholar] [CrossRef]
  6. Pendleton, L.; Donato, D.C.; Murray, B.C.; Crooks, S.; Jenkins, W.A.; Sifleet, S.; Craft, C.; Fourqurean, J.W.; Kauffman, J.B.; Marbà, N.; et al. Estimating global blue carbon emissions from conversion and degradation of vegetated coastal ecosystems. PLoS ONE 2012, 7, e43542. [Google Scholar] [CrossRef]
  7. Banerjee, K.; Sahoo, C.K.; Bal, G.; Mallik, K.; Paul, R.; Mitra, A. High blue carbon stock in mangrove forests of Eastern India. Trop. Ecol. 2019, 61, 150–167. [Google Scholar] [CrossRef]
  8. Adame, M.F.; Cherian, S.; Reef, R.; Stewart-Koster, B. Mangrove root biomass and the uncertainty of belowground carbon estimations. For. Ecol. Manag. 2017, 403, 52–60. [Google Scholar] [CrossRef]
  9. Torres, J.R.; Sanchez-Mejia, Z.M.; Arreola-Lizárraga, J.A.; Yépez, E.A.; Reynaga-Franco, F.D.; Choix, F.J. Root biomass and productivity in subtropical arid mangroves from the Gulf of California. Rhizosphere 2021, 18, 100356. [Google Scholar] [CrossRef]
  10. Osland, M.J.; Day, R.H.; Larriviere, J.C. Aboveground allometric models for freeze-affected black mangroves (Avicennia germinans): Equations for a climate sensitive mangrove-marsh ecotone. PLoS ONE 2014, 9, e99604. [Google Scholar] [CrossRef] [PubMed]
  11. Comley, B.W.T.; McGuinness, K.A. Above- and below-ground biomass, and allometry, of four common northern Australian mangroves. Aust. J. Bot. 2005, 53, 431–436. [Google Scholar] [CrossRef]
  12. Mitra, A.; Sengupta, K.; Banerjee, K. Standing biomass and carbon storage of above-ground structures in dominant mangrove trees in the Sundarbans. For. Ecol. Manag. 2011, 261, 1325–1335. [Google Scholar] [CrossRef]
  13. Njana, M.A.; Eid, T.; Zahabu, E.; Malimbwi, R. Procedures for quantification of belowground biomass of three mangrove tree species. Wetl. Ecol. Manag. 2015, 23, 749–764. [Google Scholar] [CrossRef]
  14. Virgulino-Júnior, P.C.C.; Carneiro, D.N.; Nascimento, W.R., Jr.; Cougo, M.F.; Fernandes, M.E.B. Biomass and carbon estimation for scrub mangrove forests and examination of their allometric associated uncertainties. PLoS ONE 2020, 15, e0230008. [Google Scholar] [CrossRef] [PubMed]
  15. Matsui, N. Estimated stocks of organic carbon in mangrove roots and sediments in Hinchinbrook Channel, Australia. Mangroves Salt Marshes 1998, 2, 199–204. [Google Scholar] [CrossRef]
  16. Torres, J.R.; Barba, E.; Choix, F.J. Production and biomass of mangrove roots in relation to hydroperiod and physico-chemical properties of sediment and water in the Mecoacan Lagoon, Gulf of Mexico. Wetl. Ecol. Manag. 2019, 27, 427–442. [Google Scholar] [CrossRef]
  17. Nguyen, H.T.; Stanton, D.E.; Schmitz, N.; Farquhar, G.D.; Ball, M.C. Growth responses of the mangrove Avicennia marina to salinity: Development and function of shoot hydraulic systems require saline conditions. Ann. Bot. 2015, 115, 397–407. [Google Scholar] [CrossRef]
  18. Alongi, D.M. Global Significance of Mangrove Blue Carbon in Climate Change Mitigation. Sci 2020, 2, 67. [Google Scholar] [CrossRef]
  19. Herrera-Silveira, J.A.; Pech-Cardenas, M.A.; Morales-Ojeda, S.M.; Cinco-Castro, S.; Camacho-Rico, A.; Caamal Sosa, J.P.; Mendoza-Martinez, J.E.; Pech-Poot, E.Y.; Montero, J.; Teutli-Hernandez, C. Blue carbon of Mexico, carbon stocks and fluxes: A systematic review. PeerJ 2020, 8, e8790. [Google Scholar] [CrossRef]
  20. Félix-Pico, E.; Serviere-Zaragoza, E.; Riosmena-Rodriguez, R.; León-DeLaCruz, J. Los Manglares de la Península de Baja California. Interdisciplinary Center for Marine Sciences, Biological Research Center of the Northwest S.C. and the Autonomous University of Baja California. 2011. Available online: http://dspace.cibnor.mx:8080/handle/123456789/1400 (accessed on 16 November 2023).
  21. CONABIO. Sección Mexicana del Consejo Internacional para la Preservación de las Aves CIPAMEX- Comisión Nacional para el Conocimiento y Uso de la Biodiversidad. Áreas de Importancia para la Conservación de las Aves. Financiado por CONABIO-FMCN-CCA. 1999. Available online: http://conabioweb.conabio.gob.mx/aicas/doctos/aicas.html (accessed on 16 November 2023).
  22. DOF. Decreto Por el Que se Declara la Reserva de la Biosfera “El Vizcaíno”, Ubicada en el Municipio de Mulegé, B.C.S. 1988. Available online: https://dof.gob.mx/nota_detalle.php?codigo=4794242&fecha=05/12/1988#gsc.tab=0 (accessed on 16 November 2023).
  23. Ruiz-Luna, A.; Acosta-Velázquez, J. Sitios de Manglar con Relevancia Biológica y Con Necesidades de Rehabilitación Ecológica, San Ignacio (Bocana-Dátil) PN07. CONABIO, México, D.F. 2009. Available online: https://bioteca.biodiversidad.gob.mx/janium/Documentos/15068.pdf (accessed on 16 November 2023).
  24. RAMSAR. Sistema Lagunar San Ignacio—Navachiste—Macapule, Fecha de Designación: 02-02-2004. 2008. Available online: https://rsis.ramsar.org/RISapp/files/RISrep/MX1341RIS.pdf (accessed on 16 November 2023).
  25. Moreno-Casasola, P.; Warner, B. Breviario Para Describir, Observar y Manejar Humedales. México: RAMSAR Instituto de Ecología A.C., CONANP, US Fish and Wildlife Service US State Department. 2009. Available online: http://www1.inecol.edu.mx/inecol/libros/Breviario_Humedales.pdf (accessed on 16 November 2023).
  26. Klute, A. Methods of soils analysis. Part 1. In Physical and Mineralogical Methods, 2nd ed.; EUA: Madison, WI, USA, 1986; p. 1188. [Google Scholar]
  27. Heiri, O.; Lotter, A.F.; Lemcke, G. Loss on ignition as a method for estimating organic and carbonate content in sediments: Reproducibility and comparability of results. J. Paleolimnol. 2001, 25, 101–110. [Google Scholar] [CrossRef]
  28. Infante, M.D. Estructura y Dinámica de las Selvas Inundables de la Planicie Costera Central del Golfo de México. Doctoral Thesis, INECOL. A. C., Jalapa, Mexico, 2011. [Google Scholar]
  29. Velázquez-Salazar, S.; Rodríguez-Zúñiga, M.T.; Alcántara-Maya, J.A.; Villeda-Chávez, E.; Valderrama-Landeros, L.; Troche-Souza, C.; Vázquez-Balderas, B.; Pérez-Espinosa, I.; Cruz-López, M.I.; Ressl, R.; et al. Mangroves of Mexico. Data Update and Analysis 2020. Comisión Nacional para el Uso y Conservación de la Biodiversidad. Mexico CDMX. p. 168. 2021. Available online: https://bioteca.biodiversidad.gob.mx/janium/Documentos/15638.pdf (accessed on 16 November 2023).
  30. Mostacedo, B.; Fredericksen, T. Manual de Métodos Básicos de Muestreo y Análisis en Ecología Vegetal; BOLFOR: Santa Cruz, Bolivia, 2000; p. 87. Available online: https://pdf.usaid.gov/pdf_docs/PNACL893.pdf (accessed on 16 November 2023).
  31. Barrios-Calderón, R.J. Combustibles Forestales y su Relación con Incendios en Humedales de la Reserva de la Biósfera la Encrucijada, Chiapas. Master’s Thesis in Natural Resources and Rural Development. El Colegio de la Frontera Sur. Tapachula, Chiapas, Mex. p. 203. 2015. Available online: https://ecosur.repositorioinstitucional.mx/jspui/bitstream/1017/2003/1/100000056605_documento.pdf (accessed on 16 November 2023).
  32. Castañeda-Moya, E.; Twilley, R.R.; Rivera-Monroy, V.H.; Marx, B.D.; Coronado- Molina, C.; Ewe, S.M. Patterns of root dynamics in mangrove forests along environmental gradients in the Florida coastal Everglades, USA. Ecosystems 2011, 14, 1178–1195. [Google Scholar] [CrossRef]
  33. Smith, T.J., III; Whelan, K.R. Development of allometric relations for three mangrove species in South Florida for use in the Greater Everglades Ecosystem restoration. Wetl. Ecol. Manag. 2006, 14, 409–419. [Google Scholar] [CrossRef]
  34. Howard, J.; Hoyt, S.; Isensee, K.; Telszewski, M.; Pidgeon, E. (Eds.) Coastal Blue Carbon: Methods for Assessing Carbon Stocks and Emissions Factors in Mangroves, Tidal Salt Marshes, and Seagrasses; Conservation International; Intergovernmental Oceanographic Commission of UNESCO; International Union for Conservation of Nature: Arlington, VA, USA, 2014; Available online: https://www.cifor.org/knowledge/publication/5095/ (accessed on 16 November 2023).
  35. Kauffman, J.B.; Cummings, D.L.; Ward, D.E.; Babbitt, R. Fire in the Brazilian Amazon: 1. Biomass, nutrient pools, and losses in slashed primary forests. Oecologia 1995, 104, 397–408. [Google Scholar] [CrossRef] [PubMed]
  36. Kauffman, J.B.; Donato, D.C. Protocols for the Measurement, Monitoring and Reporting of Structure, Biomass and Carbon Stocks in Mangrove Forests; CIFOR: Bogor, Indonesia, 2012; Available online: https://www.cifor.org/publications/pdf_files/WPapers/WP86CIFOR.pdf (accessed on 16 November 2023).
  37. Jaramillo, V.J.; Kauffman, J.B.; Rentería-Rodríguez, L.; Cummings, D.L.; Ellingson, L.J. Biomass, carbon, and nitrogen pools in Mexican tropical dry forest landscapes. Ecosystems 2003, 6, 609–629. [Google Scholar] [CrossRef]
  38. Marín-Muñiz, J.L.; Hernández, M.E.; Moreno-Casasola, P. Comparing soil carbon sequestration in coastal freshwater wetlands with various geomorphic features and plant communities in Veracruz, Mexico. Plant Soil 2014, 378, 189–203. [Google Scholar] [CrossRef]
  39. Mokany, K.; Raison, R.J.; Prokushkin, A.S. Critical analysis of root: Shoot ratios in terrestrial biomes. Glob. Change Biol. 2006, 12, 84–96. [Google Scholar] [CrossRef]
  40. Steel, A.; Torrie, M. Bioestadística: Principios y Procedimientos; México, D.F., Ed.; McGrawHill: New York, NY, USA, 1996. [Google Scholar]
  41. Lovelock, C.E.; Feller, I.C.; Ball, M.C.; Ellis, J.; Sorrell, B. Testing the Growth Rate vs. Geochemical Hypothesis for latitudinal variation in plant nutrients. Ecol. Lett. 2007, 10, 1154–1163. [Google Scholar] [CrossRef]
  42. Torres, J.R.; Barba, E.; Infante-Mata, D.; Sánchez, A.J. Primary productivity of the mangrove and its relationship with the population dynamics of shrimp (Decapoda: Penaeidae) in a coastal lagoon of the Gulf of Mexico. Áreas Nat. Protegidas Scr. 2022, 8, 91–107. [Google Scholar] [CrossRef]
  43. Lugo, A.E.; Snedaker, S.C. The ecology of mangroves. Annu. Rev. Ecol. Syst. 1974, 5, 39–64. [Google Scholar] [CrossRef]
  44. Adame, M.F.; Reef, R.; Santini, N.S.; Najera, E.; Turschuell, M.P.; Hayes, M.A.; Masque, P.; Lovelock, C.E. Mangroves in Arid Regions: Ecology, Threats, and Opportunities. Estuar. Coast. Shelf Sci. 2020, 248, 106796. [Google Scholar] [CrossRef]
  45. Ball, M.C. Patterns of secondary succession in a mangrove forest of southern Florida. Oecología 1980, 44, 226–235. [Google Scholar] [CrossRef]
  46. Almahasheer, H.; Serrano, O.; Duarte, C.M.; Arias-Ortiz, A.; Masque, P.; Irigoien, X. Low carbon sink capacity of Red Sea mangroves. Sci. Rep. 2017, 7, 9700. [Google Scholar] [CrossRef] [PubMed]
  47. Schile, L.M.; Kauffman, J.B.; Crooks, S.; Fourqurean, J.W.; Glavan, J.; Megonigal, J.P. Limits on carbon sequestration in arid blue carbon ecosystems. Ecol. Appl. 2017, 27, 859–874. [Google Scholar] [CrossRef] [PubMed]
  48. Kauffman, J.B.; Bhomia, R.K. Ecosystem carbon stocks of mangroves across broad environmental gradients in West-Central Africa: Global and regional comparisons. PLoS ONE 2017, 12, e0187749. [Google Scholar] [CrossRef] [PubMed]
  49. Herrera-Silveira, J.A.; Camacho-Rico, A.; Pech, E.; Pech, M.; Ramírez-Ramírez, J.; Teutli-Hernández, C. Dinámica del carbono (almacenes y flujos) en manglares de México. Terra Latinoam. 2016, 34, 61–72. Available online: https://www.terralatinoamericana.org.mx/index.php/terra/article/view/76/82 (accessed on 16 November 2023).
  50. IPCC. IPCC Guidelines for National Greenhouse Gas Inventories—A Primer, Prepared by the National Greenhouse Gas Inventories Programme; Eggleston, H.S., Miwa, K., Srivastava, N., Tanabe, K., Eds.; IGES: Hayama, Japan, 2009. Available online: https://www.ipcc-nggip.iges.or.jp/support/Primer_2006GLs.pdf (accessed on 16 November 2023).
  51. Ouyang, X.; Lee, S.Y.; Connolly, R.M. The role of root decomposition in global mangrove and saltmarsh carbon budgets. Earth Sci. Rev. 2017, 166, 53–63. [Google Scholar] [CrossRef]
  52. Torres, J.R.; Infante-Mata, D.M.; Sánchez, A.J.; Espinoza-Tenorio, A.; Barba, E. Degradación de hojarasca y aporte de nutrientes del manglar en la Laguna Mecoacán, Golfo de México. Rev. Biol. Trop. 2018, 66, 892–907. [Google Scholar] [CrossRef]
  53. Wijaya, A.; Liesenberg, V.; Gloaguen, R. Retrieval of forest attributes in complex successional forests of Central Indonesia: Modeling and estimation of bitemporal data. For. Ecol. Manag. 2010, 259, 2315–2326. [Google Scholar] [CrossRef]
  54. Hamilton, S.; Friess, D.A. Global carbon stocks and potential emissions due to mangrove deforestation from 2000 to 2012. Nat. Clim. Chang. 2018, 8, 240–244. [Google Scholar] [CrossRef]
  55. Senger, D.F.; Saavedra-Hortua, D.A.; Engel, S.; Schnurawa, M.; Moosdorf, N.; Gillis, L.G. Impacts of wetland dieback on carbon dynamics: A comparison between intact and degraded mangroves. Sci. Total Env. 2021, 753, 141817. [Google Scholar] [CrossRef]
  56. Ahalya, A.; Park, J.S. Blue Carbon Stock of Mangrove Ecosystems. Int. J. Sci. Res. 2018, 8, 1371–1375. Available online: https://www.ijsr.net/getabstract.php?paperid=ART20203497 (accessed on 16 November 2023).
  57. Kauffman, J.B.; Adame, M.F.; Arifanti, V.D.; Schile-Beers, L.M.; Bernardino, A.F.; Bhomia, R.K.; Donato, D.C.; Feller, I.C.; Ferreira, T.O.; Garcia, M.C.; et al. Total ecosystem carbon stocks of mangroves across broad global environmental and physical gradients. Ecol. Monogr. 2020, 90, 1–18. [Google Scholar] [CrossRef]
  58. Chalermchatwilai, B.; Poungparn, S.; Patanaponpaiboon, P. Distribution of fine-root necromass in a secondary mangrove forest in Trat province, Eastern Thailand. ScienceAsia 2011, 37, 1–5. [Google Scholar] [CrossRef]
  59. Kairo, J.G.; Bosire, J.; Langat, J.; Kirui, B.; Koedam, N. Allometry and biomass distribution in replanted mangrove plantations at Gazi Bay, Kenya. Aquat. Conserv. Mar. Freshw. Ecosyst. 2009, 19, S63–S69. [Google Scholar] [CrossRef]
  60. Omar, R.; Garza-Caligaris, J.F.; Kanninen, M.; Karjalainen, T.; Liski, J.; Nabuurs, G.J.; Pussinen, A.; Jong, B.H.J.; Mohren, G.M.J. Modeling carbon sequestration in afforestation, agroforestry and forest management projects: The CO2 FIX vol 2 approach. Ecol. Model. 2003, 164, 177–199. [Google Scholar] [CrossRef]
Figure 1. Location of the study sites. (monitoring sites numbered 1 to 6).
Ijpb 14 00078 g001
Figure 2. Soil leaf litter at each monitoring site (S = site).
Ijpb 14 00078 g002
Figure 3. Necromass content at sites by depth stratum.
Ijpb 14 00078 g003
Table 1. Allometric equations to estimate mangrove tree biomass.
Component Species Equation Reference
BA: Live treesRmB = 0.722*ρ*(DR)1.731Smith and
Whelan [33]
LrB = 0.362*ρ*(DS)1.92
Rm, R. mangle; Lr, L. racemosa; B, biomass; DR, diameter at 30 cm from the highest root; DS, diameter at breast height (cm); ρ = wood density (g cm−3).
Table 2. Physico-chemical characteristics of surface water at each monitoring site.
San Ignacio El Dátil
Site 1 Site 2 Site 3 Site 4 Site 5 Site 6 Fp-Value
pH 7.5 ± 0.02 7.6 ± 0.02 7.1 ± 0.09 6.6 ± 0.01 6.9 ± 0.1 6.5 ± 0.11 9.8 0.24
Temperature (°C) 20.1 ± 0.08 20.1 ± 0.1 20.4 ± 0.1 22.3 ± 0.07 22.6 ± 0.27 22.3 ± 0.08 11.2 0.04
Conductivity (mS/cm) 57 ± 1.3 58 ± 0.1 67 ± 4.6 59 ± 0.2 55 ± 0.2 57 ± 0.3 5.1 0.55
Salinity (PSU) 38 ± 1 38 ± 0.2 46 ± 3.6 40 ± 0.1 36 ± 0.2 38 ± 0.2 6.4 0.65
Redox potential (mV) −133 ± 2 −122 ± 3 −121 ± 3 −290 ± 1.4 −263 ± 4.4 −191 ± 4.2 7.4 0.62
PSU = practical salinity units, mV = millivolts, p < 0.05.
Table 3. Physico-chemical characteristics of interstitial water at each monitoring site.
San Ignacio El Dátil
Site 1 Site 2 Site 3 Site 4 Site 5 Site 6 Fp-Value
pH 6.5 ± 0.08 7 ± 0.08 6.9 ± 0.05 6.3.4 ± 0.1 6.5 ± 0.02 7.2 ± 0.14 14.1 0.43
Temperature (°C) 21 ± 0.1 22 ± 0.6 24 ± 1 25 ± 1 23 ± 0.3 21 ± 0.5 5.8 0.38
Conductivity (mS/cm) 58 ± 1.9 56 ± 1.3 54 ± 1.1 55 ± 0.1 56 ± 0.2 67 ± 2.5 3.8 0.08
Salinity (PSU) 38 ± 1.4 38 ± 1 36 ± 0.8 37 ± 0.1 37 ± 0.1 46 ± 2.3 4.2 0.06
Redox potential (mV) −134 ± 5.6 −133 ± 2.2 −130 ± 1.6 −416 ± 9.7 −338 ± 66 −112 ± 4.1 6.5 0.49
PSU = practical salinity units, mV = millivolts, p < 0.05.
Table 4. Physico-chemical characteristics of sediment in each monitoring site.
El Dátil San Ignacio
Site 1 Site 2 Site 3 Site 4 Site 5 Site 6 Control San Ignacio Control El Dátil Fp-Value
pH 7 ± 0.26 6 ± 0.24 7 ± 0.07 7 ± 0.06 7 ± 0.05 7 ± 0.11 9 ± 0.05 9 ± 0.17 24 <0.05
Humidity 0.37 ± 0.02 0.29 ± 0.01 0.29 ± 0.01 0.31 ± 0.03 0.35 ± 0.01 0.62 ± 0.01 0.16 ± 0.01 0.2 ± 0.02 22 <0.05
BD 0.9 ± 0.07 1.1 ± 0.06 1 ± 0.08 1.1 ± 0.07 1 ± 0.04 0.4 ± 0.02 1.1 ± 0.03 1.2 ± 0.01 16 0.06
OM 2.7 ± 0.5 1.5 ± 0.5 2.1 ± 0.3 3.1 ± 0.4 2.2 ± 0.3 14.8 ± 1.34 0.08 0.05 61 <0.05
Texture Sand 90 ± 1.1 88 ± 1.3 90 ± 0.5 82 ± 0.8 85 ± 0.8 85 ± 1.1 92 ± 0.9 93 ± 0.6 17 0.6
Silt 4 ± 0.8 4 ± 0.9 1 ± 0.5 6 ± 2.2 6 ± 0.5 3 ± 0.6 2 ± 0.4 1 ± 0.7 4.2 0.06
Clay 6 ± 0.5 8 ± 1.3 8 ± 0.5 12 ± 1.5 9 ± 1.1 12 ± 0.7 7 ± 0.7 6 ± 0.6 7.1 0.16
BD: bulk density; OM: organic matter; Rest: proposed sites for restoration.
Table 5. Structural attributes by species and site.
Site Species Density Height DS (cm) Baseline Area (ha) Cover (%/ha)
(Ind/ha) (m)
El DátilSite 1Rm 4200 1.1 ± 0.04 4.4 ± 0.27 4.5 ± 0.7 55 ± 10.8
Lr 1600 1.4 ± 0.1 8.1 ± 0.7 14 ± 2.3 43 ± 8.1
Site 2Rm 2300 0.8 ± 0.05 4.1 ± 0.27 3.7 ± 0.4 15 ± 0.9
Lr 1500 1.2 ± 0.1 4.3 ± 0.5 4 ± 0.9 10 ± 1
Site 3Rm 1700 0.6 ± 0.03 1.9 ± 0.2 0.8 ± 0.2 1 ± 0.4
Lr 3300 1.9 ± 0.1 6.9 ± 0.6 11 ± 1.4 40 ± 5.4
San IgnacioSite 4Rm 2200 0.7 ± 0.07 5.2 ± 0.37 5.9 ± 0.9 8 ± 1.5
Lr 1100 2.1 ± 0.1 8 ± 1.3 16 ± 2.7 76 ± 15.7
Site 5Rm 2800 1.2 ± 0.08 5.8 ± 0.5 7.8 ± 1.5 28 ± 4.8
Lr 1200 2.3 ± 0.1 7.9 ± 0.6 13 ± 1.9 35 ± 5.4
Site 6Rm 1800 1.6 ± 0.14 7.7 ± 0.33 12 ± 1 36 ± 5.9
Lr 700 2 ± 0.02 4.9 ± 0.3 5 ± 0.6 31 ± 1.1
DS: diameter of the stem; Rm: R. mangle; Lr: L. racemosa.
Table 6. Root biomass by diameter class and depth stratum.
El Datil San Ignacio
Root Class Stratum Site 1 Site 2 Site 3 Site 4 Site 5 Site 6 Fp-Value
Fine 0–15 1297 ± 329 1257 ± 276 1073 ± 367 867 ± 173 535 ± 130 1988 ± 264 1.5 0.24
15–30 2169 ± 257 1133 ± 302 937 ± 174 301 ± 57 618 ± 92 1476 ± 380 1.9 0.15
30–45 2708 ± 394 a 1038 ± 240 b 613 ± 83 b 517 ± 301 b 396 ± 75 b 934 ± 279 b 6.1 0.01
Sum 6174 ± 980 3428 ± 818 2623 ± 624 1685 ± 531 1549 ± 297 4398 ± 923
Medium 0–15 266 ± 60 217 ± 105 1187 ± 107 275 ± 91 237 ± 28 459 ± 106 9.9 0.16
15–30 237 ± 44 a 320 ± 265 ab 538 ± 128 b 432 ± 135 ab 331 ± 36 ab 293 ± 88 ab 1.6 0.01
30–45 293 ± 51 190 ± 52 356 ± 62 313 ± 76 147 ± 31 157 ± 42 1.1 0.46
sum 796 ± 155 727 ± 422 2081 ± 297 1020 ± 302 715 ± 95 909 ± 236
Large 0–15 1902 ± 339 1247 ± 362 885 ± 191 536 ± 116 720 ± 136 1195 ± 294 3.5 0.11
15–30 1142 ± 307 938 ± 306 880 ± 123 1622 ± 341 365 ± 73 1140 ± 256 1.3 0.12
30–45 1848 ± 243 738 ± 307 535 ± 204 1341 ± 325 300 ± 161 657 ± 196 1.9 0.13
Sum 4892 ± 889 2923 ± 975 2300 ± 518 3499 ± 782 1385 ± 370 2992 ± 746
TOTAL 11,862 ± 2024 7078 ± 2215 7004 ± 1439 6204 ± 1615 3649 ± 762 8299 ± 1905
Biomass in grams and letters show significant differences between sites.
Table 7. Biomass carbon by mangrove components (MgC ha−1).
Above-Ground Below-Ground
Site Structure Leaf Litter Roots Necromass Total
El Dátil 1 29.8 ± 3.6 0.15 ± 0.04 46.3 ± 7.9 11 ± 3 87.3 ± 14.5
2 11.4 ± 1.1 0.29 ± 0.09 27.6 ± 8.6 10.6 ± 2.4 49.9 ± 12.12
3 25.8 ± 3.7 0.45 ± 0.07 27.3 ± 5.6 5.9 ± 3.1 59.5 ± 12.5
San Ignacio 4 21.7 ± 3.7 0.47 ± 0.1 24.2 ± 6.3 5.2 ± 1.6 51.6 ± 11.7
5 26.2 ± 3.1 0.1 ± 0.02 14.2 ± 3 4.2 ± 0.6 44.7 ± 6.7
6 18.3 ± 1.6 0.56 ± 0.08 32.4 ± 7.4 11.4 ± 4.1 62.7 ± 13.2
Table 8. Total carbon in soil and percentage recorded at sampling sites.
El Dátil San Ignacio
Site 1 Site 2 Site 3 Control El Dátil Site 4 Site 5 Site 6 Control San Ignacio
Corg (%) 1.2 0.76 0.09 0.07 0.28 0.35 1.7 0
Corg (MgC ha−1) 75.6 31.13 5.7 7.3 28.9 16.2 96.9 0
Control = control sites for restoration.
Table 9. Comparison of above- and below-ground carbon content (MgC ha−1).
Site AGC BGC Total CorgRoot/Shoot 1Root/Shoot 2
El Dátil Site 1 29.95 132.9 162.9 1.9 4.4
Site 2 11.69 69.33 81.1 3.3 5.9
Site 3 26.25 38.9 65.2 1.3 1.5
San Ignacio Site 4 22.17 58.3 80.5 1.3 2.6
Site 5 26.3 34.6 60.9 0.7 1.3
Site 6 18.86 140.7 159.6 2.3 7.5
1 Carbon ratio in above- and below-ground biomass. 2 Carbon ratio in above- and below-ground biomass, including carbon in underground soil.
Disclaimer/Publisher’s Note: The statements, opinions and data contained in all publications are solely those of the individual author(s) and contributor(s) and not of MDPI and/or the editor(s). MDPI and/or the editor(s) disclaim responsibility for any injury to people or property resulting from any ideas, methods, instructions or products referred to in the content.

