Article

Absorption Spectra as Predictors of Algal Biomass and Pigment Content of the Cultured Microalgae Amphidinium carterae, Isochrysis galbana, Nephroselmis sp., and Anabaena sp.

by
George N. Hotos
1,* and
Vlasoula Bekiari
2
1
Plankton Culture Laboratory, Department of Fisheries and Aquaculture, University of Patras, 30200 Messolonghi, Greece
2
Department of Agriculture, University of Patras, 30200 Messolonghi, Greece
*
Author to whom correspondence should be addressed.
Int. J. Plant Biol. 2023, 14(4), 879-895; https://doi.org/10.3390/ijpb14040065
Submission received: 12 September 2023 / Revised: 24 September 2023 / Accepted: 25 September 2023 / Published: 26 September 2023
(This article belongs to the Special Issue Microalgae as a Powerful Tool for Biopharming Development)

Abstract

:
Background: In the search of a rapid and representative method for the approximate calculation of culture density and cell content of useful pigments, the study of absorption spectra of cultures of the dinoflagellate Amphidinium carterae, the haptophyte Isochrysis galbana, the chlorophyte Nephroselmis sp., and the filamentous cyanobacterium Anabaena sp. were selected as representative species of different taxa. Methods: The experimental cultures were established in small volumes by the discontinuous method under 20–21 °C, salinity of 30 or 40 ppt, and 2000 or 8000 lux illumination, and the absorbance spectra, density of the culture and concentration of the extracted pigments chlorophyll, total carotenoids, and phycocyanin were recorded during cultivation. Results: Algal density can be predicted sufficiently correctly because the regression equation of the correlation of the OD value of 750 nm from each absorption spectrum and the measured algal biomass was very strong. The same is true for the corresponding correlations between OD 750 nm and the detected pigments. Conclusions: Absorption spectra of microalgal cultures can be a simple, inexpensive, and non-invasive method for the growers to obtain the necessary information for predicting the right time to collect an ideal combination of maximum biomass and useful pigments, provided that the interpretation of the spectra is performed according to the method described herein.

1. Introduction

Microalgae are widely grown throughout the world to either produce raw biomass that can be fed to other organisms (such as rotifers in fish farms, mollusks, and crustaceans) or processed biomass that can be used to extract useful chemical molecules (such as biological pigments, biofuels, proteins, etc.) from the biomass [1,2,3,4,5,6,7]. It is essential to precisely and efficiently quantify the biomass of cultivated algae in order to assess their growth performance and gather information on their physiological and biochemical processes. An algae culture’s growth can be monitored using both invasive and non-invasive methods, whether it is in a laboratory for research or an industrial plant for production. Which approach is more efficient relies on how carefully the operators use the techniques and how sensitive they are. Noninvasive methods include measuring optical absorbance in a spectrophotometer [8,9,10], fluorescence spectroscopy [11], and quantifying cells with a hemocytometer [12,13,14,15,16,17]. Any other method that necessitates smashing cells and chemically analyzing their contents (such as those involving pigments, lipids, proteins, etc.) is intrusive. The microalgal cell density can be precisely calculated by counting the cells with a hemocytometer [18,19] or by filtering and weighing the sample after it has dried. Cell counting is considered the most accurate method, although it takes a long time, is prone to misinterpretation, and is not suitable for microalgae that are filamentous, concatenated, or agglomerated [18]. In addition, both cell counting and weighing require some time to prepare and perform, and the challenge increases when there are many samples. Although cell counting based on the principle of suspended particle counting has recently been simplified and made more accurate with a flow cytometer [20,21], the method still requires an expensive, fine calibrated instrument, trained personnel, and can be used mainly only with unicellular microalgae [22,23]. However, the determination of the optical density of the sample using a spectrophotometer greatly simplifies the problem, since the optical density value can be very easily related to either dry weight or cell density if the necessary regression equations have been developed beforehand [9,10,17,24,25]. But in addition to biomass estimation at a single wavelength, the absorption spectrum can also be used to obtain relevant information about the composition of photosynthetic pigments. In order to harvest the biomass from a practical and cultural standpoint, it is essential to understand when the desired pigment reaches its peak concentration in the cells. Continuing the cultivation would be a waste of time, effort, and resources with no added benefit. We have no doubt that by simply looking at the absorption spectra, we can determine the density of the culture, the time at which certain pigments reach their peak, and the best time to harvest. This is based on our extensive observations of absorption spectra over a long period of time in various microalgal species. Estimating the peak of pigments from spectra can save growers time and money, even though it cannot entirely replace an elaborate analytical methodology of extracting pigments and using either spectrophotometry (as in our case) or HPLC. However, prior research on individual microalgal species is necessary for the proper application of this method in order to understand how their culture develops under different environmental conditions and how their pigment concentration changes over time. In the current work, we have examined a number of microalgae (eukaryotic and cyanobacterial), all of which have been preliminary shown to be easily cultured [26,27] and produce useful amount of pigments [28]. We investigated how the absorption spectra change during the cultivation period for a given set of environmental factors (salinity, temperature, white light intensity) for each particular species. As illumination is a highly representative and influential condition for cultivation, we evaluated the change in spectra during the cultivation period, by comparing two different lighting situations in the case of the cyanobacterium Anabaena sp. The results of the current study can be used as a planning tool for mass production of the microalgae described herein, as well as other microalgae that are first subjected to a similar treatment. This study aims to give growers a quick and efficient way to assess culture conditions and predict biomass and pigment content with a reasonable degree of accuracy by using the absorption (optical density-OD) values at 750 nm extracted from the spectra in combination with parallel cell density calculations and pigments concentration analyses in order to construct initial calibration curves. Then, by using the appropriate regression equations culture density or pigment content can be calculated. Thus, the growers can determine the best time to achieve the perfect combination of microalgae quantity and/or pigment content by evaluating the changes in absorption spectra in the course of their cultivation.

2. Materials and Methods

2.1. Origination of the Microalgae

The species of marine microalgae used in this study were the Nephroselmis sp. (Chlorophyta), Amphidinium carterae (Miozoa), Isochrysis galbana (Haptophyta), and Anabaena sp. (Cyanobacteria). All 4 species were isolated from a survey in the lagoon of Messolonghi (W. Greece, 38°20′05.16″ N, 21°25′28.51″ E) [28,29] and were kept in the laboratory as monocultures.

2.2. Culture Conditions

All were batch cultured indoors (Figure 1) in an air-conditioned room at 20–21 °C, at a salinity of 30 ppt (Amphidinium) or 40 ppt (Nephroselmis, Isochrysis, Anabaena), and 8000 lux white light intensity, while for Anabaena 2000 lux were also used. One-liter glass Erlenmeyer flasks or specially configured 1 L plastic bottles (for Amphidinium) were used, filled to the 0.9 L mark with previously sterilized water enriched with Walne’s medium. Walne’s medium formula [30] consists of 3 final stock solutions A, B, and C, each of which was employed in a ratio of 1 mL per liter of culture water. Basic nutrients N, P, and K comprise solution A made by dilution of 300 g of NaNO3, 20 g of NH4Cl, and 30 g of KH2PO4 (Merck, Darmstadt, Germany) in 1 L of distilled water. Trace elements (Merck, Germany) in solution B include ZnSO4·H2O (30 g), CuSO4·5H2O (25 g), CoSO4·7H2O (30 g), and MnSO4·H2O (20 g) diluted in 1 L of distilled water. Vitamin B12 (100 mg), biotin (100 mg), and thiamine (10 mg) (Merck, Germany) diluted in 1 L of distilled water make up solution C. Cultures and measurements of the various analyses were performed in triplicates.
White light emitted by an array of 20 Watt 1600 lm LED lamps was used and the desired intensities of 40 and 160 μmol photons m−2 s−1 (2000 and 8000 lux, respectively, in the case of Anabaena) were attained by properly placing the vessels at the proper distance from the lamps (8 cm for attaining 8000 lux, 40 cm for attaining 2000 lux). Intensity was measured at the middle of the outer surface of the vessels by means of a luminometer (BIOBLOCK LX-101, Panasonic, Kadoma, Japan). The illumination period of 16h:8hD was controlled by an electric timer switching the lamps on/off appropriately. The cultures were kept in suspension by means of bubbling air (with its natural CO2 level) through a 2 mL glass pipettes (one in every vessel) at a rate of half culture volume/min. The pipettes were connected through sterilized plastic hoses to the 0.45 μm filtered central air supply system fed by a blower.
A. carterae was cultured for 15 days in 1 L plastic bottles with a salinity of 30 ppt and 8000 lux of illumination. I. galbana was cultured for 16 days in 40 ppt salinity, 8000 lux illumination, and 1 L glass Erlenmeyer flasks. Nephroselmis sp. was cultured for 19 days in 1 L glass Erlenmeyer flasks at a salinity of 40 ppt with 8000 lux illumination. The culture of Anabaena sp. lasted 15 days and was performed in 40 ppt salinity, illuminations of 2000 and 8000 lux, and using 1 L glass Erlenmeyer flasks for each set of illumination. All parameters were examined and recorded separately for each of the light intensities except for the correlation of the dry weight—OD 750 nm where pooled data from both intensities were used.

2.3. Estimation of Culture Density and Absorption Spectra

Daily cell counting with a Fuchs-Rosenthal hematocytometer for single-celled species and drying-weighing a sample filtrate of the filamentous cyanobacterium every 3–4 days were used to measure algal growth, which was measured as either cells/mL for single-celled microalgae or dry weight (g/L) for the filamentous cyanobacterium [17,26]. At the same time, the optical density at 750 nm [27] was recorded in the spectrophotometer (for all species). For the calculation of each sample’s density as dry weight per liter, a known volume of culture was filtered using 0.45 m GF/C filters in a vacuum pump (Heto-SUE-3Q) to determine the dry weight. The filters were washed with 5% (wt/v) ammonium formate [26,31,32] to remove salts and then placed at 100 °C in an oven for two hours. The dry weight was then calculated as g/L after they had been weighted to the fourth decimal digit. Using untreated culture samples, the absorption spectra from 300 to 750 nm of the cultures at different stages of maturation were recorded in a Shimadzu UV-1800 (Kyoto, Japan) spectrophotometer, and the data were transformed using its UVprobe 3.2 software.

2.4. Pigment Analyses

Chlorophyll-a and total carotenoids in the case of the cyanobacterium Anabaena sp. were extracted with absolute methanol from centrifuged culture samples. In brief, 2 mL of cyanobacterial culture was centrifuged at 5000 rpm (2795× g) for 7 min and then 2 mL of methanol pre-cooled at 4 °C was added to the sediment and vigorously homogenized. Then, the tube was covered with foil and incubated for 20 min. at 4 °C. The mixture was centrifuged at 5000 rpm (2795× g) at 4 °C for 7 min and the supernatant was measured in the spectrophotometer. Their concentrations (μg/mL) were determined using the following equations [31]:
chl-a = 12.9447 (A665 − A720)
T o t a l   c a r o t . = 1000 A 470 A 720 2.86 ( c h l o r . a ) 221  
where: (A) stands for the absorbance (or optical density-OD) of the processed sample at the indicated wavelength using a Shimadzu UVmini-1240 UV-visible (Kyoto, Japan) spectrophotometer.
Chlorophyll-a, chlorophyll-b, and total carotenoids in the case of the chlorophyte Nephroselmis sp. were extracted with DMSO from centrifuged culture samples. In brief, 2 mL of algal culture was centrifuged at 5000 rpm (2795× g) for 7 min and then 2 mL of prewarmed at 60 °C DMSO was added to the sediment and vigorously homogenized. Then, the tube was covered with foil and incubated for 10 min. at 50 °C. The mixture was centrifuged at 5000 rpm (2795× g) for 5 min and the supernatant was measured in the spectrophotometer. Their concentrations (μg/mL) were determined using the following equations [14]:
chl-a = 12.47(A665) − 3.62(A649)
chl-b = 25.06(A649) − 6.5(A665)
T o t a l   c a r o t . = 1000 A 480 ) 1.29 ( c h l o r . a 53.78 c h l o r . b 220
Chlorophyll-a and total carotenoids in the case of the dinophyte A. carterae and the haptophyte I. galbana were extracted with DMSO and determined as above, but for chlorophyll-c, the extraction was performed with methanol at 20 °C and its concentration (μg/mL) was determined according to the equation [33]:
chl-c = 23.5902(A630) − 7.8516(A647) − 1.5214(A664) − 1.7443(A691)
The phytocyanin (PC) content was extracted by freezing (−20 °C) for 24 h a concentrated known amount of culture in 0.1 M sodium phosphate buffer (pH 7.1) as solvent at a ratio of 1:10 (algal mass: solvent), and then thawing at 4 °C in the dark. The freezing and thawing process was repeated over the period of two days. The sample’s slurry was then centrifuged for 5 min at 3000 rpm (1006× g), and the supernatant’s concentration of phycocyanin (measured in mg/mL) was calculated using the formula [34]:
P C = A 615 0.474 ( A 652 ) 5.34
From the above equation the yield in phycocyanin (PC) in mg PC/g dry weight was calculated using the equation [34]:
P C y i e l d = P C m g m L × V ( m L ) D . W . ( g )
where: PCyield = mg of phycocyanin per g algal dry weight
V = volume of solvent used (mL)
D.W. = grams of dry weight of the algal mass used

2.5. Statistics

Statistical calculations of regression lines, Pearson’s correlation coefficient, standard deviation (SD), and standard error (SE) were made with Excel (Version 2019, Microsoft, Redmond, WA, USA). For comparisons of pigment content ANOVA was used followed by pair wised Tukey’s test using the free PAST3 software (Version 4.90).

3. Results

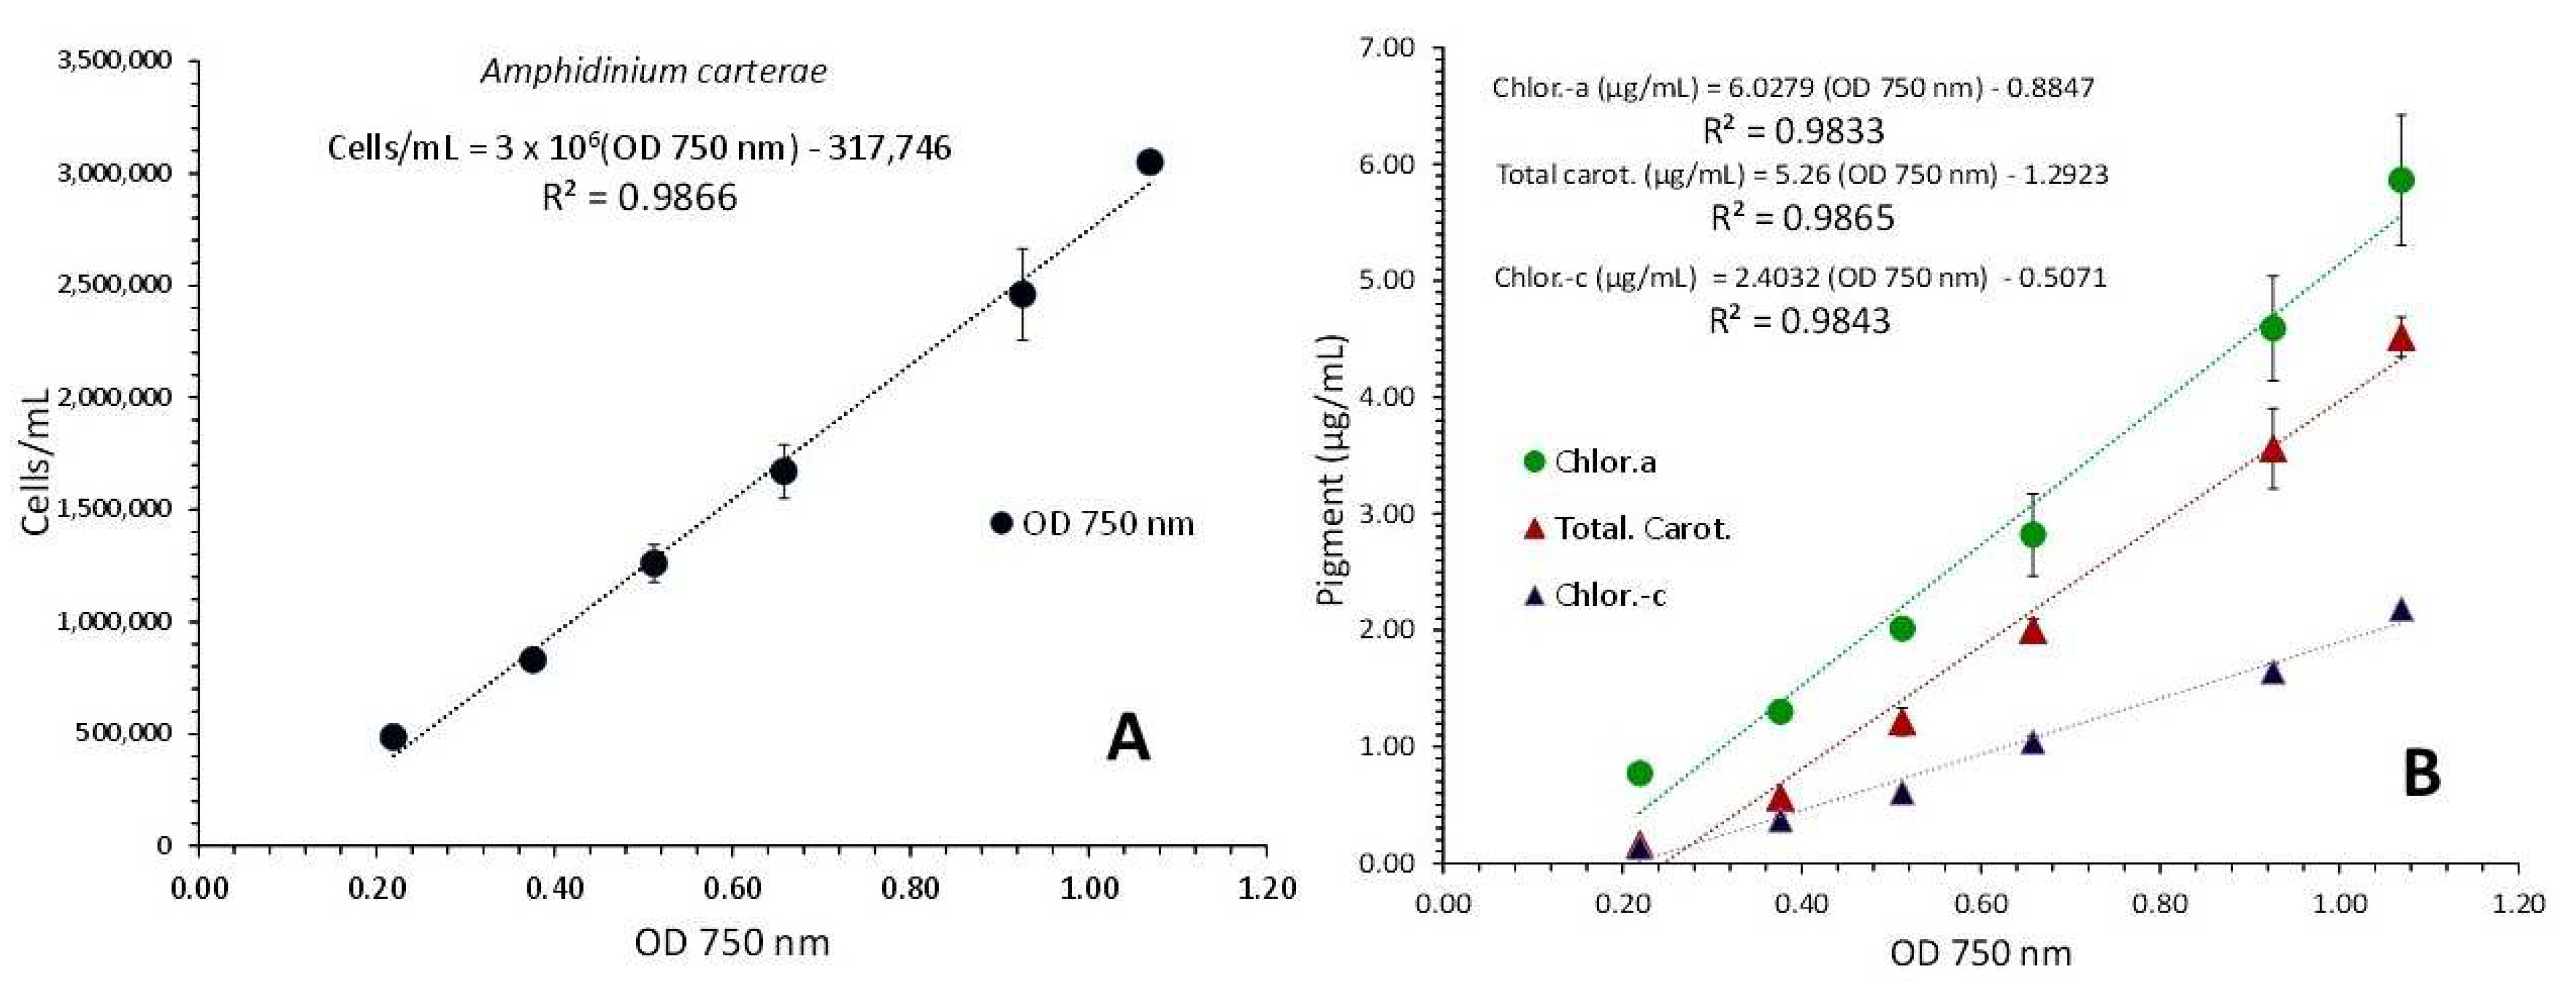
3.1. Amphidinium Carterae

From the second to the fifteenth day of culture, six absorption spectra were recorded, with cell densities ranging from 485,000 cells/mL on the second day to 3,050,000 cells/mL on the fifteenth day (Figure 2). Based on the plot of each spectrum’s optical density (OD) at 750 nm versus the corresponding algal densities (Figure 3A), a perfect fit regression line and its first order equation were produced:
C e l l   d e n s i t y c e l l s m L = 3,000,000 × O D   750   n m 317,746     ( R 2 = 0.986 )
The overall picture of the spectra displays a uniform shape of the curves with virtually flat shape for the first (2nd day), and then, in the following days, a gradually increasing peaking at the wavelengths that distinguish the different pigments (675 and 440 nm for chlorophyll-a, 465 nm for carotenoids and 590 nm for chlorophyll-c). In the final spectrum (of the highest algal density), peaks for all the aforementioned wavelengths became significantly more pronounced. Figure 4 shows the values of each pigment for each spectrum’s associated wavelength and algal density. All the pigments clearly increased as the culture matured, and this rise was especially noticeable in the last two spectra with algal densities of 2,460,000 and 3,050,000 cells/mL. Chlorophyll-a was always much higher than chlorophyll-c or total carotenoids at all densities. At the density of 3,050,000 cells/mL, the maximum concentration of all pigments was recorded as: 5.863 ± 0.322(SE) μg/mL chlorophyll-a, 2.183 ± 0.019(SE) μg/mL chlorophyll-c, and 4.517 ± 0.099(SE) μg/mL total carotenoids. Using the pigment values, their plots against their corresponding values of 750 nm are depicted in Figure 3B. The regression equations for pigment—OD 750 nm relation:
C h l o r . a μ g m L = 6.0279 × O D   750   n m 0.8847     ( R 2 = 0.9833 )
T o t a l   c a r o t . μ g m L = 5.26 × O D   750   n m 1.2923     ( R 2 = 0.9865 )
C h l o r . c μ g m L = 2.4032 × O D   750   n m 0.5071     ( R 2 = 0.9843 )
are all very predictive as indicated by their very high Pearson’s coefficient (R2 > 0.98).

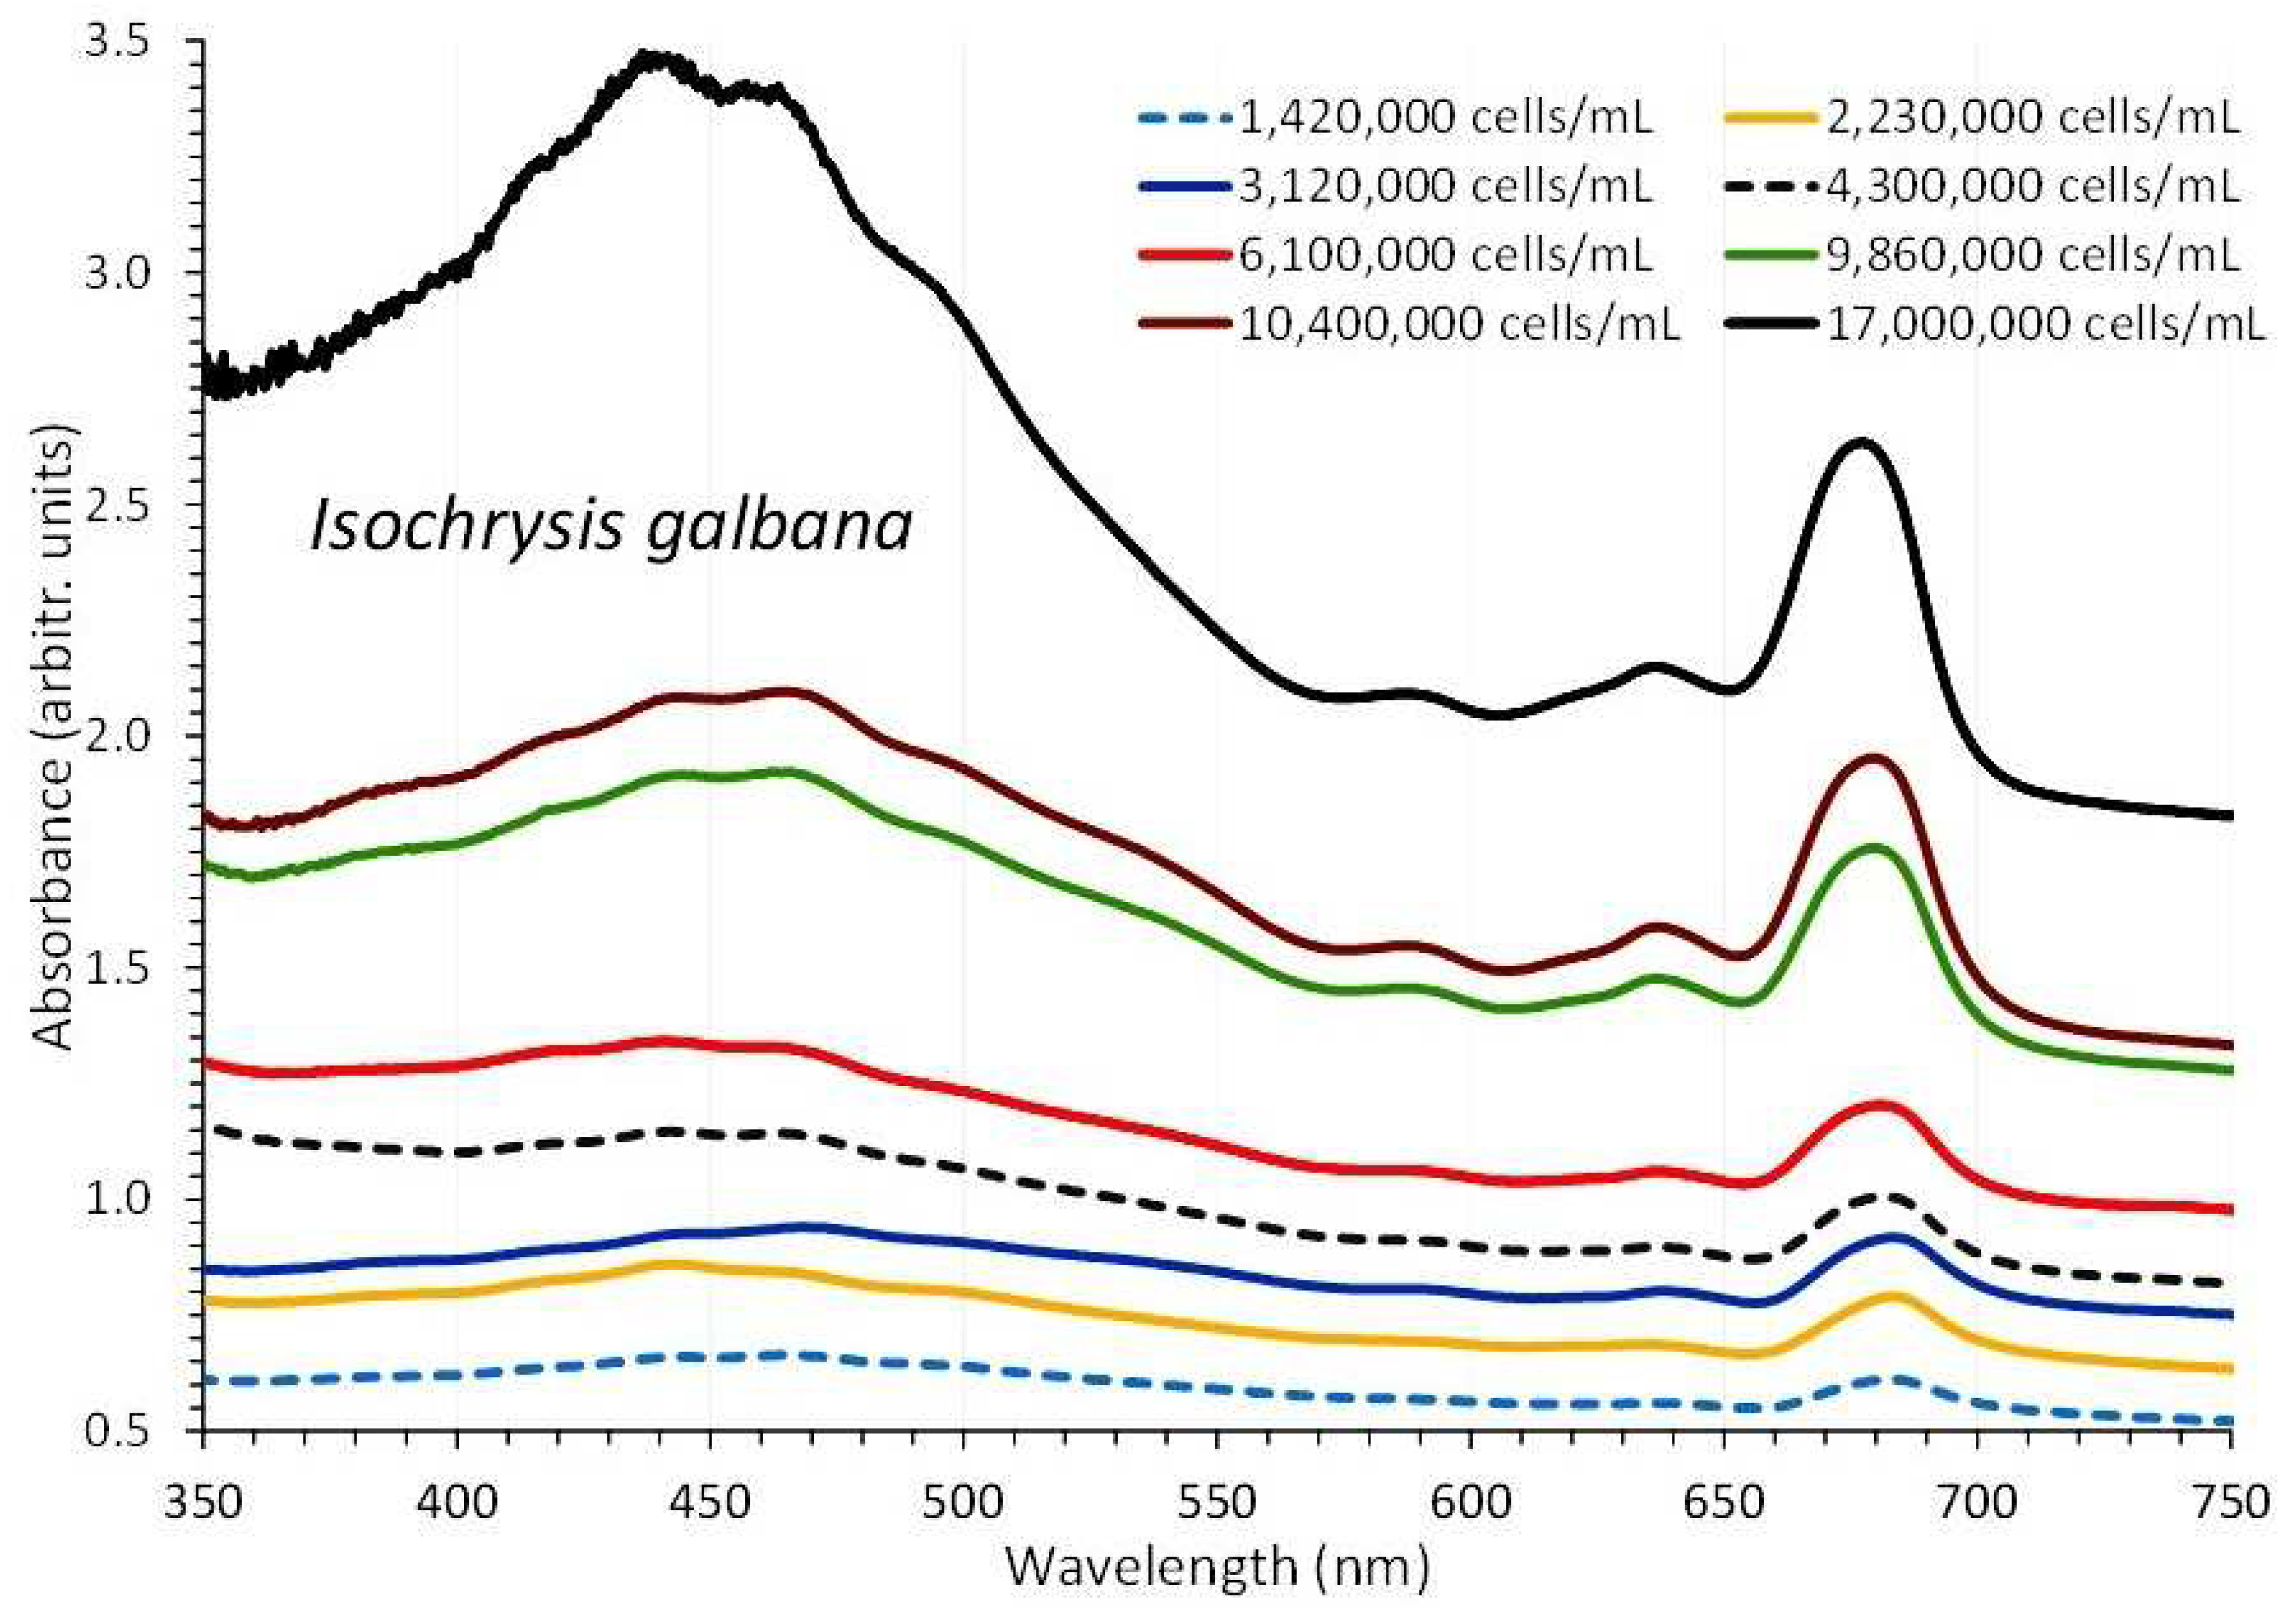
3.2. Isochrysis Galbana

From the second to the sixteenth day of culture, eight absorption spectra were recorded, with cell densities ranging from 1,420,000 cells/mL on the second day to 17,000,000 cells/mL on the sixteenth day (Figure 5). The plot of each spectrum’s optical density (OD) versus the corresponding algal densities at 750 nm (Figure 6A) produced a perfect fit regression line described by the first order equation:
C e l l   d e n s i t y c e l l s m L = 10,000,000 × O D   750   n m 6,000,000     ( R 2 = 0.996 )
The overall appearance of the spectra displays a uniform shape of the curves with an almost flat shape for the first spectrum (2nd day), followed by gradual increases in the following days (4th, 6th, 7th, and 9th) and then an abrupt increase (11th, 13th, and 16th day) in the peaking at the wavelengths that are indicative of its various pigments (680 and 435 nm for chlorophyll-a, 500 nm for carotenoids, 590 and 640 nm for chlorophyll-c). The final spectrum (with the greatest algal density of 17 × 106 cells/mL, 16th day) showed peaks for all of the aforementioned wavelengths that were significantly more pronounced. The values of each pigment for every corresponding wavelength and algal density of each spectrum are depicted in Figure 7. There is an obvious increase in all the pigments along the maturation of the culture which became much prominent in the last two spectra of algal densities of 10,400,000 and 17,000,000 cells/mL. The value of chlorophyll-a at all densities was always higher than either chlorophyll-c or total carotenoids (p < 0.05). The maximum content in all pigments was recorded at the density of 17 × 106 cells/mL with: 11.977 ± 0.052(SE) μg/mL chlorophyll-a, 7.987 ± 0.084(SE) μg/mL chlorophyll-c, and 10.113 ± 0.074(SE) μg/mL total carotenoids. Using the measured pigment concentrations, their plots against their corresponding values of 750 nm are depicted in Figure 6B. The regression equations for pigment—OD 750 nm relation:
C h l o r . a μ g m L = 5.3491 × O D   750   n m + 2.5417     ( R 2 = 0.9879 )
T o t a l   c a r o t . μ g m L = 6.399 × O D   750   n m 1.2655     ( R 2 = 0.9856 )
C h l o r . c μ g m L = 3.8151 × O D   750   n m + 1.3218     ( R 2 = 0.9721 )
are all very predictive as indicated by their very high Pearson’s coefficient (R2 > 0.97).

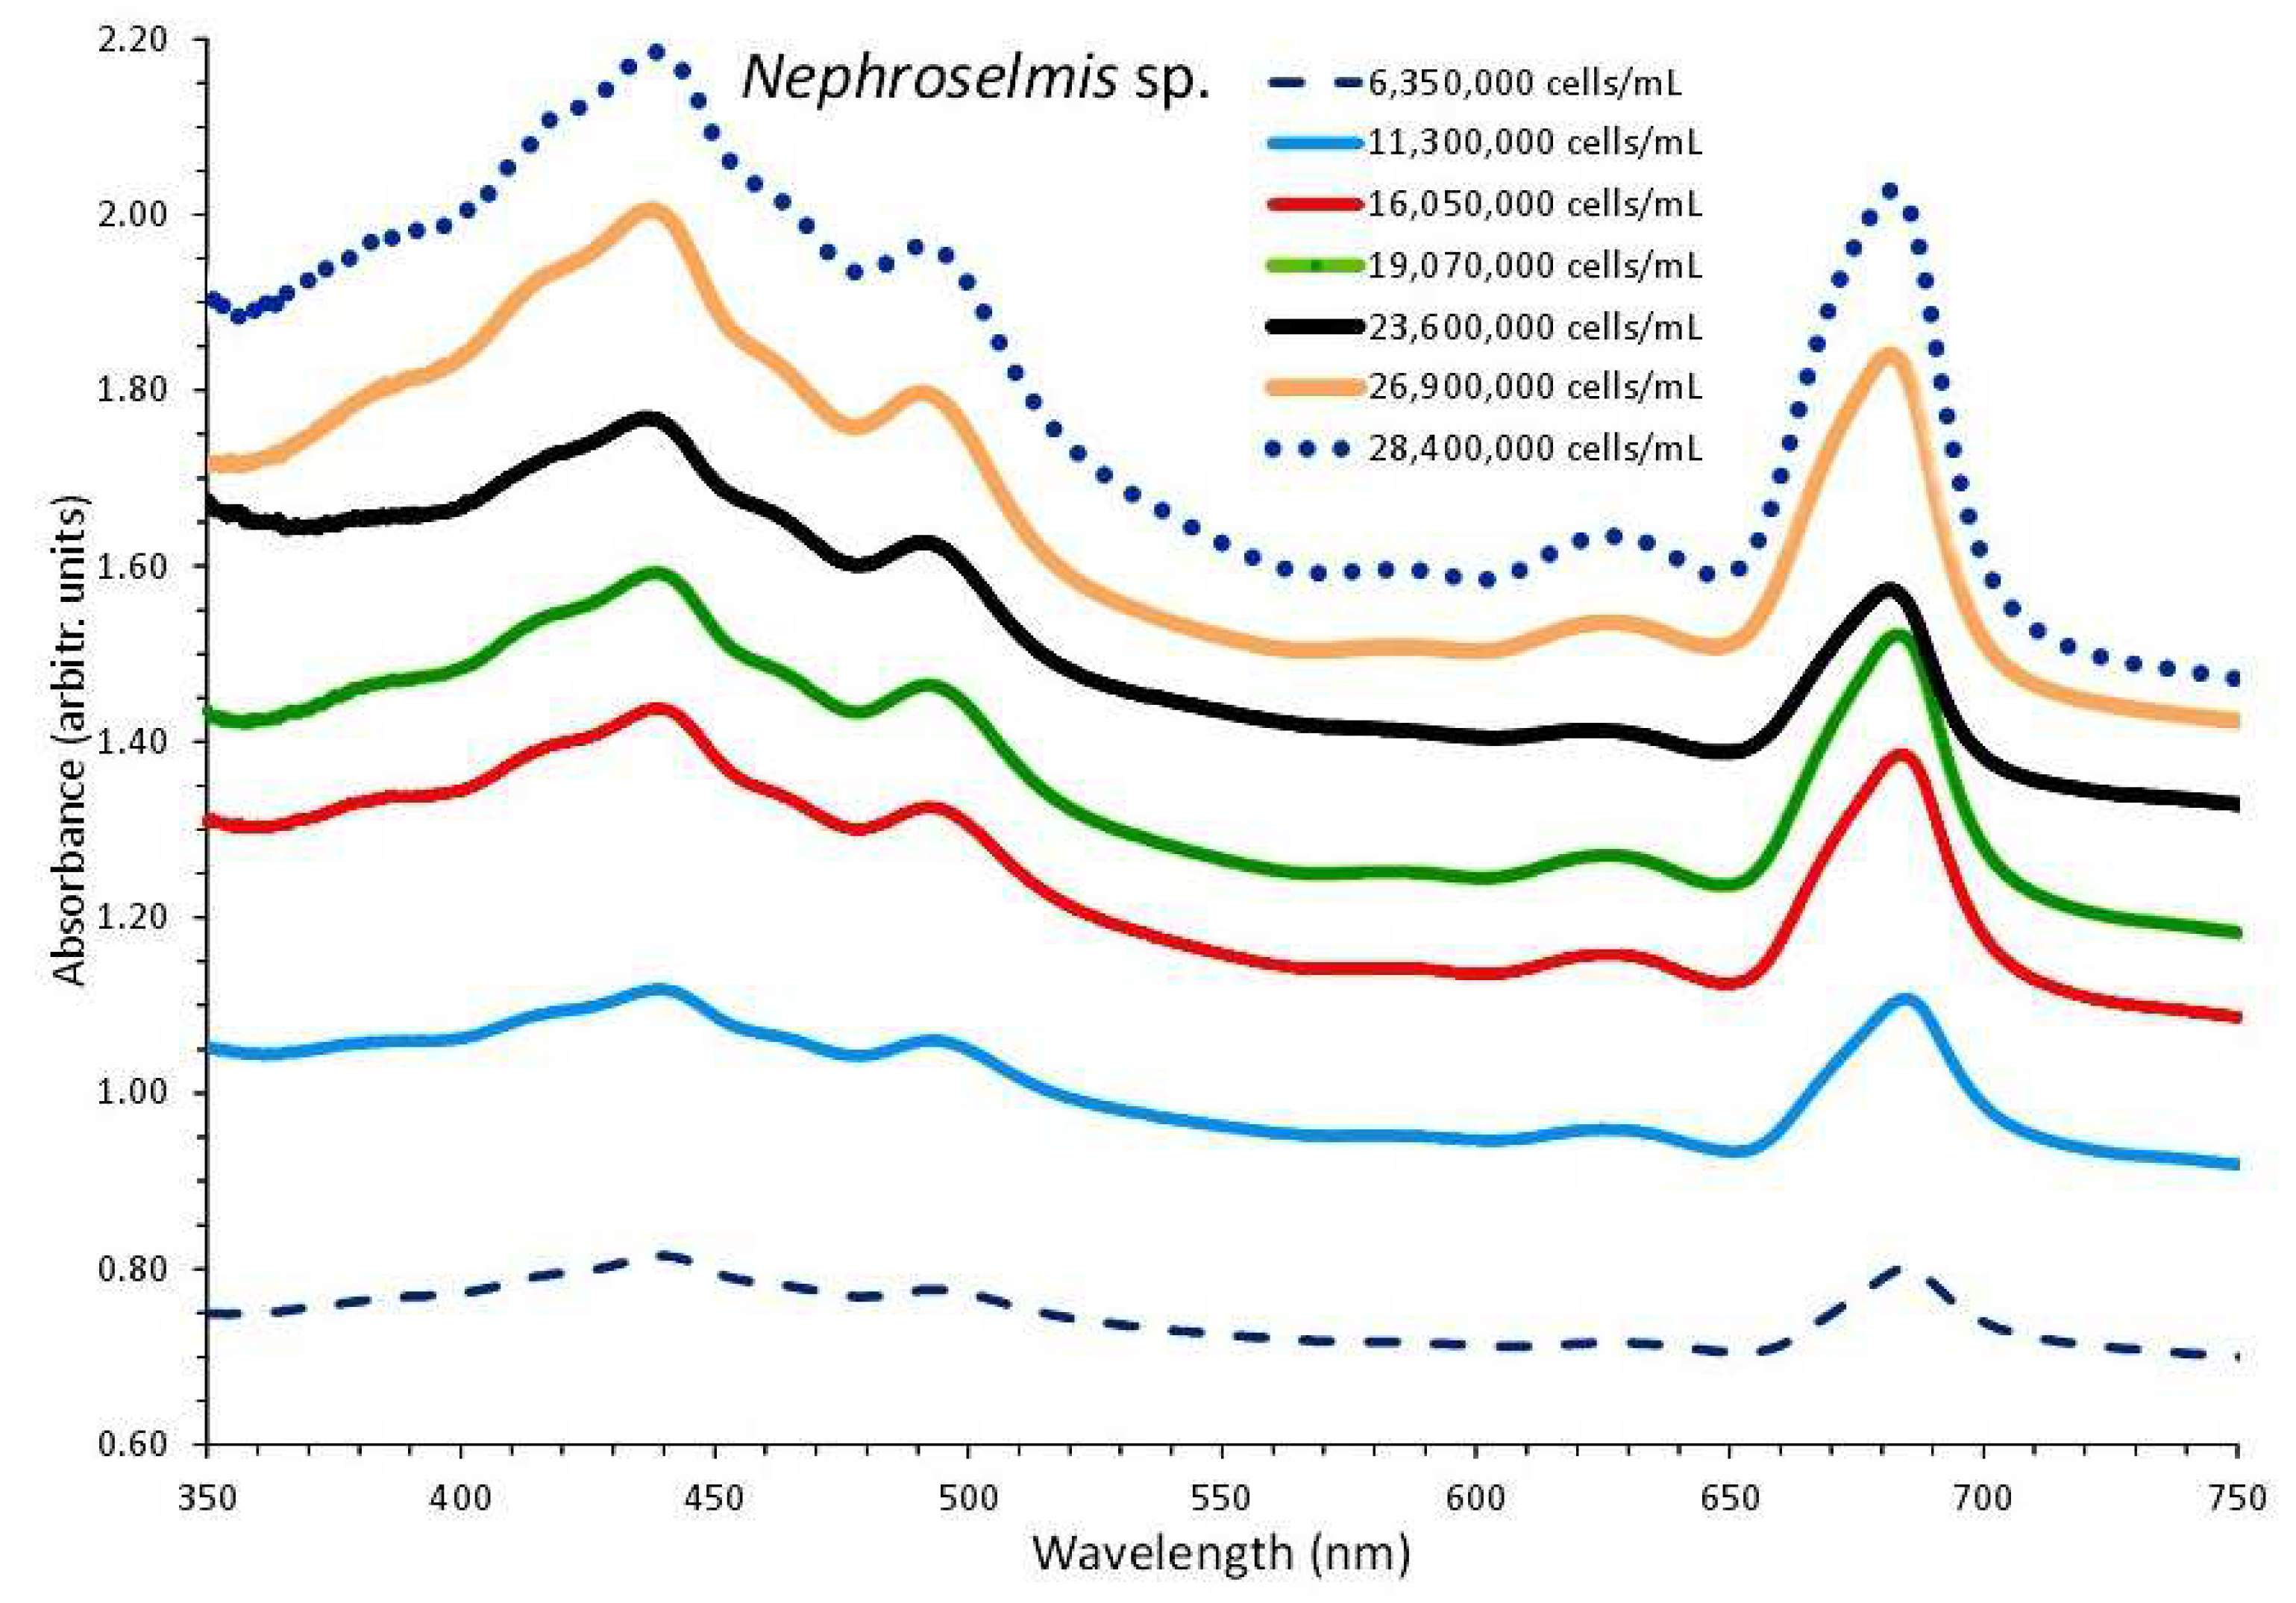
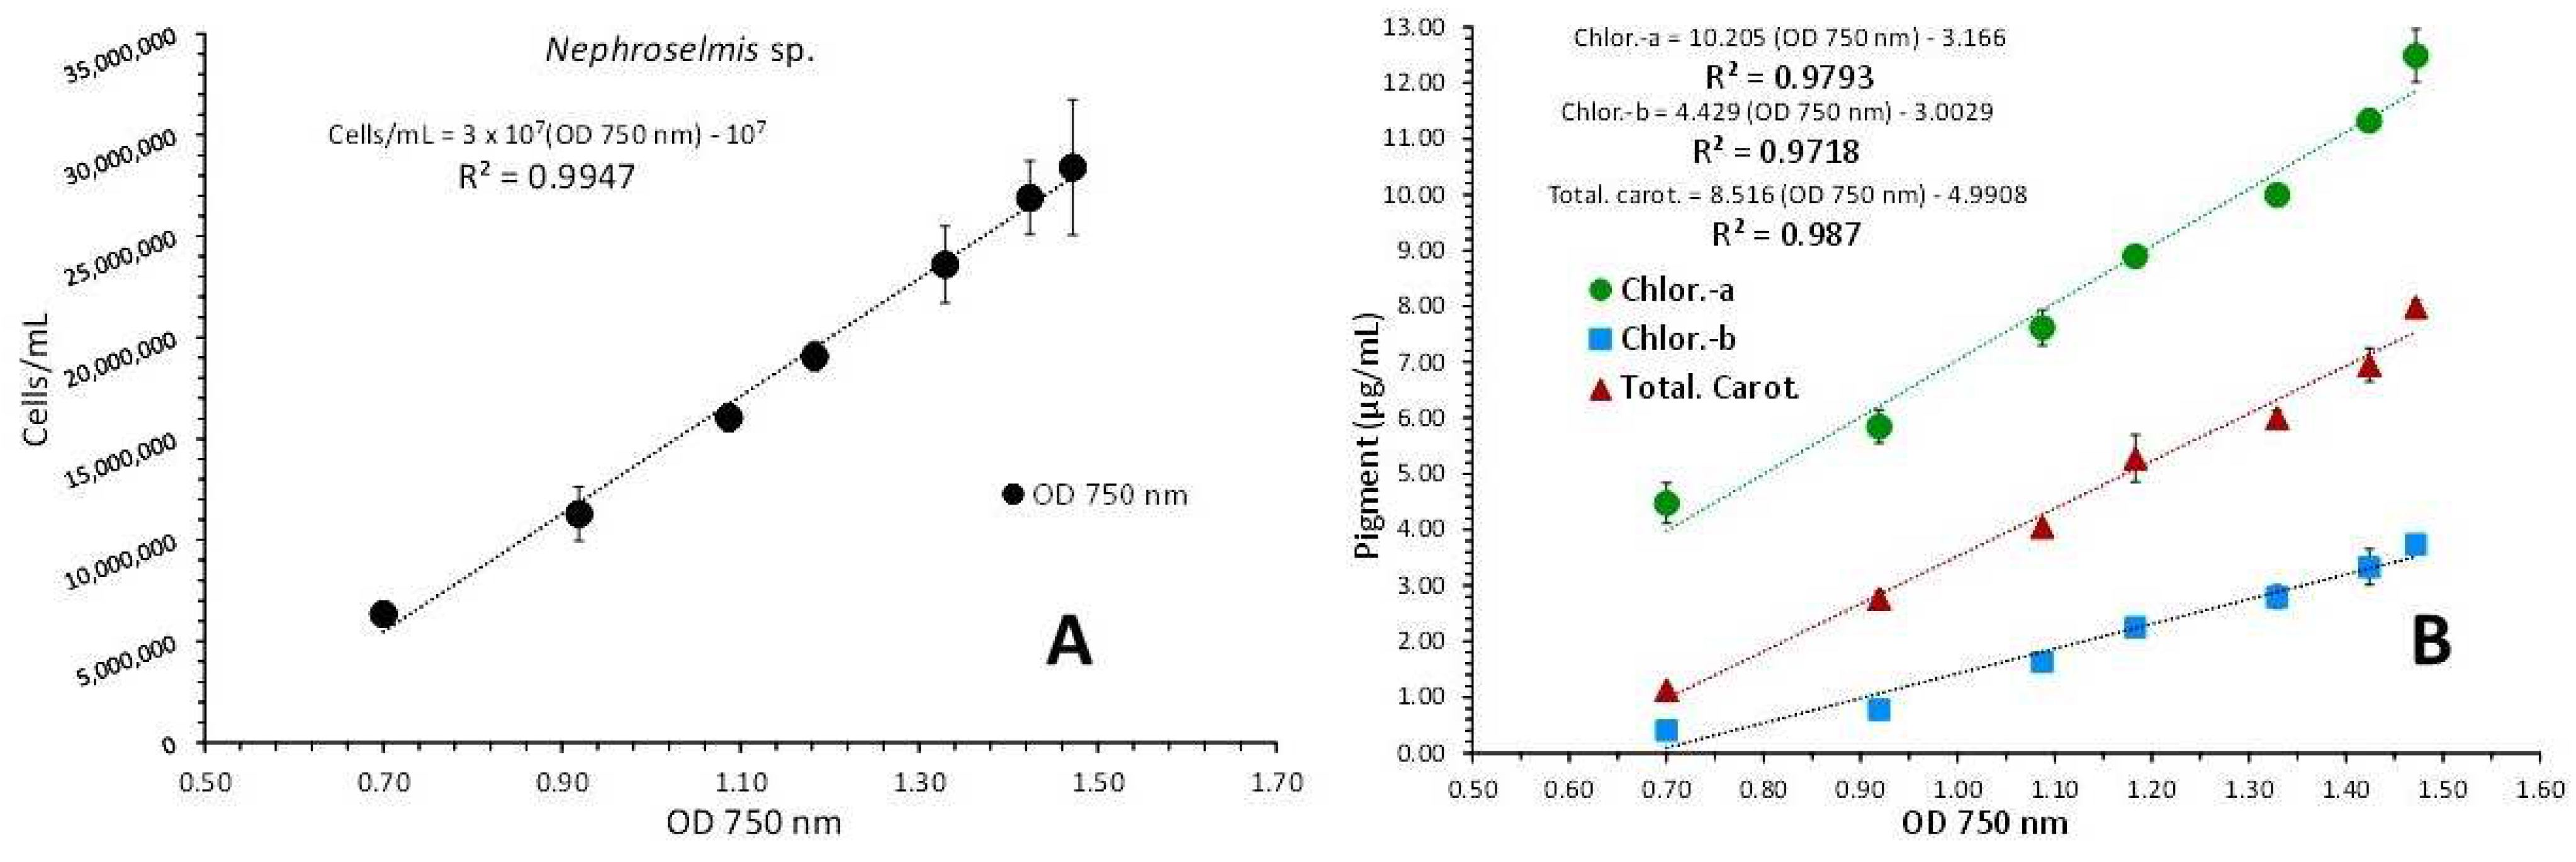
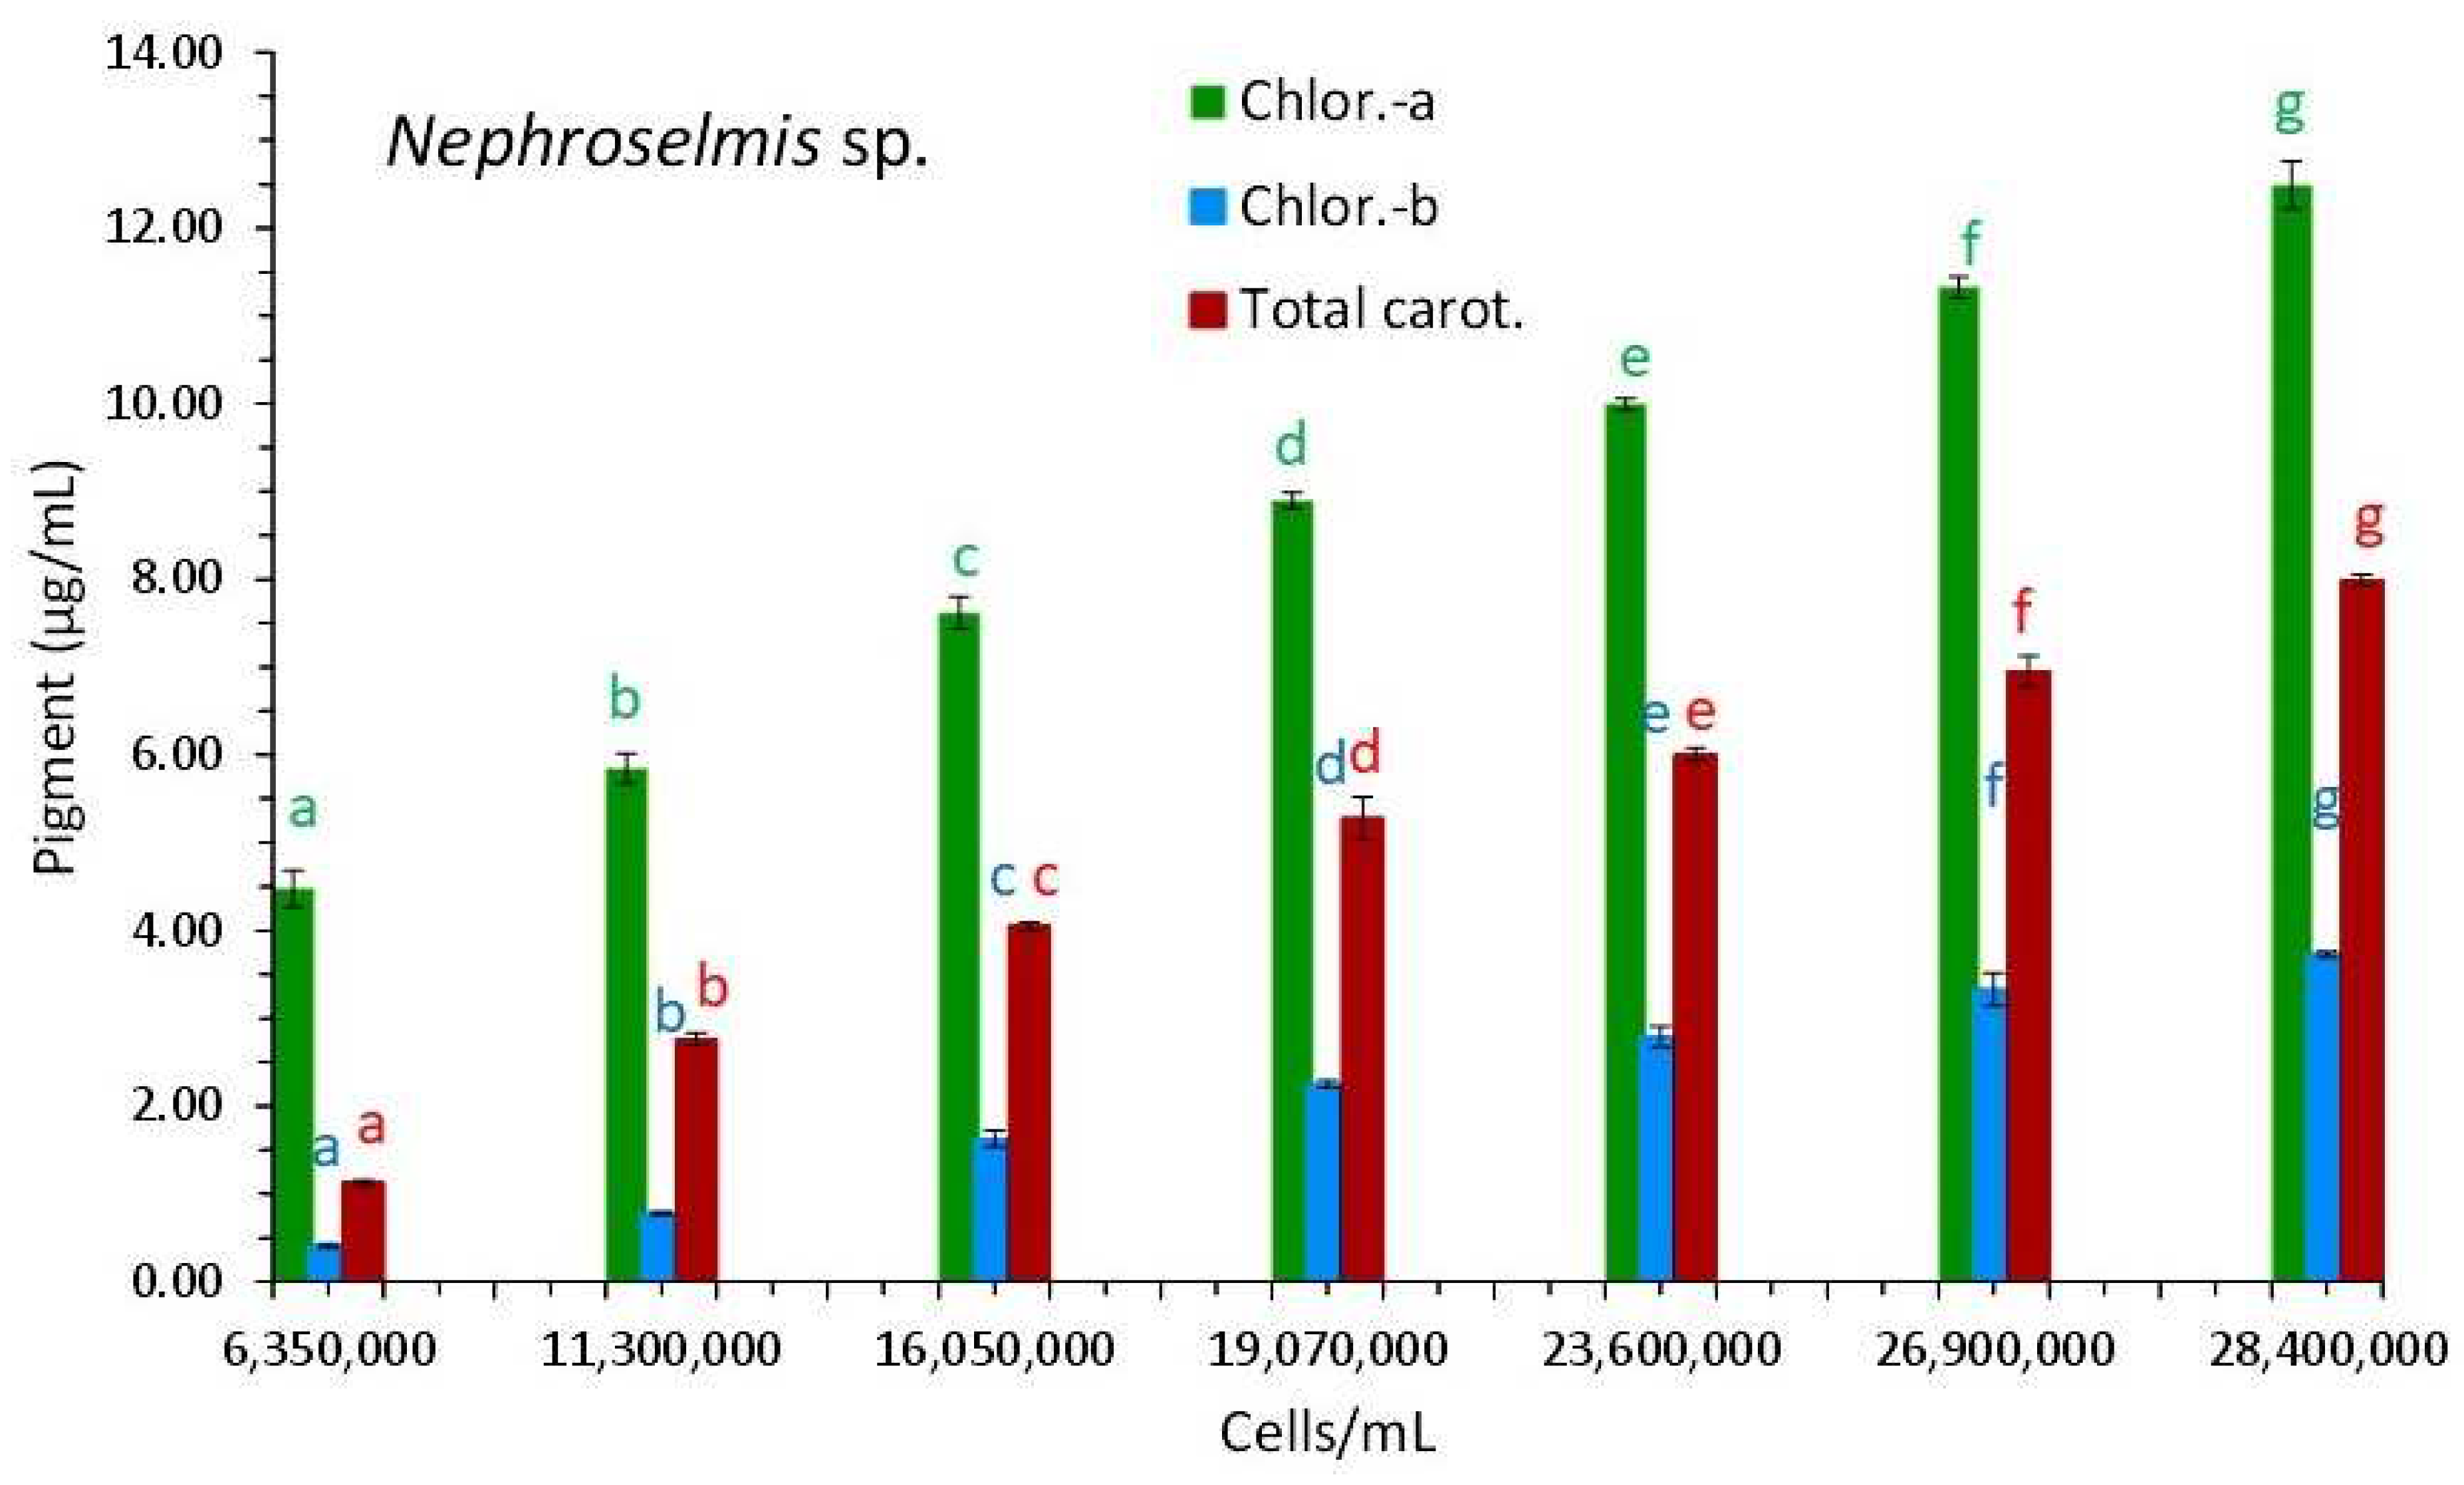
3.3. Nephroselmis sp.
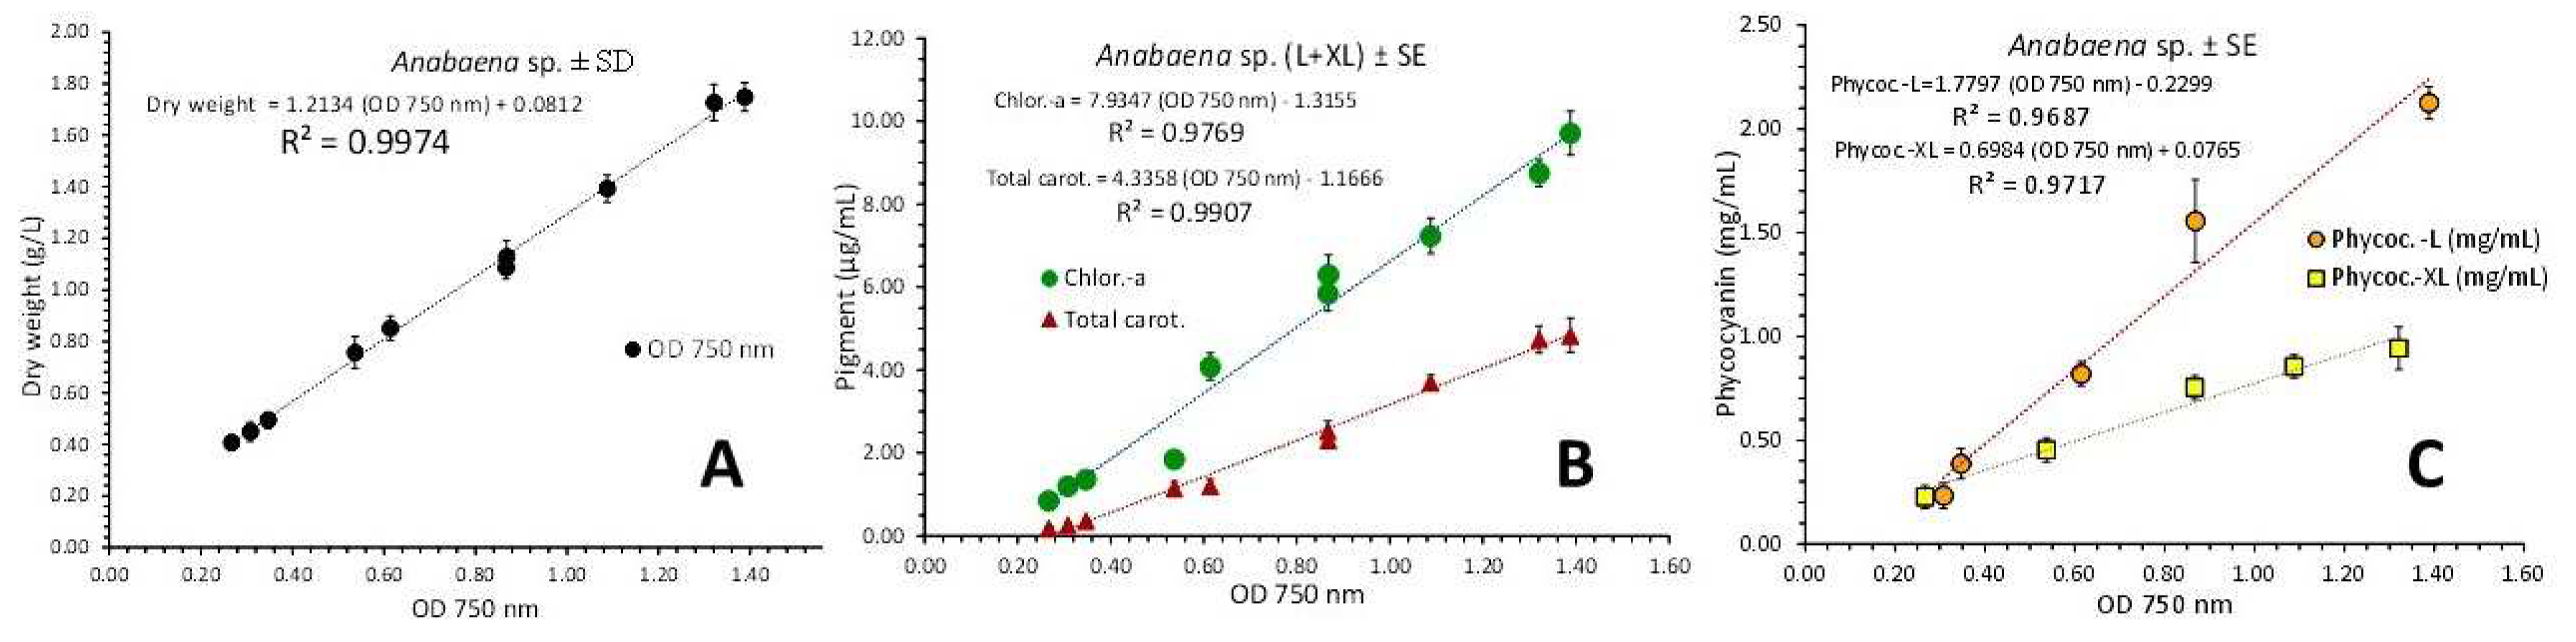
From the second to the nineteenth day of culture, seven absorption spectra were recorded, with cell densities ranging from 6,350,000 cells/mL on the second day to 28,4000,000 cells/mL on the nineteenth day (Figure 8). The plot of each spectrum’s optical density (OD) at 750 nm versus the corresponding algal densities (Figure 9A) produced a perfect fit regression line explained by the first order equation:
C e l l   d e n s i t y c e l l s m L = 30,000,000 × O D   750   n m 10,000,000     ( R 2 = 0.9947 )
The overall appearance of the spectra reveals a consistent unique shape of the curves with barely perceptible peaks in the first one (2nd day), and then, in the following days, a gradually increasing peaking at the wavelengths that distinguish the different pigments (682 and 440 nm for chlorophyll-a, 491 nm for carotenoids and 627 nm for chlorophyll-b). In the last two spectra, peaks for all of the aforementioned wavelengths became considerably more noticeable (of days 17 and 19 with the highest algal densities). Figure 10 shows the values of each pigment for each corresponding algal density of each spectrum. There is an obvious increase in all the pigments along the maturation of the culture which became much prominent in the last two spectra of algal densities of 26,900,000 and 28,400,000 cells/mL. The value of chlorophyll-a at all densities was always higher than either chlorophyll-b or total carotenoids (p < 0.05). The maximum content in all pigments was recorded at the density of 28,400,000 cells/mL with: 12.487 ± 0.273(SE) μg/mL chlorophyll-a, 3.733 ± 0.033(SE) μg/mL chlorophyll-b, and 7.99 ± 0.064(SE) μg/mL total carotenoids. Using the pigment values, their plots against their corresponding values of 750 nm are depicted in Figure 9B. The regression equations for pigment—OD 750 nm relation:
C h l o r . a μ g m L = 10.205 × O D   750   n m 3.166     ( R 2 = 0.9793 )
T o t a l   c a r o t . μ g m L = 8.516 × O D   750   n m 4.9908     ( R 2 = 0.987 )
C h l o r . b μ g m L = 4.429 × O D   750   n m 3.0029     ( R 2 = 0.9716 )
are all very predictive as indicated by their very high Pearson’s coefficient (R2 > 0.97).

3.4. Anabaena sp.

The absorption spectra of 5 days were recorded covering the period from the 3rd till the 15th day of culture, with recorded dry weights from 0.45 and 0.407 g/L the third day up to 1.748 and 1.727 g/L the fifteenth day for low light (L) of 2000 lux and extra light (XL) of 8000 lux, respectively (Figure 11). Based on the 750 nm value of optical density (OD) of each spectrum, their pooled plot against the corresponding dry weight (Figure 12A) resulted in a perfect fit regression line described by the equation:
D r y   w e i g h t g L = 1.2134 × O D   750   n m + 0.0812     ( R 2 = 0.9974 )
The overall picture of the spectra shows a uniform overall shape of the curves with slightly discernable peaks for the first one (3rd day) and afterwards, in the next days, a gradual increase in the peaking at the wavelengths that characterize the various pigments (679 and 439 nm for chlorophyll-a, 490 nm for carotenoids, and 630 nm for phycocyanin). Peaks for all the above wavelengths became much more prominent in the last two spectra (of days 12 and 15 with the highest algal densities). The values of each pigment for every corresponding algal density of each spectrum are depicted in Figure 13. There is an obvious increase in all the pigments along the maturation of the culture which became much prominent in the last two spectra of algal densities of 1.128 and 1.748 g/L in L and 1.393 and 1.727 g/L in XL.
The value of chlorophyll-a at all densities of both light conditions was always higher than that of total carotenoids. The maximum content was recorded at the dry weight of 1.748 g/L with: 9.713 ± 0.533 (SE) μg/mL chlorophyll-a and 4.939 ± 0.411 (SE) μg/mL total carotenoids in “L” and at 1.737 g/L with: 8.750 ± 0.323 (SE) μg/mL chlorophyll-a and 4.792 ± 0.325 (SE) μg/mL total carotenoids in “XL”, values statistically equal (p > 0.05) for carotenoids between the two light regimes and higher (p < 0.05) in the case of chlorophyll in the “L” regime. In the case of phycocyanin the situation was totally different as the proportion of phycocyanin content in units of either concentration (mg/mL), or yield (mg/g dw), was significantly higher (p < 0.05) in the final stages of the cultures in the condition of low (L) light (2.125 ± 0.078 mg/mL and 29.785 ± 1.687 mg/g d.w.) as compared to high (XL) light (0.943 ± 0.108 mg/mL and 24.697 ± 0.366 mg/g d.w.) (Figure 13).
Using the pigment values, their plot for chlorophyll-a and total carotenoids against their corresponding values of 750 nm using pooled data from both light regimes are depicted in Figure 12B. The regression equations for pigment—OD 750 nm relation:
C h l o r . a μ g m L = 7.9347 × O D   750   n m 1.3155     ( R 2 = 0.9769 )
T o t a l   c a r o t . μ g m L = 4.3358 × O D   750   n m 1.1666     ( R 2 = 0.9907 )
are both very predictive as indicated by their very high Pearson’s coefficient (R2 > 0.97). The corresponding equations for phycocyanin—OD 750 nm relation (Figure 12C) were calculated separately for “L” and “XL” illumination and resulted in:
P h y c o c y a n i n L m g m L = 1.7797 × O D   750   n m 0.2299     ( R 2 = 0.9687 )
P h y c o c y a n i n X L m g m L = 0.6994 × O D   750   n m + 0.0765     ( R 2 = 0.9717 )
both very predictive as indicated by their very high Pearson’s coefficient (R2 > 0.965), much higher than their respective one using pooled data from both light regimes (R2 = 0.6389).

4. Discussion

The ability of each alga to photosynthesize depends on (and is influenced by) the composition of pigments in its photosynthetic system [35] and more generally on the size and shape of cells, especially those of phytoplankton species. Therefore, when two microalgal species are compared in monoculture, their absorption spectra can be expected to have (and do have) a particular shape that distinguishes them from each other. There are many reasons to study the absorption spectra of different microalgae [36]. For example, one can identify the pigments they contain or compare the location and height of a pigment’s peak between a live culture sample and the extracted pigment to calculate the extent to which the pigment’s absorption properties are altered by coupling to proteins. Applying the absorbance spectrum of a culture sample of a particular microalga to the calculation of important culture parameters (such as culture density, amount of pigment, etc.) cannot be performed with absolute precision. This is because various factors, such as turbidity or other water constituents, either mask or introduce “noise” to the true shape of the spectrum as it would be produced by the pigments present alone. Although such a method may be considered inferior to the highest precision of a biochemical analysis, under production conditions it is critical to have a rapid and repeatable means of determining when the maximum algal biomass should be harvested or when the level of a desired pigment reaches its peak. Considering biomass estimation by spectroscopy, Liu et al., 2020, 2021 [9,10] reviewed the use of absorption and fluorescence spectroscopy along with spectral imaging technology and concluded about their pros and cons. What can be distilled from their studies is the superiority of absorption spectroscopy in high measuring range, a feature much appreciated in the usual high algal culture densities. Fluorescence as reviewed by Sa et al., 2022 [11] is more cumbersome compared to absorption spectroscopy but nevertheless of great usefulness in monitoring pigments. In providing general information about the state of the culture, absorption spectroscopy is thus the more versatile. When analyzing an absorption spectrum, two important things can be discovered. First, whether the culture density is expressed as cells/mL or as grams of dry weight per liter, the absorbance value at 750 nm has been shown to be the most accurate in numerous experiments [8,14,17,37] as this wavelength avoids the absorption of light by the photosynthetic pigments, which can affect this parameter, and only allows for the measurement of the optical density of the cells.
The spectra of all varieties of microalgae in the current study were examined and the values around 750 nm were found to have no peaks, making them the best predictors of biomass. The second component is to determine how the pigment peaks changed as the culture successively matured. This allows the grower to decide, or even predict, the best time to harvest the highest yield from the crop. In the current work, it was shown that the correlations between the concentration values of each pigment and the corresponding absorbance values at 750 nm for each absorbance spectrum of a given culture density cannot be ignored. But the next point must be noted. According to this, each absorption spectrum has its own characteristics and predictive value only under certain circumstances (phytoplankton species, temperature, and illumination) since the spectra are shaped differently depending on the conditions with respect to the critical values of absorption at 750 nm and the various other wavelengths that characterize the different pigments. This, together with the fact that not all pigments give rise to the same intense and obvious change in their peaks in the spectra, must make us particularly cautious when applying the predictive power of the spectra in relation to the concentration of the pigments, as shown by the present study. The case of the cyanobacterium Anabaena, where two different illumination intensities were applied, is the most illustrative example supporting the aforementioned claim. While the correlations between dry weight and 750 nm and between chlorophyll-a or total carotenoids and 750 nm with pooled values for both intensities show a very strong relationship with an apparent predictive value, in the case of phycocyanin such a strong correlation is shown only when the correlation of phycocyanin-750 nm is applied separately for the spectral values of each light intensity. The results on the effects of illumination on cyanobacteria in recent works [26,31,32] can also be seen as confirming this phenomenon although culture parameters (light, temperature, salinity, aeration, pH) have a significant effect on cell growth of a given microalgal species and the same is true for pigment content [35,38,39,40]; this should not deter researchers from exploring the predictive potential of absorption spectra. However, this should be conducted only after sufficient time and effort has been invested in the basic biochemical studies in the culture of an algae under conditions found to be suitable so that they can be recorded as reference values in the respective environments. In the current study, selected species of microalgae from different taxa were examined, and it was shown that analysis of absorption spectra can be predictive for all of them, even when pigment content varies. While other researchers have found similar predictive power for cell density and pigment content using the corresponding wavelengths [15,16,41,42,43,44] without looking at the absorption spectra, our study uses similar techniques and an integrated approach that uses the absorption spectra as a comprehensive predictive tool for both qualification and quantification of biomass and pigment content. The recording of the absorption spectrum is a simple, inexpensive, and beneficial procedure that, if carried out on a regular basis, can provide the grower with a wealth of important information regarding the condition of the culture. The following conditions must be met in order to properly utilize the absorption spectrum’s prediction capabilities (for biomass and pigments).
  • During the duration of the culture of a particular microalge under a more or less predetermined set of culture conditions, a sufficient number of absorption spectra should be recorded.
  • On the same day that an absorption spectrum is recorded, the biomass density should be accurately calculated, and the concentrations of different pigments should be painstakingly analyzed. Additionally, each pigment’s peaks and absorbance values at 750 nm are noted.
  • For each spectrum that was noted along the culture path, the aforementioned process is repeated. The data are processed after being collected at regular intervals together with information on biomass density and pigment concentrations for a specific culture.
  • Using the aforementioned body of data, regression equations are created for the pairs of biomass density and absorbance at 750 nm to determine whether there is a substantial association (i.e., R2 > 0.85). If so, the OD value of 750 nm can be used to predict biomass using the equation. In order to forecast each pigment’s concentration based on the created equations, the identical technique is carried out for the pairs of each pigment concentration and OD at 750 nm.
  • The foregoing laborious process is carried out once at the beginning to create the calibration equations for the specific culture. The grower can then utilize the created equations to obtain reasonably accurate estimations for biomass and pigments for subsequent cultures of the same species under almost identical conditions.

5. Conclusions

The measurement of the biomass growth efficiency of four microalgae under laboratory circumstances was made possible by spectrophotometric analyses employing the absorption spectra. Monitoring of cell density or dry weight is made possible by using the optical density at 750 nm while also figuring out how much pigment is present in the microalgae that have been developed. On the basis of the data gathered, conclusions about different stages of the growth of the algae population can be made. By analyzing the absorption spectrum of a particular species’ culture, under a particular set of conditions, and at a particular stage of growth, the optical density value of 750 nm and the various respective values at the wavelengths characterizing various pigments of each particular spectrum can be used as a reliable predictor of algal biomass and pigment content.

Author Contributions

Conceptualization, G.N.H.; methodology, G.N.H. and V.B.; software, G.N.H. and V.B.; validation, G.N.H.; formal analysis, G.N.H. and V.B.; investigation, G.N.H.; resources, G.N.H.; data curation, G.N.H.; writing—original draft preparation, G.N.H.; writing—review and editing, G.N.H.; visualization, G.N.H.; supervision, G.N.H.; project administration, G.N.H.; funding acquisition, G.N.H. All authors have read and agreed to the published version of the manuscript.

Funding

This research was financially supported by the research program “ALGAVISION: Isolation and culture of local phytoplankton species aiming to mass production of antibacterial substances, fatty acids, pigments and antioxidants” (MIS 5048496), funded by the General Secretariat of Research and Technology of the Greek Government.

Institutional Review Board Statement

Not applicable.

Informed Consent Statement

Not applicable.

Data Availability Statement

Data sharing not applicable.

Acknowledgments

The authors thank the technical staff of the laboratory Despoina Avramidou for her help in the experimentation.

Conflicts of Interest

The authors declare no conflict of interest. The funders had no role in the design of the study; in the collection, analyses, or interpretation of the data; in the writing of the manuscript; nor in the decision to publish the results.

References

  1. Chisti, Y. Biodiesel from Microalgae. Biotechnol. Adv. 2007, 25, 294–306. [Google Scholar] [CrossRef]
  2. Ajanovic, A. Renewable Fuels—A Comparative Assessment from Economic, Energetic and Ecological Point-of-View up to 2050 in EU-Countries. Renew. Energy 2013, 60, 733–738. [Google Scholar] [CrossRef]
  3. Bharathiraja, B.; Chakravarthy, M.; Ranjith Kumar, R.; Yogendran, D.; Yuvaraj, D.; Jayamuthunagai, J.; Praveen Kumar, R.; Palani, S. Aquatic Biomass (Algae) as a Future Feed Stock for Bio-Refineries: A Review on Cultivation, Processing and Products. Renew. Sustain. Energy Rev. 2015, 47, 634–653. [Google Scholar] [CrossRef]
  4. Guedes, A.C.; Malcata, X.F. Nutritional Value and Uses of Microalgae in Aquaculture. In Aquaculture; Muchlisin, Z.A., Ed.; InTech: London, UK, 2012; pp. 63–66. [Google Scholar]
  5. Kaparapu, J. Application of Microalgae in Aquaculture. Phykos 2018, 48, 21–26. [Google Scholar]
  6. Turcihan, G.; Turgay, E.; Yardımcı, R.E.; Eryalçın, K.M. The Effect of Feeding with Different Microalgae on Survival, Growth, and Fatty Acid Composition of Artemia franciscana Metanauplii and on Predominant Bacterial Species of the Rearing Water. Aquac. Int. 2021, 29, 2223–2241. [Google Scholar] [CrossRef]
  7. Eryalçın, K.M.; Ganuza, E.; Atalah, E.; Hernández Cruz, M.C. Nannochloropsis Gaditana and Crypthecodinium Cohnii, Two Microalgae as Alternative Sources of Essential Fatty Acids in Early Weaning for Gilthead Seabream. Hidrobiológica 2015, 25, 193–203. [Google Scholar]
  8. Lu, L.; Yang, G.; Zhu, B.; Pan, K. A Comparative Study on Three Quantitating Methods of Microalgal Biomass. Indian J. Geomarine Sci. 2017, 46, 2265–2272. [Google Scholar]
  9. Liu, J.-Y.; Zeng, L.-H.; Ren, Z.-H. The Application of Spectroscopy Technology in the Monitoring of Microalgae Cells Concentration. Appl. Spectrosc. Rev. 2021, 56, 171–192. [Google Scholar] [CrossRef]
  10. Liu, J.-Y.; Zeng, L.-H.; Ren, Z.-H. Recent Application of Spectroscopy for the Detection of Microalgae Life Information: A Review. Appl. Spectrosc. Rev. 2020, 55, 26–59. [Google Scholar] [CrossRef]
  11. Sá, M.; Ferrer-Ledo, N.; Gao, F.; Bertinetto, C.G.; Jansen, J.; Crespo, J.G.; Wijffels, R.H.; Barbosa, M.; Galinha, C.F. Perspectives of Fluorescence Spectroscopy for Online Monitoring in Microalgae Industry. Microb. Biotechnol. 2022, 15, 1824–1838. [Google Scholar] [CrossRef]
  12. Sandnes, J.M.; Ringstad, T.; Wenner, D.; Heyerdahl, P.H.; Källqvist, T.; Gislerød, H.R. Real-Time Monitoring and Automatic Density Control of Large-Scale Microalgal Cultures Using near Infrared (NIR) Optical Density Sensors. J. Biotechnol. 2006, 122, 209–215. [Google Scholar] [CrossRef]
  13. White, L.H.; Martin, D.W.; Witt, K.K.; Vogt, F. Impacts of Nutrient Competition on Microalgae Biomass Production. J. Chemom. 2014, 28, 448–461. [Google Scholar] [CrossRef]
  14. Griffiths, M.J.; Garcin, C.; van Hille, R.P.; Harrison, S.T.L. Interference by Pigment in the Estimation of Microalgal Biomass Concentration by Optical Density. J. Microbiol. Methods 2011, 85, 119–123. [Google Scholar] [CrossRef]
  15. Ribeiro-Rodrigues, L.H.; Arenzon, A.; Raya-Rodriquez, M.T.; Ferreira Fontouna, N. Algal Density Assessed by Spectrophotometry: A Calibration Curve for the Unicellular Algae Pseudokirchneriella Subcapitata. J. Environ. Chem. Ecotoxicol. 2011, 3, 225–228. [Google Scholar] [CrossRef]
  16. Santos-Ballardo, D.U.; Rossi, S.; Hernández, V.; Gómez, R.V.; del Carmen Rendón-Unceta, M.; Caro-Corrales, J.; Valdez-Ortiz, A. A Simple Spectrophotometric Method for Biomass Measurement of Important Microalgae Species in Aquaculture. Aquaculture 2015, 448, 87–92. [Google Scholar] [CrossRef]
  17. Hotos, G.N.; Avramidou, D.; Bekiari, V. Calibration Curves of Culture Density Assessed by Spectrophotometer for Three Microalgae (Nephroselmis sp., Amphidinium carterae and Phormidium sp.). Eur. J. Biol. Biotechnol. 2020, 1, 6. [Google Scholar] [CrossRef]
  18. Stein, J.R. Dry Weight, Volume and Optical Density. In Handbook of Phycological Methods: Culture Methods and Growth Measurements; Stein, J.R., Ed.; Cambridge University Press: London, UK, 1973; pp. 21–22. [Google Scholar]
  19. Guillard, R.R.L.; Sieracki, M.S. Counting Cells in Cultures with the Light Microscope. In Algal Culturing Techniques; Andersen, R.A., Ed.; Elsevier: Amsterdam, The Netherlands, 2005; pp. 239–252. [Google Scholar]
  20. Hyka, P.; Lickova, S.; Přibyl, P.; Melzoch, K.; Kovar, K. Flow Cytometry for the Development of Biotechnological Processes with Microalgae. Biotechnol. Adv. 2013, 31, 2–16. [Google Scholar] [CrossRef]
  21. Rottberger, J.; Gruber, A.; Kroth, P.G. Analysing Size Variation during Light-Starvation Response of Nutritionally Diverse Chrysophytes with a Coulter Counter. Arch. Hydrobiol. Suppl. Algol. Stud. 2013, 141, 37–51. [Google Scholar] [CrossRef]
  22. Marie, D.; Simon, N.; Vaulot, D. Phytoplankton Cell Counting by Flow Cytometry. In Algal Culturing Techniques; Andersen, R.A., Ed.; Academic Press: Cambridge, MA, USA, 2005; pp. 253–267. [Google Scholar]
  23. Moheimani, N.R.; Borowitzka, M.A.; Isdepsky, A.; Sing, S.F. Standard Methods for Measuring Growth of Algae and Their Composition. In Algae for Biofuels and Energy; Springer: Dordrecht, The Netherlands, 2013; pp. 265–284. [Google Scholar]
  24. Sarrafzadeh, M.H.; La, H.-J.; Seo, S.-H.; Asgharnejad, H.; Oh, H.-M. Evaluation of Various Techniques for Microalgal Biomass Quantification. J. Biotechnol. 2015, 216, 90–97. [Google Scholar] [CrossRef]
  25. Almomani, F.A.; Örmeci, B. Monitoring and Measurement of Microalgae Using the First Derivative of Absorbance and Comparison with Chlorophyll Extraction Method. Environ. Monit. Assess. 2018, 190, 90. [Google Scholar] [CrossRef]
  26. Hotos, G.N.; Avramidou, D.; Samara, A. The Effect of Salinity and Light Intensity on the Batch Cultured Cyanobacteria Anabaena sp. and Cyanothece sp. Hydrobiology 2022, 1, 278–287. [Google Scholar] [CrossRef]
  27. Hotos, G.N.; Avramidou, D. The Effect of Various Salinities and Light Intensities on the Growth Performance of Five Locally Isolated Microalgae [Amphidinium Carterae, Nephroselmis sp., Tetraselmis sp. (Var. Red Pappas), Asteromonas Gracilis and Dunaliella sp.] in Laboratory Batch Cultures. J. Mar. Sci. Eng. 2021, 9, 1275. [Google Scholar] [CrossRef]
  28. Hotos, G.; Avramidou, D.; Mastropetros, S.G.; Tsigkou, K.; Kouvara, K.; Makridis, P.; Kornaros, M. Isolation, Identification, and Chemical Composition Analysis of Nine Microalgal and Cyanobacterial Species Isolated in Lagoons of Western Greece. Algal Res. 2023, 69, 102935. [Google Scholar] [CrossRef]
  29. Hotos, G.N. A Preliminary Survey on the Planktonic Biota in a Hypersaline Pond of Messolonghi Saltworks (W. Greece). Diversity 2021, 13, 270. [Google Scholar] [CrossRef]
  30. Walne, P.R. Experiments on the Large-Scale Culture of the Larvae of Ostrea Edulis. J. Fish. Invest. Min. Agric. Fish. Lond. Ser. 1966, 2, 25–53. [Google Scholar]
  31. Hotos, G.N.; Antoniadis, T.I. The Effect of Colored and White Light on Growth and Phycobiliproteins, Chlorophyll and Carotenoids Content of the Marine Cyanobacteria Phormidium sp. and Cyanothece sp. in Batch Cultures. Life 2022, 12, 837. [Google Scholar] [CrossRef]
  32. Hotos, G.N. Culture Growth of the Cyanobacterium Phormidium sp. in Various Salinity and Light Regimes and Their Influence on Its Phycocyanin and other Pigments Content. J. Mar. Sci. Eng. 2021, 9, 798. [Google Scholar] [CrossRef]
  33. Ritchie, R.J. Universal Chlorophyll Equations for Estimating Chlorophylls a, b, c, and d and Total Chlorophylls in Natural Assemblages of Photosynthetic Organisms Using Acetone, Methanol, or Ethanol Solvents. Photosynthetica 2008, 46, 115–126. [Google Scholar] [CrossRef]
  34. Moraes, C.C.; Sala, L.; Cerveira, G.P.; Kalil, S.J. C-Phycocyanin Extraction from Spirulina Platensis Wet Biomass. Braz. J. Chem. Eng. 2011, 28, 45–49. [Google Scholar] [CrossRef]
  35. Maltsev, Y.; Maltseva, K.; Kulikovskiy, M.; Maltseva, S. Influence of Light Conditions on Microalgae Growth and Content of Lipids, Carotenoids, and Fatty Acid Composition. Biology 2021, 10, 1060. [Google Scholar] [CrossRef]
  36. Kirk, J.T.O. Light Capture by Aquatic Plants. In Light and Photosynthesis in Aquatic Ecosystems; Kirk, J.T.O., Ed.; Cambridge University Press: Cambridge, UK, 1994; pp. 201–218. ISBN 9780511623370. [Google Scholar]
  37. Borovkov, A.B.; Gudvilovich, I.N.; Avsiyan, A.L. Scale-up of Dunaliella Salina Cultivation: From Strain Selection to Open Ponds. J. Appl. Phycol. 2020, 32, 1545–1558. [Google Scholar] [CrossRef]
  38. Healey, F.P. Physiological Indicators of Nutrient Deficiency in Algae. Internationale Vereinigung für Theoretische und Angewandte Limnologie: Mitteilungen 1978, 21, 34–41. [Google Scholar] [CrossRef]
  39. Minhas, A.K.; Hodgson, P.; Barrow, C.J.; Adholeya, A. A Review on the Assessment of Stress Conditions for Simultaneous Production of Microalgal Lipids and Carotenoids. Front. Microbiol. 2016, 7, 546. [Google Scholar] [CrossRef]
  40. Montero-Lobato, Z.; Vázquez, M.; Navarro, F.; Fuentes, J.; Bermejo, E.; Garbayo, I.; Vílchez, C.; Cuaresma, M. Chemically-Induced Production of Anti-Inflammatory Molecules in Microalgae. Mar. Drugs 2018, 16, 478. [Google Scholar] [CrossRef]
  41. Valer, R.M.; Glock, L. Quantificação de Algas Clorofíceas Deinteresse Ecotoxicológico a Través Do Método Espectrofotométrico. Acta Limnol. Bras. 1998, 11, 148–156. [Google Scholar]
  42. Rossi, S.; Fiorillo, I. Biochemical Features of a Protoceratium reticulatum Red Tide in Chipana Bay (Northern Chile) in Summer Conditions. Sci. Mar. 2010, 74, 633–642. [Google Scholar] [CrossRef]
  43. Ebenezer, V.; Ki, J.-S. Quantification of Toxic Effects of the Herbicide Metolachlor on Marine Microalgae Ditylum brightwellii (Bacillariophyceae), Prorocentrum minimum (Dinophyceae), and Tetraselmis suecica (Chlorophyceae). J. Microbiol. 2013, 51, 136–139. [Google Scholar] [CrossRef]
  44. Lee, E.; Heng, R.-L.; Pilon, L. Spectral Optical Properties of Selected Photosynthetic Microalgae Producing Biofuels. J. Quant. Spectrosc. Radiat. Transf. 2013, 114, 122–135. [Google Scholar] [CrossRef]
Figure 1. Representative images of the cultures of the 4 microalgae shot at various days of their culture period. (A,B): Amphidinium carterae on the 2nd and 10th day, respectively. (C,D): Isochrysis galbana on the 2nd and 9th day, respectively. (E,F): Nephroselmis sp. on 2nd and 8th day, respectively. (G,H): Anabaena sp. on the 3rd and 9th day, respectively.
Ijpb 14 00065 g001
Figure 2. Absorption spectra of Amphidinium carterae culture at different cell densities.
Ijpb 14 00065 g002
Figure 3. Correlation of algal density (A) and pigment concentration (B) with absorption (optical density-OD) at 750 nm in Amphidinium carterae culture. Values are means of 3 replicates ± SD.
Ijpb 14 00065 g003
Figure 4. Pigment content in μg/mL ± SE of Amphidinium carterae culture at different cell densities. Values are means of 3 replicates ± SE. Different letters above each bar with the same color as the relevant pigment bar denote statistically different values (p < 0.05) among the different culture densities for the particular pigment.
Ijpb 14 00065 g004
Figure 5. Absorption spectra of Isochrysis galbana culture at different cell densities.
Ijpb 14 00065 g005
Figure 6. Correlation of algal density (A) and pigment concentration (B) with absorption (Optical Density-OD) at 750 nm in Isochrysis galbana culture. Values are means of 3 replicates ± SD.
Ijpb 14 00065 g006
Figure 7. Pigment content in μg/mL of Isochrysis galbana culture at different cell densities. Values are means of 3 replicates ± SE. Different letters above each bar with the same color as the relevant pigment bar denote statistically different values (p < 0.05) among the different culture densities for the particular pigment. Same letters denote no difference (p > 0.05).
Ijpb 14 00065 g007
Figure 8. Absorption spectra of Nephroselmis sp. culture at different cell densities.
Ijpb 14 00065 g008
Figure 9. Correlation of algal density (A) and pigment concentration (B) with absorption (Optical Density-OD) at 750 nm in Nephroselmis sp. culture. Values are means of 3 replicates ± SD.
Ijpb 14 00065 g009
Figure 10. Pigment content in μg/mL of Nephroselmis sp. culture at different cell densities. Values are means of 3 replicates ± SE. Different letters above each bar with the same color as the relevant pigment bar, denote statistically different values (p < 0.05) among the different culture densities for the particular pigment. Same letters denote no difference (p > 0.05).
Ijpb 14 00065 g010
Figure 11. Absorption spectra of Anabaena sp. culture at different dry weights and light intensities, (A) 2000 lux (L), (B) 8000 lux (XL).
Ijpb 14 00065 g011
Figure 12. Correlation of dry weight (A), chlorophyll-a and total carotenoids (B) and phycocyanin (C) under low (2000 lux-L) and high (8000 lux-XL) illumination, with absorption (optical density-OD) at 750 nm in Anabaena sp. culture. Values are means of 3 replicates ± SD.
Ijpb 14 00065 g012
Figure 13. Pigment content in μg/mL of chlorophyll-a and, total carotenoids in (A): 2000 lux (L) and (B): 8000 lux (XL) and phycocyanin in mg/mL and phycocyanin yield in mg/g d.w. in (C): 2000 lux (L) and (D): 8000 lux (XL) of Anabaena sp. culture at different culture densities in g/L. Values are means of 3 replicates ± SE. Different letters with the same color as the relevant pigment bar above, or inside each bar, denote statistically different values (p < 0.05) among the different culture densities for the particular pigment across all treatments. Same letters denote no difference (p > 0.05).
Ijpb 14 00065 g013
Disclaimer/Publisher’s Note: The statements, opinions and data contained in all publications are solely those of the individual author(s) and contributor(s) and not of MDPI and/or the editor(s). MDPI and/or the editor(s) disclaim responsibility for any injury to people or property resulting from any ideas, methods, instructions or products referred to in the content.

