Article

Novel Bioformulations with Trichoderma lixii to Improve the Growth Dynamics and Biocontrol of the Cowpea Damping-Off Disease

by
Alaa El-Dein Omara
* and
Fatma M. El-maghraby
Agricultural Research Center, Department of Microbiology, Soils, Water and Environment Research Institute, Giza 12112, Egypt
*
Author to whom correspondence should be addressed.
Microbiol. Res. 2023, 14(4), 2041-2066; https://doi.org/10.3390/microbiolres14040138
Submission received: 22 October 2023 / Revised: 29 November 2023 / Accepted: 30 November 2023 / Published: 4 December 2023
(This article belongs to the Special Issue Antifungal Agents: Treatment for Indoor Mold Exposure)

Abstract

:
Because agricultural wastes are abundant in biologically active substances, they can be used as a substitute source to produce highly valuable products while lowering pollution levels in the environment. Therefore, we aimed at determining the best agricultural wastes to increase the biomass production rate and the effectiveness of the biocontrol strain Trichoderma lixii SARS 111 in a solid-state fermentation system. The potential for its use in enhancing growth dynamics and controlling the Fusarium oxysporum NCAIM-F-00779-caused damping-off disease of cowpea plants grown in greenhouse conditions was also studied. Using a one-factor-at-a-time experiment, five cheap agricultural waste substrates (faba bean, cowpea, sweet potato, pumpkin, and cassava) were studied using the Plackett–Burman design (PBD) and the central composite design (CCD) to optimize the nutritional and growth conditions to maximize the production of Trichoderma conidia. The findings demonstrated that increasing Candida production quantitatively required the use of 3 g of sweet potato, 3 g of cassava, pH 6, 25 °C, and pre-treatment with dH2O. The shelf life and viability of T. lixii strain were measured as log10 CFU g−1 per substrate at room temperature (RT, 25 °C) at the beginning of month 0 and subsequently at 2-month intervals for 12 months. Data showed that the fungal counts increased with the use of 4 g of sweet potato + 2 g of cassava up to 7 months and then sharply decreased, lasting up to 12 months. Additionally, this bioformulation was applied to cowpea plants in a greenhouse experiment, where a significantly higher level of plant growth traits, photosynthetic pigments, antioxidant enzymes, and chemical content in the leaves, as well as lower incidence of the damping-off disease, were noted. Accordingly, it is possible to suggest 4 g of sweet potato and 2 g of cassava as a suitable bioformulation for the industrial-scale production of the T. lixii strain, which may be a potential biocontrol agent for preventing the cowpea damping-off disease caused by F. oxysporum and improving the growth dynamics.

1. Introduction

In the agricultural sector, the most popular method of protecting plants from pests and diseases is the use of chemical pesticides. However, using these synthetic substances has a detrimental impact on both human health and the environment [1,2], in addition to the substantial costs associated with recording, research, and production. Finding alternative methods of managing disease has become more popular due to the usage of synthetic pesticides [3]. The notion of environmentally friendly growth through the effective control of plant diseases using commercial biological products has recently drawn the attention of several corporations, thereby improving the productivity of many crops [4]. A few benefits of using micro-organisms as a sustainable biological control method include increased agricultural yields, human safety, and a decrease in other pesticide residues. It has also been shown to be effective against plant pathogens, improve food, water, and soil quality, and increase biodiversity. However, the process of developing and producing micro-organisms is costly and time consuming, particularly when it comes to marketing [5,6]. The method of formulating these microbes in biological control and their effectiveness also depend on the quantity, quality, and fermentation materials used [7]. In addition, these fermentation materials must be rich in nutrients, low cost, and readily available, with end-biomass containing a potency inoculum. Moreover, the biomass of biocontrol agents, especially fungi, must endure many steps, i.e., harvesting, drying, formulation, storage, and delivery [8]. In this regard, a key barrier to the marketing of biocides is their short shelf life. To produce a high quantity and quality of biomass, the bioproduct must be optimized utilizing appropriate organic substrates [9].
In this context, the two types of fermentation used to create fungi biocontrol agents are solid-state fermentation (SSF) and liquid-state fermentation (LSF) [10]. SSF is defined as a method involving the growth of micro-organism on a solid, typically insoluble, organic substrate, and it acts as a source of nutrients. Thus, SSF has emerged as an acceptable technique for producing microbial biomass [11]. The most popular micro-organisms for the SSF technology are filamentous fungi. They are widely and commercially applied in various industries, i.e., enzymes, antibiotics, organic acids, and biofuels. They are also displayed in different forms, such as plates, bottles, bags, trays, etc. [12]. Furthermore, SSF offers numerous benefits, including enhanced fermentation, stability, reduced expenses, and lower water and energy requirements because it replicates the natural conditions of fungi and is suitably adapted to their metabolism. As a result, it has a significant economic potential in the biopesticides sector [13]. On the other hand, the organic substrates in SSF serve as transporters for the biomass; therefore, a complicated formulation is not required. SSF may thus be acceptable in developing nations, with their plentiful labor force and agricultural waste [14]. However, SSF has some disadvantages, such as high fermentation time, heat buildup problem, and difficulty in controlling the moisture levels, pH, and temperature [15]. In the SSF technique, micro-organisms are grown on a variety of organic materials, including wastes and inexpensive byproducts. Different substrates can function as appropriate media to create fungal inoculants for biocontrol, including sawdust, sugarcane bagasse, cereals (wheat, barley, and sorghum), bran and straw cereal [6,16,17].
Trichoderma fungi are widespread and can be found in a variety of soil types and environments [18]. They have been utilized for many years to counteract several crop illnesses by means of plant pathogen biocontrol. The production of enzymes, the environment, the competition for essential nutrients, antibiotics, etc., all affect how they function [19,20]. They are currently used in commercial marketing as biocides, biofertilizers, growth promoters, and natural resistance boosters due to their advantageous effects on plants [21,22]. The cowpea plant (Vigna unguiculata L.) is regarded as a significant food crop worldwide. In Egypt, all of the plant’s parts are consumed as a source of protein, with protein and carbohydrate ratios of 23 and 57%, respectively [23]. It was previously claimed that the root rot diseases caused by Fusarium solani, Rhizoctonia solani, Macrophomina phaseolinae, Sclerotium rolfsii, and Pythium sp. could attack the roots and cause damping-off diseases and root rot, leading to significant yield losses [24,25,26,27].
Encouraged by such evidence, one of the most key fungi—which are commonly employed to produce biomass on SSF under ideal circumstances and are used as a biocontrol agent with various plants—are Trichoderma. The technology used to create biological inoculation suffers due to the neglect of microbial inoculation formulation despite the critical role it plays, especially in sustainable agriculture. Thus, this work confirms the possibility of producing a new bioformulation of T. lixii and its application against damping-off disease, enhancing the different growth dynamics of cowpea plants under greenhouse conditions.

2. Materials and Methods

2.1. Fungi Used and Culture Conditions

The Agricultural Microbiology Department, SARS, ARC, Kafr El-Sheikh, Egypt, graciously donated the T. lixii SARS 111 and F. oxysporum NCAIM F 00779 for use in this study. T. lixii was grown on potato dextrose agar (PDA) at 28 °C for 7 days to produce the inoculum suspension. Spores were then collected from the surface by washing the conidia with sterile 0.1% Tween-80 [28]. On the other hand, the F. oxysporum fungus was cultivated on PDA at 28 °C, and after being dried, it was cultured for three weeks on autoclaved wheat grains until the fungus’ mycelia covered the grains’ surface.

2.2. Agricultural Wastes Used and Their Chemical Properties

The research farm at the Sakha Agricultural Research Station, Kafr El-Sheikh, provided 5 easily accessible, reasonably priced agricultural waste substrates. They are described in Table 1 according to their traits.

2.3. Conidia Production Statistical Optimization under SSF Conditions

2.3.1. Using Two Levels

A 2 mm sieve was used to pass all agricultural waste substrates before being pulverized in an electric grinder and aseptically dried in glass stock before use. All substrates were dried at 70 °C overnight. In this experiment, a Plackett–Burman design (PBD) was used to identify the variables, which have the greatest influence on the ability of T. lixii to produce spores under SSF conditions. This design was based on the response surface methodology (RSM) approach to identify the interactions among variables, i.e., substrate, pre-treatment, pH, temperature (°C), and moisture (%).
These factors and treatments were evaluated with one maximum (+1) and one minimum (−1). In triplicate, a 500 mL glass flask containing 50 g dry weight of a solid substrate with 1% (w/v) ammonium sulfate as N source was sterilized (121 °C for 30 min), cooled, and inoculated with the spore suspension (5 mL, 1 × 10⁶ spores mL−1), followed by incubation for 21 days at 25 °C. The moisture content was also adjusted to 65% [6]. Afterward, the T. lixii inoculum was removed and dried in a fluid bed drier. The spores were counted, and the best spore-producing substrate was chosen for further experiments. This design contained 12 runs at 3 levels with 3 center points, as shown in Table 2 and Table 3. The Plackett–Burman design is based on the first-order linear equation:
Y = β0 + ∑βiXi
where Y is the predicted response (conidia production); β0 is the model intercept; βi denotes the variables’ estimates; and Xi represents the coded independent variables, which were coded as W1, W2, W3, W4, W5.

2.3.2. Using Three Levels

As previously mentioned in Section 2.3.1., the best spore-producing substrates were selected and evaluated, as shown in Table 4 and Table 5. Response surface modeling and optimization of conidia production conditions were accomplished using a quadratic CCD [29,30]. This design involved 5 variables—(W2): sweet potato waste (g), (W5): cassava waste (g), (C): initial pH, (D): temperature (°C), and (E): pre-treatment—each with 3 levels, comprising 43 runs. The responses in all experiments were expressed in terms of conidia production. The predicted response was calculated using the second-degree polynomial equation, which includes all interaction terms, where Y response denotes the predicted response; β0 denotes the intercept; βi denotes the linear coefficient; βii denotes the quadratic coefficients; βij denotes the cross-product coefficients; and Xi, Xi 2, Xj denote the coded independent variables [31]. The independent variables were coded as W1, W2, and pH; therefore, the second-order polynomial equation was as follows:
Y = β 0 +   β i   X i +   β i j   X i   2 +   β i j   X i   X j
Using the Design Expert software, Version 13 (Stat-Ease Inc. Minneapolis, MN, USA), data from both designs were analyzed using analysis of variance (ANOVA) and multiple regression. To identify the significant model terms, a parameter of “Prob > F” less than 0.05 was employed. The model’s equations were created, and the interpretation of the data was based on the coefficients’ signs (whether they had a positive or negative impact on the response), as well as their statistical significance (p < 0.05). The same software was used to create 3D surface graphs to examine the relationships among the various variables.

2.4. Assessment of Shelf Life and Viability

Using the serial dilution approach, the conidia generation of T. lixii on a bioproduct was investigated. The colonized substrates were used in three separate 1 g samples. The surfactant Tween 80 (0.05% v/v) and 9 mL of sterilized dH2O were added to each sample. Glass beads were utilized to scoop up the conidia stuck to the substrate’s surface prior to shaking [6]. Using a vortex mixer, the suspensions were violently agitated for 1 min before being filtered through 2 layers of muslin cloth and repeated dilutions [32]. With the use of a hemocytometer slide, the conidia were counted. T. lixii population counts in the prepared product were noted at the beginning (0 month) and subsequently every 2 months for 12 months. During the storage period, the formulations’ shelf life was expressed as log10 CFU g−1 [33].

2.5. Effect of T. viride Bioformulations Generated on Plant Growth in a Cowpea Gnotobiotic Clay System

A variety of established T. lixii bioformulations (13 treatments) were combined with cowpea seeds (Kafrelsheikh) for an extended amount of time (30 min) at RT in the dark. The seeds were sterilized with 3% NaClO for around 2 min and rinsed three times in sterilized dH2O with a few drops of H2O2. Five replicates of three seeds each were inserted into 200 g plastic pots filled with sterilized clay soil. Some of the soil’s physical and chemical analyses are shown in Table 6. One week prior to planting, the inoculum of F. oxysporum (6 g, 1 × 10⁶ spores g−1) was given to the soil, and the soil was then watered with Hoagland solution [34]. Over the course of the 15-day experiment, cowpea seedlings were measured in terms of their length from the tip (shoot to root) [35], and the vigor index (VI) was calculated by multiplying the germination (%) of seedling length [36].

2.6. Cowpea Pot Experiments

To examine the effects of several established bioformulations on cowpea growth dynamics, the soil was intentionally infected with 300 g of the inoculum of F. oxysporum (1 × 10⁶ spores g−1) in a 10 kg polyethylene bag with an internal diameter of 30 cm and a height of 35 cm. The completely randomized experimental design underwent 5 repetitions. A total of 13 treatments, including 10 distinct bioformulation treatments created for T. lixii and 3 control treatments, were employed herein in a greenhouse at the Bacteriology Lab., SARS, Kafr El-Sheikh, in May 2022 (Table 7). According to the guidelines in the germination experiment section, cowpea seeds were surface-sterilized. The bioformulation treatments were mixed into the surface-sterilized seeds for a pre-determined amount of time. After the seedlings grew for one week, one plant from each treatment of five seeds was maintained. The required volumes of mineral fertilizers were applied, and the soil moisture level was kept between 60 and 65% saturation. After 50 days, the cowpea plants’ disease incidence (%), vegetative growth, physiological traits, antioxidant enzymes, phenolic content, and mineral content parameters were evaluated.

2.6.1. The Incidence of the Disease

After seeding (50 days), the plants were pulled and evaluated for disease incidence based on the previously suggested equation [37]:
The incidence of the disease (%) = No. of infected plants/No. of total plants × 100

2.6.2. Vegetative Growth

The fresh and dry mass (g plant−1), as well as shoot length and root length (cm plant−1), were measured after the harvest of three healthy plants per treatment. The fresh and dry mass were calculated using an electronic balance (ADAM, PW 214, 0.5 kg, UK).

2.6.3. Physiological Features

Using a UV spectrophotometer (Model 6705), a leaf sample was frozen from each treatment to assess the photosynthetic pigments, total soluble sugars (TSS), antioxidant enzymes, and phenolic content.

Photosynthetic Pigments

An amount of 0.1 g of leaf samples was crushed, then extracted in acetone (5 mL, 80%). The supernatant was measured at wavelengths of 663, 645, and 470 nm after being centrifuged at 13,000× g for 10 min. Chlorophyll a, b, total, and carotenoids were then calculated, and the carotenoid and chlorophyll contents were reported as µg g−1 FW and mg g−1 FW, respectively [38].

TSS

After being homogenized in EtOH (5 mL, 80%), a 0.5 g leaf sample was put in a water bath and heated at 80 °C for 30 min. To determine the concentration of TSS at 620 nm, the supernatants were collected and centrifuged (10,000× g for 10 min). The data were presented as µg g−1 FW, where glucose was utilized as the standard curve [39].

2.6.4. Antioxidant Enzymes

Peroxidase Activity (PO)

According to a related method [40], the oxidation of pyrogallol to purpurogallin with H2O2 was assessed to determine the activity of the peroxidase enzyme. Volumes of 3.0 mL of dH2O, 0.5 mL of 0.1 M sodium phosphate buffer (pH 7), 0.3 mL of the extract (enzyme), 0.05 mL of pyrogallol, and 0.1 mL of H2O2 (10%) were placed in the cuvette. PO activity was measured at 425 nm μM H2O2 g−1 FW min−1.

Polyphenol Oxidase Assay (PPO)

Briefly, 1.0 mL of sodium phosphate buffer (0.2 M, pH 7), 10.0 mL of catechol (0.001 M), 1.0 mL of the extract (enzyme), and 3.0 mL of dH2O were mixed together [41]. PPO activity was measured at 495 nm μM tetra–guaiacol g−1 min−1 FW.

Phenylalanine Ammonia Lyase Assay (PAL)

Phenylalanine ammonia lyase test enzyme was quantified using a previous procedure [42]. Briefly, the reaction consisted of 1.5 mL of borate buffer (0.2 M), 1 mL of phenylalanine (1%), 2.5 mL of dH2O, and pH 8.8. One milliliter of dH2O was added to phenylalanine as a blank. The mixture was incubated at 40 °C for 1 h. Afterward, the reaction was stopped by adding 0.5 mL of HCL (5N), and the activity of the enzyme was measured at 290 nm μmol min−1 g−1 FW.

Total Phenolic Content (TPC)

A volume of 10 mL of MeOH (80%) was used to homogenize 1 g of leaf tissue, which was then stirred for 15 min at 70 °C. The solution was held at 25 °C (1 mL of the methanolic extract + 5 mL of dH2O + 250 µL of Folin–Ciocalteu reagent, 1 N). Following the addition of 1 mL of saturated Na2CO3 and 1 mL of dH2O, the reaction mixture was incubated for an additional hour at 25 °C. The generated blue color’s absorption was measured at 725 nm. Based on the gallic acid calibration curve, TPC was determined and represented as mg GAE g−1 FW [43].

2.7. Chemical Contents of Leaves

Samples dried at 65 °C for 3 days were ground into a homogeneous powder (IKa-Werke, M 20 Darmstadt, Germany). N (%) was assessed using the micro-Kjeldahl method [44], where P and K% were evaluated using spectrophotometers and the atomic absorption spectrometry method, respectively [45,46].

2.8. Statistical Analyses

Data were subjected to analysis of variance using SPSS software (version 20; IBM Corp., Armonk, NY, USA). The mean separations were analyzed using Duncan’s multiple-range testing method, and significance was established at p ≤ 0.05 [47].

3. Results

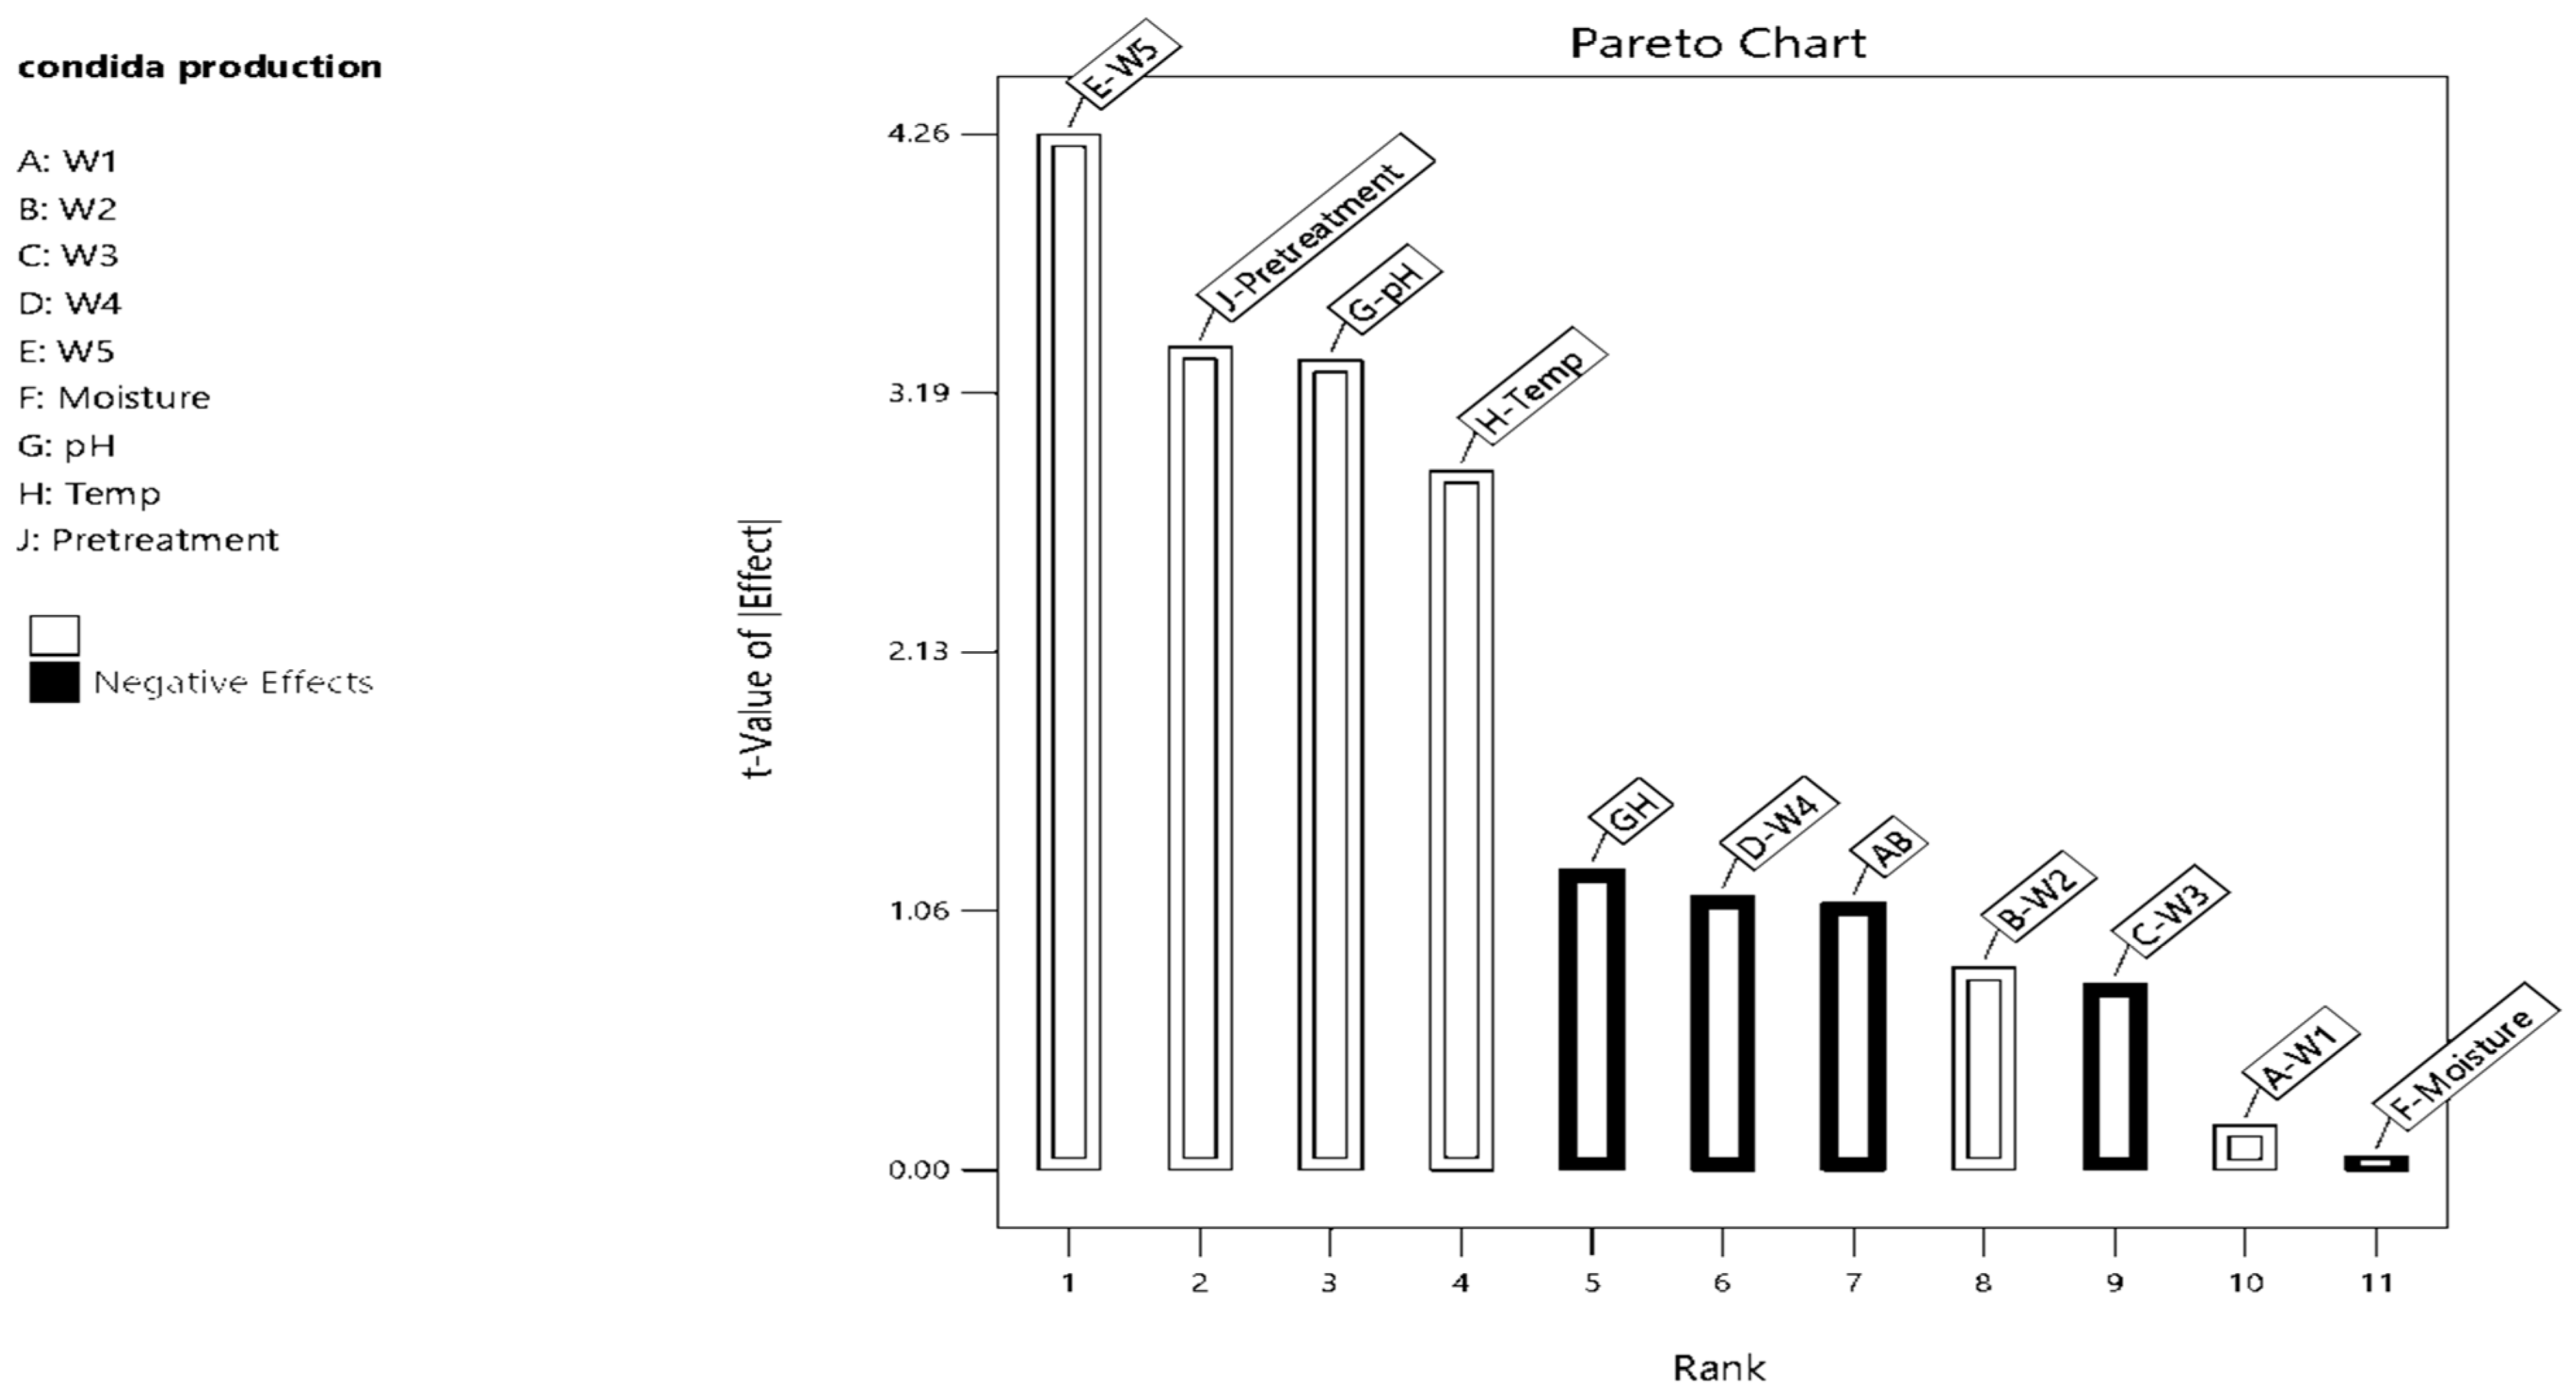
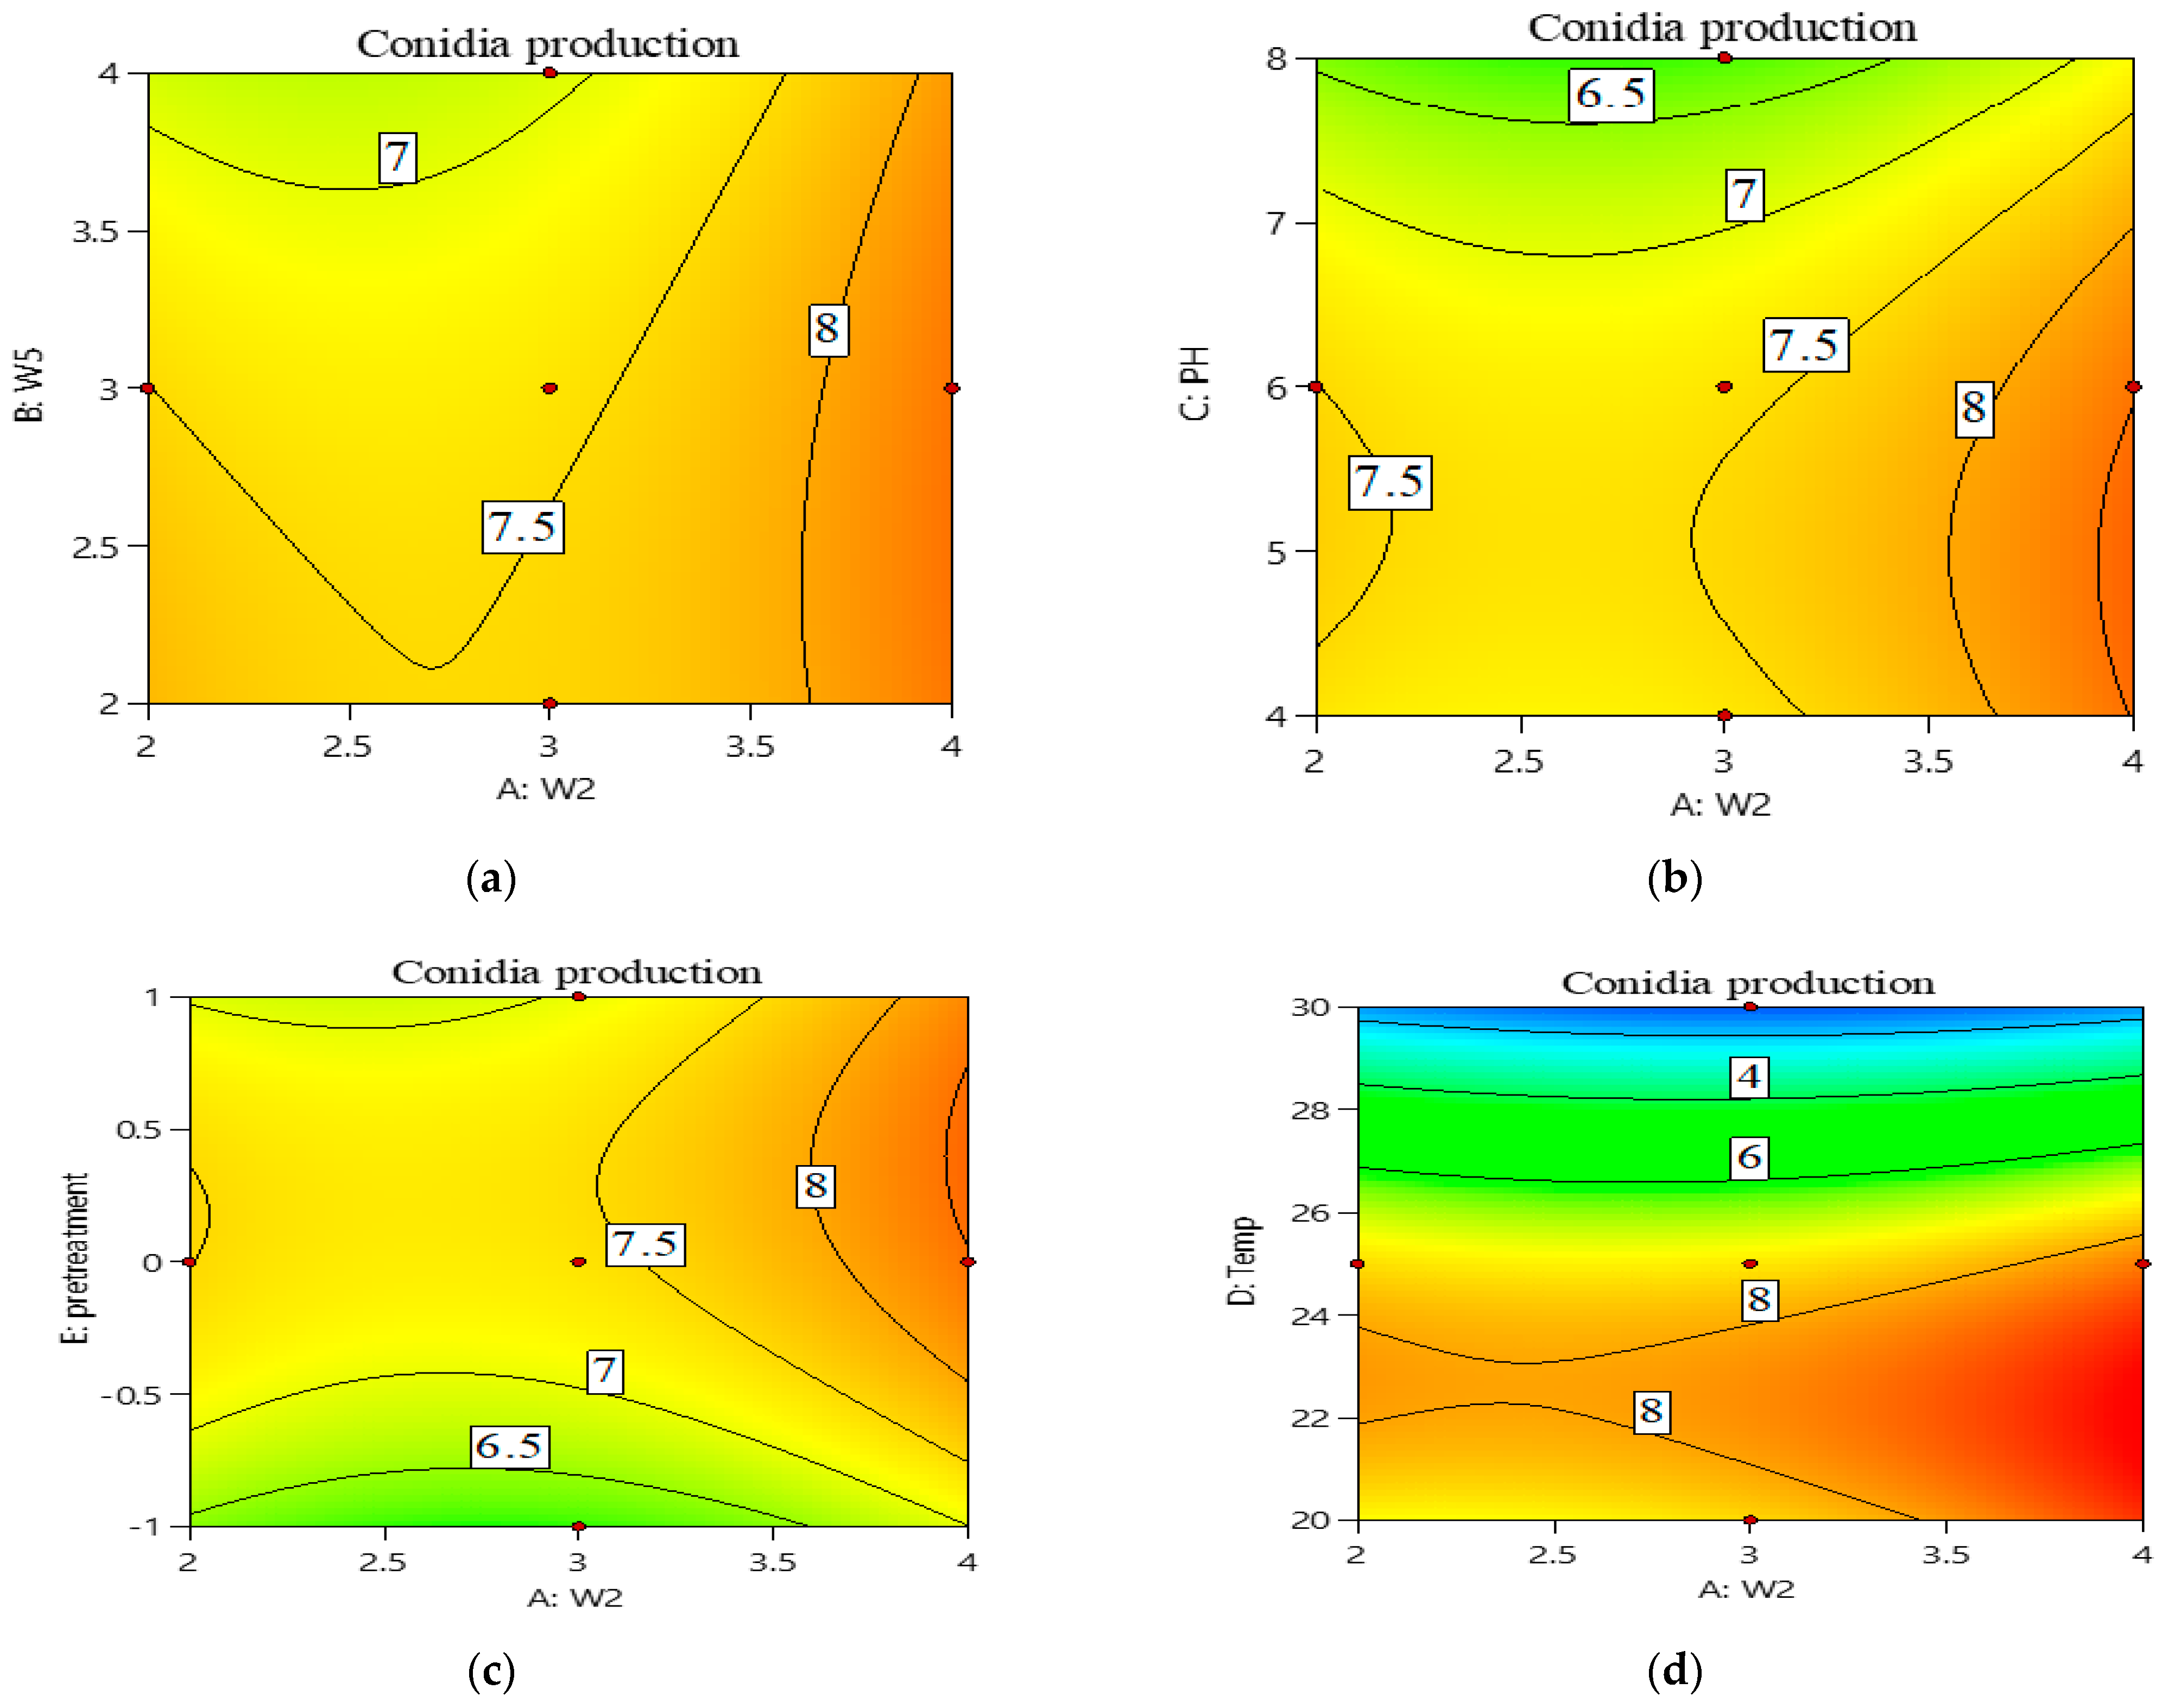
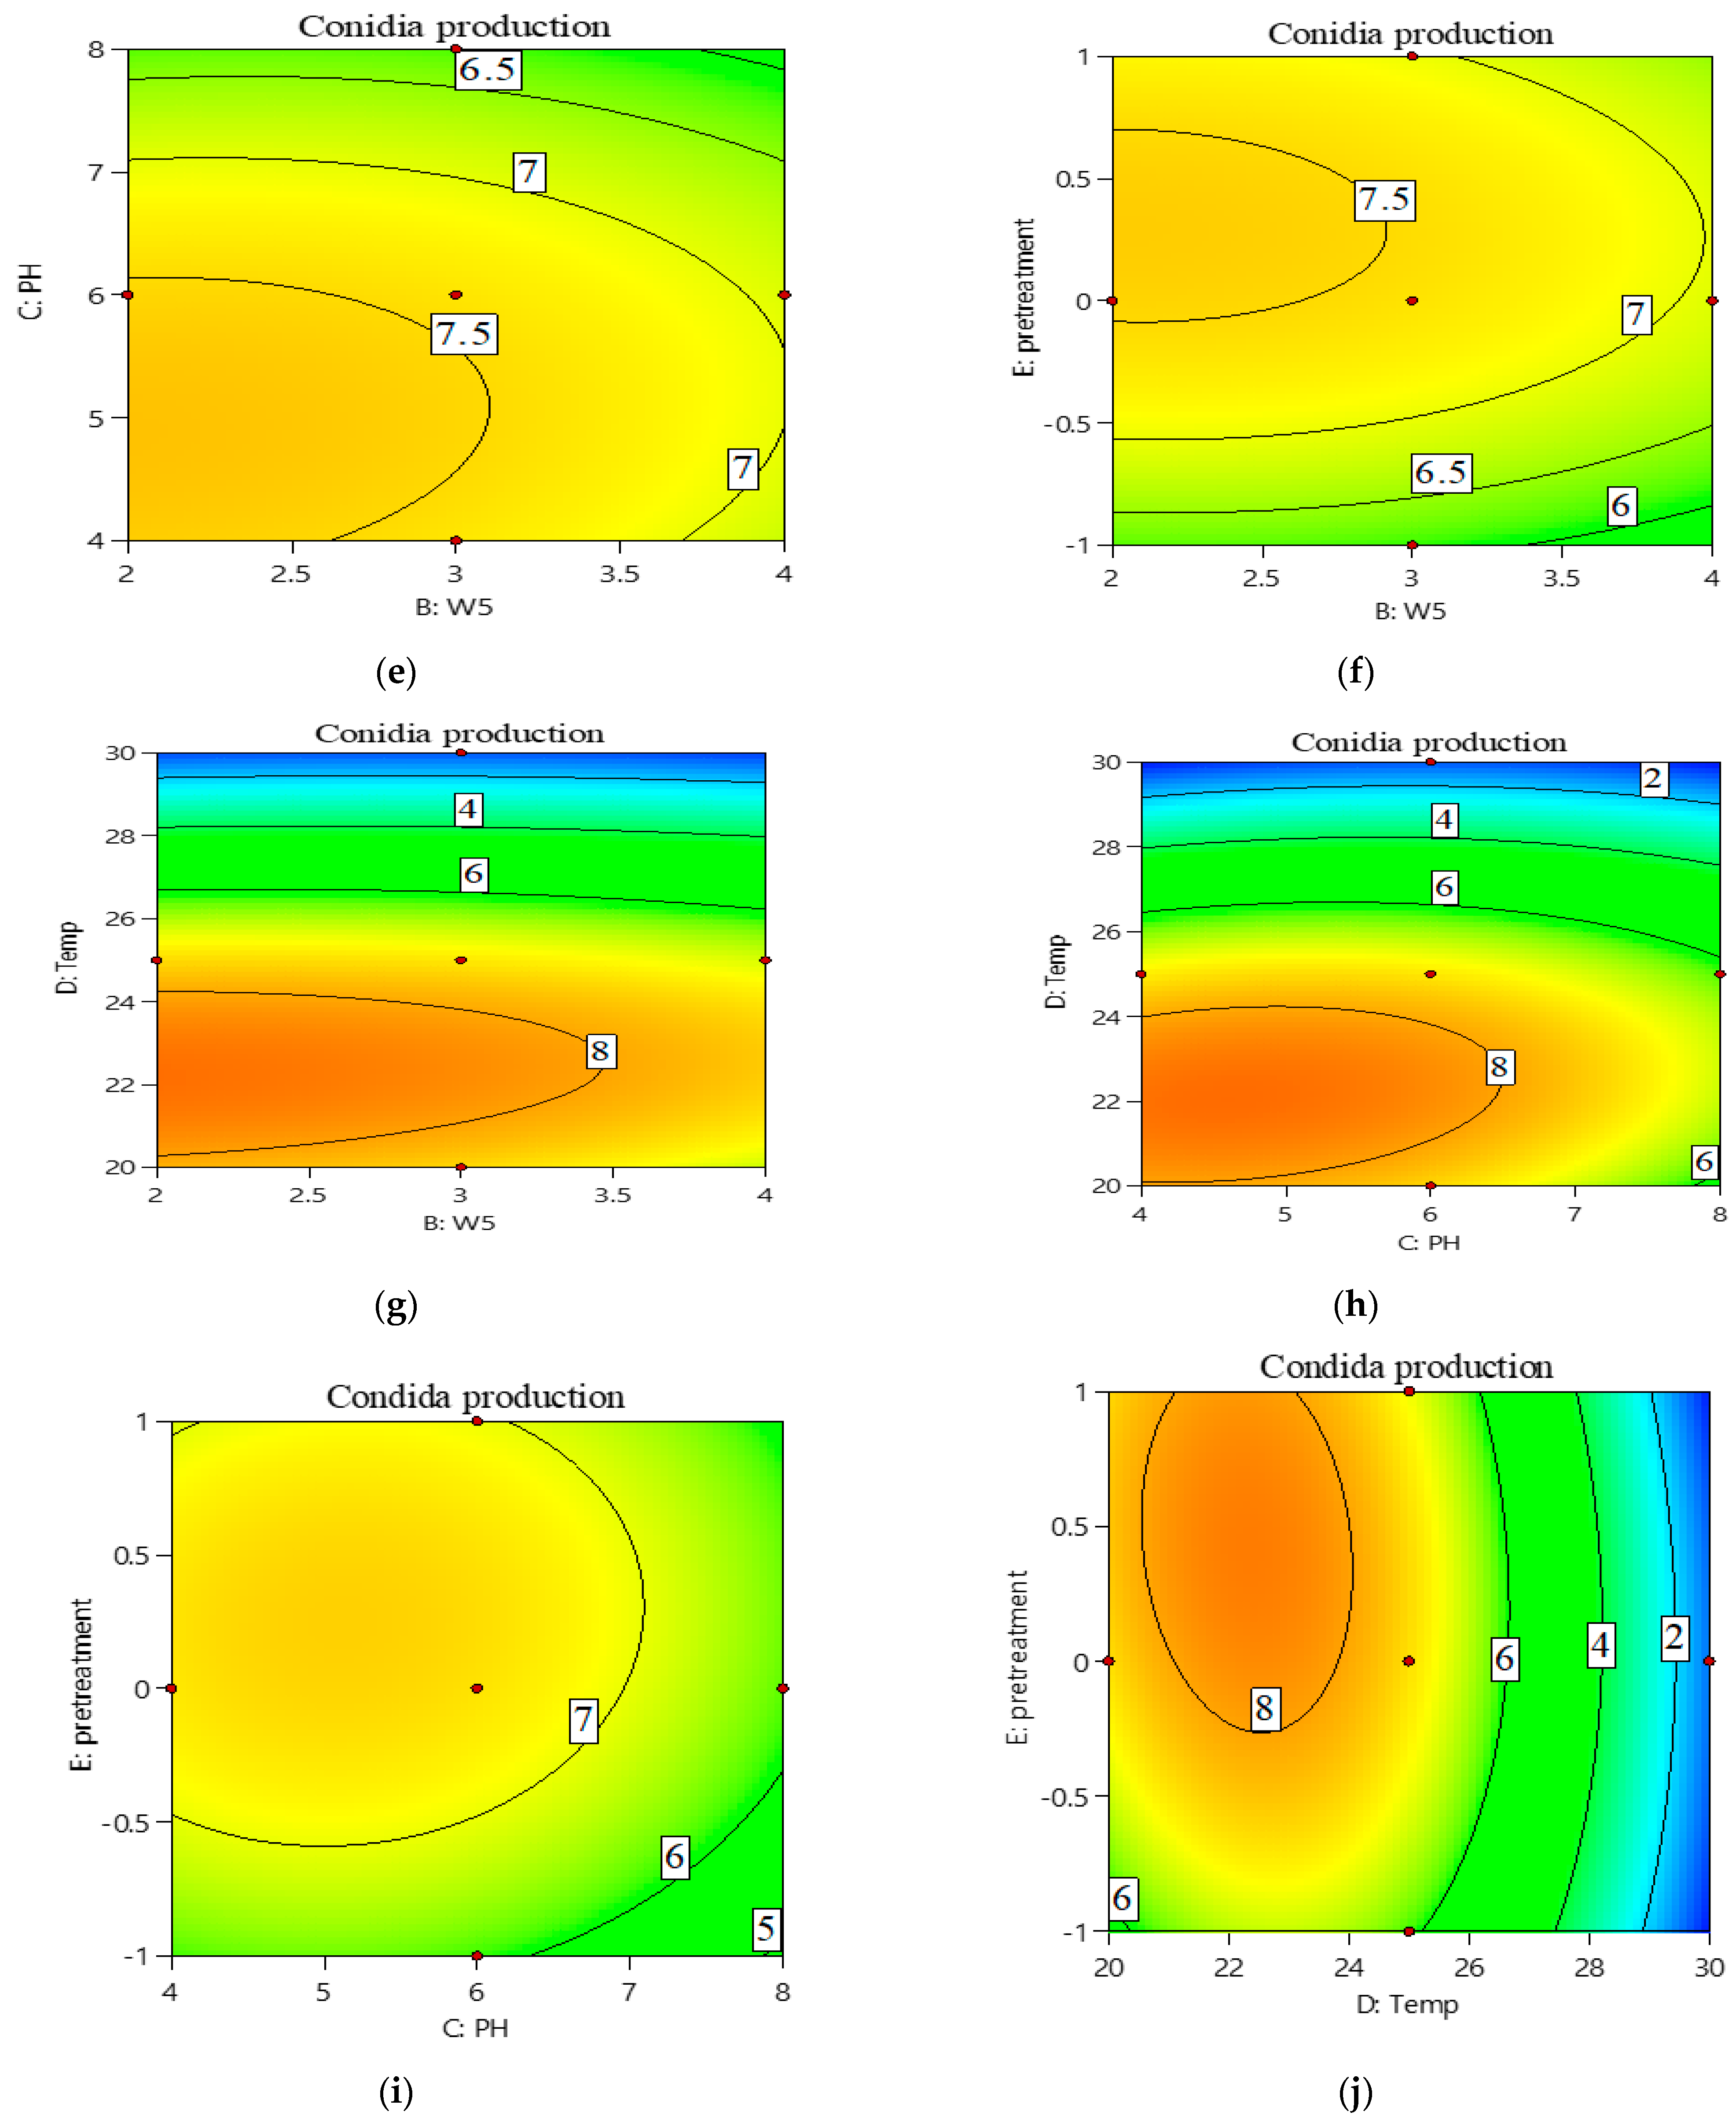
3.1. Optimization of the Culture Conditions Using Response Surface Design

The screening of the significant variables was conducted using PBD to determine their impact on biomass conidia production. A total of 12 runs were performed, each with different combinations of independent variables. The data of these runs, including their influences on conidia production, are presented in Table 8. The production of conidia exhibited a range of values, from 6.57 to 8.67 log mL−1, highlighting the importance of studying the composition of the medium to achieve higher productivity. The lowest conidia production was observed in trial run 9, while the highest production was achieved in trial run 5. This improvement was attributed to specific conditions, including a pH of 4, moisture level of 65%, temperature of 25 °C, and pre-treatment with water, cassava, and sweet potato as substrates in the growth medium (Table 8).
Furthermore, the main effects of the examined factors on conidia production were calculated and visualized in a Pareto chart (Figure 1), providing an indication of the magnitude and ranking of each factor’s influence. Analysis of the regression coefficients for the nine tested variables revealed that variables W3, W4, W1, and moisture had negative effects. Notably, no conidia production was observed in trial runs 7 and 11 (Figure 1).
The data obtained for biomass production were subjected to statistical analysis using ANOVA (Table 9 and Table 10). The model p-value of 0.005 indicates the significance of the model. Furthermore, it was discovered that the variables of cassava, pre-treatment, pH, temperature, and sweet potato were significant model terms (p-value < 0.05). There is a good agreement between the experimental and predicted values of conidia production, as indicated by the model R2 value of 0.999 and the adjusted R2 value of 0.998. The signal-to-noise ratio was used to determine the model’s adequate precision with a value of 76.64, above the desired value of 4, and the model’s coefficient of variance was 6.10%. All of the information given earlier demonstrated the model’s correctness and dependability and demonstrated that it could be used to reasonably explore the design space. The final equation using coded variables is displayed below.
Regression Equation for Uncoded Units’ Conidia production = 1.308 − 17.26 A + 1.945 B − 0.875 C + 0.869 D + 3.691 E + 0.6908 pH + 0.1109 Moisture + 0.3152 Temperature + 3.906 Pre-Treatment.

3.2. Central Composite Design (CCD) Approach for Optimization of Conidia Production

To show the relationship between conidia production and the experimental levels of each independent variable, 3D response surface plots were used (Figure 2a–j). While the other variables were kept at 0 levels, each graphic shows how two variables interact with one another. We were able to identify the beneficial and detrimental effects of many variables by examining the 3D figures. Figure 2a illustrates the relationship between sweet potatoes and cassava, demonstrating that while conidia production decreased when sweet potato concentration increased, it increased steadily when cassava concentration increased.
The interaction between sweet potato and pH of the fermentation medium is presented in Figure 2b. The highest conidia production was observed at the lowest and highest levels of sweet potato, but conidia production escalated with the gradual increase in initial pH, reaching its peak at pH 6. Figure 2c displays the maximum conidia production achieved with pre-treatment in trial run 1 (treatment with 0.5 NaOH). However, the highest yield was attained at the highest concentrations of sweet potato. Figure 2d presents the interplay between sweet potato and temperature, wherein the alteration in sweet potato concentration did not exhibit a noticeable effect on conidia production (all concentrations of A exhibited the highest candida production), while the maximum temperature ranged from 20 to 25 °C. As illustrated in Figure 2e, an increase in cassava concentration increased the conidia production. Conversely, the alteration in the initial pH of the medium significantly impacted their production. The interaction between cassava and pre-treatment is demonstrated in Figure 2f, wherein the highest concentration of conidia production was observed at a medium concentration of cassava, while pre-treatment in trial run 1 (treatment with 0.5 NaOH) increased conidia production. The highest production of conidia at concentrations of 3–5 g of cassava was observed at low temperatures in Figure 2g. The gradual increase in the initial pH of the fermentation medium and temperature affected conidia production (Figure 2 h–j), with the maximum conidia production observed at pH 6, temperature between 20 and 25 °C, and pre-treatment in trial run 1 (treatment with 0.5 NaOH).

3.3. Shelf Life and Viability of Bio-Fungicides

The formulated bio-fungicides produced using the SSF technique were composed of an 8% moisture mixture of talc powder and T. lixii spores (Table 11). The SSF technique proved useful for producing a variety of biocontrol agents. The formulated wet table powder retained the viability of T. lixii for a long time. The population of the biocontrol fungus declined slowly up to 7 months and then sharply decreased, starting to decline at 9 months. The population decline continued up to 12 months (Table 11).

3.4. Gnotobiotic System Experiment

Thirteen treatments, T1 through T13, based on various bioformulations of T. lixii, were applied to cowpea seeds grown in clay soil infected with F. oxysporum to examine their effects on seedling length and the vigor index (Figure 3). In general, for all treatments, seedlings treated with T. lixii bioformulations were substantially taller than the control (un-inoculated). When seeds were treated with T. lixii using treatment T12 (cowpea waste (4 g) + 4 g of cassava waste), the seedling length increased from 10.21 cm without fungal inoculation (T1) to 18.43 cm, and the differences were statistically significant (Figure 3). T12 bioformulations’ inoculation always resulted in the tallest seedlings relative to the reference treatment. For the vigor index (VI), similar trends were observed, as illustrated in Figure 3. When seeds were treated with T. lixii—especially treatment T12, which had the highest related VI values among the other treatments—the VI increased in all treatments relative to the control treatment (T1). However, such increases were particularly high in these cases. When cowpea seeds were subjected to various bioformulations, the VI increased in the control (T1) and T12 treatments, respectively, from 574.50 to 1670.99 (Figure 3). As a result, seedling length and the vigor index were frequently boosted by treatment T12 to a level, which was comparable to that of the reference treatment (T13).

3.5. Disease Incidence (%)

As portrayed in Figure 4, seed treatment with T. lixii with various bioformulations (T1–T13) significantly decreased the proportion of soil infection with F. oxysporum compared with the control treatment (T2). Seed treatment with T. lixii in T12 (cowpea waste (4 g) + cassava waste (4 g)) had the largest impact on reducing infection in comparison to control, followed by treatment T10 (cowpea waste (3 g) +cassava waste (3 g)) and treatment T11 (cowpea waste (3 g) + cassava waste (1 g)), recording 27, 33, 33.33, and 37.33%, respectively (Figure 4). Hence, treatment T12 always resulted in infection reduction equivalent to the reference treatment.

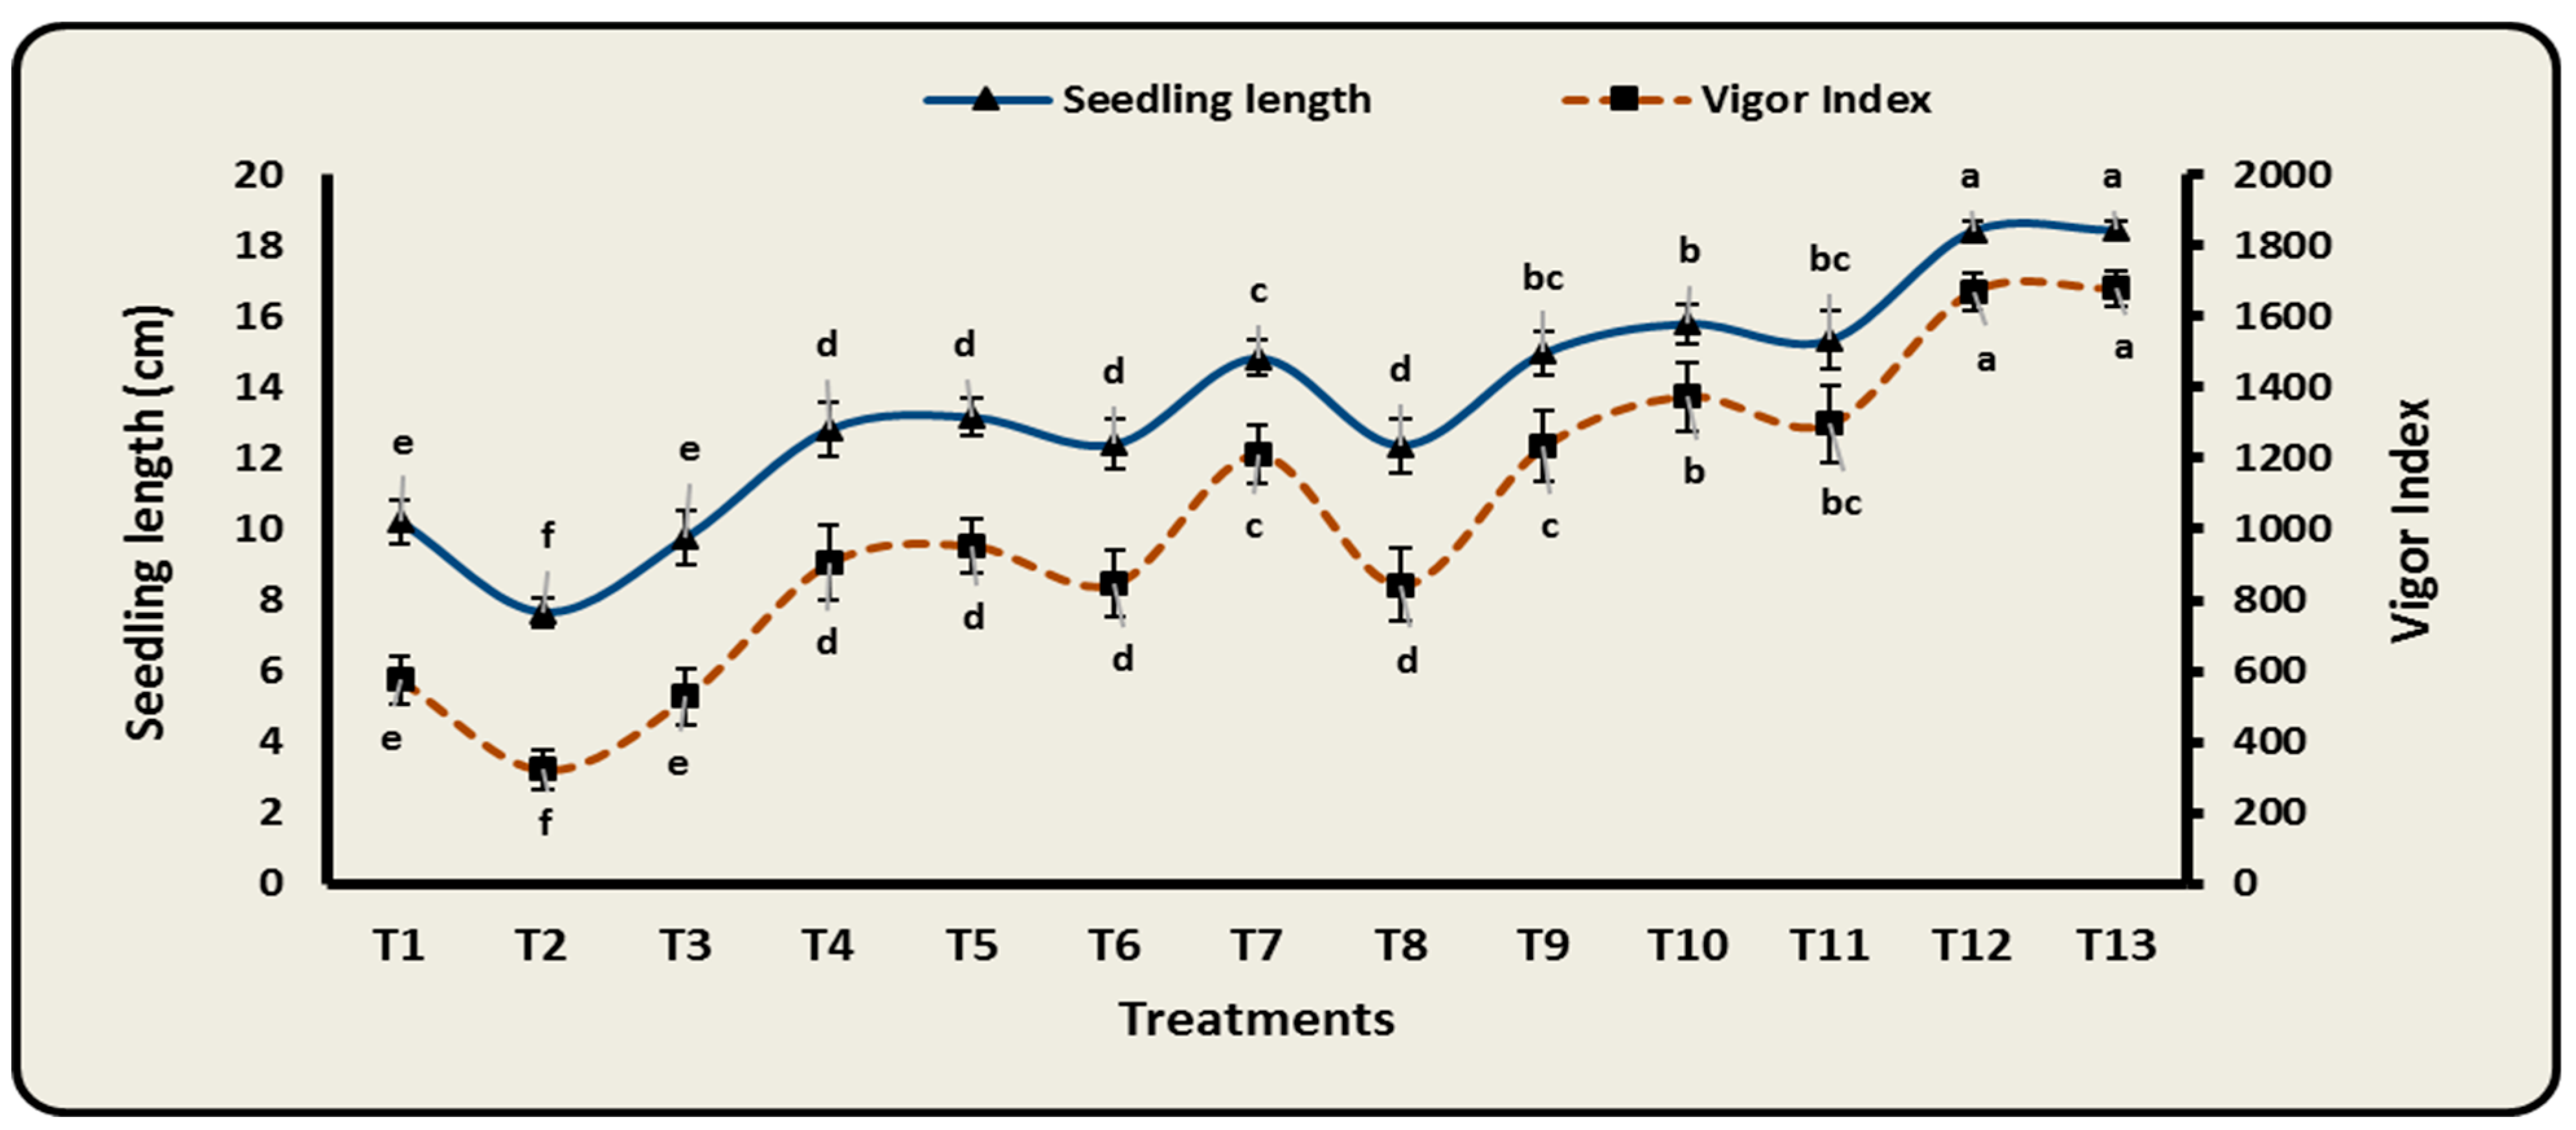
3.6. Effect of Different Bioformulations on Growth Characteristics of Cowpea Infected with F. oxysporum

To determine the most effective way of applying bioformulation (T. lixii) under F. oxysporum infection, a greenhouse pot experiment was performed using cowpea as a model crop. After 50 days of testing, the results from 13 treatments revealed that cowpea plants had F. oxysporum infection compared to control plants (not infected), with all vegetative parameters—including fresh and dry mass, shoot length, and root length—being lower than those of the control (Table 12). However, the inoculation of cowpea seeds with T. lixii mitigated this adverse effect of F. oxysporum stress. Cowpea seeds were given the T12 treatment, which included cowpea waste (4 g), pumpkin waste (4 g), and cassava waste (4 g). This greatly improved the growth dynamics under F. oxysporum infection (in comparison to stressed plants without T. lixii treatment and also to the control without infection), as tabulated in Table 12. For instance, the shoot and root lengths of cowpea plants were 29.54 and 14.03 cm, respectively. Additionally, the highest fresh mass (103.56 g plant−1) and the lowest dry mass (19.81 g plant−1) were similarly treated (Table 12). As a consequence, treatment T12 regularly increased vegetative growth to a level, which was on par with the reference treatment (T13).

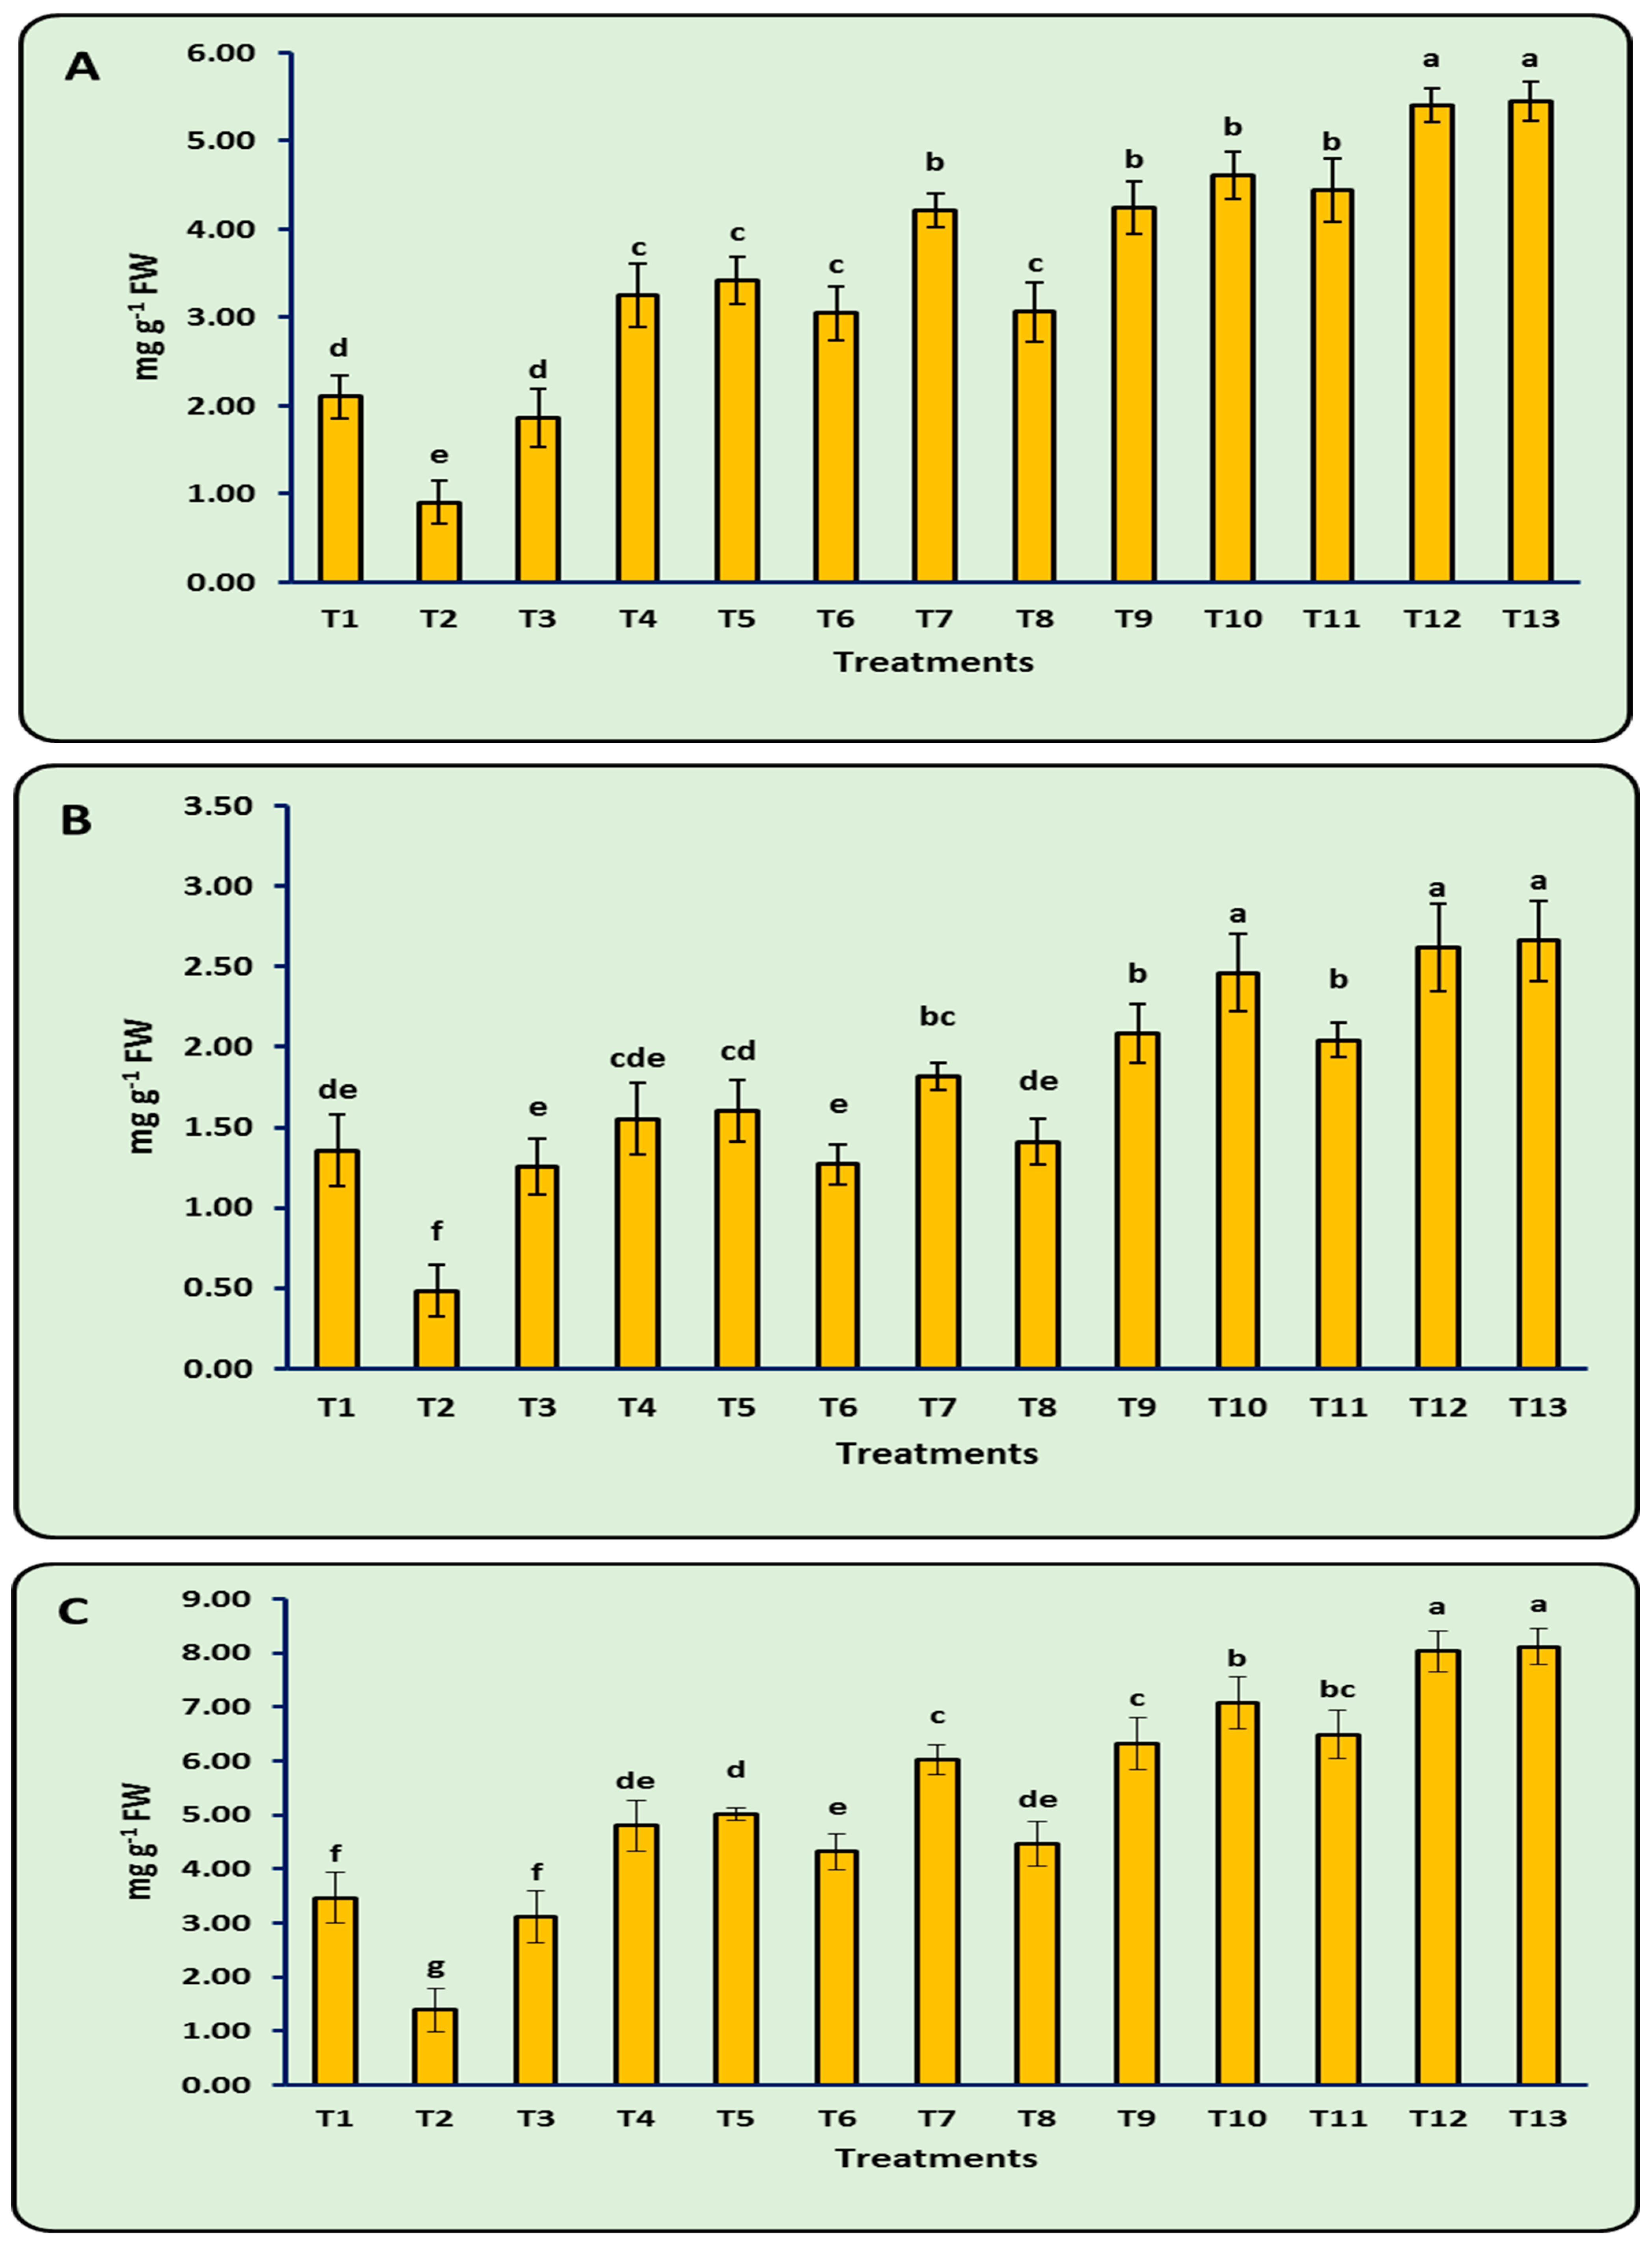
3.7. Photosynthetic Pigments

As observed in Figure 5, utilizing various bioformulation treatments under F. oxysporum-infected soil resulted in a significant (p ≤ 0.05) rise in the levels of photosynthetic pigments, such as Chl a, Chl b, total Chl, Caro, and TSS. Positive effects were observed in treatment T12, which was almost 5-fold more effective than the control treatment (T2), recording 5.41 mg g−1 FW for Ch a (Figure 5A), 2.62 mg g−1 FW for Ch b (Figure 5B), 8.03 mg g−1 FW for total Chl (Figure 5C), 1.57 µg g−1 FW for Caro (Figure 5D), and 5.25 µg g−1 FW for TSS (Figure 5E). Therefore, different bioformulation treatments were ranked as follows: T13 > T12 > T10 > T11 > T9 > T7 > T5 > T4 > T6 > T8 > T1 > T3 > T2. As a result, the photosynthetic pigments were consistently enhanced by treatment T12 to a level comparable to that of the reference treatment (T13).

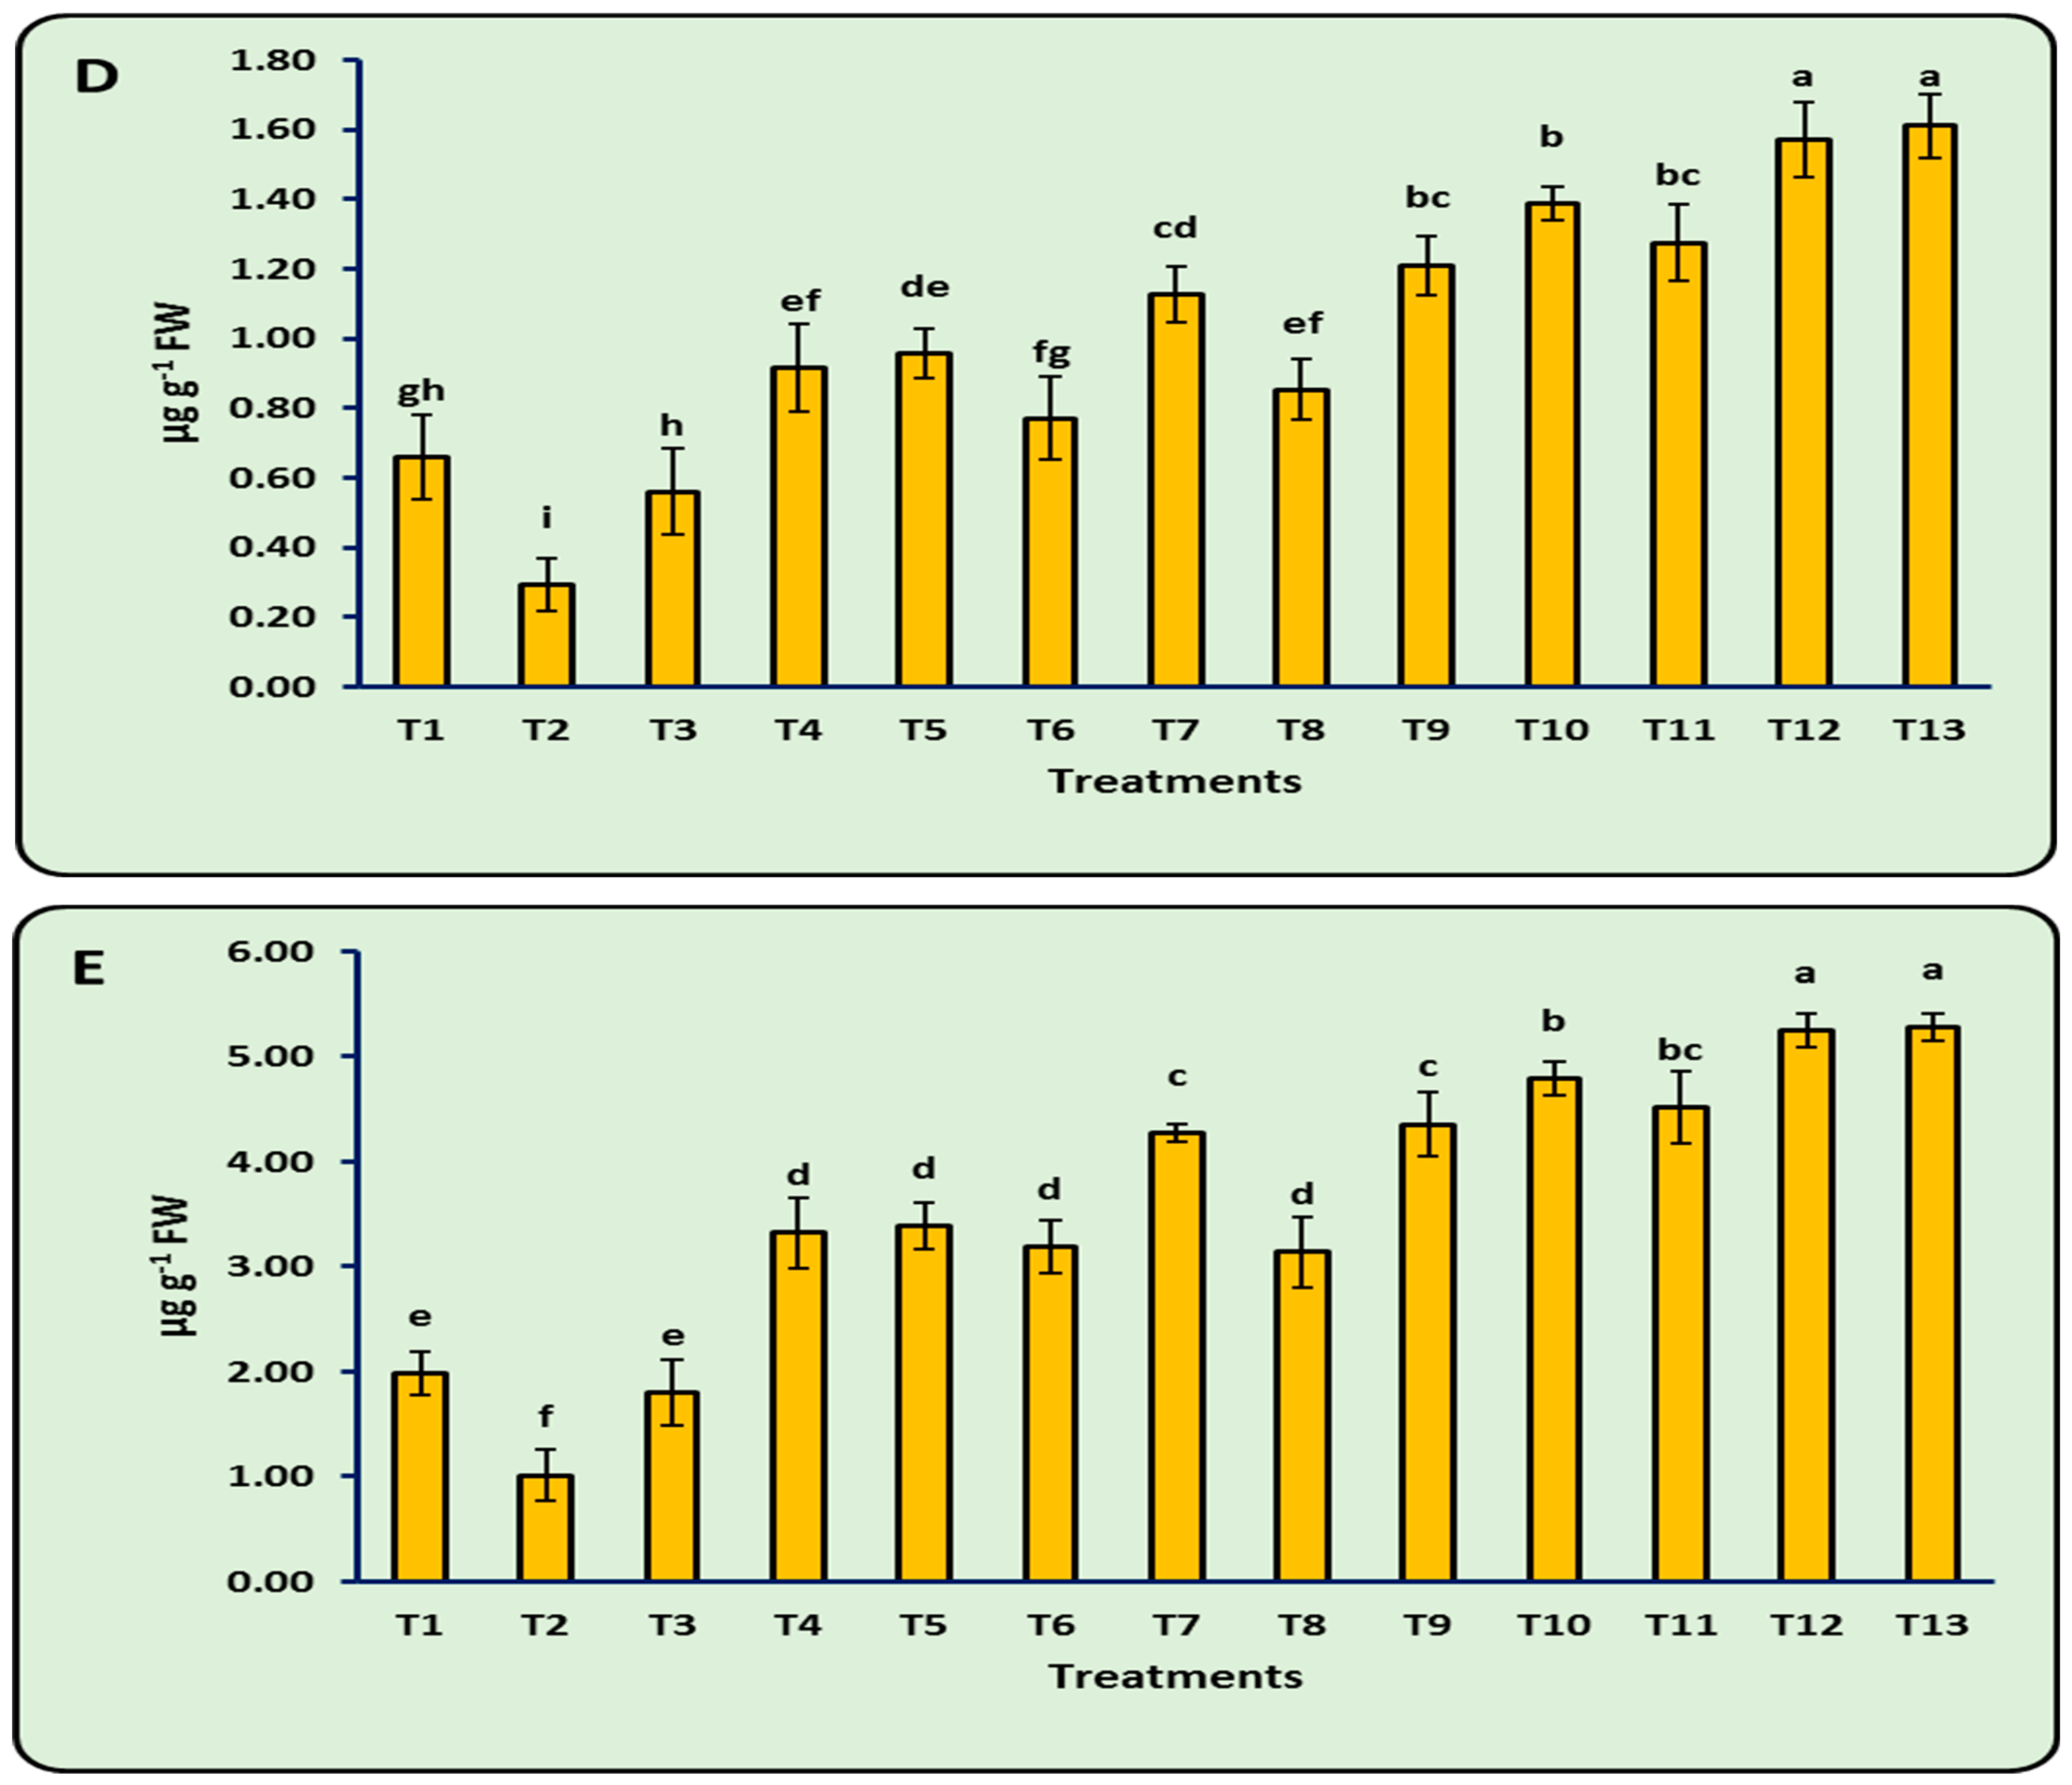
3.8. Antioxidant Enzymes

The data shown in Table 13 demonstrate that at 50 days after planting, cowpea plants treated with bioformulation treatments grown in soil infected with F. oxysporum increased their activity of the antioxidant enzymes PO, PPO, and PAL, as well as their TPC. As demonstrated in Table 13, the greatest values of PO activity (μM H2O2 g−1 FW min−1) in the treated seeds were significantly increased from 0.25 (control, T2) to 4.05 (T12).
Additionally, F. oxysporum-infected soil reduced the antioxidant capacity reflected by PPO activity in untreated cowpea seeds, whereas treating seeds with a different bioformulation mitigated the negative effects of infected soil on antioxidant capacity. Among all treatments, treatment T12 induced the activity of PPO enzyme (μM tetra–guaiacol g−1 min−1 FW), recording greater values than the control, which altered from 0.07 (T2) to 0.33 (T12). Meanwhile, the highest values of PAL enzyme activity (μmol min−1 g−1 FW) recorded were 5.43 for T12, followed by 4.81 for T10 and 4.60 for T11, compared to control and other treatments (Table 13). On the other hand, our findings on TPC were statistically significant (p ≤ 0.05). Data showed that an increase was observed, with T12 registering 25.07 mg GAE g−1 FW, followed by 22.79 mg GAE g−1 FW for T10, compared to control. Consequently, T12 consistently increased antioxidant enzymes to a level comparable to the reference treatment (T13).

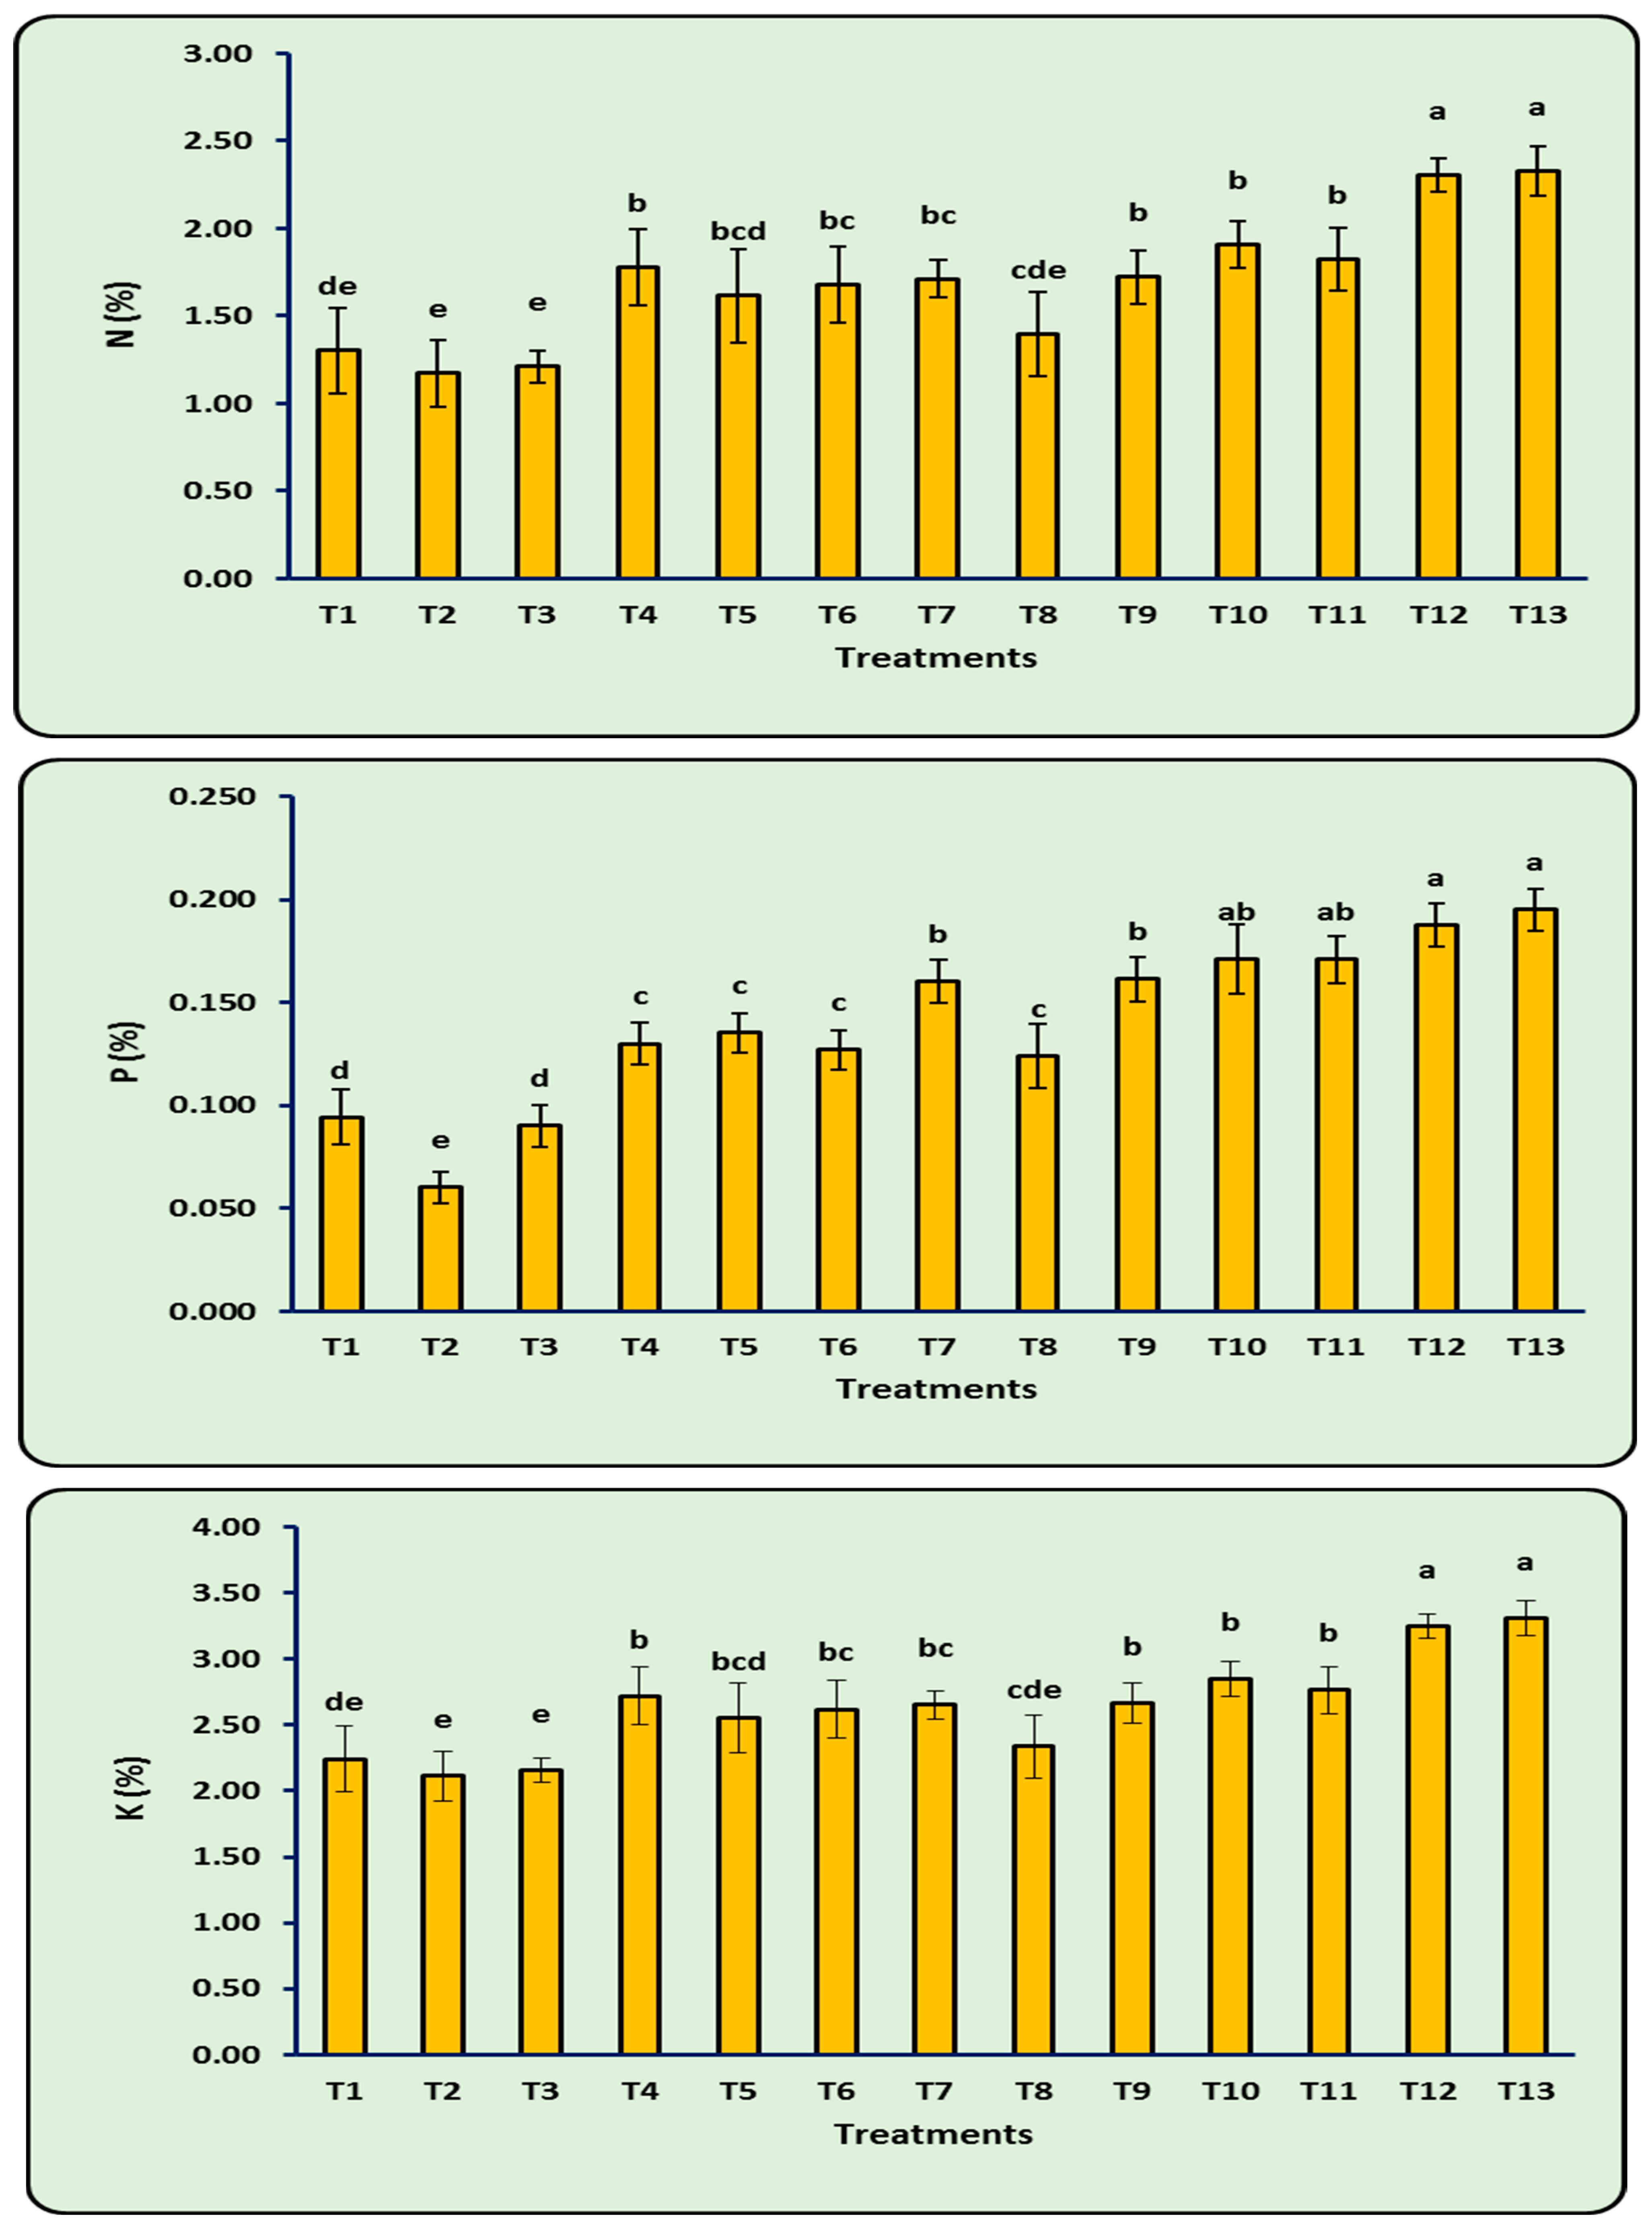
3.9. N, P, and K (%) of Leaves

The chemical composition of cowpea leaves (N, P, and K%) grown in soil infected with F. oxysporum differed significantly (p ≤ 0.05) depending on the different bioformulations of T. lixii (Figure 6). At 50 days after sowing, the treated cowpea seeds exhibited elevated N (%), from 1.17 (T2) to 2.31 (T12), whereas the same treatment significantly increased P (%) from 0.06 (T2) to 0.18 (T12) in comparison to other treatments. Comparing treatment T12 with the control and other treatments, the greatest K (%) values were 3.25 for T12, followed by 2.85 for T10 and 2.76 for T11 (Figure 6). As a result, the chemical compositions of cowpea leaves (N, P, and K) were consistently enhanced by T12 to a level comparable to that of the reference treatment (T13).

4. Discussion

Value-added goods made from agricultural waste are an excellent way of providing cost-effective carriers for producing bioproducts based on Trichoderma. With this approach, waste products may be safely utilized, the disposal costs can be reduced, and the negative effects on the environment can be mitigated. More research is required to identify the fermentation substrates, which may generate microbial populations for the formulation process and which are numerous, dependable, and efficient [48]. PBD and CCD were used to optimize the nutritional and growth conditions in terms of maximizing the production of Trichoderma conidia, which is highly dependent on the nutritional content of the substrates and the conditions in which it is cultured. PBD was initially used to investigate and determine the key elements influencing the growth of conidia. The determination coefficient (R2) of this model was 0.99, implying that the model was accurate for this process because there was an excellent fit between the observed and anticipated values of conidia production.
To further optimize the use of CCD, sweet potato, cassava, pH, temperature, and pre-treatment of substrates were chosen. At the concentration levels studied, it was discovered that they had a considerable impact on conidia production. Our findings concur with those of Ref. [49], whose authors found that Trichoderma is produced in copious quantities on various substrates based on its capacity to utilize carbon and nitrogen as a source of nourishment. In the response surface approach, the second-order CCD is crucial, especially when precise prediction and design economy are needed. Only three layers of each factor are used in CCD—a type of rotatable design [50,51]. In addition, with 3 g of sweet potato, 3 g of cassava, pH 6, 25 °C, and pre-treatment with dH2O, the numerical optimization for candida production was attempted. As would be assumed, pre-treatment, pH, and temperature are crucial physical variables, which significantly influence biomass production. Thus, this study provided the evidence that Trichoderma species thrive in acidic environments. The research by Ref. [52] demonstrated that fungal growth was more encouraged by an acidic pH than an alkaline pH. According to Ref. [53], Trichoderma grows more effectively in acidic soils than in alkaline soils; hence, it changes the rhizosphere soil by making it acidic. This clarifies why Trichoderma prefers an acidic pH.
According to Ref. [54], the pH range of 4.8–6.8 was ideal for mycelial growth in the isolate of T. harzianum. Any biological system’s activity is strongly influenced by temperature, which also has a significant impact on Trichoderma radial growth and sporulation. Trichoderma thrived and produced spores well between 20 and 25 °C, but at 30 °C, it was unable to perform either. According to Trichoderma species, 25 °C is the ideal temperature for maximizing conidia development (Figure 2a,b), agreeing with related findings in Ref. [55], whose authors found that the ideal temperature range for rapid development of Trichoderma species was between 25 and 30 °C. In contrast to the current study, Ref. [56] found that 10 °C was preferable to 20 and 30 °C for supporting T. harzianum maximal growth. Due to changes in the membrane shape and protein breakdown, microbial growth is hampered and produces fewer conidia at higher temperatures [57].
Temperature is the parameter, which has the greatest impact on SSF performance [32,55]. It is well known that enzymes, which have already been synthesized, and other enzymes required for microbial metabolic activities, become inactive at extremely high or low temperatures. Pre-treatment could further improve the delignification and desalination processes on lignocellulosic material because lignin is an essential component of cell walls and gives plants strength and resistance to microbial degradation [58]. Consequently, both cellulose and hemicellulose will be exposed to further saccharification by the selected conversion agent.
In the gnotobiotic system experiment, our findings demonstrated that bioformulation T12 (T. lixii + 4 g of cowpea waste + 4 g of cassava scraps) improved the cowpea seedling length and vigor index results in soil infected with F. oxysporum (Figure 3). These optimistic outcomes were a result of the bioformulation role of treatment T12 as an essential factor for plant growth. It helps permanently colonize the root surfaces of the plants and defends them from encroaching pathogens by erecting a physical barrier and producing concentrated amounts of antimicrobial compounds in the rhizoplane [59,60]. As a result, root colonization improves Trichoderma’s ability to induce induced systemic resistance (ISR), since it makes its connection with the host more stable [61,62]. Additionally, Trichoderma enhanced seedling length and the vigor index of tomato [63], eggplant—when mixed with peat and black gram bran or grass pea bran or gram bran 16 days after sowing [64]—onion [65], chickpea and lentil [66], tomato [59], and maize [67].
With regard to disease incidence (%), our research indicates that compared to the control treatment, the cowpea seeds treatment with various bioformulations of T. lixii significantly reduced the proportion of soil infection with plant pathogenic fungus F. oxysporum (Figure 4). The current results are consistent with those of Ref. [68], whose authors discovered that T. harzianum cp and T. harzianum T22 grown on peat-soil-based black gram bran were beneficial for reducing nursery diseases, such as damping-off, tip-over, and seedling blight diseases. Refs. [64,69,70,71] reported similar findings in several crops. Consequently, Trichoderma has developed several defense mechanisms against other fungi, as well as indirect means of supporting the development of roots and plants, such as saprotrophs, mycoparasites, soil-produced chitinase or cellulase, and plant symbionts, which degrade the cell walls of pathogenic micro-organisms. Therefore, for the effective management of diseases and other pressures, bioformulation and the characterization of different strains of Trichoderma are essential [72,73].
In comparison to the control plants (which were not infected), cowpea plants developed F. oxysporum infection after 50 days of testing, as evidenced by decreased values of all vegetative parameters, including fresh and dry mass, shoot length, and root length (Table 12). Our findings were in good alignment with those presented in Ref. [74], whose authors treated cucumber plants with T. harzianum, which resulted in increases in dry weight, shoot length, and root length of 80, 95, and 75%, respectively, over control plants. Additionally, potato inoculation with T. viride Tvd44 can promote growth in terms of height, roots, and leaf count [75]. A rise in the rate of photosynthetic activities, a rise in the rate of plant growth control, and a rise in rooting depth are likely the causes of this improvement in the growth dynamics [63], among other mechanisms. Rich inorganic soil substrates, such as bio-organic fertilizers, facilitate the colonization and proliferation of Trichoderma spp. fungi more effectively [71,76].
In terms of the photosynthetic pigments, T12 was 5-fold more effective than the control treatment (T2) for photosynthetic pigments (Figure 5). However, pathogen infection resulted in a drop in carotenoid, chlorophyll a and b levels in seedlings, demonstrating that there was a genotype-specific response to changes in chlorophyll content. Chlorophyll concentration, particularly chlorophyll a and b, is crucial for photosynthesis. A decrease in plant chlorophyll content has an impact on photosynthesis and lowers the yield [77]. In addition, the amount of chlorophyll in plants is another sign of the health of the plant [78]. Plant regulation mechanisms, including defense responses to biotic and abiotic stresses, are impacted by changes in the energy supply and signaling on the photosynthetic process [79]. Plant regulatory mechanisms are also impacted, including the defense mechanism in response to biotic and abiotic stressors. Mung beans may employ these changes in plant chlorophyll concentration as a defense mechanism to lessen the pathogen’s access to resources [80].
Regarding the antioxidant enzymes, the measurement of plant-defense-related enzymes, such PO, PPO, PAL, and TPC, and their role in plant defense mechanism induction was assessed. Enzymes involved in plant defense were also activated by treatment with T. lixii and pathogen infection (F. oxysporum) (Table 13). According to research by Ref. [81], peroxidase plays a crucial part at the beginning of the plant’s defense response against infections by building structural barriers (lignin accumulation) or by releasing more ROS and synthesizing phenolic chemicals to create highly toxic conditions. PO is also actively involved in growth-related self-regulation, such as respiration and photosynthesis [82].
On the other hand, due to its capacity to catalyze the oxidation of phenolic compounds into quinones and the production of lignin, PPO played a significant role in disease resistance [83]. According to Ref. [80], there was a negative association between PPO activity and the percentage of plants that survived, and there was no correlation between PPO activity and total phenol, indicating that PPO activity was not a direct factor in the induction of mung bean’s resistance to pathogenic fungi. Numerous research works have noted the different expressions of PAL; for instance, deoxynivalenol (DON, a Fusarium mycotoxin) affected the activity of PAL in wheat, which led to downregulation of PAL in vulnerable varieties [84]. Although it is difficult to understand Trichoderma’s inhibitory effect on PAL activity in the plant–pathogen–Trichoderma interaction, PAL reaction is not the only pathway for the body’s defense response, and PAL biosynthesis from L-phenylalanine may occur in the plant via more than one route [80].
Phenols, one of the largest and most varied classes of plant active compounds, are important for triggering defense reactions in response to pathogen infection and abiotic stress. Phenolics are engaged in the regulation of plant growth. When plants identify potential pathogens, phenolics are produced [85]. However, other variables affecting phenol accumulation include plant genetics or species [86], nutrient status, and environmental variables, such as temperature and light [87]. These variables suggest that the relationship between elicitor activity and specificity in a plant–microbe interaction is extremely complex.
In terms of N, P, and K percentages, the chemical composition of cowpea leaves (N, P, and K%) grown in soil infected with F. oxysporum differed significantly (p ≤ 0.05) depending on the different bioformulations of T. lixii (Figure 6). As a plant growth regulator, Trichoderma solubilizes minerals via hydrolysis, chelation, redox, and acidification [88]. These traits are supported by Refs. [89,90], whose authors discovered that T. harzianum produced organic acids, which support plant growth—such as tartaric acid, succinic acid, lactic acid, and citric acid—and solubilized iron (III), as well as solubilizing P from Ca3(PO4)2 [91]. According to Ref. [92], T. asperellum improved the plant’s systemic resistance, made the nutrients available via solubilization, and increased the surface area of root growth, all of which improved the nutrient uptake of Fusarium wilt diseased tomato plants. Additionally, T. harzianum can increase the performance of Fe, Mn, and Mg by lowering soil pH levels, maintaining soil fertility with sufficient nutrients [60,93].

5. Conclusions

Developing a dependable biocontrol agent requires determining the optimal formulation to overcome environmental restrictions and present the antagonist with a competitive edge against diseases and other micro-organisms. Furthermore, wheat is one of the most often used formulations; however, because it is a component of food, it is not always easily available, which has prompted the creation of various alternatives utilizing organic waste.
The production and deployment of T. lixii must be repeated in the field—according to the study—even if the current examination was conducted in a greenhouse. Based on these results, we conclude that cowpea bioformulations, such as those made of sweet potatoes and cassava, may be helpful in reducing the effects of F. oxysporum disease and promoting cowpea growth. Therefore, the current findings may be useful for developing disease management strategies for an integrated pest management program (IPM).

Author Contributions

Conceptualization, methodology, software, validation, formal analysis, investigation, resources, data curation, writing—original draft preparation, writing—review and editing, visualization: A.E.-D.O. and F.M.E.-m.; supervision: A.E.-D.O.; project administration: A.E.-D.O.; funding acquisition: A.E.-D.O. and F.M.E.-m. All authors have read and agreed to the published version of the manuscript.

Funding

This research received no external funding.

Institutional Review Board Statement

Not applicable.

Informed Consent Statement

Not applicable.

Data Availability Statement

The study did not report any data.

Acknowledgments

All authors are grateful for the support provided by the Soils, Water, and Environment Research Institute (SWERI), Agriculture Research Center (ARC), Egypt.

Conflicts of Interest

The authors declare no conflict of interest.

References

  1. Rajak, P.; Roy, S.; Ganguly, A.; Mandi, M.; Dutta, A.; Das, K.; Nanda, S.; Ghanty, S.; Biswas, G. Agricultural pesticides–Friends or foes to biosphere? J. Hazard. Mater. Adv. 2023, 10, 100264. [Google Scholar] [CrossRef]
  2. Ayilara, M.S.; Adeleke, B.S.; Akinola, S.A.; Fayose, C.A.; Adeyemi, U.T.; Gbadegesin, L.A.; Omole, R.K.; Johnson, R.M.; Uthman, Q.O.; Babalola, O.O. Biopesticides as a promising alternative to synthetic pesticides: A case for microbial pesticides, phytopesticides, and nanobiopesticides. Front. Microbiol. 2023, 14, 1040901. [Google Scholar] [CrossRef] [PubMed]
  3. Ngegba, P.M.; Cui, G.; Khalid, M.Z.; Zhong, G. Use of botanical pesticides in agriculture as an alternative to synthetic pesticides. Agriculture 2022, 12, 600. [Google Scholar] [CrossRef]
  4. El-Saadony, M.T.; Saad, A.M.; Soliman, S.M.; Salem, H.M.; Ahmed, A.I.; Mahmood, M.; El-Tahan, A.M.; Ebrahim, A.A.; El-Mageed, A.; Taia, A.; et al. Plant growth-promoting microorganisms as biocontrol agents of plant diseases: Mechanisms, challenges and future perspectives. Front. Plant Sci. 2022, 13, 923880. [Google Scholar] [CrossRef]
  5. Pathak, V.M.; Verma, V.K.; Rawat, B.S.; Kaur, B.; Babu, N.; Sharma, A.; Dewali, S.; Yadav, M.; Kumari, R.; Singh, S.; et al. Current status of pesticide effects on environment, human health and it’s eco-friendly management as bioremediation: A comprehensive review. Front. Microbiol. 2022, 13, 2833. [Google Scholar] [CrossRef] [PubMed]
  6. Naeimi, S.; Khosravi, V.; Varga, A.; Vágvölgyi, C.; Kredics, L. Screening of organic substrates for solid-state fermentation, viability and bioefficacy of Trichoderma harzianum AS12-2, a biocontrol Strain against Rice Sheath Blight Disease. J. Agron. 2020, 10, 1258. [Google Scholar] [CrossRef]
  7. Bonaterra, A.; Badosa, E.; Daranas, N.; Francés, J.; Roselló, G.; Montesinos, E. Bacteria as biological control agents of plant diseases. Microorganisms 2022, 10, 1759. [Google Scholar] [CrossRef]
  8. Vassileva, M.; Malusà, E.; Sas-Paszt, L.; Trzcinski, P.; Galvez, A.; Flor-Peregrin, E.; Shilev, S.; Canfora, L.; Mocali, S.; Vassilev, N. Fermentation strategies to improve soil bio-inoculant production and quality. Microorganisms 2021, 9, 1254. [Google Scholar] [CrossRef]
  9. Teixidó, N.; Usall, J.; Torres, R. Insight into a successful development of biocontrol agents: Production, formulation, packaging, and shelf life as key aspects. Horticulturae 2022, 8, 305. [Google Scholar] [CrossRef]
  10. Lewis, J.A.; Papavizas, G. Biocontrol of plant diseases: The approach for tomorrow. Crop. Prot. 1991, 10, 95–105. [Google Scholar] [CrossRef]
  11. Rayhane, H.; Josiane, M.; Gregoria, M.; Yiannis, K.; Nathalie, D.; Ahmed, M.; Sevastianos, R. From flasks to single used bioreactor: Scale-up of solid state fermentation process for metabolites and conidia production by Trichoderma asperellum. J. Environ. Manag. 2019, 252, 109496. [Google Scholar] [CrossRef] [PubMed]
  12. Sala, A.; Artola, A.; Sánchez, A.; Barrena, R. Rice husk as a source for fungal biopesticide production by solid-state fermentation using B. bassiana and T. harzianum. Bioresour. Technol. 2019, 296, 122322. [Google Scholar] [CrossRef] [PubMed]
  13. Mattedi, A.; Sabbi, E.; Farda, B.; Djebaili, R.; Mitra, D.; Ercole, C.; Cacchio, P.; Del Gallo, M.; Pellegrini, M. Solid-State Fermentation: Applications and Future Perspectives for Biostimulant and Biopesticides Production. Microorganisms 2023, 11, 1408. [Google Scholar] [CrossRef] [PubMed]
  14. Šelo, G.; Planinić, M.; Tišma, M.; Tomas, S.; Koceva Komlenić, D.; Bucić-Kojić, A. A comprehensive review on valorization of agro-food industrial residues by solid-state fermentation. Foods 2021, 10, 927. [Google Scholar] [CrossRef]
  15. López-Trujillo, J.; Mellado-Bosque, M.; Ascacio-Valdés, J.A.; Prado-Barragán, L.A.; Hernández-Herrera, J.A.; Aguilera-Carbó, A.F. Temperature and pH Optimization for Protease Production Fermented by Yarrowia lipolytica from Agro-Industrial Waste. Fermentation 2023, 9, 819. [Google Scholar] [CrossRef]
  16. Sadh, P.K.; Duhan, S.; Duhan, J.S. Agro-industrial wastes and their utilization using solid state fermentation: A review. Bioresour. Bioprocess. 2018, 5, 1–5. [Google Scholar] [CrossRef]
  17. Steudler, S.; Werner, A.; Walther, T. It Is the Mix that Matters: Substrate-Specific Enzyme Production from Filamentous Fungi and Bacteria through Solid-State Fermentation. In Solid State Fermentation, Research and Industrial Applications; Werner, A., Steudler, S., Cheng, J.J., Eds.; Springer Nature: Cham, Switzerland, 2019; pp. 51–81. [Google Scholar]
  18. Zin, N.A.; Badaluddin, N.A. Biological functions of Trichoderma spp. for agriculture applications. Ann. Agric. Sci. 2020, 65, 168–178. [Google Scholar] [CrossRef]
  19. Collinge, D.B.; Jensen, D.F.; Rabiey, M.; Sarrocco, S.; Shaw, M.W.; Shaw, R.H. Biological control of plant diseases—What has been achieved and what is the direction? Plant Pathol. 2022, 71, 1024–1047. [Google Scholar] [CrossRef]
  20. Ayaz, M.; Li, C.H.; Ali, Q.; Zhao, W.; Chi, Y.K.; Shafiq, M.; Ali, F.; Yu, X.Y.; Yu, Q.; Zhao, J.T.; et al. Bacterial and Fungal Biocontrol Agents for Plant Disease Protection: Journey from Lab to Field, Current Status, Challenges, and Global Perspectives. Molecules 2023, 28, 6735. [Google Scholar] [CrossRef]
  21. Mendoza-Mendoza, A.; Clouston, A.; Li, J.-H.; Nieto-Jacobo, M.F.; Cummings, N.; Steyaert, J.; Hill, R. Isolation and Mass Production of Trichoderma. In Microbial-Based Biopesticides, Methods in Molecular Biology; Glare, T.R., Moran-Diez, M.E., Eds.; Humana Press: New York, NY, USA, 2016; Volume 1477, pp. 13–20. [Google Scholar]
  22. Abbey, L.; Abbey, J.; Leke-Aladekoba, A.; Iheshiulo, E.M.; Ijenyo, M. Biopesticides and Biofertilizers: Types, Production, Benefits, and Utilization. In Byproducts from Agriculture and Fisheries: Adding Value for Food, Feed, Pharma, and Fuels; Simpson, B.K., Aryee, A.N.A., Toldrá, F., Eds.; John Wiley & Sons Ltd.: New York, NY, USA, 2020; pp. 479–500. [Google Scholar]
  23. Mekonnen, T.W.; Gerrano, A.S.; Mbuma, N.W.; Labuschagne, M.T. Breeding of vegetable cowpea for nutrition and climate resilience in Sub-Saharan Africa: Progress, opportunities, and challenges. Plants 2022, 11, 1583. [Google Scholar] [CrossRef]
  24. Adekunle, A.T.; Cardwell, K.F.; Florini, D.A.; Ikotun, T. Seed treatment with Trichoderma species for control of damping-off of cowpea caused by Macrophomina phaseolina. Biocontrol. Sci. Technol. 2001, 11, 449–457. [Google Scholar] [CrossRef]
  25. Lewis, J.A.; Lumsden, R.D. Biocontrol of damping-off of greenhouse-grown crops caused by Rhizoctonia solani with a formulation of Trichoderma spp. Crop Prot. 2001, 20, 49–56. [Google Scholar] [CrossRef]
  26. Hamed, E.R.; Awad, H.M.; Ghazi, E.A.; El-Gamal, N.G.; Shehata, H.S. Trichoderma asperellum isolated from salinity soil using rice straw waste as biocontrol agent for cowpea plant pathogens. J. Appl. Pharm. Sci. 2015, 5, 91–98. [Google Scholar] [CrossRef]
  27. Naseri, B.; Younesi, H. Beneficial microbes in biocontrol of root rots in bean crops: A meta-analysis (1990–2020). Physiol. Mol. Plant Pathol. 2021, 116, 101712. [Google Scholar] [CrossRef]
  28. Fraceto, L.F.; Maruyama, C.R.; Guilger, M.; Mishra, S.; Keswani, C.; Singh, H.B.; de Lima, R. Trichoderma harzianum-based novel formulations: Potential applications for management of next-gen agricultural challenges. J. Chem.Technol. Biotechnol. 2018, 93, 2056–2063. [Google Scholar] [CrossRef]
  29. Box, G.E.P.; Wilson, K.B. On the experimental attainment of optimum conditions. J. Roy Stat. Soc. B 1951, 13, 27. [Google Scholar] [CrossRef]
  30. Box, G.E.P.; Hunter, J.S. Multifactor experimental design for exploring the response surfaces. Ann. Math. Stat. 1957, 28, 195–242. [Google Scholar] [CrossRef]
  31. Plackett, R.L.; Burman, J.P. The design of optimum multifactorial experiments. Biometrica 1946, 33, 305–325. [Google Scholar] [CrossRef]
  32. Mishra, P.K.; Khan, F.N. Effect of different growth media and physical factors on biomass production of Trichoderma viride. People’s J. Sci. Res. 2015, 8, 11–17. [Google Scholar]
  33. Carboué, Q.; Claeys-Bruno, M.; Bombarda, I.; Sergent, M.; Jolain, J.; Roussos, S. Experimental design and solid state fermentation: A holistic approach to improve cultural medium for the production of fungal secondary metabolites. Chemom. Intell. Lab. Syst. 2018, 176, 101–107. [Google Scholar] [CrossRef]
  34. El-Shabrawy, E.; Heba, S. Controlling maize late-wilt and enhancing plant salinity tolerance by some rhizobacterial strains. Egypt. J. Phytopathol. 2018, 46, 235–255. [Google Scholar] [CrossRef]
  35. Belimov, A.A.; Hontzeas, N.; Safronova, V.I.; Demchinskaya, S.V.; Piluzza, G.; Bullitta, S.; Glick, B.R. Cadmium-tolerant plant growth-promoting bacteria associated with the roots of Indian mustard (Brassica juncea L. Czern.). Soil Biol. Biochem. 2005, 37, 241–250. [Google Scholar] [CrossRef]
  36. Luo, J.; Tang, S.Q.; Hu, P.S.; Aleman, L.; Jiao, G.A.; Tang, J. Analysis on factors affecting seedling establishment in rice. Rice Sci. 2007, 14, 27–32. [Google Scholar] [CrossRef]
  37. Crowe, F.J.; Debons, J.; Darnell, T.; McGrath, D.; Koepsell, P.; Laborde, J.; Redondo, J. Control of Allium white rot with DADS and related products. In Proceedings of the Fifth International Workshop on Allium White Rot, Cordoba, Spain, 1994; Entwistle, A.R., Melero-Vara, J.M., Eds.; HRI: Norwich, UK, 1994; pp. 15–19. [Google Scholar]
  38. Lichtenthaler, H.K. Chlorophylls and carotenoids: Pigments of photosynthetic biomembranes. In Methods in Enzymology; Academic Press: San Diego, CA, USA, 1987; Volume 148, pp. 350–382. [Google Scholar]
  39. Hendrix, D.L. Rapid extraction and analysis of nonstructural carbohydrates in plant tissues. Crop. Sci. 1993, 33, 1306–1311. [Google Scholar] [CrossRef]
  40. Srivastava, S.K. Peroxidase and polyphenol-oxidase in Brassica juncea plants infected with Macrophomina phaseolina (Tassi): Goid of and their implication in disease resistance. Phytopathology 1987, 120, 249–254. [Google Scholar] [CrossRef]
  41. Matta, A.I.; Dimond, A.F. Symptoms of Fusarium wilt in relation to quantity of fungus and enzyme activity in tomato stems. Phytopathology 1963, 53, 574–578. [Google Scholar]
  42. Zucker, M. Sequential induction of phenylalanine ammonia layse and lyase in inactivating system in potato tuber disks. Plant Physiol. 1968, 43, 365–374. [Google Scholar] [CrossRef]
  43. Zieslin, N.; Ben-Zaken, R. Peroxidase activity and presence of phenolic substances in peduncles of rose flowers. Plant Physiol Biochem. 1993, 31, 333–339. [Google Scholar]
  44. Page, A.L.; Miller, R.H.; Keeny, D.R. Methods of Soil Analysis, Part II, Agronomy Monographs ASA and SSSA, 2nd ed.; Madison Book Company: Madison, WI, USA, 1982. [Google Scholar]
  45. Murphy, J.; Riley, J.P. A modified single solution method for the determination of phosphate in natural waters. Anal. Chim. Acta 1962, 27, 31–36. [Google Scholar] [CrossRef]
  46. USDA. Soil Survey LaboratoryMethodsManual Soil Survey Investigation Report, No. 42, Version 4; USDA-NRCS: Lincoln, NE, USA, 2004.
  47. Duncan, D.B. Multiple range and multiple F tests. Biometrics 1955, 11, 1–42. [Google Scholar] [CrossRef]
  48. Hynes, R.K.; Boyetchko, S.M. Research initiatives in the art and science of biopesticide formulations. Soil Biol. Biochem. 2006, 38, 845–849. [Google Scholar] [CrossRef]
  49. Mulatu, A.; Alemu, T.; Megersa, N.; Vetukuri, R.R. Optimization of culture conditions and production of bio-fungicides from Trichoderma species under solid-state fermentation using mathematical modeling. Microorganisms 2021, 9, 1675. [Google Scholar] [CrossRef] [PubMed]
  50. Yahya, S.; Jahangir, S.; Shaukat, S.S.; Sohail, M.; Khan, S.A. Production optimization by using Plackett-Burman design and partial characterization of amylase from Aspergillus tubingensis SY 1. Pak. J. Bot. 2016, 48, 2557–2561. [Google Scholar]
  51. Zalila-Kolsi, I.; Kessentini, S.; Tounsi, S.; Jamoussi, K. Optimization of Bacillus amyloliquefaciens BLB369 culture medium by response surface methodology for low cost production of antifungal activity. Microorganisms 2022, 10, 830. [Google Scholar] [CrossRef] [PubMed]
  52. Limón, M.C.; Chacón, M.R.; Mejías, R.; Delgado-Jarana, J.; Rincón, A.M.; Codón, A.C.; Benítez, T. Increased antifungal and chitinase specific activities of Trichoderma harzianum CECT 2413 by addition of a cellulose binding domain. Appl. Microbiol. Biotechnol. 2004, 64, 675–685. [Google Scholar] [CrossRef] [PubMed]
  53. Bitton, G.; Boylan, R.A. Effect of Acid Precipitation on Soil Microbial Activity: I. Soil Core Studies; American Society of Agronomy, Crop Science Society of America, and Soil Science Society of America: Madison, WI, USA, 1985; Volume 14, pp. 66–69. [Google Scholar]
  54. Jackson, A.; Whipps, J.; Lynch, J. Production, delivery systems, and survival in soil of four fungi with disease biocontrol potential. Enzym. Microb. Technol. 1991, 13, 636–642. [Google Scholar] [CrossRef]
  55. Singh, A.; Sarma, B.K.; Singh, H.B.; Upadhyay, R. Trichoderma: A silent worker of plant rhizosphere. In Biotechnology and Biology of Trichoderma; Elsevier: Amsterdam, The Netherlands, 2014; pp. 533–542. [Google Scholar]
  56. Mohiddin, F.; Bashir, I.; Padder, S.A.; Hamid, B. Evaluation of different substrates for mass multiplication of Trichoderma species. J. Pharmacogn. Phytochem. 2017, 6, 563–569. [Google Scholar]
  57. Pandey, A. Aspects of fermenter design for solid-state fermentations. Process Biochem. 1991, 26, 355–361. [Google Scholar] [CrossRef]
  58. Mosier, N.; Wyman, C.; Dale, B.; Elander, R.; Lee, Y.Y.; Holtzapple, M.; Ladisch, M. Features of promising technologies for pretreatment of lignocellulosic biomass. Bioresour. Technol. 2005, 96, 673–686. [Google Scholar] [CrossRef]
  59. Sharma, A.; Salwan, R.; Kaur, R.; Sharma, R.; Sharma, V. Characterization and evaluation of bioformulation from antagonistic and flower inducing Trichoderma asperellum isolate UCRD5. Biocatal. Agric. Biotechnol. 2022, 43, 102437. [Google Scholar] [CrossRef]
  60. Subramaniam, S.; Zainudin, N.A.I.M.; Aris, A.; Hasan, Z.A.E. Role of Trichoderma in plant growth promotion. In Advances in Trichoderma Biology for Agricultural Applications; Springer: Berlin/Heidelberg, Germany, 2022; pp. 257–280. [Google Scholar]
  61. Poveda, J.; Eugui, D. Combined use of Trichoderma and beneficial bacteria (mainly Bacillus and Pseudomonas): Development of microbial synergistic bio-inoculants in sustainable agriculture. Biol. Control 2022, 176, 105100. [Google Scholar] [CrossRef]
  62. Dutta, P.; Mahanta, M.; Singh, S.B.; Thakuria, D.; Deb, L.; Kumari, A.; Upamanya, G.K.; Boruah, S.; Dey, U.; Mishra, A.K.; et al. Molecular interaction between plants and Trichoderma species against soil-borne plant pathogens. Front. Plant Sci. 2023, 14, 1145715. [Google Scholar] [CrossRef]
  63. Mastouri, F.; Björkman, T.; Harman, G.E. Seed treatment with Trichoderma harzianum alleviates biotic, abiotic, and physiological stresses in germinating seeds and seedlings. Phytopathology 2010, 100, 1213–1221. [Google Scholar] [CrossRef]
  64. Adan, M.J.; Baque, M.A.; Rahman, M.M.; Islam, M.R.; Jahan, A. Formulation of Trichoderma based biopesticide for controlling damping off pathogen of eggplant seedling. Univers. J. Agric. Res. 2015, 3, 106–113. [Google Scholar] [CrossRef]
  65. Dabire, T.G.; Bonzi, S.; Somda, I.; Legreve, A. Evaluation of the potential of Trichoderma harzianum as a plant growth promoter and biocontrol agent against Fusarium damping-off in onion in Burkina Faso. Asian J. Plant Pathol. 2016, 10, 49–60. [Google Scholar] [CrossRef]
  66. Mukherjee, P.K.; Mehetre, S.T.; Sherkhane, P.D.; Muthukathan, G.; Ghosh, A.; Kotasthane, A.S.; Khare, N.; Rathod, P.; Sharma, K.K.; Nath, R.; et al. A novel seed-dressing formulation based on an improved mutant strain of Trichoderma virens, and its field evaluation. Front. Microbiol. 2019, 10, 1910. [Google Scholar] [CrossRef] [PubMed]
  67. Agostini, R.B.; Ariel, F.; Rius, S.P.; Vargas, W.A.; Campos-Bermudez, V.A. Trichoderma root colonization in maize triggers epigenetic changes in genes related to the jasmonic and salicylic acid pathways that prime defenses against Colletotrichum graminicola leaf infection. J. Exp. Bot. 2023, 74, 2016–2028. [Google Scholar] [CrossRef]
  68. Meah, M.B.; Islam, M.R.; Islam, M.M. Development of an integrated approach for management of Phomopsis Blight and Fruit rot of Eggplant in Bamgladesh. Ann. Res. Reptr. Dept. Plant Pathol. BAU 2004, 62. [Google Scholar]
  69. Kakvan, N.; Heydari, A.; Zamanizadeh, H.R.; Rezaee, S.; Naraghi, L. Development of new bioformulations using Trichoderma and Talaromyces fungal antagonists for biological control of sugar beet damping-off disease. Crop Prot. 2013, 53, 80–84. [Google Scholar] [CrossRef]
  70. Chin, J.M.; Lim, Y.Y.; Ting, A.S.Y. Biopolymers for biopriming of Brassica rapa seeds: A study on coating efficacy, bioagent viability and seed germination. J. Saudi Soc. Agric. Sci. 2021, 20, 198–207. [Google Scholar] [CrossRef]
  71. Manzar, N.; Kashyap, A.S.; Goutam, R.S.; Rajawat, M.V.S.; Sharma, P.K.; Sharma, S.K.; Singh, H.V. Trichoderma: Advent of versatile biocontrol agent, its secrets and insights into mechanism of biocontrol potential. Sustainability 2022, 14, 12786. [Google Scholar] [CrossRef]
  72. Harman, G.E.; Howell, C.R.; Viterbo, A.; Chet, I.; Lorito, M. Trichoderma species opportunistic, avirulent plant symbionts. Nat. Rev. Microbiol. 2004, 2, 43–56. [Google Scholar] [CrossRef]
  73. Alfiky, A.; Weisskopf, L. Deciphering Trichoderma–Plant–Pathogen Interactions for Better Development of Biocontrol Applications. J. Fungi 2021, 7, 61. [Google Scholar] [CrossRef]
  74. Yedidia, I.; Srivastva, A.K.; Kapulnik, Y.; Chet, I. Effect of Trichoderma harzianum on microelement concentrations and increased growth of cucumber plants. Plant Soil 2001, 235, 235–242. [Google Scholar] [CrossRef]
  75. Aseel, D.G.; Soliman, S.A.; Al-Askar, A.A.; Elkelish, A.; Elbeaino, T.; Abdelkhalek, A. Trichoderma viride Isolate Tvd44 Enhances Potato Growth and Stimulates the Defense System against Potato Virus Y. Horticulturae 2023, 9, 716. [Google Scholar] [CrossRef]
  76. Yang, C.A.; Cheng, C.H.; Lo, C.T.; Liu, S.Y.; Lee, J.W.; Peng, K.H. A novel L-amino acid oxidase from Trichoderma harzianum EST 323 associated with antagonism of R. Solani. J. Agric. Food Chem. 2011, 59, 4519–4526. [Google Scholar] [CrossRef]
  77. Durairaj, K.; Velmurugan, P.; Park, J.H.; Chang, W.S.; Park, Y.J.; Senthilkumar, P. 2018. Characterization and assessment of two biocontrol bacteria against Pseudomonas syringae wilt in Solanum lycopersicum and its genetic responses. Microbiol. Res. 2018, 206, 43–49. [Google Scholar] [CrossRef] [PubMed]
  78. Moharan, S.; Dutta, S. Spatial variability of chlorophyll and nitrogen content of rice from hyperspectral imagery. ISPRS J. Photogramm 2016, 122, 17–29. [Google Scholar] [CrossRef]
  79. Pérez-Bueno, M.L.; Pineda, M.; Barón, M. Phenotyping plant responses to biotic stress by chlorophyll fluorescence imaging. Front. Plant Sci. 2019, 10, 1135. [Google Scholar] [CrossRef]
  80. Inayati, A.; Sulistyowati, L.; Aini, L.Q.; Yusnawan, E. Trichoderma virens-Tv4 enhances growth promoter and plant defense-related enzymes of mungbean (Vigna radiata) against soil-borne pathogen Rhizoctonia solani. Biodiversitas J. Biol. Divers. 2020, 21. [Google Scholar] [CrossRef]
  81. Adhilakshmi, M.; Paranidharan, V.; Balachandar, D.; Ganesamurthy, K.; Velazhahan, R. Suppression of root rot of mung bean (Vigna radiata L.) by Streptomyces sp. is associated with induction of peroxidase and polyphenol oxidase. Arch Phytopathol Plant Prot. 2014, 47, 71–583. [Google Scholar] [CrossRef]
  82. Kavitha, R.; Umesha, S. Regulation of defense-related enzymes associated with bacterial spot resistance in tomato. Phytoparasitica 2008, 36, 144. [Google Scholar] [CrossRef]
  83. Constabel, C.P.; Barbehenn, R. Defensive roles of polyphenol oxidase in plants. In Induced Plant Resistance to Herbivory; Schaller, A., Ed.; Springer: Dordrecht, Germany, 2008. [Google Scholar]
  84. Perincherry, L.; Lalak-Kańczugowska, J.; Stępień, Ł. Fusarium-produced mycotoxins in plant-pathogen interactions. Toxins 2019, 11, 664. [Google Scholar] [CrossRef]
  85. Kubalt, K. The role of phenolic compounds in plant resistance. Biotechnol. Food Sci. 2016, 80, 97–108. [Google Scholar]
  86. Bhattacharya, A.; Sood, P.; Citovsky, V. The roles of plant phenolics in defense and communication during Agrobacterium and Rhizobium infection. J. Mol. Plant Pathol. 2010, 11, 705–719. [Google Scholar] [CrossRef] [PubMed]
  87. Løvdal, T.; Olsen, K.M.; Slimestad, R.; Verheul, M.; Lillo, C. Synergetic effects of nitrogen depletion, temperature, and light on the content of phenolic compounds and gene expression in leaves of tomato. Phytochemistry 2010, 71, 605–613. [Google Scholar] [CrossRef]
  88. Hesham, A.E.-L.; Upadhyay, R.S.; Sharma, G.D.; Manoharachary, C.; Gupta, V.K. Fungal Biotechnology and Bioengineering; Springer: Berlin/Heidelberg, Germany, 2020. [Google Scholar]
  89. Li, R.; Cai, F.; Pang, G.; Shen, Q.; Li, R.; Chen, W. Solubilisation of phosphate and micronutrients by Trichoderma harzianum and its relationship with the promotion of tomato plant growth. PLoS ONE 2015, 10, e0130081. [Google Scholar] [CrossRef] [PubMed]
  90. Mallhi, Z.I.; Rizwan, M.; Mansha, A.; Ali, Q.; Asim, S.; Ali, S.; Hussain, A.; Alrokayan, S.H.; Khan, H.A.; Alam, P.; et al. Citric acid enhances plant growth, photosynthesis, and phytoextraction of lead by alleviating the oxidative stress in castor beans. Plan Theory 2019, 8, 525. [Google Scholar] [CrossRef]
  91. Saravanakumar, K.; Arasu, V.S.; Kathiresan, K. Effect of Trichoderma on soil phosphate solubilization and growth improvement of Avicennia Mar. Aquat Bot. 2013, 104, 101–105. [Google Scholar] [CrossRef]
  92. Li, Y.; Hwang, S.; Huang, Y.; Huang, C. Effects of Trichoderma asperellum on nutrient uptake and Fusarium wilt of tomato. Crop Prot. 2018, 110, 275–282. [Google Scholar] [CrossRef]
  93. Fiorentino, N.; Ventorino, V.; Woo, S.L.; Pepe, O.; Rosa, A.D.; Gioia, L.; Romano, I.; Lombardi, N.; Napolitano, M.; Colla, G.; et al. Trichoderma -based biostimulants modulate rhizosphere microbial populations and improve n uptake efficiency, yield, and nutritional quality of leafy vegetables. Front. Plant Sci. 2018, 9, 743. [Google Scholar] [CrossRef] [PubMed]
Figure 1. Pareto chart graph indicating the effect of growth factors on conidia production by T. lixii SARS 111.
Microbiolres 14 00138 g001
Figure 2. (aj) Contour plots of candida production: The result of two active parameters; the other two are detained at 0 levels.
Microbiolres 14 00138 g002aMicrobiolres 14 00138 g002b
Figure 3. Effect of different developed bioformulations of T. lixii on seedling length (cm) and the vigor index of cowpea plants grown in the presence of soil infected with F. oxysporum. Treatments T1–T13, as described above in Table 7; a–f: Duncan’s letters.
Microbiolres 14 00138 g003
Figure 4. Effect of different developed bioformulations of T. lixii on disease incidence (%) and the vigor index of cowpea plants grown in the presence of soil infected with F. oxysporum. Treatments T1–T13, as described above in Table 7; a–g: Duncan’s letters.
Microbiolres 14 00138 g004
Figure 5. Effect of different developed bioformulations of T. lixii on (A): chlorophyll a; (B): chlorophyll b; (C): total chlorophyll; (D): carotenoids; and (E): total soluble sugar of cowpea plants grown in the presence of soil infected with F. oxysporum. Treatments T1–T13, as described above in Table 7; a–i: Duncan’s letters.
Microbiolres 14 00138 g005aMicrobiolres 14 00138 g005b
Figure 6. Effect of different developed bioformulations of T. lixii on mineral content (N, P, and K%) of cowpea plants grown in the presence of soil infected with F. oxysporum. Treatments T1–T13, as described above in Table 7; a–e: Duncan’s letters.
Microbiolres 14 00138 g006
Table 1. Chemical analysis of different agricultural waste substrates (waste) used in the experiment.
Parameters (%)Faba BeanCowpeaSweet PotatoPumpkinCassava
OC42.041.3939.9944.2942.00
C/N ratio28.327.8830.2128.1129.92
Total N1.471.291.431.591.66
Total P0.370.390.480.520.56
Total K1.481.411.761.831.73
OC: Organic carbon. The analysis was performed at the Physical and Chemical Research Department, SARS, Kafr El-Sheikh.
Table 2. Experimental range, level, and code of independent variables using two levels.
Independent VariablesUnitsCoded Levels
LowHigh
W1Faba bean wasteg01
W2Cowpea wasteg01
W3Sweet potato wasteg01
W4Pumpkin wasteg01
W5Cassava wasteg01
pHpH-46
MoistureMoisture%6575
TemperatureTemperature°C2025
Pre-treatmentPre-treatment of substrate-UntreatedTreated with water
Table 3. Twelve trials using the Plackett–Burman experimental design and the response (Conidia production).
RunW1W2W3W4W5MoisturepHTemperaturePre-TreatmentC/N Ratio
11011075625036:1
2 1110065620138:1
3 0010175425122:1
4 0111065425034:1
5 1011165420148:1
6 0110175620032:1
7 0001075620120:1
8 1000165625028:1
9 1100075425121:1
10 1101175420046:1
11 000006542000
12 0101165625135:1
W1: Faba bean waste; W2: Cowpea waste; W3: Sweet potato waste; W4: Pumpkin waste; W5: Cassava waste.
Table 4. Experimental range, level, and code of independent variables using three levels.
Independent VariablesUnitsCoded Levels
Level 1Level 2Level 3
W2Sweet potato wasteg234
W5Cassava wasteg234
pHpH 468
TempTemperature°C202530
Pre-treatmentPre-treatment of substrate-Untreated Treated with water (0.5)Treated with 0.5% NaOH (1)
Table 5. The central composite design of experiments for conidia production of T. lixii under SSF conditions.
RunW2W5pHTemperaturePre-TreatmentC/N Ratio
122830−125:1
233620034:1
323625025:1
442820131:1
533630034:1
644820148:1
744420−148:1
842830131:1
944830148:1
1044430148:1
1124830135:1
1233625134:1
1324430−135:1
1434625037:1
1522430−125:1
1644820−148:1
1724430135:1
1824820135:1
1933625034:1
2042420−131:1
2122820125:1
2233825034:1
2333625−134:1
2422420125:1
2542430−131:1
2644430−148:1
2732625027:1
2842830−131:1
2942820−131:1
3044830−148:1
3122830125:1
3244420148:1
3324420−135:1
3422420−135:1
3533425025:1
3624830−135:1
3742430131:1
3842420131:1
3922430125:1
4043625044:1
4122820−125:1
4224820−135:1
4324420135:1
W2: Sweet potato waste; W5: Cassava waste.
Table 6. Physical and chemical analyses of the soil used in gnotobiotic and greenhouse experiments.
Mechanical Analysis (%)TexturepHEC OM
(g kg−1)
Available Elements (mg kg−1)
SandSiltClayNPK
20.9124.8754.22Clay7.632.9215.569.778.90343.37
The analysis was performed at the Physical and Chemical Research Department, SARS, Kafr El-Sheikh.
Table 7. Treatment used for the greenhouse experiment.
SymbolDescription
T1Control (neither bioformulation nor infected stress)
T2Control (soil infected with F. oxysporum)
T3Control (soil infected with F. oxysporum + seeds treated with Vitavax fungicide (Carboxin 37.5% + Thiram 37.5% DS, 1 g kg−1, Dhanuka Agritech Ltd. India)
T4Seeds treated with T. lixii by a carrier of sweet potato waste (2 g) + Cassava waste (2 g)
T5Seeds treated with T. lixii by a carrier of sweet potato waste (4 g) + Cassava waste (4 g)
T6Seeds treated with T. lixii by a carrier of sweet potato waste (3 g) + Cassava waste (4 g)
T7Seeds treated with T. lixii by a carrier of sweet potato waste (2 g) + Cassava waste (2 g)
T8Seeds treated with T. lixii by a carrier of sweet potato waste (2 g) + Cassava waste (4 g)
T9Seeds treated with T. lixii by a carrier of sweet potato waste (4 g) + Cassava waste (3 g)
T10Seeds treated with T. lixii by a carrier of sweet potato waste (3 g) + Cassava waste (2 g)
T11Seeds treated with T. lixii by a carrier of sweet potato waste (3 g) + Cassava waste (3 g)
T12Seeds treated with T. lixii by a carrier of sweet potato waste (4 g) + Cassava waste (2 g)
T13Seeds treated with T. lixii by a carrier of talc (reference treatment)
Table 8. Conidia production of T. lixii under different experimental conditions using the randomized Plackett–Burman design.
RunW1W2W3W4W5MoisturepHTemperaturePre-Treatmentlog10(Y)-Conidia/g Dry Substrate
ExperimentalPredicted
1101107562506.95 ± 0.15 6.98
2 111006562016.67 ± 0.14 6.63
3 001017542517.52 ± 0.23 7.34
4 011106542506.86 ± 0.16 6.54
5 101116542018.67 ± 0.72 8.35
6 011017562007.4 ± 0.63 7.57
7 000107562010 0.17
8 100016562507.36 ± 0.47 7.67
9 110007542516.57 ± 0.47 6.88
10 110117542008.05 ± 0.11 8.23
11 000006542000 0.000
12 010116562517.12 ± 0.12 7.29
Table 9. Analysis of variance (ANOVA) of PBD for conidia production, R2 = 0.999; R2 (adj) = 0.998, R2 (pred) = 0.98: Values of “prob > F” less than 0.05 indicate that model terms are significant.
SourceSum of SquaresdfMean SquareF-Valuep-Value
Model92.98910.33679.290.0015 *
A—W119.69119.691294.450.0008
B—W212.34112.34811.560.0012
C—W318.68118.681227.950.0008
D—W40.378110.378124.860.0380
E—W530.31130.311992.680.0005
F—Moisture0.003010.00300.19780.7000
G—pH0.392410.392425.800.0366
H—Temperature11.19111.19736.040.0014
J—Pre-Treatment0.000410.00040.02680.8849
Residual0.040020.0152
 Lack of Fit0.0110.010.530.54
 Pure Error0.0360.02
Cor Total92.1711
*: significant.
Table 10. Central composite design (CCD) for conidia production using T. lixii.
RunW2W5pHTemperaturePre-Treatmentlog10(Y)-Conidia/g Dry Substrate
ExperimentalPredicted
122830−100.16
23362008.71 ± 0.197.47
32362507.58 ± 0.547.51
44282017.95 ± 0.667.74
533630000.95
64482017.45 ± 0.277.09
744420−17.56 ± 0.457.11
84283010−0.05
944830100.24
1044430100.16
112483010−0.28
123362517.58 ± 0.377.05
1324430−10−0.17
143462505.89 ± 0.276.93
1522430−100.42
1644820−14.23 ± 0.174.82
172443010−0.73
182482014.65 ± 0.454.66
193362506.27 ± 0.367.41
2042420−17.67 ± 0.378.01
212282015.46 ± 0.315.95
223382505.68 ± 0.296.24
2333625−15.88 ± 0.316.12
242242018.34 ± 0.317.98
2542430−10−0.08
2644430−10−0.04
273262508.87 ± 0.307.55
2842830−10−0.71
2942820−14.8 ± 0.825.31
3044830−10−0.25
3122830100.06
324442019.45 ± 0.989.07
3324420−14.65 ± 0.205.08
3422420−16.85 ± 1.076.62
353342508.21 ± 1.047.36
3624830−10−0.01
3742430100.28
384242019.53 ± 0.2710.14
3922430100.02
404362508.68 ± 0.408.47
4122820−14.23 ± 0.414.28
4224820−13.98 ± 0.313.16
432442015.28 ± 1.026.28
Table 11. Shelf life and viability of T. lixii under storage conditions.
TreatmentsStorage Duration in Months (log10 CFU g−1)
Initial357912
C8.89 ± 0.348.20 ± 0.217.76 ± 0.226.72 ± 0.175.54 ± 0.115.20 ± 0.19
T48.21 ± 0.127.90 ± 0.187.69 ± 0.196.95 ± 0.165.86 ± 0.185.63 ± 0.15
T58.34 ± 0.118.04 ± 0.197.71 ± 0.167.06 ± 0.225.98 ± 0.125.81 ± 0.21
T68.18 ± 0.277.48 ± 0.277.60 ± 0.276.80 ± 0.275.65 ± 0.175.45 ± 0.27
T78.68 ± 0.338.15 ± 0.317.73 ± 0.327.13 ± 0.326.07 ± 0.195.94 ± 0.17
T87.58 ± 0.267.70 ± 0.387.68 ± 0.316.92 ± 0.315.81 ± 0.225.62 ± 0.14
T98.71 ± 0.178.26 ± 0.277.77 ± 0.327.17 ± 0.366.11 ± 0.285.95 ± 0.19
T109.45 ± 0.198.30 ± 0.247.83 ± 0.337.40 ± 0.276.37 ± 0.196.27 ± 0.22
T118.87 ± 0.278.28 ± 0.307.70 ± 0.317.33 ± 0.366.29 ± 0.256.18 ± 0.27
T129.53 ± 0.299.38 ± 0.358.83 ± 0.267.78 ± 0.286.63 ± 0.266.36 ± 0.21
Control: wheat seed formula; (T4:T12) treatments of sweet potato with cassava, as described above in Table 7.
Table 12. Effect of different developed bioformulations of T. lixii on fresh and dry mass, shoot and root length of cowpea plants grown in the presence of soil infected with F. oxysporum.
TreatmentsFresh Mass
(g Plant−1)
Dry Mass
(g Plant−1)
Shoot Length
(cm Plant−1)
Root Length
(cm Plant−1)
T139.73 ± 7.42 e7.54 ± 0.95 d17.39 ± 1.07 e8.13 ± 0.50 e
T216.73 ± 5.02 f3.21 ± 0.90 e12.98 ± 0.73 f6.15 ± 0.35 f
T336.21 ± 5.13 e6.82 ± 1.23 d16.56 ± 1.27 e7.87 ± 0.63 e
T462.93 ± 6.51 cd11.82 ± 1.23 c21.69 ± 1.31 d10.35 ± 0.64 d
T568.29 ± 5.30 c12.45 ± 1.00 c22.28 ± 0.89 d10.62 ± 0.44 d
T659.59 ± 8.21 d11.18 ± 1.12 c21.02 ± 1.17 d9.99 ± 0.53 d
T783.90 ± 4.05 b15.53 ± 0.75 b25.16 ± 0.87 c11.91 ± 0.47 c
T859.21 ± 3.91 d11.30 ± 1.27 c21.00 ± 1.17 d9.92 ± 0.73 d
T984.93 ± 6.05 b15.63 ± 1.12 b25.33 ± 0.99 bc12.11 ± 0.53 bc
T1089.29 ± 2.35 b17.06 ± 0.98 b26.79 ± 0.98 b12.72 ± 0.42 b
T1188.93 ± 7.24 b16.47 ± 1.34 b26.04 ± 1.57 bc12.33 ± 0.54 bc
T12103.56 ± 2.72 a19.81 ± 0.81 a29.54 ± 0.56 a14.03 ± 0.11 a
T13105.16 ± 1.82 a19.97 ± 0.71 a29.79 ± 0.51 a14.18 ± 0.09 a
LSD 0.057.841.631.570.80
Treatments T1–T13, as described above in Table 7; a–f: Duncan’s letters.
Table 13. Effect of different developed bioformulations of T. lixii on antioxidant enzymes (PO, PPO, and PAL) and TPC of cowpea plants grown in the presence of soil infected with F. oxysporum.
TreatmentsPO
(μM H2O2 g−1 FW min−1)
PPO
(μM Tetra–Guaiacol g−1 min−1 FW)
PAL
(μmol min−1 g−1 FW)
TPC
(mg GAE g−1 FW)
T10.71 ± 0.25 d0.14 ± 0.03 d2.24 ± 0.20 e13.15 ± 1.16 d
T20.25 ± 0.06 e0.07 ± 0.02 e1.10 ± 0.24 f9.38 ± 0.91 e
T30.51 ± 0.30 de0.13 ± 0.02 d2.01 ± 0.23 e 11.92 ± 1.10 d
T41.90 ± 0.39 c0.21 ± 0.02 c3.37 ± 0.33 d17.72 ± 1.20 c
T52.08 ± 0.27 c0.22 ± 0.02 c3.47 ± 0.37 d18.01 ± 0.69 c
T61.70 ± 0.30 c0.20 ± 0.02 c3.27 ± 0.30 d17.31 ± 1.12 c
T72.81 ± 0.26 b0.27 ± 0.02 b4.41 ± 0.22 c21.29 ± 1.16 b
T81.73 ± 0.33 c0.20 ± 0.03 c3.11 ± 0.16 d17.03 ± 1.74 c
T92.82 ± 0.26 b0.27 ± 0.02 b4.39 ± 0.33 c21.76 ± 1.12 b
T103.22 ± 0.19 b0.29 ± 0.03 ab4.81 ± 0.24 b22.79 ± 1.53 b
T113.05 ± 0.31 b0.29 ± 0.02 ab4.60 ± 0.33 bc21.83 ± 1.33 b
T124.05 ± 0.13 a0.33 ± 0.02 a5.43 ± 0.21 a25.07 ± 1.04 a
T134.12 ± 0.11 a0.37 ± 0.03 a5.45 ± 0.17 a25.11 ± 1.08 a
LSD 0.050.420.030.361.86
Treatments T1–T13, as described above in Table 7; a–f: Duncan’s letters.
Disclaimer/Publisher’s Note: The statements, opinions and data contained in all publications are solely those of the individual author(s) and contributor(s) and not of MDPI and/or the editor(s). MDPI and/or the editor(s) disclaim responsibility for any injury to people or property resulting from any ideas, methods, instructions or products referred to in the content.

