Article

Evaluation of Different Molecular Markers for Genotyping Non-Saccharomyces Wine Yeast Species

by
Aspasia Nisiotou
1,*,
Emanouela Gyftogianni
1 and
Georgios Banilas
2
1
Hellenic Agricultural Organization “Dimitra”, Institute of Technology of Agricultural Products, Sofokli Venizelou 1, 14123 Lykovryssi, Greece
2
Department of Wine, Vine and Beverage Sciences, University of West Attica, Ag. Spyridonos 28, 12243, Aegaleo, Greece
*
Author to whom correspondence should be addressed.
Microbiol. Res. 2022, 13(3), 643-654; https://doi.org/10.3390/microbiolres13030046
Submission received: 29 July 2022 / Revised: 3 September 2022 / Accepted: 6 September 2022 / Published: 8 September 2022
(This article belongs to the Collection Microbiology and Technology of Fermented Foods)

Abstract

:
Wine quality is determined by the particular yeast strains prevailing at various stages of fermentation. Therefore, the ability to make an easy, fast, and unambiguous discrimination of yeasts at the strain level is of great importance. Here, the tandem repeat-tRNA (TRtRNA) method with the 5GAC or ISSR-MB primer sets and random amplified polymorphic DNA (RAPD) analysis with (GTG)3, R5, and RF2 oligonucleotides were tested on various non-Saccharomyces wine yeast species. The TRtRNA-PCR employing ISSR-MB showed the highest capacity in discriminating Lachancea thermotolerans and Metschnikowia pulcherrima isolates. RAPD with RF2 was the most efficient method in resolving Starmerella bacillaris isolates, although it produced few polymorphic bands. RAPD with R5 showed the highest capacity to discriminate among the Issatchenkia orientalis, Hanseniaspora guilliermondii, and Pichia anomala isolates. RAPD with either R5 or RF2 exhibited the highest ability to discriminate among the Torulaspora delbrueckii isolates. RAPD with (GTG)3 was the most discriminating method for the H. uvarum isolates. Here we concluded that both TRtRNA-PCR and RAPD-PCR offer rapid means for typing non-Saccharomyces species. However, each method performs better for a given species when paired with a particular primer set. The present results can be useful in wine research for the fast fingerprinting of non-Saccharomyces yeasts.

1. Introduction

Saccharomyces cerevisiae is the primary yeast species in winemaking. However, it is a small minority among various non-Saccharomyces (NS) yeast populations that develop on grape berries and are then transferred in the grape must [1]. NS yeasts, also known as wild yeasts, include diverse species, most of which belong to the genera Hanseniaspora, Candida, Lachancea, Metschnikowia, Pichia, Torulaspora, and Zygosaccharomyces [2,3]. Although NS yeasts start the spontaneous alcoholic fermentation of grape must, most of these populations start to decline thereafter and are almost undetectable at the end of the course, either because they cannot tolerate ethanol or because they are unable to endure microbial antagonism. Nevertheless, they are essential in the development of important metabolites that determine the flavor and aroma of wines, greatly influencing the final character and style of wine [4].
Different NS species, and even strains within a species, may provide various characteristics to wines and thus modulate wine organoleptic profile and quality [5,6]. Therefore, there is a growing interest in isolating and characterizing stains of NS species with particular features to be used as potential inocula in winemaking as part of mixed starter formulations with S. cerevisiae [7]. Several NS strains have been considered, each contributing differentially to the alcoholic fermentation and the produced wine. For instance, some NS strains produce various valuable enzymes (e.g., esterases, β-glycosidases, lipases, and proteases) that liberate aromatic compounds from the respective odorless grape precursors or may facilitate technological procedures [8]. Different yeast species or strains may also confer to the quality of wines through the direct production of a variety of sensory compounds. For instance, Starmerella bacillaris improves the analytical profile of wines by increasing glycerol and succinic acid or total ester content and diminishing acetic acid and higher alcohols [9,10]. Lachancea thermotolerans has been shown to improve wine quality by increasing the levels of fruit-impair esters like ethyl decanoate, 3-methylbutyl octanoate, and isoamyl hexanoate, or the terpenic compounds of wine [6]. Among other examples, Torulaspora delbrueckii has been associated with reduced levels of volatile acidity compared to the amounts formed by S. cerevisiae [11], while wines produced by co-inoculation of Candida colliculosa and S. cerevisiae were judged to be better than the respective reference wines [12].Taken together, accumulating data reveal significant intra-species genetic diversity within non-Saccharomyces wine yeasts, corresponding to high phenotypic variation. Consequently, the quality and sensory characteristics of wine are highly dependent on the particular strain of yeast species that prevails during the alcoholic fermentation. Therefore, the discrimination of yeasts at the strain level is of great importance in wine science and the technology of winemaking.
Although there are several PCR-based fingerprinting methods for typing S. cerevisiae strains, there are not so many available for different NS yeasts. The main limitation has been the lack of sufficient genomic sequence data. Even though the whole genome sequence is now available for several wild yeasts of enological importance, including Hanseniaspora uvarum and Lachancea thermotolerans, the need for easy, fast, and low-cost typing methods still exists. Here we applied and compared two different PCR-fingerprinting methods, Random Amplified Polymorphic DNA (RAPD) and Tandem repeat-tRNA (TRtRNA), which have been previously developed for typing specific NS species of enological importance. The RAPD method has been widely applied in the genetic fingerprinting of food yeast or bacterial isolates [13]. A single decamer oligonucleotide of random sequence was used to differentiate strains of Dekkera bruxellensis or Pichia guilliermondii [14], Zygosaccharomyces bailii or Z. rouxii [15], H. uvarum [16,17], Brettanomyces bruxellensis, [18] and Starmerella bacillaris (Candida zemplinina) [19]. The TRtRNA-PCR method was developed by Barquet et al. [20] and was successfully applied to discriminate Metschnikowia pulcherrima strains, suggesting that it might also be used to distinguish between strains of various other NS species. The technique employs a single oligonucleotide targeting tandem repeats randomly distributed across the genomes of all eukaryotic organisms combined with an additional oligonucleotide based on a conserved tRNA region unique to ascomycetes. The aim of this study was to test the efficiency of the above methods using different primer sets to discriminate among the native vineyard isolates of different wild yeast species. The data provided here may enable easier selection of the most effective, rapid, and affordable molecular methods to type strains of various important NS species.

2. Materials and Methods

2.1. Yeast Strains

A total of 34 yeast strains belonging to the Culture Collection of the Institute of Technology of Agricultural Products (ITAP)—ELGO were analyzed in this study (Table S1). The yeasts belonged to the species Hanseniaspora guilliermondii, H. uvarum, Issatchenkia orientalis, Lachancea thermotolerans, Metschnikowia pulcherrima, Meyerozyma carribica, Pichia anomala, Starmerella bacillaris, and Torulaspora delbrueckii. The yeasts were isolated from grapes or fermenting musts originating from vineyards in the regions of Peza (Crete), Nemea (Peloponnese) and Athens, Greece. Yeasts were identified as previously described [21]. The isolates included in the analysis were randomly selected, while those of the same region were isolated from different vineyards.

2.2. Cell Culture and Genomic DNA Extraction
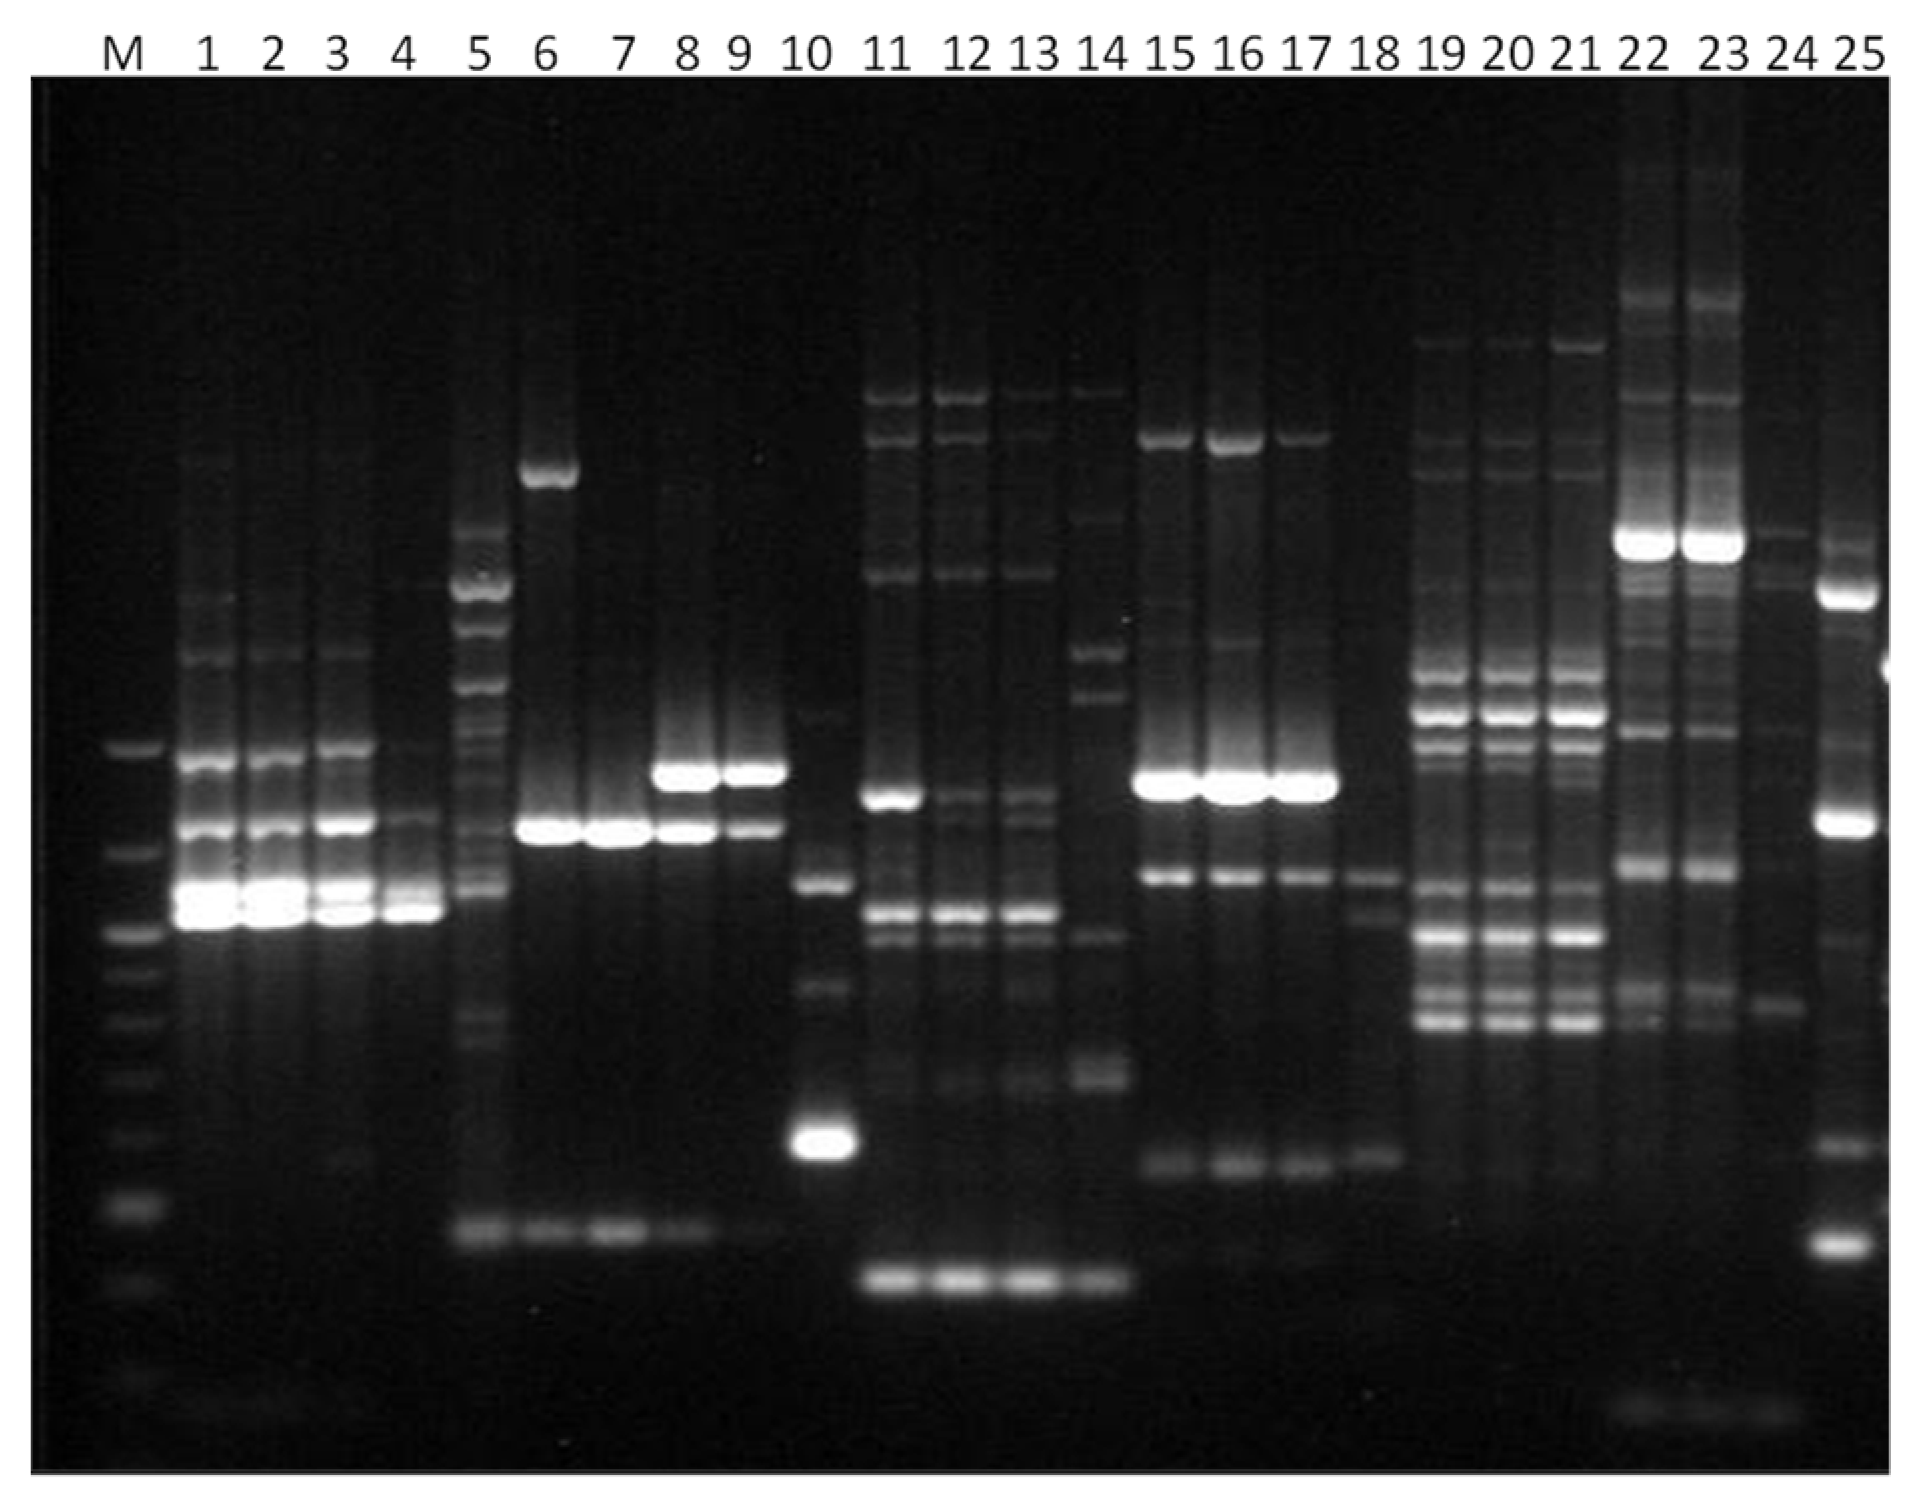
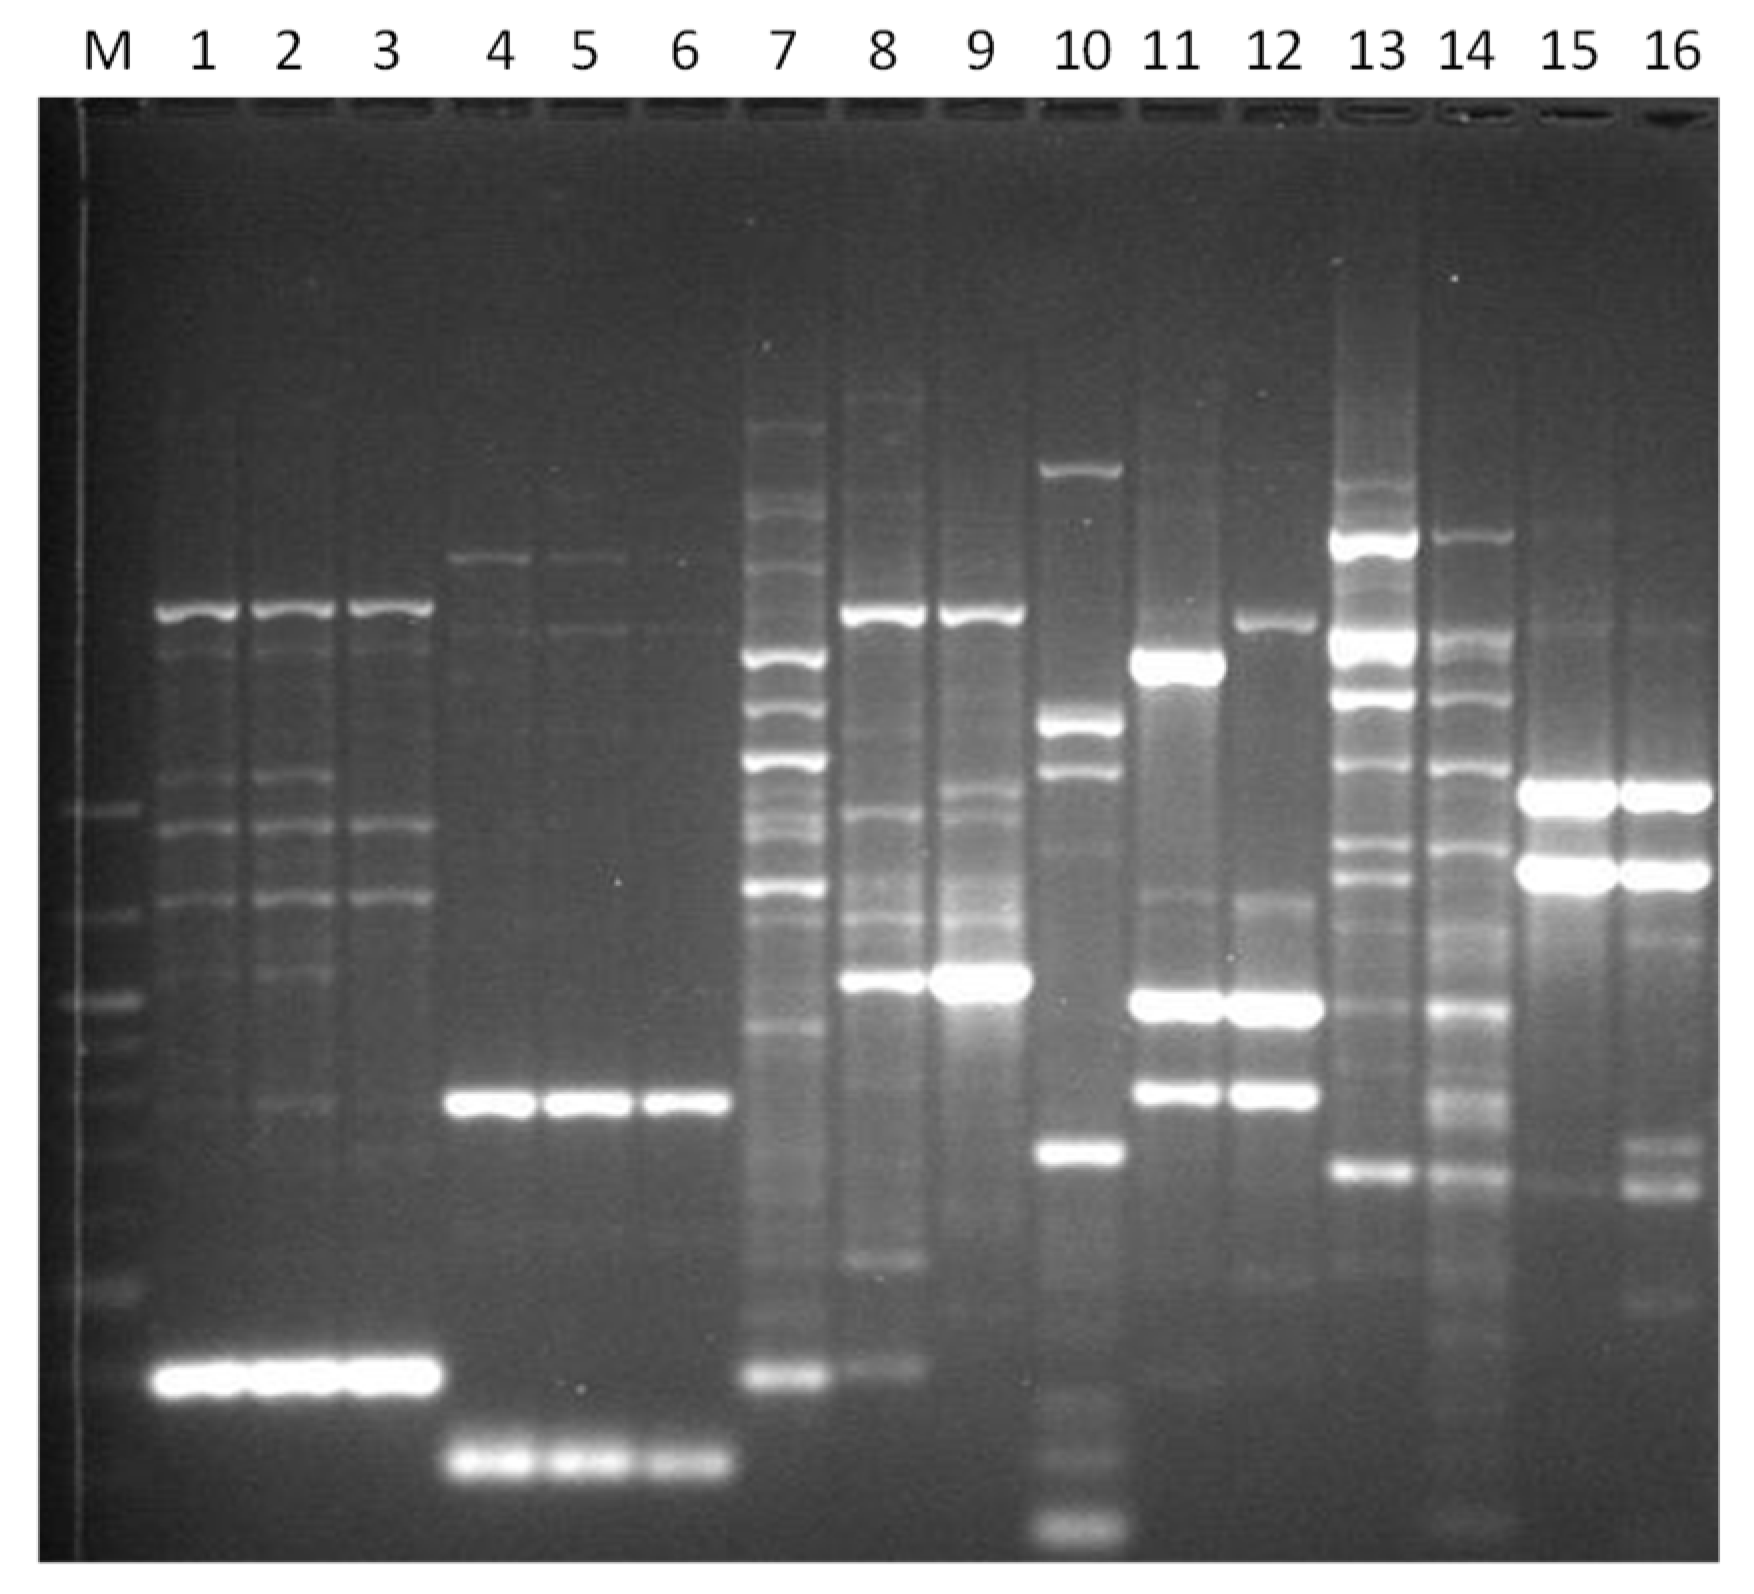
The yeasts were grown overnight in YPD broth (1% yeast extract, 2% bacteriological peptone, 2% glucose, pH 6.2) at 28 °C in a rotary shaker. The cells were collected by centrifugation at 8000 g for 1 min and resuspended in a 300 μL breaking buffer (2% Triton X-100, 1% sodium dodecyl sulfate, 100 mM NaCl, 10 mM Tris, pH 8, 1 mM EDTA, pH 8) containing 0.3 g of 0.5-mm-diameter glass beads (Sigma). The cells were subjected to vortex mixing (2 min) after adding 300 μL phenol-chloroform-isoamyl alcohol (25:24:1 [vol/vol/vol]). Three hundred microliters of TE buffer (10 mM Tris, 1 mM EDTA, pH 7.6) was added, and the mixture was centrifuged (12,000× g, 10 min). The supernatant was mixed with 2.5 volumes of absolute ethanol (molecular biology grade), and DNA was precipitated by centrifugation (12,000× g, 10 min), washed with 70% ethanol, and resuspended in water.

2.3. RAPD Analysis

For the molecular typing of non-Saccharomyces species, the RAPD analysis with (GTG)3 primer [22], R5 (5′-AACGCGCAAC-3′) and RF2 (5′-CGGCCCCTGT-3′) oligos according to [23] was applied. PCR products were separated in 2% agarose gels. Standard molecular size markers (100-bp ladder and 1-kb ladder; New England Biolabs) were used to estimate the sizes of PCR-generated fragments. Bands were detected and molecular fingerprints were analyzed using the Gel Doc XR+ System, controlled by the Image Lab Image Capture and Analysis Software (Bio-Rad Laboratories).

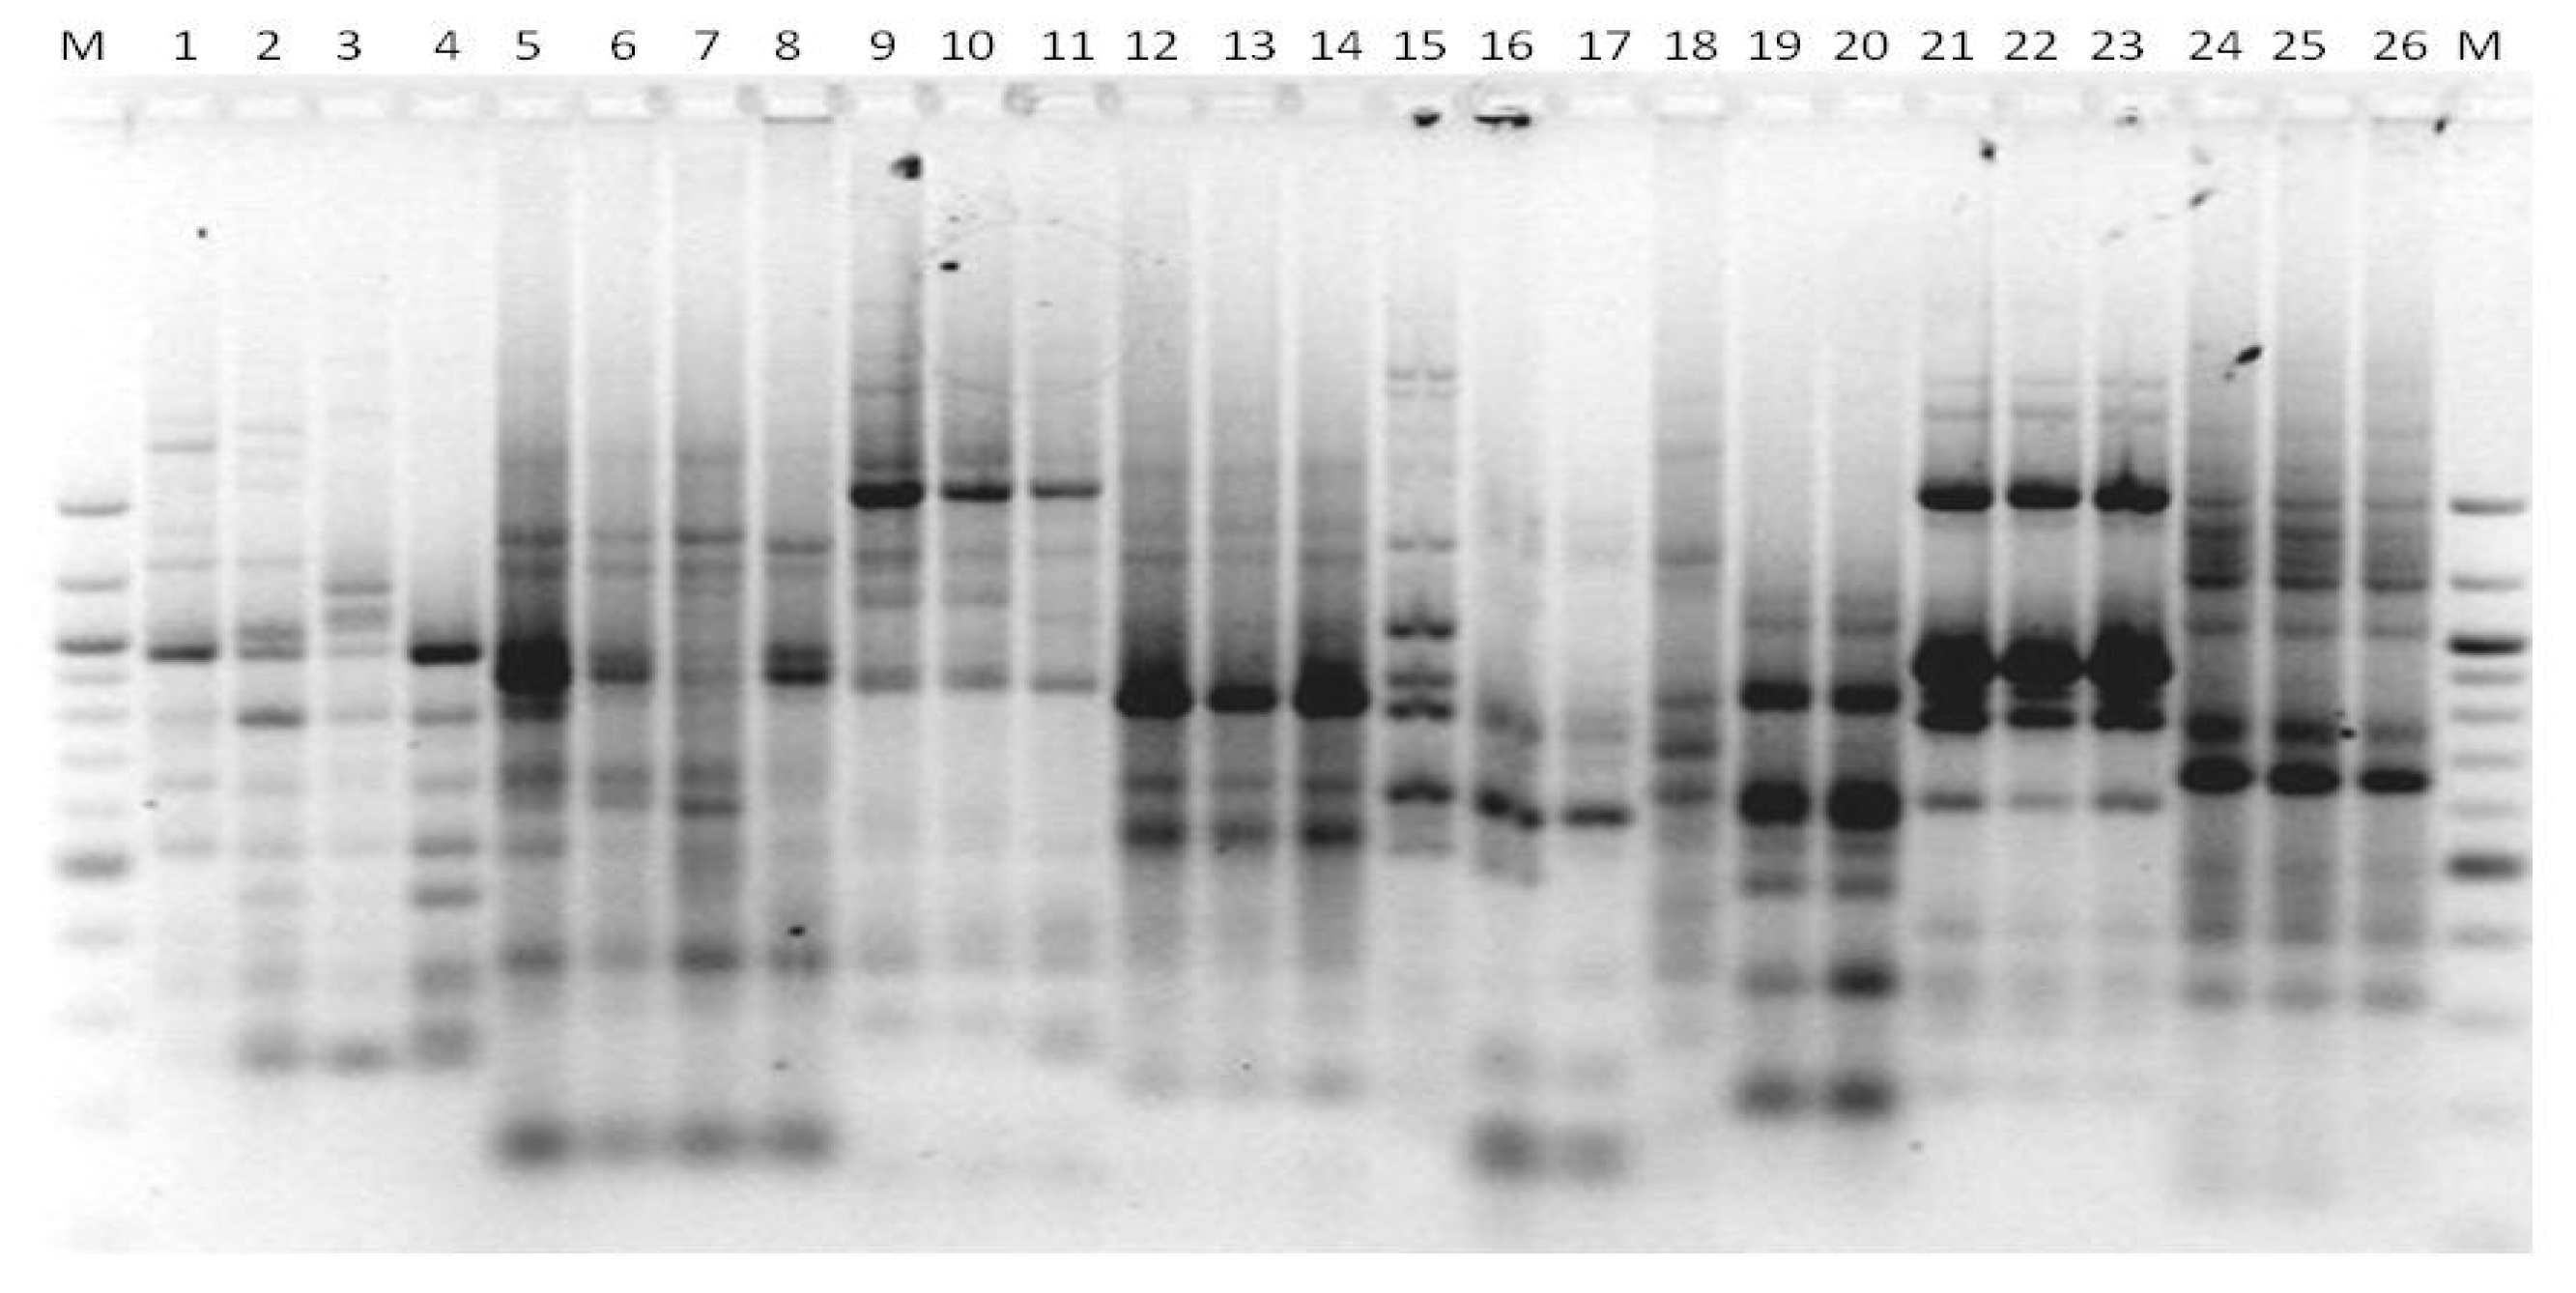
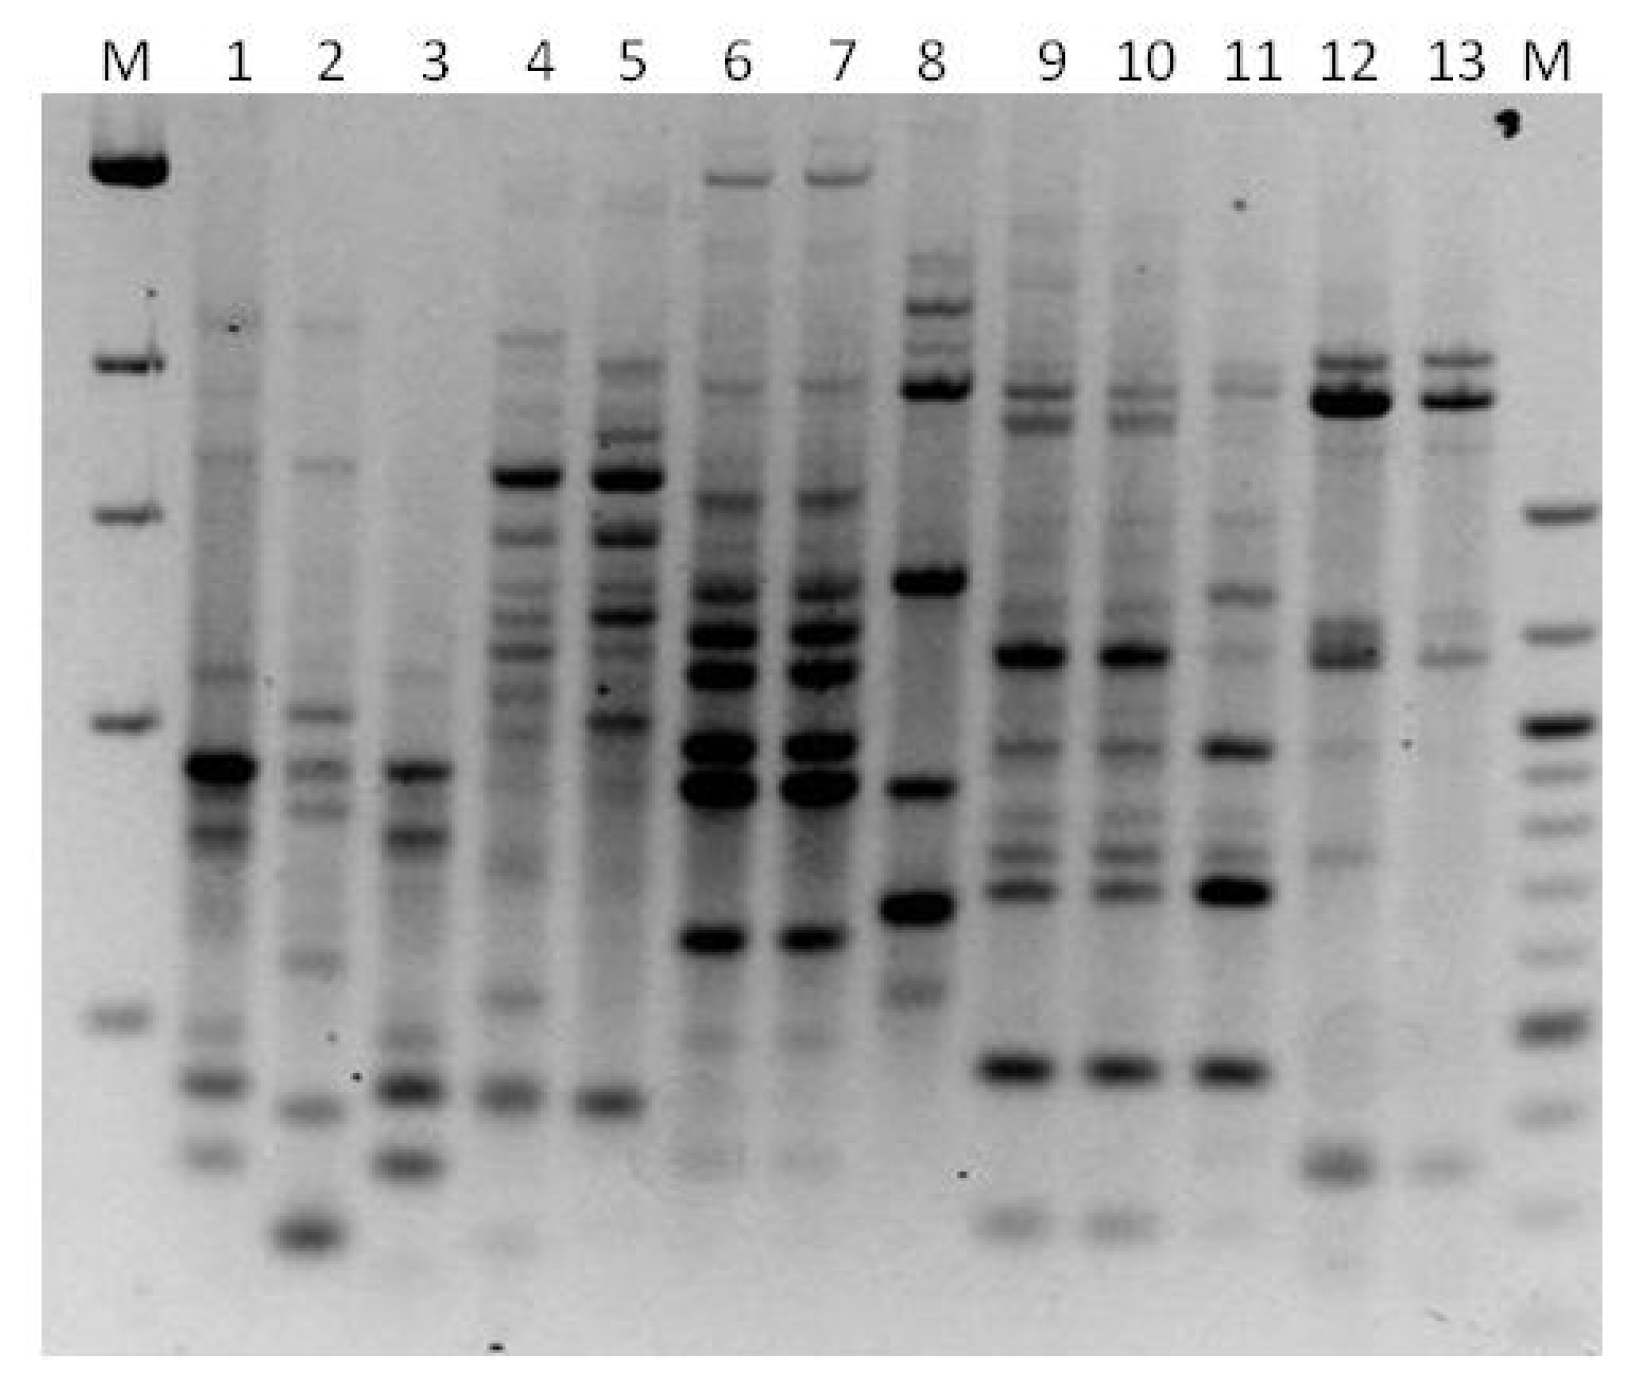
2.4. TRtRNA Analysis
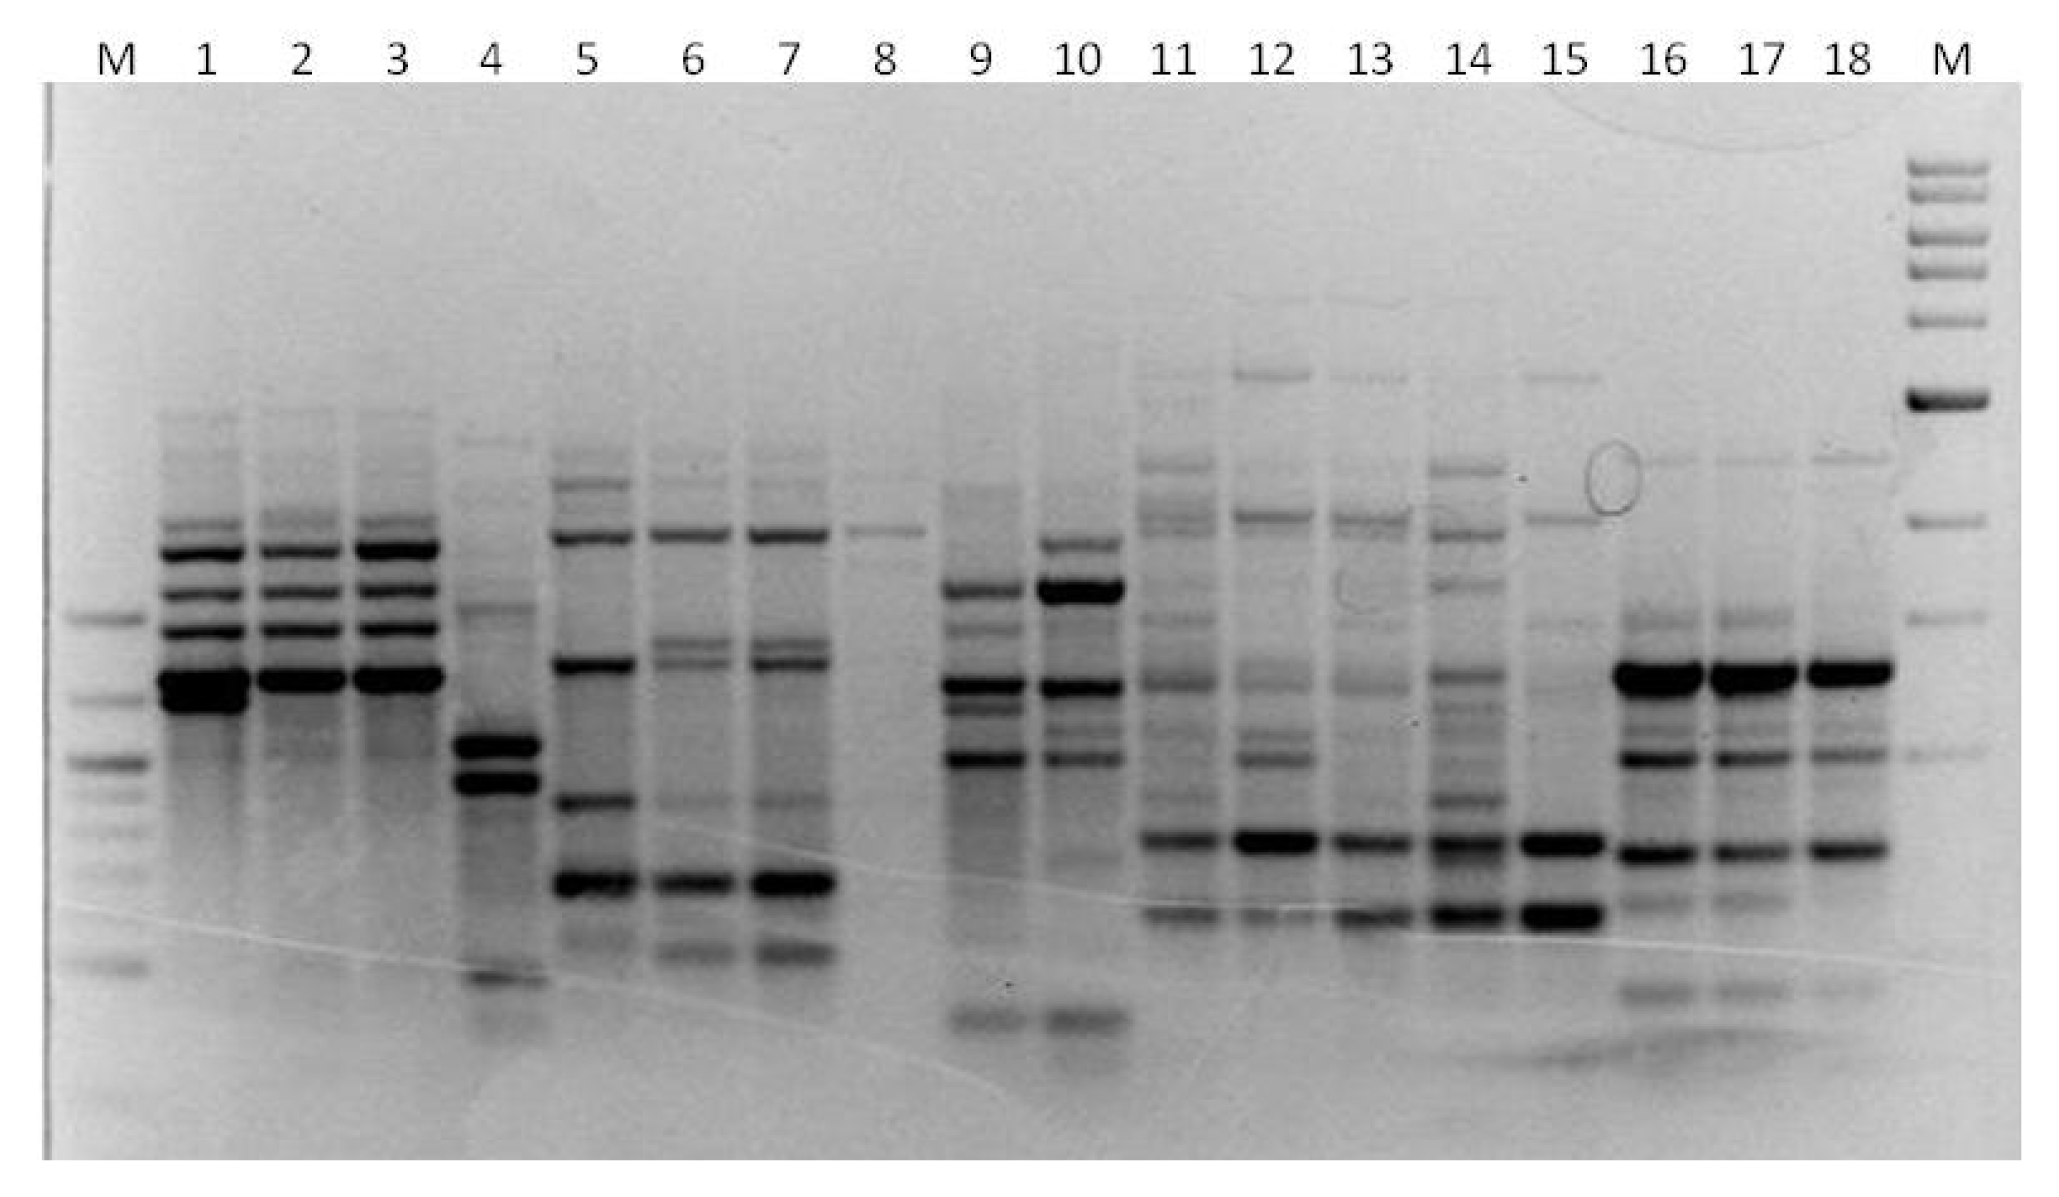
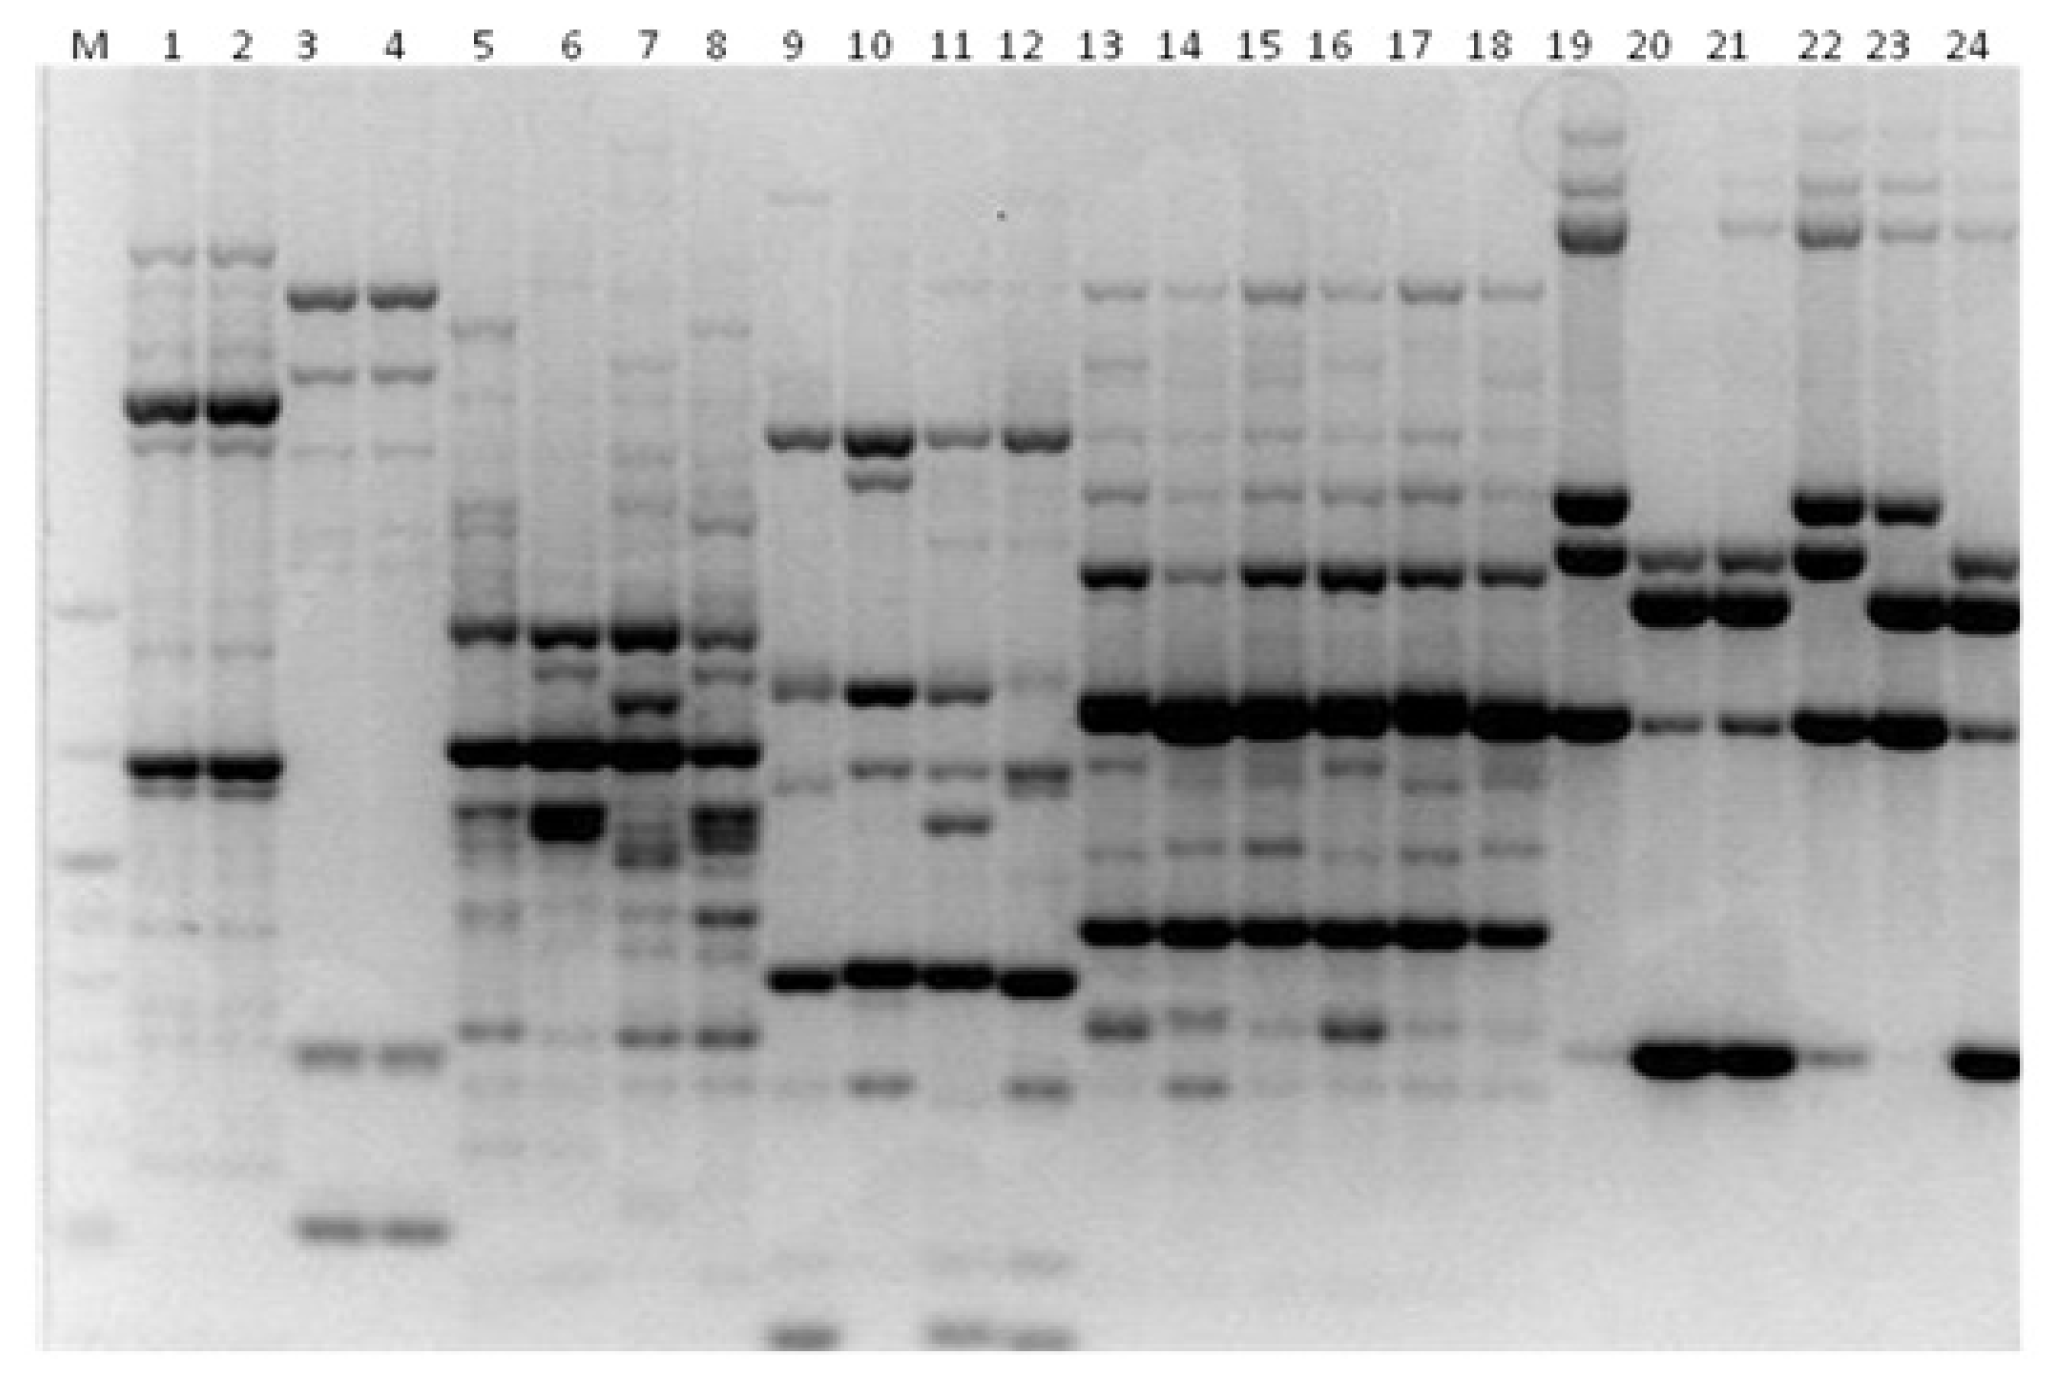
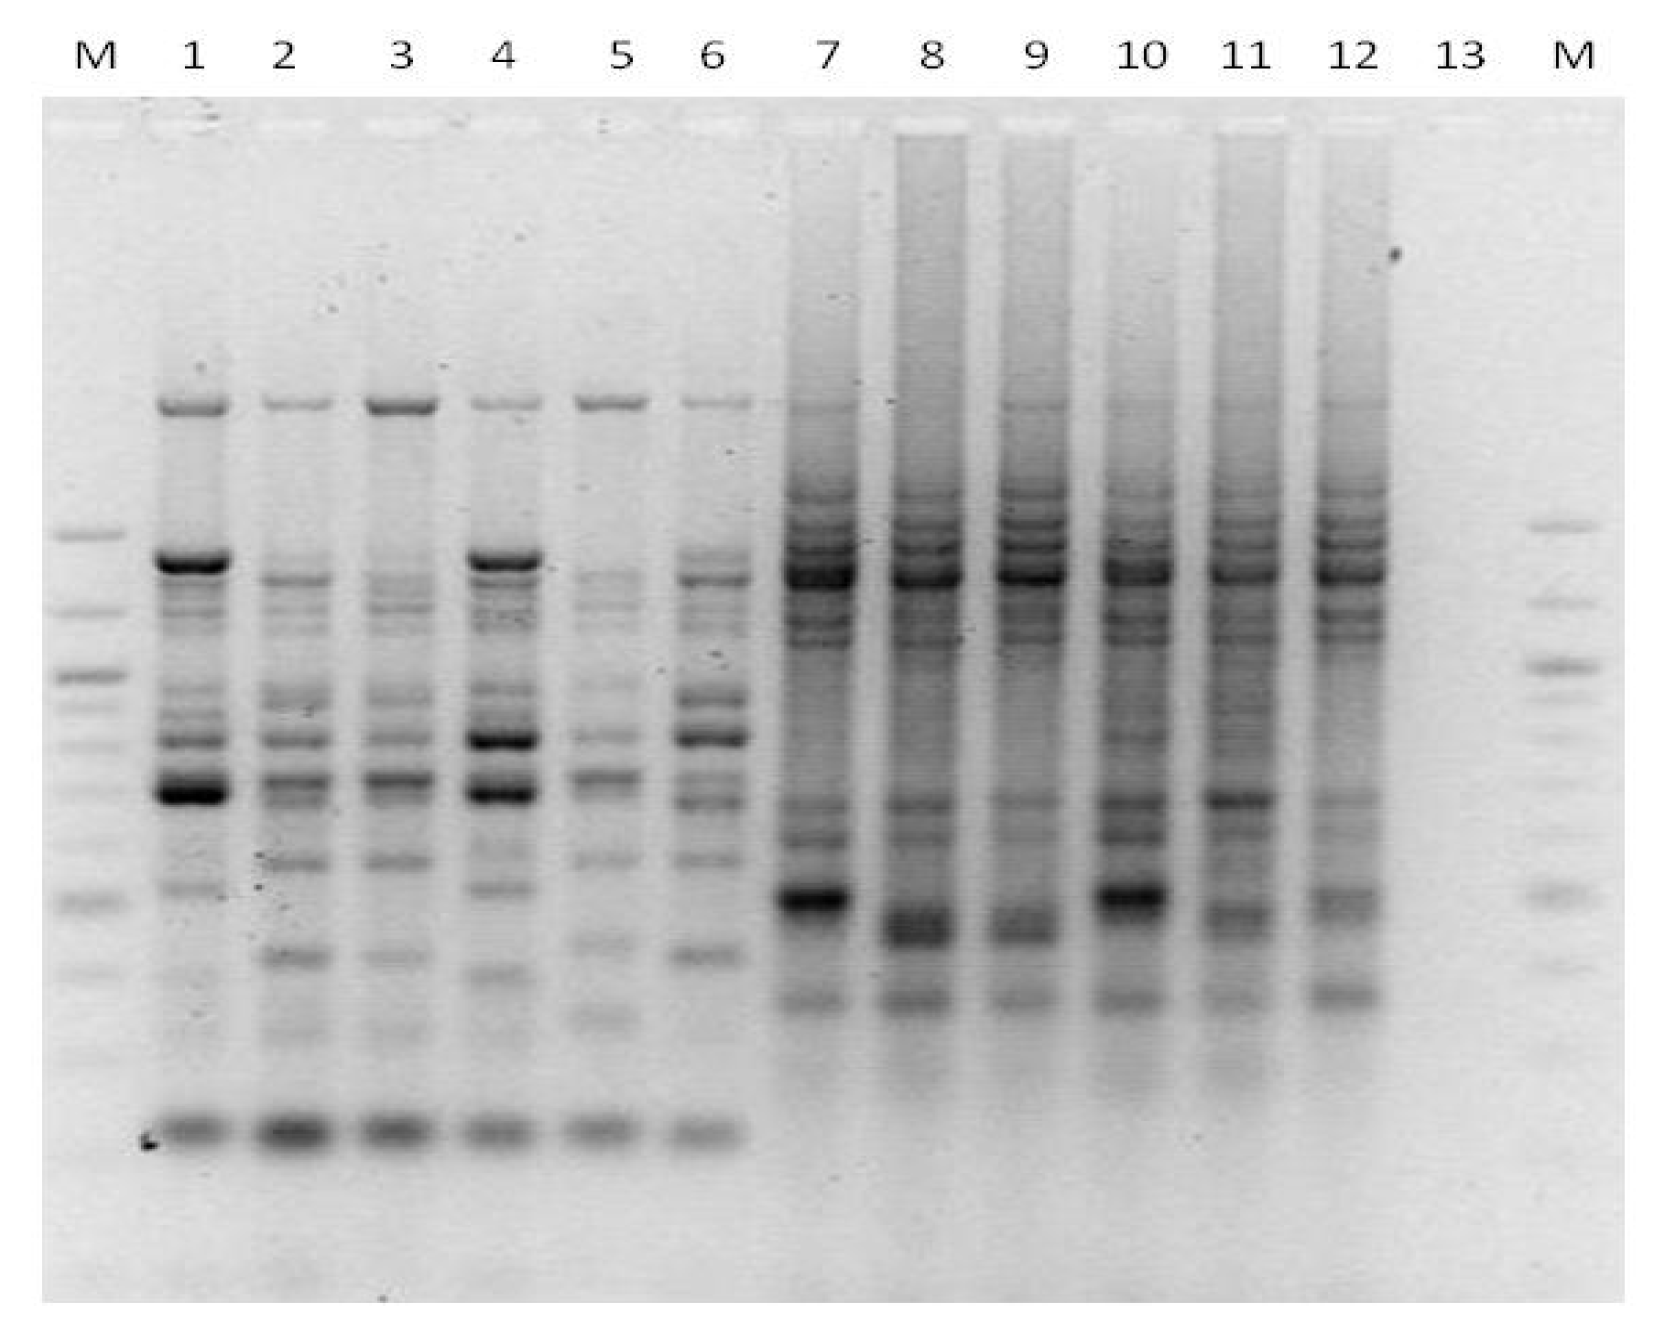
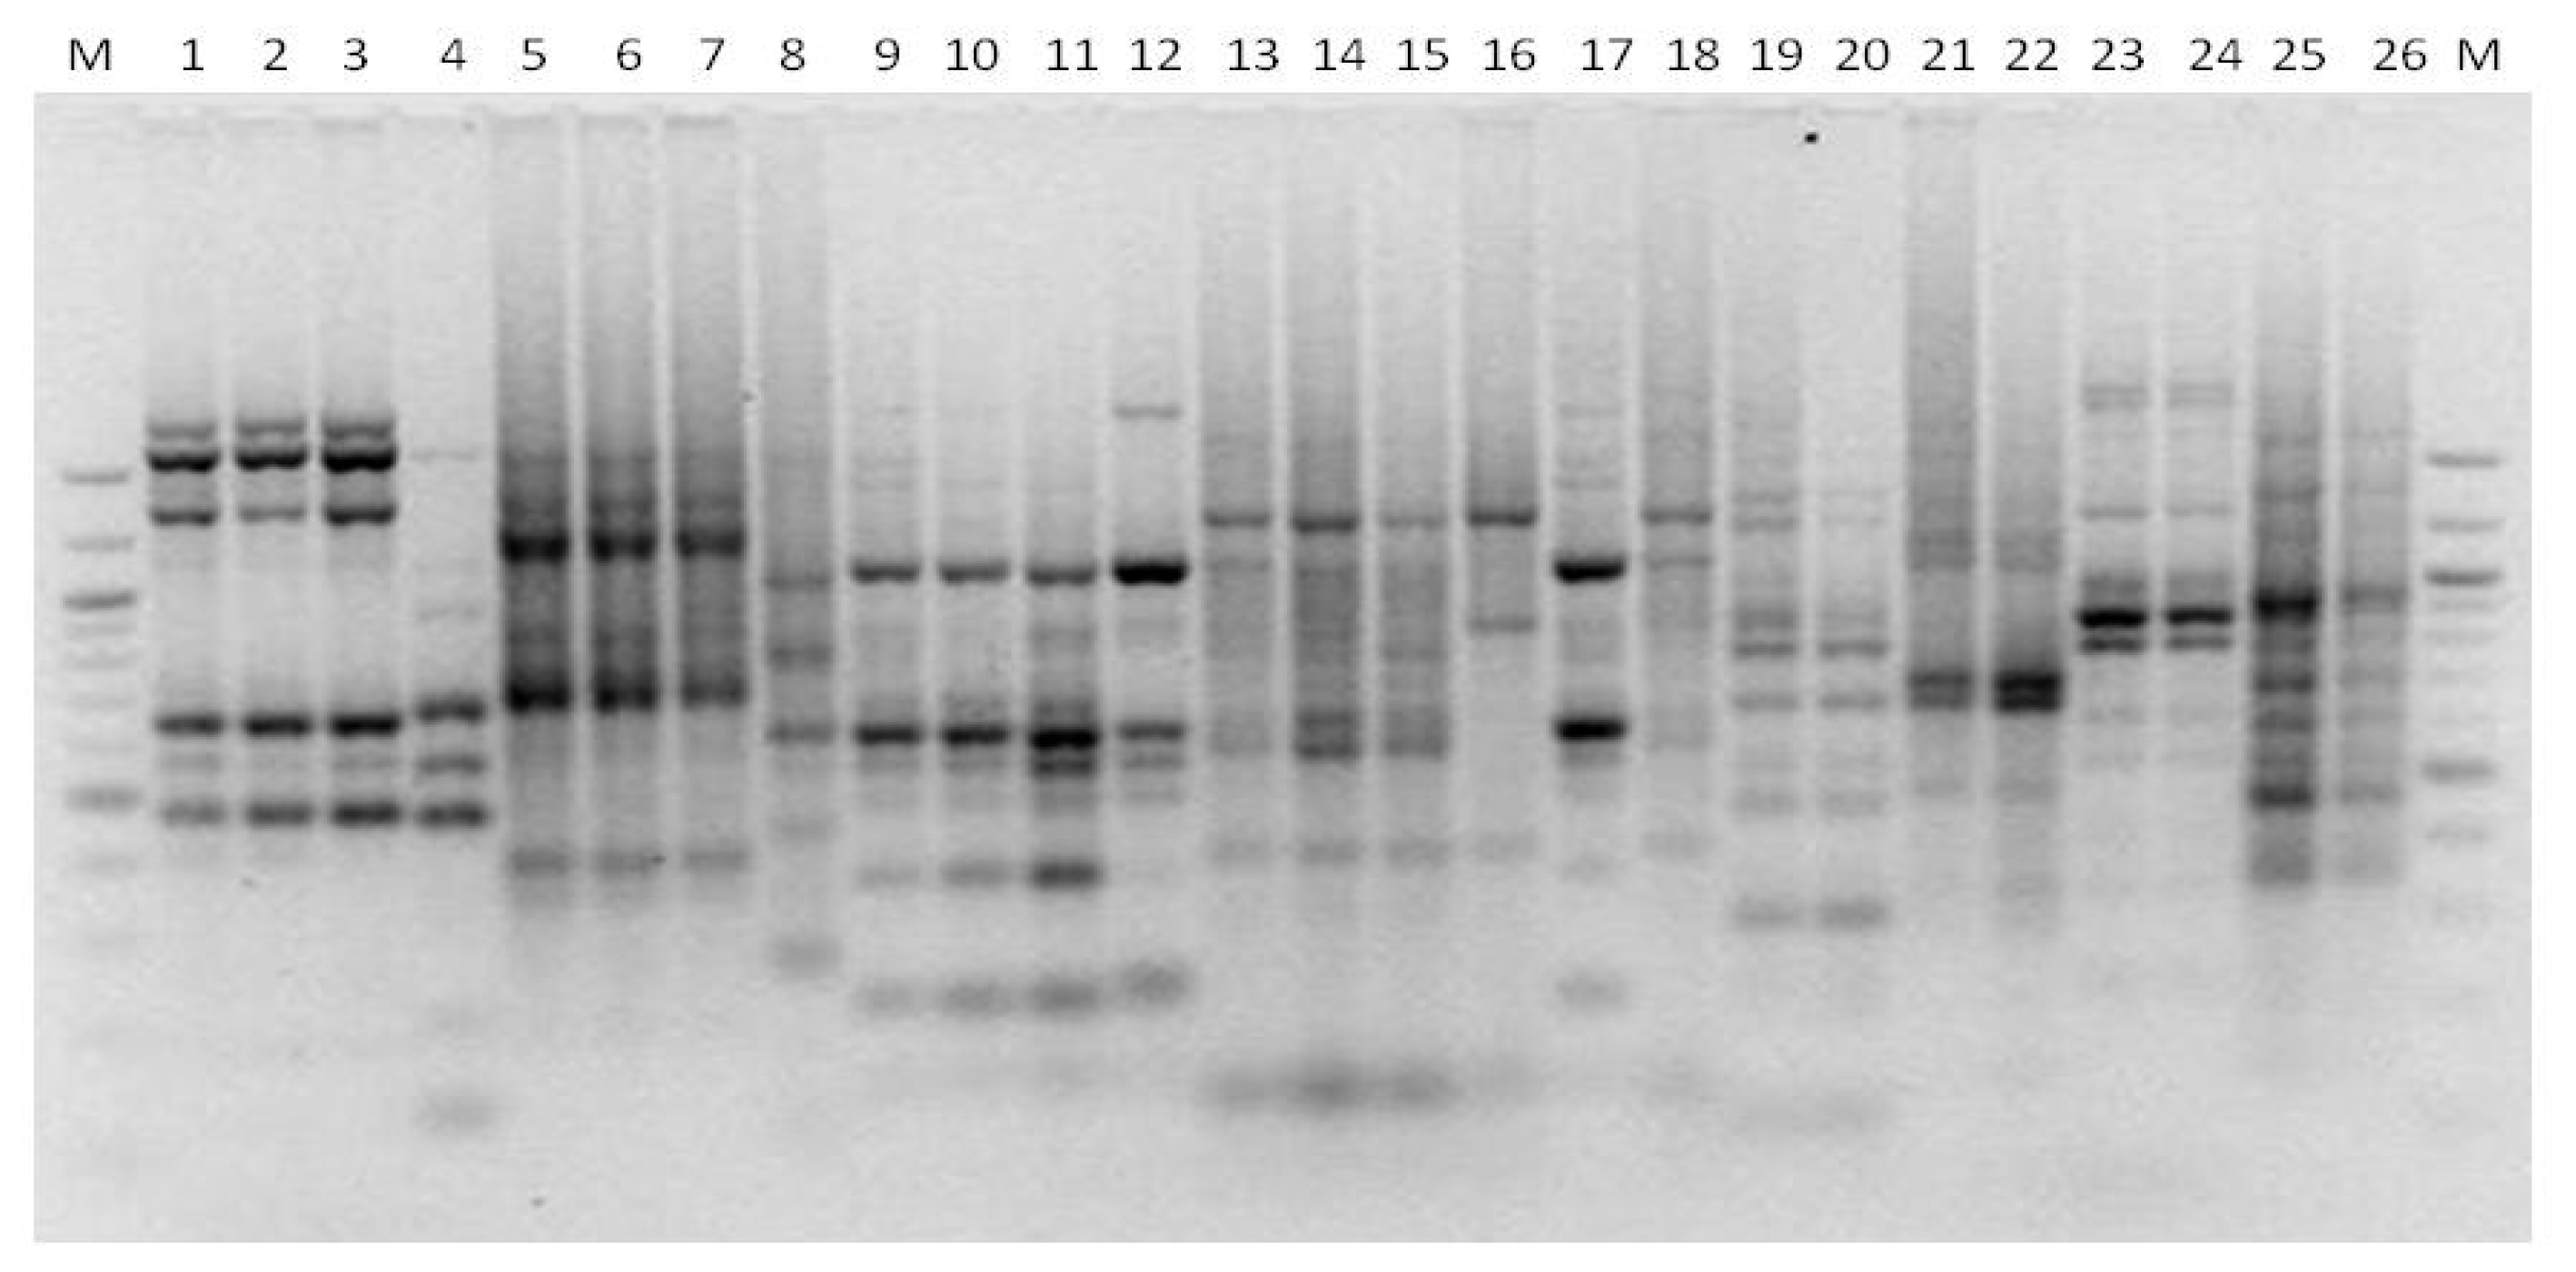
The tandem repeat-tRNA (TRtRNA) PCR method using the TtRNASc primer (5′-GCTTCTATGGCCAAGTTG-3′) combined with either 5GAC (5′-CAGCAGCAGCAGCAG-3′) or ISSR-MB (5′-CTCACAACAACAACAACA-3′) was applied as described previously [20]. The PCR products were separated in 2% agarose gels. A standard molecular size marker (100-bp ladder; New England Biolabs) was used to estimate the sizes of the fragments. Molecular fingerprints were analyzed as above.

3. Results

The TRtRNA-PCR method using the TtRNASc with either the 5GAC or the ISSR-MB primer, and RAPDs using the primer (GTG)3, R5 or RF2 were applied to evaluate their efficiency in discriminating strains of various non-Saccharomyces wine yeast species. In particular, the yeasts included in the present comparative analysis belonged to the species Hanseniaspora guilliermondii, H. uvarum, Issatchenkia orientalis, Lachancea thermotolerans, Metschnikowia pulcherrima, Pichia anomala, Starmerella bacillaris, and Torulaspora delbrueckii. To evaluate the discriminating effectiveness of the above PCR-based fingerprinting methods, indigenous isolates originating from vineyards of diverse geographical regions of Greece (Nemea-Peloponnese, Peza-Crete, and Athens-Attica) were included in the analysis. To increase the confidence level of the selected PCR-generated fragments included in the analysis, the bands were scored quite conservatively, excluding all weak bands or those that were unclear for some genotypes in order to acquire unambiguous and reproducible data.

3.1. Genotyping Lachancea therotolerans

Four randomly selected native L. thermotolerans isolates, one from Nemea (isolate Lt N2), two from Peza (isolates Lt P9 and Lt P14), and one from Athens (isolate Y-7) were analyzed. The reference strain CECT 10387 was also included in the analysis. By using RAPD with the primer (GTG)3, twelve bands were produced, ten of which (83%) were polymorphic (Figure 1). This method discriminated between all individuals except for the two isolates from Peza, which produced undistinguishable patterns.
Similarly, RAPD analysis with either primer R5 or RF2 produced distinct banding profiles for all isolates except P9 and P14 (Figure 2). Primer R5 generated 14 different total bands, 6 of which (43%) were polymorphic. Primer RF2 produced fewer bands, but almost all of them were polymorphic, i.e., seven polymorphic out of eight total (88%; Figure 2).
On the other hand, the TRtRNA-PCR method produced a relatively higher number of bands (Figure 3). In more detail, the use of primer ISSR-MB produced 19 bands, 13 of them being polymorphic (68%), while 5CAG generated 17 bands, with 8 polymorphic (47%). Notably, the analysis with TRtRNA-PCR discriminated between all individuals.

3.2. Genotyping Starmerella bacillaris

Three indigenous S. bacillaris isolates, i.e., isolates Sb N11 from Nemea, Sb P51 from Peza and Y-14 from Athens, and the reference strain CECT 31235 were included in the analysis. Seven total bands were generated by TRtRNA-PCR with the primer ISSR-MB, 5 of which (71%) were polymorphic (Figure 4). This particular method/primer set could not discriminate among the native isolates, which all produced the same pattern, but could differentiate between isolates and the reference strain (CECT 31235). Similarly, the TRtRNA-PCR method with the primer ISSR-MB produced a distinct pattern for strain CECT 31235, while the native isolates generated undistinguishable fingerprints. A total of 11 bands were scored, all of which were polymorphic.
Similar to the TRtRNA-PCR method, the RAPD analysis with primer R5 produced a single pattern for all the indigenous isolates, while a distinct profile for the reference strain was generated (Figure 5). Eleven total bands were detected, 4 of which were polymorphic (36%).
The RAPD analysis with primer (GTG)3 exhibited a higher discriminating capacity, as it produced distinct patterns for all the different isolates (Figure 1). The method could also differentiate between native isolates and the reference strain, generating a total of 10 bands, 5 of which were polymorphic (50%). Finally, RAPD with the primer RF2 could differentiate among isolates and strain CECT 31235 (Figure 5). Although the number of bands generated was smaller (7 bands) than those obtained with the primer (GTG)3, the number of polymorphic bands (6 bands, 86%) was somewhat higher. Taken together, all the methods applied clearly discriminated native yeasts from the reference strain, revealing higher similar banding patterns among the indigenous isolates than with the reference S. bacillaris. Among the methods tested, the RAPD analysis with primer RF2 was the most efficient in resolving among native isolates, despite the fact that it produced a relatively low number of polymorphic bands.

3.3. Genotyping Metschnikowia pulcherrima

Three native M. pulcherrima isolates, Mp N4 and Mp N6 from the Nemea region and Mp P16 from the Peza region, were included in the analysis. The strain M. pulcherrima SIGMO MP11 was also included in the analysis as reference. All the methods could differentiate among all the isolates examined. The TRtRNA-PCR method produced a higher number of bands using the primer ISSR-MB, i.e., 12 polymorphic out of 15 total bands (80%), than the primer 5CAG and 12 total bands vs. 9 polymorphic bands (75%) (Figure 6).
The number of total and polymorphic bands generated by RAPD analysis was 11 and 9 (82%) with primer R5 (Figure 2), 9 and 8 (89%) with primer RF2 (Figure 2), and 7 and 5 (71%) with primer (GTG)3 (Figure 6 and Figure 7), respectively.

3.4. Genotyping Issatchenkia orientalis

Four native I. orientalis isolates, two originating from Peza (Io P8 and Io P14), one from Nemea (Io N5) and one from Athens (Y-6), were examined. The TRtRNA-PCR with either the primer ISSR-MB or 5CAG generated highly similar banding patterns for isolates from Peza and Nemea, differentiating them from the isolate Y-6 from Athens (Figure 4). Nine total and 5 polymorphic bands (56%) were generated by applying the ISSR-MB primer, while 8 total and 6 polymorphic bands (75%) were produced by the primer 5CAG. When the RAPD analysis with primer RF2 was applied, a lower number of total bands were generated, i.e., 6 total and 5 polymorphic bands (83%), respectively (Figure 5). RAPD analysis with either the primer (GTG)3 or R5 further discriminated between isolate Io P8 and Io P14 or Io N5. Nine (6 polymorphic) bands (67%) were produced with primer (GTG)3 (Figure 1) and 12 (8 polymorphic) bands (67%) with primer R5 (Figure 5). The above results show that the RAPD analysis with either the primer (GTG)3 or R5 exhibit a higher capacity in discriminating between native isolates belonging to I. orientalis than the TRtRNA-PCR method or RAPDs with primer RF2. Comparing between the two methods, the use of R5 produced a higher number of both total and polymorphic bands than (GTG)3; therefore, it could be considered as a method of choice for the genotyping of I. orientalis isolates.

3.5. Genotyping Torulaspora delbrueckii

Two indigenous T. delbrueckii isolates from the Nemea region (Td N13 and Td N16) and one reference strain (TO2) were used in this study. The RAPD analysis with primer (GTG)3 produced 6 bands, with 2 of them being polymorphic (33%) and 4 bands being common for all individuals (Figure 1). This method differentiated between the native isolates and the reference strain, while Td N13 and Td N16 produced undistinguishable profiles. Similar banding patterns were observed when either primer R5 or RF2 was applied (Figure 5). However, a higher number of total and polymorphic bands was observed with the primer R5 than with the primer RF2, i.e., 16 and 4 (25%) vs. 13 and 7 (54%), respectively. The TRtRNA-PCR method by either the primer ISSR-MB or 5CAG showed a lower capacity to discriminate among T. delbrueckii isolates than the RAPD analysis, as it could not differentiate between the native isolates and the reference strain. As shown in Figure 6, although an adequate number of bands was generated, i.e., eight bands by primer ISSR-MB and twelve by primer 5CAG, none of them was polymorphic.

3.6. Genotyping Hanseniaspora spp.

Two native H. uvarum isolates, Hu P12 from Peza and Hu N10 from Nemea, and one reference strain (CECT 10389) were tested. Τhe TRtRNA-PCR method with the primer 5CAG produced 7 bands, all of which were monomorphic, so that it could not discriminate between individuals (Figure 6). When the ISSR-MB primer was employed in TRtRNA-PCR, 6 bands were generated with 2 of them being polymorphic, which were able to discriminate between the native H. uvarum isolates and the reference strain CECT 10389 (Figure 6). The RAPD analysis with primer RF2 produced only two monomorphic bands, so that they could not discriminate among individuals (Figure 8). By the use of R5, 7 bands were generated with 2 being polymorphic (29%; Figure 8). Native isolates were differentiated from the strain CECT 10389 by this method. Similar results were achieved by the use of (GTG)3. However, a higher number of total (13) and polymorphic (3) bands were produced by this method/primer (Figure 7).
Two native H. guilliermondii isolates from Nemea (Hg N3 and Hg N8) and one isolate from Athens (Y-9) were included in the analysis. TRtRNA-PCR with the primer 5CAG generated a total of 9 bands, 7 of which were polymorphic (Figure 6). While this method/primer differentiated between strain Y-9 and Nemea isolates, it could not discriminate between Hg N3 and Hg N8. Although the ISSR-MB primer produced a lower number of total (6) and polymorphic (4) bands compared to 5CAG, it differentiated among all three strains (Figure 6). The RAPD analysis with primer (GTG)3 produced five bands, all of which were monomorphic (Figure 7). The RAPD analysis with either the primer R5 or RF2 discriminated between all the isolates. Eight polymorphic bands were generated by primer RF2 (Figure 8). Primer R5 produced the highest number of total and polymorphic bands (11 and 10, respectively) (Figure 8).

3.7. Genotyping Pichia anonala

P. anomala isolates from Peza, i.e., Pa P9 and Pa P12, were included in the analysis. Τhe TRtRNA-PCR method with the primer 5CAG and ISSR-MB generated 6 and 9 monomorphic bands (Figure 4). Similarly, the RAPD analysis with the primer (GTG)3 (Figure 7) and RF2 (Figure 8) produced 6 and 4 monomorphic bands, respectively. Only the RAPD analysis with the primer R5 resolved between Pa P9 and Pa P12 P. anomala isolates (Figure 8). Thirteen total and four polymorphic bands were generated by this method.
Finally, the Meyerozyma caribbica isolates from Peza region (Mc P17 and Mc P21) were undistinguishable by all the methods tested (Figure 2, Figure 4 and Figure 7). The RAPD analysis with primer (GTG)3 produced the highest number of monomorphic bands.

4. Discussion

The organoleptic profile and quality of wine is affected by the presence of different non-Saccharomyces (NS) species or strains [5,6]. Thus, it is of utmost relevance to wine-making to have the ability to easily, quickly, and unambiguously discriminate between yeasts at the strain level. Still, there is a limited, if any, range of available PCR-based fingerprinting approaches for discriminating NS species, compared to S. cerevisiae. While whole genome sequences for several enologically important wild yeasts like H. uvarum and L. thermotolerans are now available, rapid and inexpensive typing techniques are still needed. Here, we utilized and compared two previously developed PCR-fingerprinting approaches, Random Amplified Polymorphic DNA (RAPD) and Tandem repeat-tRNA (TRtRNA), for discriminating yeasts of the species H. guilliermondii, H. uvarum, I. orientalis, L. thermotolerans, M. pulcherrima, P. anomala, S. bacillaris, and T. delbrueckii. These species are among the most frequent and important non-Saccharomyces yeasts residing on grape berries, as has been documented previously [4,21].
M. pulcherrima is one of the most abundant yeast species in fresh grape must. It has interesting technological properties, such as the production of enzymes that liberate aromatic precursors, and various metabolites such as esters that improve wine quality [24]. The TRtRNA-PCR technique described by Barquet et al. [20] was successfully utilized to identify M. pulcherrima strains. RAPD with (GTG)3 was also successfully applied previously to differentiate between M. pulcherrima isolates [22]. In the present study, TRtRNA-PCR showed the best discriminatory capacity among the methods examined for discriminating M. pulcherrima isolates. The primer ISSR-MB produced a higher number of polymorphic bands than primer 5CAG, as wasalso observed previously [20].
H. uvarum, the most common wine yeast on grapes and at the early stages of must fermentation, was considered undesirable in winemaking because it often produces high amounts of ethyl acetate [6,25]. However, more recent studies have shown that certain strains may be beneficial to the organoleptic character of wine by improving the aroma profile [26]. Therefore, an appropriate method for fast efficient fingerprinting is of high importance. The TRtRNA-PCR technique has been previously proposed for differentiating H. uvarum isolates [20]. RAPD analysis with primer P80 was also applied to discriminate H. uvarum strains [16]. However, when primer (GTG)5 was used, H. uvarum isolates could not be differentiated [27]. Here, the RAPD analysis with primer (GTG)3 was the most discriminating method for genotyping H. uvarum isolates.
Previous studies have revealed that certain strains of L. thermotolerans exhibit a range of advantageous enological characteristics, such as the production of glycerol and 2-phenylethanol [28,29] or the ability to produce particularly high levels of lactic acid [5,30]. Therefore, L. thermotolerans was included in the present study, since discriminating and typing of different strains could be beneficial for the wine industry and for research purposes. Taken together, the TRtRNA-PCR method showed a higher capacity in discriminating L. thermotolerans isolates compared to RAPDs. Between the two primer pairs applied in TRtRNA-PCR, the use of ISSR-MB generated the highest number of total and polymorphic bands; therefore, it is suggested as more appropriate for rapid and efficient genotyping of L. thermotolerans. This method was found to produce sufficient polymorphic bands to discriminate L. thermotolerans isolates from grape must [30].
Torulaspora delbrueckii is the most common non-Saccharomyces yeast employed in winemaking to improve quality characteristics, including the aroma profile [31]. As in most non-Saccharomyces vineyard populations, there is a high degree of genetic and phenotypic variation within the species, which may explain how different strains have diverse effects on wine quality [31,32]. In a previous study, RAPD-PCR with the M13 primer provided the best discrimination of T. delbrueckii strains compared to other RAPD primers (M14, Coc, OPA02, and OPA09) or PCR fingerprinting with the primers (GTG)5 and (GAC)5 [33]. Similar results were observed by Canonico et al. [34]. Here, the RAPD analysis with either the primer R5 or RF2 exhibited the highest ability to discriminate between T. delbrueckii isolates, superior to that of TRtRNA-PCR or fingerprinting with (GTG)3. Previously, the RAPD primers R5 and RF2 were used in combination by Tofalo et al. [19] to differentiate among S. bacillaris strains from grapes and wine of Italian origin, showing high discrimination power. By contrast, Pfliegler et al. [35], using the primer RF2 to discriminate S. bacillaris isolates from grapes, must, and wine of diverse geographical origin across Europe, noted that it produced relatively few polymorphic bands, pointing out that it may not be suitable for genetic diversity studies. In the present study, although the RAPD analysis with primer RF2 was the most efficient in resolving among S. bacillaris isolates, it produced a relatively low number of polymorphic bands, coinciding with the results of Pfliegler et al. [35].

5. Conclusions

Taken together, the TRtRNA-PCR using either the primer set TtRNASc or ISSR-MB and RAPDs with primer (GTG)3, R5, or RF2 were found to be adequate for typing the non-Saccharomyces yeast species analyzed in this study. However, different methods/primer sets revealed considerable variations in analyzing and discriminating individuals of different species. The TRtRNA-PCR method with the primer ISSR-MB showed the highest capacity in discriminating L. thermotolerans or M. pulcherrima isolates. The RAPD analysis with primer RF2 was the most efficient in resolving among S. bacillaris isolates. The RAPD analysis with R5 showed the highest capacity among all the methods tested to discriminate between of I. orientalis, H. guilliermondii, and P. anomala isolates. The RAPD analysis with either the primer R5 or RF2 exhibited the highest ability to discriminate between T. delbrueckii isolates. The RAPD analysis with (GTG)3 was the most discriminating method for H. uvarum isolates. The present results could serve as a general guideline for choosing the most appropriate method of those compared here coupled with the best primer set for a particular non-Saccharomyces wine yeast.

Supplementary Materials

The following supporting information can be downloaded at: https://www.mdpi.com/article/10.3390/microbiolres13030046/s1, Table S1: Yeast strains used in the present study.

Author Contributions

Conceptualization, A.N.; methodology, A.N. and G.B.; investigation, E.G.; writing—original draft preparation, A.N.; writing—review and editing, G.B.; supervision, A.N.; funding acquisition, A.N. All authors have read and agreed to the published version of the manuscript.

Funding

This work was partially supported by European Union’s Seventh Framework Programme (FP7/2007–2013) [grant number 315065]. The funders had no role in study design, data collection and analysis, decision to publish, or preparation of the manuscript.

Data Availability Statement

Not applicable.

Conflicts of Interest

The authors declare no conflict of interest.

References

  1. Martini, A.; Ciani, M.; Scorzetti, G. Direct Enumeration and Isolation of Wine Yeasts from Grape Surfaces. Am. J. Enol. Vitic. 1996, 47, 435–440. [Google Scholar]
  2. Fleet, G.H. Wine Yeasts for the Future. FEMS Yeast Res. 2008, 8, 979–995. [Google Scholar] [CrossRef] [PubMed]
  3. Nisiotou, A.A.; Spiropoulos, A.E.; Nychas, G.J.E. Yeast Community Structures and Dynamics in Healthy and Botrytis-Affected Grape Must Fermentations. Appl. Environ. Microbiol. 2007, 73, 6705–6713. [Google Scholar] [CrossRef] [PubMed]
  4. Jolly, N.P.; Varela, C.; Pretorius, I.S. Not Your Ordinary Yeast: Non-Saccharomyces Yeasts in Wine Production Uncovered. FEMS Yeast Res. 2014, 14, 215–237. [Google Scholar] [CrossRef]
  5. Sgouros, G.; Chalvantzi, I.; Mallouchos, A.; Paraskevopoulos, Y.; Banilas, G.; Nisiotou, A. Biodiversity and Enological Potential of Non-Saccharomyces Yeasts from Nemean Vineyards. Fermentation 2018, 4, 32. [Google Scholar] [CrossRef]
  6. Nisiotou, A.; Mallouchos, A.; Tassou, C.; Banilas, G. Indigenous Yeast Interactions in Dual-Starter Fermentations May Improve the Varietal Expression of Moschofilero Wine. Front. Microbiol. 2019, 10, 1712. [Google Scholar] [CrossRef]
  7. Ciani, M.; Comitini, F.; Mannazzu, I.; Domizio, P. Controlled Mixed Culture Fermentation: A New Perspective on the Use of Non-Saccharomyces Yeasts in Winemaking. FEMS Yeast Res. 2010, 10, 123–133. [Google Scholar] [CrossRef]
  8. Jolly, N.P.; Augustyn, O.P.H.; Pretorius, I.S. The Role and Use of Non-Saccharomyces Yeasts in Wine Production. S. Afr. J. Enol. Vitic. 2006, 27, 15–39. [Google Scholar] [CrossRef]
  9. Ferraro, L.; Fatichenti, F.; Ciani, M. Pilot Scale Vinification Process Using Immobilized Candida stellata Cells and Saccharomyces cerevisiae. Process Biochem. 2000, 35, 1125–1129. [Google Scholar] [CrossRef]
  10. Nisiotou, A.; Sgouros, G.; Mallouchos, A.; Nisiotis, C.S.; Michaelidis, C.; Tassou, C.; Banilas, G. The Use of Indigenous Saccharomyces cerevisiae and Starmerella bacillaris Strains as a Tool to Create Chemical Complexity in Local Wines. Food Res. Int. 2018, 111, 498–508. [Google Scholar] [CrossRef]
  11. Bely, M.; Stoeckle, P.; Masneuf-Pomarède, I.; Dubourdieu, D. Impact of Mixed Torulaspora delbrueckiSaccharomyces cerevisiae Culture on High-Sugar Fermentation. Int. J. Food Microbiol. 2008, 122, 312–320. [Google Scholar] [CrossRef] [PubMed]
  12. Jolly, N.P.; Augustyn, O.P.H.; Pretorius, I.S. The Effect of Non-Saccharomyces Yeasts on Fermentation and Wine Quality. S. Afr. J. Enol. Vitic. 2003, 24, 8–10. [Google Scholar] [CrossRef]
  13. Nisiotou, A.; Parlapani, F.; Kormas, K.; Boziaris, I. Old Targets, New Weapons: Food Microbial Communities Revealed with Molecular Tools. In Novel Food Preservation and Microbial Assessment Techniques; CRC Press: Boca Raton, FL, USA, 2014; pp. 277–312. [Google Scholar]
  14. Martorell, P.; Barata, A.; Malfeito-Ferreira, M.; Fernández-Espinar, M.T.; Loureiro, V.; Querol, A. Molecular Typing of the Yeast Species Dekkera bruxellensis and Pichia guilliermondii Recovered from Wine Related Sources. Int. J. Food Microbiol. 2006, 106, 79–84. [Google Scholar] [CrossRef] [PubMed]
  15. Baleiras Couto, M.M.; van der Vossen, J.M.B.M.; Hofstra, H.; Huis in ’t Veld, J.H.J. RAPD Analysis: A Rapid Technique for Differentiation of Spoilage Yeasts. Int. J. Food Microbiol. 1994, 24, 249–260. [Google Scholar] [CrossRef]
  16. Capece, A.; Fiore, C.; Maraz, A.; Romano, P. Molecular and Technological Approaches to Evaluate Strain Biodiversity in Hanseniaspora uvarum of Wine Origin. J. Appl. Microbiol. 2005, 98, 136–144. [Google Scholar] [CrossRef] [PubMed]
  17. De Benedictis, M.; Bleve, G.; Tristezza, M.; Tufariello, M.; Grieco, F. An Optimized Procedure for the Enological Selection of Non-Saccharomyces Starter Cultures. Antonie Van Leeuwenhoek 2011, 99, 189–200. [Google Scholar] [CrossRef]
  18. Agnolucci, M.; Vigentini, I.; Capurso, G.; Merico, A.; Tirelli, A.; Compagno, C.; Foschino, R.; Nuti, M. Genetic Diversity and Physiological Traits of Brettanomyces bruxellensis Strains Isolated from Tuscan Sangiovese Wines. Int. J. Food Microbiol. 2009, 130, 238–244. [Google Scholar] [CrossRef]
  19. Tofalo, R.; Schirone, M.; Torriani, S.; Rantsiou, K.; Cocolin, L.; Perpetuini, G.; Suzzi, G. Diversity of Candida zemplinina Strains from Grapes and Italian Wines. Food Microbiol. 2012, 29, 18–26. [Google Scholar] [CrossRef]
  20. Barquet, M.; Martín, V.; Medina, K.; Pérez, G.; Carrau, F.; Gaggero, C. Tandem Repeat-TRNA (TRtRNA) PCR Method for the Molecular Typing of Non-Saccharomyces Subspecies. Appl. Microbiol. Biotechnol. 2012, 93, 807–814. [Google Scholar] [CrossRef]
  21. Chalvantzi, I.; Banilas, G.; Tassou, C.; Nisiotou, A. Biogeographical Regionalization of Wine Yeast Communities in Greece and Environmental Drivers of Species Distribution at a Local Scale. Front. Microbiol. 2021, 12, 705001. [Google Scholar] [CrossRef]
  22. Senses-Ergul, S.; Ágoston, R.; Belák, Á.; Deák, T. Characterization of Some Yeasts Isolated from Foods by Traditional and Molecular Tests. Int. J. Food Microbiol. 2006, 108, 120–124. [Google Scholar] [CrossRef] [PubMed]
  23. Martín, B.; Garriga, M.; Hugas, M.; Bover-Cid, S.; Veciana-Nogués, M.T.; Aymerich, T. Molecular, Technological and Safety Characterization of Gram-Positive Catalase-Positive Cocci from Slightly Fermented Sausages. Int. J. Food Microbiol. 2006, 107, 148–158. [Google Scholar] [CrossRef] [PubMed]
  24. Vicente, J.; Ruiz, J.; Belda, I.; Benito-Vázquez, I.; Marquina, D.; Calderón, F.; Santos, A.; Benito, S. The Genus Metschnikowia in Enology. Microorganisms 2020, 8, 1038. [Google Scholar] [CrossRef] [PubMed]
  25. du Toit, M.; Pretorius, I.S. Microbial Spoilage and Preservation of Wine: Using Weapons from Nature’s Own Arsenal-A Review. S. Afr. J. Enol. Vitic. 2019, 21, 74–96. [Google Scholar] [CrossRef]
  26. Howell, K.; Varela, C.A.; Grieco, F.; Tristezza, M.; Tufariello, M.; Capozzi, V.; Spano, G.; Mita, G. The Oenological Potential of Hanseniaspora uvarum in Simultaneous and Sequential Co-Fermentation with Saccharomyces cerevisiae for Industrial Wine Production. Front. Microbiol. 2016, 1, 670. [Google Scholar] [CrossRef]
  27. Caruso, M.; Capece, A.; Salzano, G.; Romano, P. Typing of Saccharomyces cerevisiae and Kloeckera apiculata Strains from Aglianico Wine. Lett. Appl. Microbiol. 2002, 34, 323–328. [Google Scholar] [CrossRef]
  28. Gobbi, M.; Comitini, F.; Domizio, P.; Romani, C.; Lencioni, L.; Mannazzu, I.; Ciani, M. Lachancea thermotolerans and Saccharomyces cerevisiae in Simultaneous and Sequential Co-Fermentation: A Strategy to Enhance Acidity and Improve the Overall Quality of Wine. Food Microbiol. 2013, 33, 271–281. [Google Scholar] [CrossRef]
  29. Belda, I.; Ruiz, J.; Beisert, B.; Navascués, E.; Marquina, D.; Calderón, F.; Rauhut, D.; Benito, S.; Santos, A. Influence of Torulaspora delbrueckii in Varietal Thiol (3-SH and 4-MSP) Release in Wine Sequential Fermentations. Int. J. Food Microbiol. 2017, 257, 183–191. [Google Scholar] [CrossRef]
  30. Banilas, G.; Sgouros, G.; Nisiotou, A. Development of Microsatellite Markers for Lachancea thermotolerans Typing and Population Structure of Wine-Associated Isolates. Microbiol. Res. 2016, 193, 1–10. [Google Scholar] [CrossRef]
  31. Benito, S. The Impact of Torulaspora delbrueckii Yeast in Winemaking. Appl. Microbiol. Biotechnol. 2018, 102, 3081–3094. [Google Scholar] [CrossRef]
  32. Ramírez, M.; Velázquez, R. The Yeast Torulaspora Delbrueckii: An Interesting but Difficult-to-Use Tool for Winemaking. Fermentation 2018, 4, 94. [Google Scholar] [CrossRef] [Green Version]
  33. Renault, P.; Miot-Sertier, C.; Marullo, P.; Hernández-Orte, P.; Lagarrigue, L.; Lonvaud-Funel, A.; Bely, M. Genetic Characterization and Phenotypic Variability in Torulaspora delbrueckii Species: Potential Applications in the Wine Industry. Int. J. Food Microbiol. 2009, 134, 201–210. [Google Scholar] [CrossRef] [PubMed]
  34. Canonico, L.; Comitini, F.; Ciani, M. TdPIR Minisatellite Fingerprinting as a Useful New Tool for Torulaspora delbrueckii Molecular Typing. Int. J. Food Microbiol. 2015, 200, 47–51. [Google Scholar] [CrossRef] [PubMed]
  35. Pfliegler, W.P.; Horváth, E.; Kállai, Z.; Sipiczki, M. Diversity of Candida zemplinina Isolates Inferred from RAPD, Micro/Minisatellite and Physiological Analysis. Microbiol. Res. 2014, 169, 402–410. [Google Scholar] [CrossRef] [PubMed]
Figure 1. Representative agarose gel showing RAPD profiles generated with the primer (GTG)3. M: 100 bp DNA marker; 1: S. bacillaris Sb N11; 2: S. bacillaris Sb P51; 3: S. bacillaris Y-14; 4: S. bacillaris CECT 31235; 5: I. orientalis Io P8; 6: I. orientalis Io P14; 7: I. orientalis Io N5; 8: I. orientalis Y-6; 9: M. pulcherrima Mp P16; 10: M. pulcherrima MP11; 11: L. thermotolerans Lt P9; 12: L. thermotolerans Lt N2; 13: L. thermotolerans Lt P14; 14: L. thermotolerans CECT 10387; 15: L. thermotolerans Y-7; 16: T. delbrueckii Td N16; 17: T. delbrueckii Td N13; 18: T. delbrueckii TO2; M: 1 kb DNA marker.
Microbiolres 13 00046 g001
Figure 2. RAPD profiles generated with primers R5 (lanes1-2, 5–8 and 13–18) and RF2 (lanes 3–4, 9–12, and 14–19) M: 100 bp DNA marker; 1, 3: M. carribica Mc P17; 2, 4: M. carribica Mc P21; 5, 9: M. pulcherrima Mp PL16; 6, 10: M. pulcherrima MP11; 7, 11: M. pulcherrima Mp N6; 8, 12: M. pulcherrima Mp N4; 13, 19: L. thermotolerans CECT 10387; 14, 20: L. thermotolerans Y-7; 15, 21: L. thermotolerans Lt P14; 16, 22: L. thermotolerans 10387; 17, 23: L. thermotolerans Lt N2; 18, 24: L. thermotolerans Lt P9.
Microbiolres 13 00046 g002
Figure 3. TRtRNA-PCR banding profiles generated with the primer pair sets ISSR-MB/TtRNASc (lanes 1–6) and 5CAG/TtRNASc (lanes 7–12). M: 100 bp DNA marker; 1, 7: L. thermotolerans CECT 10387; 2,8: L. thermotolerans Y-7; 3, 9: L. thermotolerans Lt P14; 4, 10: L. thermotolerans CECT 10387; 5, 11: L. thermotolerans Lt N2; 6, 12: L. thermotolerans Lt P9.
Microbiolres 13 00046 g003
Figure 4. TRtRNA-PCR banding profiles generated with the primer pair ISSR-MB/TtRNASc (lanes 1–4, 9–12, 17, 19–20, and 23–24) and 5CAG/TtRNASc (lanes 5–8, 13–16, 18, 21–22, and 25–26). M: 100 bp DNA marker; 1, 5: S. bacillaris Sb N11; 2,6: S. bacillaris Sb P51; 3, 7: S. bacillaris Y-14; 4, 8: S. bacillaris CECT 31235; 9, 13: I. orientalis Io P8; 10, 14: I. orientalis Io P14; 11, 15: I. orientalis Io N5; 12, 16: I. orientalis Y-6; 17–18: H. osmophila Ho N15; 19, 21: P. anomala Pa P9; 20, 22: P. anomala Pa P12; 23, 25: M. carribica Mc P17; 24, 26: M. carribica McP21.
Microbiolres 13 00046 g004
Figure 5. RAPD banding profiles generated with primers R5 (lanes 1–5, 11–14, 19–21, 25–27, 31–33, and 37–38) and RF2 (lanes 6–10,15–18, 22–24, 28–30, 34–36, and 39–40). M: 100 bp DNA marker; 1, 6: S. bacillaris Sb N11; 2, 7: S. bacillaris Sb P51; 3, 8: S. bacillaris Y-14; 4, 9: S. bacillaris Sb P13; 5, 10: S. bacillaris CECT 31235; 11, 15: I. orientalis Io P8; 12, 16: I. orientalis Io P14; 13, 17: I. orientalis Io N5; 14, 18: I. orientalis Y-6; 19, 22: T. delbrueckii Td N6; 20, 23: T. delbrueckii Td N13; 21, 24: T. delbrueckii TO2.
Microbiolres 13 00046 g005
Figure 6. TRtRNA-PCR profiles generated with the primer pair ISSR-MB/TtRNASc (lanes 1–4, 9–11, 15–17, and 21–23) and 5CAG/TtRNASc (lanes 5–8, 12–14, 18–20, and 24–26). M: 100 bp DNA marker; 1, 5: M. pulcherrima Mp P16; 2,6: M. pulcherrima Mp N4; 3, 7: M. pulcherrima Mp N6; 4, 8: M. pulcherrima MP11; 9, 12: H. uvarum Hu P12; 10, 13: H. uvarum Hu N10; 11, 14: H. uvarum CECT10389; 15, 18: H. guilliermondii Y-9; 16, 19: H. guilliermondii Hg N8; 17, 20: H. guilliermondii Hg N3; 21, 24: T. delbrueckii Td N6; 22, 25: T. delbrueckii Td N13; 23, 26: T. delbrueckii TO2.
Microbiolres 13 00046 g006
Figure 7. RAPD profiles generated with primers (GTG)3. M: 1 kb DNA marker; 1: P. anomala Pa P9; 2: Pichia sp. P P22; 3: P. anomala Pa P12; 4: M. pulcherrima Mp N6; 5: M. pulcherrima Mp N4; 6: M. carribica Mc P17; 7: M. carribica Mc P21; 8: H. osmophila Ho N15; 9: H. uvarum Hu P12; 10: H. uvarum Hu N10; 11: H. uvarum CECT 10389; 12: H. guilliermondii Hg N3; 13: H. guilliermondii Hg N8; M: 100 bp DNA marker.
Microbiolres 13 00046 g007
Figure 8. RAPD profiles generated with primers R5 (lanes 1–3, 7–9, and 13–14) and RF2 (lanes 4–6, 10–12, and 15–16). M: 100 bp DNA marker; 1, 4: H. uvarum Hu P12; 2, 5: H. uvarum Hu N10; 3, 6: H. uvarum CECT10389; 7, 10: H. guilliermondii Y-9; 8, 11: H. guilliermondii Hg N3; 9, 12: H. guilliermondii Hg N8; 13, 15: P. anomala Pa P9; 14, 16: P. anomala Pa P12.
Microbiolres 13 00046 g008
Publisher’s Note: MDPI stays neutral with regard to jurisdictional claims in published maps and institutional affiliations.

