1. Introduction
Electric machines have played a crucial role in the maritime industry for over a century, serving as auxiliary systems or primary propulsion for a wide range of vessels including cruise ships, ferries, yachts, battleships, icebreakers, shuttle tankers, and specialised vessels [
1,
2]. Electric propulsion in the maritime sector is a rapidly advancing field driven by advancements in power electronics and machine design [
3]. It offers significant environmental benefits by reducing fuel consumption and delivers notable advantages in EF, performance, manoeuvrability and safety compared to traditional diesel-mechanical systems [
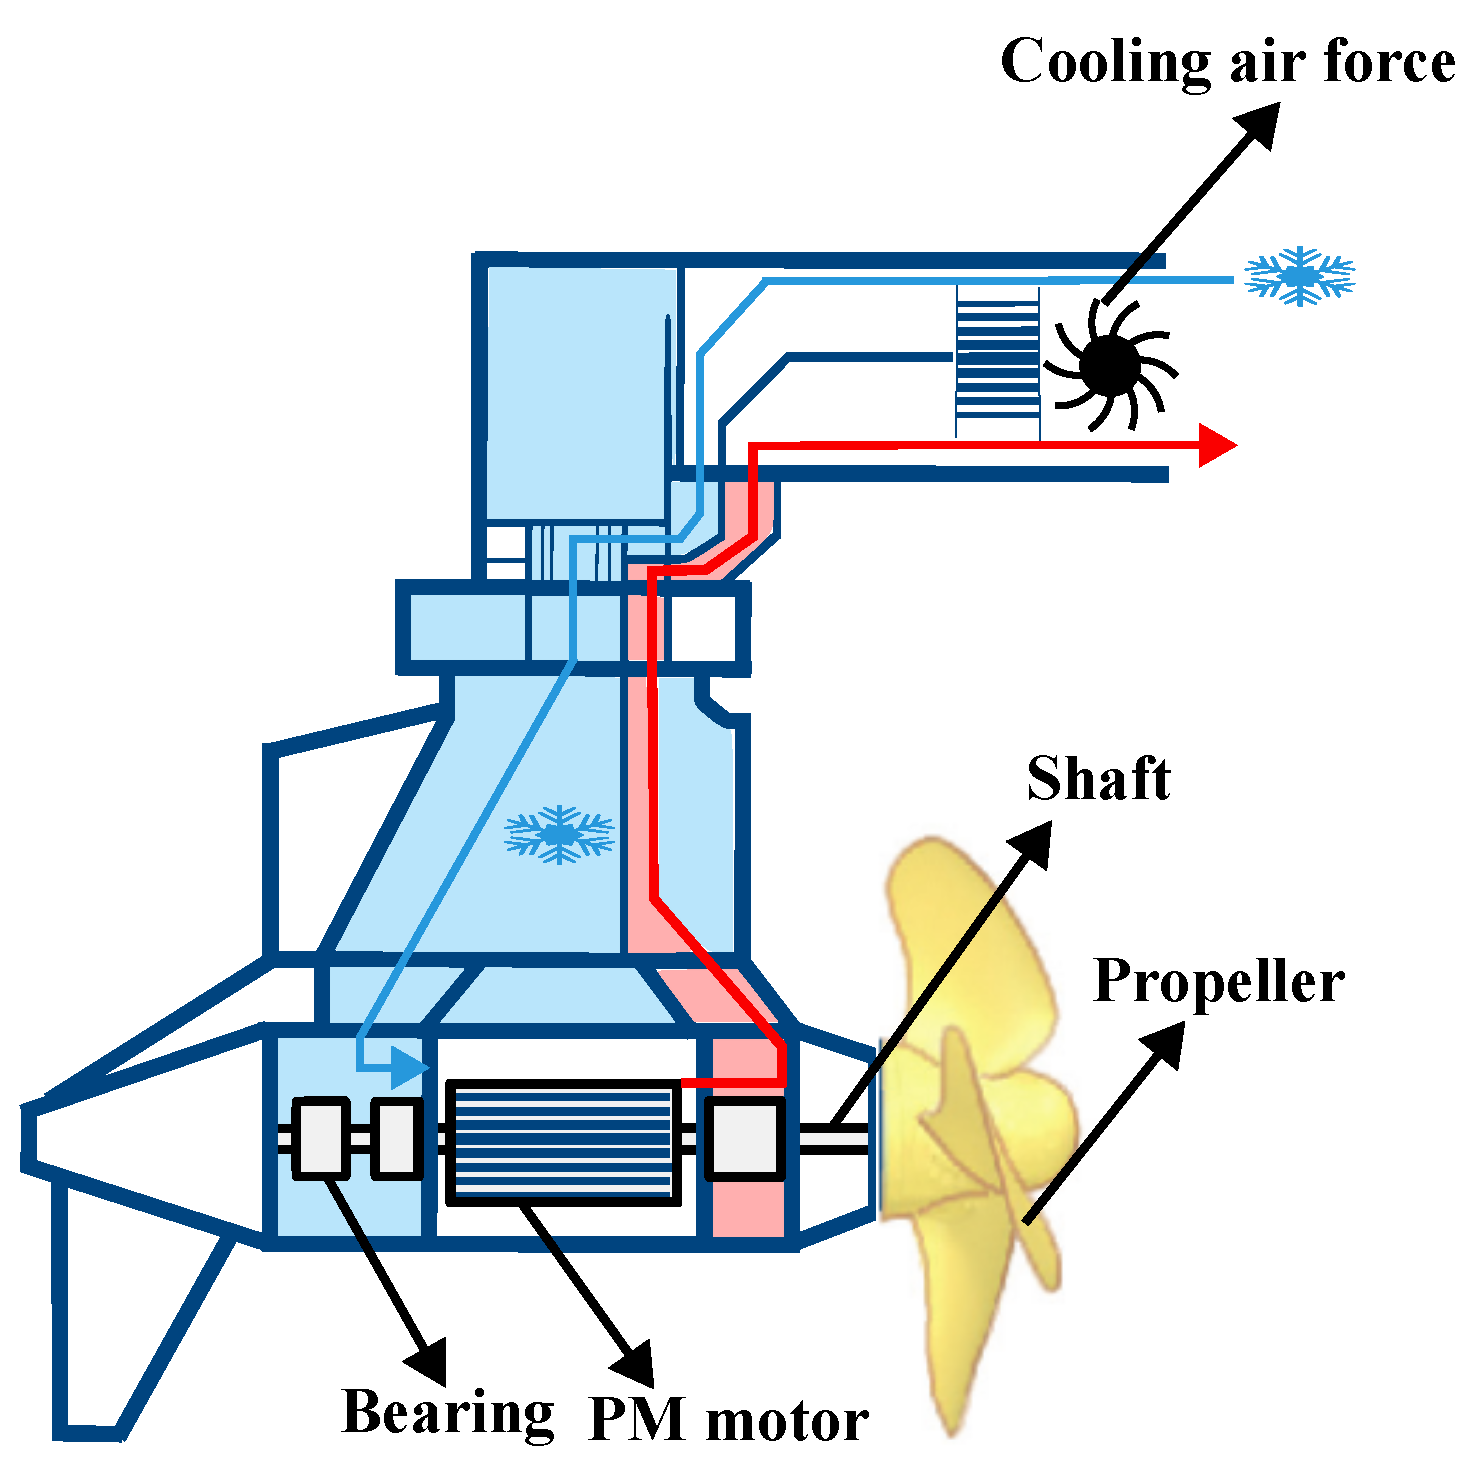
4]. The latest advancement in electrical ship propulsion is podded propulsion, which involves positioning the prime mover outside the ship’s hull on an azimuthing podded, as depicted in
Figure 1. This pod-based approach eliminates the need for a gearbox and enables the direct mounting of the propeller into the electric motor. By eliminating mechanical coupling, this design offers space and energy savings, improved EF and enhanced manoeuvrability during shallow-water navigation and embarkation/disembarkation [
5]. In addition, electric propulsion systems contribute to a higher comfort class rating on board ships due to reduced vibration and noise levels [
6].
When selecting an electric motor for marine propulsion, important considerations include high EF, low torque ripple, and high power and torque density. Therefore, careful selection of the motor type and topology is crucial in developing a podded propulsion system. These systems are typically categorised based on four specific levels of supply voltage: 690 V, 3.3 kV, 6.6 kV, and 11 kV [
7]. Numerous electrical motors designed for marine propulsion have been presented in the literature and compared in references [
8,
9,
10].
The unique properties of high-temperature superconductor (HTS) materials have led to their application in high-power systems such as ship propulsion, resulting in improved performance [
11,
12,
13]. However, the use of HTS materials in ship propulsion presents challenges, including increased complexity and the cost of the cooling system. In some cases, the cooling system required for HTS materials can be larger in size than the electrical motor itself, which can be considered a drawback, especially when space limitations are a significant factor [
14,
15,
16,
17]. PM motors are highly regarded as top contenders for ship propulsion due to their compact size and high torque density. These motors are designed with a wide range of configurations, including surface-mounted PM [
18,
19,
20], Halbach-array PM [
21], spoke-array PM [
22], and interior PM [
23,
24,
25,
26,
27] arrangements. Furthermore, axial flux PM motors [
28] are also considered.
In recent years, permanent magnet vernier machines (PMVM) have gained interest due to their higher torque density compared to standard PMSMs while maintaining the same structural simplicity [
29,
30,
31,
32]. However, PMVMs are characterised by their low power factor (PF), which is a result of high leakage flux and high winding reactance. In an effort to improve the PF of PMVMs, some researchers have proposed more complex topologies to reduce leakage flux, such as double-stator [
32], double-rotor [
33] and HTS-bulk PMVM [
34]. PMVMs with high pole ratios generally utilise a relatively small number of stator pole pairs, combined with a notably greater number of slots. This arrangement results in windings that overlap, accompanied by long end connections. These elongated end-windings can occupy a significant portion of the overall machine volume, particularly in high-power applications when the PMVM has a short stack length. To address this issue and minimise the length of the end-windings, low pole-ratio PMVMs with non-overlap windings are also proposed. These showcase a significant reduction in end-winding length and associated copper loss. However, these PMVMs also exhibit a considerably lower torque capacity due to a lower winding factor [
35].
An effective balance can be struck with the Vernier machine by using a fractional-slot winding with a coil pitch of two [
36,
37]. The main objective of this strategy is to reduce end-winding length while preserving a high winding factor [
38,
39,
40]. Previous studies have focused primarily on comparing various types of PMVMs and conventional PMSMs at multi-kilowatt power levels and different PF [
41]. A novel aspect of this study is the categorization of gear ratios into three distinct types: Type A, Type B, and Type C. This is followed by a comparative analysis of various PMVMs across these categories against conventional PMSMs for ship propulsion applications. Such a comparison, especially at high power levels and with a high PF characteristic of Vernier motors, is rarely addressed in existing literature. The comparison includes a comprehensive evaluation of all models in terms of mass, cost, EF, PF, torque ripple, losses, cooling system complexity and thermal performance, current density, torque per mass, and torque per volume. The results indicate that Type A, which represents a high gear ratio, is not a suitable candidate for this application. In contrast, Types B and C can compete with conventional PMSMs and, in some aspects, offer better performance for this application. These advantages will be discussed in detail in the following sections.
2. Fundamental Working Principle
In a conventional PMSM with
Q slots, the stator winding pole-pair number (
) is equal to the rotor pole-pair number (
) to attain synchronous speed and induce electromagnetic torque. In a PMSM, the angular velocity of the air-gap field aligns with the rotational speed of the stator field, a condition met when the rotor’s pole-pair count matches that of the stator. However, in the case of a Vernier machine, the relationship between
,
and
Q is governed by
The velocity of the air-gap field is times faster than that of the stator field, effectively defining the gear ratio .
This gear ratio in Vernier machines emulates the behavior of a magnetic gear, where a small movement of the rotor triggers a rapidly changing magnetic field in the stator due to field-modulation effects.
Figure 2 provides a visual representation of this concept using a specific Vernier machine configuration with a
slot/pole combination and a gear ratio of
.
2.1. Rotor Harmonic Comparison
The air-gap flux density of the PMVM can be defined from the MMF generated by the PMs and the air-gap permeance of the stator slots, which are expressed by Equation (
2) and Equation (
3), respectively.
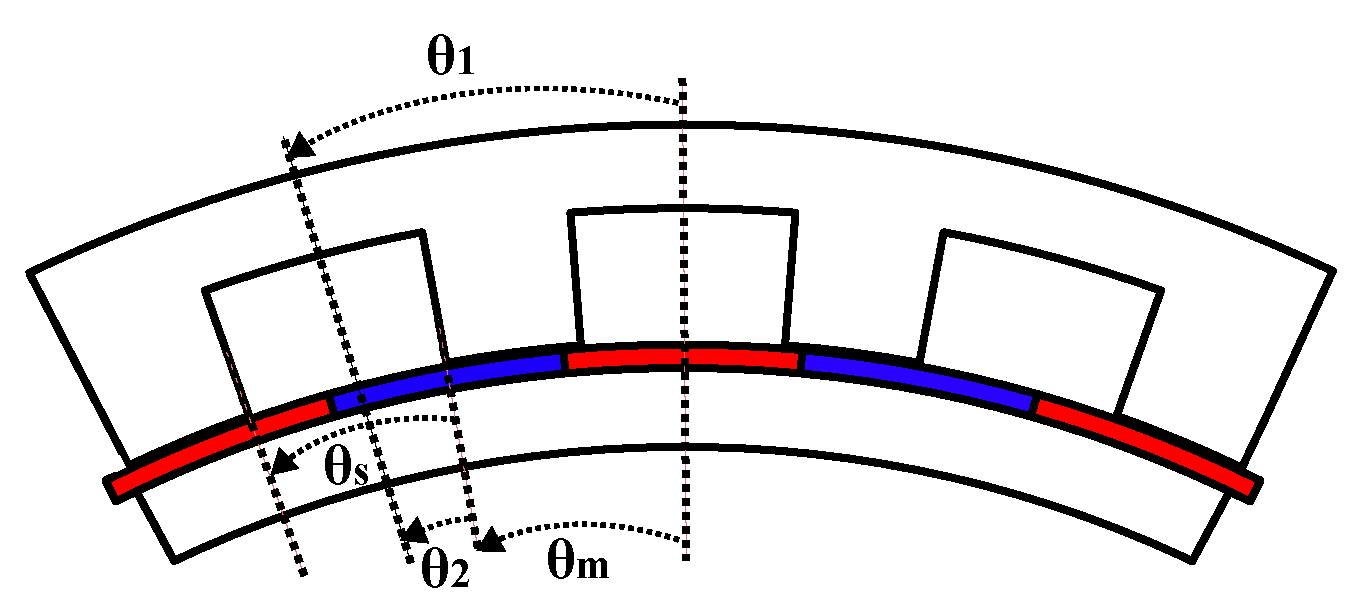
where
and
are defined in
Figure 3 as mechanical angles, and
and
are given as in [
42]:
where
is the permeability of the air,
g is the air-gap length,
=
, and
. The air-gap flux density of the permanent magnet, (
), is obtained as
where
is the area of air gap and
According to Equation (
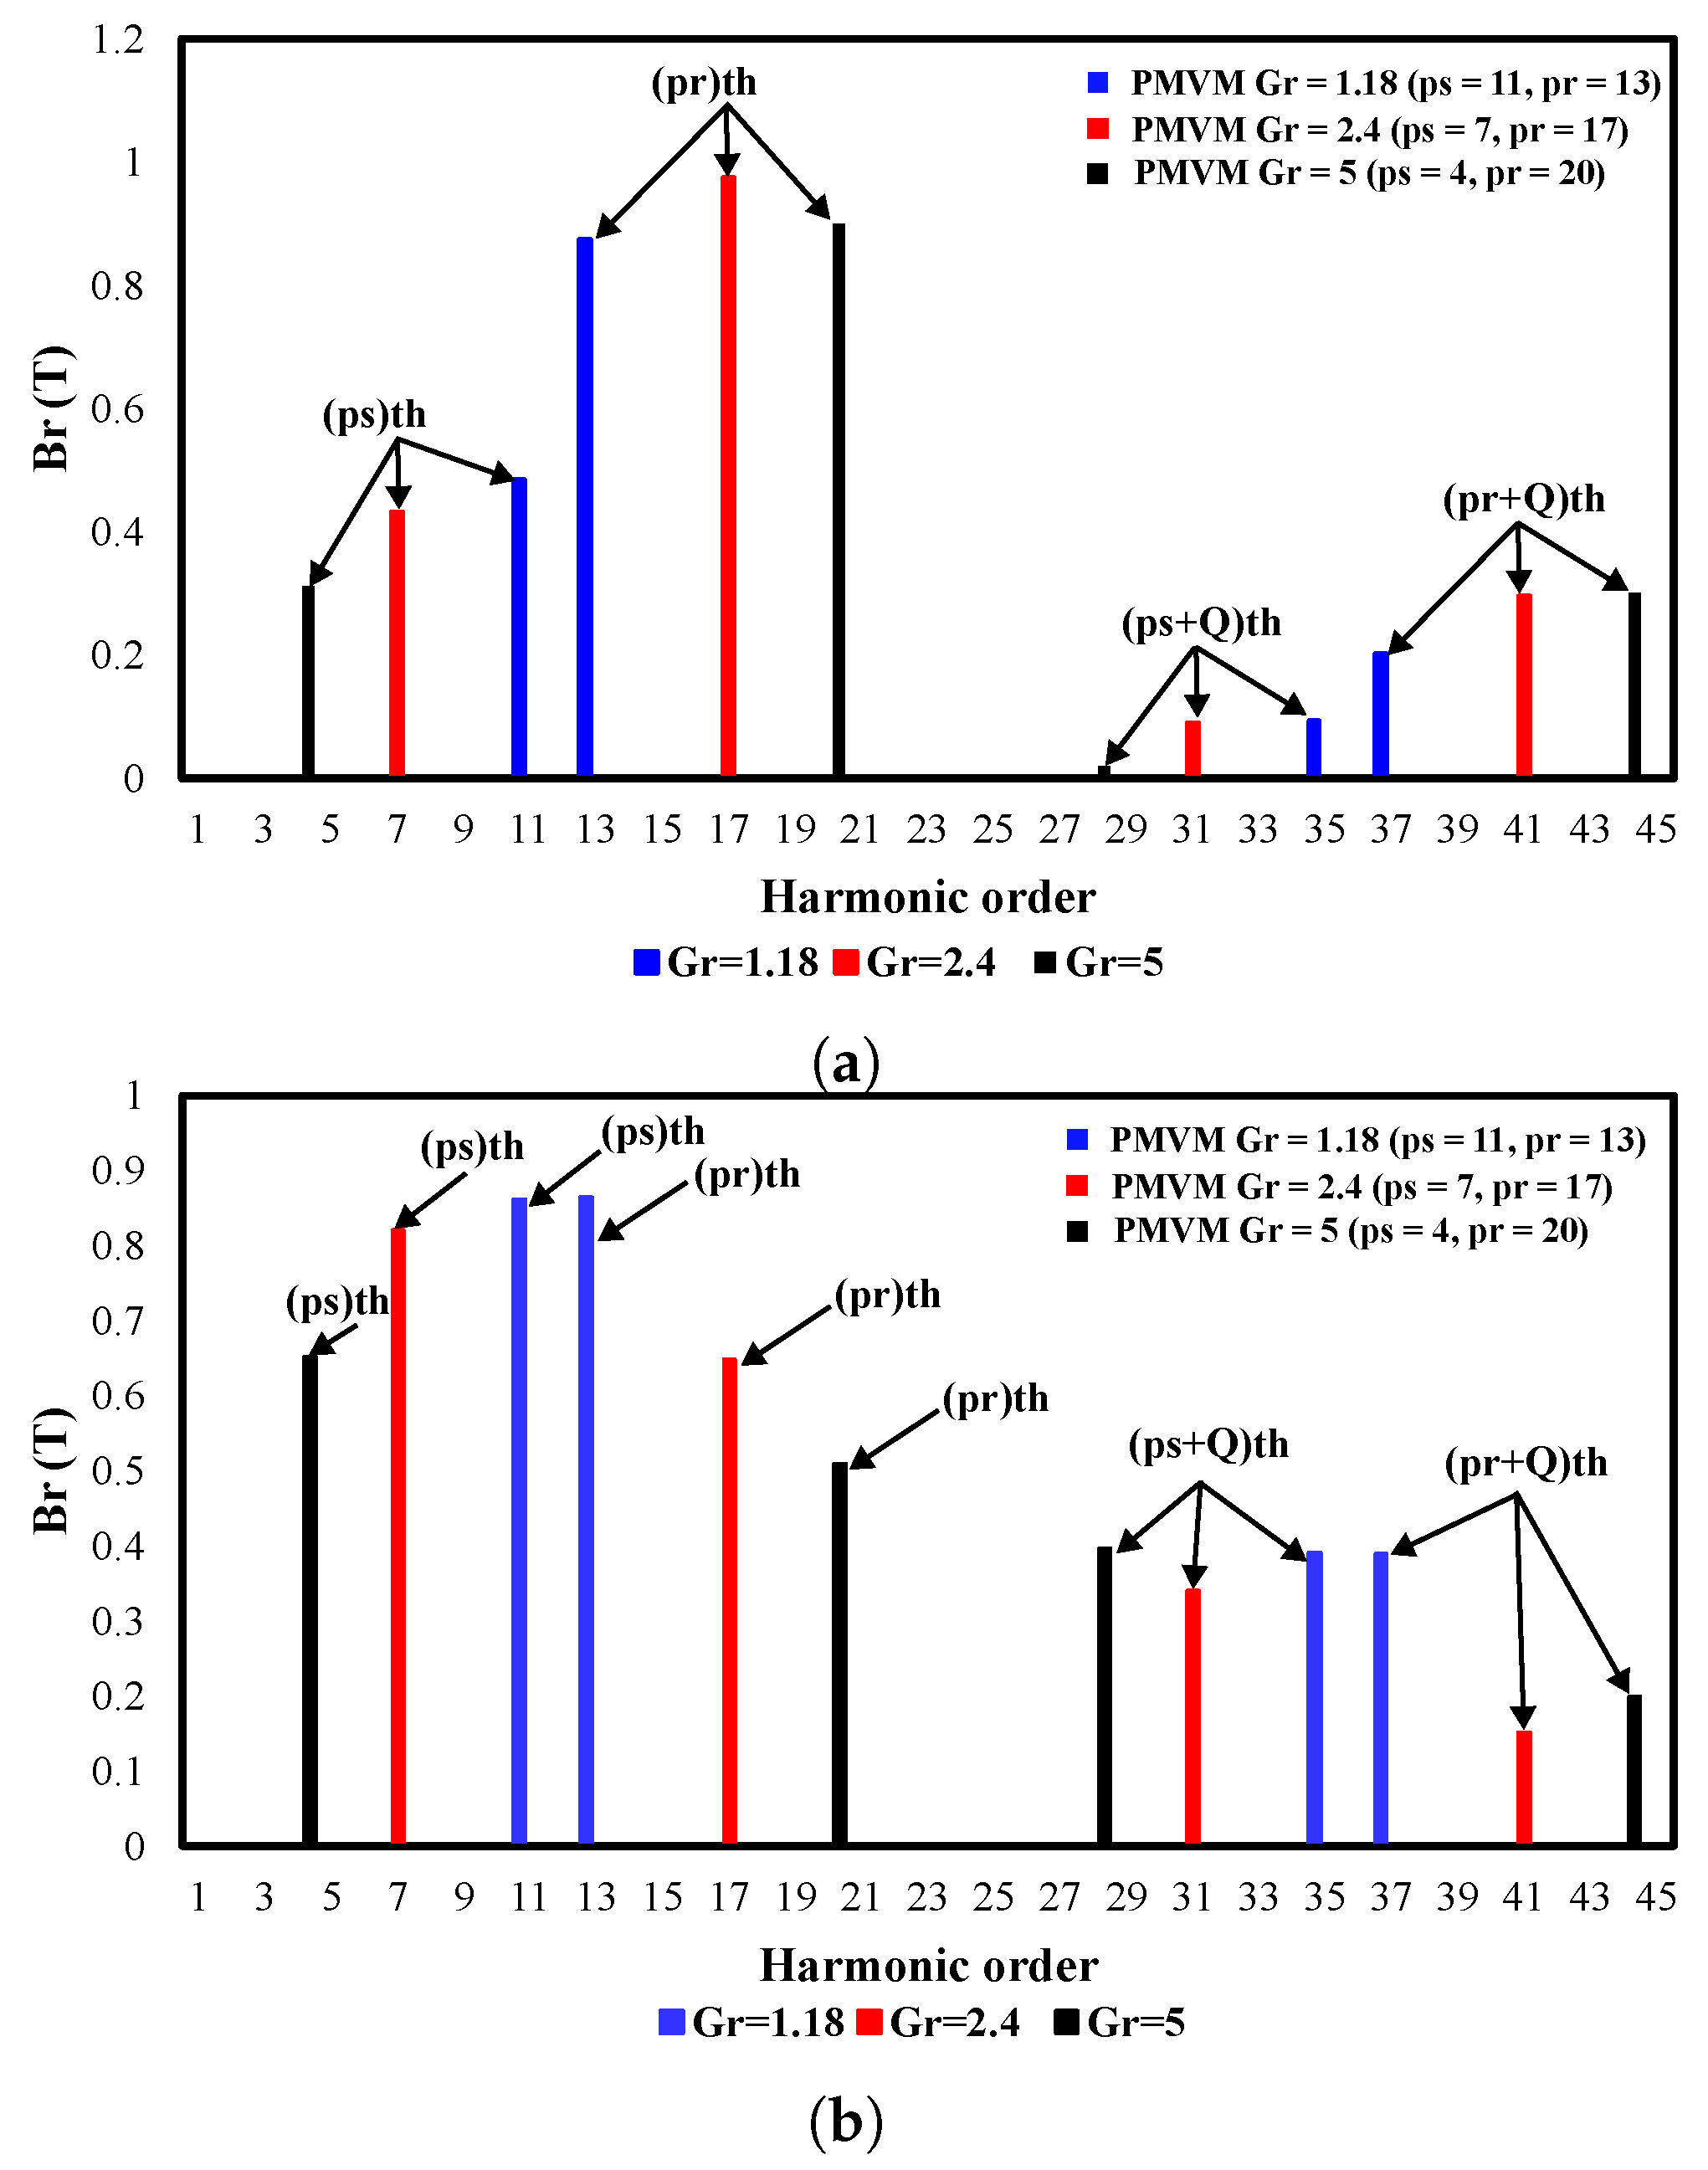
6), in the Vernier machine, the main components of
are
,
and
. By conducting an FFT analysis on the radial air-gap flux density of various PMVMs featuring distinct gear ratios (e.g.,
,
, and
), the resulting air-gap flux-density harmonics are presented in
Figure 4a. The figure clearly illustrates the active harmonics (
,
,
, and
) as outlined in Equation (
6) for their respective gear ratio and slot configurations.
2.2. Stator Harmonic Comparison
On the other hand, the stator MMF harmonic due to the stator currents (
) can be expressed as
where
and
are the total number of turns in series per phase and the winding factor of the fundamental harmonic, respectively. The harmonic distribution of radial air-gap flux density due to stator currents is depicted in
Figure 4b for PMSMs with
,
, and
, respectively. It is noted that the
and stator MMF have the same working harmonics (
,
,
and
). The working harmonics due to stator currents interact with the working harmonics due to the PM, which is called harmonic coupling, yielding an electromagnetic torque.
3. PMVM Gear Ratio Configurations
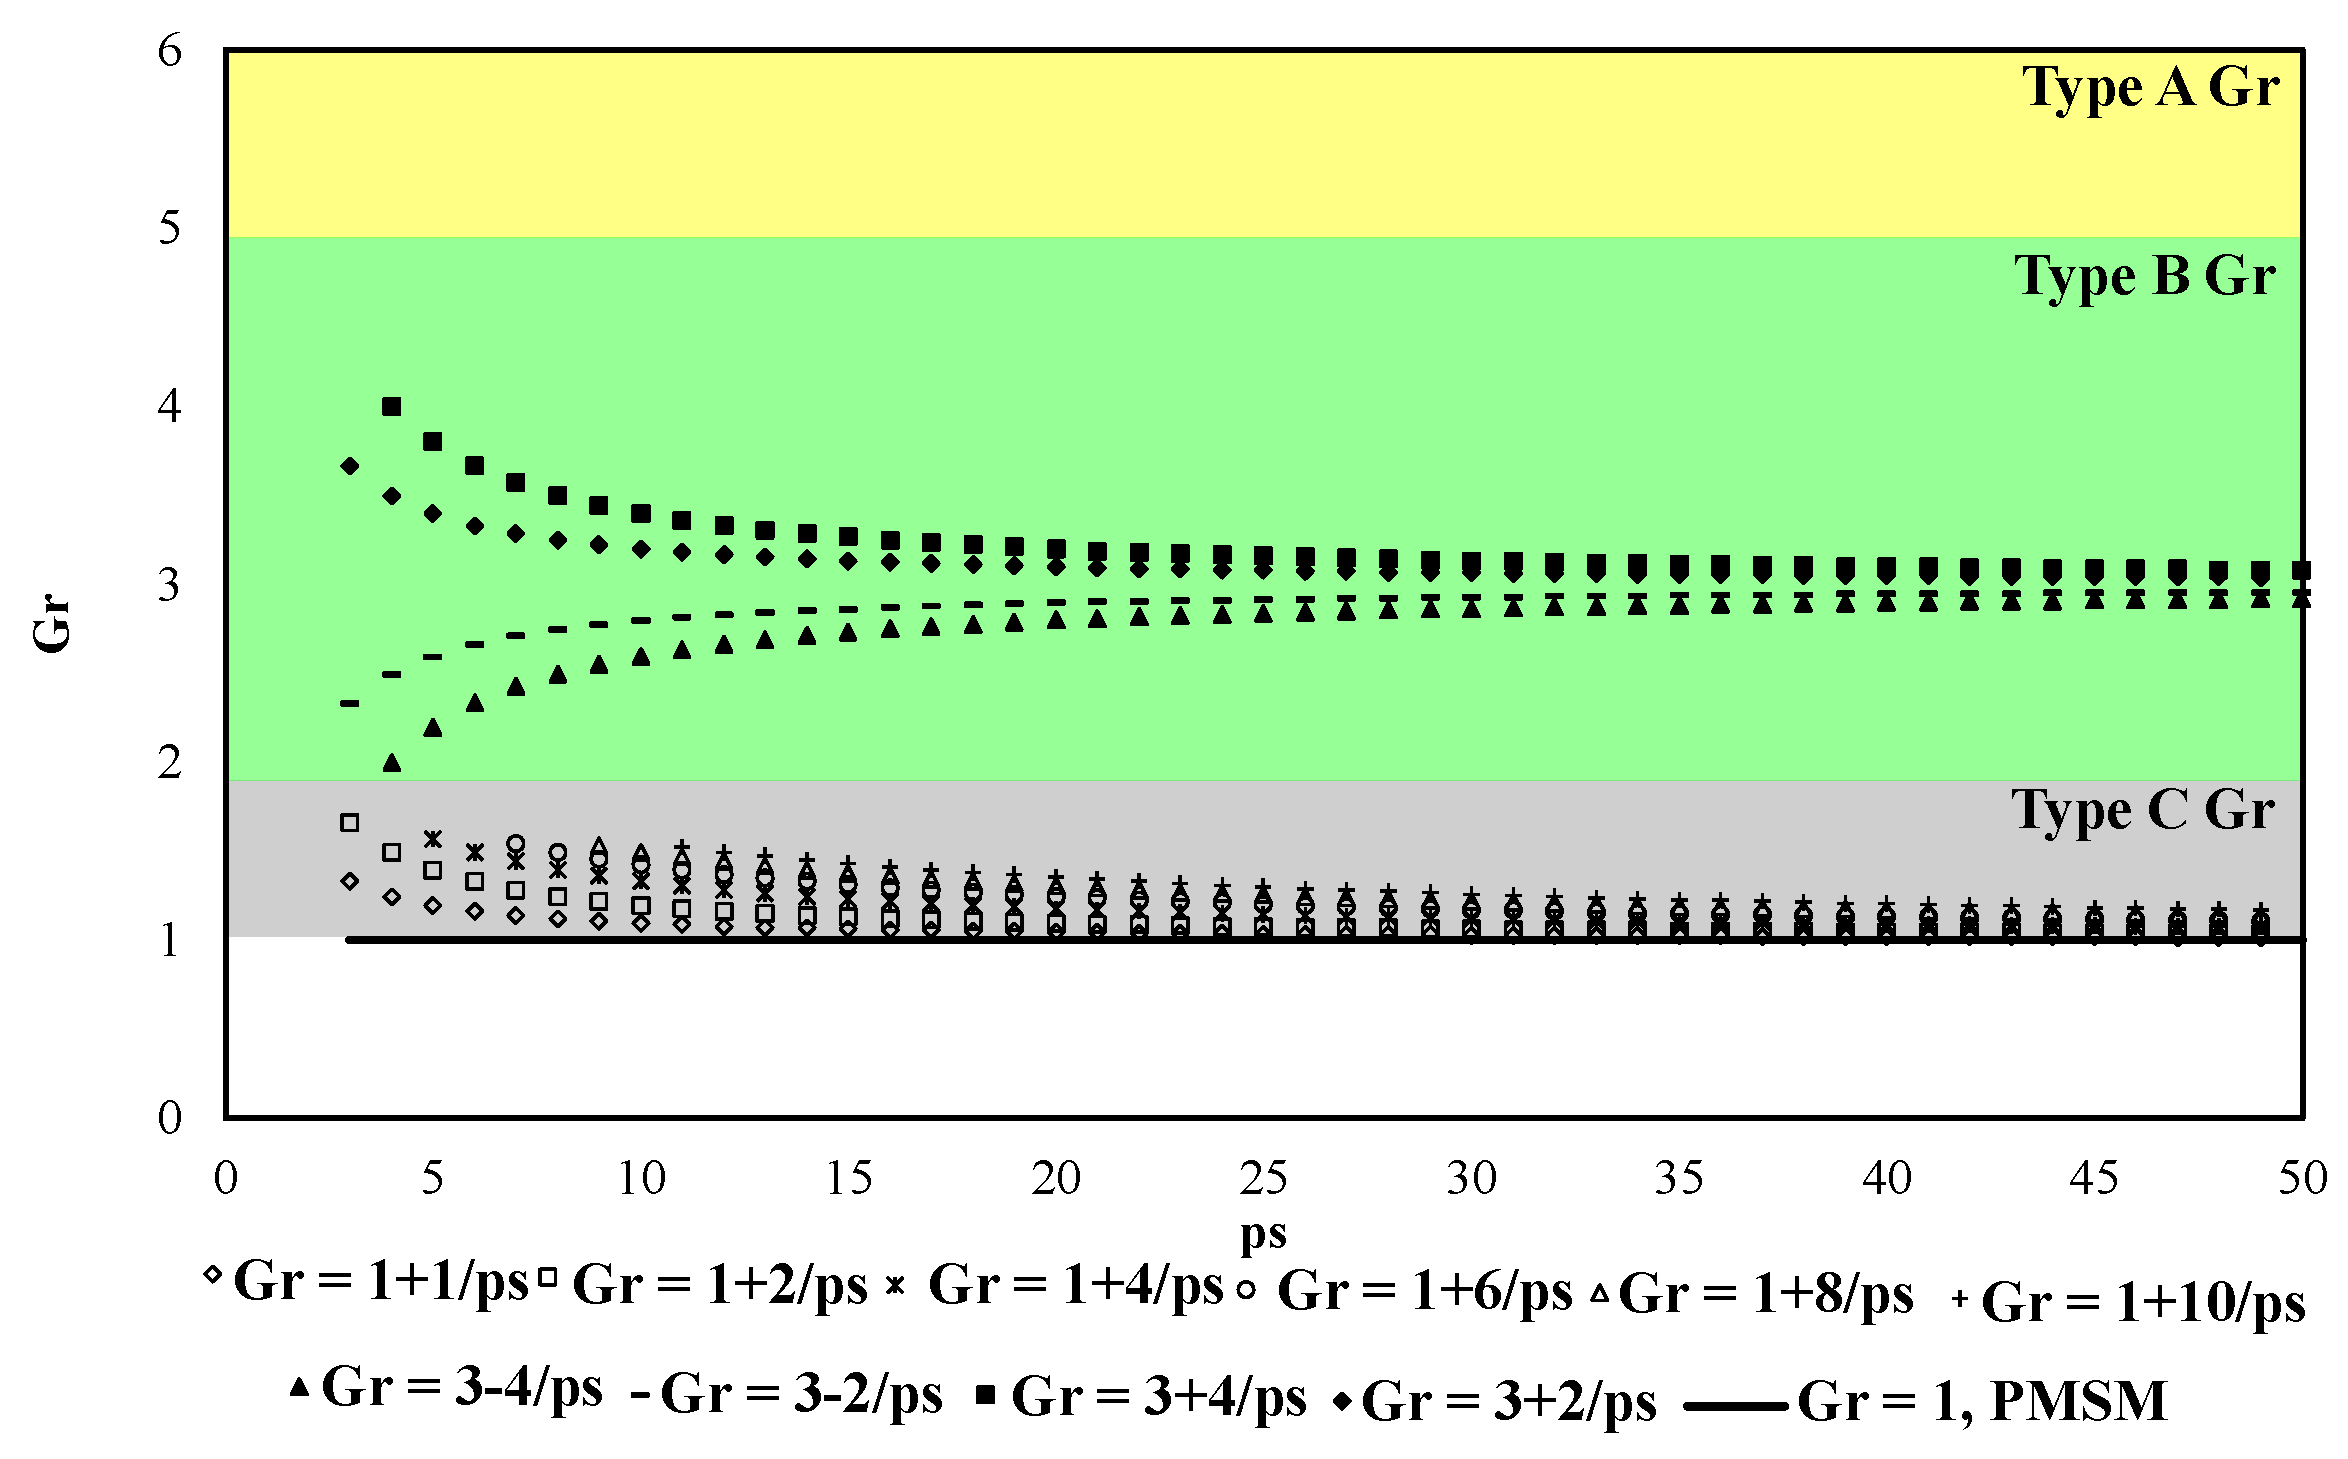
Research on PMVM structures has revealed that different slot/pole combinations that correspond to various gear ratios have a significant influence on the performance of PMVMs. An optimal gear ratio selection relates to the specific application and power requirements. For easy reference, this paper classifies PMVMs into the following three types according to their gear ratios:
Type A: Gr ≥ 5 with an overlapped winding (ow) and a coil pitch greater than two,
Type B: 2 < Gr < 5 with an overlapped winding and a coil pitch of two, and
Type C: 1 < Gr ≤ 2 with a non-overlap winding (nw) and a coil pitch of one.
For PMVMs of Types B and C, the
value is relatively close to half of the total number of slots (
), which leads to a small difference between
and
, resulting in a shorter end-winding length and also a lower
compared to Type A PMVM. This variation opens up a new range of slot per pole per phase (
q) options, as shown in
Table 1. The
of all Type B Vernier machines can be defined based on the
, which progressively converges toward 3 as it increases (refer to Equation (
9)).
Similarly, the
of all Type C Vernier machines can be defined based on the parameter
, which progressively converges toward 1 as
increases (refer to Equation (
10)).
This convergence is also depicted in
Figure 5 for both Type B and Type C PMVMs (refer to Equations (9) and (10)).
Various slot–pole combinations for three types of PMVMs with high winding factors are provided and presented in
Table 2.
4. Design Optimisation
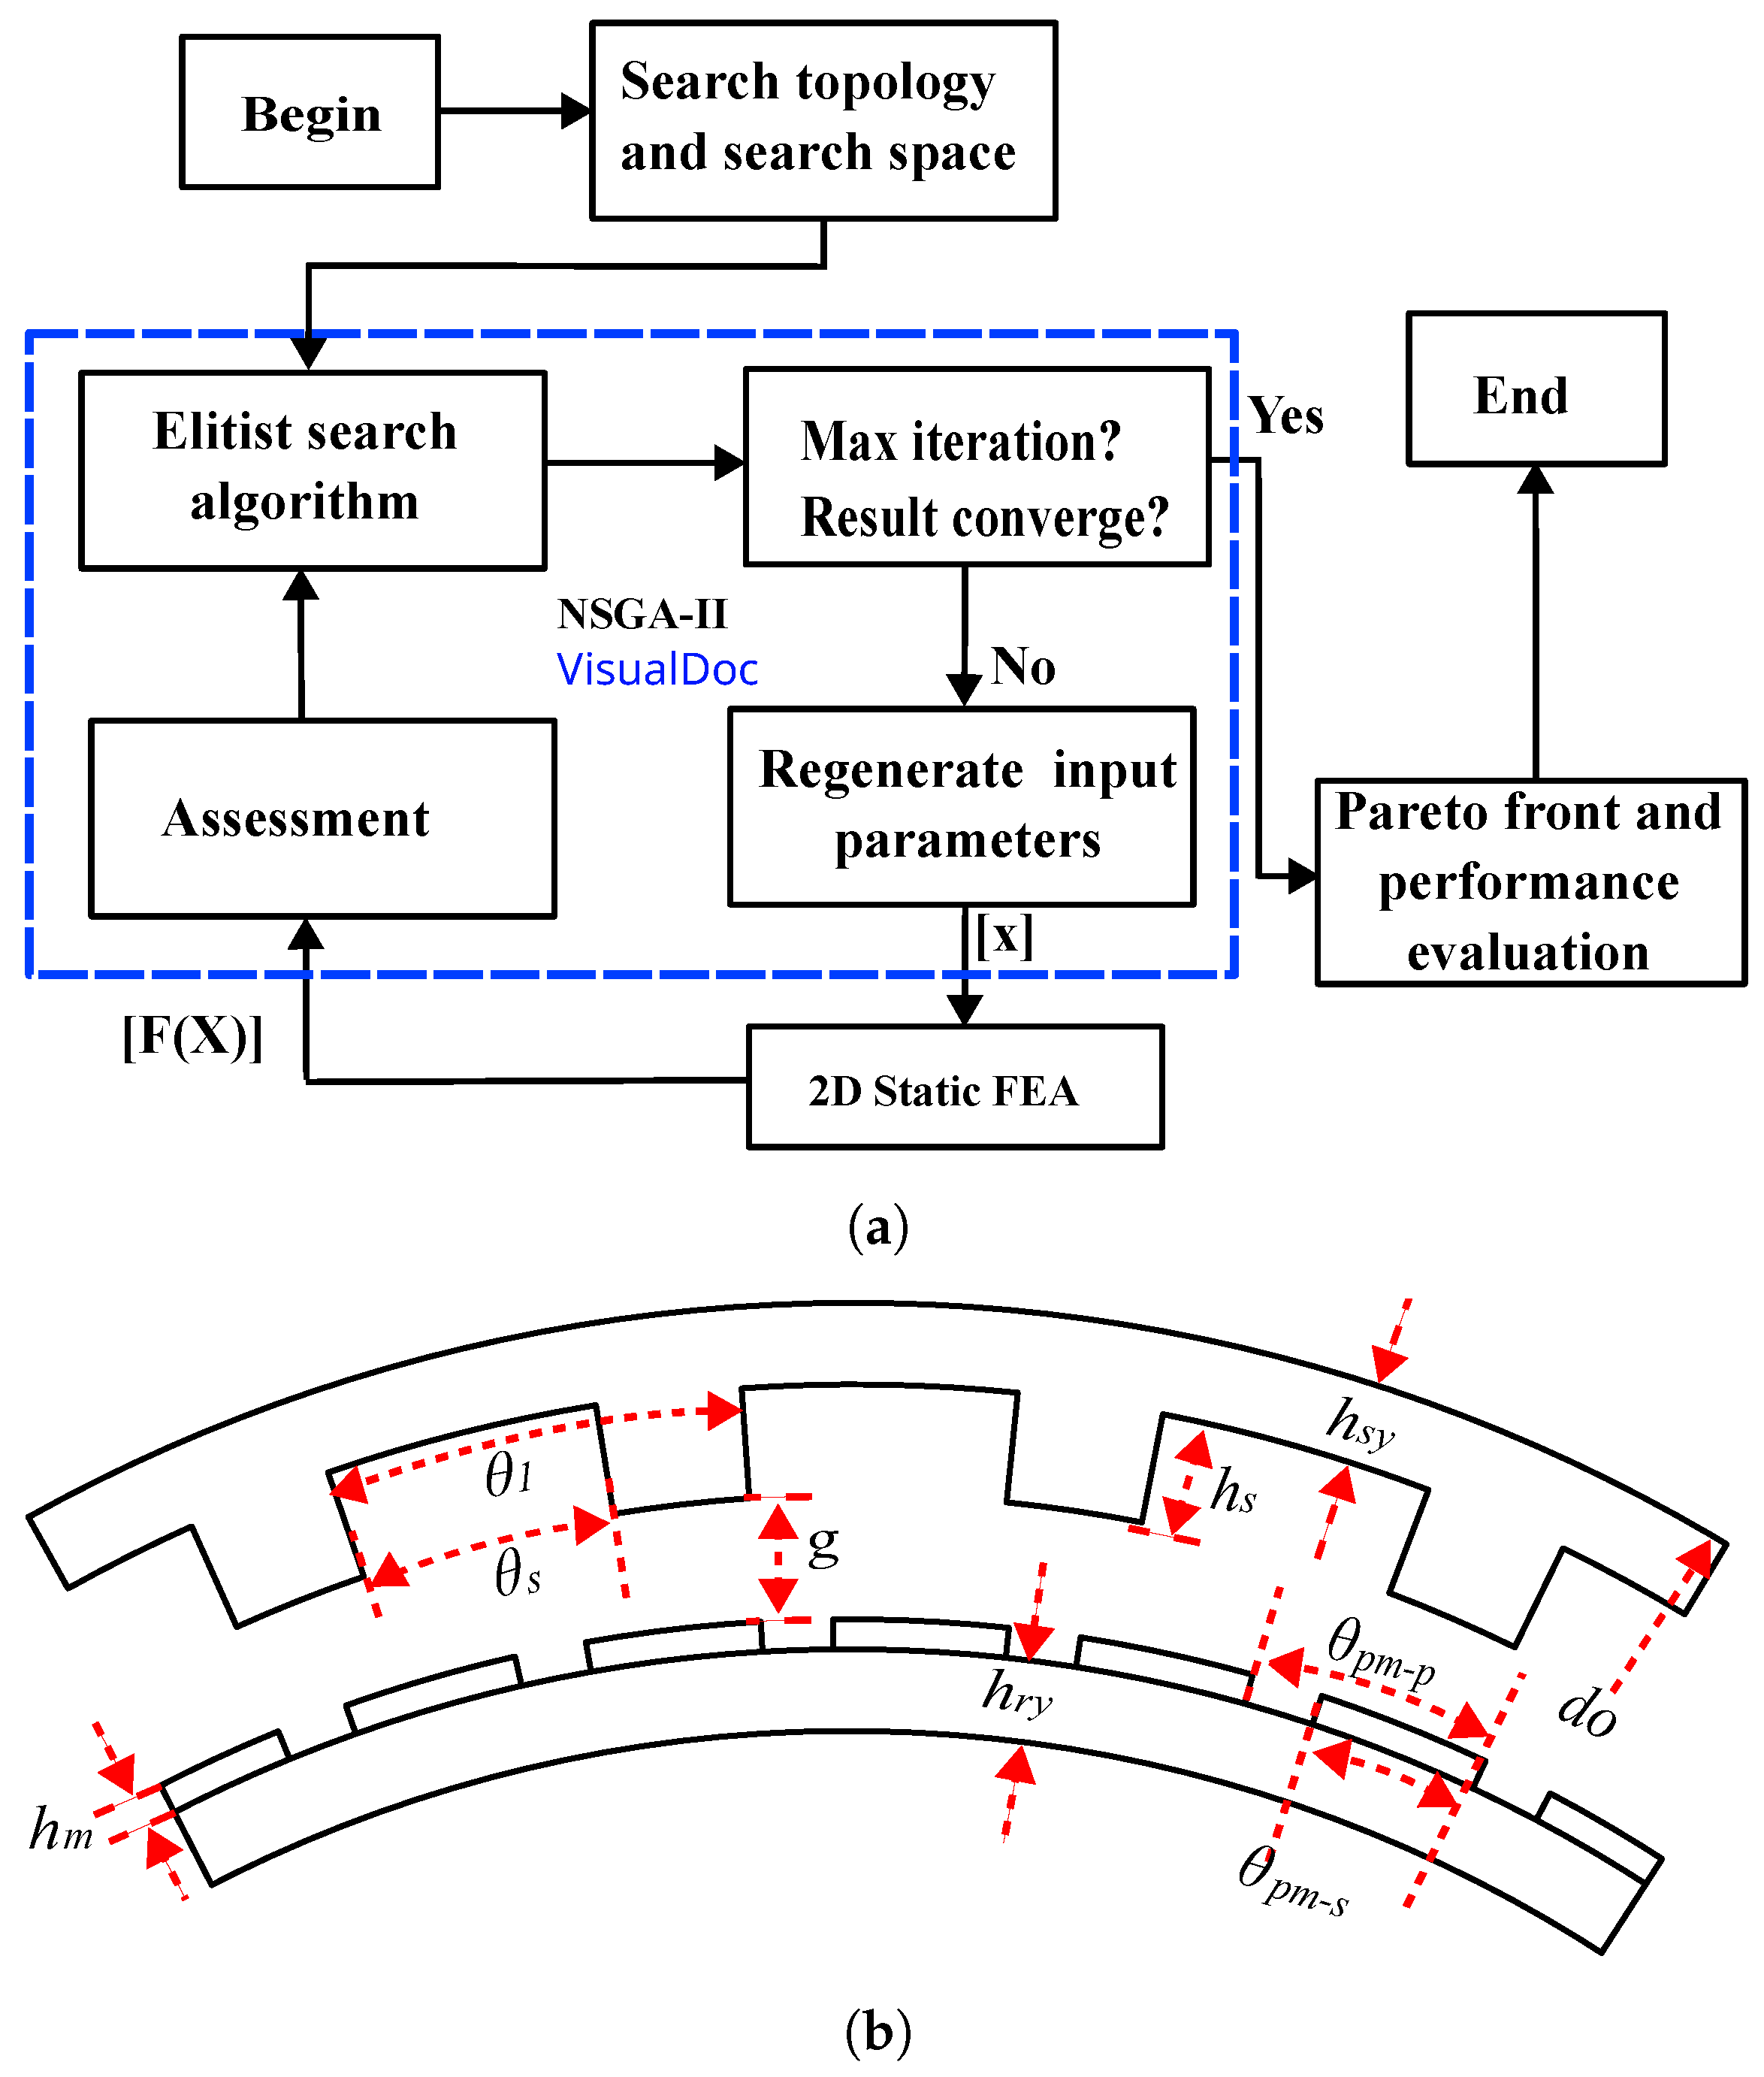
In this study, an integrated methodology that combines the NSGA-II algorithm with finite element analysis (FEA) using Ansys Maxwell and Motor-CAD was applied for design optimization. This approach ensured that the optimised motor design met both dimensional and performance requirements while maintaining a fixed outer diameter of 1.3 m. The NSGA-II algorithm was used to assess the objectives and constraints, yielding a collection of solutions forming the Pareto front. Through an analysis of the trade-offs between the objectives, the optimal design could be discerned from the converged solutions. The flowchart of the formulated design and optimisation framework is depicted in
Figure 6a.
Multi-Objective Function and Constraint
The main aim of this study was to evaluate PMVM technologies for 5 MW podded ship-propulsion applications with a speed of 300 rpm. Among the slot-pole combinations given in
Table 2, the study focuses on the 24-slot design options. This selection is informed by considerations of practical electrical frequency and their common usage, as evident from earlier comparative investigations [
38].
These selected combinations include gear ratios such as 24/28 (
, Type C), 24/26 (
, Type C), 24/34 (
, Type B), 24/36 (
, Type B), 24/40 (
, Type A), and 24/44 (
, Type A), 24/22 PMSM and 90/20 PMSM, as tabulated in
Table 3. To optimise the design, various constraints were considered, with a focus on minimising the active mass and magnet mass to reduce the overall cost of the system. The multi-objective function for this optimisation is defined as follows:
where
represents the combined mass of the stator and rotor iron laminations,
represents the total mass of copper, which includes the end-winding, and
, represents the total mass of permanent magnets.
is the input vector representing the variable parameters shown in
Figure 6b.
where
g is air gap and
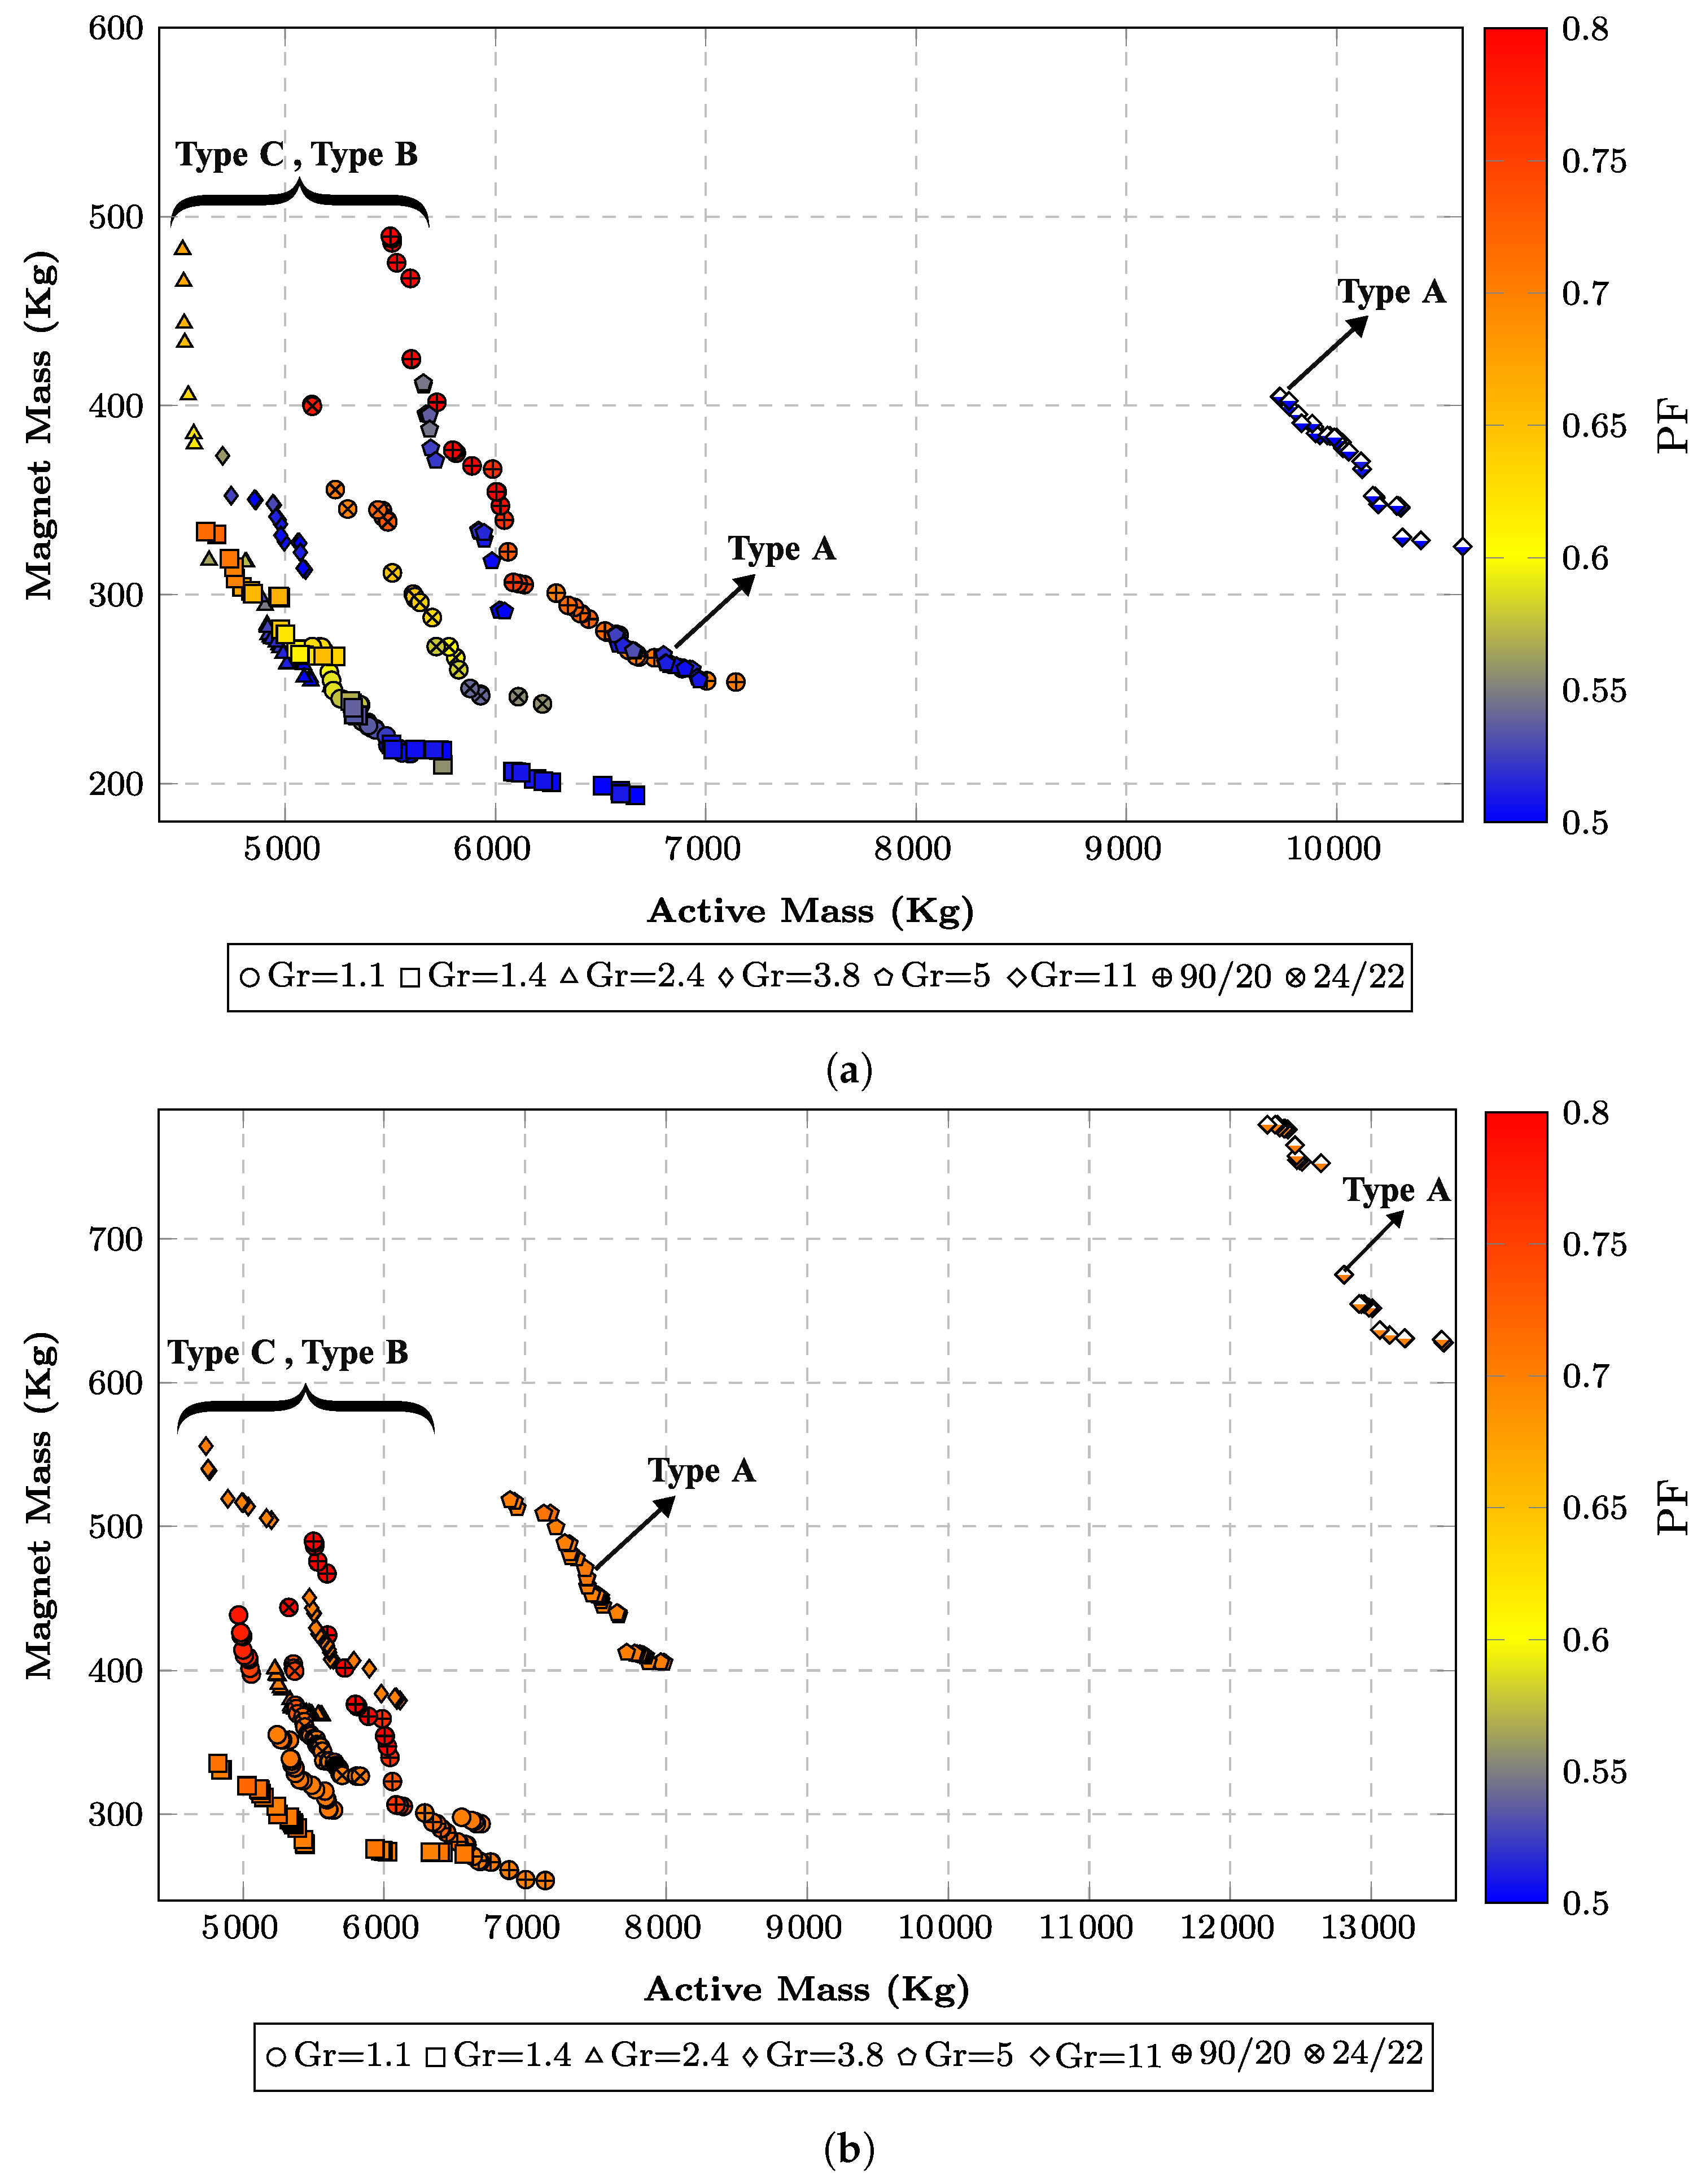
5. Pareto Front Results
The Pareto front results are provided in
Figure 7, depicting two distinct ranges for the lower boundary of PF (0.5 and 0.7) for the two PMSMs with slot/pole combinations of 24/22 and 90/20, as well as three different types of gear ratios for PMSMs.
These results offer valuable insights into the comparison between PMVMs and PMSMs, specifically concerning active mass and magnet mass within the high power range of this application. From the Pareto front results at PF with the lower boundary of 0.5, it is evident that Types B and C exhibit lower weights compared to Type A and the PMSM. Notably, Type A, particularly with a of 5, demonstrates competitiveness with the PMSM in terms of active mass. The Pareto front plot provides a clear visualisation of the inherently high PF of the PMSM, even when constrained by a lower PF boundary of 0.5.
In stark contrast, the PMVMs do not inherently possess a comparably high PF. However, it is worth noting that Type B and Type C PMVMs can achieve relatively higher PF values compared to Type A, while the latter struggles to attain a PF higher than 0.5. This observation underscores the inverse correlation between and PF, suggesting that higher gear ratios tend to result in lower PF values.
When considering the Pareto front with the lower boundary of PF as 0.7, a distinct pattern emerges: the PF values of the PMVMs tend to approach the lower boundary of PF optimisation (), a trend not observed in the PMSM. Interestingly, Type B and Type C PMVMs exhibit modest changes in their Pareto fronts, resulting in slightly higher mass values.
However, in contrast, Type A experiences a more pronounced shift in its Pareto front, especially as the gear ratio increases. This observation suggests that the weight of the Type A gear ratio undergoes a remarkable change when altering the PF from 0.5 to 0.7. Consequently, it becomes evident that the Type A gear ratio is less suited for achieving a high PF at the MW (megawatt) level and may not be the most economically favourable choice for such applications.
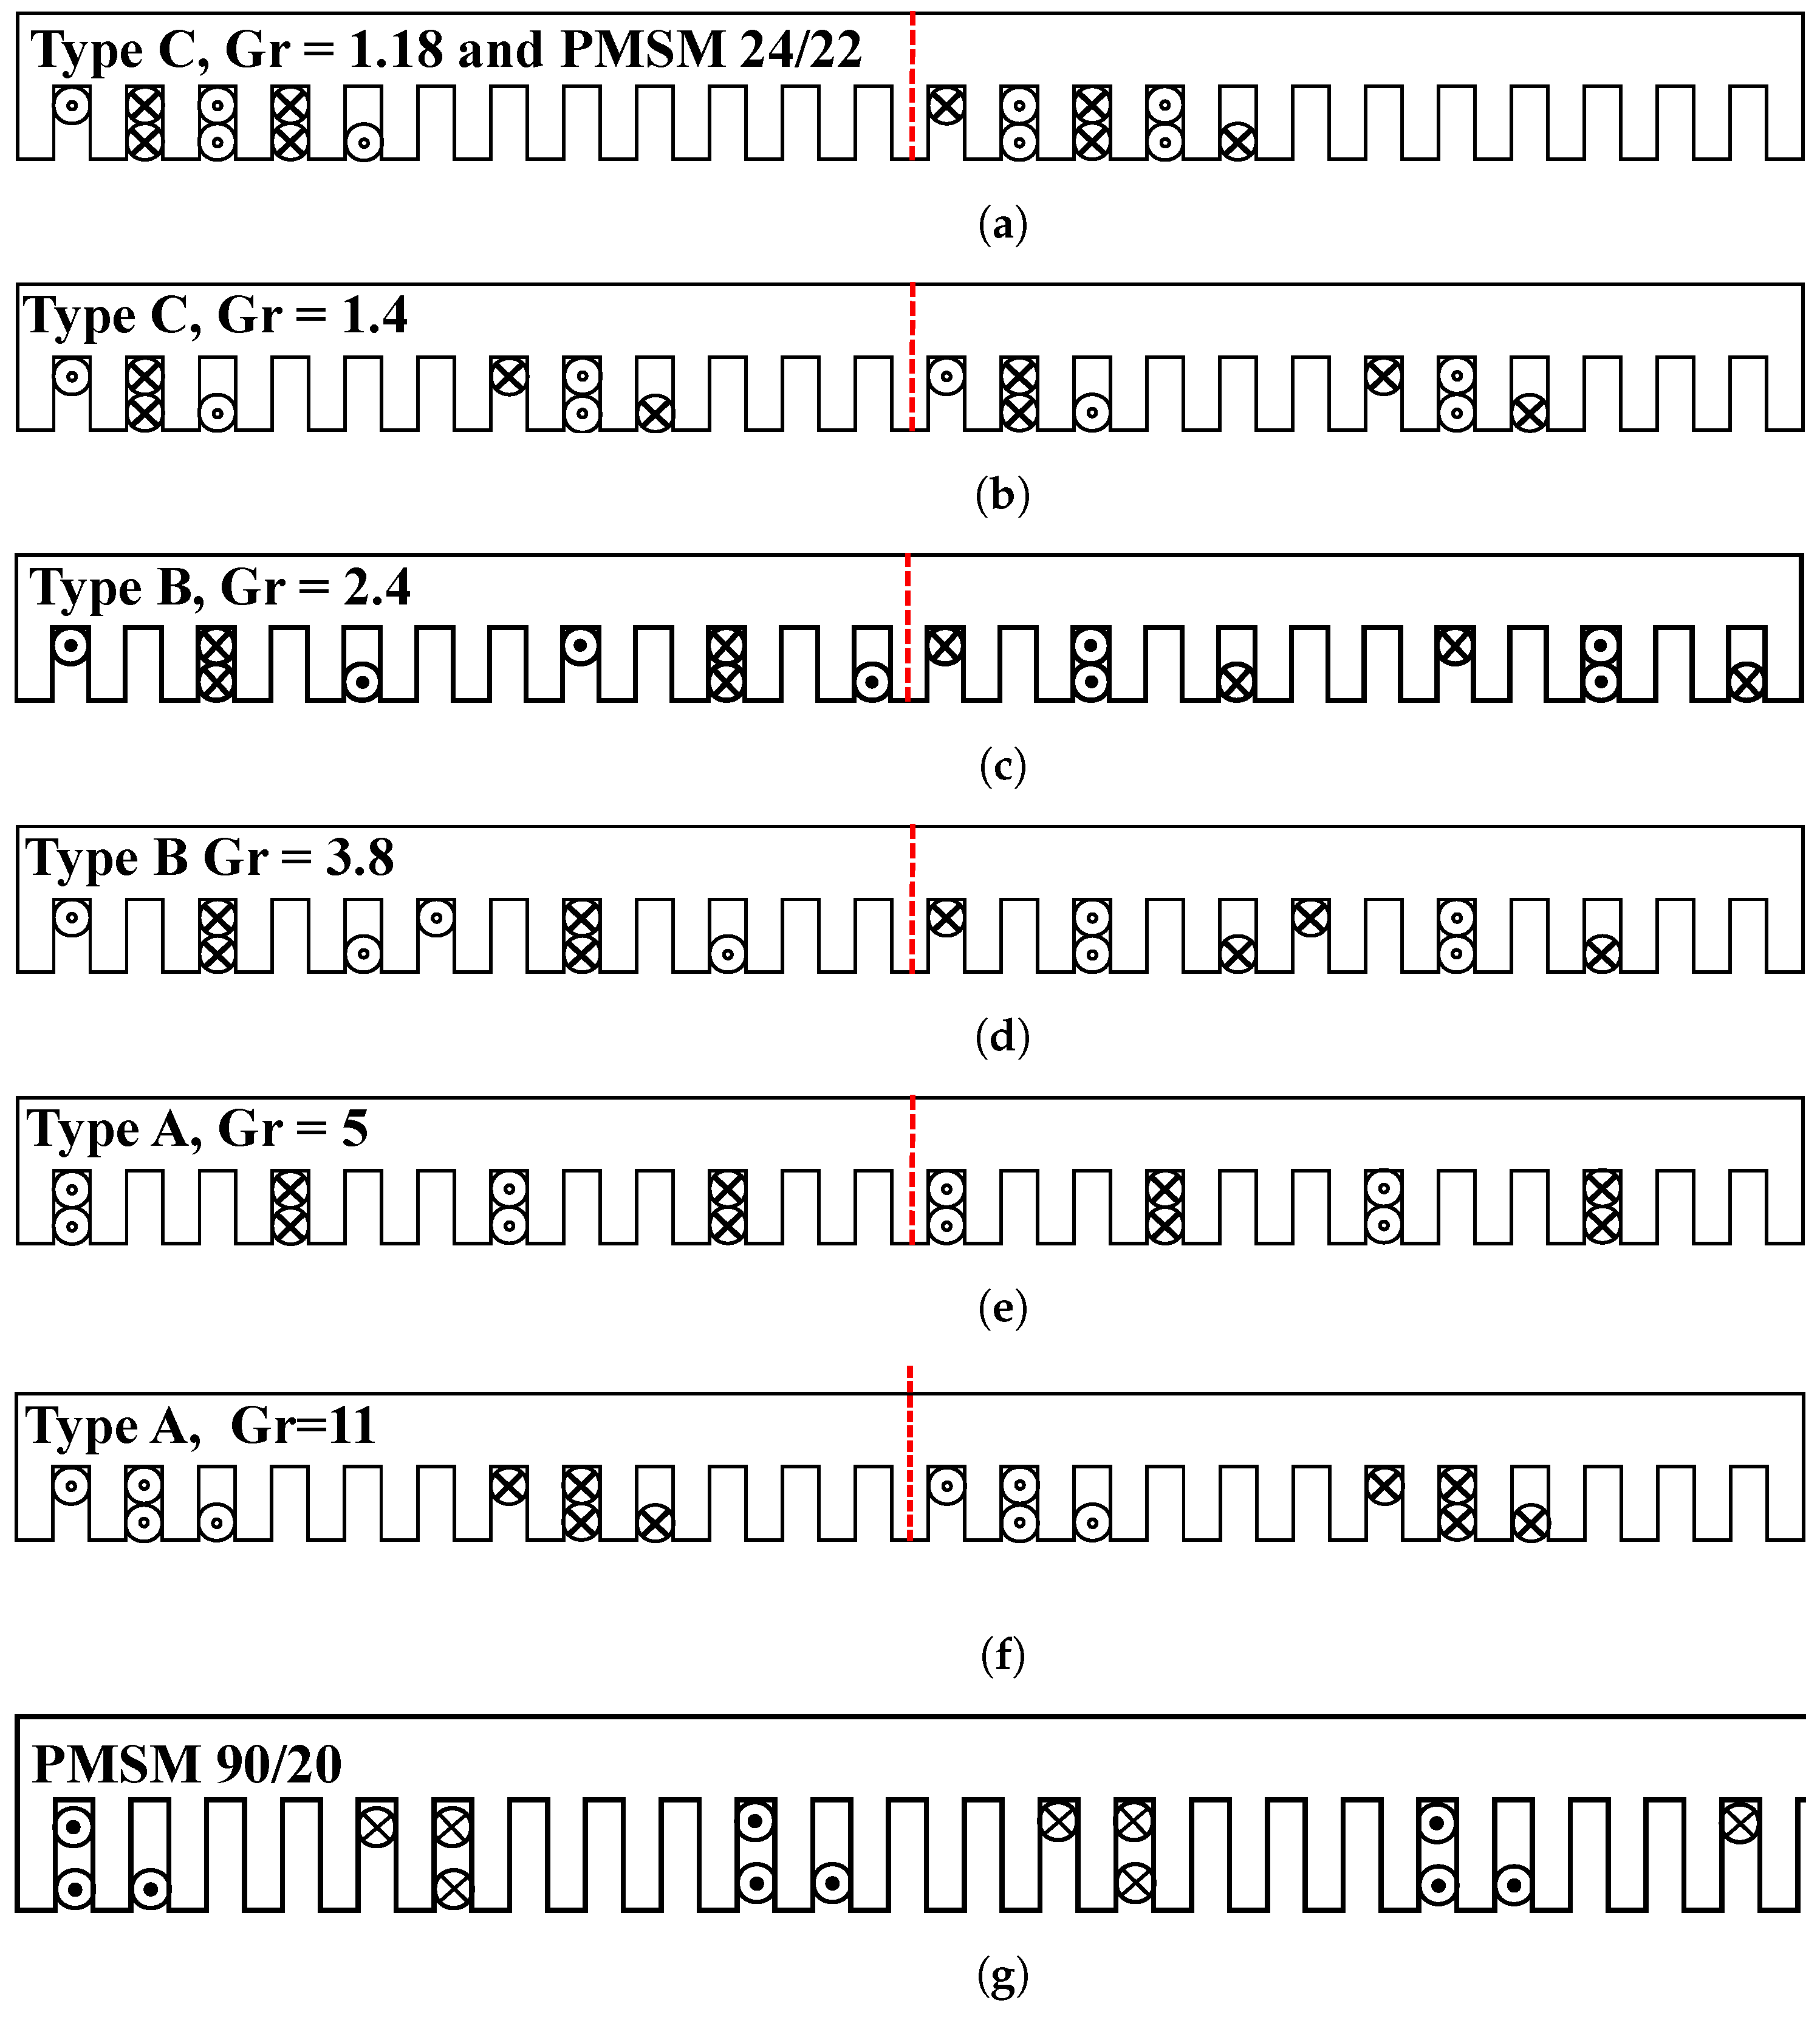
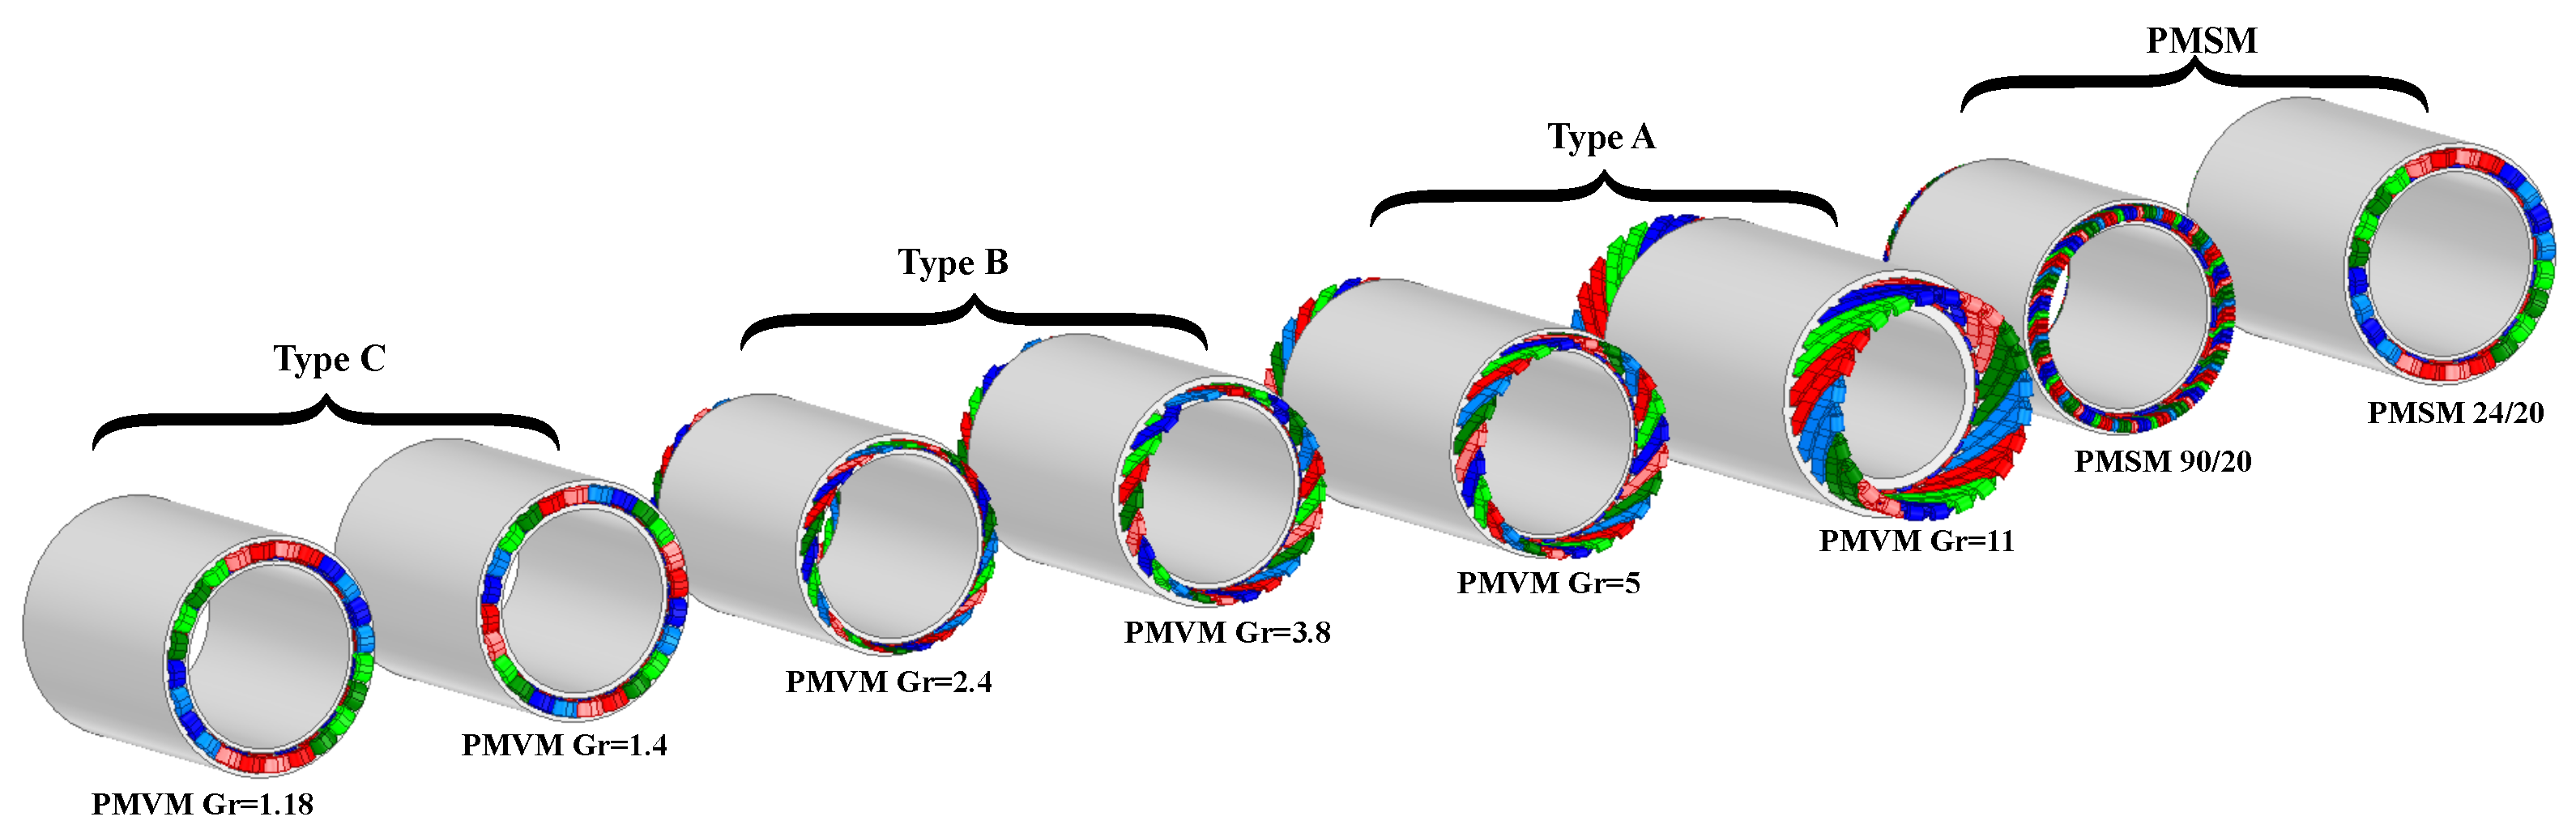
It was observed that the PMVM performed poorly in terms of PF, making it an unfair comparison to assess performance at different PF levels. However, it is important to note that, except for a few instances, most of the previous comparisons in the literature between PMSM and PMVM have not considered this important factor. For this paper, the comparison was conducted in terms of electromagnetic performance and the cost of the system. To make sure the cost of the inverter was taken into account in this comparison, all optimal models were selected from the second Pareto front at the same level of PF = 0.7. The winding arrangement and 3D structure size of the optimal models are illustrated in
Figure 8 and
Figure 9, respectively.
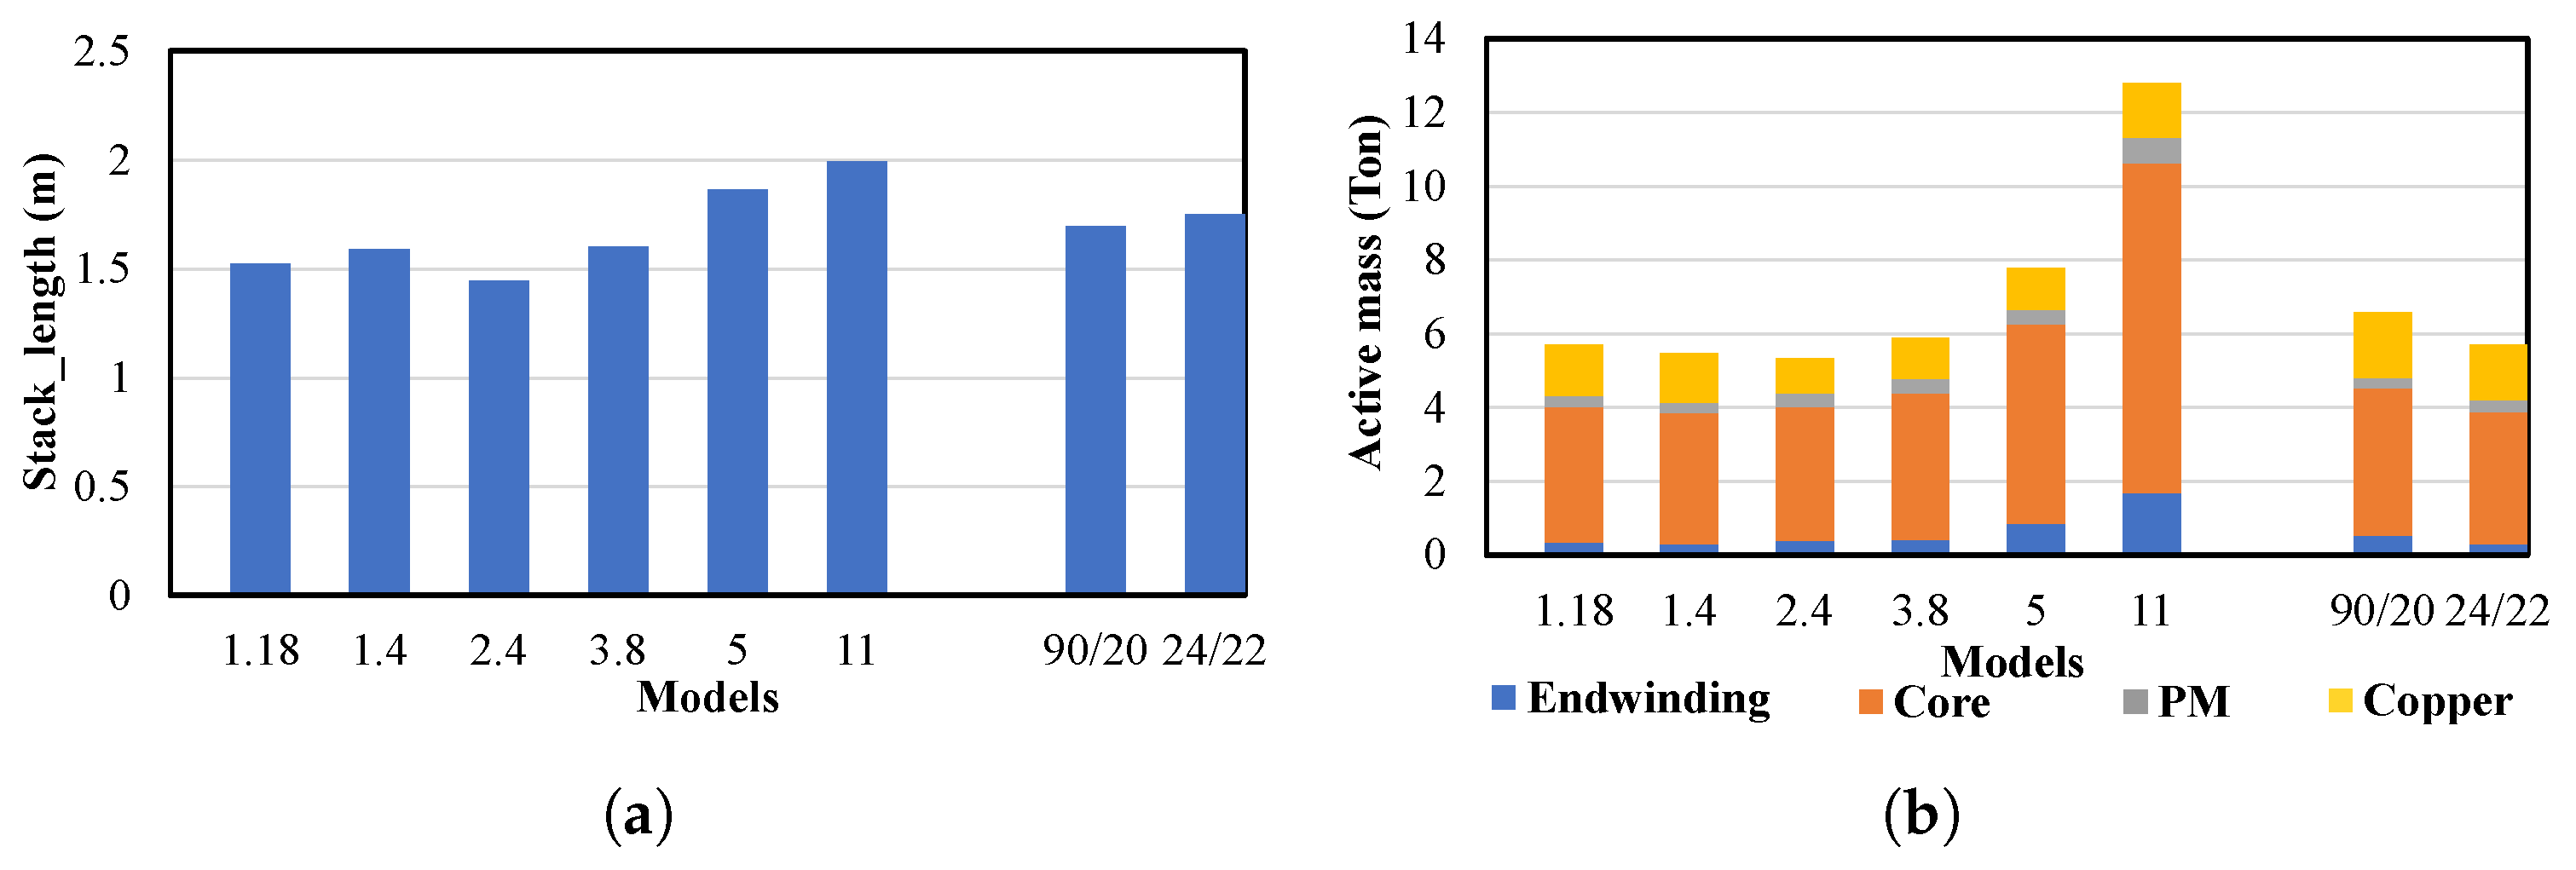
Figure 10 presents a comparative analysis of the mass components and stack lengths. Elevation in the
corresponds to proportional increments in PM mass, end-winding mass, and active mass. Furthermore, it is discernible that Type B and Type C configurations exhibit comparatively reduced stack lengths. Taking into account the length of the end-winding for different coil pitches and winding types is crucial, as it has a significant effect on the performance and optimisation results, especially when the Pareto front is focused on minimising active mass and includes the end-winding. It is evident that increasing the difference between
and
(increasing the
) leads to an increase in both the end-winding length and mass.
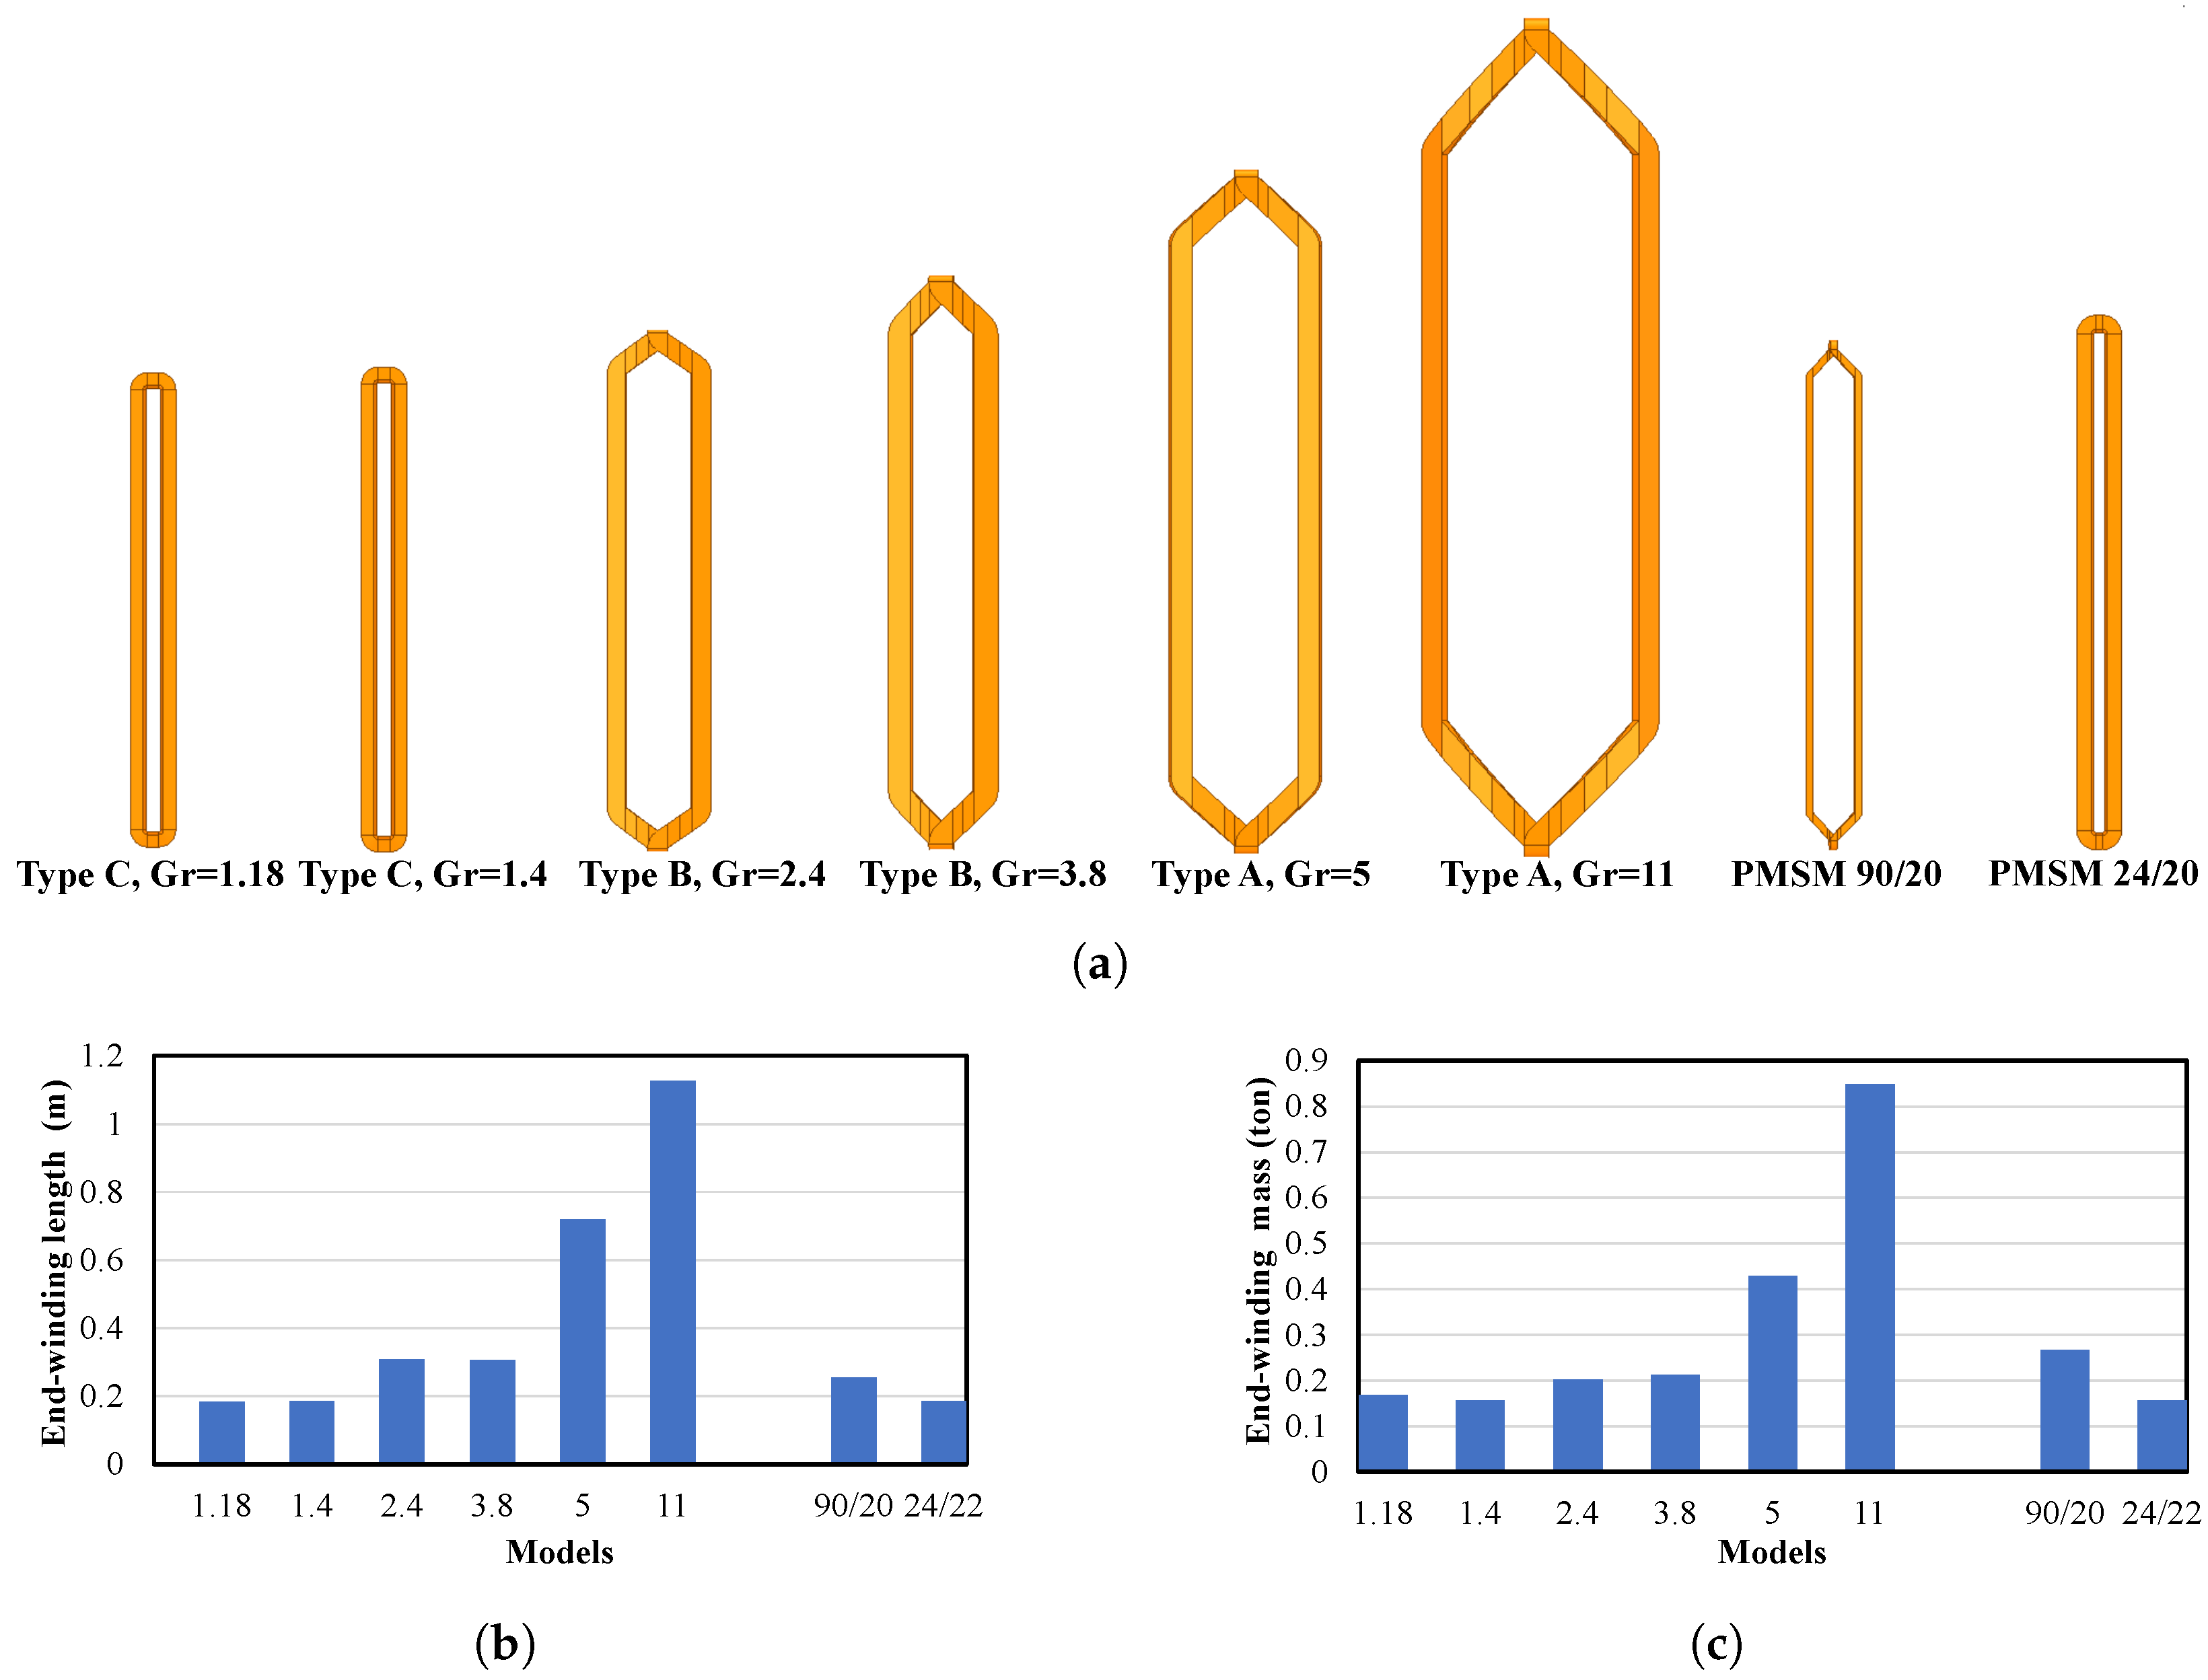
Figure 11 illustrates the effect of increasing the gear ratio on the PMVM and compares it with a conventional PMSM in terms of the physical shape and end-winding length of the 3D winding. As shown, a higher gear ratio results in longer and heavier end-windings.
6. Effect of Gear Ratio on the Performance
6.1. Flux Density Comparison
The flux line and flux density distribution of all models at full load are depicted in
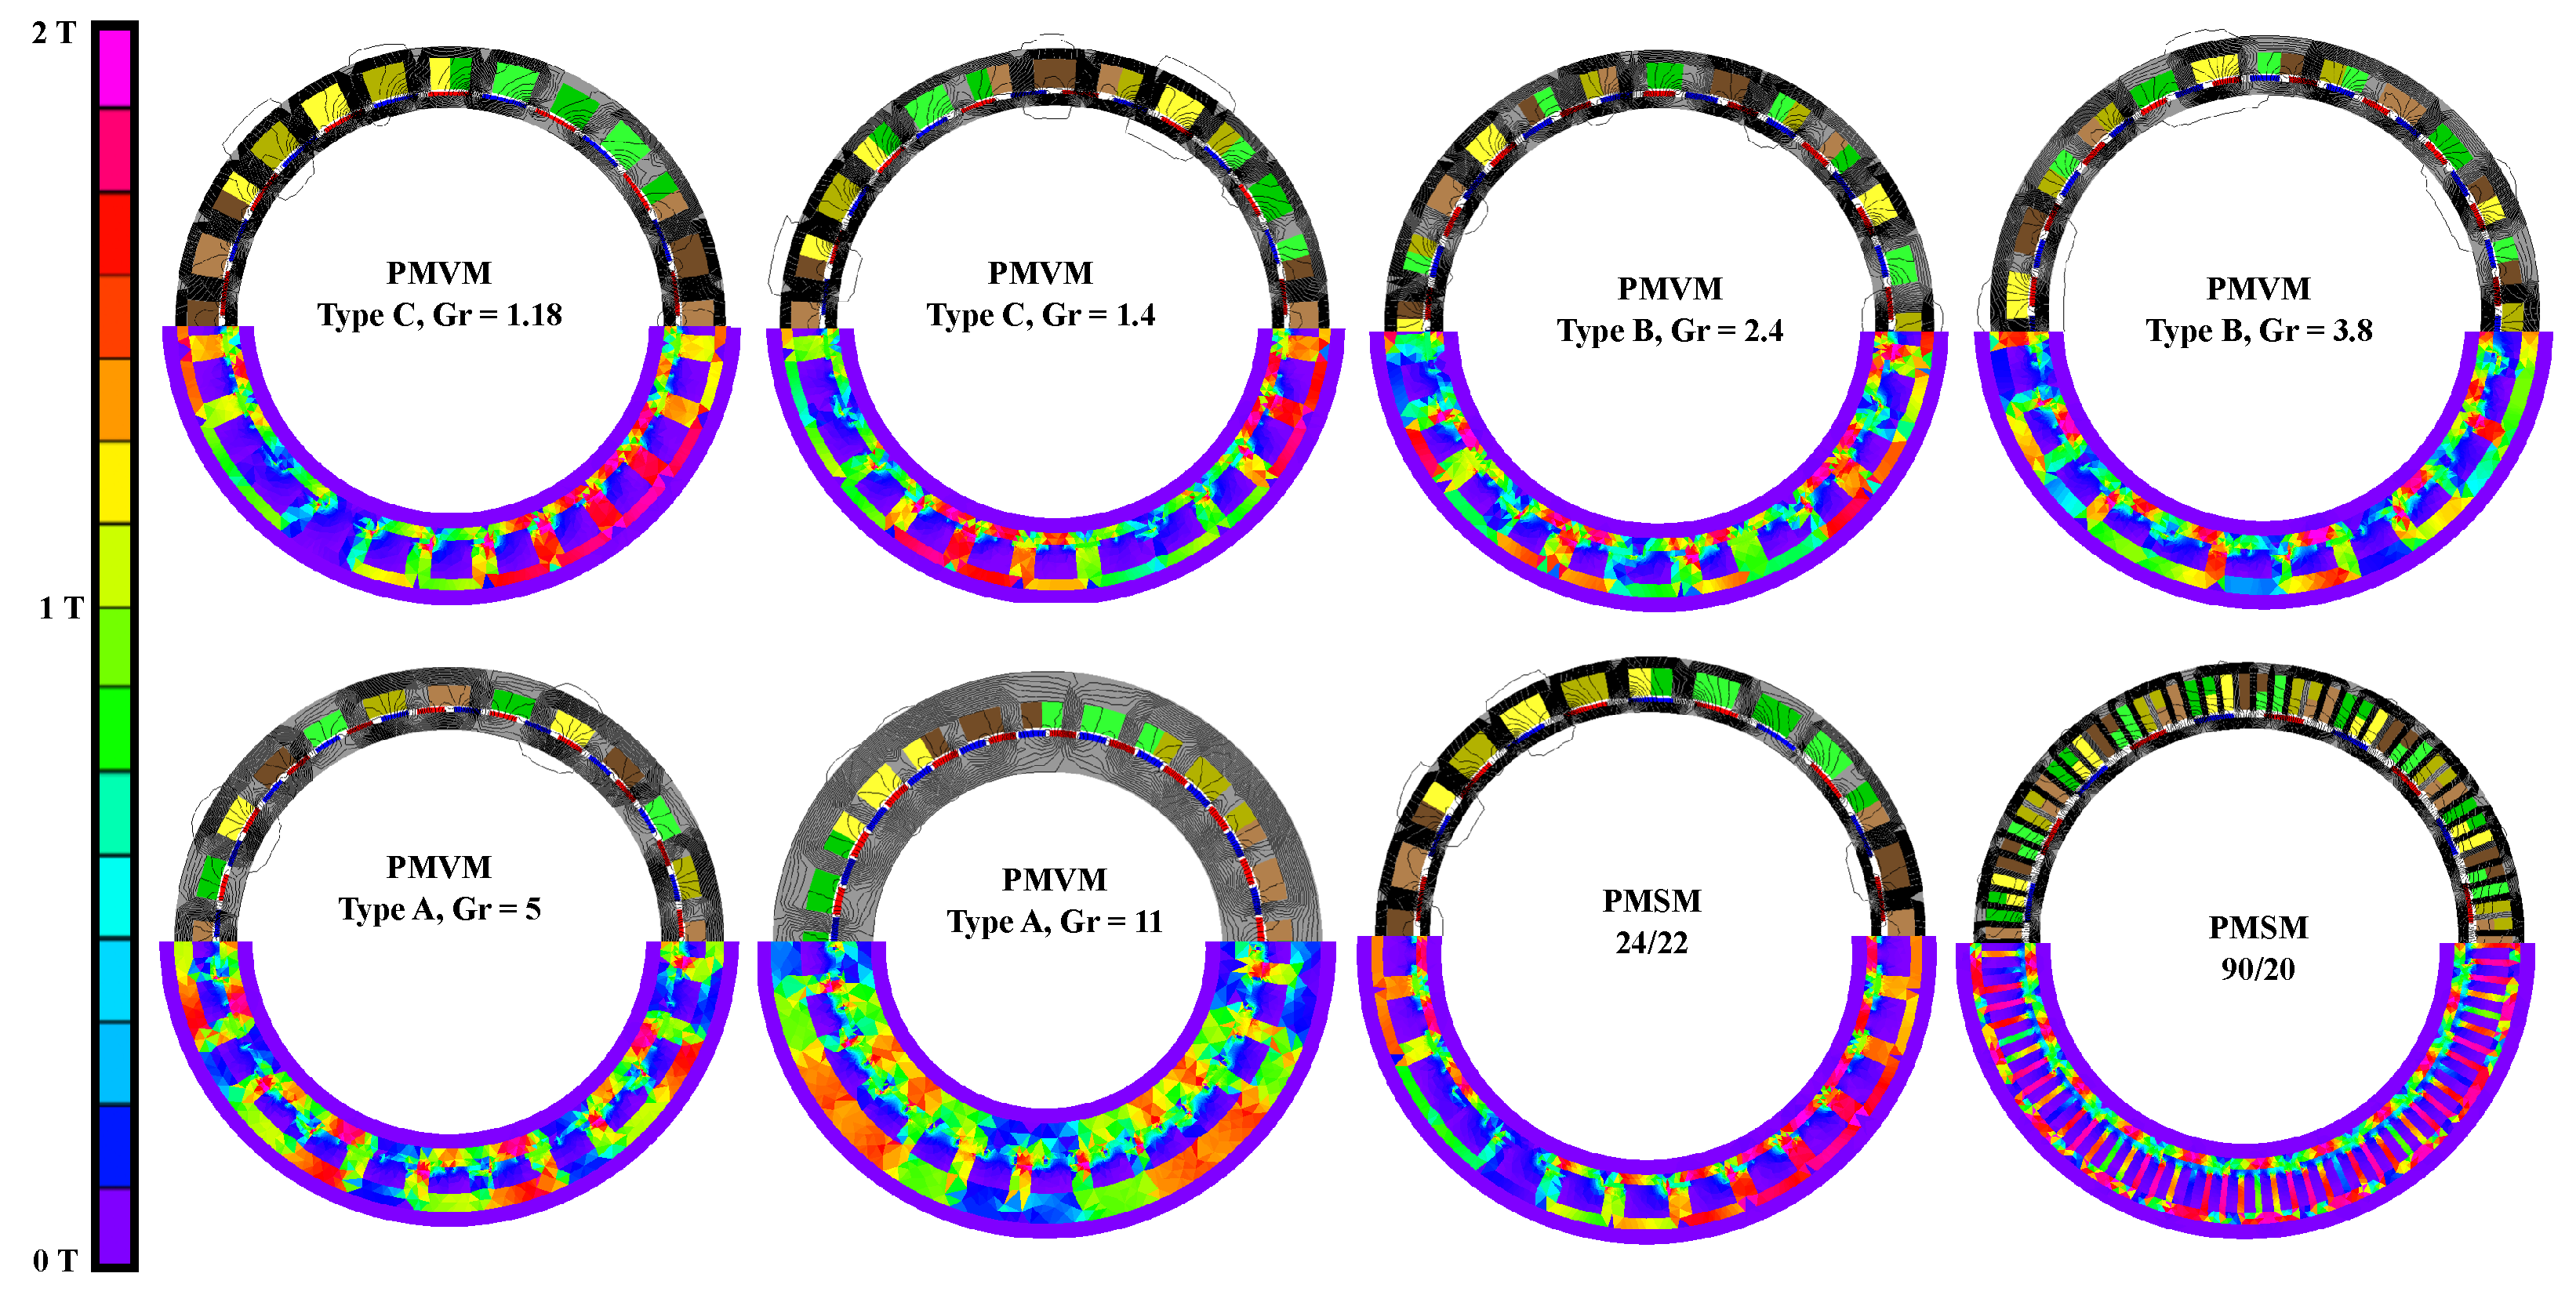
Figure 12. As shown, the structures exhibit no signs of deep saturation, and increasing the gear ratio reduces the saturation.
6.2. Loss and Cooling Comparison
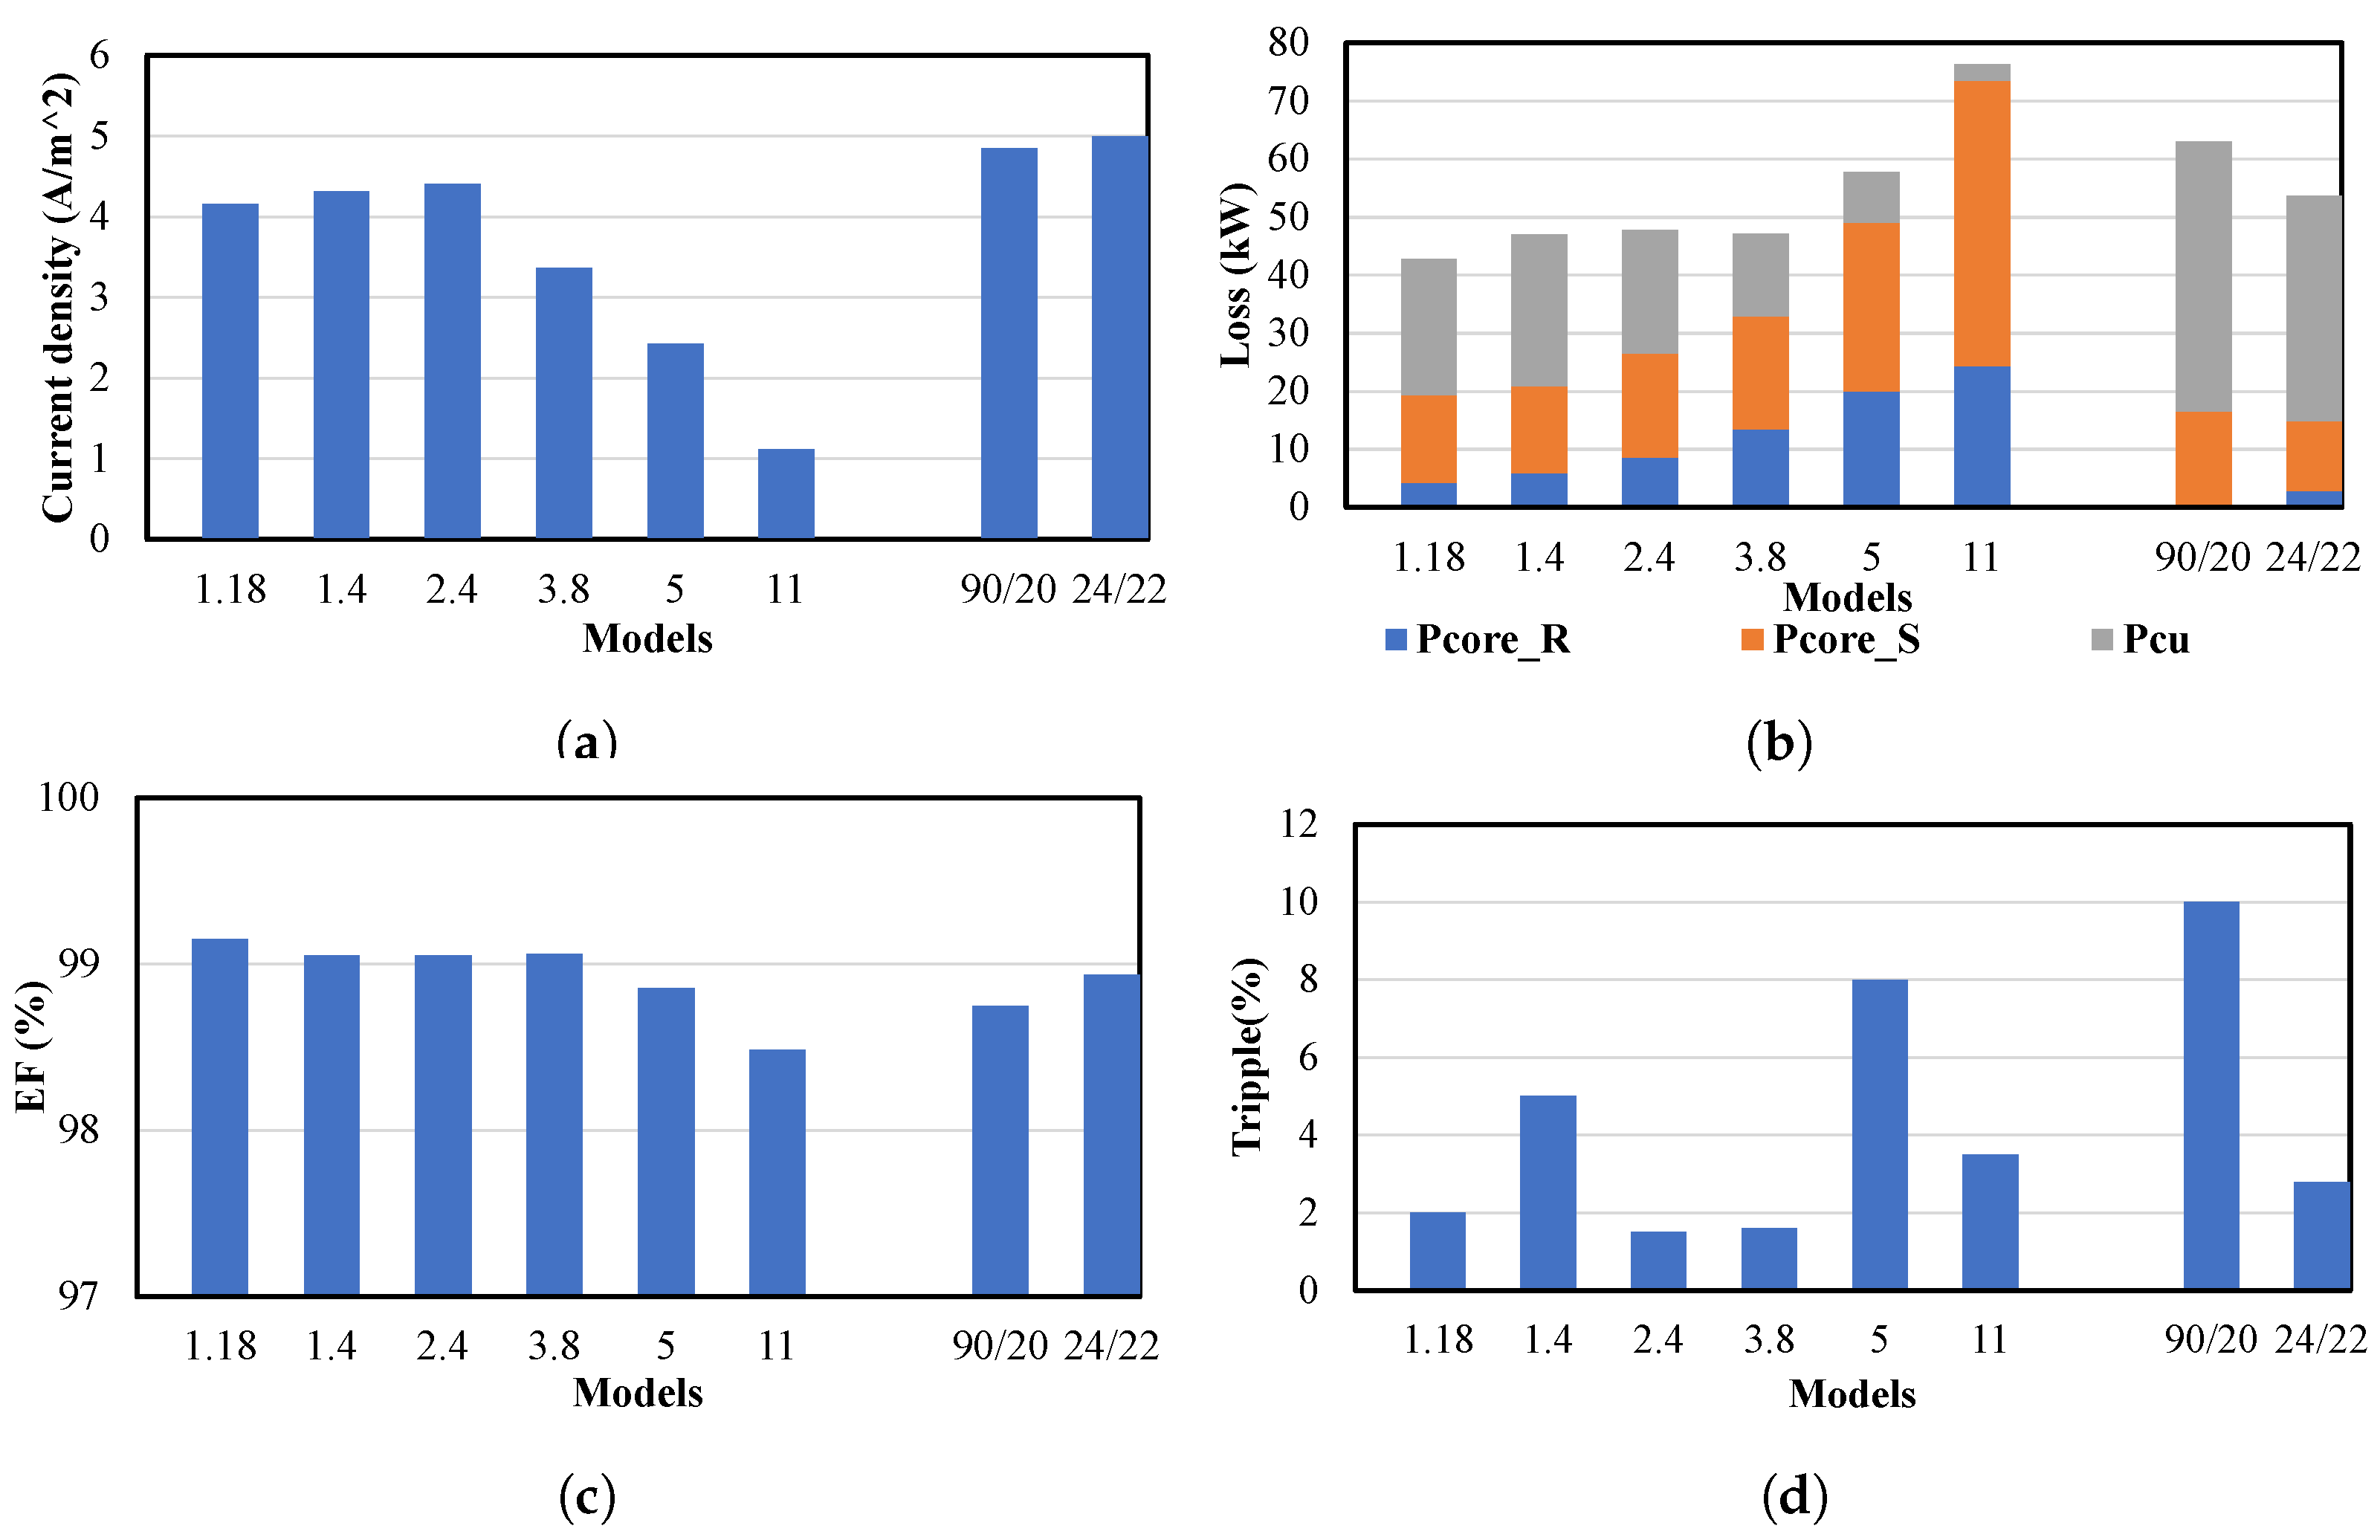
Copper loss and core loss analysis is another crucial aspect to consider that has an effect on the performance of electric motors. As mentioned previously, all motors are designed and optimised for a power output of 5 MW, with varying dimensions and stack lengths. To attain a line-to-line voltage of 3.3 kV, the number of turns in series per phase is adjusted to match the intended voltage level. An escalation in the gear ratio results in a proportional increase in leakage flux. As a result, to sustain a precise voltage level, it becomes imperative to reduce the number of turns in series per phase as the gear ratio increases. This adjustment not only affects the turns, but also leads to a reduction in phase resistance, which can reduce copper loss. Moreover, non-overlapping windings have a shorter coil pitch, which at the same slot size and machine dimensions results in a lower induced voltage and lower torque at the same level of current density. Therefore, to achieve the desired torque, it is necessary to increase the current density, as can be seen in
Figure 13a, which in turn leads to an overall increase in copper losses, as depicted in
Figure 13b. The PMVM can experience higher core losses compared to the conventional PMSM operating at the same speed. This difference can be attributed to the increased number of poles of the PMVM, which results in a higher operating frequency. Moreover, increasing the gear ratio amplifies the number of poles and operating frequency, thereby intensifying the core loss even further. Based on
Figure 13b, PMVM has higher core losses compared to the normal PMSM, while the normal PMSM has higher copper losses. It is worth noting that core cooling is generally more straightforward compared to coil cooling.
Therefore, it can be argued that the Vernier machine surpasses the conventional PMSM in terms of the cooling system, assuming an equal number of slots. Furthermore, it is evident that Type C and Type B configurations demonstrate lower total losses compared to the normal PMSM, which makes EF higher. Based on
Figure 13c increasing
leads to a decrease in EF. Notably, Type B and Type C exhibit the highest EF among all models.
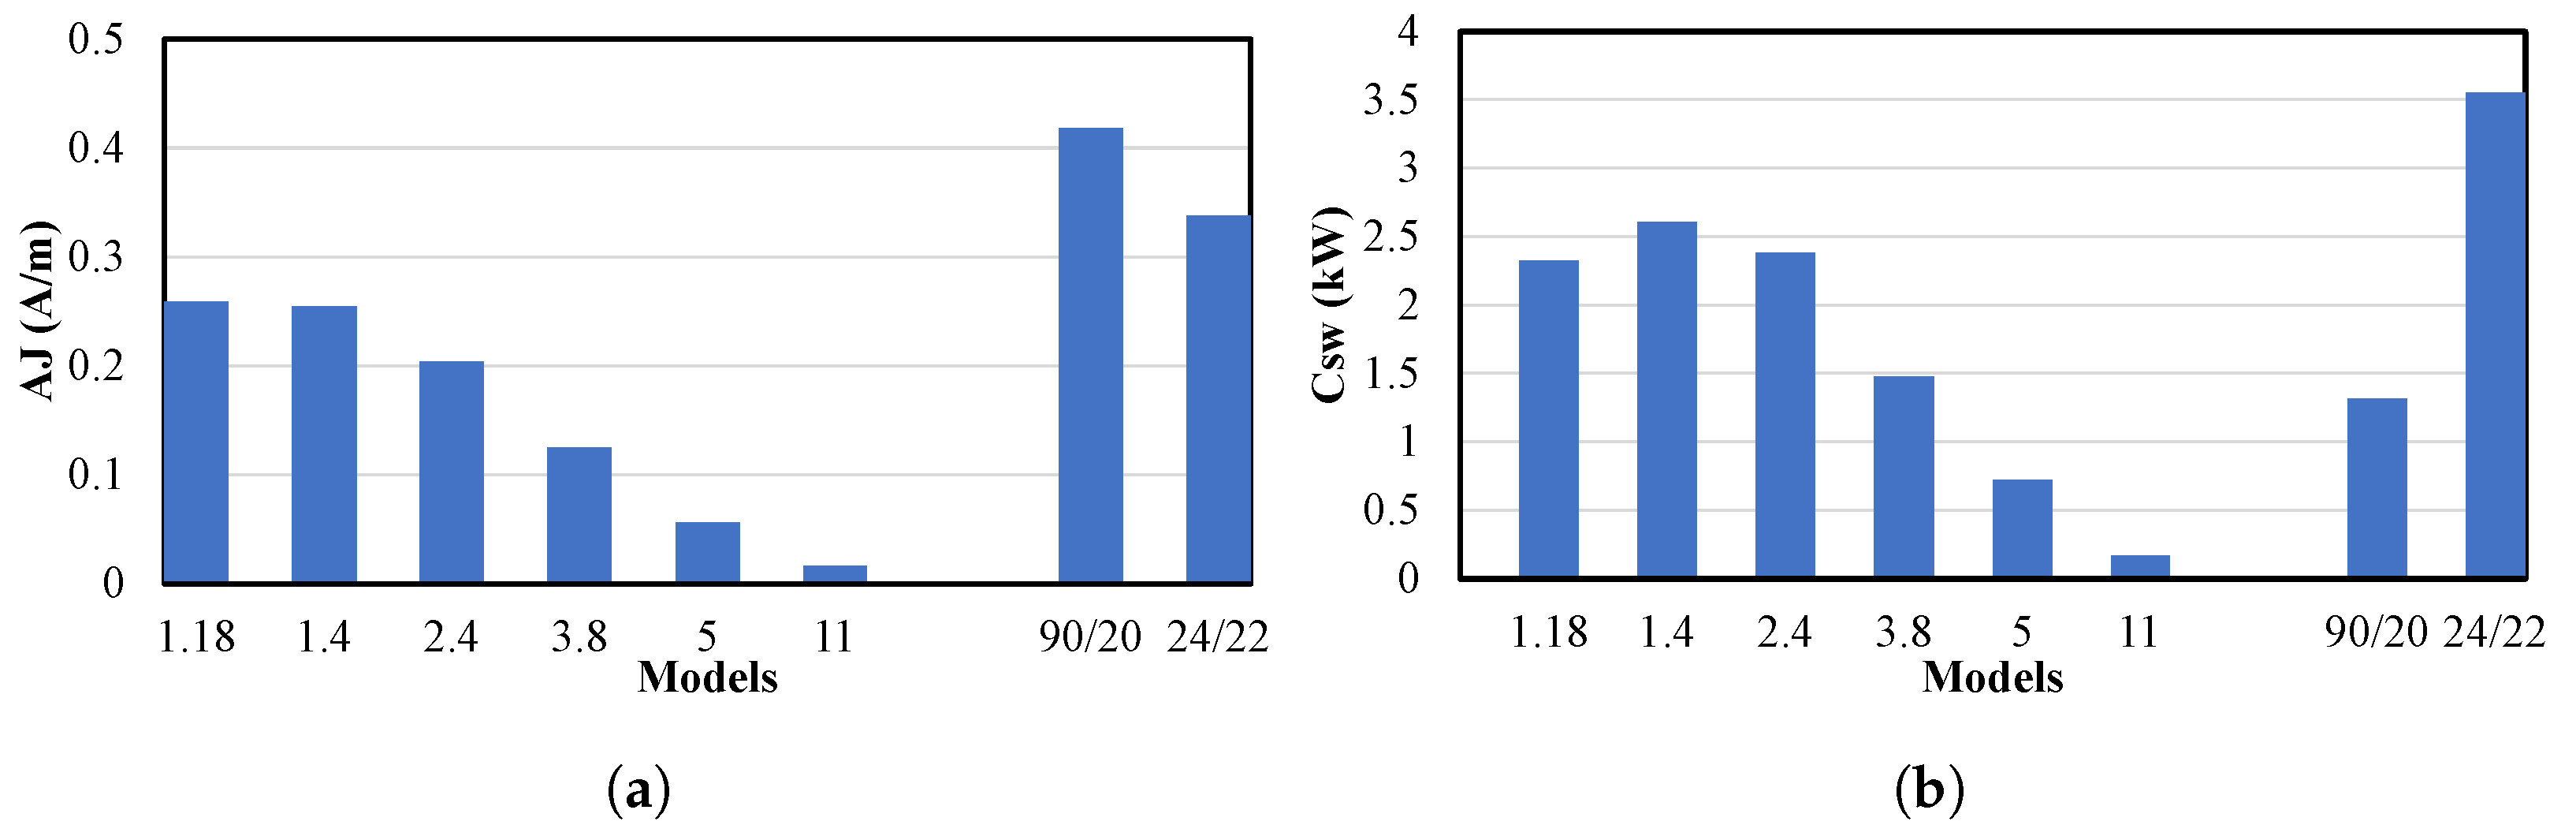
An effective cooling system and efficient heat extraction are critical for electrical machines, especially in high-power applications with significant loss factors. The AJ value, derived from the electrical loading (A) and slot current density (J), serves as an indicator of cooling system complexity. Higher AJ values signify increased electrical loading and current density, requiring advanced cooling systems such as oil or water cooling. However, these systems introduce extra components and control mechanisms, increasing overall system complexity. Consequently, a higher AJ value necessitates sophisticated cooling approaches to manage thermal demands effectively. Electrical loading can be defined as
where
is the slot area (side areas and bottom area) available for the copper conductors,
is the copper filling factor and
is the inner diameter of the stator. The AJ value for all models is defined in
Figure 14a. The AJ values in the PMVMs are lower than those of the normal PMSMs. By increasing the
, the AJ value decreases drastically, specifically for Type A PMVMs. The copper loss per slot-wall area serves as a measure of heat extraction, given by
where
,
h and
b are the active copper loss (without end-winding), height and width of the slot, respectively. The
for all models are shown in
Figure 14b. Increasing the gear ratio (
) leads to a decrease in
due to a lower current density.
The PMVMs exhibit lower compared to the normal PMSMs with the same number of slots. Among the various types, Type A exhibits the lowest AJ value and the least , indicating that it offers superior performance in terms of cooling system and heat extraction.
6.3. Torque Ripple Comparison
The interaction between back EMF harmonics and the current results in ripple torque. Due to the undesirable effects of high ripple torque, such as noise and vibration, it becomes a crucial design parameter, especially for ship propulsion. The percentage of ripple torque is calculated by
where
and
are maximum and minimum torque, respectively. The percentage ripple torque of all the 5 MW PM machine models is compared in
Figure 13d. The Type B PMVM demonstrates superior performance in terms of ripple torque. Note, however, that this comparison was conducted without employing any methodology to reduce the ripple torque, such as by skewing, PM shaping, or other techniques.
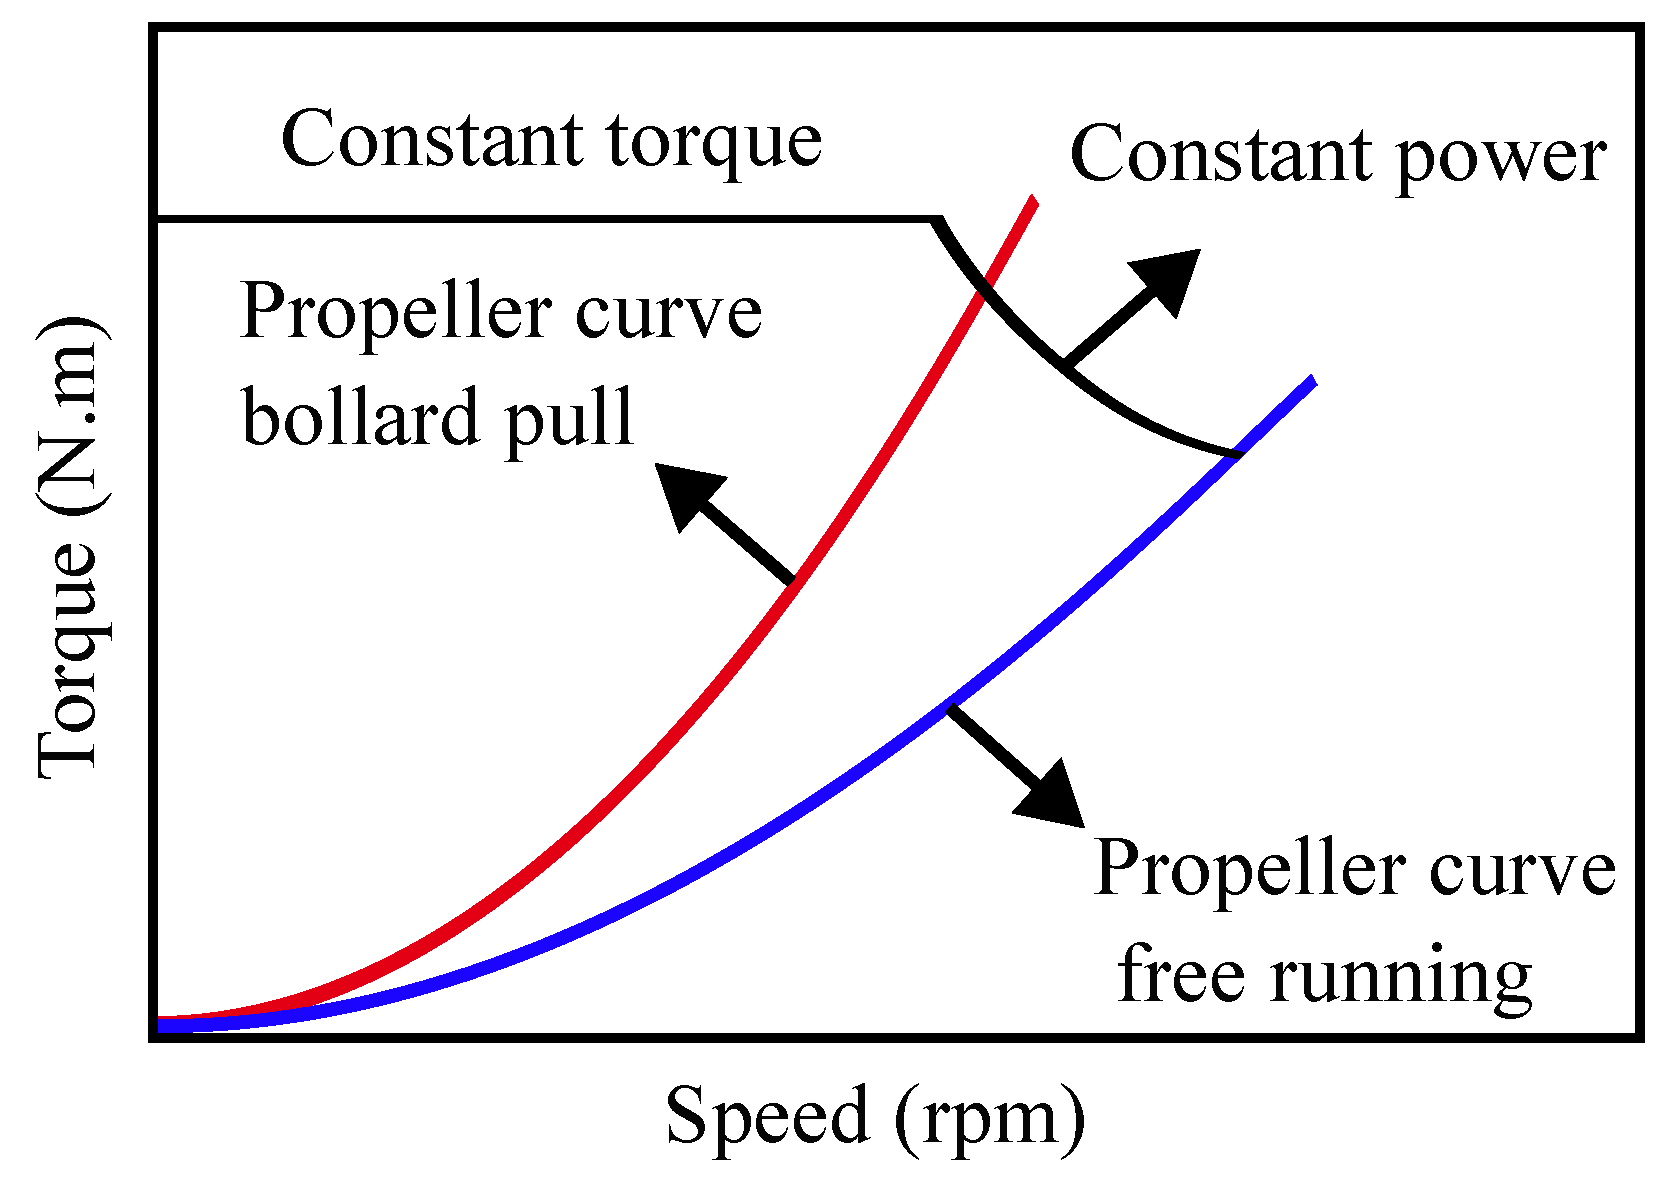
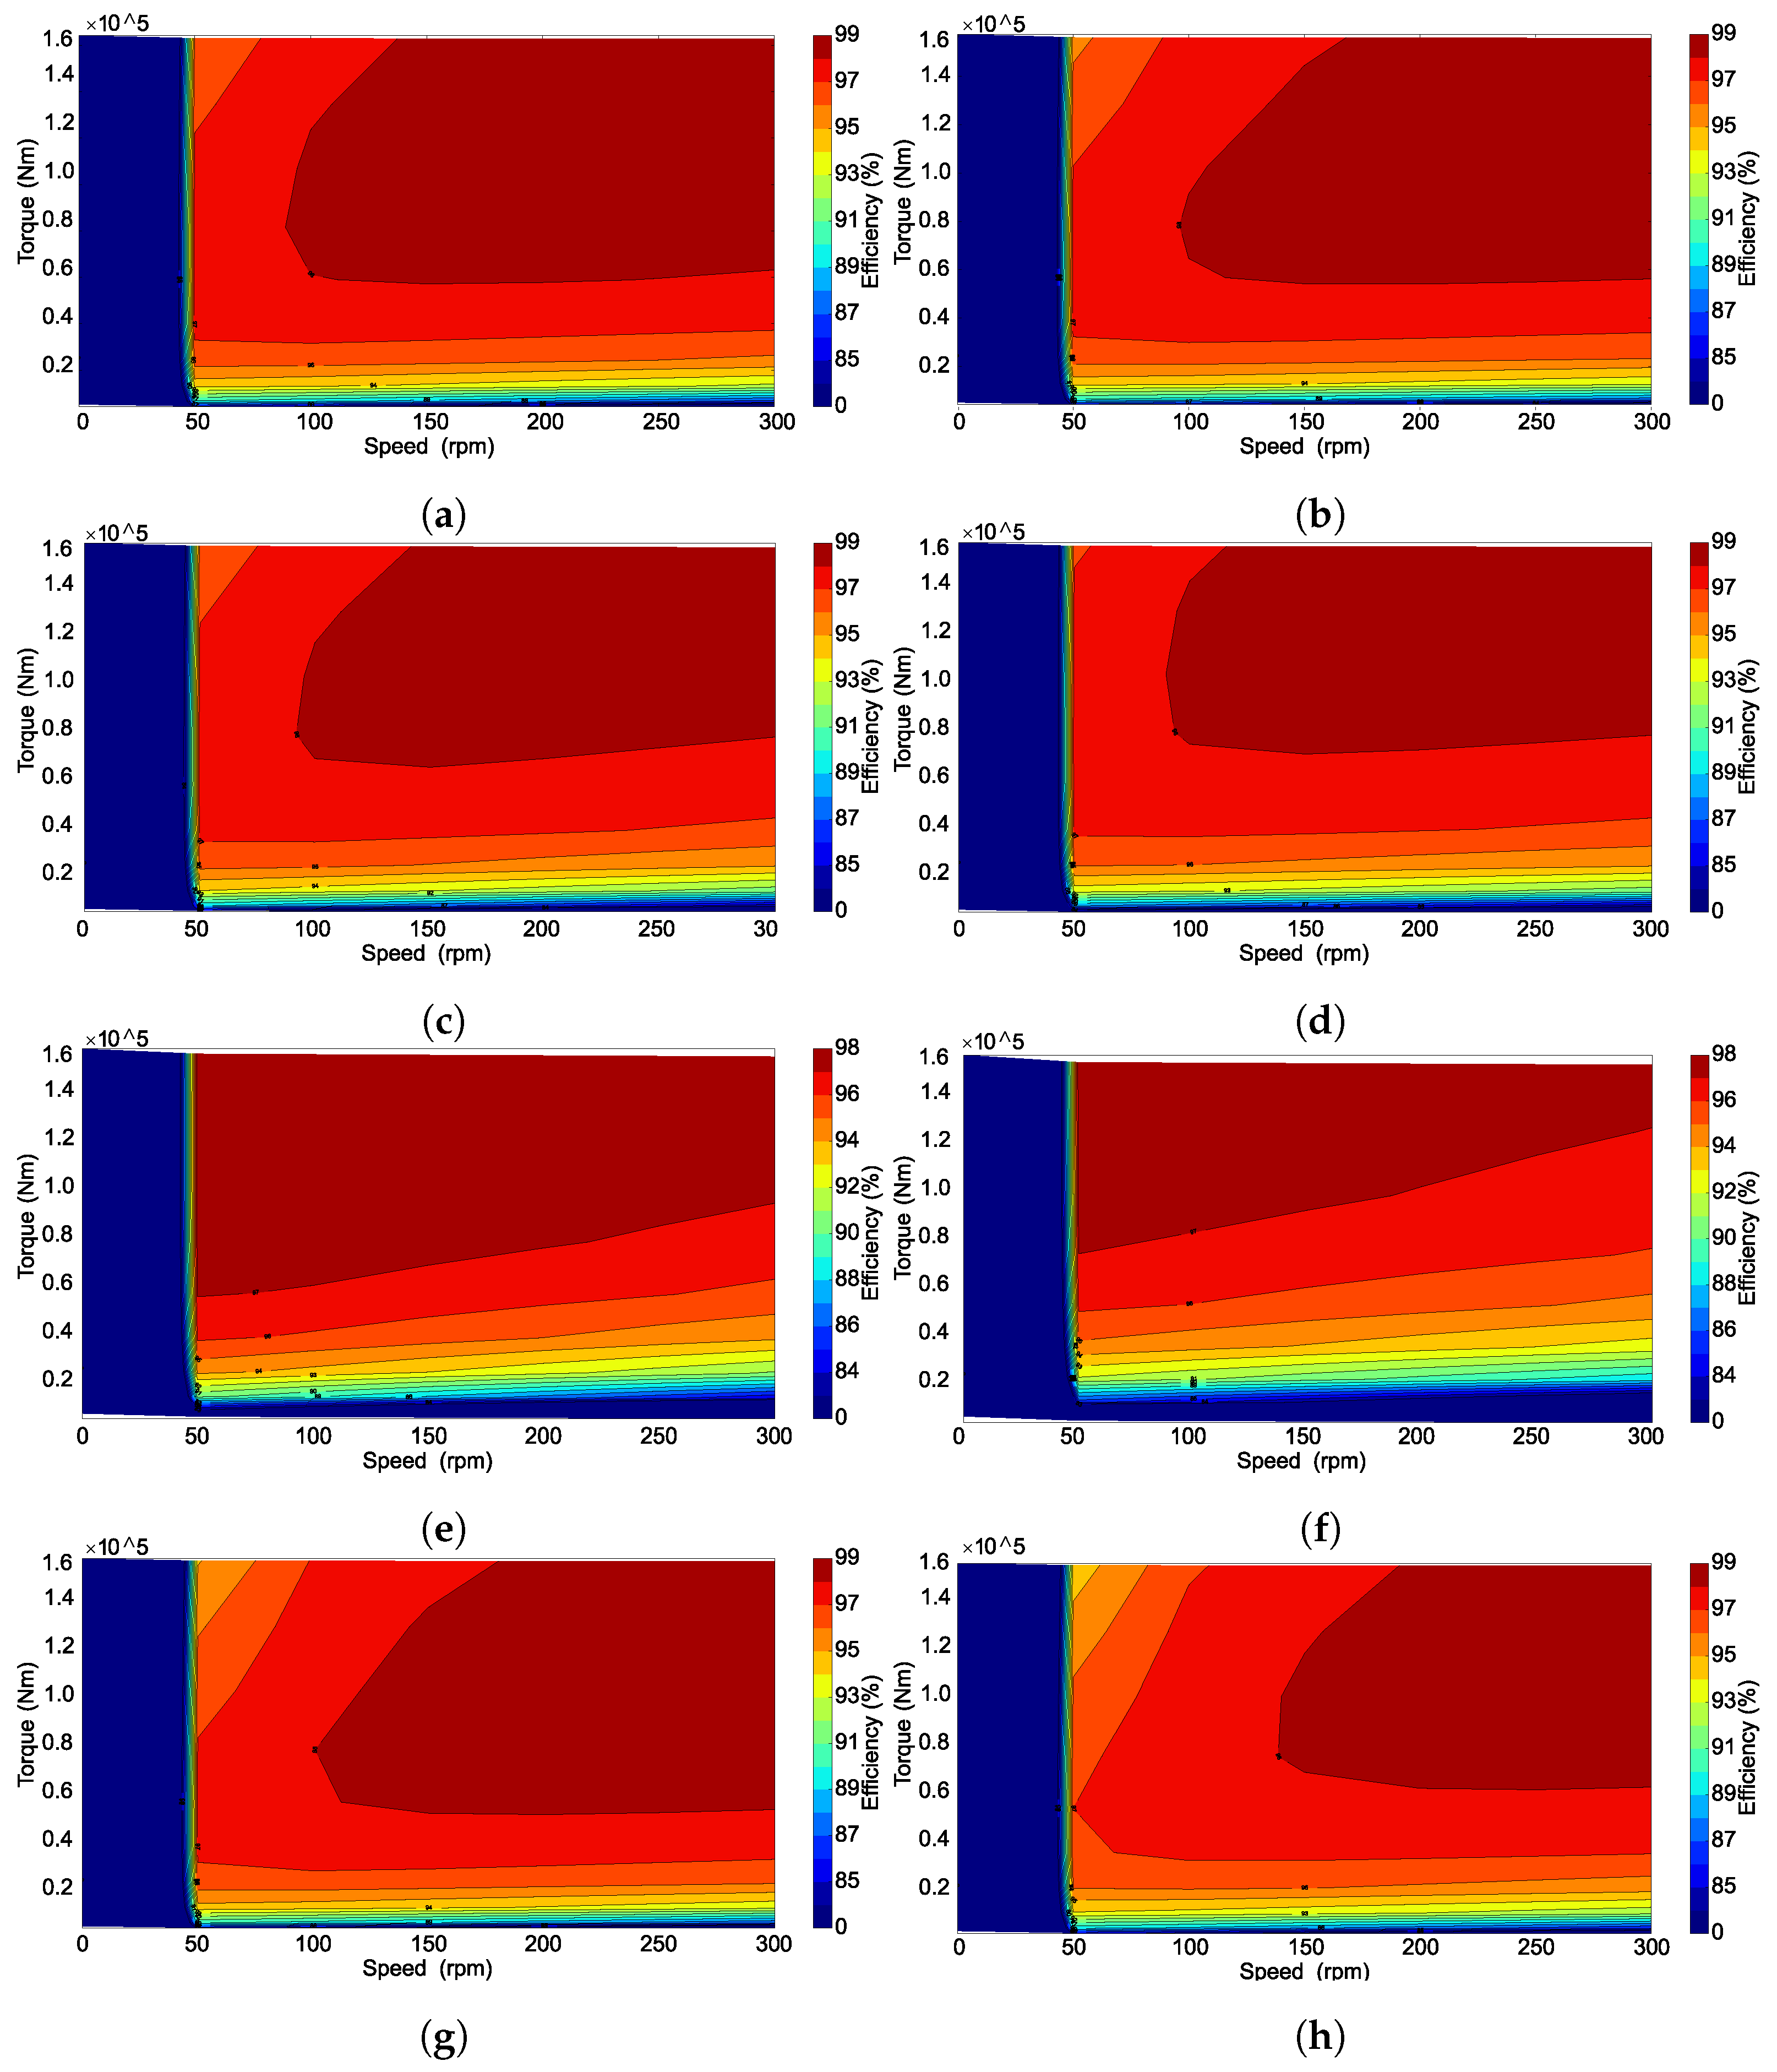
6.4. EF versus Speed Load
The propulsion motor’s high torque at the propeller shaft is essential and electric motors can be designed with a torque characteristic that gives maximum torque at low propeller speed, even when the propeller is stopped. A typical torque-speed characteristic of the propulsion motor is shown in
Figure 15. The efficiency map is a valuable tool for comparing the performance of electrical machines and understanding their EF [
43]. For each motor design, EF under various load conditions is presented in
Figure 16. Overall, the Type C and Type B PMVM showcase a higher maximum EF compared to the PMSM. However, when the gear ratio is augmented, the extent of the high-efficiency range (97%) diminishes, as shown in
Table 4.
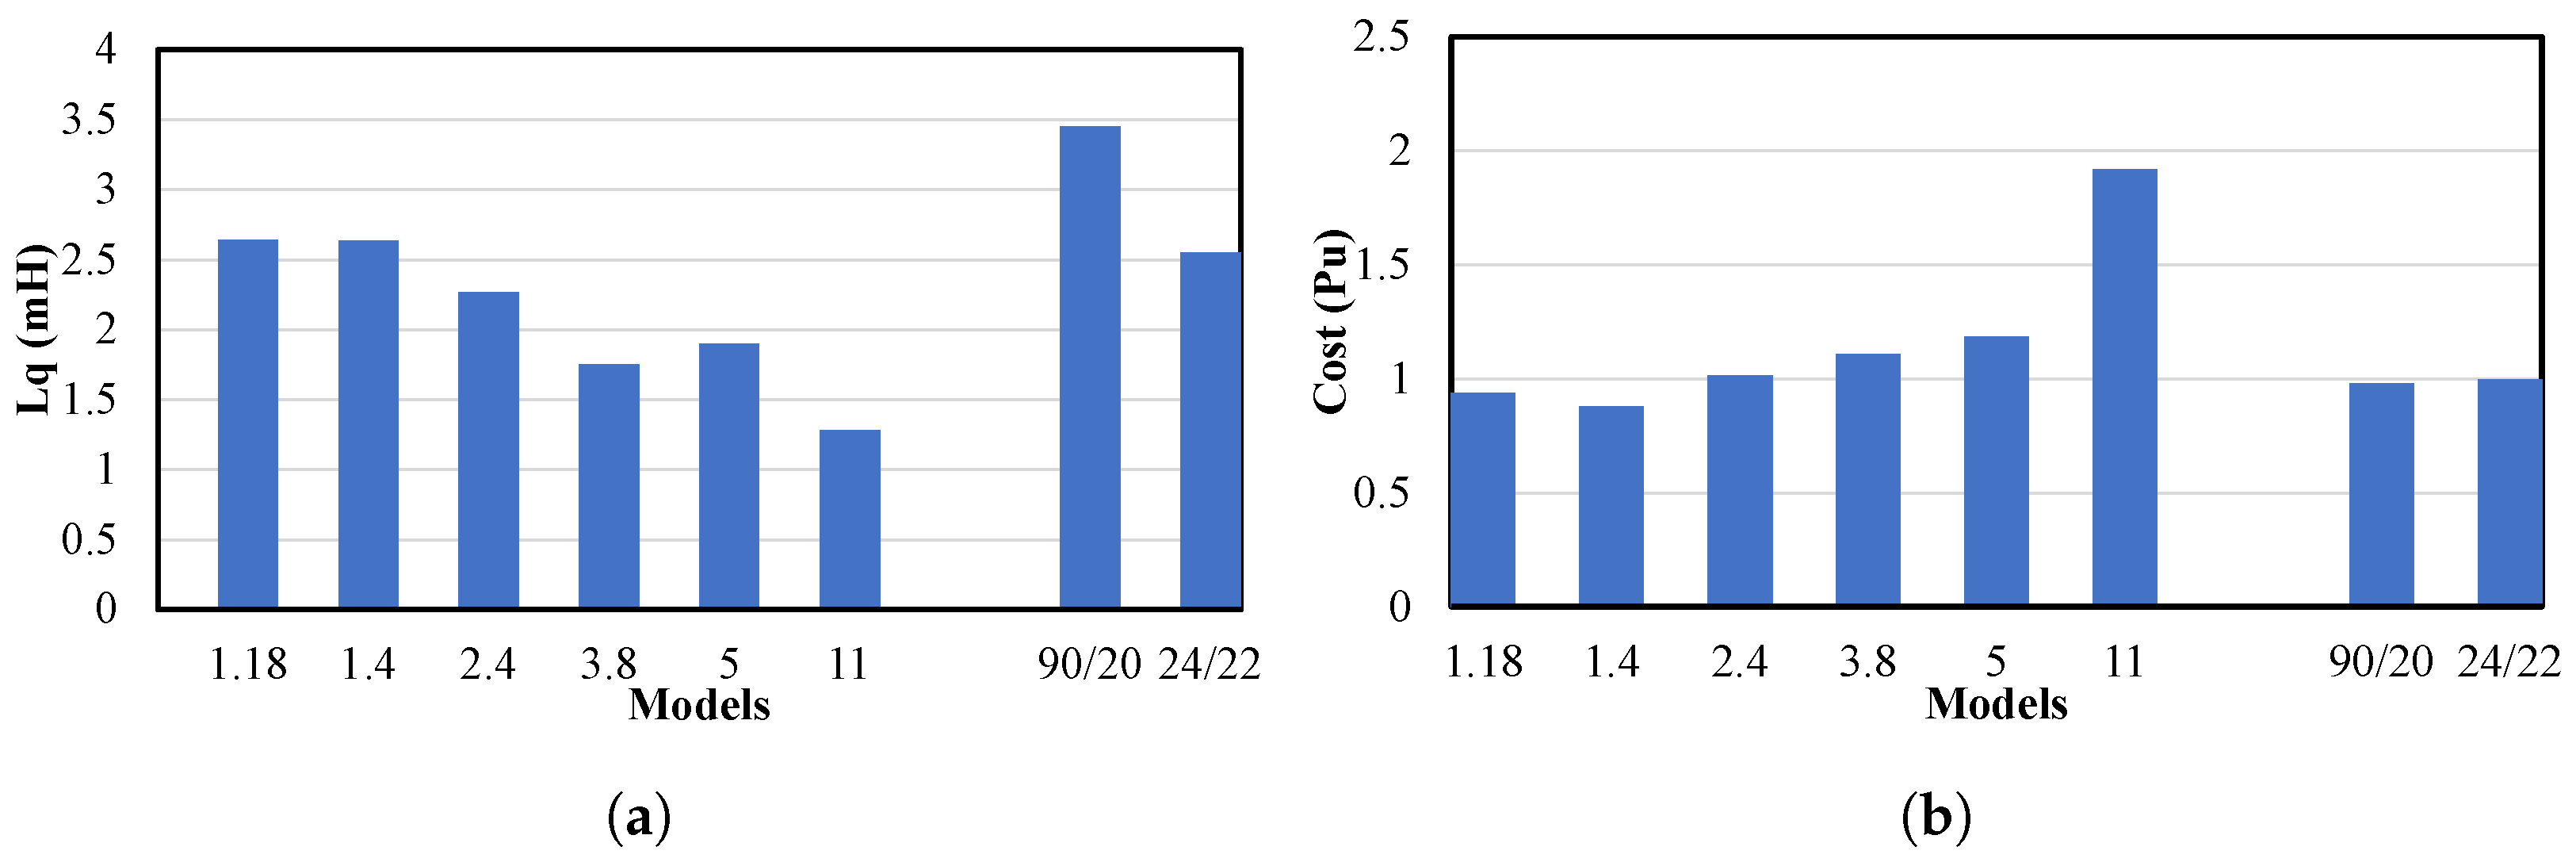
6.5. Power Factor and Cost Comparison
As explained earlier, the PMVM and PMSM models are compared at the same PF = 0.7. The PF can be explained based on Equation (
20), which is extracted from the phasor diagram. In the phasor diagram, the phase resistance is ignored. Further,
, as all the PM machines were optimised, with only q-axis current flowing. Lastly, theta is the power factor angle.
Equation (
20) demonstrates that, when aiming to maintain a PF of 0.7 at the same current and voltage level, it becomes necessary to reduce the inductance by increasing the
.
Figure 17a illustrates the phase inductance values of all PM machine models, revealing a decrease in phase inductance with increasing
. The comparison of the 5 MW PM machines at the same PF level makes it a fair comparison in terms of the cost of the PM machine drives, as all the PM machines require the same kVA-size power converter (inverter). With the inverter cost the same, only the material cost of the PM machines has to be considered. The costs of the PM, copper and iron materials are based on PM =
, copper =
, and laminated core =
. The cost comparison for all models is depicted in
Figure 17b per unit. As can be seen, Type A is the most expensive type, Type C is the cheapest model and Type B is competitive with the normal PMSM.
7. Discussion
The objective function for all models was chosen to ensure that all optimised models had a lower active mass and magnet mass. The models were selected from the optimum point on the Pareto front, close to the knee point, with a PF = 0.7, and are physically and electromagnetically compared in
Table 5. The mass of the core and magnets reflects the material costs and structural considerations of the models. Lighter models are often preferred for portable applications due to their cost effectiveness. In the mass comparison, increasing the gear ratio results in a higher mass for the magnet, core, and end-winding. However, in comparing PMVM with normal PMSMs, Type B and Type C are lighter than Type A and normal PMSMs. The lowest mass is observed for the gear ratio of 2.4, with a total weight of 5342 kg, which includes 373 kg of magnet mass and 202 kg of end-winding mass. In a cost comparison based on material weight, Type A was the most expensive due to its higher-value magnet and core, while Type C was the least expensive due to its lower-value materials. Type B and normal PMSMs had similar costs. Although this comparison primarily considered material costs, the similar power factors across all models suggest that it may also be indicative of the overall system cost.
In ship propulsion, where space constraints often necessitate compact motors, the motor’s stack length emerges as a critical design parameter that influences its electromagnetic performance. Shortening the stack length can potentially reduce manufacturing costs and render the motor more appropriate for applications with limited space. Type B and Type C, when compared to Type A PMVM and normal PMSMs, have shorter stack lengths, rendering them more suitable for such applications in terms of size and dimension. Among all models compared, the PMVM with a gear ratio of 2.4 had the lowest stack length, of 1445 mm, thereby making it the most suitable for this application. As mentioned before, current density and AJ are crucial parameters affecting the thermal aspects of electrical machines, where higher values can significantly affect performance in terms of thermal management and cooling complexity. In this comparison, PMVM exhibited better performance relative to conventional PMSMs, with an increase in gear ratio leading to reduced current density and AJ values. The lowest J and AJ values belonged to Type A, with values of 1.1 (A/m2) and 0.016 (A/m), respectively, indicating that Type A had superior performance in terms of thermal management and cooling efficiency. Core and copper losses are key indicators of model EF. The core loss in PMVM was higher than in PMSM, a consequence of the higher frequency. In addition, an increase in the gear ratio leads to a further rise in the core loss. However, the lowest core loss in the Vernier machine, at 19,311 W, still exceeded the highest core loss observed in PMSM, at 15,109 W. On the other hand, the copper loss in PMSM was greater than in PMVM, attributable to the higher current density. Increasing the gear ratio decreases copper loss. Interestingly, the highest copper loss in the Vernier machine, at 26,154 W, was lower than the lowest copper loss in a normal PMSM, which is 38,848 W.
The EF is arguably the most direct measure of performance, where higher EF indicates a model’s superior capability to convert electrical energy into mechanical energy with minimal waste. In the comprehensive comparison of EF, it can be confirmed that PMVM, even with its higher frequency, exhibited better EF compared to conventional PMSM. In addition, increasing the gear ratio reduced the EF of PMVM. However, it has been observed that Type B and Type C demonstrate efficiencies higher than 99%, a level of performance not seen in normal PMSM. Regarding wall loss, which indicates the heat-extraction capability of an electrical model and is influenced by slot area, copper loss, stack length, and number of slots, the Vernier machine outperforms conventional PMSMs. An increase in the gear ratio leads to a reduction in wall loss. When comparing lower values of wall loss, Type A, with a = 11 demonstrated the lowest wall loss even which had the lower number of slots compared to the normal PMSM, with a higher slot number (90/20). The wall loss for the Type A PMVM was 165 (W/m2). In the comparison of torque per volume and torque per mass, it can be concluded that, both metrics decreased with an increase in the gear ratio. Type B and Type C exhibited higher values compared to conventional PMSM. The highest values for torque per volume and torque per mass were achieved at a gear ratio of 2.4, with values of 81 (KNm/m3) and 29.76 (Nm/kg), respectively. Based on this discussion, it can be concluded that for high power levels (MW) in ship and marine propulsion, a low gear ratio (Type B, Type C) demonstrates better performance compared to conventional PMSM. High gear ratios (Type A) are not suitable for this application.
8. Conclusions
This paper presents the design, optimisation, and performance evaluation of a 5 MW open-slot PMSM and PMVM for ship propulsion, conducting comparisons and optimisations at the same PF. The study encompassed six PMVMs and two PMSMs, dividing the PMVMs into three types: Type A, Type B, and Type C. Type C featured a non-overlap winding with a coil pitch of one, Type B used an overlapped winding with a coil pitch of two, and Type A adopted an overlapped winding with a coil pitch greater than two. The results of the comparison study are summarised in
Table 5. They reveal that Type A PMVMs are heavier and more expensive, making them less suitable for high-power applications due to their substantial iron losses and mass. On the other hand, Type B and Type C PMVMs are cost-competitive with PMSMs and, in certain respects, offer superior performance in terms of losses, EF, mass, torque per volume, torque per mass, and cooling system effectiveness. In conclusion, the study illustrates that Type B and Type C PMVMs, with their low gear ratio, stand as promising alternatives to traditional PMSMs for high-power applications, such as podded ship propulsion. They provide lower losses, higher EF exceeding 99%, and necessitate smaller cooling systems than standard PMSMs. Among the evaluated models, the Type B PMVM with a gear ratio of 2.4 was identified as the most suitable option due to its exceptional overall performance, shortest stack length, lowest ripple torque, and enhanced torque per volume and mass for this specific application.
Author Contributions
Conceptualisation, N.A.; methodology, M.J.K. and R.-J.W.; software, N.A.; validation, N.A., M.J.K., and R.-J.W.; formal analysis, N.A., M.J.K., and R.-J.W.; investigation, M.J.K. and R.-J.W.; writing—original draft preparation, N.A.; writing—review and editing, M.J.K. and R.-J.W.; visualisation, N.A., M.J K., and R.-J.W.; supervision, M.J.K. and R.-J.W. All authors have read and agreed to the published version of the manuscript.
Funding
This research received no external funding.
Data Availability Statement
The original contributions presented in the study are included in the article, further inquiries can be directed to the corresponding author.
Acknowledgments
This work was supported by ABB Corporate Research in Sweden and by Stellenbosch University in South Africa.
Conflicts of Interest
The authors declare no conflict of interest.
Nomenclature
| Gear ratio |
| Power factor |
| Q | Number of stator slots |
| Stator winding pole-pair number |
| Rotor pole-pair number |
| Permeance of the permanent magnets as a function of the position |
| Air-gap permeance of the stator slots as a function of the position |
| Angles |
| Permeability of the air |
| % | Air-gap length |
| Air-gap flux density as a function of the position |
| Area of air gap |
| Stator MMF harmonic due to stator currents |
| Total number of turns in series per phase |
| Winding factor for the fundamental harmonic |
| q | Slot per pole per phase |
| Efficiency |
| J | Current density |
| Iron mass |
| Copper mass |
| Magnet mass |
| Input vectors |
| Stack length |
| Slot area |
| Copper filling factor |
| A | Electrical loading |
| Inner diameter of the stator |
| Copper loss per slot-wall area |
| Active copper loss |
| Height and width of the slot, respectively |
| Ripple torque |
| Maximum torque |
| Minimum torque |
| d-axis and q-axis currents, respectively |
| d-axis and q-axis inductances, respectively |
| E | Voltage |
| n | Speed |
| Phase resistance |
| End-winding length |
References
- Kirtley, J.L.; Banerjee, A.; Englebretson, S. Motors for ship propulsion. Proc. IEEE 2015, 103, 2320–2332. [Google Scholar] [CrossRef]
- McCoy, T.J. Electric ships past, present, and future [technology leaders]. IEEE Electrif. Mag. 2015, 3, 4–11. [Google Scholar] [CrossRef]
- Bruzzese, C. A high absolute thrust permanent magnet linear actuator for direct drive of ship’s steering gears: Concept and fem analysis. In Proceedings of the 2012 XXth International Conference on Electrical Machines, Marseille, France, 2–5 September 2012; pp. 556–562. [Google Scholar]
- Sulligoi, G.; Vicenzutti, A.; Menis, R. All-electric ship design: From electrical propulsion to integrated electrical and electronic power systems. IEEE Trans. Transp. Electrif. 2016, 2, 507–521. [Google Scholar] [CrossRef]
- Doerry, N.; Amy, J.; Krolick, C. History and the status of electric ship propulsion, integrated power systems, and future trends in the u.s. navy. Proc. IEEE 2015, 103, 2243–2251. [Google Scholar] [CrossRef]
- Thongam, J.S.; Tarbouchi, M.; Okou, A.F.; Bouchard, D.; Beguenane, R. Trends in naval ship propulsion drive motor technology. In Proceedings of the 2013 IEEE Electrical Power & Energy Conference, Halifax, NS, Canada, 21–23 August 2013; pp. 1–5. [Google Scholar]
- Chasiotis, I.D.; Karnavas, Y.L. A study on design and optimization of high power density pmsm for pod propulsion system. In Proceedings of the 2018 XIII International Conference on Electrical Machines (ICEM), Alexandroupoli, Greece, 3–6 September 2018; pp. 534–540. [Google Scholar]
- Arish, N.; Kamper, M.J.; Wang, R.-J. Electromagnetic Analysis of Flux Barrier U-Shaped Permanent Magnet Vernier Motor. In Proceedings of the 2021 International Aegean Conference on Electrical Machines and Power Electronics (ACEMP) & 2021 International Conference on Optimization of Electrical and Electronic Equipment (OPTIM), Brasov, Romania, 2–3 September 2021; pp. 198–204. [Google Scholar]
- Lateb, R.; Takorabet, N.; MeibodyTabar, F.; Mirzaian, A.; Enon, J.; Sarribouette, A. Performances comparison of induction motors and surface mounted pm motor for pod marine propulsion. In Proceedings of the Fourtieth IAS Annual Meeting, Conference Record of the 2005 Industry Applications Conference, Hong Kong, China, 2–6 October 2005; Volume 2, pp. 1342–1349. [Google Scholar]
- Zeraoulia, M.; Benbouzid, M.E.H.; Diallo, D. Electric motor drive selection issues for hev propulsion systems: A comparative study. IEEE Trans. Veh. Technol. 2006, 55, 1756–1764. [Google Scholar] [CrossRef]
- Arish, N.; Marignetti, F.; YazdaniAsrami, M. Comparative study of a new structure of hts-bulk axial flux-switching machine. Phys. C Supercond. Its Appl. 2021, 584, 1353854. [Google Scholar] [CrossRef]
- Arish, N.; Ardestani, M.; Hekmati, A. Optimum structure of rotor slot for a 20 kw hts induction motor. Phys. C Supercond. Its Appl. 2021, 582, 1353829. [Google Scholar] [CrossRef]
- Arish, N. Leakage flux reduction of axial-flux switching pm machine by using hts-disk. Phys. C Supercond. Its Appl. 2021, 590, 1353962. [Google Scholar] [CrossRef]
- Yanamoto, T.; Izumi, M.; Umemoto, K.; Oryu, T.; Murase, Y.; Kawamura, M. Load test of 3-mw hts motor for ship propulsion. IEEE Trans. Appl. Supercond. 2017, 27, 5204305. [Google Scholar] [CrossRef]
- Umemoto, K.; Aizawa, K.; Yokoyama, M.; Yoshikawa, K.; Kimura, Y.; Izumi, M.; Ohashi, K.; Numano, M.; Okumura, K.; Yamaguchi, M.; et al. Development of 1 mw-class hts motor for podded ship propulsion system. J. Phys. Conf. Ser. 2010, 234, 032060. [Google Scholar] [CrossRef]
- Gamble, B.; Snitchler, G.; MacDonald, T. Full power test of a 36.5 mw hts propulsion motor. IEEE Trans. Appl. Supercond. 2011, 21, 1083–1088. [Google Scholar] [CrossRef]
- Xu, L.; Liu, G.; Zhao, W.; Ji, J. Stator-excited vernier high-temperature superconducting machine for direct drive propulsion. IEEE Trans. Appl. Supercond. 2016, 26, 5207505. [Google Scholar] [CrossRef]
- Qiao, M.; Zhu, Y.; Li, G.; Liang, J. Analysis and design of low-speed six-phase fractional-slot concentrated-winding pm motor applied to marine propulsion. In Proceedings of the 2015 IEEE International Conference on Mechatronics and Automation (ICMA), Beijing, China, 2–5 August 2015; pp. 681–686. [Google Scholar]
- Choi, H.Y.; Park, S.J.; Kong, Y.K.; Bin, J.G. Design of multi-phase permanent magnet motor for ship propulsion. In Proceedings of the 2009 International Conference on Electrical Machines and Systems, Tokyo, Japan, 15–18 November 2009; IEEE: Piscataway, NJ, USA, 2019; pp. 1–4. [Google Scholar]
- Qiao, M.; Jiang, C.; Zhu, Y.; Li, G. Research on design method and electromagnetic vibration of six-phase fractional-slot concentrated-winding pm motor suitable for ship propulsion. IEEE Access 2016, 4, 8535–8543. [Google Scholar] [CrossRef]
- Liu, Y.; Long, F.; Yin, J.; Lei, J.; Gao, Y. Optimal design of a halbach magnetized permanent magnet motor applied in electrical marine propulsion system. In Proceedings of the 2014 IEEE Conference and Expo Transportation Electrification Asia-Pacific (ITEC Asia-Pacific), Beijing, China, 31 August–3 September 2014; pp. 1–5. [Google Scholar]
- Guerroudj, C.; Saou, R.; Charpentier, J.F.; Boulayoune, A. Optimal design of a novel doubly salient permanent magnet motors for high power ship propulsion. In Proceedings of the 2018 XIII International Conference on Electrical Machines (ICEM), Alexandroupoli, Greece, 3–6 September 2018; pp. 2556–2562. [Google Scholar]
- Tao, X.; Yiguang, C.; Haotian, S.; Ning, X.; Weijie, H. Design and Analysis of Fractional Pole-Pair Permanent Magnet Vernier Machine Using Asymmetrical V-Shaped Permanent Magnet. In Proceedings of the 2023 26th International Conference on Electrical Machines and Systems (ICEMS), Zhuhai, China, 5–8 November 2023; pp. 2529–2533. [Google Scholar]
- Yu, J.; Mi, W.; Cai, Z.; Song, Z.; Liu, S.; Liu, C. Design Principle Considering Structural Mutual Effects of Double-Stator V-Shape-PM Vernier Machines for Electric Ship Propulsion. IEEE Trans. Transp. Electrif. 2023, 10, 496–508. [Google Scholar] [CrossRef]
- Ruzojcic, B.; Zarko, D.; Ban, D. Interior permanent-magnet motor for ship propulsion, design and testing. In Proceedings of the 2009 13th European Conference on Power Electronics and Applications, Barcelona, Spain, 8–10 September 2009; pp. 1–10. [Google Scholar]
- Bianchi, N.; Bolognani, S.; Ruzojcic, B. Design of a 1000 hp permanent magnet synchronous motor for ship propulsion. In Proceedings of the 2009 13th European Conference on Power Electronics and Applications, Barcelona, Spain, 8–10 September 2009; pp. 1–8. [Google Scholar]
- Cho, Y.U.; Lee, S.K.; Kang, G.H.; Kim, B.W. Design and verification of 200kw interior permanent magnet synchronous motor for ship propulsion. In Proceedings of the 2016 IEEE Conference on Electromagnetic Field Computation (CEFC), Miami, FL, USA, 13–16 November 2016; pp. 1–2. [Google Scholar]
- Caricchi, F.; Crescimbini, F.; Honrati, O. Modular axial-flux permanent-magnet motor for ship propulsion drives. IEEE Trans. Energy Convers. 1999, 14, 673–679. [Google Scholar] [CrossRef]
- Wu, W.; Xu, L.; Liu, B. Design, Analysis, and Optimization of Permanent Magnet Vernier Machines Considering Rotor Losses. Energies 2022, 15, 1502. [Google Scholar] [CrossRef]
- Arish, N.; Kamper, M.J.; Wang, R.-J. Performance of Large Low-Pole-Ratio Non-Overlap-Winding PM Vernier Motor. In Proceedings of the 2023 26th International Conference on Electrical Machines and Systems (ICEMS), Zhuhai, China, 5–8 November 2023; pp. 5255–5260. [Google Scholar]
- Li, W.; Ching, T.W.; Chau, K.T.; Lee, C.H.T. A superconducting vernier motor for electric ship propulsion. IEEE Trans. Appl. Supercond. 2018, 28, 5201706. [Google Scholar] [CrossRef]
- Li, D.; Qu, R.; Lipo, T.A. High-power-factor vernier permanent-magnet machines. IEEE Trans. Ind. Appl. 2014, 50, 3664–3674. [Google Scholar] [CrossRef]
- Yang, Y.; Wang, Y.; Zhu, C.; Wang, X.; Zhang, R. Study of vernier permanent magnet machine with the dual rotor, toroidal winding and ferrite magnet on both sides of stator and rotor. IET ELectric Power Appl. 2020, 14, 2675–2686. [Google Scholar]
- Arish, N. Electromagnetic performance analysis of linear vernier machine with pm and hts-bulk. Phys. C Supercond. Its Appl. 2020, 579, 1353751. [Google Scholar] [CrossRef]
- Xu, L.; Liu, G.; Zhao, W.; Ji, J.; Zhou, H.; Zhao, W.; Jiang, T. Quantitative comparison of integral and fractional slot permanent magnet vernier motors. IEEE Trans. Energy Convers. 2015, 30, 1483–1495. [Google Scholar] [CrossRef]
- Arish, N.; Kamper, M.J.; Wang, R.-J. Performance Comparison of 5-MW Normal and Dual Three-Phase PM Vernier Motors for Ship Propulsion. In Proceedings of the 2023 International Aegean Conference on Electrical Machines and Power Electronics (ACEMP) and 2023 International Conference on Optimization of Electrical and Electronic Equipment (OPTIM), Istanbul, Turkiye, 1–2 September 2023; pp. 1–8. [Google Scholar]
- Arish, N.; Kamper, M.J.; Wang, R.-J.; Dramat, A.Z.; Phumudzo, M. Design and Optimization of Fractional Slot Concentrated Winding PM Vernier Motor. In Proceedings of the 32nd Southern African Universities Power Engineering Conference (SAUPEC), Stellenbosch, South Africa, 24–25 January 2024; pp. 1–6. [Google Scholar]
- Li, D.; Zou, T.; Qu, R.; Jiang, D. Analysis of fractional-slot concentrated winding PM vernier machines with regular open-slot stators. IEEE Trans. Ind. Appl. 2018, 54, 1320–1330. [Google Scholar] [CrossRef]
- Yu, Y.; Pei, Y.; Chai, F.; Doppelbauer, M. Analysis of back EMF harmonics influenced by slot–pole combinations in permanent magnet vernier in-wheel motors. IEEE Trans. Ind. Electron. 2023, 70, 4461–4471. [Google Scholar]
- Tlali, P.; Wang, R.J. Prospect of PM vernier machine for wind power application. Energies 2022, 15, 4912. [Google Scholar] [CrossRef]
- Arish, N.; Teymoori, V.; Dube, L.; Kamper, M.J.; Wang, R.-J.; Dramat, A.Z.; Phumudzo, M. Comparative Analysis of PM and Non-PM Design Options for Small-Scale Wind Generators. In Proceedings of the 32nd Southern African Universities Power Engineering Conference (SAUPEC), Stellenbosch, South Africa, 24–25 January 2024; pp. 1–6. [Google Scholar]
- Lipo, T.A.; Kim, B. Operation and Design Principles of a PM Vernier Motor. IEEE Trans. Ind. Appl. 2014, 50, 3656–3663. [Google Scholar]
- Vadamodala, L.; Das, S.; Gundogmus, O.; Husain, T.; Harasis, S.; Chowdhury, S.; Sozer, Y.; Venegas, F.; Colvincenzo, D. Comparison of Electrical Machine Types for Electrically Driven Engine Accessories Using Multiphysics Simulation Tools. In Proceedings of the 2018 IEEE Energy Conversion Congress and Exposition (ECCE), Portland, OR, USA, 23–27 September 2018; pp. 5223–5229. [Google Scholar] [CrossRef]
- Hanninen, S.; Heideman, T.; Tenhunen, E. Development of Azipod Propulsion for High Power Arctic Offshore Vessels. In Proceedings of the 2012 OTC Arctic Technology Conference, Houston, TX, USA, 3–5 December 2012; pp. 1–13. [Google Scholar]
Figure 1.
Podded propulsion.
Figure 1.
Podded propulsion.
Figure 2.
Gear effect of PMVM with .
Figure 2.
Gear effect of PMVM with .
Figure 3.
Definition of slot/pole angles.
Figure 3.
Definition of slot/pole angles.
Figure 4.
The harmonic distribution of radial air-gap flux density due to the (a) PM for different gear ratios, (b) stator current for different gear ratios.
Figure 4.
The harmonic distribution of radial air-gap flux density due to the (a) PM for different gear ratios, (b) stator current for different gear ratios.
Figure 5.
The effect of on the gear ratio of Type B and Type C PMVMs.
Figure 5.
The effect of on the gear ratio of Type B and Type C PMVMs.
Figure 6.
Definition of the (a) design and optimisation flow diagram of NSGA-II and (b) variable parameters.
Figure 6.
Definition of the (a) design and optimisation flow diagram of NSGA-II and (b) variable parameters.
Figure 7.
Comparison of Pareto front results comparison for all types, with a lower boundary of (a) PF = 0.5 and (b) PF = 0.7.
Figure 7.
Comparison of Pareto front results comparison for all types, with a lower boundary of (a) PF = 0.5 and (b) PF = 0.7.
Figure 8.
Winding arrangement: (a) Type C, = 1.18 and PMSM, 24/22, (b) Type C, = 1.4, (c) Type B, = 2.4, (d) Type B, = 3.8, (e) Type A, = 5, (f) Type A, = 11, and (g) PMSM, 90/20 (24 slots).
Figure 8.
Winding arrangement: (a) Type C, = 1.18 and PMSM, 24/22, (b) Type C, = 1.4, (c) Type B, = 2.4, (d) Type B, = 3.8, (e) Type A, = 5, (f) Type A, = 11, and (g) PMSM, 90/20 (24 slots).
Figure 9.
The 3D structure sizes of the optimal models.
Figure 9.
The 3D structure sizes of the optimal models.
Figure 10.
Comparison of (a) stack length and (b) mass of optimally designed PMVMs and PMSMs.
Figure 10.
Comparison of (a) stack length and (b) mass of optimally designed PMVMs and PMSMs.
Figure 11.
Comparison of winding coil size, (a) 3D model, (b) end-winding length, and (c) end-winding mass of optimal design for all models.
Figure 11.
Comparison of winding coil size, (a) 3D model, (b) end-winding length, and (c) end-winding mass of optimal design for all models.
Figure 12.
Comparison of the flux density distribution of the different optimised 5 MW PM motors.
Figure 12.
Comparison of the flux density distribution of the different optimised 5 MW PM motors.
Figure 13.
Comparison of (a) current density, (b) loss, (c) EF, and (d) ripple torque of the different optimised 5 MW PM motors.
Figure 13.
Comparison of (a) current density, (b) loss, (c) EF, and (d) ripple torque of the different optimised 5 MW PM motors.
Figure 14.
Comparison of (a) AJ value and (b) Csw value of the different optimised 5 MW PM motors.
Figure 14.
Comparison of (a) AJ value and (b) Csw value of the different optimised 5 MW PM motors.
Figure 15.
Torque speed of propulsion motor [
44].
Figure 15.
Torque speed of propulsion motor [
44].
Figure 16.
Torque EF map of (a) Type C, = 1.18, (b) Type C, = 1.4, (c) Type B, = 2.4, (d) Type B, = 3.8, (e) Type A, = 5, (f) Type A, = 11, (g) PMSM, 24/22, and (h) PMSM, 90/20.
Figure 16.
Torque EF map of (a) Type C, = 1.18, (b) Type C, = 1.4, (c) Type B, = 2.4, (d) Type B, = 3.8, (e) Type A, = 5, (f) Type A, = 11, (g) PMSM, 24/22, and (h) PMSM, 90/20.
Figure 17.
Comparison of (a) and (b) cost.
Figure 17.
Comparison of (a) and (b) cost.
Table 1.
Classification of PMVMs based on gear ratios (Gr).
Table 1.
Classification of PMVMs based on gear ratios (Gr).
| Model | Type A | Type B | Type C |
|---|
| Gr | Gr ≥ 5 | 2 ≤ Gr < 5 | 1 < Gr < 2 |
| q | q ≥ 1 | | |
| Coil pitch | ≥3 | 2 | 1 |
Table 2.
Various slot–pole combinations and their winding factors in PMVMs for all types of Gr.
Table 2.
Various slot–pole combinations and their winding factors in PMVMs for all types of Gr.
| | | Q = 6 | | Q = 12 | | Q = 18 | | Q = 24 | | Q = 30 |
|---|
| | | | | | | | | | | | | | | | | | | | | | | | | |
| 1 | | 5 | 5 | 1 | 1 | | 11 | 11 | 0.97 | 2 | | 17 | 17 | 0.96 | 3 | | 23 | 23 | 0.96 | 4 | | 29 | 29 | 0.96 | 5 |
| 2 | | 4 | 2 | 0.87 | 1/2 | | 10 | 5 | 1 | 1 | | 16 | 8 | 0.95 | 1.5 | | 22 | 11 | 0.97 | 2 | | 28 | 14 | 0.95 | 2.5 |
| 3 | | - | - | - | - | | - | - | - | - | | 15 | 5 | 1 | 1 | | - | - | - | - | | - | - | - | - |
| 4 | | - | - | - | - | | 8 | 2 | 0.87 | 2/4 | | 14 | 3.5 | 0.95 | 3/4 | | 20 | 5 | 1 | 1 | | 26 | 6.5 | 0.91 | 1.25 |
| 5 | | - | - | - | - | | 7 | 1.4 | 0.93 | 2/5 | | 13 | 2.6 | 0.95 | 3/5 | | 19 | 3.8 | 0.93 | 4/5 | | 25 | 5 | 1 | 1 |
| 6 | | - | - | - | - | | - | - | - | - | | 12 | 2 | 0.86 | 3/6 | | - | - | - | - | | - | - | - | - |
| 7 | | - | - | - | - | | - | - | - | - | | 11 | 1.57 | 0.90 | 3/7 | | 17 | 2.43 | 0.93 | 4/7 | | 23 | 3.29 | 0.95 | 5/7 |
| 8 | | - | - | - | - | | - | - | - | - | | 10 | 1.25 | 0.95 | 3/8 | | 16 | 2 | 0.87 | 4/8 | | 22 | 2.75 | 0.95 | 5/8 |
| 10 | | - | - | - | - | | - | - | - | - | | - | - | - | - | | 14 | 1.4 | 0.93 | 4/10 | | 20 | 2 | 0.87 | 5/10 |
| 11 | | - | - | - | - | | - | - | - | - | | - | - | - | - | | 13 | 1.18 | 0.95 | 4/11 | | 19 | 1.73 | 0.87 | 5/11 |
| 13 | | - | - | - | - | | - | - | - | - | | - | - | - | - | | - | - | - | - | | 17 | 1.31 | 0.94 | 5/13 |
| 14 | | - | - | - | - | | - | - | - | - | | - | - | - | - | | - | - | - | - | | 16 | 1.14 | 0.95 | 5/14 |
Table 3.
Slot-pole combinations considered in design optimisation.
Table 3.
Slot-pole combinations considered in design optimisation.
| Q = 24 |
|---|
| | | | q | | Coil Pitch | Winding Type |
|---|
| 24 | 2 | 22 | 11 (Type A) | 2 | 0.97 | 5 | ow |
| 24 | 4 | 20 | 5 (Type A) | 1 | 1 | 3 | ow |
| 24 | 5 | 19 | 3.8 (Type B) | 4/5 | 0.93 | 2 | ow |
| 24 | 7 | 17 | 2.4 (Type B) | 4/7 | 0.93 | 2 | ow |
| 24 | 10 | 14 | 1.4 (Type C) | 4/10 | 0.93 | 1 | nw |
| 24 | 11 | 13 | 1.18 (Type C) | 4/11 | 0.95 | 1 | nw |
| 24 | 11 | 11 | 1 (PMSM) | 4/11 | 0.95 | 1 | nw |
| 90 | 10 | 10 | 1 (PMSM) | 3/2 | 0.94 | 4 | ow |
Table 4.
EF versus speed load.
Table 4.
EF versus speed load.
| Model | Type | EF > 97% |
|---|
| C | 71% |
| C | 71% |
| B | 70% |
| B | 70% |
| A | 52% |
| A | 35% |
| PMSM | 68% |
| PMSM | 61% |
Table 5.
Comparison of the electromagnetic performance of PMSM and PMVM.
Table 5.
Comparison of the electromagnetic performance of PMSM and PMVM.
| Model | Type C, Gr = 1.18 | Type C, Gr = 1.4 | Type B, Gr = 2.4 | Type B, Gr = 3.8 | Type A, Gr = 5 | Type A, Gr = 11 | 90/20 | 24/22 |
|---|
| Coil pitch | 1 | 1 | 2 | 2 | 3 | 5 | 4 | 1 |
| Winding factor | 0.95 | 0.93 | 0.92 | 0.92 | 1 | 0.93 | 0.94 | 0.95 |
| Series turn per phase | 40 | 40 | 32 | 24 | 16 | 8 | 60 | 40 |
| 0.0053 | 0.0060 | 0.0051 | 0.0029 | 0.0020 | 0.0004 | 0.0111 | 0.0066 |
| Q | 24 | 24 | 24 | 24 | 24 | 24 | 90 | 24 |
| pr | 13 | 14 | 17 | 19 | 20 | 22 | 10 | 11 |
| ps | 11 | 10 | 7 | 5 | 4 | 2 | 10 | 11 |
| n (rpm) | 300 | 300 | 300 | 300 | 300 | 300 | 300 | 300 |
| Frequency (Hz) | 65 | 70 | 85 | 95 | 100 | 110 | 50 | 55 |
| g (mm) | 1.3 | 1.3 | 1.3 | 1.3 | 1.3 | 1.4 | 2.2 | 1.3 |
| 0.183 | 0.185 | 0.309 | 0.306 | 0.718 | 1.12 | 0.254 | 0.185 |
| 2.64 | 2.63 | 2.32 | 1.75 | 1.89 | 1.28 | 3.45 | 2.55 |
| 1552 | 1589 | 1445 | 1604 | 1868 | 1993 | 1697 | 1749 |
| 9.6 | 9.8 | 13.1 | 12.84 | 11.2 | 15.85 | 11.56 | 10.65 |
| J (A/m2) | 4.1 | 4.3 | 4.4 | 3.3 | 2.4 | 1.1 | 4.85 | 5 |
| AJ (A/m) | 0.258 | 0.254 | 0.203 | 0.124 | 0.056 | 0.016 | 0.418 | 0.338 |
| 302 | 278 | 373 | 401 | 411 | 675 | 278 | 327 |
| 5641 | 5440 | 5342 | 5895 | 7776 | 12,800 | 6578 | 5703 |
| Active copper mass (kg) | 1557 | 1507 | 1148 | 1324 | 1544 | 2345 | 2051 | 1638 |
| End-winding mass (kg) | 168 | 157 | 202 | 213 | 429 | 848 | 267 | 157 |
| 19,311 | 20,885 | 26,505 | 32,882 | 49,108 | 73,555 | 15,109 | 14,813 |
| 23,464 | 26,154 | 21,183 | 14,229 | 8644 | 2775 | 44,729 | 38,848 |
| 2 | 5 | 1.5 | 1.6 | 8 | 3.5 | 10 | 2.8 |
| EF (%) | 99.11 | 99.04 | 99.06 | 99.03 | 98.81 | 98.41 | 98.75 | 98.93 |
| PF | 0.7 | 0.7 | 0.7 | 0.7 | 0.7 | 0.7 | 0.75 | 0.7 |
| Cws (W/m2) | 2323 | 2610 | 2382 | 1477 | 724 | 165 | 1314 | 3553 |
| Torque (KNm) | 159 | 159 | 159 | 159 | 159 | 159 | 159 | 159 |
| Power (MW) | 5 | 5 | 5 | 5 | 5 | 5 | 5 | 5 |
| Torque per volume (KNm/m3) | 76.7 | 76.4 | 81 | 76.2 | 66 | 59 | 72 | 70 |
| Torque per mass (Nm/kg) | 28.18 | 29.2 | 29.78 | 27 | 20.5 | 12.5 | 24.2 | 27.8 |
| Cost (pu) | 0.94 | 0.88 | 1.01 | 1.1 | 1.18 | 1.9 | 0.98 | 1 |
| Disclaimer/Publisher’s Note: The statements, opinions and data contained in all publications are solely those of the individual author(s) and contributor(s) and not of MDPI and/or the editor(s). MDPI and/or the editor(s) disclaim responsibility for any injury to people or property resulting from any ideas, methods, instructions or products referred to in the content. |
© 2024 by the authors. Licensee MDPI, Basel, Switzerland. This article is an open access article distributed under the terms and conditions of the Creative Commons Attribution (CC BY) license (https://creativecommons.org/licenses/by/4.0/).


