Article

Indicators of Potential Use of Electric Vehicles in Urban Areas: A Real-Life Survey-Based Study in Hail, Saudi Arabia

by
Abdulmohsen A. Al-fouzan
1 and
Radwan A. Almasri
2,*
1
Renewable Energy Engineering Program, College of Engineering, Qassim University, Buriadah 51452, Saudi Arabia
2
Department of Mechanical Engineering, College of Engineering, Qassim University, Buriadah 51452, Saudi Arabia
*
Author to whom correspondence should be addressed.
World Electr. Veh. J. 2024, 15(3), 108; https://doi.org/10.3390/wevj15030108
Submission received: 9 February 2024 / Revised: 7 March 2024 / Accepted: 7 March 2024 / Published: 9 March 2024

Abstract

:
This study aimed to uncover the attitudes, preferences, and perceptions of Hail residents toward electric vehicles (EVs) by employing a real-life survey-based approach. This paper presents an in-depth analysis of the potential adoption and impact of EVs to clarify the picture of the transition from using traditional vehicles to using EVs in Hail City, Saudi Arabia. Hail is rapidly becoming a more urbanized city; in the past few decades, the city’s area has expanded from 3242 to 17,526 hectares, and its population has increased dramatically from 82,900 in 1984 to 344,111 in present day. As a result, the city is facing increasingly difficult challenges related to rising vehicle emissions and environmental degradation. A survey was conducted among a diverse group of 346 participants. The survey results show an average of 3.15 cars per family, which indicates a strong connection with personal vehicles. The survey provides a comprehensive picture of the respondents’ socioeconomic background, indicating an average household size of 5.8 people and an average monthly income of SR 13,350. The key findings from the survey reveal that approximately 52.3% of the respondents have 3–4 family members, and nearly half of the families own one or two cars. Government employees formed a major proportion of the respondents. The results show a significant inclination toward EVs, with 78.6% of the participants being aware of EV charging stations and 37.9% expressing a positive attitude towards switching to electric vehicles. Despite this, a large majority (88.7%) have never driven an electric car. The respondents’ driving habits are further explored in the survey, which reveals an average of 2.1 h of daily driving. Furthermore, the respondents disclosed an average weekly fuel expenditure of SR 235. The results also highlight that the average weekly cost for fuel varies among the respondents, with most respondents spending no more than SR 300 per week. Additionally, this study examined the daily vehicle mileage, revealing that 37.9% of the respondents have a daily mileage of 51 to 100 km, which impacts the planning of charging station capacities and locations. The findings suggest a growing interest in EVs and highlight the need for strategic infrastructure development to support the anticipated surge in EV adoption.

1. Introduction

Electric vehicles (EVs) emit no emissions from the exhaust, but the energy mix used to generate the power needed to charge them typically does. Sustainable mobility services are essential to raising the standard of living in metropolitan regions to address issues associated with urban mobility, such as increasing air pollution, noise pollution, traffic congestion, and greenhouse gas emissions (GHG) [1,2,3].
The sales of EVs have experienced a remarkable surge since their introduction to commercial markets in the early years of the last decade. In 2010, the global number of EVs on the roads was approximately 17,000. However, by 2019, this figure had skyrocketed to 7.2 million, with around 47% of EVs being registered in China. Moreover, nine countries had exceeded the milestone of 100,000 EVs in circulation, while at least twenty countries achieved market shares surpassing 1%. This substantial growth reflects the increasing adoption and popularity of EVs worldwide [4]. Figure 1 shows that the number of EVs increased significantly globally during the period from 2010 to 2020. This calls for a need to study the use of EVs in general. User opinions also play an important role in the transition from traditional cars to EVs. This work aims to clarify the opinions of Saudi society—in this case, Hail City—on the adoption of EVs. The findings may not only shape the future of transportation in Hail but also serve as a blueprint for other urban areas grappling with similar sustainability concerns.
The Kingdom of Saudi Arabia (KSA) is a sovereign nation located in the Middle East on the Arabian Peninsula. It covers an expansive area of approximately 2.15 million square kilometers, making it the largest country in the Middle East and the 13th largest in the world [6,7]. With a population of over 34 million people, the KSA has experienced substantial growth over the years [6]. The KSA has long been renowned for its abundant reserves of fossil fuels, particularly oil [8]. The KSA’s vast solar resources make it particularly suitable for solar photovoltaic (PV) technology [9]. The KSA can unlock numerous benefits by harnessing its solar potential, including reduced GHG emissions, improved air quality, energy diversification, and enhanced energy security. The government has embarked on an ambitious RE plan to generate 50% of the country’s electricity from renewable sources by 2030 [10,11,12]. This plan includes significant investments in solar and wind power projects and the development of a robust infrastructure to support RE integration [12]. The Saudi Standards, Metrology, and Quality Organization published a standard governing the use of EVs in the KSA in 2018 [13]. The nation started its green drive in 2021 to lessen the effects of climate change. One of the initiatives is to raise the proportion of EVs to 30% of all vehicles in Riyadh [14].
Figure 2 shows the balance between the production, consumption, and imports of energy resources in the KSA in 2018. The graph indicates a gross of 586.3 Mtoe in oil production, 43.4 Mtoe in oil product import, and 79.1 Mtoe in natural gas production, with the total export being 492.4 Mtoe in 2018. There were also statistical differences and stock changes. In the KSA, Fahmy et al. [15] projected an electric consumption of 399.2145 TWh in 2020; consumption will rise to 496.1887 TWh by 2025. The share of energy-related CO2 emissions in the KSA from the transport sector was 19% in 2018. This share was high compared to other G20 countries but had reduced by 25% in the period 2014–2019 [10]. It is also critical to note that the KSA already has a few electric vehicle charging stations (EVCSs) built and recently announced that it will begin producing EVs.
User acceptability is the key to the success and widespread use of EVs. Nevertheless, there is currently a dearth of real-world research to evaluate user acceptance and behavioral intention toward EVs. Hence, the importance of this research is to clarify the image among users of private traditional cars about the possibility of converting to EVs in Hail City in the KSA.
The paper is divided into a literature review in Section 2, the methodology in Section 3, the results and discussion in Section 4, the limitations of the study in Section 5, and the conclusion in Section 6.

2. Literature Review

There are few research studies on the potential of EVs in cities, especially real-life survey-based analyses. These studies tell us about what makes people want to buy EVs and the problems they face. The literature documents the global trends in EV adoption, highlighting the increasing interest and market share of EVs in different urban areas. Lee and Clark [16] examined additional developments needed for EVs to have a significant impact on auto fleets. They used various gasoline and battery costs as well as discount rates to compare the costs of batteries for cars, plug-in hybrids, and internal combustion engine vehicles. According to their analysis, battery-only vehicles are very financially viable, although plug-in hybrids are generally more expensive than automobiles with internal combustion engines (ICEs). Milligan et al. [17] investigated the performance of EVs that were operated over short- and long-range tests in Scotland, United Kingdom (UK). The results reveal that the actual performance of an EV’s range could be seventeen percent lower than the actual mileage predicted by the EV’s manufacturer.
The literature also addresses the challenges and barriers hindering widespread EV adoption. Because of their economic and environmental benefits, wind and solar energy are regarded as reliable substitutes for traditional energy sources, and it can be argued that they are the most suitable sources for the charging infrastructure of EVs, as reported by Alkawsi et al. [18]. According to economic research, although EVs have initial costs that are higher than those of ICE cars, the operating costs and environmental advantages can differ greatly depending on the energy mix and local electricity prices, as reported by Rapson and Muehlegger [19]. Ottesen et al. [20] investigated Kuwaiti ICE drivers’ opinions regarding EVs, focusing on EV characteristics, features, enablers, and barriers. According to the study, more than half of the participants would purchase an EV over the next three years, provided several requirements were satisfied.
Numerous studies have explored consumer attitudes and perceptions toward EVs. Saputra and Andajani [21] used an online questionnaire to examine the effects of attitudes, subjective norms, behavioral control perceptions, moral norms, environmental awareness, financial incentive policies, and risk perceptions on the desire to adopt EVs in Indonesia. The findings suggest that subjective norms and attitudes do not substantially affect intentions to adopt EVs. However, financial incentives, moral standards, perceived behavioral restraints, and environmental concerns all have a positive and considerable influence on readiness to use EVs. Three categories were used by Shrestha et al. [22] to group research studies on range anxiety among EV users: user perceptions, range-affecting factors, and mitigation techniques. Consumers are dubious about modern EVs’ ability to fulfill daily needs, notwithstanding their capabilities. In 2021, Schelte et al. [23] conducted an exploratory study on the acceptance of battery switching and solar CSs (charging stations) by users in Germany. According to the authors, between 50 and 80 percent of prospective users of sharing systems want to embrace solar CSs and battery-swapping stations. The majority of respondents (71–77%) agreed that they think solar charging and battery-swapping stations are easy to use. Ninety-six percent of respondents believed that inductive charging for solar CSs is easy to use. According to the authors, most respondents would find a discount between 10% and 20% off the next sharing trip to be an adequate incentive. More females than males plan to utilize solar CSs, while more male respondents want to use battery-swapping stations. Aguilera-García et al. [24] conducted a preliminary investigation on the demand for moped sharing in Spain. Their study offers a better understanding of the shared moped industry and its potential effects on urban transportation. The findings suggest that the primary drivers of the future prospective use of these services appear to be age, occupation, income, and environmental consciousness. By surveying EV owners and non-owners alike and establishing a link between range anxiety and the ideal distance between nearby CSs, Pevec et al. [25] were able to quantify range anxiety. While the majority of the respondents who do not own an EV are from Croatia, the bulk of EV owners are based in the US or the UK. The average ideal distance between nearby CSs was determined by both participant groups to be approximately 7 km, as reported by the authors. Khaleghikarahrodi et al. [26] explored the idea that the charging behavior of EV users might be significantly influenced by battery size. The authors discovered that users with batteries larger than 21 kWh may go farther between charges as they often put off charging. Thirteen percent of US adults stated that they do not plan to buy a car, and half said that they are not too or not at all inclined to consider buying an EV. Compared to May 2022, the percentage of the population interested in buying an EV has decreased by 4 percentage points in 2023 [27]. In 2019, Bienias et al. [28] surveyed to find out the preferences of Polish automobile buyers. According to the authors, 80.8 percent of the respondents had purchased a car with a conventional engine, just 1.9 percent had opted for an EV, and 3.8 percent had purchased a hybrid electric vehicle (HEV). Just 3.8% of the participants stated that they were undecided, while 9.6% stated that they had not decided to buy any kind of car. The primary barrier appears to be the expense of EVs and HEVs. Customers anticipate receiving a tax break or subsidy to lessen their financial burden. Ruan and Lv [29] analyzed public perceptions of EVs expressed on online social networks (OSNs) based on two large datasets collected from Reddit and Twitter. The authors speculated that the public’s views on EVs and relevant topics may differ across different OSNs. Except for the mega-influencer Elon Musk, the results show that the two main groups of important people influencing EV conversations are politicians and the news media. Despite the public’s generally negative reaction towards EVs, the authors found that legislators have become more positive during these discussions. An investigation into the potential use of EVs among participants from five different KSA regions was conducted by Almutairi [30] using a survey. This study asked about the respondents’ age, gender, place of residence, type of car they drove, the likelihood of purchasing an EV, typical journey distance, points of departure and arrival, and preferred location for auto charging. After being presented, the data analysis revealed that more than 80 percent of the participants were either definitely inclined or probably inclined to acquire an EV within the following five years. This study also showed that about 28% of families have three cars, and less than that have one to two cars; on the other hand, about 10% have more than five cars.
A total of 61 percent of EV owners in the EU charge their EVs at home, while fifteen percent charge their EVs at work. According to Bailey et al. [31] in Canada and Almutairi [30] in the KSA, the home was selected by over 60% of the participants as the best location for EV charging. A study by Todts and Mathieu [32] found that nearly 25% of EVs are charged using public chargers. The percentage of home charging is anticipated to decrease from 61% in 2020 to 45% in 2030. Obstacles that prevent the adoption of EVs remain in place despite their apparent cost reduction when compared to conventional cars. The opinions of Dutch EV drivers regarding vehicle-to-grid were examined by Van Heuveln et al. [33], who also provided details on the factors influencing drivers’ adoption of this technology. The authors discovered that remuneration, transparent system operations, and reliable user control are the most important factors in encouraging user adoption. Sendek-Matysiak and Łosiewicz [34] listed several incentives that can help EV adoption become more widespread, including tax breaks, the ability to install wall chargers in customers’ homes, unrestricted access to highways, additional co-financing for EV purchases, and the reimbursement of a portion of the purchase price. The consequences of adopting electrified passenger automobiles in Regina, Canada, were studied by Xu et al. [35]. Their survey found that most Regina residents support wind farms, and 25% said they would install solar panels on their roofs even if they were not paid for doing so. Wang et al. [36] evaluated customer acceptability of EVCSs in Hangzhou, China, to understand the mechanisms underlying acceptance and improve user adoption. Assessments were carried out to examine the variables influencing acceptance willingness and differences in EVCS acceptance among social groups. The results showed that 81.2 percent of the participants were willing to use EVCS.
Almohaimeed [5] conducted a statistical analysis of the effect that EV charging has on the KSA’s electricity grid. According to the data, EV peak loads happen in the late evening and early morning. It is interesting to note that this research study demonstrates that the off-peak hours of the daily load curve correspond to the peak EV periods. Accordingly, a large EV population can improve and provide flexibility to the country’s electric grid; also, the cumulative EV load of a large EV population follows a smooth pattern and does not affect the country’s electric system. This is consistent with Sheldon and Dua’s findings [37]. In that study, most participants said that they visited a gas station once or twice a week, and the majority (more than 70%) of the respondents said they traveled between 10 and 60 km per day. By taking into account the energy mix, Elshurafa and Peerbocus [38] calculated the net carbon emissions related to the deployment of EVs in the KSA. The Kingdom intends to use a significant quantity of RE. The social and economic benefits could increase if policies promoting RE sources and EV deployment are taken into consideration at the same time. In contrast, a net rise in emissions occurs in the worst-case scenario. The findings also show that there is no discernible difference in emission reduction between the time that EVs are charged and other factors. Although time-of-use pricing can still be used to alleviate some of the loads on the power system by moving charging to off-peak hours, it is not a viable strategy for encouraging the reduction in emissions.
Urban planning and infrastructure development play a crucial role in shaping the feasibility of EV integration. Mishra et al. [39] reviewed the latest developments in planning, designing, and operating the CS for the use of EVs. They addressed ways to use RE resources to produce the needed energy. The development of EVs and their charging infrastructure can lower this sector’s harmful emissions, but more research is necessary to determine the potential damage this sector could cause. The authors concluded that the acceptance of EVs is influenced by the lack of proper batteries that can carry enough energy for an elongated distance and length of time. Charging EVs from solar PV systems offers two significant advantages: sustainability and economics. Solar-powered EV charging demonstrates higher energy efficiency, lower net emissions, and reduced environmental impact compared to conventional methods [40,41]. Furthermore, the declining costs of PV systems have already made solar PV electricity more affordable than conventional electricity in many regions worldwide. In certain car segments, the total cost of ownership for an EV is already lower than that of a comparable internal combustion engine vehicle [41].
After reviewing the available literature on the opinion of users of EVs, it was found that there is no study on this in Hail City in the KSA, so this study provides a local perspective on the possibilities of using EVs.

3. Methodology

In this work, the opinion of private car users about EVs will be examined. The following paragraph will explain the questionnaire used to obtain users’ opinions. Geographic and climate data will also be clarified due to their impact on the use of EVs.

3.1. Study Questionnaire

A quantitative and descriptive research approach was used to gather preliminary information about local transportation options, expenses, EV usage, and implications. For this purpose, a questionnaire was designed in Arabic (the questionnaire was translated into English as shown in Appendix A). The response options listed in the questionnaire are detailed in Appendix A. This allowed researchers to learn more about the degree of awareness regarding EVs in Hail City, KSA. A Google survey was disseminated within the Hail City community using the questionnaire method. The survey link was distributed to social media groups of society, and the response was good and satisfactory in all respects. The questionnaire was provided with sufficient explanations and the possibility of referring to the researchers in the event of any questions. After two weeks of making the questionnaire available, three hundred and forty-six participants’ complete responses were obtained, and no responses were excluded. The questionnaire asks questions about preferences, usage habits, travel habits, understanding of EVs, and other facets of car ownership. These questions are presented in Table 1. The questions are categorized to obtain in-depth information from the locals. The categories are as follows:
Information about general resident information;
Vehicle details and usage;
Driving habits; and
Public transportation and EV awareness.
Responses to these questions contribute valuable data to the research, aiding in gaining a deeper understanding of transportation patterns and the potential for EV adoption in Hail City. Table 1 presents the questions that have been categorized into four groups. The weighted average value of the indicators obtained from the questionnaire was determined according to the following formula:
M = i = 1 N ( x i × w i ) i = 1 N ( w i )
where
xi = number of indicators;
wi = percentage of indicators; and
N = number of options.

3.2. Geographic Information

The capital of the Hail Region is Hail City (27°31′ N 41°41′ E), which is situated in northern Saudi Arabia. It is well known for its major contributions to agriculture, especially in the production of wheat. Natural scenery and historical landmarks, such as Jubbah and Shuwaymis, which have prehistoric rock art, are among the United Nations Educational, Scientific and Cultural Organization World Heritage sites around the city. Hail City’s character and significance in the region are defined by its agricultural economy and historical and ecological significance [42]. The demographic information of Hail City’s population is compiled from reliable sources, including official documents, census data, and surveys. Over time, there have been significant changes to Hail City’s urban development phases. The augmentation of community services, the growth of the population, and the construction of infrastructure are indicative of these trends. Hail was formerly a tiny community, but it has recently witnessed rapid population expansion. To fulfill the changing needs of the city and its citizens, the expansion of services and infrastructure is necessary. The area coverage of the city underwent a notable increase throughout a three-decade period. As seen in Figure 3, the city covered 3242 hectares in 1984, which was sufficient to accommodate the population of 82,900 persons living there. Significant expansion occurred as a result of development and urbanization as time went on. The city expanded to 6602 hectares by 2009, a reflection of a rapidly expanding city. However, in 2014, the acreage exploded to a massive 17,526 hectares, making the transition more apparent. Alongside this significant growth, the population of the city also increased significantly to 746,046 people in 2020 [43]. This development highlights how the urban and demographic landscape of the city is dynamic and characterized by significant expansion and development. A thorough depiction of Hail City’s population density, expressed in people per hectare, can be found in Figure 4. An essential metric for urban growth and planning is population density. This metric facilitates the evaluation of service distribution, infrastructural needs, and overall urban sustainability.

3.3. Climate Data

Meteorological data were procured from a weather station situated at Hail University for the years 2018 through 2021. The weather station at Hail University is equipped with high-precision instruments capable of continuously monitoring various climatic parameters. For the scope of this study, we specifically focused on the following parameters:
Air temperature (°C);
Wind speed (m/s); and
Relative humidity (%).
To provide a better understanding and facilitate ease in pattern recognition, the daily data gathered over the years were further processed to obtain the monthly averages. This approach offered a simplified yet comprehensive snapshot of weather variations and their potential influence on solar power generation and EV charging efficiency. Figure 5 provides a comprehensive visualization of the monthly averaged data for air temperature, wind speed, and relative humidity for 2018–2021. This combined representation offers an immediate comparative insight into the interrelation of these parameters and their fluctuations throughout the years. The monthly average temperature is between 16 and 35 degrees Celsius throughout the year. May through October is considered the hot season, with an average monthly temperature of roughly 35 °C. August is the warmest month in Hail City, while January is the coldest. The monthly average wind speed showed that the relative humidity is highest in January and December and lowest in July, with only a small change in wind speed of up to 5%. The effect of temperature may have a significant impact on the effectiveness of EVs, which may hinder their spread. In addition to affecting the battery’s operation, energy is required to air condition the car’s cabin under high temperature conditions. We must mention here that the temperature during the day in summer may reach 50 °C. The average annual solar global horizontal irradiation in the region is estimated to be about 2000 kWh/m2, which may help to benefit the efficiency of solar energy production in charging EVs.

4. Results and Discussion

This section explores and interprets insights from this study to determine community opinions about EVs in Hail City. The intention is to facilitate a smooth transition from raw data to actionable insights, thereby presenting a clear and straightforward path toward the deployment of a robust solar CS network. The results of the questionnaire were analyzed concerning the current situation of the transportation sector, the extent of society’s acceptance of EVs, and the need for infrastructure to charge this type of vehicle that is expected to be widely adopted soon.
A quantitative and descriptive approach was used to collect initial data regarding transportation modes, costs, EVs, and the implications of EV adoption and to gain insight into the level of awareness of EVs in the local community in Hail City, KSA. A questionnaire method was used to obtain initial data for the concepts tested in this study, and a Google survey was distributed to the local community. The survey was conducted in May 2022 and received responses from 346 participants. The purpose of the questionnaire was to determine the fuel consumption and average mileage of residents. The data collected may be used to estimate the initial requirements for EVCS integration. Various parameters were measured to aid in the development of a predictive model for future EV adoption. Each aspect of the survey is described below.

4.1. General Resident Information

In this section, general residents’ information in Hail City is discussed. To ensure that the sample who responded to the questionnaire lives in Hail, demographic data were analyzed, and it was confirmed that 92.2% of the respondents live in Hail City, as shown in Figure 6a. The average size of families was also assessed. This information, as reflected in the survey findings, is critical in estimating the total number of households, which, in turn, influences the projected number of vehicles in the city. Figure 6b shows that the number of family members reported by the majority of participants ranges from four to seven. Families with 8–10 members are also notable, constituting 27.7% of the survey participants, and the smallest group comprises individuals living alone, representing 2.0% of the survey participants. It was also found that 52.0% of the sample reported one or two family members who use one car in each household (Figure 6c). A smaller percentage of 13.6% reported 5–6 family members sharing vehicles, and a minority of 4.9% reported not owning a car. Fewer participants, at 29.5%, reported 3–4 family members using their car. It is noted from Figure 6d that a quarter of the sample owns one car, and the same percentage of the sample owns two cars. There are 8.1% of respondents who reported more than six cars at home, which agrees with the findings published by Almutairi [30]. Figure 6e shows the respondents’ employment status, showing that the largest group works in the governmental sector (42.8%), followed by the private sector (36.7%). Retired individuals make up 11.8%, while unemployed and self-employed individuals are less common, at 6.1% and 2.6%, respectively. Regarding monthly income, as shown in Figure 6f, the largest segment of the survey participants (41.6%) earns between SR 10,000 and 15,000. Those earning up to SR 10,000 constitute 30.1% and 21.7% earn between SR 15,000 and 20,000. A smaller portion, at 6.6%, reported earning more than SR 20,000.
Formula (1) was used to calculate the averages of the indicators. Table 2 shows the weighted average values for general residents’ information and indicators in Hail City. The findings reveal that the average household size in Hail is approximately 5.8 individuals, which is consistent with the results published by Esmaeil et al. [44]. Almasri et al. [45] reported that the number of family members in the KSA’s Qassim region was 7.3 people. In terms of car ownership, the average is 3.15 cars per family, indicating a high dependency on personal vehicles for transportation needs, which agrees with the findings published by Almutairi [30]. In terms of economic parameters, the weighted average monthly income of the surveyed households is SR 13,350.

4.2. Vehicle Details and Usage

In this section, the results of the usage of vehicles are presented. As shown in Figure 7a, the survey data shed light on the respondents’ usage and car ownership habits. A mere 1.4 percent of those surveyed have an automobile given by their employer, whereas the majority of participants, at 98.6 percent, own a private vehicle. This study investigated the length of time that the participants have held a driver’s license, and the results are presented in Figure 7b. About 15.9% of drivers have one to five years of driving experience, while 13.0% have between 6 and 10 years. With 34.1 percent of the respondents having a driver’s license for 11–20 years and 37.0 percent for more than 20 years, a larger percentage of the sample has more extensive driving experience. Figure 7c shows the participants’ journey times regarding daily car usage. Less than an hour is spent in a car every day by 16.5% of the respondents. About 44.5 percent of the respondents, by far the largest percentage, said they drive for one to two hours every day. A sizable portion of people—28.6 percent—said they spend three to four hours every day in their cars. Four percent of the participants said they drive more than six hours a day, which is a smaller percentage. When it comes to the age of cars, as shown in Figure 7d, the majority of the respondents (39.6%) reported that their cars were manufactured between 2011 and 2015. About 17.6% of the participants reported that their vehicles were manufactured between 2000 and 2010, while 15.9% were manufactured between 2016 and 2017. Of the total automobiles, 12.1 percent of the respondents reported their cars were manufactured in 2020 or later, and 11.0 percent reported their cars were manufactured between 2018 and 2019. Merely 3.8 percent of the respondents said that their automobiles were manufactured before 2000. Regarding the duration of car ownership, a significant 45.1% of participants have been using their current car for more than five years. Those who have had their car for one year represent 15.9%, followed closely by those with two years of ownership at 13.9%. The percentages of respondents who have used their car for three and four years are 12.4% and 12.7%, respectively, as shown in Figure 7e. Using the number of seats as a proxy for vehicle capacity, Figure 7f illustrates that 54.0% of the respondents reported that their cars could fit five or six people. Of the participants, 31.5 percent own a smaller car with four seats, while 13.0 percent own a larger car with nine seats. Only 1.4 percent of the respondents own a vehicle with room for eleven passengers. Figure 7g demonstrates that the majority of car owners utilize gasoline 91, which is used by 80.6 percent of car owners, while 15% reported the fuel used is gasoline 95%, and 2.6% reported diesel. The findings also show that less than 2% of the respondents use a hybrid car. Regarding weekly fuel consumption, Figure 7h shows that the largest group of participants, at 29.2%, uses between 51 and 100 L of fuel. This is followed by 16.2% of participants who use 101 to 150 L and 12.7% who use 0 to 50 L. Notably, 18.2% of the respondents are unsure about their fuel consumption. In terms of weekly fuel expenses, as shown in Figure 7i, a significant portion of the respondents, at 38.7%, spend between SR 151 and 300. Another large group, at 38.4%, spends between SR 0 and 150. The survey data show that 13.3% of the participants spend between SR 301 and 500, and a smaller group of 3.8% spend between SR 501 and 600. The findings also show that about 5% spend more than SR 600 per week.
Additionally, the weighted average values of the indicators were computed using Formula (1). The mean values for the vehicle details and usage indicators are displayed in Table 3. The daily driving duration averages 2.1 h, reflecting significant engagement with personal vehicles for daily commutes and activities. Financially, the respondents spend an average of SR 235 per week on fuel.

4.3. Driving Habits

In this section, travel options for the community in Hail City are presented. As seen in Figure 8a, 88.7 percent of the respondents said that their main usage of automobiles is for all purposes, which can include personal errands, commuting, and other activities. The percentage of respondents reporting that their cars are used only for work and shopping is far lower, at 8.1 percent and 3.2 percent, respectively. In terms of car types, as shown in Figure 8b, the vast majority of respondents, 94.8%, drive private sedans. Special cars and trucks are less common, at 2.3% and 2.9%, respectively. Regarding engine capacities, a sizable portion of participants—55.8 percent—do not know the engine capacity of their vehicles, as shown in Figure 8c. Of those who are aware, 19.7% drive vehicles with an engine capacity between 2001 and 3000 CC, 11.6% reported an engine capacity between 3001 and 4000 CC, and 12.4% reported an engine capacity of more than 4000 CC. The percentage of respondents with a car with an engine capacity between 1001 and 2000 CC was only 0.6%. The survey data show that the majority of the respondents, at 37.9%, travel between 51 and 100 km per day, as shown in Figure 8d. The next largest group, at 30.9 percent, makes daily trips of 26 to 50 km, which agrees with the findings published by Elshurafa and Peerbocus [38]. A smaller proportion, at 13.9 percent, travel between 101 and 250 km daily, while 12.7 percent of the participants travel less than 25 km. At 4.6% of the respondents, the lowest proportion is among those who travel more than 250 km every day. As evident in Figure 8e, the majority of the respondents (44.8%) stated that their typical driving speed in urban areas is between 51 and 80 km/h. A sizable number of participants, at 34.7 percent, drive between 81 and 100 km/h, indicating a propensity for quicker urban driving. Just 16.2 percent of the participants drive between 26 and 50 km/h, and 4.3 percent of the participants keep their speeds below 25 km/h. According to Figure 8f, most people (58.4%) reported driving on highways at a speed between 121 and 140 km/h, while another 29.2 percent reported traveling between 101 and 150 km/h. Only 3.2% of the respondents reported driving less than 50 km/h on highways, and a smaller percentage—9.2 percent—drive between 51 and 100 km/h.
The weighted average values of the indicators were also calculated based on Formula (1). Table 4 shows the mean values for the indicators related to driving behavior. Regarding travel distances, the average trip length is approximately 77.55 km per day, illustrating a considerable daily reliance on personal vehicles for commuting. Data from previous studies [30] in various Saudi locations were compared with this study’s findings on the adoption of EVs in Hail to provide more context. The average driving speed in urban areas is around 66.95 km/h, while on highways, it increases to an average of 116.5 km/h. Appendix B presents a correlation matrix of the indicators.

4.4. Public Transportation and EV Awareness

This section discusses Saudi society’s interest in the possibility of switching to EVs. While the majority of the respondents, at 63.0 percent, would prefer not to utilize public transit, Figure 9a reveals that 37.0% of the respondents indicated they enjoy using it. This suggests that those who participated in the survey are more likely to favor private transportation. The survey data shed light on the respondents’ perceptions of and awareness of EVs. Figure 9b illustrates that a sizable majority of the respondents, at 81.2 percent, are aware that cars may run on electricity. Regarding the adoption of EVs, as shown in Figure 9c, 37.9% of the respondents indicated that they would like to switch from their present car to an electric one. A larger percentage, at 47.1%, reported that they are thinking about buying an EV in the future, indicating a growing interest in EVs, which agrees with the findings published by Almutairi [30]. Merely 11.3 percent of the participants have attempted to drive an EV, indicating a low level of experience with this type of vehicle (Figure 9d). This implies that EV exposure in real life is probably limited. About 15.0 percent of the respondents have driven a hybrid car, which combines electricity and fuel. This means that 85.0 percent of the respondents have never driven a hybrid car, as shown in Figure 9e. As noted in Figure 9f, only 21.4% of the participants had ever seen an EVCS, which may be a reflection of the limited exposure of citizens to EV infrastructure within the KSA.

5. Limitations

This study offers a thorough survey-based analysis to comprehend the potential of EV adoption in a rapidly modernizing metropolis. It focuses on the urban landscape of Hail City in the KSA. In light of growing urbanization and environmental concerns, this study provides insightful information about the viability and acceptance of EVs; however, it is crucial to recognize the significant limitations of this study, which may impact the interpretation and applicability of our findings. These limitations result from several variables that are specific to the setting of Hail City and might not apply to other areas, such as weather patterns, topographical features, the infrastructure of public transportation, and real-life exposure and experience with EVs:
  • Public transportation effect: According to the survey, 63.0% of the participants would rather not use public transportation, and just 37.0% find it enjoyable, indicating a preference for private transportation. This choice could affect how EVs are seen and adopted. Furthermore, although EV integration with current public transportation systems can be a critical component of urban mobility, this aspect of the study is not thoroughly explored.
  • Public EV infrastructure: The current status of EV infrastructure in Hail City is reflected in the fact that just 21.4% of the respondents have seen an EVCS. This suggests that this study’s evaluation of the current EV infrastructure and its suitability for facilitating a widespread switch to EVs is limited.
  • Real-life exposure and experience with EVs: According to the survey, just 11.3% of the participants have ever driven a hybrid vehicle, and 85.0% have never tried an EV. These statistics suggest that the respondents have little real-life exposure to or experience with EVs.
  • High temperature in summer: It should be noted that the temperature during the day in summer may reach 50 °C, which may prevent the spread of EVs in Hail City.

6. Conclusions

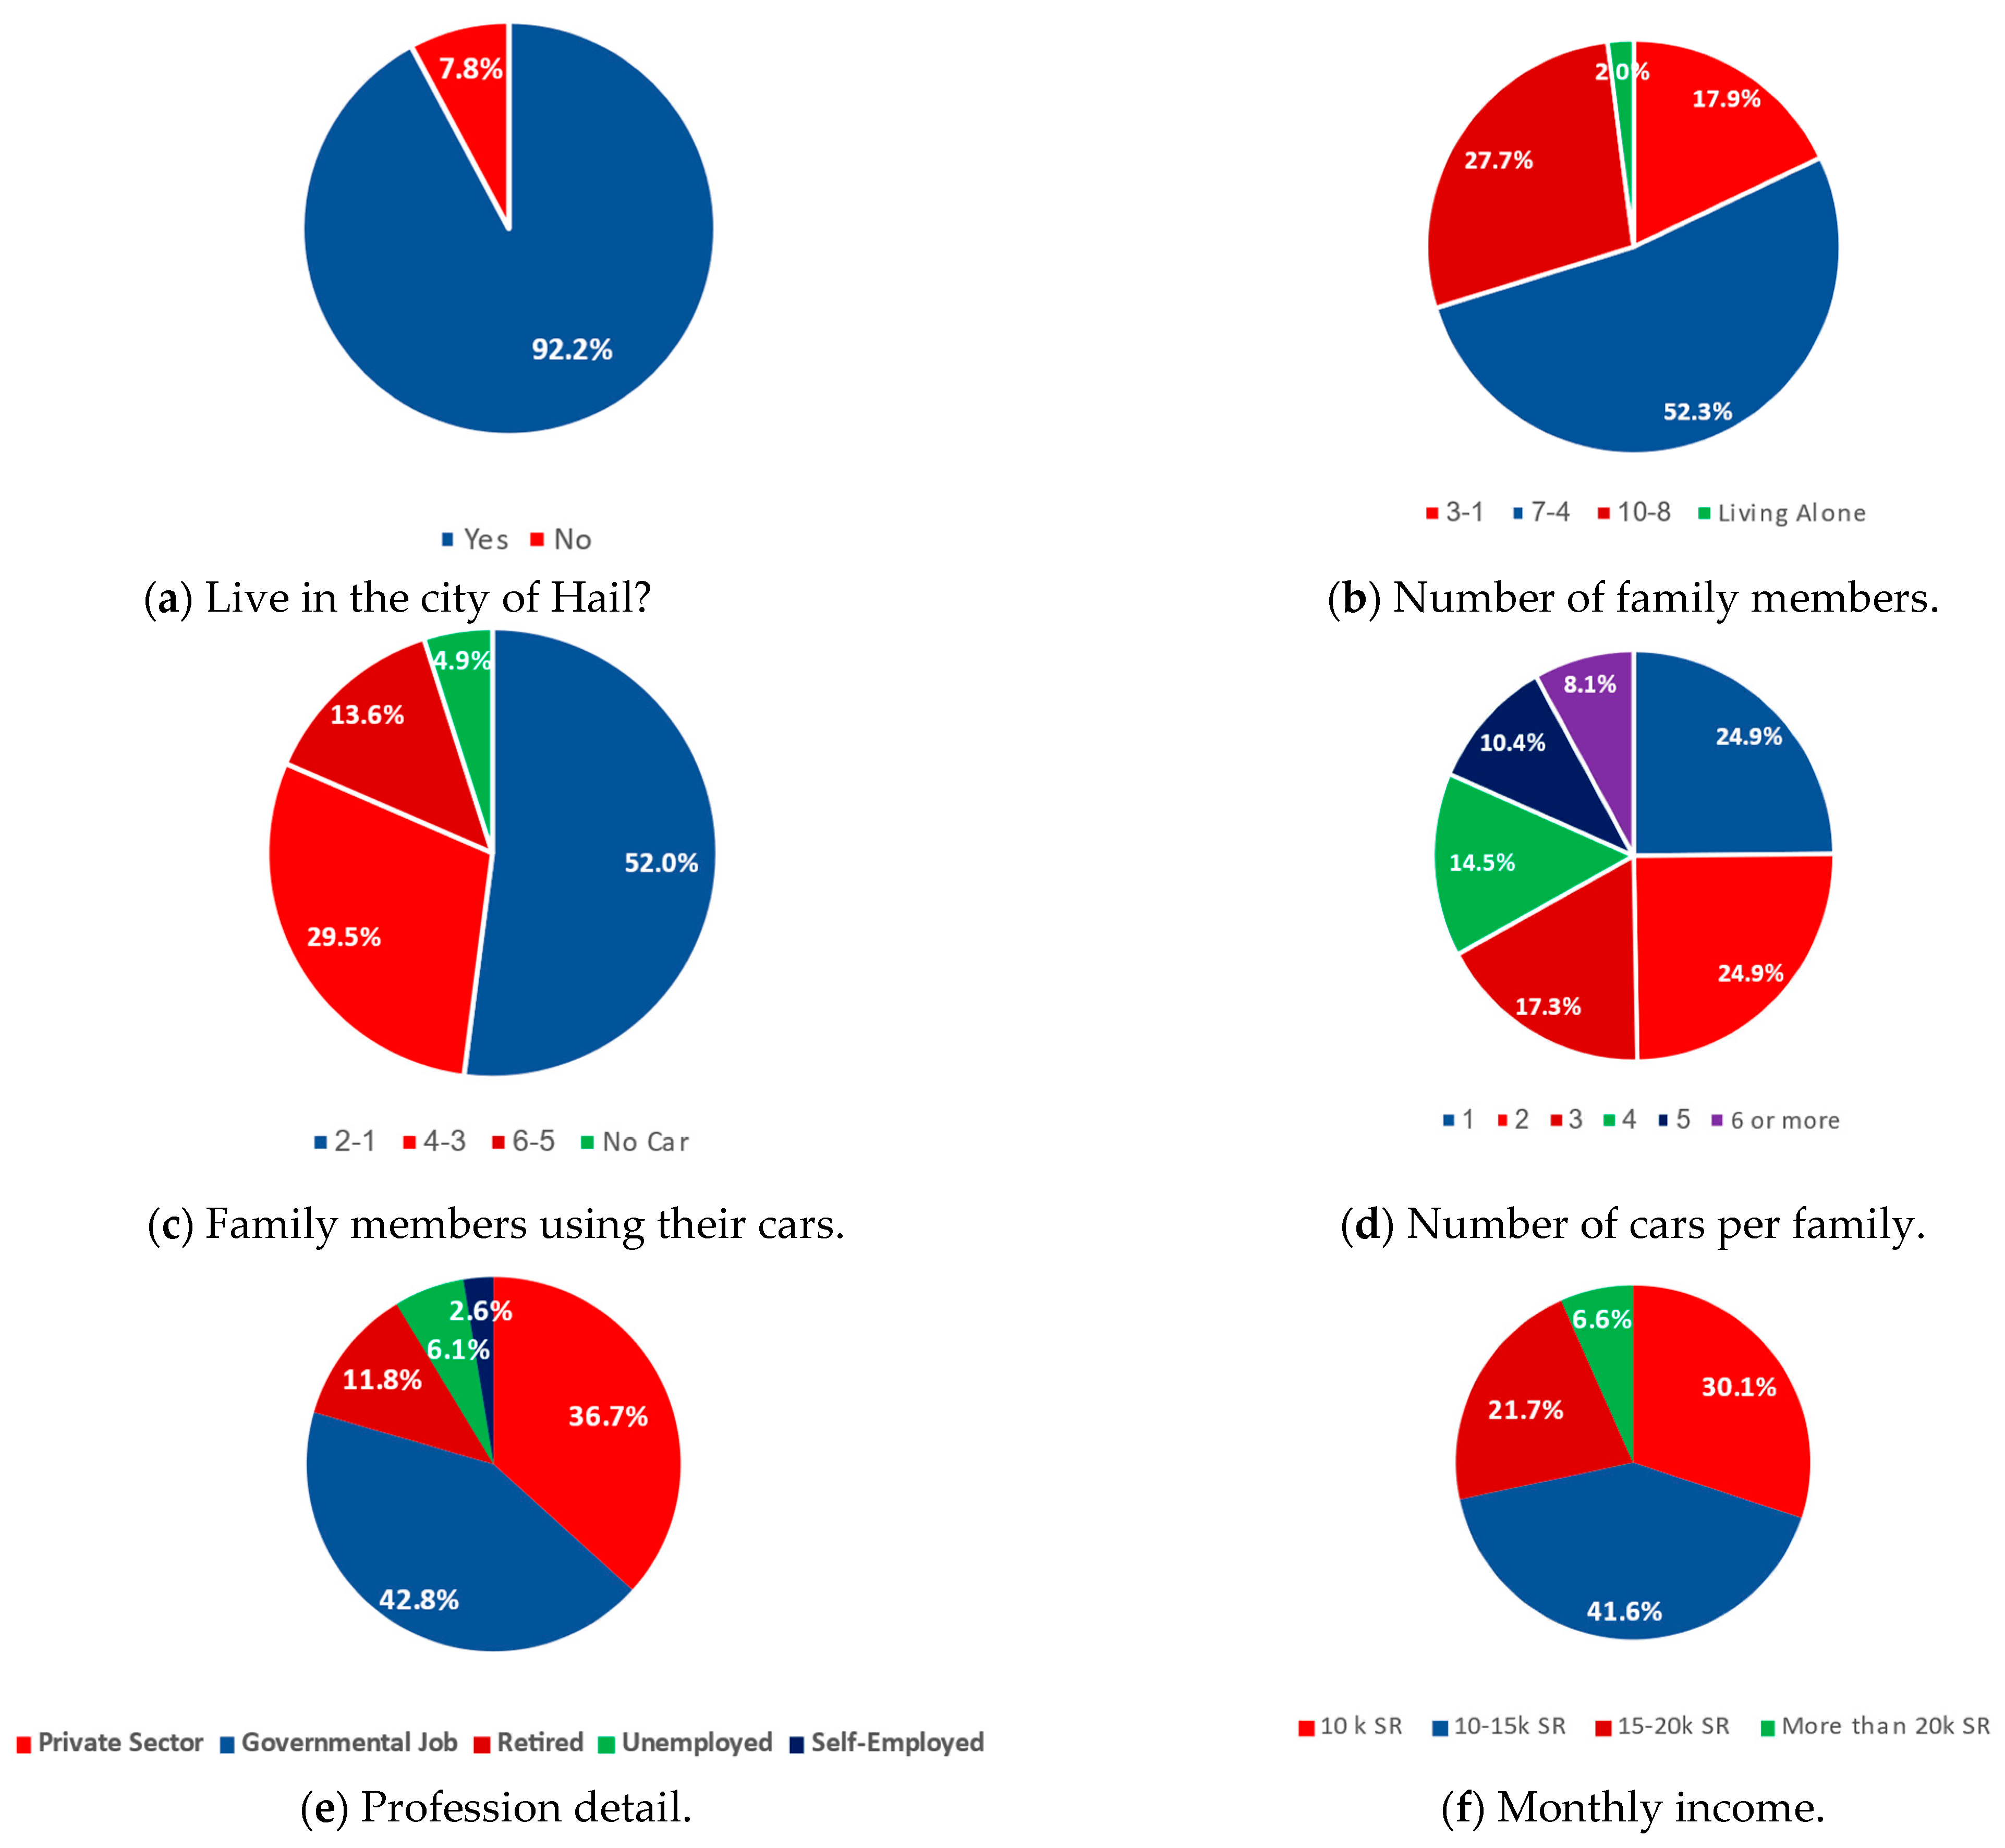
This research study provides critical insights into the adoption of EVs in Hail City, KSA. This study was conducted through a comprehensive survey of 346 participants. It is evident that, while there is a substantial knowledge base, with 81.2% of the participants being aware of the capability of electric power to run cars, direct experience with EVs remains limited, with only 11.3% having ever tried an EV. This survey provides a detailed snapshot of the current private transportation scenario in Hail, with an average car ownership of 3.15 cars per family and an average household size of 5.8 people. Additionally, the residents’ experience with vehicles shows an average of 2.1 h of driving per day. The findings of this study highlight a strong interest in EVs, with 37.9% of the participants considering the adoption of an EV and a significant 47.1% being open to the possibility in the future. The willingness to transition to EVs is further emphasized by the fact that only 15.0% of the participants are resistant to replacing their vehicle with an electric alternative.
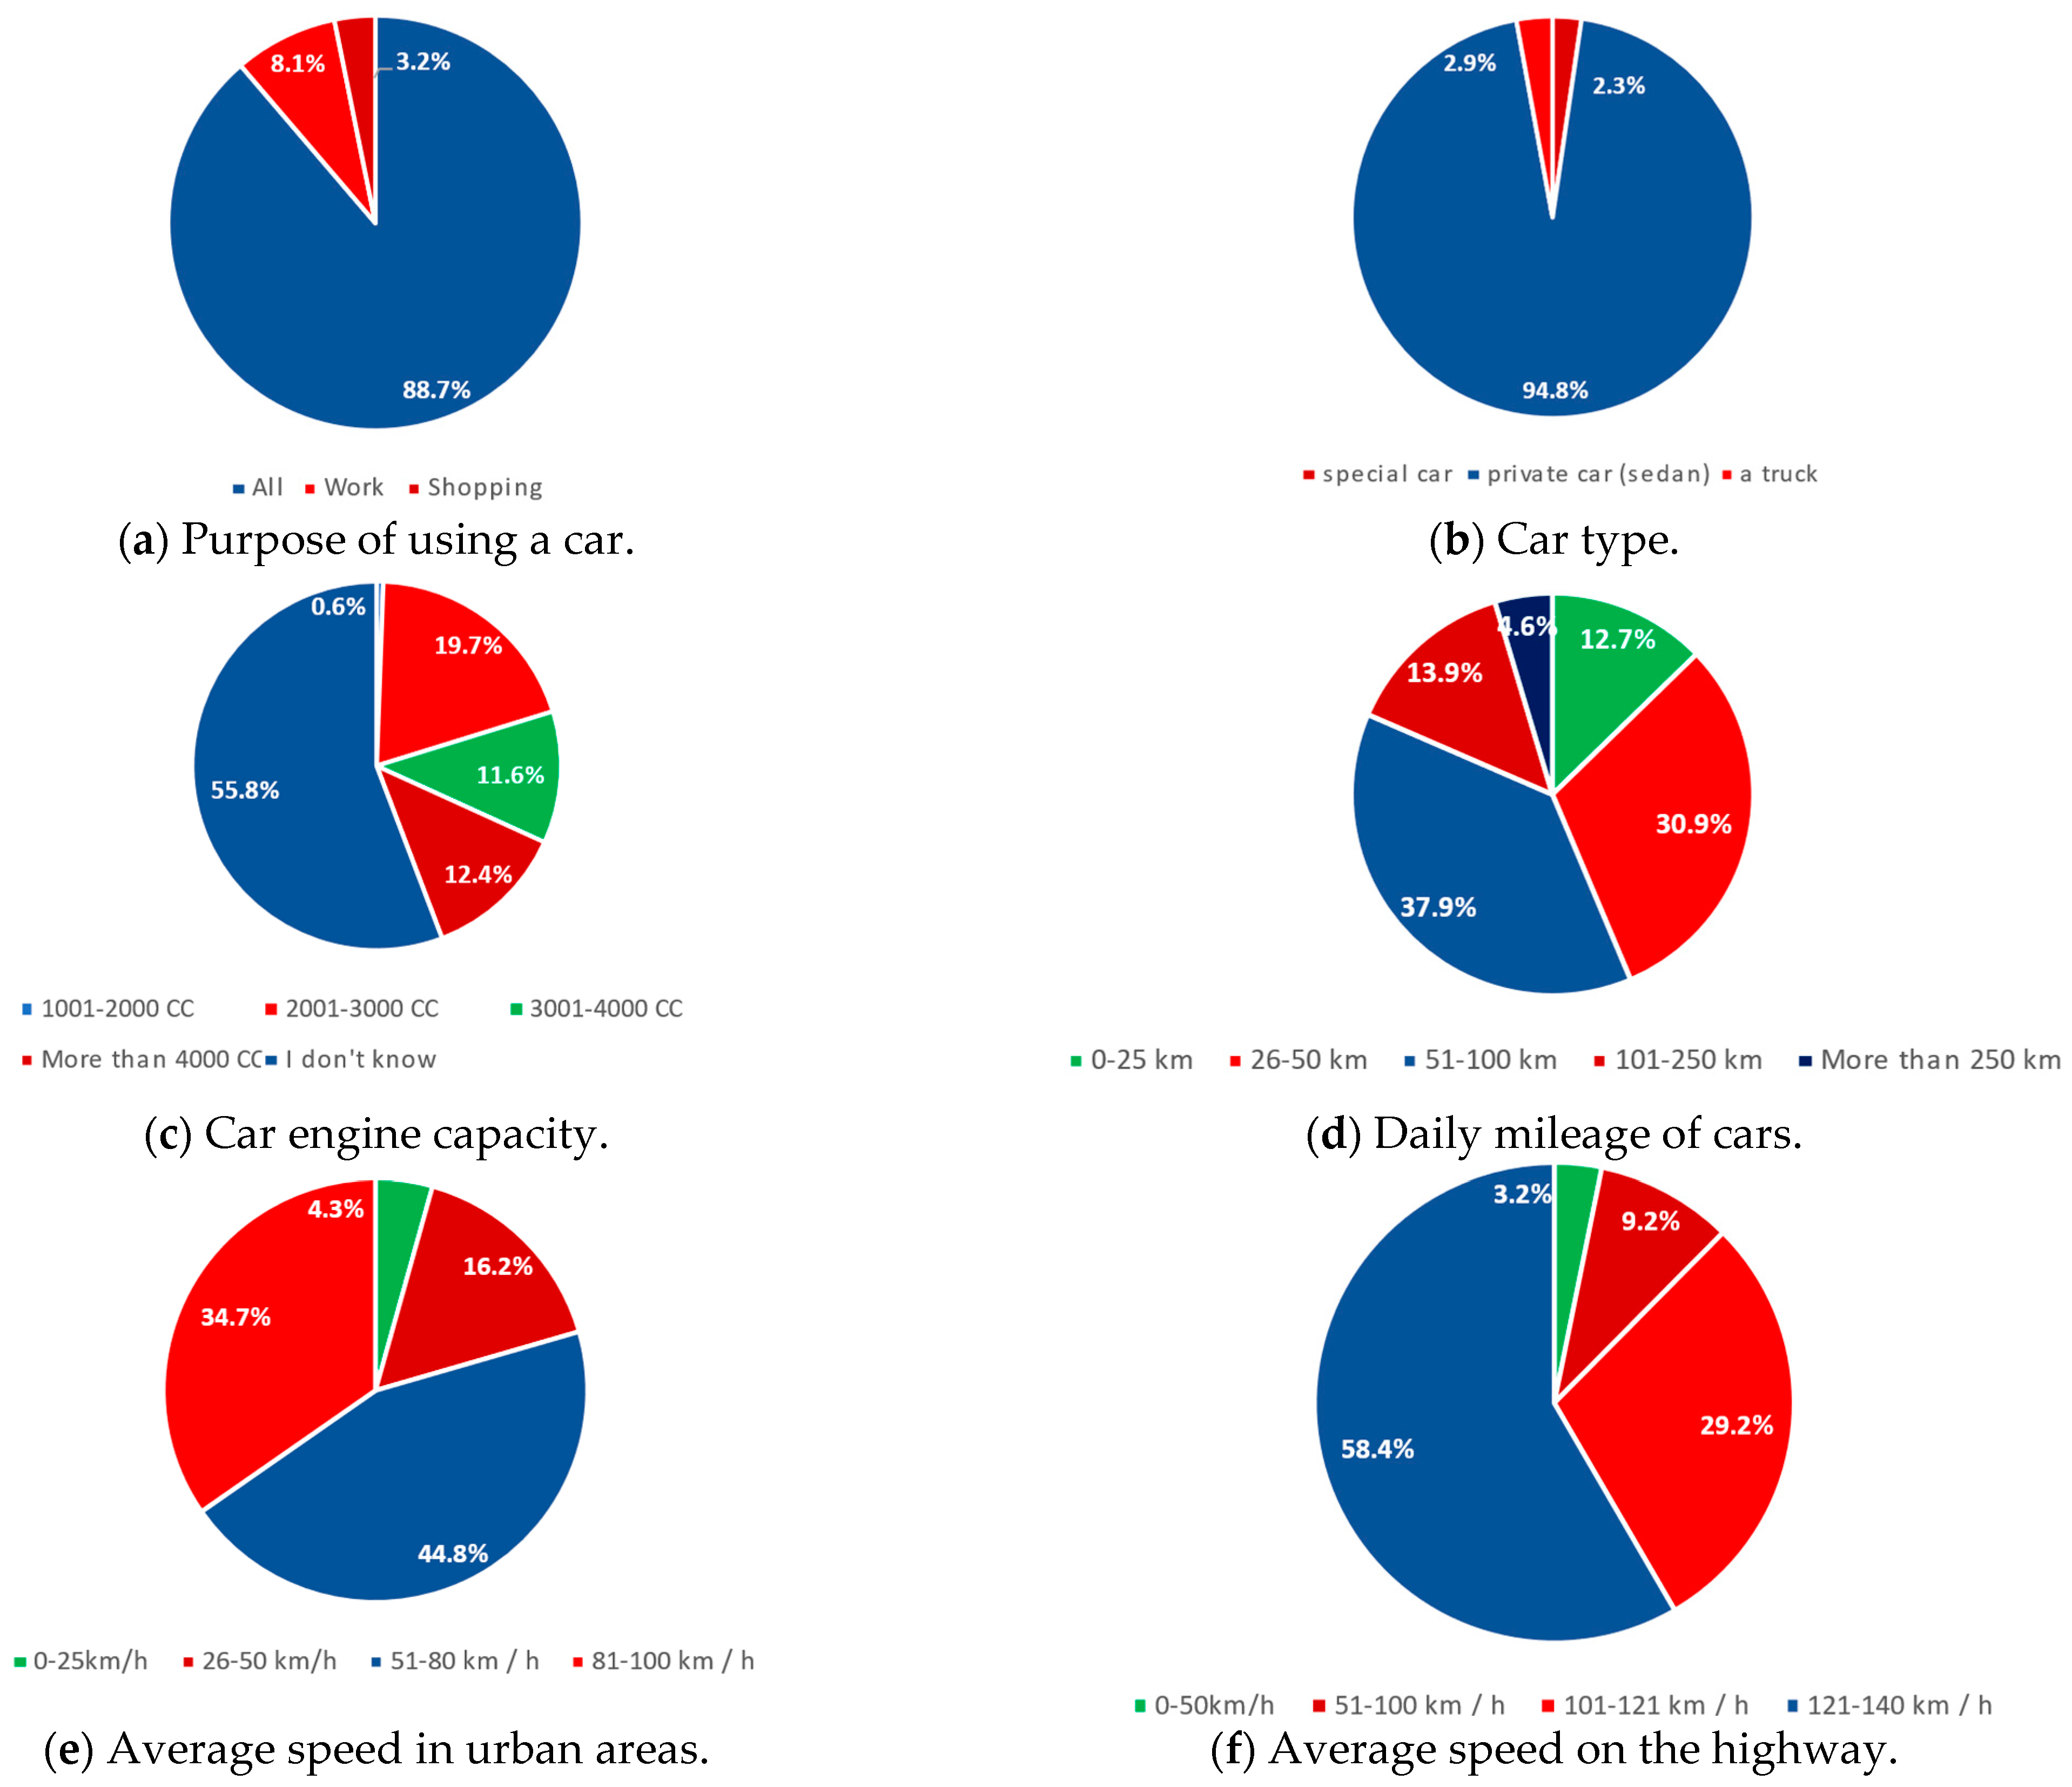
In terms of vehicle specifications, the daily transportation patterns, characterized by an average trip length of 77.45 km and average speeds of 66.95 km/h in urban areas and 116.5 km/h on highways, provide critical insights for planning the EV charging infrastructure. Fuel consumption patterns, as observed in the survey, indicate that the largest proportion of the respondents, at 29.2%, consume between 51 and 100 L per week, and approximately 80% of the respondents spend no more than SR 300 per week on fuel. This expenditure reflects the potential economic viability of EVs when considering the cost savings over traditional fuel expenses. The average weekly fuel cost of SR 235, coupled with the reported average weekly fuel consumption of about 144 L, further underscores the potential cost-effectiveness of EVs in the context of Hail City’s current fuel expenditure patterns. Additionally, the data reveal that 37.9% of the respondents have a daily mileage of 51 to 100 km, a factor that should be accounted for in the planning of CS capacities and locations to accommodate typical daily travel distances. The survey also reveals a pressing need for infrastructural development, with only 21.4% of the respondents having seen an actual EVCS, pointing to a gap in the current charging network, which is a critical component in supporting EV adoption.
In essence, the findings suggest that residents of Hail City are on the cusp of a significant shift toward sustainable transportation, as evidenced by their openness to EVs and their potential alignment with environmental objectives and economic incentives. However, the transition to electric mobility hinges on strategic planning and robust policy support to bridge the gap between interest and actual usage, ensure the development of adequate charging infrastructure, and smooth the path toward a more sustainable and economically viable transportation future.
It is crucial to emphasize that using EVs benefits all nations, including oil-producing nations like the KSA. This is especially true when solar energy is used to charge EVs since it allows for the export of more oil that can be utilized for purposes other than automobile fuel. The financial condition improves as a result of this.
Due to the high temperature during the day in summer in this region, which may prevent the spread of electric cars in this region, it could be an important topic for experimental research on the use of EVs in the future. Also, the high intensity of solar radiation in the region could be an important topic for studying the possibility of connecting charging stations to on- or off-grid solar systems.

Author Contributions

Conceptualization, R.A.A. and A.A.A.-f.; methodology, R.A.A.; software, A.A.A.-f.; investigation, A.A.A.-f.; resources, A.A.A.-f.; writing—original draft preparation, A.A.A.-f.; writing—review and editing, R.A.A.; visualization, A.A.A.-f.; supervision, R.A.A.; project administration, R.A.A.; funding acquisition, R.A.A. All authors have read and agreed to the published version of the manuscript.

Funding

The researchers would like to thank the Deanship of Scientific Research, Qassim University for funding the publication of this project.

Data Availability Statement

The original contributions presented in the study are included in the article, further inquiries can be directed to the corresponding author.

Conflicts of Interest

The authors declare no conflict of interest.

Abbreviations

CCCubic centimeters
CO2Carbon dioxide
CSCharging station
ELDVElectric light-duty vehicles
EVElectric vehicles
EVCSElectric vehicle charging station
GHGGreenhouse gas
HEVHybrid electric vehicle
ICEInternal combustion engine
KSAKingdom of Saudi Arabia
kWhKilowatt-hours
LCOELevelized cost of energy
MtCO2Megatons of carbon dioxide
MtoeMillion tons of oil
OSNsOnline social networks
PVPhotovoltaics
RERenewable energy
SRSaudi Riyals (1$ ≈ 3.77 SR)
TWhTerawatt-hours
UKUnited Kingdom
USUnited States

Appendix A. Survey Questionnaire

1. Do you live in Hail?
□ Yes□ No
2. How many family members?
□ 1–3□ 4–7□ 8–10□ Living Alone
3. How many family members use their car?
□ 1–2□ 3–4□ 5–6□ No Car
4. How many cars does your family own?
□ 1□ 2□ 3□ 4□ 5□ 6 or more
5. What is your current job?
□ Private Sector□ Governmental Job □ Retired□ Unemployed□ Self-Employed
6. Monthly income?
□ 10 kSR□ 10–15 kSR□ 15–20 kSR□ More than 20 kSR
7. Is your car private or provided by work?
□ Private□ By Work
8. How long have you held a driver’s license?
□ 1–5 Years□ 6–10 Years□ 11–20 Years□ More than 20 Years
9. How many hours do you spend by car per day?
□ <1 h□ 1–2 h□ 3–4 h□ More than 6 h
10. What is the date of manufacture of your car?
□ Before 2000□ 2000–2010□ 2010–2015□ 2016–2017□ 2018–2019□ 2020 or later
11. How many years have you been using your current car?
□ 1 Year□ 2 Years□ 3 Years□ 4 Years□ > 5 Years
12. What is the number of seats for your car?
□ 4□ 5–6□ 9□ 11
13. What type of fuel do you use for your car?
□ Gasoline 91□ Gasoline 95□ Diesel□ Hybrid + Gasoline 91□ Hybrid + Gasoline 95
14. How many liters of fuel does your car consume (per week) (approximately)
□ 0–50 L□ 51–100 L□ 101–150 L□ 151–200 L□ 201–250 L
□ 251–300 L□ 301–350 L□ 351–400 L□ >400 L□ I do not know
15. How much do you pay SR (per week) to fill your car with fuel?
□ 0–150 SR□ 151–300 SR□ 301–500 SR
□ 501–600 SR□ 601–800 SR□ More than 800 SR
16. The purpose of using the car?
□ All□ Work□ Shopping
17. What is your car type?
□ Special Car□ Private Car (Sedan)□ A truck
18. What is the engine capacity of your car (cc)?
□ 1001–2000 CC□ 2001–3000 CC□ 3001–4000 CC
□ More than 4000 CC□ I do not know
19. What is the average distance traveled by your vehicle per day?
□ 0–25 km□ 26–50 km□ 51–100 km
□ 101–250 km□ More than 250 km
20. What is your average speed in urban areas?
□ 0–25 km/h□ 26–50 km/h□ 51–80 km/h□ 81–100 km/h
21. What is your average speed on the highway?
□ 0–50 km/h□ 51–100 km/h□ 101–150 km/h□ 121–140 km/h
22. Do you like to travel in public transportation?
□ Yes□ No
23. Did you know that it is possible to run cars with electric power?
□ Yes□ No
24. Do you want to replace your vehicle with an EV?
□ Yes□ No□ I will think about it
25. Have you tried the EV before? (Inside or outside KSA)?
□ Yes□ No
26. Have you tried hybrid cars (fuel + electricity)?
□ Yes□ No
27. Have you seen an actual EVCS? (Inside or outside KSA)
□ Yes□ No

Appendix B. Correlation Matrix

Live in HailFamily SizeNumber of CarsJob TypeMonthly IncomeYears with a Driver’s LicenseDaily Hours in CarCar Manufacturing YearDesire for EVFamily Members Using CarCar Fuel TypeWeekly Fuel Consumption
Live in Hail1.00−0.09−0.09−0.05−0.090.02−0.16−0.05−0.05−0.04−0.01−0.05
Family Size−0.091.000.92−0.01−0.100.160.10−0.21−0.050.830.11−0.03
Number of Cars−0.090.921.000.01−0.130.170.04−0.200.040.740.14−0.08
Job Type−0.05−0.010.011.000.010.050.08−0.000.04−0.06−0.160.12
Monthly Income−0.09−0.10−0.130.011.000.030.010.690.00−0.12−0.010.03
Years with a Driver’s License0.020.160.170.050.031.000.10−0.130.010.130.070.00
Daily Hours in Car−0.160.100.040.080.010.101.000.05−0.220.050.03−0.08
Car Manufacturing Year−0.05−0.21−0.20−0.000.69−0.130.051.00−0.02−0.22−0.040.04
Desire for EV−0.05−0.050.040.040.000.01−0.22−0.021.00−0.04−0.160.14
Family Members Using Car−0.040.830.74−0.06−0.120.130.05−0.22−0.041.000.140.07
Car Fuel Type−0.010.110.14−0.16−0.010.070.03−0.04−0.160.141.00−0.16
Weekly Fuel Consumption−0.05−0.03−0.080.120.030.00−0.080.040.140.07−0.161.00

References

  1. Alanazi, F. Electric Vehicles: Benefits, Challenges, and Potential Solutions for Widespread Adaptation. Appl. Sci. 2023, 13, 6016. [Google Scholar] [CrossRef]
  2. Alotaibi, S.; Omer, S.; Su, Y. Identification of Potential Barriers to Electric Vehicle Adoption in Oil-Producing Nations&mdash; The Case of Saudi Arabia. Electricity 2022, 3, 365–395. [Google Scholar]
  3. Almutairi, A.; Albagami, N.; Almesned, S.; Alrumayh, O.; Malik, H. Electric Vehicle Load Estimation at Home and Workplace in Saudi Arabia for Grid Planners and Policy Makers. Sustainability 2023, 15, 15878. [Google Scholar] [CrossRef]
  4. Boshkoska, M.; Jankulovski, N. Coronavirus impact on global economy. Ann. Theconstantin Brâncuşi Univ. Târgu Jiu Econ. Ser. 2020, 4, 18–23. [Google Scholar]
  5. Almohaimeed, S.A. Electric Vehicle Deployment and Integration in the Saudi Electric Power System. World Electr. Veh. J. 2022, 13, 84. [Google Scholar] [CrossRef]
  6. Central Department of Statistics and Information (CDSI), Kingdom of Saudi Arabia. Available online: http://www.stats.gov.sa (accessed on 3 January 2023).
  7. World Population Review. Riyadh Population 2022. 2022. Available online: https://worldpopulationreview.com/world-cities/riyadh-population (accessed on 3 March 2023).
  8. IEA. Saudi Arabia Balance. Available online: https://www.iea.org/sankey/#?c=Saudi%20Arabia&s=Balance (accessed on 20 September 2023).
  9. Mian, S.H.; Moiduddin, K.; Alkhalefah, H.; Abidi, M.H.; Ahmed, F.; Hashmi, F.H. Mechanisms for Choosing PV Locations That Allow for the Most Sustainable Usage of Solar Energy. Sustainability 2023, 15, 3284. [Google Scholar] [CrossRef]
  10. Ministry of Energy, Kingdom of Saudi Arabia. Saudi Arabia Renewable Energy Project Development Office. Available online: https://www.pdo.sa (accessed on 20 September 2023).
  11. Quevedo, T.C.; Geraldi, M.S.; Melo, A.P. Applying machine learning to develop energy benchmarking for university buildings in Brazil. J. Build. Eng. 2023, 63, 105468. [Google Scholar] [CrossRef]
  12. Grand, S.; Wolff, K. Assessing Saudi Vision 2030: A 2020 Review; Atlantic Council: Washington, DC, USA, 2020; Volume 80, ISBN 978-1-61977-107-9. [Google Scholar]
  13. SASO 2864/2015; Saudi Arabia Corporate Average Fuel Economy Standard (Saudi Cafe) for Incoming Light Duty Vehicles. Saudi Standards, Metrology and Quality Organization: Riyadh, Saudi Arabia, 2018.
  14. Green Riyadh Project. Royal Commission for Riyadh City. Available online: https://www.rcrc.gov.sa/en/projects/green-riyadh-project (accessed on 22 December 2023).
  15. Fahmy, M.S.; Ahmed, F.; Durani, F.; Bojnec, Š.; Ghareeb, M.M. Predicting Electricity Consumption in the Kingdom of Saudi Arabia. Energies 2023, 16, 506. [Google Scholar] [CrossRef]
  16. Lee, H.; Clark, A. Charging the Future: Challenges and Opportunities for Electric Vehicle Adoption; Harvard Kennedy School: Cambridge, MA, USA, 2018. [Google Scholar]
  17. Milligan, R.; Etxebarria, S.; Muneer, T.; Jadraque Gago, E. Driven performance of electric vehicles in Edinburgh and its environs. Energies 2019, 12, 3074. [Google Scholar] [CrossRef]
  18. Alkawsi, G.; Baashar, Y.; Abbas, U.D.; Alkahtani, A.A.; Tiong, S.K. Review of renewable energy-based charging infrastructure for electric vehicles. Appl. Sci. 2021, 11, 3847. [Google Scholar] [CrossRef]
  19. Rapson, D.S.; Muehlegger, E. The economics of electric vehicles. Rev. Environ. Econ. Policy 2023, 17, 274–294. [Google Scholar] [CrossRef]
  20. Ottesen, A.; Banna, S.; Alzougool, B. Attitudes of Drivers towards Electric Vehicles in Kuwait. Sustainability 2022, 14, 12163. [Google Scholar] [CrossRef]
  21. Saputra, M.C.; Andajani, E. Analysis of Factors Influencing Intention to Adopt Battery Electric Vehicle in Indonesia. ADI J. Recent Innov. 2024, 5, 100–109. [Google Scholar] [CrossRef]
  22. Shrestha, S.; Baral, B.; Shah, M.; Chitrakar, S.; Shrestha, B.P. Measures to resolve range anxiety in electric vehicle users. Int. J. Low-Carbon Technol. 2022, 17, 1186–1206. [Google Scholar] [CrossRef]
  23. Schelte, N.; Severengiz, S.; Finke, S.; Stommel, J. Analysis on User Acceptance for Light Electric Vehicles and Novel Charging Infrastructure. In Proceedings of the 2022 IEEE European Technology and Engineering Management Summit (E-TEMS), Bilbao, Spain, 9–11 March 2022; pp. 103–108. [Google Scholar]
  24. Aguilera-García, Á.; Gomez, J.; Sobrino, N.; Vinagre Díaz, J.J. Moped Scooter Sharing: Citizens’ Perceptions, Users’ Behavior, and Implications for Urban Mobility. Sustainability 2021, 13, 6886. [Google Scholar] [CrossRef]
  25. Pevec, D.; Babic, J.; Carvalho, A.; Ghiassi-Farrokhfal, Y.; Ketter, W.; Podobnik, V. A survey-based assessment of how existing and potential electric vehicle owners perceive range anxiety. J. Clean. Prod. 2020, 276, 122779. [Google Scholar] [CrossRef]
  26. Khaleghikarahrodi, M.; Herrera Santos, J.; Lynch-Smith, F.; Macht, G.A. Investigating Factors Affecting Electric Vehicle Users’ Procrastination Charging Behavior. In Proceedings of the Human Factors and Ergonomics Society Annual Meeting, Los Angeles, CA, USA, 24–27 March 2024; 2023; pp. 1295–1301. [Google Scholar] [CrossRef]
  27. Spencer, A.; Ross, S.; Tyson, A. How Americans View Electric Vehicles; Pew Research Center: Washington, DC, USA, 2023; Available online: https://www.pewresearch.org/short-reads/2023/07/13/how-americans-view-electric-vehicles/ (accessed on 2 March 2023).
  28. Bienias, K.; Kowalska-Pyzalska, A.; Ramsey, D. What do people think about electric vehicles? An initial study of the opinions of car purchasers in Poland. Energy Rep. 2020, 6, 267–273. [Google Scholar] [CrossRef]
  29. Ruan, T.; Lv, Q. Public perception of electric vehicles on Reddit and Twitter: A cross-platform analysis. Transp. Res. Interdiscip. Perspect. 2023, 21, 100872. [Google Scholar] [CrossRef]
  30. Almutairi, A. Plug-in electric vehicles and their impact on power generation availability: A real survey-based analysis in Saudi Arabia. Sustain. Cities Soc. 2021, 75, 103389. [Google Scholar] [CrossRef]
  31. Bailey, J.; Miele, A.; Axsen, J. Is awareness of public charging associated with consumer interest in plug-in electric vehicles? Transp. Res. Part D: Transp. Environ. 2015, 36, 1–9. [Google Scholar] [CrossRef]
  32. Todts, W.; Mathieu, L. How Many Charge Points Will Europe and Its Member States Need in the 2020s; Transport & Environment: Brussels, Belgium, 2020; p. 68. [Google Scholar]
  33. van Heuveln, K.; Ghotge, R.; Annema, J.A.; van Bergen, E.; van Wee, B.; Pesch, U. Factors influencing consumer acceptance of vehicle-to-grid by electric vehicle drivers in The Netherlands. Travel Behav. Soc. 2021, 24, 34–45. [Google Scholar] [CrossRef]
  34. Sendek-Matysiak, E.; Łosiewicz, Z. Analysis of the Development of the Electromobility Market in Poland in the Context of the Implemented Subsidies. Energies 2021, 14, 222. [Google Scholar] [CrossRef]
  35. Xu, R.; Seatle, M.; Kennedy, C.; McPherson, M. Flexible electric vehicle charging and its role in variable renewable energy integration. Environ. Syst. Res. 2023, 12, 11. [Google Scholar] [CrossRef]
  36. Wang, N.; Tian, H.; Zhu, S.; Li, Y. Analysis of public acceptance of electric vehicle charging scheduling based on the technology acceptance model. Energy 2022, 258, 124804. [Google Scholar] [CrossRef]
  37. Sheldon, T.L.; Dua, R. Assessing the effectiveness of California’s “Replace Your Ride”. Energy Policy 2019, 132, 318–323. [Google Scholar] [CrossRef]
  38. Elshurafa, A.M.; Peerbocus, N. Electric vehicle deployment and carbon emissions in Saudi Arabia: A power system perspective. Electr. J. 2020, 33, 106774. [Google Scholar] [CrossRef]
  39. Mishra, S.; Verma, S.; Chowdhury, S.; Gaur, A.; Mohapatra, S.; Dwivedi, G.; Verma, P. A comprehensive review on developments in electric vehicle charging station infrastructure and present scenario of India. Sustainability 2021, 13, 2396. [Google Scholar] [CrossRef]
  40. Rangaraju, S.; De Vroey, L.; Messagie, M.; Mertens, J.; Van Mierlo, J. Impacts of electricity mix, charging profile, and driving behavior on the emissions performance of battery electric vehicles: A Belgian case study. Appl. Energy 2015, 148, 496–505. [Google Scholar] [CrossRef]
  41. Messagie, M.; Lebeau, K.; Coosemans, T.; Macharis, C.; Van Mierlo, J. Environmental and financial evaluation of passenger vehicle technologies in Belgium. Sustainability 2013, 5, 5020–5033. [Google Scholar] [CrossRef]
  42. Future Saudi Cities Program: The Comprehensive Urban Vision for Hail City; Ministry of Municipal and Rural Affairs: Riyadh, Saudi Arabia, 2020; ISBN 978-603-8279-40-3.
  43. Hail Region. Available online: https://www.investsaudi.sa/en/meetTheKingdom/province/hail (accessed on 3 March 2024).
  44. Esmaeil, K.K.; Alshitawi, M.S.; Almasri, R.A. Analysis of energy consumption pattern in Saudi Arabia’s residential buildings with specific reference to Qassim region. Energy Effic. 2019, 12, 2123–2145. [Google Scholar] [CrossRef]
  45. Almasri, R.A.; Almarshoud, A.F.; Omar, H.M.; Esmaeil, K.K.; Alshitawi, M. Exergy and Economic Analysis of Energy Consumption in the Residential Sector of the Qassim Region in the Kingdom of Saudi Arabia. Sustainability 2020, 12, 2606. [Google Scholar] [CrossRef]
Figure 1. Global sales of EVs per year between 2010 and 2020 [5].
Wevj 15 00108 g001
Figure 2. Sources of energy balance in 2018 in the KSA [8].
Wevj 15 00108 g002
Figure 3. Development of Hail City (area and population) from 1984 to 2014 [42].
Wevj 15 00108 g003
Figure 4. Population density of Hail City [42].
Wevj 15 00108 g004
Figure 5. Monthly average meteorological data in Hail (2018–2021).
Wevj 15 00108 g005
Figure 6. Hail City general resident information.
Wevj 15 00108 g006
Figure 7. Vehicle details and usage.
Wevj 15 00108 g007aWevj 15 00108 g007b
Figure 8. Driving habits.
Wevj 15 00108 g008
Figure 9. Public transportation and EV awareness.
Wevj 15 00108 g009aWevj 15 00108 g009b
Table 1. Survey questionnaire.
CategoriesQuestion Question
General Resident Information1Do you live in Hail?
2How many family members?
3How many family members use their car?
4How many cars does your family own?
5What is your current job?
6Monthly income?
Vehicle Details and Usage7Is your car private or provided by work?
8How long have you held a driver’s license?
9How many hours do you spend by car per day?
10What is the date of manufacture of your car?
11How many years have you been using your current car?
12What is the number of seats for your car?
13What type of fuel do you use for your car?
14How many liters of fuel does your car consume (per week) (approximately)
15How much do you pay SR (per week) to fill your car with fuel?
Driving Habits16The purpose of using the car?
17What is your car type?
18What is the engine capacity of your car (cc)?
19What is the average distance traveled by your vehicle per day?
20What is your average speed in urban areas?
21What is your average speed on the highway?
Public Transportation and EV Awareness22Do you like to travel in public transportation?
23Did you know that it is possible to run cars with electric power?
24Do you want to replace your vehicle with an EV?
25Have you tried the EV before? (Inside or outside KSA)?
26Have you tried hybrid cars (fuel + electricity)
27Have you seen an actual EVCS? (Inside or outside KSA)
Table 2. Weighted average value of general resident information in Hail City.
ParameterValue
1Average number of family members (person)5.8
2Average number of family members using cars (person)2.6
3Average car ownership (cars per family)3.15
4Average monthly income (SR/month)13,350
Table 3. Weighted average indicators for vehicle details and usage.
ParameterValue
1Average years holding a driver’s license (year)14
2Average driving hours per day (h)2.1
3Average number of seats in vehicles (seat)5.6
4Average weekly fuel consumption (liter)144
5Average weekly fuel cost (SR/week)235
Table 4. Weighted average values of driving behavior indicators.
ParameterValue
1Average engine power (CC)2184
2Average trip length (km/day)77.45
3Average speed in urban areas (km/h)66.95
4Average speed on highways (km/h)116.50
Disclaimer/Publisher’s Note: The statements, opinions and data contained in all publications are solely those of the individual author(s) and contributor(s) and not of MDPI and/or the editor(s). MDPI and/or the editor(s) disclaim responsibility for any injury to people or property resulting from any ideas, methods, instructions or products referred to in the content.

