1. Introduction
Solid-state batteries are becoming a promising next-generation battery type in energy storage applications due to their higher energy density and safer operation behaviour when compared with lithium-ion batteries [
1,
2]. In addition, solid-state batteries are able to charge faster, making them more suitable for electric vehicles and other applications, where sustainable development goals are important [
3]. The manufacturing process, especially for the electrode production stage, plays an important role in determining the solid-state battery performance [
4]. In this context, to ensure high-performance solid-state batteries and widen their applications, it is vital to analyse/quantify the effects of manufacturing feature terms and monitor/forecast electrode key properties such as mass loading during the early manufacturing stages.
However, solid-state batteries have complicated energy storage resources, containing many electrochemical dynamics, during their production [
5]. To date, the trial-and-error strategy is the main solution, which has been widely utilized to analyse the effects of key manufacturing feature terms on the mass loading of produced electrodes, which is can easily lead to high costs and can take a long time to complete [
6,
7]. In light of this, developing an efficient solution to analyse the importance of manufacturing feature terms of interest and predict the electrode mass loading of solid-state batteries is a challenging but essential target when attempting to widen the applications of solid-state batteries.
With the rapid development of artificial intelligence, machine learning and computational platforms [
8], machine-learning-based methods have become a powerful solution to management issues in batteries [
9,
10]. Numerous machine-learning-based solutions have been developed to estimate batteries’ internal states [
11,
12,
13,
14], forecast batteries’ future ageing dynamics [
15,
16,
17] and remaining useful life (RUL) [
18,
19], diagnose battery faults [
20,
21,
22] and optimize battery charging [
23,
24,
25,
26] and energy management [
27,
28,
29,
30]. In summary, based on a well-developed machine learning method, an effective management solution can be obtained to improve the operational performance of batteries. However, these methods mainly focus on exploring the macrodynamics rather than microdynamics of batteries, such as their manufacturing feature terms. To date, there are still limited studies focusing on analyses of battery electrode manufacturing feature terms through the development of related machine-learning-based solutions. For instance, a machine learning method using random forest is proposed in [
31] to capture the interdependency among key feature terms of battery manufacturing and the electrical behaviours of the associated battery cells. Based on the typical cross-industrial standard process, a machine learning approach using neural networks is developed to quantify the dependency among key battery components. In [
32], a neural-network-based machine learning approach is designed to capture battery products’ capacity for highly efficient battery manufacturing. To solve the imbalance that usually occurs in the battery manufacturing process, an RUBoost-based machine learning method is developed to predict battery capacity and quantify the formulation terms in [
33]. For solid-state batteries, it should be noted that the corresponding manufacturing process, especially for electrode production, plays a key role in the solid-state battery properties. To ensure high-performance solid-state battery production, it is necessary to design an effective machine-learning-based approach to predict the produced electrode properties and analyse how feature terms at the early manufacturing stages will affect the electrode properties.
Based on the above discussion, to benefit high-performance solid-state battery production, this study develops a machine-learning-based approach to accurately forecast the electrode mass loading of solid-state batteries and quantify the importance of related manufacturing feature terms in determining electrode mass loading. This study makes the following contributions to the field: (1) three effective machine-learning-based feature analysis methods, including minimum redundancy–maximum relevance (MRMR), the F-test and RreliefF, are developed to quantify and analyse the importance and effects of four key manufacturing feature terms on determining electrode mass loading; (2) after analysing feature importance, four efficient machine-learning-based regression methods, including decision tree (DT), boosted decision tree (BDT), support vector regression (SVR) and Gaussian process regression (GPR), are developed to predict the electrode mass loading a of a solid-state battery during the early manufacturing stage. Due to its data-driven characteristics, the designed machine-learning-based approach could accurately forecast battery electrode mass loading at the mixing and coating stages and successfully quantify the importance of manufacturing feature terms, paving the way to monitoring electrode mass loading and analysing the effects of early-stage manufacturing feature terms, further benefitting the production of high-performance solid-state batteries.
The rest of this paper is organized as follows:
Section 2 introduces four key manufacturing feature terms from mixing and coating stages to produce an electrode for the solid-state battery.
Section 3 describes the machine-learning-based feature importance analysis methods, the machine-learning-based regression methods and the related prediction performance indicators. Then, the feature importance analysis results of four key manufacturing feature terms and the electrode mass loading prediction results are provided and discussed in
Section 4. The conclusion of this study is given in
Section 5.
2. Key Manufacturing Feature Terms
Electrode manufacturing is a key and complex process within the production line for solid-state batteries, involving numerous disciplines, including material, mechanical and electrical engineering [
34]. Furthermore, the produced electrode properties such as mass loading significantly affect final the performance of solid-state batteries, which must be well monitored and controlled to produce a high-performance solid-state battery.
Figure 1 illustrates the main stages to manufacture an electrode of solid-state batteries. During electrode manufacturing, after preparing suitable materials, the first main stage is mixing to generate slurries that contain active material, conductive additive material and solvent. After that, the mixed slurry needs to be coated on the surface of the metal foil through a coating machine. Generally, anode coating will use copper foil, while cathode coating will adopt aluminium foil. During the coating stage, the ratio of the coating machine will be fixed, while CG will be adjusted to determine the thickness of the coating product. Then, the coating product will be dried by using ovens at a predefined temperature, followed by a calendaring stage to evaporate the residual solvent. After cutting the coating product to a suitable size, the electrode of the solid-state battery can be obtained. It should be noted that lots of manufacturing terms are involved within the electrode production line. Some feature terms, specifically for those from mixing and coating stages (the early manufacturing stages), play a key role in affecting electrode mass loading, which must be well analysed and monitored to ensure good electrode performance.
In this study, three key feature terms, including active material–mass content (AM-MC), solid-to-liquid ratio (S-LR), viscosity from the mixing stage and a key feature term named comma-gap (CG), from the coating stage are utilized as the explored feature terms of interest. All of these feature terms come from the early manufacturing stages, which brings challenges for electrode mass loading prediction. Theoretically, CG stands for a gap value between comma and coating rolls, affecting both the weight and thickness of the coating. S-LR stands for the mass ratio between a solid component (i.e., active material, conductive additive material and binder) and slurry mass (i.e., solvent and solid component). A well-proven dataset [
35] from the Franco Laboratoire de Reactivite Chimie-des-Solides (LRCS) is adopted here to ensure that the machine-learning-based models used can be trained well. More information on the design of experiments and the introduction of the data can be obtained in [
35] for readers’ interest. Based on this dataset, the feature importance of the above-mentioned four feature terms can be quantified, while suitable machine-learning-based regression models can be built to predict the electrode mass loading of the solid-state battery in the early manufacturing stages.
3. Machine Learning Methodology
In this section, three typical machine learning methods are first introduced to analyse the importance of feature terms of interest. Then, four regression methods are derived to predict the electrode mass loading of solid-state batteries. Afterwards, three performance indicators are used to quantify and compare the electrode mass loading prediction performance via the developed regression models.
3.1. Feature Importance Analysis Method
To quantify the importance and analyse the effects of these feature terms of interest on the determination of electrode mass loading of solid-state batteries, three effective feature selection methods, including minimum redundancy–maximum relevance (MRMR), F-test and RReliefF, are utilized in this study, respectively.
3.1.1. Minimum Redundancy–Maximum Relevance
Minimum redundancy–maximum relevance (MRMR) is an efficient feature selection method as it selects feature terms with high correlations with the output of interest and low correlations with each other [
36]. If the interested feature terms are continuous, the correlation with relevance in MRMR can be calculated by using the F-statistic, while the correlation with redundancy will be obtained by using the Pearson correlation coefficient. In this context, the importance of the feature terms could be determined one by one through adopting the greedy search to maximize target functions corresponding to both relevance and redundancy.
In this study, two classical target functions, including the Mutual Information Difference (MID) and the Mutual Information Quotient (MIQ), are adopted to represent the difference and the quotient between relevance and redundancy. Through using MID and MIQ, MRMR is capable of ensuring that the quantified feature importance not only refers to the one that gives the minimum correlation among inputted feature terms but also provides the large correlations with the target output.
3.1.2. F-Test
The F-test is one of the classic statistical tests providing an F-score through computing variance ratios [
37]. In this study, the F-test in a one-way analysis of variance (ANOVA) is adopted to calculate variance’s ratio among groups and a group’s variance for a feature. A larger value of the F-score represents that the distance within the group is smaller, while the distance between the groups is larger.
The ANOVA could determine each feature term’s value to the target output by adopting the F-test to quantify the mean of various groups. Then, each feature term can be scored and ranked to reflect which term plays the most important role in determining the target output. For the ANOVA, the number of feature terms and the F-ration will be obtained. The F-score of each feature term can be obtained by:
where
stands for the number of group
within the set;
and
represent the mean values of the group and feature term, respectively.
denotes the number of groups. Finally, the feature importance value under the F-test can be obtained through dividing distances among groups by the distance within the group. The larger the result, the more important that feature’s contribution to the target output.
3.1.3. RReliefF
RReliefF is an efficient machine-learning-based approach to quantify feature importance by penalizing the feature term that provides various values to neighbours with similar target outputs while rewarding the feature term that gives different values to neighbours with different target outputs [
38]. Supposing
represents the weight of providing various values for the target output,
stands for the weight of providing various values for the feature term, and
denotes the weight of providing various target outputs and various values for the feature term, thus giving two nearest neighbours. All weights in RReliefF can be calculated by:
Afterwards, RReliefF can calculate the importance weight
of feature terms through updating all intermediate weights as:
3.2. Regression Method
After developing a feature importance analysis method to quantify the importance of different feature terms, the prediction method needs to be adopted to forecast the electrode mass loading based on the feature terms of interest. In this study, four classical and effective prediction methods named decision tree, boosted decision tree, support vector machine and Gaussian process regression are utilized.
3.2.1. Decision Tree
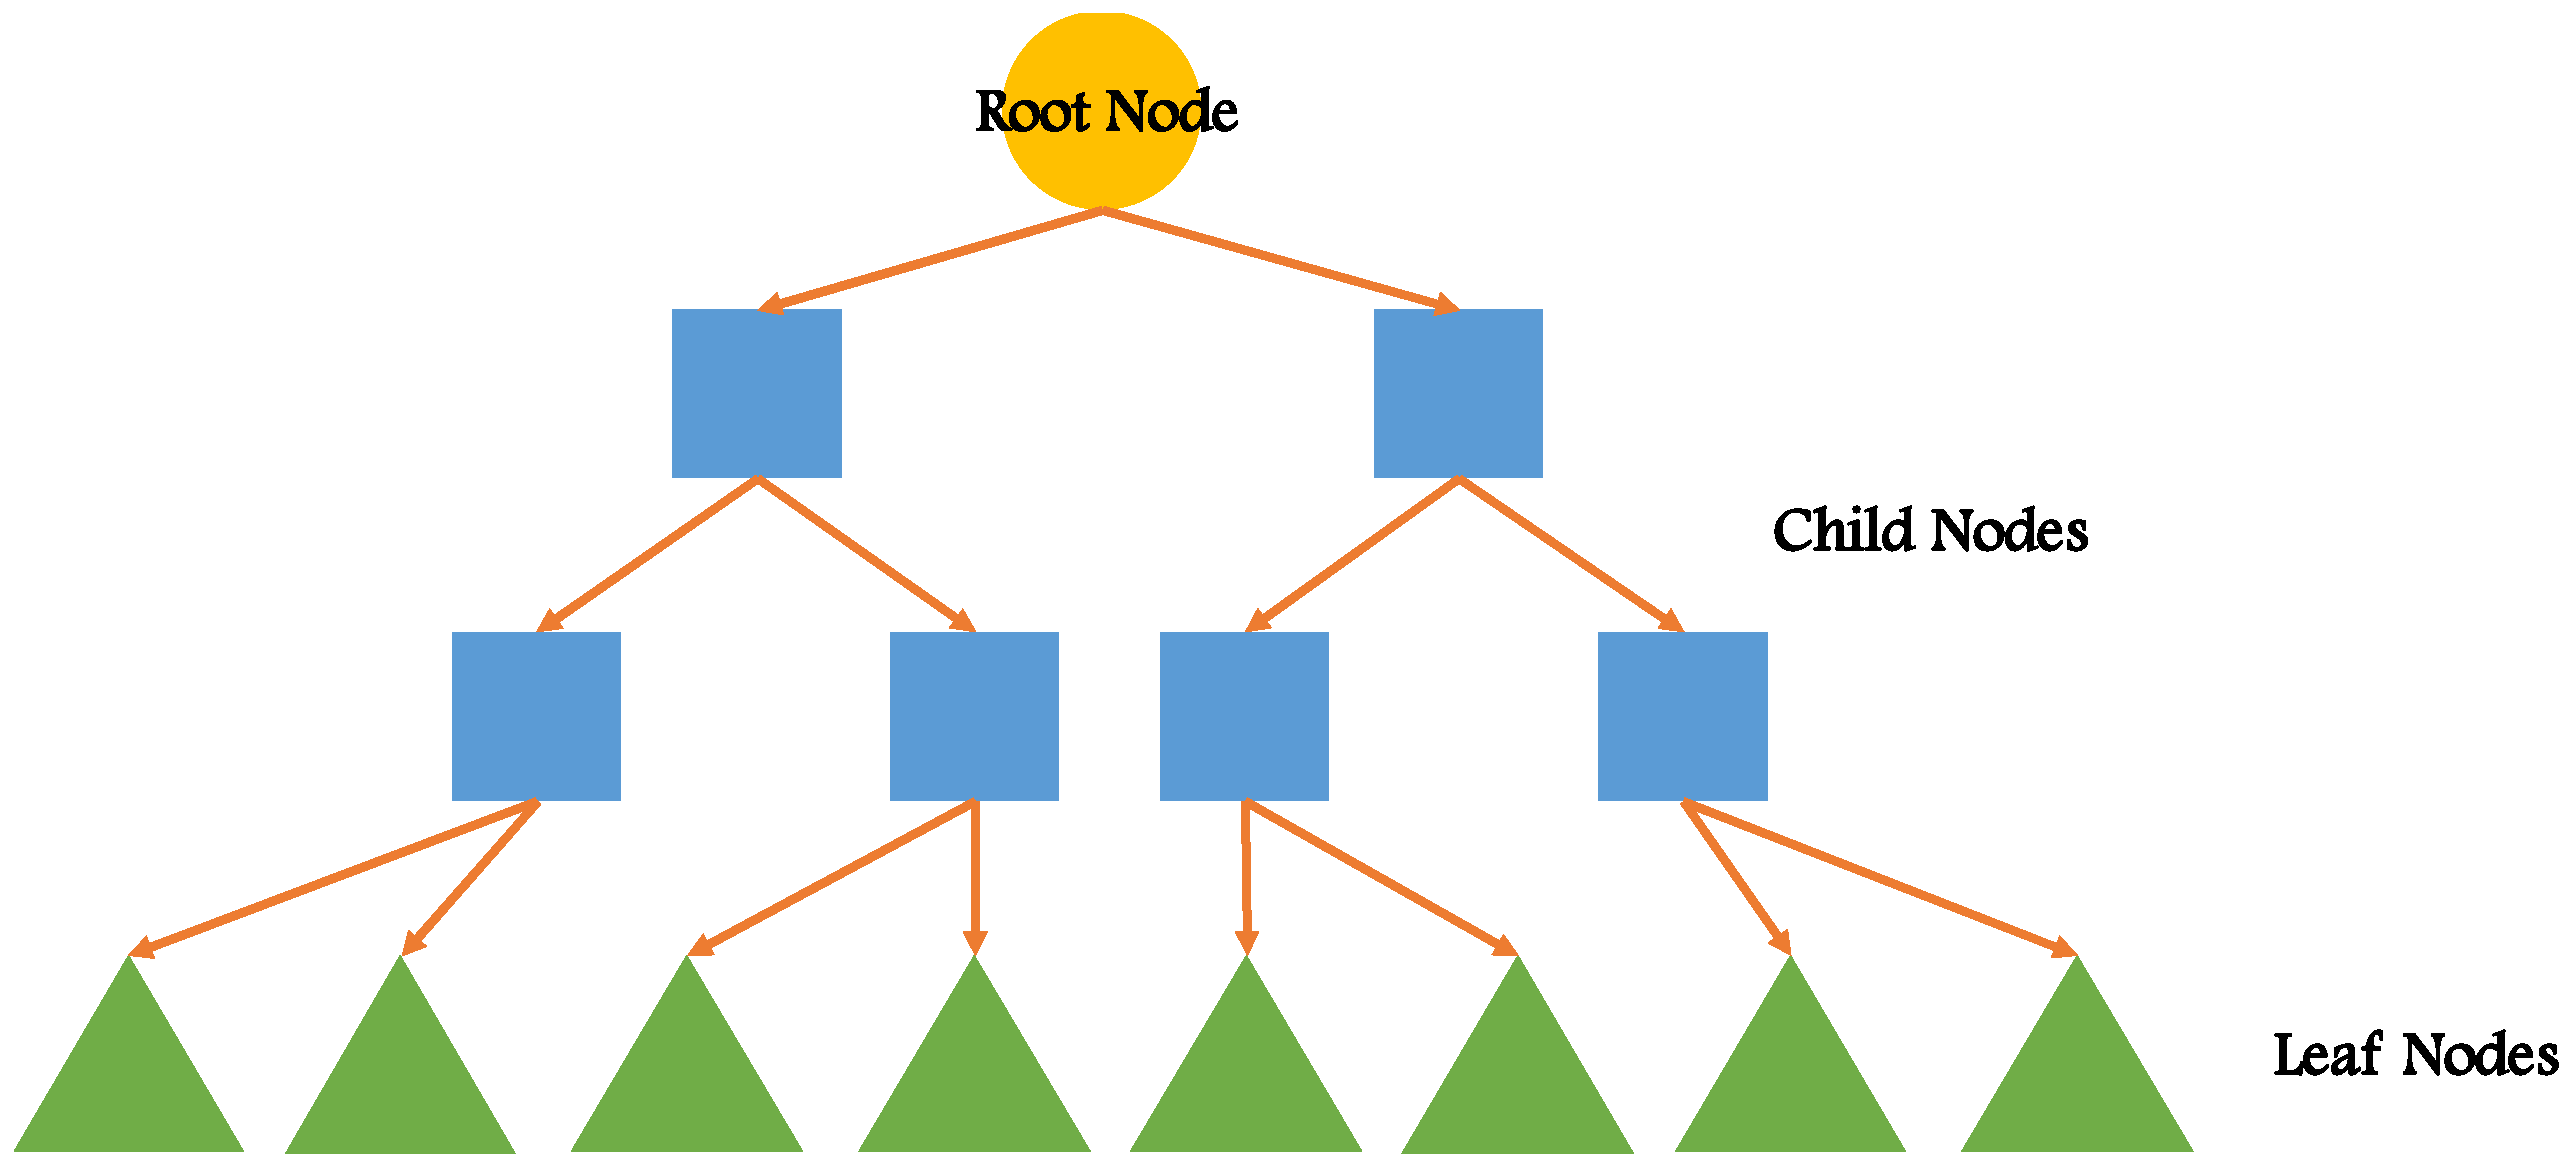
Decision tree (DT) is an algorithm that uses a tree model to solve regression problems. Each leaf in the tree model represents a predicted value, which is the mean value of the outputs of all training set factors contained in this leaf. The DT is a binary tree, which means that except for leaf nodes, all other nodes have only two child nodes. In addition, all inputs that fall on the same leaf have the same output [
39].
Figure 2 describes a simple structure example of DT. Specifically, when using DT to solve regression tasks, a certain feature of the samples is tested from the root nodes, and then the samples are assigned to the child nodes according to the testing results. It is ensured that each child node corresponds to a value of this feature. By analogy, all samples are tested and distributed in a recursive manner until they reach the leaf nodes.
3.2.2. Boosted Decision Tree
The working mechanism of the boosting algorithm is to first train the training set through a weak learner A with a set of initial weights. Then, the weights of the training samples are updated according to the performance of the error rates of this weak learner A, so that the weights of the training samples with higher learning error rates will become greater. Then, a weak learner B is used to train the training set based on the adjusted weights, and these samples with greater weights will receive more attention. This process is repeated until the number of weak learners reaches the pre-specified number T ( in this study). Finally, these T weak learners are integrated through the predefined strategy to obtain a final strong learner. In this study, the medium decision trees are employed as the weak learners, and the AdaBoost algorithm is utilized as the integration strategy. When dealing with practical problems, the boosted decision tree (BDT) model can handle different types of predictors and allows for missing values. This method can fit complex nonlinear relationships and can automatically manage the mutual influence between predictors. Thus, the BDT model usually has stronger predictive ability than most traditional tree methods.
3.2.3. Support Vector Regression
Support vector machine (SVM) is a machine learning classification model, and its principle is to seek the optimal solution in data mining through establishing an optimal hyperplane, so that the support vectors of the two (or more) classification sets are the farthest away from this classification plane [
40]. The traditional methods usually simplify problems by reducing the dimensionality of the sample, while the SVM increases the dimensionality of the sample point. Then, it maps the sample points to a high-dimensional or even infinite-dimensional space through a kernel function to deal with linear and nonlinear problems. As an application of SVM to regression problems, support vector regression (SVR) is an approach to estimate the function mapped from input objects to output numbers based on training data. Regression and classification are essentially the same in a sense. Similar to SVM, the principle of SVR is to find a regression hyperplane, so that all the data in a dataset are closest to the plane. When considering data distributed in two dimensions (x-axis and y-axis are used to define the location of the points), SVR tries to find the best line within a predefined or threshold error value. It classifies the data into two types, one type above the error line and one type below the error line. For failed lines, the error is estimated as the difference between the predicted and actual values and represented by
, as illustrated in
Figure 3.
3.2.4. Gaussian Process Regression
Gaussian process regression (GPR) is a typical regression method based on Bayesian theory [
41,
42]. The probability distribution of GPR can be described through mean function
and kernel function
as:
with:
Here,
is usually set as zero to simply the computation process. In this context, for a prediction, the prior distribution of output in a regression case is defined as:
Supposing the training set
and testing set
own the same Gaussian distribution, then the testing output
presents the joint prior distributions with the training output
as [
43]:
Based on this joint prior distribution, the predicted output
related to the input
can be obtained through calculating the conditional distribution
:
with
where
represents the mean predicted value, while
stands for the corresponding variance value.
In real application of GPR, the kernel function
needs to be carefully selected. In this study, a squared exponential (
SE) kernel in the following form with effective performance is utilized:
where
and
represent two hyperparameters to affect both the amplitude and length of the
SE kernel.
3.3. Modelling Process
Figure 4 illustrates the designed model structure and relevant process. To be specific, four machine-learning-based regression models, including DT, BDT, SVR and GPR, are constructed using CG, S-LR, AM-MC, and viscosity as inputs to predict electrode mass loading. Subsequently, three feature selection methods, namely MRMR, F-test and RReliefF, are employed to assess the importance of these four features. This approach unveils the decision-making process of the model and offers valuable insights for real battery production.
3.4. Prediction Performance Indicators
To quantitatively reflect the solid-state battery electrode mass loading prediction performance of machine-learning-based regression models, three classical prediction performance indicators [
44] are utilized:
- (1)
Mean absolute error (MAE): Supposing represents the total amount of all samples, is the real battery electrode mass loading value, while stands for the predicted electrode mass loading value from the machine-learning-based regression model. MAE can then be defined by:
- (2)
Root mean square error (RMSE): As another typical performance indicator, RMSE is an effective prediction performance indicator, defined as:
- (3)
: supposing stands for the mean value of all predicted electrode mass loading, can be defined as:
In real solid-state battery electrode mass loading prediction, when the predicted value is close to the real value, MAE and RMSE should become close to 0, while should be close to 1.
4. Result and Discussion
In this section, the feature importance analysis of four battery manufacturing terms is carried out to quantify the effects of CG, S-LR, AM-MC and viscosity on determining the electrode mass loading of the solid-state battery. Afterwards, four machine-learning-based regression models with DT, BDT, SVR and GPR are established to predict battery electrode mass loading in the early manufacturing stage.
4.1. Feature Importance Analysis Results
To quantify the importance of four manufacturing feature terms for all samples, the MRMR-based machine learning method is first utilized.
Figure 5 quantifies and plots the importance values of four manufacturing feature terms of interest (CG, S-LR, AM-MC, viscosity). It can be obviously seen that CG is the most important feature term, with the highest importance value of 1.01, while S-LR provides the second-highest importance value of 0.185, which is five-times smaller than CG. In comparison, the importance values of AM-MC and viscosity are smaller than S-LR, meaning that their effect on determining solid-state battery electrode mass loading decreases accordingly.
Next, an F-test is adopted to quantify the importance of these four manufacturing terms, and the corresponding results are shown in
Figure 6. It can be seen that although the values of the F-test are significantly larger than those of MRMR, the importance trend of these four manufacturing terms is similar. To be specific, CG gives the most important contribution to determine electrode mass loading, with a value of over 80. S-LR and AM-MC present the second and third most important contribution, with values of 21.732 and 8.121, respectively. Viscosity gives the smallest contribution to determine electrode mass loading.
Furthermore, after using the RReliefF-based machine learning approach, the importance of these four manufacturing terms is also quantified and plotted in
Figure 7. According to
Figure 6, although the importance values of CG and viscosity are positive, while S-LR and AM-MC are negative, the quantified effects on determining electrode mass loading are similar to those of MRMR-based and F-test-based machine learning methods. Specifically, CG gives the largest quantified importance value of 0.1236, while S-LR provides the second-largest quantified importance value with −0.0837. In comparison, viscosity presents the smallest quantified importance value of 0.0126. The trend of the quantified importance values of all three machine-learning-based approaches is similar, indicating that the importance of CG, S-LR, AM-MC and viscosity can be successfully quantified and analysed using our designed feature importance analysis methods.
4.2. Mass Loading Prediction Results
Next, after developing a machine-learning-based approach to quantify and analyse the importance of four key manufacturing terms (CG, S-LR, AM-MC and viscosity), the machine-learning-based regression models by using four different technologies, including DT, BDT, SVR and GPR, are carried out to predict the electrode mass loading of the solid-state battery in the early manufacturing stage, respectively.
We first focus on the electrode mass loading prediction by using four manufacturing feature terms (CG, S-LR, AM-MC and viscosity) as inputs via various machine-learning-based regression models. After carrying out five-fold cross-validation, the electrode mass loading prediction results of using DT-, BDT-, SVR- and GPR-based regression models are shown in
Figure 7, while their related prediction performance indicators are quantified in
Table 1. According to
Figure 8, it can be seen that all these four machine-learning-based regression models are capable of capturing most of the electrode mass loading sample points, indicating the effectiveness of the machine-learning-based regression model in predicting electrode mass loading in the early manufacturing stages. Specifically, the DT-based regression model provides the worst prediction result, with an RMSE value of 1.919 and a
value of 0.978, which is 21.5% and 1.2% worse than those from the BDT-based regression model. In comparison, the GPR-based regression model gives the best result for electrode mass loading predictions, whose MAE and RMSE values are 0.883 and 1.089, respectively, which are 3.5% and 30.3% better than those of the SVR-based regression model. It can be concluded that four electrode manufacturing feature terms (CG, S-LR, AM-MC and viscosity) present strong relationships with the electrode mass loading. Through using more complicated regression models with kernel functions like SVR and GPR, the electrode mass loading prediction performance could be further enhanced.
To further explore the electrode mass loading prediction results of using machine-learning-based regression models, the prediction versus true plots for DT-, BDT-, SVR- and GPR-based regression cases are shown in
Figure 9. Theoretically, the farthest observations in the prediction versus true plots are able to allow the prediction line for this sample. The better prediction performance a model gives, the closer the observations from that model to the perfect prediction line. According to
Figure 8, it can be noted that for all four machine-learning-based regression models, most of the observations are close to the perfect prediction line, while only a few observations are far from the perfect prediction line. This is mainly due to the overfitting phenomenon and can be enhanced by giving more high-quality electrode manufacturing data observations.
4.3. Comparison and Discussion
To further explore the effectiveness of the designed approach, three other traditional algorithms, including the linear regression (LR) model, the random forest (RF)-based model and the AdaBoost-based ensemble model, are adopted for further comparisons. To be specific, the LR model is a linear traditional algorithm to capture the relationships between inputs and responses. RF and AdaBoost are all tree-based ensemble models.
Table 2 shows the results of electrode mass loading prediction by using all these traditional algorithms after five-fold cross-validation. Obviously, the LR model gives the worst results, with an
of 0.851, indicating that the underlying relationships between the investigated manufacturing parameters and the electrode mass loading are highly non-linear. In contrast, both the RF-based model and the AdaBoost-based model perform well in predicting the electrode mass loading, with an
above 0.992, which is similar to the GPR-based approach we developed. In this context, the designed GPR-based approach and ensemble models can provide a competent performance for early predictions of battery electrode mass loading.
Due to its data-driven nature, this machine-learning-based approach can be easily adopted by engineers in real-world applications, as limited professional knowledge of the battery manufacturing mechanism is required. The designed modelling process can be conveniently extended to other data analysis applications of battery manufacturing if appropriate data are available. It should be noted that this is of great importance for battery manufacturers to better understand their manufacturing line and make reasonable battery property predictions in the early manufacturing stage. It is also convenient to extend this machine-learning-based approach for analysing other battery cases such as the composite electrode that comprises both the solid electrolyte and the electrode. Moreover, the developed method, as supported by [
45], is flexible and free from limitations of the battery mechanism. Analysing different combinations of solid electrolytes and electrodes can also be performed via the developed machine-learning-based solution when the corresponding data are collected.
5. Conclusions
The solid-state battery is developing into a promising technology that enables safer operation of energy storage systems, with its performance largely determined by the charge of the electrode mass. However, it is difficult to effectively analyse the importance of the strongly coupled manufacturing characteristics and predict the load on the electrode mass in the early stages of battery manufacturing. As suggested and requested by battery manufacturers, this study proposes a machine-learning-based approach that combines the advantages of effective feature selection and a user-friendly regression model to predict electrode mass loading and quantify the importance and impact of manufacturing parameters in the mixing and coating stages. The comparative analysis shows that CG and S-LR are the first and second most important contributors to the determination of electrode mass loading of a solid-state battery, while viscosity is the least important contributor to the prediction of electrode mass loading. The developed GPR-based regression model provides the best performance in predicting the electrode mass loading, with an RMSE and R2 of 1.089 and 0.995, respectively. Due to its data-driven nature, the developed machine-learning-based approach can efficiently assist engineers in monitoring/predicting the mass loading of solid-state battery electrodes in early manufacturing stages and analysing/quantifying the significance of manufacturing features of interest. Additionally, it can be conveniently extended to other applications of data analysis in battery manufacturing, as no professional knowledge of the battery manufacturing mechanism is required. This could further advance the development of high-performance solid-state batteries for broader energy storage applications. As obtaining available data from battery production requires specialised equipment and is time consuming, we will conduct further experiments in the future to generate more relevant data related to other characteristics, such as drying temperature and pressure, and also consider the composite electrode to further improve the sensitivity analysis of characteristics for high-performance Li-ion battery production.


