Article

Numerical Investigation of Heat Production in the Two-Wheeler Electric Vehicle Battery via Torque Load Variation Test

by
Hariyotejo Pujowidodo
1,*,
Bambang Teguh Prasetyo
1,
Respatya Teguh Soewono
1,
Himawan Sutriyanto
1,
Achmad Maswan
1,
Muhammad Penta Helios
1,
Kanon Prabandaru Sumarah
1,
Bhakti Nuryadin
2,
Andhy Muhammad Fathoni
1,
Dwi Handoko Arthanto
1,
Riki Jaka Komara
1,
Agus Prasetyo Nuryadi
1,
Fitrianto
1,
Chairunnisa
1 and
I.G.A. Uttariyani
1
1
National Research and Innovation Agency Republic of Indonesia, Jakarta Pusat 10340, Indonesia
2
Ministry of Energy and Mineral Resources Republic of Indonesia, Jakarta Pusat 10110, Indonesia
*
Author to whom correspondence should be addressed.
World Electr. Veh. J. 2024, 15(1), 13; https://doi.org/10.3390/wevj15010013
Submission received: 9 September 2023 / Revised: 11 October 2023 / Accepted: 13 November 2023 / Published: 2 January 2024
(This article belongs to the Special Issue Lithium-Ion Batteries for Electric Vehicle)

Abstract

:
Experimental studies were conducted to investigate the effect of varying torque loads on the temperature distribution on the surface of lithium-ion batteries (72 volts–20 Ah) in real commercial two-wheeler electric vehicles as part of our previous research. An electric vehicle engine was installed in a dyno testing laboratory and used as the main load for the battery. Ambient temperature and relative humidity were controlled using an air conditioning system. The test results are presented as surface temperature distributions on each side of the battery at various torque loads. The highest temperature on the battery’s surface was found to be approximately 40 °C at a torque load of 100%. Unfortunately, the heat generated by the battery during testing could not be measured for further research. This paper presents a numerical study of battery heat generation at 100% torque load using Ansys Fluent 2020 R1©. This tool is employed to calculate the heat flux from the battery surface to the ambient air. The CFD tool was initially validated against available experimental data and commonly used correlations for natural convection along a vertically heated wall. Good agreements between the current predictions and experimental data were observed for laminar flow regimes. Convective heat transfer between the battery surface and ambient air was simulated. The results indicate that the commonly used heat transfer correlation for vertical plates accurately predicts the heat transfer rate on the battery surface, and it was found that the heat generation rate is 1199 W/m3.

1. Introduction

The transportation sector is responsible for 20% of total global emissions [1]. This reality has prompted a shift from traditional fossil fuel vehicles to electric vehicles in an effort to reduce greenhouse gas emissions in the transportation sector [2]. To date, most electric vehicles rely on lithium-ion batteries for energy storage [3]. Despite their advantages, an increase in battery temperature during operation can lead to thermal runaway [4]. Thermal runaway in batteries can result in explosions and fires [5]. Batteries offer promising sources of green and sustainable energy and have been widely adopted in various applications [6]. Lithium-ion batteries play a crucial role in the energy storage sector due to their high specific energy and energy density compared to other rechargeable batteries [7]. The primary challenges in maintaining lithium-ion battery safety and high performance are closely linked to battery thermal management [8]. The optimal operating temperature range for batteries is typically between 10 °C and 50 °C [9], 15 °C and 35 °C [9], or 20 °C and 40 °C [10]. Therefore, innovation in battery cooling optimization is essential to ensure the battery operates safely and efficiently [11,12].
An important practical question to answer is how much heat is generated by the battery as a thermal response of the battery to the applied torque load and what the temperature of the battery is in the presence of this generated heat [13]. Diaz et al. [14] stated in their paper that there is no standard methodology explaining how to measure a cell’s heat generation capability. The paper developed Thermal Metrics to calculate the rate of internal heat generation using the Cell Cooling Coefficient (CCC) method, which was determined experimentally. To calculate CCC, it was necessary to experimentally measure the rate of heat dissipation from the cell tab, calculated based on the temperature difference recorded by the thermocouple positioned along the busbar, as well as considering the material properties and geometry of the busbar. Additionally, surface heat dissipation was measured on the brass fin using a thermocouple and Peltier’s Element (PE). Cao et al. [15] also presented a method to characterize the heat generation of lithium-ion battery cells under various discharge currents, ambient temperatures, and aging cycles, utilizing a forced convection calorimeter in experimental setups. This method operates on the principle of thermal balance, wherein the heat generated equals the heat forcibly convected into the air flowing within the calorimeter chamber. The development of a calorimeter to measure battery cell heat production has been experimentally validated by assessing heat dissipation from pouch battery cells [16]. The fundamental principle at play is thermal balance, where the heat produced is equivalent to the heat released through conduction on the heat sink. Furthermore, Drake et al. [17] have reported measurements of the heat generation rate of a Li-ion cell at high discharge rates, obtained by measuring the cell temperature and surface heat flux. In essence, the method employed is analogous; specifically, the heat produced is equated to the heat lost, gauged through the flux and temperature at the surface. Consequently, the approach for determining the heat generated in battery cells involves applying the principle of thermal balance, where the heat produced equals with the heat released through conduction or convection within the battery cells. The investigation utilized a battery cell as the research object and necessitated specific test equipment, such as a calorimeter. This principle aligns with the investigation method we employ. Our approach involves a direct investigation of the battery pack, eliminating the need for disassembling the battery pack and utilizing specialized test equipment.
In our previous research [18], we tested a real commercial two-wheeler electric vehicle engine driven by a battery unit in a dyno test laboratory, investigating the effects of variations in torque load on the surface temperature distribution of the battery. An electric vehicle engine (BLDC motor) is installed in a dyno testing laboratory and is used as the primary load for the battery. The battery used as the research object is a Li-ion battery with a capacity of 72 V–20 Ah, with dimensions of 127 mm in length, 116 mm in width, and 366 mm in height. The battery is positioned on the floor of the test room, where the ambient temperature and relative humidity are controlled using an air conditioning system. A schematic representation of the testing setup for electric vehicle engine-driven batteries in the dyno test laboratory is shown in Figure 1. Other versions of the experimental setup drawing have also been presented in [18].
Thermocouples and data loggers are installed to acquire the temperature distribution on the battery’s surface. The torque value is varied to assess the battery’s thermal response under different loads. A detailed description of the entire testing procedure can be found in [18]. The test results are presented as surface temperature distributions on each side of the battery at different torque loads. It becomes evident that as the torque increases, so does the battery’s surface temperature, with the highest temperature reaching approximately 40 °C at a 100% load. It is estimated that this temperature could be even higher when the battery is placed in a confined space within a real commercial electric vehicle. To provide a more accurate estimation of the battery’s temperature under these conditions, it is crucial to gather data on the heat generated by the battery in response to applied torque loads. Unfortunately, during testing, it was not possible to measure the heat production of the battery. Therefore, it is necessary to conduct analytical investigations to facilitate further studies.
This paper presents a numerical investigation of the heat generated by a battery under a 100% torque load using Computational Fluid Dynamics (CFD) software (CFD Simulation-Ansys Fluent© R1 2020). The battery is situated within a relatively spacious dyno test laboratory room. Heat transfer from the four vertical sides of the battery’s surface to the air in the laboratory room is considered, employing a natural convection mechanism. Numerous studies concerning natural convection over a flat vertical plate with air as the working fluid have been conducted extensively [19,20]. A paper presented by Yang and West [21] employed a CFD methodology grounded in first principles to calculate heat transfer from the tank wall to a cryogenic liquid, extracting and correlating the equivalent heat transfer coefficient in support of a reduced-order thermal model. The CFD tool was initially validated against available experimental data and commonly utilized correlations for natural convection along a vertically heated wall. A numerical modeling study on the Li-ion battery pack system for hybrid vehicles [22] has obtained thermal characteristics which are influenced by surface conduction and fluid flow interface parameters, Reynolds number, and cooling fluid channel spacing width. The choice of location and shape of cooling inlets and outlets greatly influences the heat dissipation in the battery pack system [23].

2. Materials and Methods

To ensure accuracy, the CFD tool was first validated against available experimental data and commonly used correlations for natural convection along a vertically heated wall. The purpose of this research is to investigate the heat generated by the battery as a thermal response to the applied torque load. The battery used as the research object is a Li-ion battery with a capacity of 72 V–20 Ah, with dimensions of 127 mm in length, 116 mm in width, and 366 mm in height. Based on the battery surface temperature profile observed in previous studies, we utilize CFD software to calculate the heat transfer from the battery surface to the surrounding ambient air. Additionally, we perform analytical calculations to determine the heat generated.

2.1. Battery Thermal Characteristics Test

The testing algorithm for obtaining the battery temperature profile as a function of variations in torque load is depicted in Figure 2. The activities at each step are described in Section 2.1.1, Section 2.1.2 and Section 2.1.3.

2.1.1. Preparation and Instalation of Research Object

As illustrated in Figure 1, the BLDC motor is mounted on a test bench equipped with wiring, an ECU, battery, throttle, and other devices to ensure the smooth operation of the test. The BLDC motor is connected via a propeller shaft (prop-shaft) to a dynamometer.
The system records various test parameters, including RPM, torque, power, temperature, throttle speed, and environmental conditions. For the batteries in particular, temperatures are monitored on the battery’s surface and specific parts of the battery pack structure.

2.1.2. RPM Mapping Test for Maximum Power

The RPM mapping test for maximum power is a performance test of the BLDC motor aimed at determining the optimal rotation speed (optimal RPM). The optimal RPM is the rotation speed at which the BLDC motor produces its maximum power at the appropriate torque load. The power, in this context, is defined as the product of torque, T (N·m), and angular rotational speed, ω (rad/s), as shown in Equation (1). This corresponding torque load is henceforth referred to as ‘100% full load’, which will be later used to assess the battery’s thermal characteristics.
P = T ·   ω = T · 2 · π · n 60
where P: electric motor shaft power (W) T: Torque (N·m) ω : angular rotational speed of the motor shaft (rad/s) n: motor shaft rotation speed (RPM). The performance test, also known as the RPM mapping test, involves running the BLDC motor within a specified rotation speed range. This is achieved by adjusting the dynamometer loading via the loading setpoint at the selected RPM and gradually increasing the throttle until reaching full throttle (100%). The performance testing occurs in several stages, starting with higher rotations at 2500 RPM and gradually decreasing to as low as 400 RPM. To ensure repeatability, the test was repeated in increments from 400 RPM to 2500 RPM.
The results of the performance test indicate that the optimal RPM for the BLDC motor is approximately 2000 RPM, corresponding to a torque of 8.16 N·m and a maximum power output of 1.7 kW (further details are provided in Section 3.1). This optimal RPM also corresponds to a driving speed of around 40 km/hour, as displayed on the electric motorbike’s dashboard.

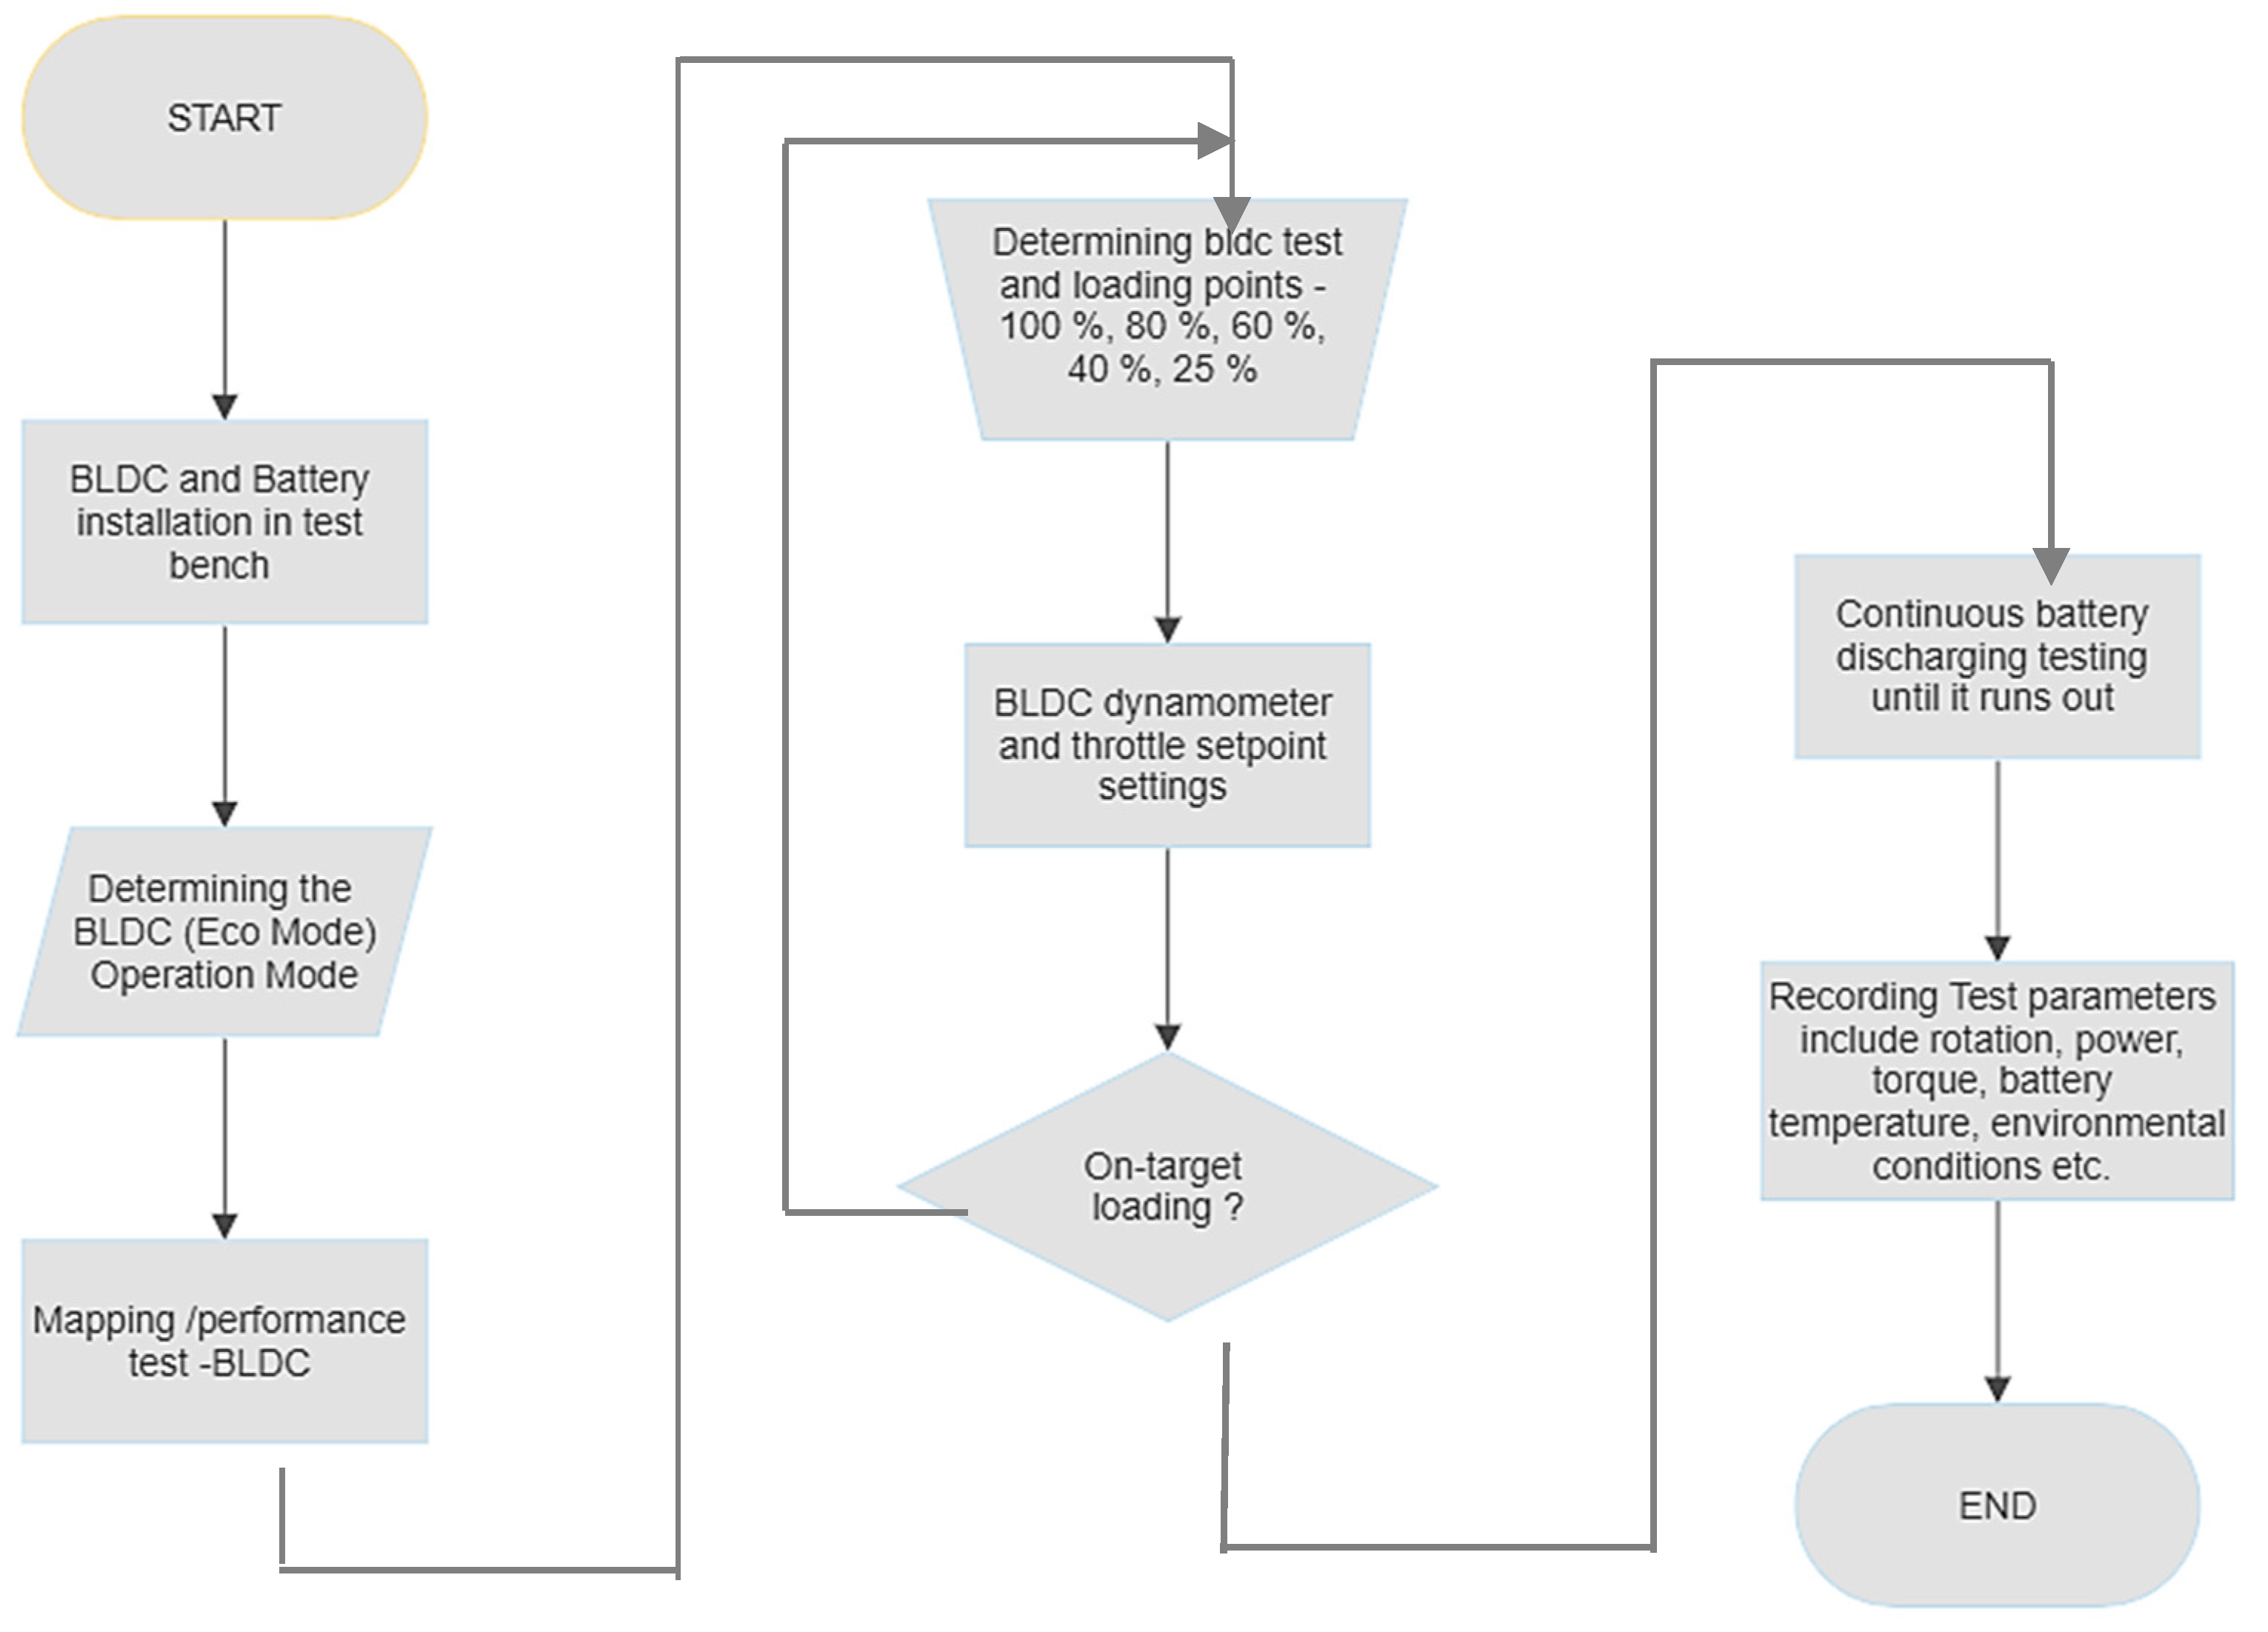
2.1.3. Battery Thermal Characteristic Test (Discharging Test with Torque Load Variations)

This test is conducted to obtain the characteristic curve of the battery temperature when supplying power to the BLDC motor at different torque loads, simultaneously serving as a discharge test.
The torque load that delivers maximum power at the optimal RPM during performance testing, with the speed-throttle set to maximum, is referred to as the 100% torque load (approximately 8.16 N·m). Battery thermal characteristics testing was conducted with torque load variations of 100%, 80%, 60%, 40%, and 25%, corresponding to approximately 8.16, 6.53, 4.90, 3.26, and 2.04 N·m, respectively, all at a constant optimal RPM (around 2000 RPM). To achieve these test conditions, the dynamometer was partially loaded while adjusting the throttle position.
This test can also be referred to as the discharging test with torque load variations because, at each load variation, the BLDC motor is operated until the battery’s energy source cannot sustain the target load/torque. The testing procedure is as follows:
  • At the beginning of the test, the battery must be fully charged to 100% capacity.
  • Loading of the BLDC motor by the dynamometer starts at 100% load at 2000 RPM with full throttle applied.
  • The BLDC motor runs continuously at a constant rotation until the battery’s energy source can no longer sustain the load/torque target.
  • During testing, various parameters are recorded, including time, RPM, torque, power, environmental conditions, and battery temperature.
  • Using the same method, the test continues with load levels of 80%, 60%, 40%, and 25%.
  • At the start of each test, the battery must be fully charged to 100% capacity.
  • The dynamometer’s load on the BLDC motor is adjusted to match the specified load variations mentioned above.
  • Throttle position is fine-tuned to achieve the target load at 2000 RPM.
Schematically, the test procedure for battery thermal characteristic/discharging is shown in Figure 3.

2.2. Numerical Investigation

2.2.1. Transport Equation for Numerical Modelling

The transport equations utilized in this simulation encompass the fundamental principles of mass, momentum, and energy conservation. Describing spatial derivatives within each discretized volume element in a steady-state condition without a source term is denoted as follows. The general equation form of Continuity in Equation (2), representing a solution for mass balance is as follows:
ρ u x + ρ v y + ρ w z = 0 d i v ( ρ · u ) = 0
Density values ρ are calculated using the ideal gas Equation (3), where the parameter Pa is atmospheric pressure, R u and Mw respectively represent the universal gas constant and the molecular weight of air.
ρ = P a ( R u / M w ) T
Momentum Equations (4)–(6) are for the solution of the force balance, with vector form notation in the x, y, and z directions, respectively:
x-direction :   d i v ρ u u = p x + d i v μ   g r a d   u ,
y-direction :   d i v ρ v u = p y + d i v μ   g r a d   v + g β ( T T 0 ) ,
z-direction :   d i v ρ w u = p z + d i v μ   g r a d   w ,
where g = 9.81 m/s2 (gravitational acceleration); β (coefficient of volumetric thermal expansion); T 0 = fluid temperature and u = u, v, w (vectors in direction of x, y, z).
Temperature is determined by solving the energy conservation Equation (7) below.
  d i v ρ T u = k c p d i v g r a d   T
In this equation k is the material’s thermal conductivity constant, c p is specific heat capacity and density is a function of pressure and temperature.

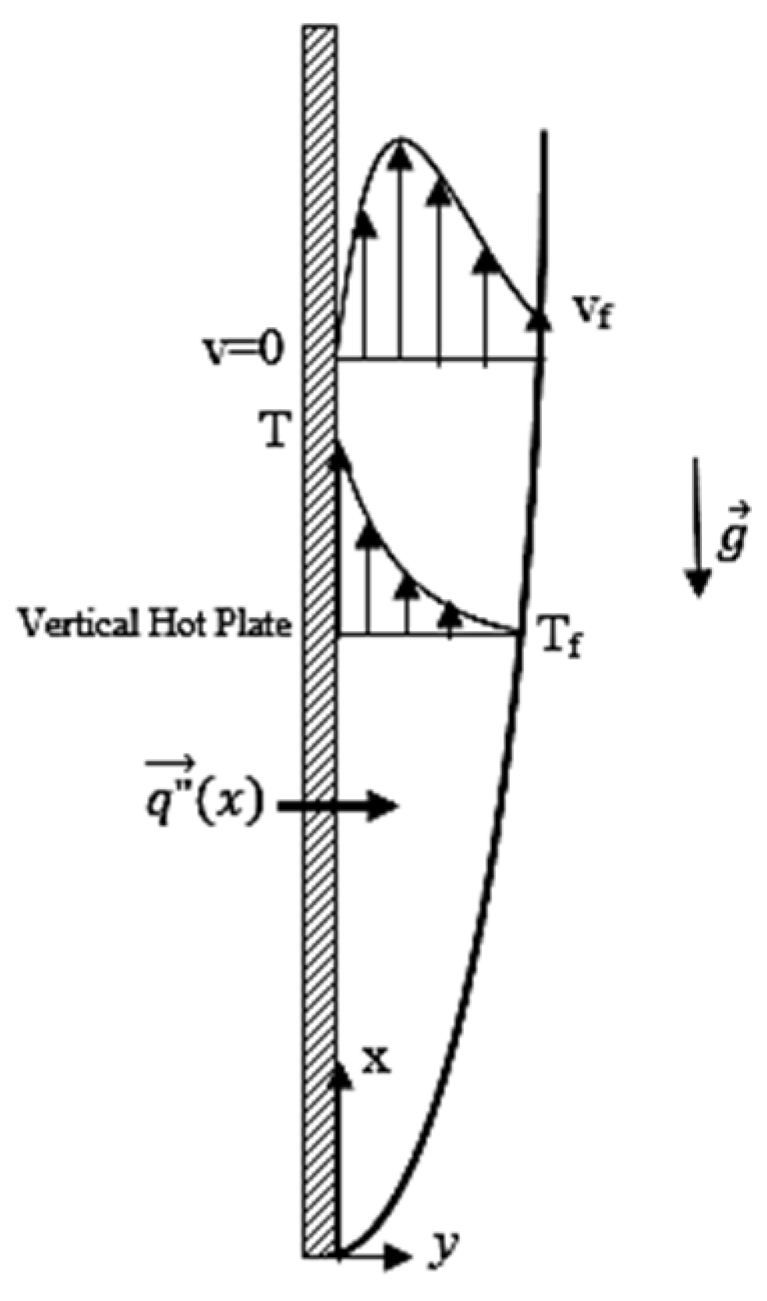
2.2.2. Validation of Numerical Model of Nusselt Number of Natural Convection in Vertical Walls

Before we apply computational numerical methods using CFD software to investigate heat production in batteries by the calculation of convection heat transfer through the battery surface, it is important to carry out a systematic validation study. The validation study involved the application of analytical and empirical concepts of heat transfer to an isothermal vertical plate. The first step taken is to validate the Nusselt number of natural convection along a vertical walls, with air as the working medium. The temperature difference occurring on the surface of the vertical battery wall induces airflow particle movement. In accordance with the principles of mass, momentum, and energy balance, alterations in particle motion stem from variations in mass density (buoyancy) and gravitational forces (body force). A thermal boundary layer will form on the surface of the plate, as depicted in Figure 4.
The rate of heat released on the battery surface is quantified as the heat flux, denoted as q″ which relies on the Nusselt number, represented as N u ¯ . This dimensionless parameter determines the convection heat transfer coefficient, h, at each characteristic length x and wall temperature, given in Equation (8).
N u ¯ = h x k f
In Equation (8) the parameter k f represents the thermal conductivity of the film layer with the arithmetic average temperature equal to the ambient fluid temperature.
Calculation of the value   N u ¯ can also employ the Newton cooling flux correlation for convection heat transfer. Equation (8) can be expressed by substituting the convection coefficient parameter h as follows in Equation (9).
N u ¯ x = q ¯ T T f x k f  
w h e r e   q ¯   x = 0 x q ( x ) d x x
q ( x ) represents the local heat flux value on the vertical wall of the battery obtained from the results of numerical modeling of convection heat transfer in open space.
T and T f respectively, denote the local wall temperature and open-air temperature, based on the temperature values specified as the simulation boundary conditions.
The Nusselt number N u ¯ x obtained from numerical modeling is subsequently validated against the calculation results referenced in [21,24].
Numerical modeling to obtain q ( x ) is carried out using a rectangular 2D model measuring 366 mm high and 500 mm wide as shown in the Figure 5. The 366 mm height corresponds to the vertical wall of the battery, while the 500 mm width is determined by assuming that fluid flow in this zone occurs under conditions outside the boundary layer. The simulation domain is defined with the following boundary conditions:
  • The left side represents the vertical flat boundary wall of the battery and is assigned an initial temperature range of 30–90 °C. This value is taken to represent the results of the battery vertical wall temperature test, as in Table 1.
  • The bottom side is an adiabatic wall, representing the floor of the test chamber where the battery is placed.
  • The top side is defined as the room air pressure outlet boundary.
  • The right side represents a virtual boundary wall, reflecting the ambient air temperature condition set at 25 °C.
Figure 5. Simulation model for heat transfer in vertical flat walls.
Wevj 15 00013 g005
The assumptions applied in this 2D numerical modeling are:
(a)
Stationary airflow is laminar flow.
(b)
Air is treated as an ideal gas, with constant physical properties, and it is considered incompressible and a Newtonian fluid.
(c)
We neglect work due to viscous forces and pressure, and we assume there is no source term.
(d)
We disregard heat transfer due to surface radiation.
(e)
We assume airflow is slow and natural, maintaining a balanced state.

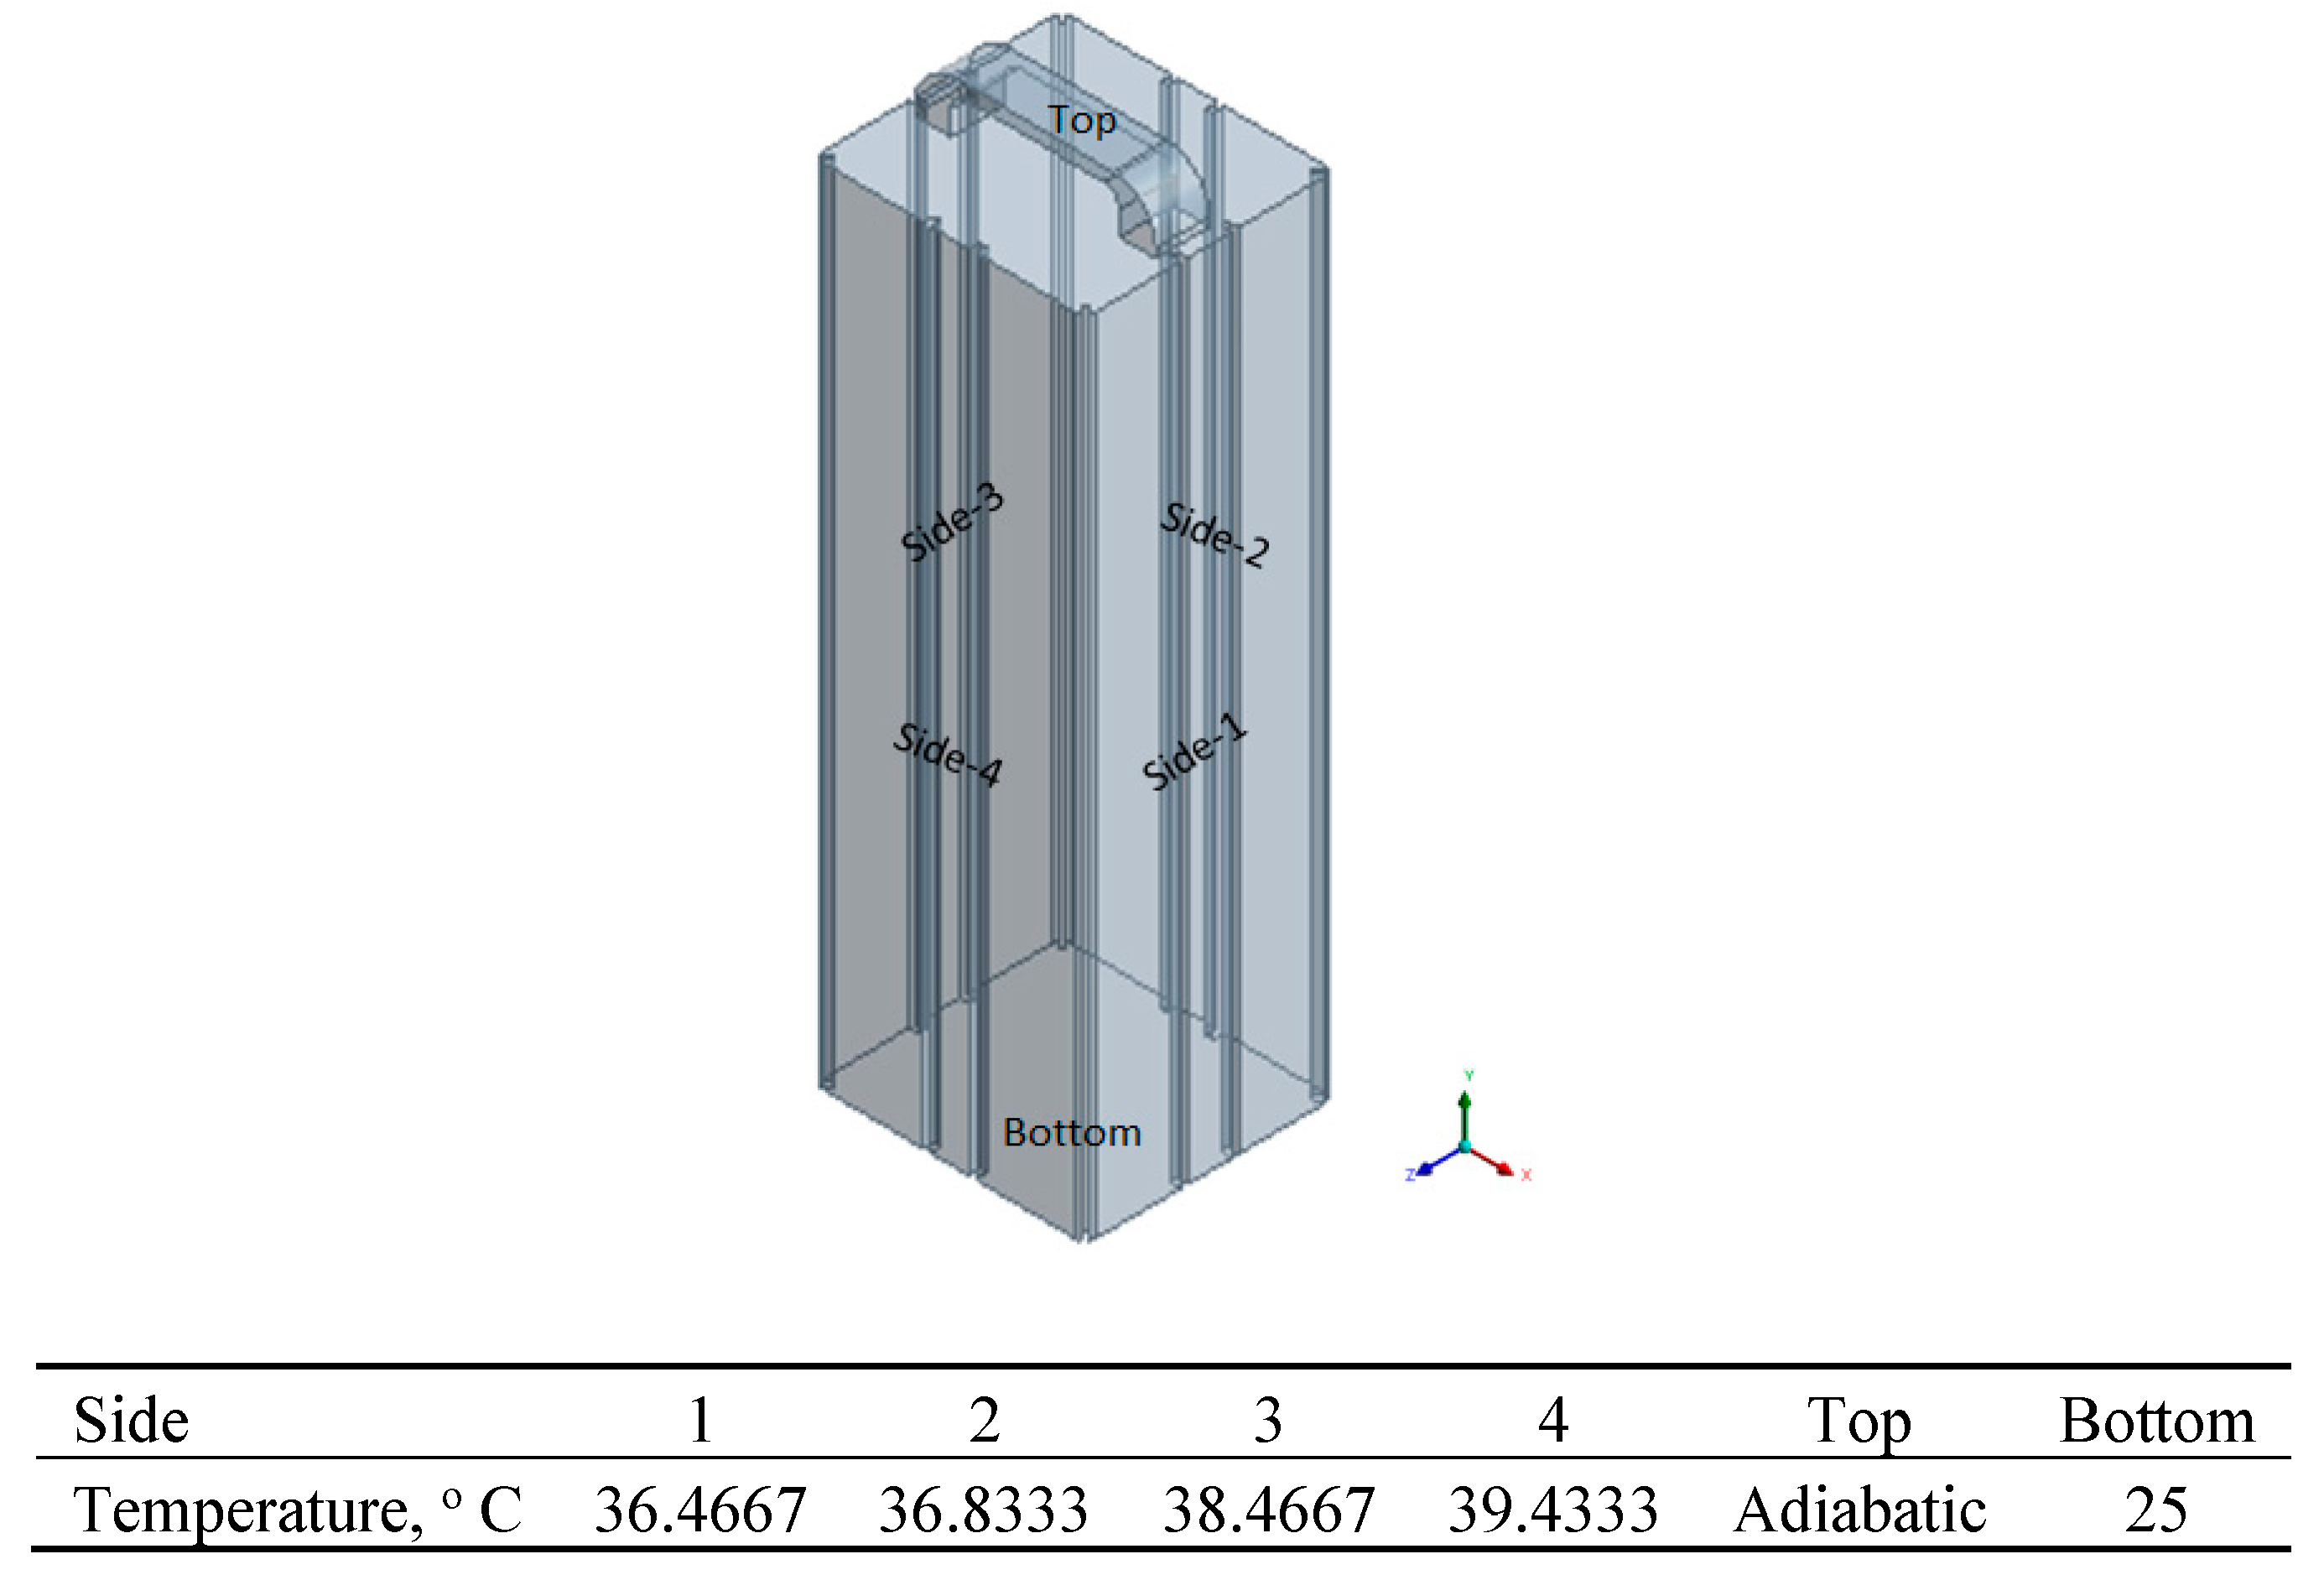
2.2.3. Numerical Investigation of Heat Production in Electric Vehicle Battery Using CFD Software

(a)
Geometry modeling and domain simulation
The object under study is a 72 V–20 Ah Li-ion battery with dimensions of 127 mm in length, 116 mm in width, and 366 mm in height, manufactured by Indonesian state-owned company. The battery pack is modeled as 3D object using Ansys Fluent 2020 R1©, and to be positioned within a space measuring 3000 mm in length, 3000 mm in width, and 500 mm in height. The battery and the simulation domain are depicted in Figure 6.
(b)
Boundary Conditions
The problem under investigation is the three-dimensional heat transfer to obtain the heat flux from all four vertical sides of the battery surface. Convection between the battery surface and environmental air is assumed to be purely natural convection [25]. The horizontal wall (top cover and bottom cover) is adiabatic, and the vertical wall is isotherm at different temperatures, according to the test results in the dyno testing laboratory. Tw1.1, Tw1.2, and Tw1.3 to Tw4.3 in Figure 7 is the distribution of the surface temperature of the battery as tested in the dyno-test laboratory, each of which is shown in Table 1. This temperature refers to the discharging test results as shown in Section 3.2.
The assumptions and boundary conditions applied in this 3D numerical modeling are similar to the 2D model, except for the following:
(a)
The vertical boundary of the side edge of the domain is treated as wall with a temperature of 25 °C.
(b)
The horizontal boundaries of the lower and upper edges are adiabatic walls, representing the floor space and boundaries that no longer affect the heat transfer process from the battery.
(c)
On the vertical wall of the battery surface, the temperature is based on the average measurements from the three zones on each side, while the top surface is treated as an adiabatic wall.

3. Results and Discussion

3.1. RPM Mapping Test for Maximum Power

The BLDC motor performance test, or RPM mapping test for maximum power with the throttle fully open, has yielded results for rated torque, BLDC-shaft power, dyno rotation, and testing time. As a variable, the test rotation is determined in the range of 400 RPM to 2500 RPM and its repeatability, and a performance curve is obtained, as shown in Figure 8. The average values are presented in the following Table 2. It appears that when the BLDC motor operates at low rotational speed, it generates low shaft power but with high rotational torque. As the rotational speed of the electric motor increases, the torque load decreases, while the shaft power increases. The electric motor reaches its maximum shaft power when the motor’s rotational speed is approximately 2000 RPM. We refer to this speed as the optimal RPM, and under this condition, the electric motor produces its maximum work output. At this optimal RPM, the electric motor achieves a maximum power of 1.7 kW and a torque of 8.16 N·m.

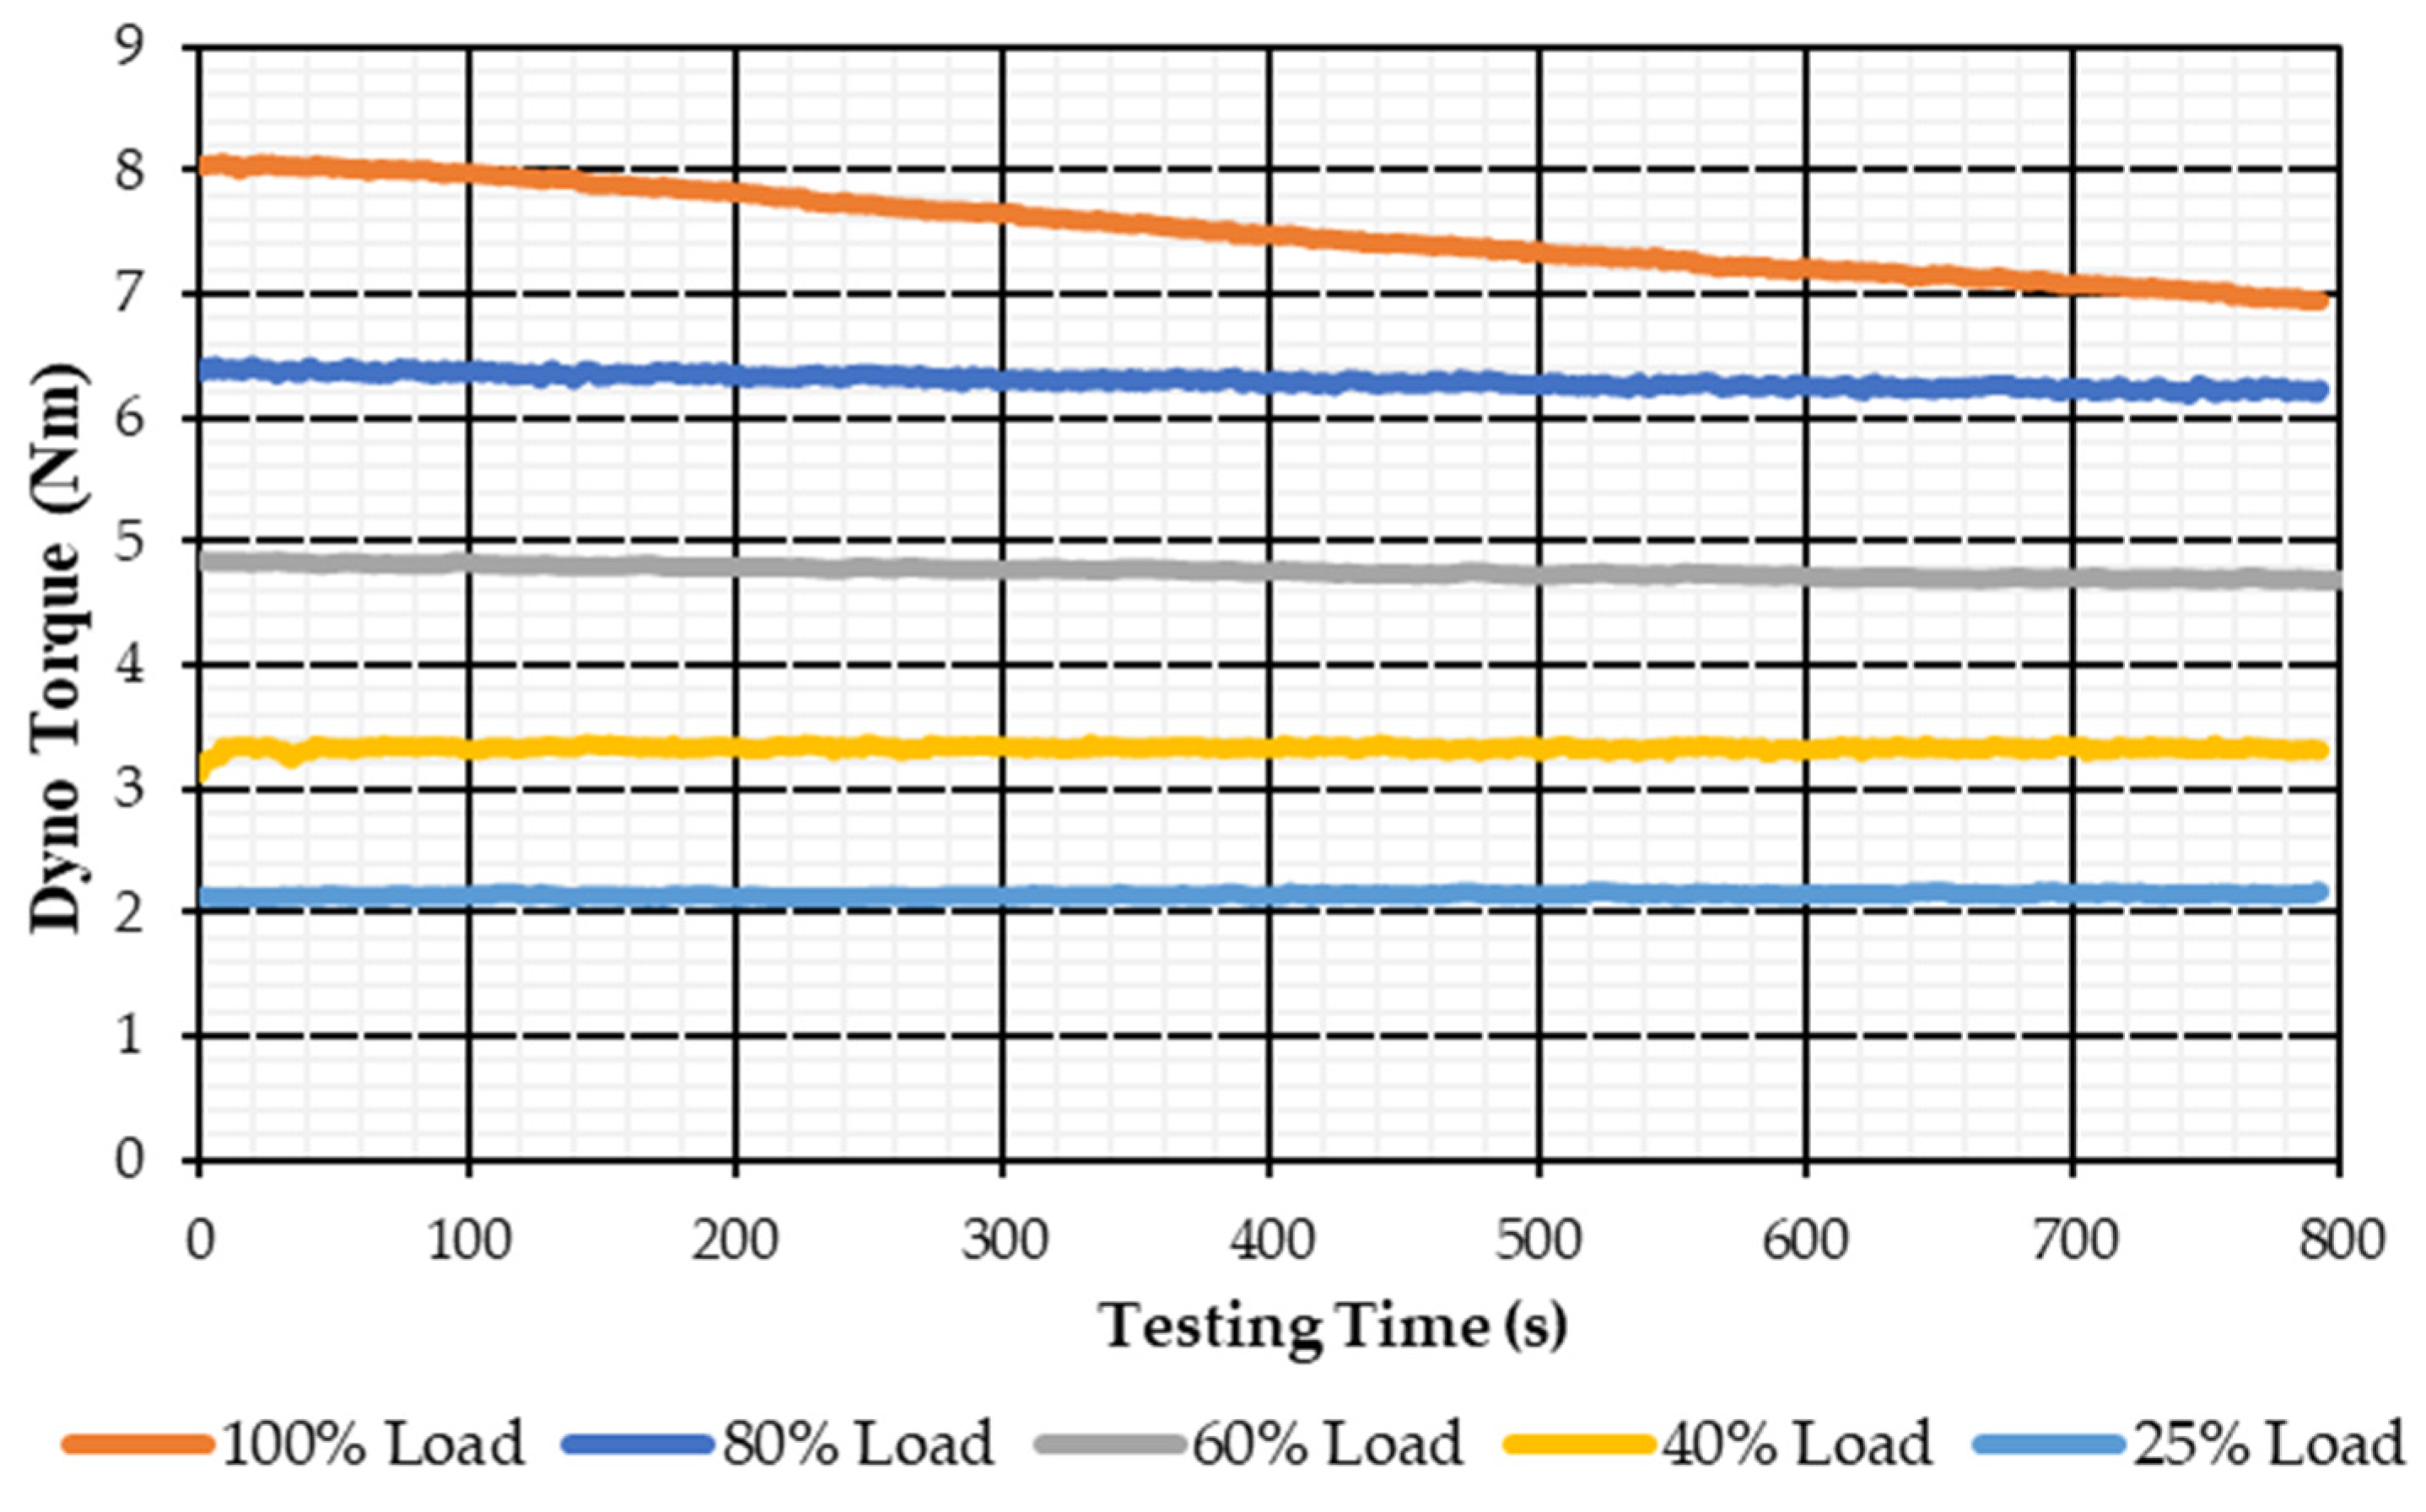
3.2. Battery Thermal Characteristic

The battery thermal characteristic test (discharging test with torque load variations) method has been explained in Section 2.1.3. To characterize the battery thermally, the observation of the recorded average battery surface temperature is maintained for 8000 s, as illustrated in Figure 9.
It can be observed that at 100% torque load, the increase in the battery’s surface temperature is more rapid, and the discharging time period is shorter compared to a lower torque load. This demonstrates that the electric current consumption from the battery is directly proportional to the amount of torque load.
At the end of the discharging period, the average surface temperature of the battery under 100% torque load is 37.8 °C (with a discharging time of 2300 s). For lower torque loads of 80%, 60%, 40%, and 25%, the average surface temperature of the battery is 36.2 °C, 33.5 °C, 31.2 °C, and 30.3 °C, respectively, with corresponding discharging times of approximately 2300, 3500, 5200, and 8000 s, respectively. The complete temperature values on each side of the battery surface at the beginning and end of the test period are presented in Table 3. Based on the observed temperature distribution, it appears that the temperatures on the surfaces of S3 and S4 in the middle and bottom exceed the optimal limit for battery operation [10].
In this test, the period during which the measured torque load starts to decrease from the target setting point is also observed. Observations were restricted to a duration of 800 s, as depicted in Figure 10. The selection of the 800 s timeframe is based on the point at which a decrease in the measured torque value was observed in the test results. It can be seen that at 100% load, the measured dyno torque value starts to decrease from the target setting value at the 100th second of the discharging test period. However, at lower loads, a significant decline in battery performance has not been observed over period of 800 s period.

3.3. Validation of Numerical Model of Nusselt Number of Natural Convection in Vertical Walls

The validation of the surface natural convection modeling of a battery pack in an open space involved the application of analytical and empirical concepts of heat transfer to an isothermal vertical plate. A 2D rectangular model and the boundary conditions were built as defined in the previous section. The number of grids was determined through a mesh independency test. The computational domain comprises three grid sizes. The analysis of the grid independence test reveals that a mesh size of 20,000 cells provides sufficient independence from the other sizes, as shown in Figure 11.

3.4. Numerical Investigation of Heat Production in Electric Vehicle Battery

This simulation of natural convection on the surface of an electric battery pack utilizes test results obtained at 100% torque load and the commercial modeling tool Ansys Fluent R1 2020©. The computational domain employs a tetrahedral mesh type with a total of 1,340,486 cells, as depicted in Figure 12. All vertical wall surface temperatures as presented in Figure 13 and room temperatures serve as boundary conditions in the modeling, accounting for gravitational effects.
The next verification process in the analysis of heat transfer modeling for open space electric battery modules pertains to the hydrodynamic behavior of airflow due to variations in density and external body forces. Analytically, changes in temperature around the wall will impact the rate of heat transfer, as described earlier.
The results of the simulation analysis in Figure 14 demonstrate changes in the velocity vector distribution v at a specific elevation, affecting all directions. The velocity distribution graph indicates the presence of a negative velocity vector attributed to variations in density and airflow rate.
In the analysis of natural convection heat transfer on the surface of the electric battery, the wall heat flux parameter is used and processed with an empirical reference to determine the total heat rate dissipated by all four sides of the tested battery surface. Figure 15 below displays the heat flux distribution of the simulation results.
The natural convection heat transfer on the vertical wall of the electric battery, depicted in Figure 15 above, reveals a distribution of heat flux values with a decreasing trend as values change along the height of the wall. This phenomenon is attributed to variations in air velocity influenced by the hydrodynamic layer effect on the wall surface. The presence of a velocity gradient along the wall’s elevation results in a different mass flow rate flux, impacting the cooling air capacity.
In addition, the heat flux distribution, as shown in Figure 15, is integrated along the wall height to obtain an average value (refer to Equation (10)). This average value is used to calculate the average Nusselt number ( N u ¯ ), referring to Equation (9), and validated using the empirical formula referenced in [21,24], as shown in Figure 16.
It is shown that the CFD simulation results produce good accuracy within the range of Rayleigh numbers being analyzed. Based on the results of the average heat flux on the wall surface, it was found that the rate of heat production in the case of the commercial electric battery was 1199 W/m3.

4. Conclusions

The numerical model for calculating the average Nusselt number, used for the investigation of heat production, was first validated based on commonly used empirical correlations for natural convection along vertically heated walls. Good agreement between the current predictions and empirical correlations is found for flows in the laminar regime. In the experimental Rayleigh number range 2.19 × 10⁷ to 18.5 × 10⁷ there is a good agreement between the CFD and Churchill numbers [24]. The difference ranges from 2.05% to 3.07%. When compared with Yang [21] the difference in Nusselt number ranges from 8.68% to 9.77%.
Based on the numerical investigation of natural convection, it was found that the heat generation in the battery volume was 1199 W/m3. Numerical investigations were performed using a 3D geometry model, considering the temperature results obtained from testing the thermal characteristics of commercial electric vehicle batteries in a laboratory room as boundary conditions.
This investigation of the heat generation rate will be useful as an input parameter for battery thermal analysis when the battery operates within the confined space of a real electric vehicle.

Author Contributions

Conceptualization, B.T.P.; methodology, B.T.P.; software, M.P.H. and H.P.; validation, A.M., H.P. and H.S.; formal analysis, M.P.H.; investigation, B.T.P. and H.P.; resources, K.P.S., B.N., R.T.S. and R.J.K.; data curation, R.T.S., K.P.S., B.N., D.H.A. and A.M.F.; writing—original draft preparation, H.P.; writing—review and editing, A.P.N., C. and H.P.; visualization, F.; supervision, H.P.; project administration, I.G.A.U.; funding acquisition, I.G.A.U. All authors have read and agreed to the published version of the manuscript.

Funding

This research was funded by the National Research and Innovations Agency (BRIN) through funding Electric Vehicles Program-Electronic and Informatics Research Organization 2022 (SK Ka-ORIPT No. 2/III/HK/2022).

Data Availability Statement

Data are contained within the article.

Acknowledgments

The authors would like to thank all the support from the Management of the Electric Vehicles Program 2022․Research Organization for Electronics and Informatics and supporting the tools facility of CFD Simulation-Ansys Fluent© R1 2020. We also appreciate the good cooperation to Bagus Anang Nugroho, Ariyanto, Yaaro Telaumbanua, Mohammad Mukhlas AF., Dedy Indriatmono, and Kartini from National Research and Innovation Agency, who have helped in this research and shared their knowledge and experience in the field of testing, measurement, and validation of results in improving this paper.

Conflicts of Interest

The authors declare no conflict of interest. H.P., B.T.P., R.T.S., H.S., A.M., M.P.H., K.P.S., B.N., A.M.F., D.H.A., R.J.K., A.P.N., F., C. and I.G.A.U. are employee in National Research and Innovation Agency Republic of Indonesia (BRIN) and Ministry of Mineral Resources and Energy Republic of Indonesia (Kementerian ESDM-RI).

References

  1. Albuquerque, F.D.B.; Maraqa, M.A.; Chowdhury, R.; Mauga, T.; Alzard, M. Greenhouse gas emissions associated with road transport projects: Current status, benchmarking, and assessment tools. Transp. Res. Procedia 2020, 48, 2018–2030. [Google Scholar] [CrossRef]
  2. Martins, T.; Barreto, A.C.; Souza, F.M.; Souza, A.M. Fossil fuels consumption and carbon dioxide emissions in G7 countries: Empirical evidence from ARDL bounds testing approach. Environ. Pollut. 2021, 291, 118093. [Google Scholar] [CrossRef] [PubMed]
  3. Hannan, M.A.; Hoque, M.D.M.; Hussain, A.; Yusof, Y.; Ker, A.P.J. State-of-the-art and energy management system of lithium-ion batteries in electric vehicle applications: Issues and recommendations. IEEE Access 2018, 6, 19362–19378. [Google Scholar] [CrossRef]
  4. Miao, Y.; Hynan, P.; von Jouanne, A.; Yokochi, A. Current Li-ion battery technologies in electric vehicles and opportunities for advancements. Energies 2019, 12, 1074. [Google Scholar] [CrossRef]
  5. Liu, W.; Jia, Z.; Luo, Y.; Xie, W.; Deng, T. Experimental investigation on thermal management of cylindrical Li-ion battery pack based on vapor chamber combined with fin structure. Appl. Therm. Eng. 2019, 162, 114272. [Google Scholar] [CrossRef]
  6. Luo, J.; Zou, D.; Wang, Y.; Wang, S.; Huang, L. Battery thermal management systems (BTMs) based on phase change material (PCM): A comprehensive review. Chem. Eng. J. 2022, 430, 132741. [Google Scholar] [CrossRef]
  7. Bhatt, K.D.; El Darieby, M. An assessment of batteries form battery electric vehicle perspectives. In Proceedings of the 2018 IEEE International Conference on Smart Energy Grid Engineering (SEGE), Oshawa, ON, Canada, 12–15 August 2018; IEEE: Toulouse, France, 2018; pp. 255–259. [Google Scholar]
  8. Hu, M.; Wang, J.; Fu, C.; Qin, D.; Xie, S. Study on cycle-life prediction model of lithium-ion battery for electric vehicles. Int. J. Electrochem. Sci. 2016, 11, 577–589. [Google Scholar] [CrossRef]
  9. Liu, W.; Placke, T.; Chau, K.T. Overview of batteries and battery management for electric vehicles. Energy Rep. 2022, 8, 4058–4084. [Google Scholar] [CrossRef]
  10. Yi, F.; E, J.; Zhang, B.; Zuo, H.; Wei, K.; Chen, J.; Zhu, H.; Zhu, H.; Deng, Y. Effects analysis on heat dissipation characteristics of lithium-ion battery thermal management system under the synergism of phase change material and liquid cooling method. Renew. Energy 2022, 181, 472–489. [Google Scholar] [CrossRef]
  11. Choudhari, V.; Dhoble, A.; Sathe, T. A review on effect of heat generation and various thermal management systems for lithium ion battery used for electric vehicle. J. Energy Storage 2020, 32, 101729. [Google Scholar] [CrossRef]
  12. Bhattacharjee, A.; Mohanty, R.K.; Ghosh, A. Design of an optimized thermal management system for Li-ion batteries under different discharging conditions. Energies 2020, 13, 5695. [Google Scholar] [CrossRef]
  13. Ziat, K.; Louahlia, H.; Petrone, R.; Gualous, H.; Schaetzel, P. Experimental investigation on the impact of the battery charging/discharging current ratio on the operating temperature and heat generation. Int. J. Energy Res. 2021, 45, 16754–16768. [Google Scholar] [CrossRef]
  14. Diaz, L.B.; Hales, A.; Marzook, M.W.; Patel, Y.; Offer, G. Measuring irreversible heat generation in lithium-ion batteries: An experimental methodology. J. Electrochem. Soc. 2022, 169, 030523. [Google Scholar] [CrossRef]
  15. Cao, R.; Zhang, X.; Yang, H.; Wang, C. Experimental study on heat generation characteristics of lithium-ion batteries using a forced convection calorimetry method. Appl. Therm. Eng. 2023, 219, 119559. [Google Scholar] [CrossRef]
  16. Yin, Y.; Zheng, Z.; Choe, S.-Y. Design of a calorimeter for measurement of heat generation rate of lithium ion battery using thermoelectric device. SAE Int. J. Altern. Powertrains 2017, 6, 252–260. [Google Scholar] [CrossRef]
  17. Drake, S.J.; Martin, M.; Wetz, D.A.; Ostanek, J.K.; Miller, S.P.; Heinzel, J.M.; Jain, A. Heat generation rate measurement in a Li-ion cell at large C-rates through temperature and heat flux measurements. J. Power Sources 2015, 285, 266–273. [Google Scholar] [CrossRef]
  18. Kanon Prabandaru Sumarah, M.P. A Study on the Influence of Torque Variation to Surface Temperature Distribution of Electric Vehicle Battery. In Proceedings of the International Conference on Heat Transfer, Energy and Mechanical Innovations, Yogyakarta, Indonesia, 31 May 2022. (publishing in process). [Google Scholar]
  19. Patankar, S.V.; Spalding, D.B. A calculation procedure for heat, mass and momentum transfer in three-dimensional parabolic flows. Int. J. Heat Mass Transf. 1972, 15, 1787–1806. [Google Scholar] [CrossRef]
  20. Bejan, A. Convection Heat Transfer; John Wiley & Sons: New York, NY, USA, 2013. [Google Scholar]
  21. Yang, H.Q.; West, J. CFD extraction of heat transfer coefficient in cryogenic propellant tanks. In Proceedings of the 51st AIAA/SAE/ASEE Joint Propulsion Conference, Orlando, FL, USA, 27–29 July 2015; p. 3856. [Google Scholar]
  22. Afzal, A.; Kaladgi, A.R.; Jilte, R.; Ibrahim, M.; Kumar, R.; Mujtaba, M.; Alshahrani, S.; Saleel, C.A. Thermal modelling and characteristic evaluation of electric vehicle battery system. Case Stud. Therm. Eng. 2021, 26, 101058. [Google Scholar] [CrossRef]
  23. Hwang, H.-Y.; Chen, Y.-S.; Chen, J.-S. Optimizing the heat dissipation of an electric vehicle battery pack. Adv. Mech. Eng. 2015, 7, 204131. [Google Scholar] [CrossRef]
  24. Churchill, S.W.; Chu, H.H. Correlating equations for laminar and turbulent free convection from a vertical plate. Int. J. Heat Mass Transf. 1975, 18, 1323–1329. [Google Scholar] [CrossRef]
  25. Ismail, N.H.F.; Toha, S.F.; Azubir, N.A.M.; Ishak, N.H.M.; Hassan, I.D.M.K.; Ibrahim, B.S.K. Simplified heat generation model for lithium-ion battery used in electric vehicle. IOP Conf. Ser. Mater. Sci. Eng. 2013, 53, 012014. [Google Scholar] [CrossRef]
Figure 1. Experimental setup diagram of surface temperature distribution.
Wevj 15 00013 g001
Figure 2. Battery thermal characteristics testing algorithm diagram.
Wevj 15 00013 g002
Figure 3. Discharging test diagram of lithium-ion electric battery pack with varied torque loading.
Wevj 15 00013 g003
Figure 4. Thermal boundary layer and velocity gradient over vertical hot plate surface.
Wevj 15 00013 g004
Figure 6. The battery’s geometry and the dimensions of the simulation domain.
Wevj 15 00013 g006
Figure 7. Temperature surface measurement points in testing commercial battery packs.
Wevj 15 00013 g007
Figure 8. Performance test curve of BLDC motor for nominal RPM mapping (a) Dyno torque and BLDC-shaft power (b) Dyno rotation during test.
Wevj 15 00013 g008
Figure 9. Battery pack average surface temperature change rate at 100%, 80%, 60%, 40%, and 25% torque load conditions during discharge test—data from [18].
Wevj 15 00013 g009
Figure 10. Observation of measured dyno torque when tested at optimal RPM.
Wevj 15 00013 g010
Figure 11. Mesh indepedency test on electrical battery natural convection modeling (a) Mesh generation (b) Comparing mesh over wall temperature range.
Wevj 15 00013 g011
Figure 12. Computational Domain of Open Space Simulation.
Wevj 15 00013 g012
Figure 13. Boundary condition of test result temperature on battery pack surface—adapted from reference [18].
Wevj 15 00013 g013
Figure 14. The airflow pattern of electric battery around the open space as a result of modeling (a) Velocity vector (b) Vertical velocity distribution curve ( v ) on the XY section.
Wevj 15 00013 g014
Figure 15. Simulation results of natural convection electric battery surface (a) Wall heat flux contour profile (b) Heat flux distribution curve on 4 vertical walls.
Wevj 15 00013 g015
Figure 16. Comparison of CFD and empirical correlations for mean Nusselt number as in [21,24].
Wevj 15 00013 g016
Table 1. Battery packs wall temperature at 100% torque load.
NoSurface ZoneSectionTemperature, °C
1Batwal1Bottom (1)Tw1.136
2Middle (2)Tw1.237
3Top (3)Tw1.336.4
4Batwal2Bottom (1)Tw2.137.3
5Middle (2)Tw2.237
6Top (3)Tw2.336.2
7Batwal3Bottom (1)Tw3.136.4
8Middle (2)Tw3.238.5
9Top (3)Tw3.340.5
10Batwal4Bottom (1)Tw4.138.2
11Middle (2)Tw4.240.3
12Top (3)Tw4.339.8
Table 2. Performance Data of BLDC motor at full throttle and varied RPM.
Identified ParameterTarget Speed (RPM-Set)Actual Speed (RPM Read)Dyno Torque (N·m)Engine Power (kW)Room Temp. (°C)Room Humid (% RH)Throttle Motlis (% Opening)
25002518.796.101.6125.6077.03100
24002396.326.541.6425.6077.32100
22002191.217.241.6625.6077.16100
Max Power20001993.298.161.7025.6077.28100
19001918.628.191.6525.6177.06100
18001814.388.521.6225.6176.93100
16001609.879.511.6025.6077.13100
14001403.4510.821.5925.6076.88100
12001195,3112.411.5525.7076.94100
1000999.1114.521.5225.7077.06100
800791.1717.151.4225.7076.99100
600606.3620.581.3125.7077.33100
400417.4024.921.0925.7077.27100
Table 3. Temperature distribution of each side of the battery surface at the initial and final of the discharging test.
Load
Percentage
Initial Temperature (°C)Final Temperature (°C)Point
Section
S1S2S3S4S1S2S3S4
25%25.125.32624.530.53030.330.1Top
2525.225.724.630.530.230.430.6Middle
25.225.124.724.529.830.430.430.2Bottom
40%24.624.625.523.931.330.731.231.2Top
24.724.725.22430.931.131.531.3Middle
24.724.624.223.93131.431.631.5Bottom
60%25.42525.424.533.432.133.134.1Top
25.425.225.224.633.73333.834.1Middle
2425.324.624.532.733.934.534.1Bottom
80%24.32424.423.335.434.635.436.5Top
24.224.224.223.536.735.43636.3Middle
23.92423.523.435.936.138.437.6Bottom
100%2424.124.723.436.436.236.438.2Top
23.92424.523.4373738.540.3Middle
2423.923.523.23637.340.539.8Bottom
Remarks: S1: Surface Zone No.1S3: Surface Zone No.3
S2: Surface Zone No.2S4: Surface Zone No.4
Disclaimer/Publisher’s Note: The statements, opinions and data contained in all publications are solely those of the individual author(s) and contributor(s) and not of MDPI and/or the editor(s). MDPI and/or the editor(s) disclaim responsibility for any injury to people or property resulting from any ideas, methods, instructions or products referred to in the content.

