Article

Electrochemical Impedance Spectrum (EIS) Variation of Lithium-Ion Batteries Due to Resting Times in the Charging Processes

1
Space Power Technology State Key Laboratory, Shanghai Institute of Space Power-Sources, 2965#, Dongchuan Road, Shanghai 200245, China
2
School of Information Science and Technology, Fudan University, 220 Handan Road, Shanghai 200433, China
*
Authors to whom correspondence should be addressed.
World Electr. Veh. J. 2023, 14(12), 321; https://doi.org/10.3390/wevj14120321
Submission received: 26 September 2023 / Revised: 30 October 2023 / Accepted: 20 November 2023 / Published: 24 November 2023
(This article belongs to the Topic Electric Vehicles Energy Management)

Abstract

:
The electrochemical impedance spectrum (EIS) is a non-destructive technique for the on-line evaluation and monitoring of the performance of lithium-ion batteries. However, the measured EIS can be unstable and inaccurate without the proper resting time. Therefore, we conducted comprehensive EIS tests during the charging process and at different state of charge (SOC) levels with various resting times. The test results revealed two findings: (1) EIS tests with a constant long resting time showed a clear pattern in the impedance spectral radius—a decrease followed by a slight increase. We analyzed the impedance data using an equivalent circuit model and explained the changes through circuit parameters. (2) We examined the effect of resting time on impedance at consistent SOC levels. While low SOC levels exhibited significant sensitivity to resting time, medium SOC levels showed less sensitivity, and high SOC levels had minimal impact on resting time. The equivalent circuit parameters matched the observed trends. Kramers–Kronig transformation was conducted to assess the reliability of the experiments. This study not only summarizes the relationship between the EIS and SOC but also highlights the importance of resting time in impedance analysis. Recognizing the role of the resting time could enhance impedance-based battery studies, contribute to refined battery status evaluation, and help researchers to design proper test protocols.

1. Introduction

The electrochemical impedance spectrum (EIS) is an electrochemical technique that measures the impedance curve versus multiple alternating current frequencies [1,2,3]. Because the EIS is a non-destructive and non-invasive technique, it is widely used for the on-line evaluation and monitoring of the performance of lithium-ion batteries [4,5]. For example, in 2011 the authors of [6] used the EIS to evaluate both the state of charge (SOC) and the state of health (SOH), and the authors of [7] used the EIS to investigate the internal mechanisms of lithium-ion batteries. However, the EIS is also influenced by the resting time of the battery during the charge and discharge process [8,9]. If the resting time is not considered, the EIS obtained from the same battery with the same SOC and SOH may vary significantly. Therefore, it is important to study the effect of the resting time on the EIS and find the optimal resting time for accurate and reliable battery evaluation.
The EIS is important for assessing various performance characteristics of batteries. In 2011, the authors of [6] used the EIS to evaluate both the SOC and SOH. In 2021, Gao, Orazem, et al. [10] published a study in Nature highlighting the applications of the EIS in battery performance and electrochemical biosensing. Their research pointed out that the EIS could aid in the elucidation of other fundamental processes, such as: (1) the formation of surface films on electrode materials, (2) interfacial contact issues between different phases, and (3) the depletion of charge carriers within active phases or the electrolyte. Messing et al. [11] recently proposed a strategy to estimate the state of charge (SOC) of a battery using a deep neural network (DNN) and the EIS. The obtained EIS data were fed into the DNN to obtain an accurate battery model and the corresponding parameters.
In addition, some studies have focused on monitoring or predicting other important battery state information. For example, Koleti et al. [12] proposed a new method for lithium precipitation detection based on battery impedance estimation. The in situ impedance-based detection method could detect the onset of lithium precipitation during charging. The authors further stated that this method could operate in real time during charging and could therefore be transferred to a battery management system (BMS). Zhou et al. [13] proposed a model-free physical-level battery diagnostic method combining the EIS and a multi-output relevance vector machine (RVM). The multi-output RVM using impedance data in the low-frequency domain could accurately and robustly identify the curvature, porosity, and fraction of active materials in Monte Carlo simulations. Its potential for practical application in battery monomer performance screening was demonstrated. In addition, Zhang et al. [14] collected EIS data from more than 20,000 commercial lithium-ion batteries under different health states, states of charge, and temperatures. The entire EIS was used as input through a Gaussian process model to automatically determine which spectral features could predict degradation without further feature engineering. The adopted model accurately predicted the remaining lifetime of the battery. In summary, the EIS is an important tool for battery evaluation.
Accurately measuring the EIS is crucial to understanding battery performance. Among all the factors that affect EIS measurement, resting time is important. The resting time is the period during which the battery is not subjected to any current or voltage. If the resting time is not considered, the EIS obtained from the same battery with the same SOC and SOH may vary significantly. In 2013, Waag et al. [15] investigated EIS variation and discovered that the resting time is important to the EIS. In 2015, during a study of the long-term equalization effects due to local state-of-charge inhomogeneities, Noel et al. [16] also pointed out the dependence of the EIS on the resting time. However, how the resting time affects the EIS under different SOC and the extent to which this occurs are still unknown. In particular, regarding the increasingly popular method of SOC assessment using the EIS, this lack of knowledge concerning the sensitivity of the EIS to the resting time at different SOC may lead to significant estimation errors in the SOC or other factors. It is therefore necessary to analyze the effect of the resting time on the EIS at different SOC.
In this study, we specifically investigated the correlation between the EIS value, rest time, and SOC of Li-ion batteries. The test results revealed two findings: (1) EIS tests with a constant long resting time showed a clear pattern in the impedance spectral radius—a decrease followed by a slight increase. We analyzed the impedance data using an equivalent circuit model and explained the changes through circuit parameters. (2) We examined the effect of resting time on impedance at consistent SOC levels. While low SOC levels exhibited significant sensitivity to resting time, medium SOC levels showed less sensitivity, and high SOC levels had minimal impact on the resting time. The equivalent circuit parameters matched the observed trends. Kramers–Kronig transformation was conducted to assess the reliability of the experiments. This study not only summarizes the relationship between the EIS and SOC but also highlights the importance of the resting time in impedance analysis. Recognizing the role of the resting time could enhance impedance-based battery studies, contributes to refined battery status evaluation, and help researchers to build proper test protocols.

2. Method

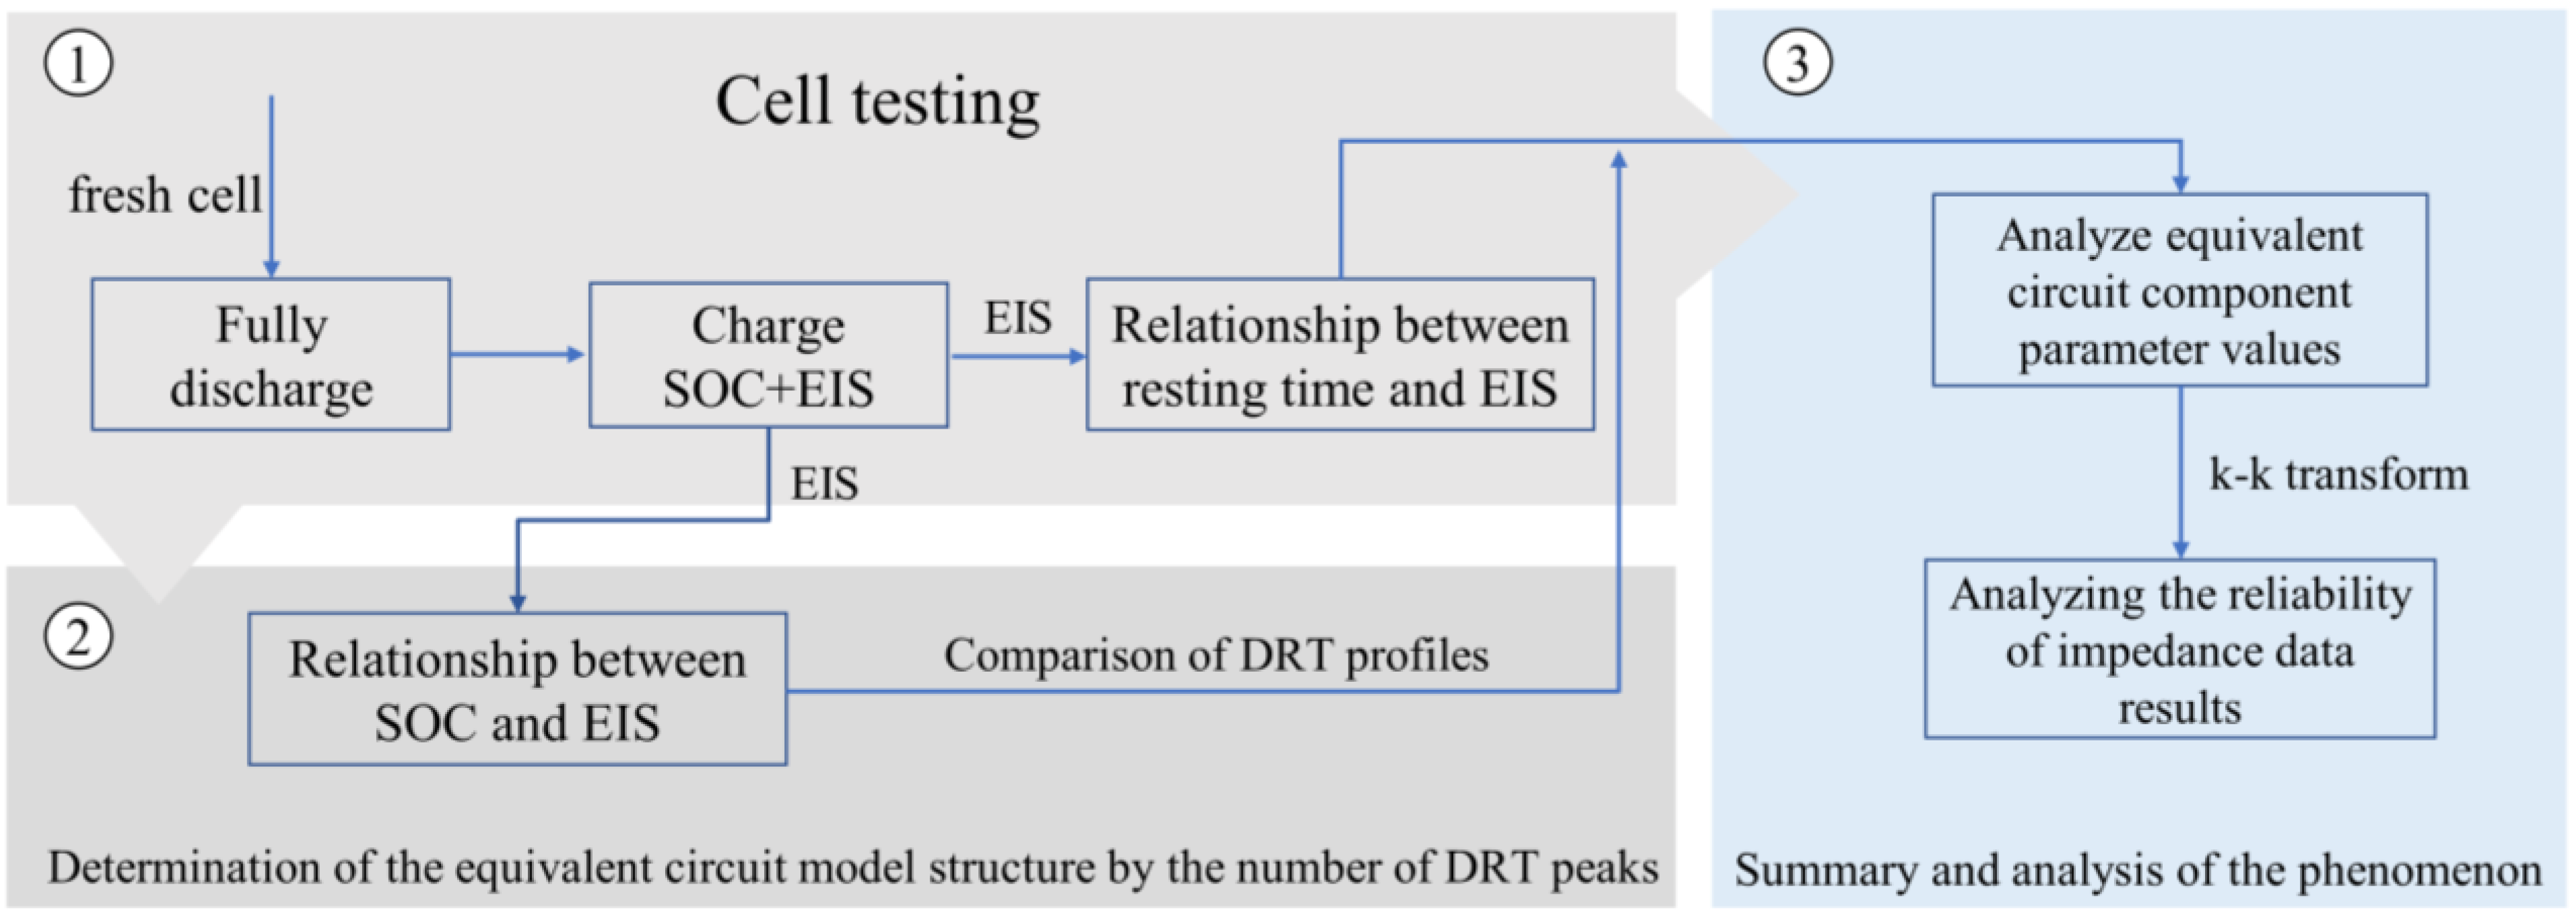
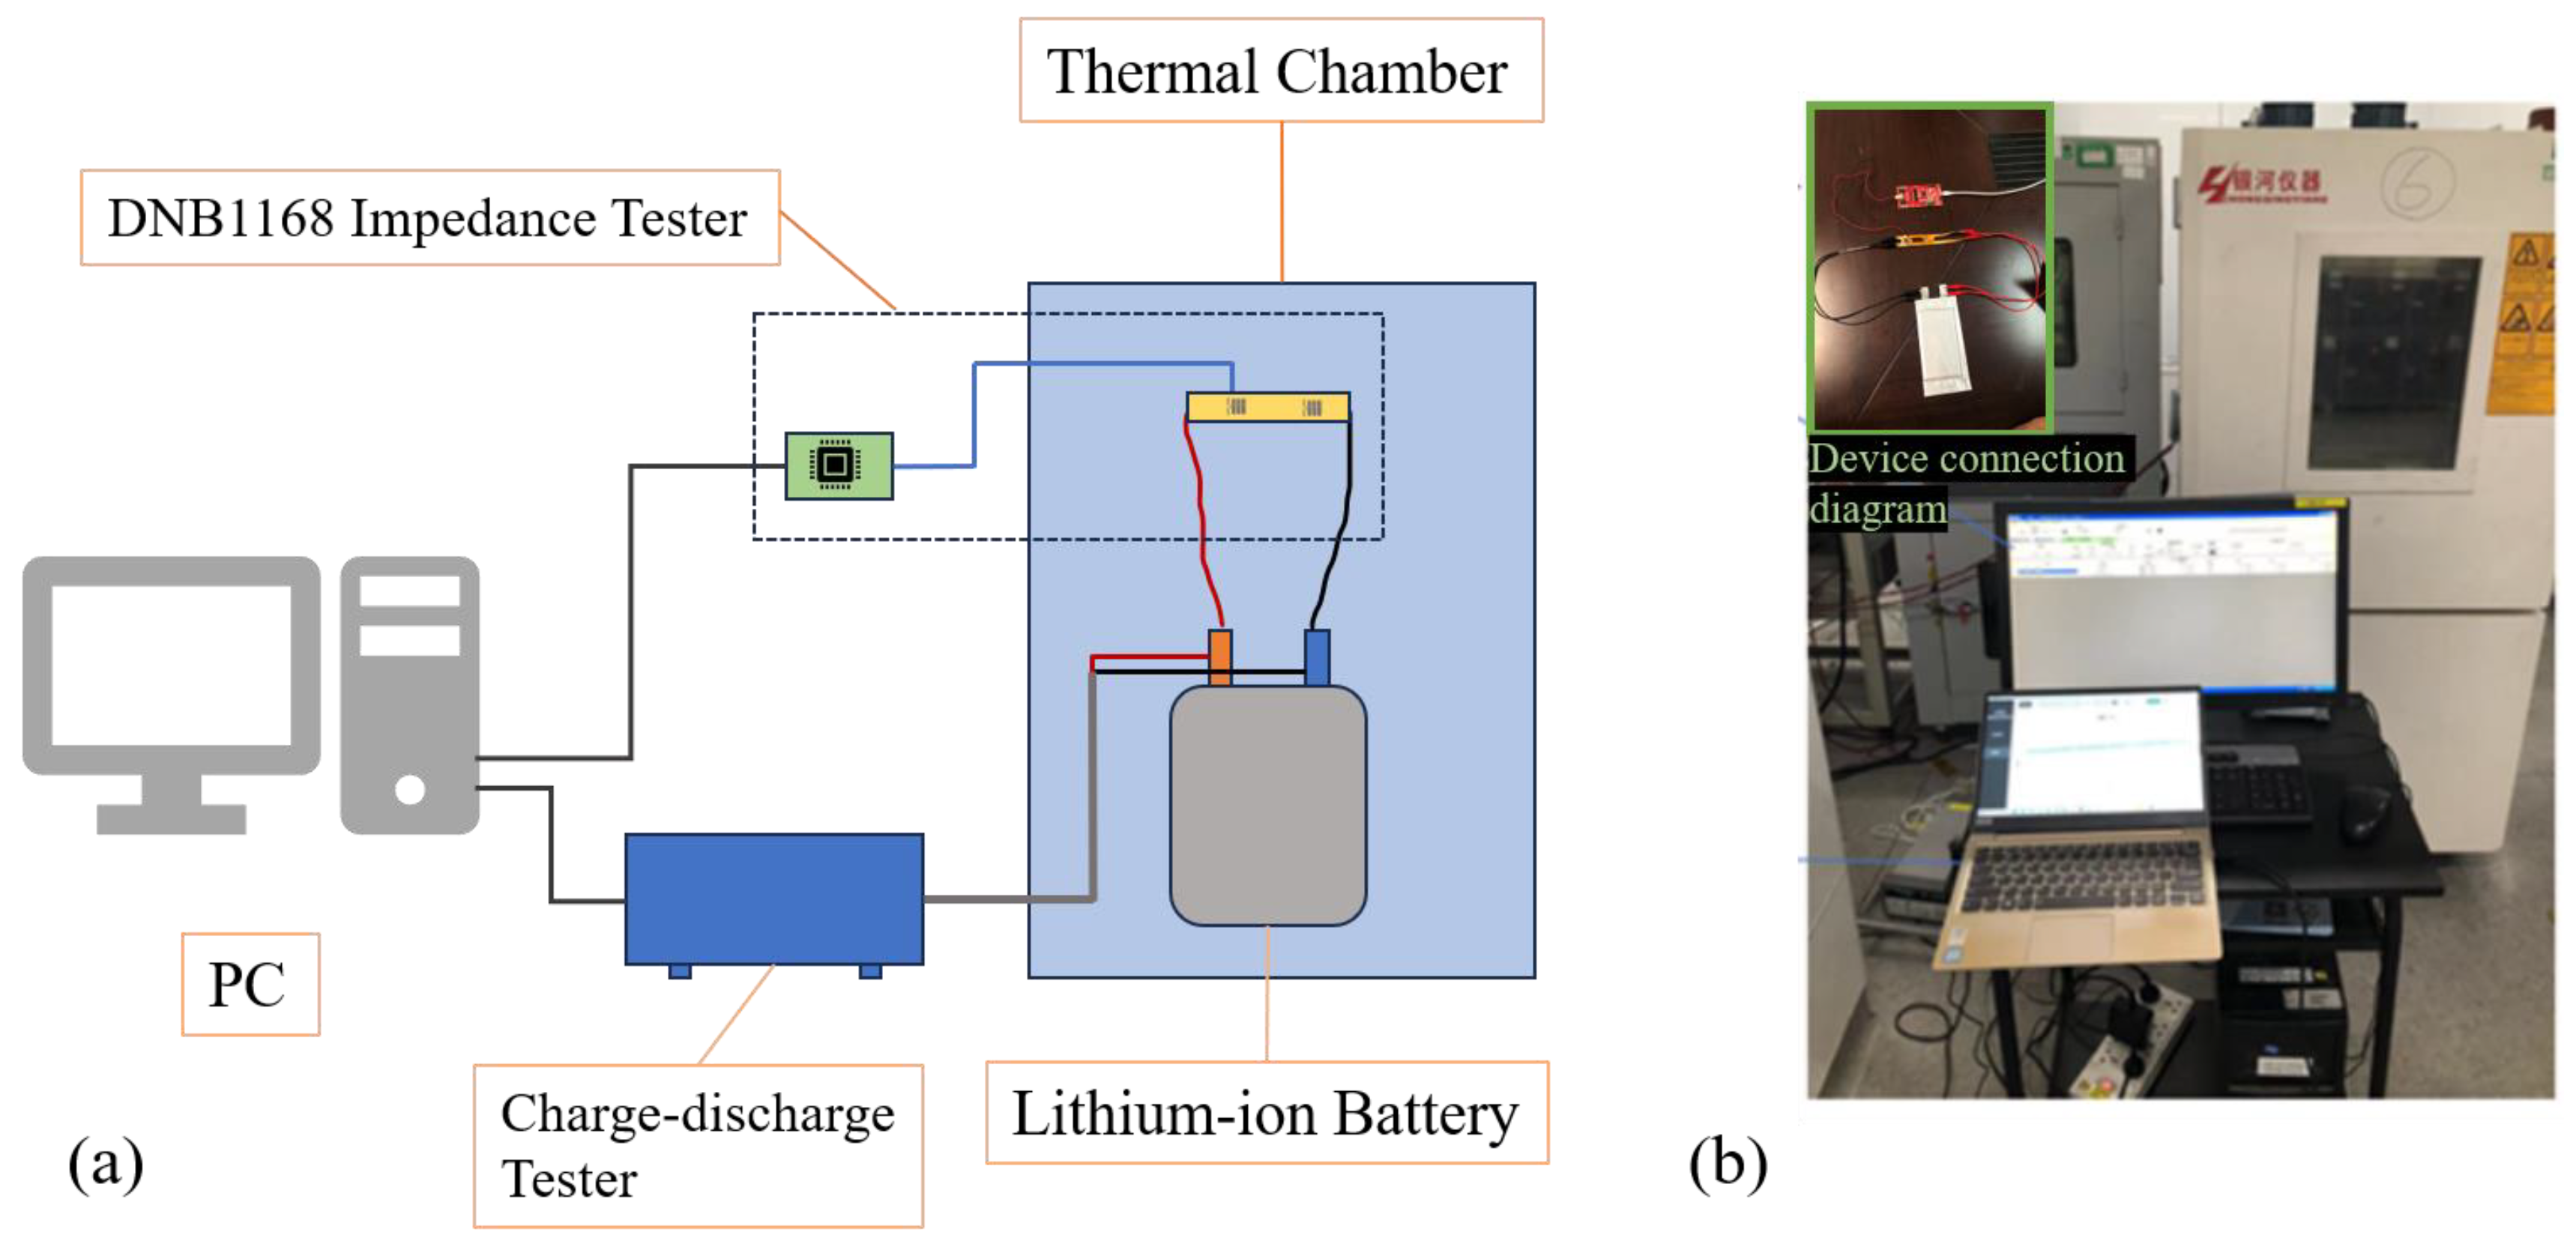
2.1. Measurement Process

In this study, we used an electrochemical impedance spectroscopy test device based on the DNB1168 single-chip test system [17], which has obvious volume and cost advantages over electrochemical workstations. Only one flexible printed circuit board and one acquisition board are needed to measure the EIS of lithium-ion batteries, which solves the problem of the huge volume and high cost of electrochemical workstations for real-time online impedance measurements. This advantage makes it promising for future real-time impedance testing in automotive applications. At the same time, we made our own lithium-ion battery for experimental investigations.
The overall study process is shown in Figure 1. The fresh battery was first fully discharged, and after a period of resting, the charge capacity was controlled to be 5% every time with the charge current set at 0.2 C; then, the EIS test was performed for different resting times. Based on the test results, the variation relationship between the EIS and SOC and the relationship between the EIS and resting time were analyzed by DRT and an equivalent circuit model. Finally, the reliability of the impedance data was analyzed by KK transformation. The ambient temperature of the battery measurement was controlled by a thermal chamber during the test to exclude inconsistencies in the EIS results caused by temperature differences as much as possible. The constructed experimental test platform is shown in Figure 2. The experimental control of battery charging and discharging was achieved by LANDdt. The charging process was suspended every 15 min to perform the EIS test, which included measurements of different resting times, namely immediate measurements at the end of 10 s, measurements at 15 min of resting, measurements at 30 min of resting, measurements at 1 h of resting, and measurements at 2 h of resting. The EIS testing process is shown in Figure 3. Several different rest times were set to explore the extent to which the resting time affected the impedance of the battery at different SOC.

2.2. Pouch Battery Fabrication

Cathode preparation: Polyvinylidene fluoride, conductive carbon black, and lithium nickel-cobalt-aluminate material were added to N-methylpyrrolidone in the mass ratio of 2:1.5:96.5 to produce the cathode slurry, which was coated, dried, rolled, and pressed to fabricate the cathode electrode. The single-sided loading of the electrode was 240 g m−2.
Anode preparation: In deionized water, according to the mass ratio of 1.5:1:6:90:1.5, carboxy methyl cellulose, conductive carbon black, silicon(II) oxide (SiOx), graphite (C), and styrene-butadiene rubber were added sequentially to make the anode slurry. After coating, drying, rolling, and cutting, the anode electrode was produced. The single-sided loading of the sheet was 115 g m−2, and the N/P ratio of the battery was 1.07.
Battery preparation: The battery was assembled in a low-dew-point room (≤−40 °C), and the electrolyte used for all cells was 1 mol L−1 of LiPF6 in EC:DEC:EMC (1:1:2) with 2% VC. The battery was sealed in an aluminum-laminated polymer film. The designed capacity of the battery was 5 Ah.

3. Results and Discussion

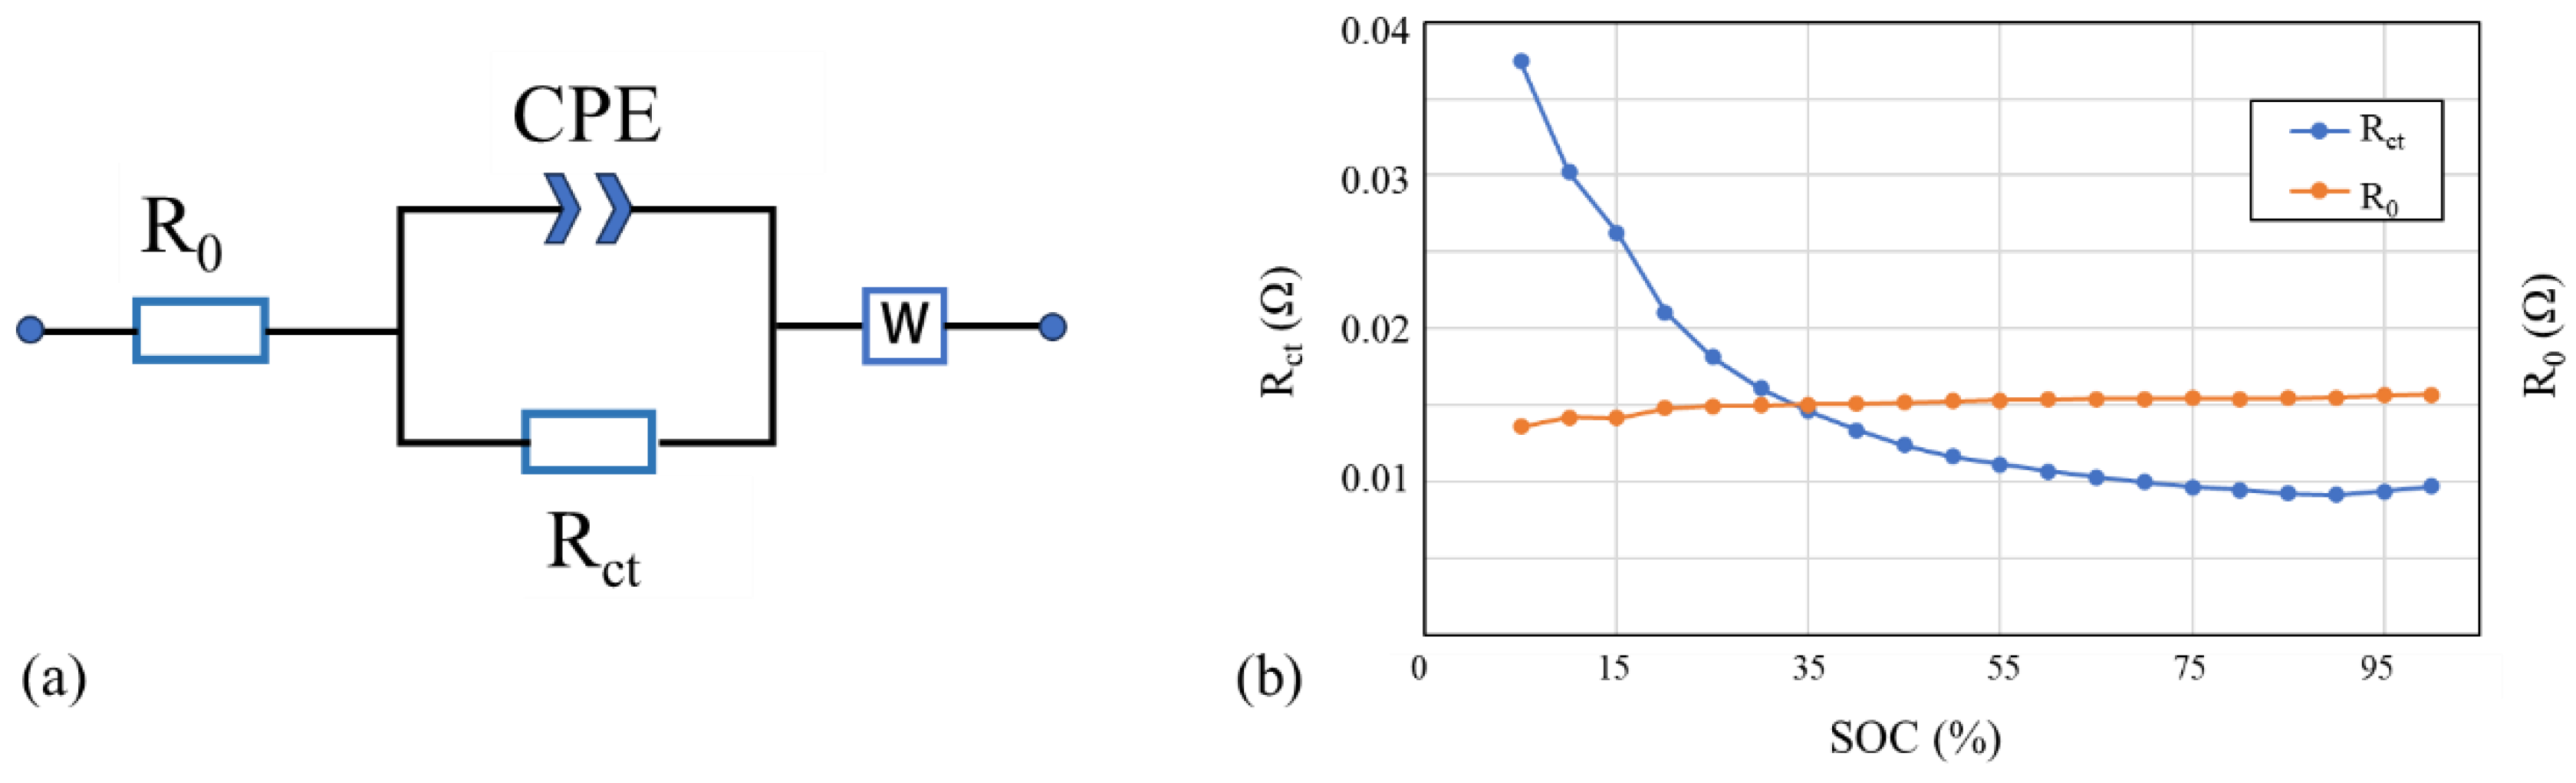
3.1. Same Resting Time at Different SOC

The EIS measured in this study is shown in Figure 4. Firstly, the results for the same resting time at different SOC are shown, from which it can be found that there was a regular trend in the EIS of the lithium-ion batteries for the five resting times, and as charging proceeded, the arc radius of the impedance spectrum demonstrated a gradual decrease with until reaching an SOC of about 90%. With subsequent charging to 100%, there was a tendency for the arc radius to become progressively larger, but the increase was comparatively slight. The phenomenon was the same for the five resting times. Further, in order to analyze more concretely the above impedance changes and their causes, we fit the EIS using an equivalent circuit model (ECM) to explore how the battery impedance variation reacted to the model parameters.
First, we used the distribution of relaxation times (DRT) [18,19,20,21] to determine the structure of the equivalent circuit model; ideally, a typical EIS consists of separated semicircles. Each semicircle is associated with a specific time constant, which is represented in the DRT plot as isolated straight lines corresponding to the respective parallel resistance and capacitance circuits. In fact, the semicircles in the EIS are coupled with each other, and it is difficult to distinguish them. DRT can transform the coupled EIS into a continuous curve with several specific peaks, and based on the inverse convolution time constant, the relaxation time distribution of the electrochemical system can be extracted, which can guide the electrochemical modeling of electrochemical systems. If it is assumed that the voltage response is perturbed by a step current decay exponentially on a specific time scale, the impedance of the electrochemical system can be written in the following form:
Z ( ω ) = R 0 + Z p o l ( ω ) = R 0 + R p o l 0 g ( τ ) 1 + j ω τ d τ
where 0 g ( τ ) d τ = 1 . In Equation (1), R 0 is the ohmic resistance of the electrochemical system, Z p o l ( w ) is the polarization impedance, R p o l is the polarization resistance, τ is the relaxation eigentime, g ( τ ) is the distribution function of the relaxation eigentime, j denotes the imaginary part symbol, and w is the angular frequency. The DRT method, which treats the electrochemical system as an ohmic resistance R 0 in series with an infinite number of polarization processes, approximates the impedance model of an arbitrary electrochemical system and avoids the problem of a priori assumptions in electrochemical modeling.
The results of the DRT for 30 min of resting at 50% SOC are shown in Figure 4f, which reveals one clear peak, so the impedance data were fitted using a first-order ECM, as shown in Figure 5a. An ECM utilizes a variety of series and parallel circuit components such as resistors, capacitors, and voltage sources to simulate the external dynamic characteristics of a battery, thus avoiding the need for complex calculations of internal electrochemical processes. The basic idea is to consider the electrochemical system as a circuit system consisting of various electronic and ionic components and to describe the electrochemical properties of the electrochemical system in terms of the electrical properties of the circuit components. R0 is used to represent the equivalent ohmic resistance of all materials inside the battery. The charge transfer resistance represents the obstruction of the current by the charge transfer process in an electrochemical reaction. In an equivalent circuit model, the charge transfer resistance is usually expressed as Rct, and the magnitude of Rct is related to the active area of the electrode surface, the electrochemical reaction rate constant, and the concentration of the electrochemical reactants. The constant-phase-angle element (CPE) is often used to describe electrochemical systems such as non-ideal capacitance or electrode interfaces. It is a complex impedance element consisting of an imaginary impedance and the phase angle. Unlike conventional capacitive elements, the impedance response of a CPE element at different frequencies is not a pure phase shift but a compound effect of a phase shift and a frequency-dependent capacitance value. The EIS curve could be well fitted using a fractional-order CPE element since the EIS curve of the battery exhibited an oblate semicircle in the mid-frequency band. The Warburg model is used to describe the diffusion of charge through an electrolyte. The impedance spectrum corresponding to this model exhibits a straight line with a 45° slope, called the Warburg segment. The model can be used to analyze the diffusion process of ions or molecules in an electrolyte, denoted as W in Figure 5a. The results for 30 min of resting were chosen for fitting, as shown in Figure 5b. It can be noted that as charging proceeded, the ohmic resistance R0 remained almost stable with a very slight increasing trend. The charge transfer resistance Rct of the radius of the representative impedance spectrum arc varied significantly with an increasing SOC during the charging process. A significant decrease occurred when the SOC was less than 90%, followed by a slight increase during charging to 100% SOC, a phenomenon that was very consistent with the geometrical variation in the impedance spectrum. Rct is linked to electrochemical reaction kinetics as follows [22]:
R c t = R T n F A 0 j 0
where R is the gas constant, T is the absolute temperature in Kelvin, n is the number of electrons, F is the Faraday constant, A 0 is the active surface area, and j 0 is the exchange current density. During charging, Rct first decreased in the low state of charge region and remained at a steady level in the medium state of charge region until reaching the high state of charge region, where Rct then increased slightly. This parabolic-like trend was consistent with previous EIS studies on similar Ni-rich cathode materials [23,24], For electrodes from the same battery, A 0 does not vary with the electrode potential, so j 0 should show a parabolic-like curve, but with an opposite trend [25]. The parabolic-like trend of the characteristic diffusion time constant as a function of the electrode potential is attributed to the significant changes in the crystal structure in electrode potential regions below 3.7 V vs. Li/Li+ [23] and above 4.2 V vs. Li/Li+. Therefore, the similar parabolic-like behavior observed for Rct was possibly also related to the drastic crystal structure changes, which might have altered the equilibrium oxidation/reduction rate, i.e., the exchange current density [24,25,26] (j0 in Equation (2)).
The different impedance spectral shapes and different ECM parameters at different SOC, as well as the phenomenon of regular changes in the two, corroborated the feasibility of the SOC estimation of lithium-ion batteries via the EIS using data-driven and model-driven methods.

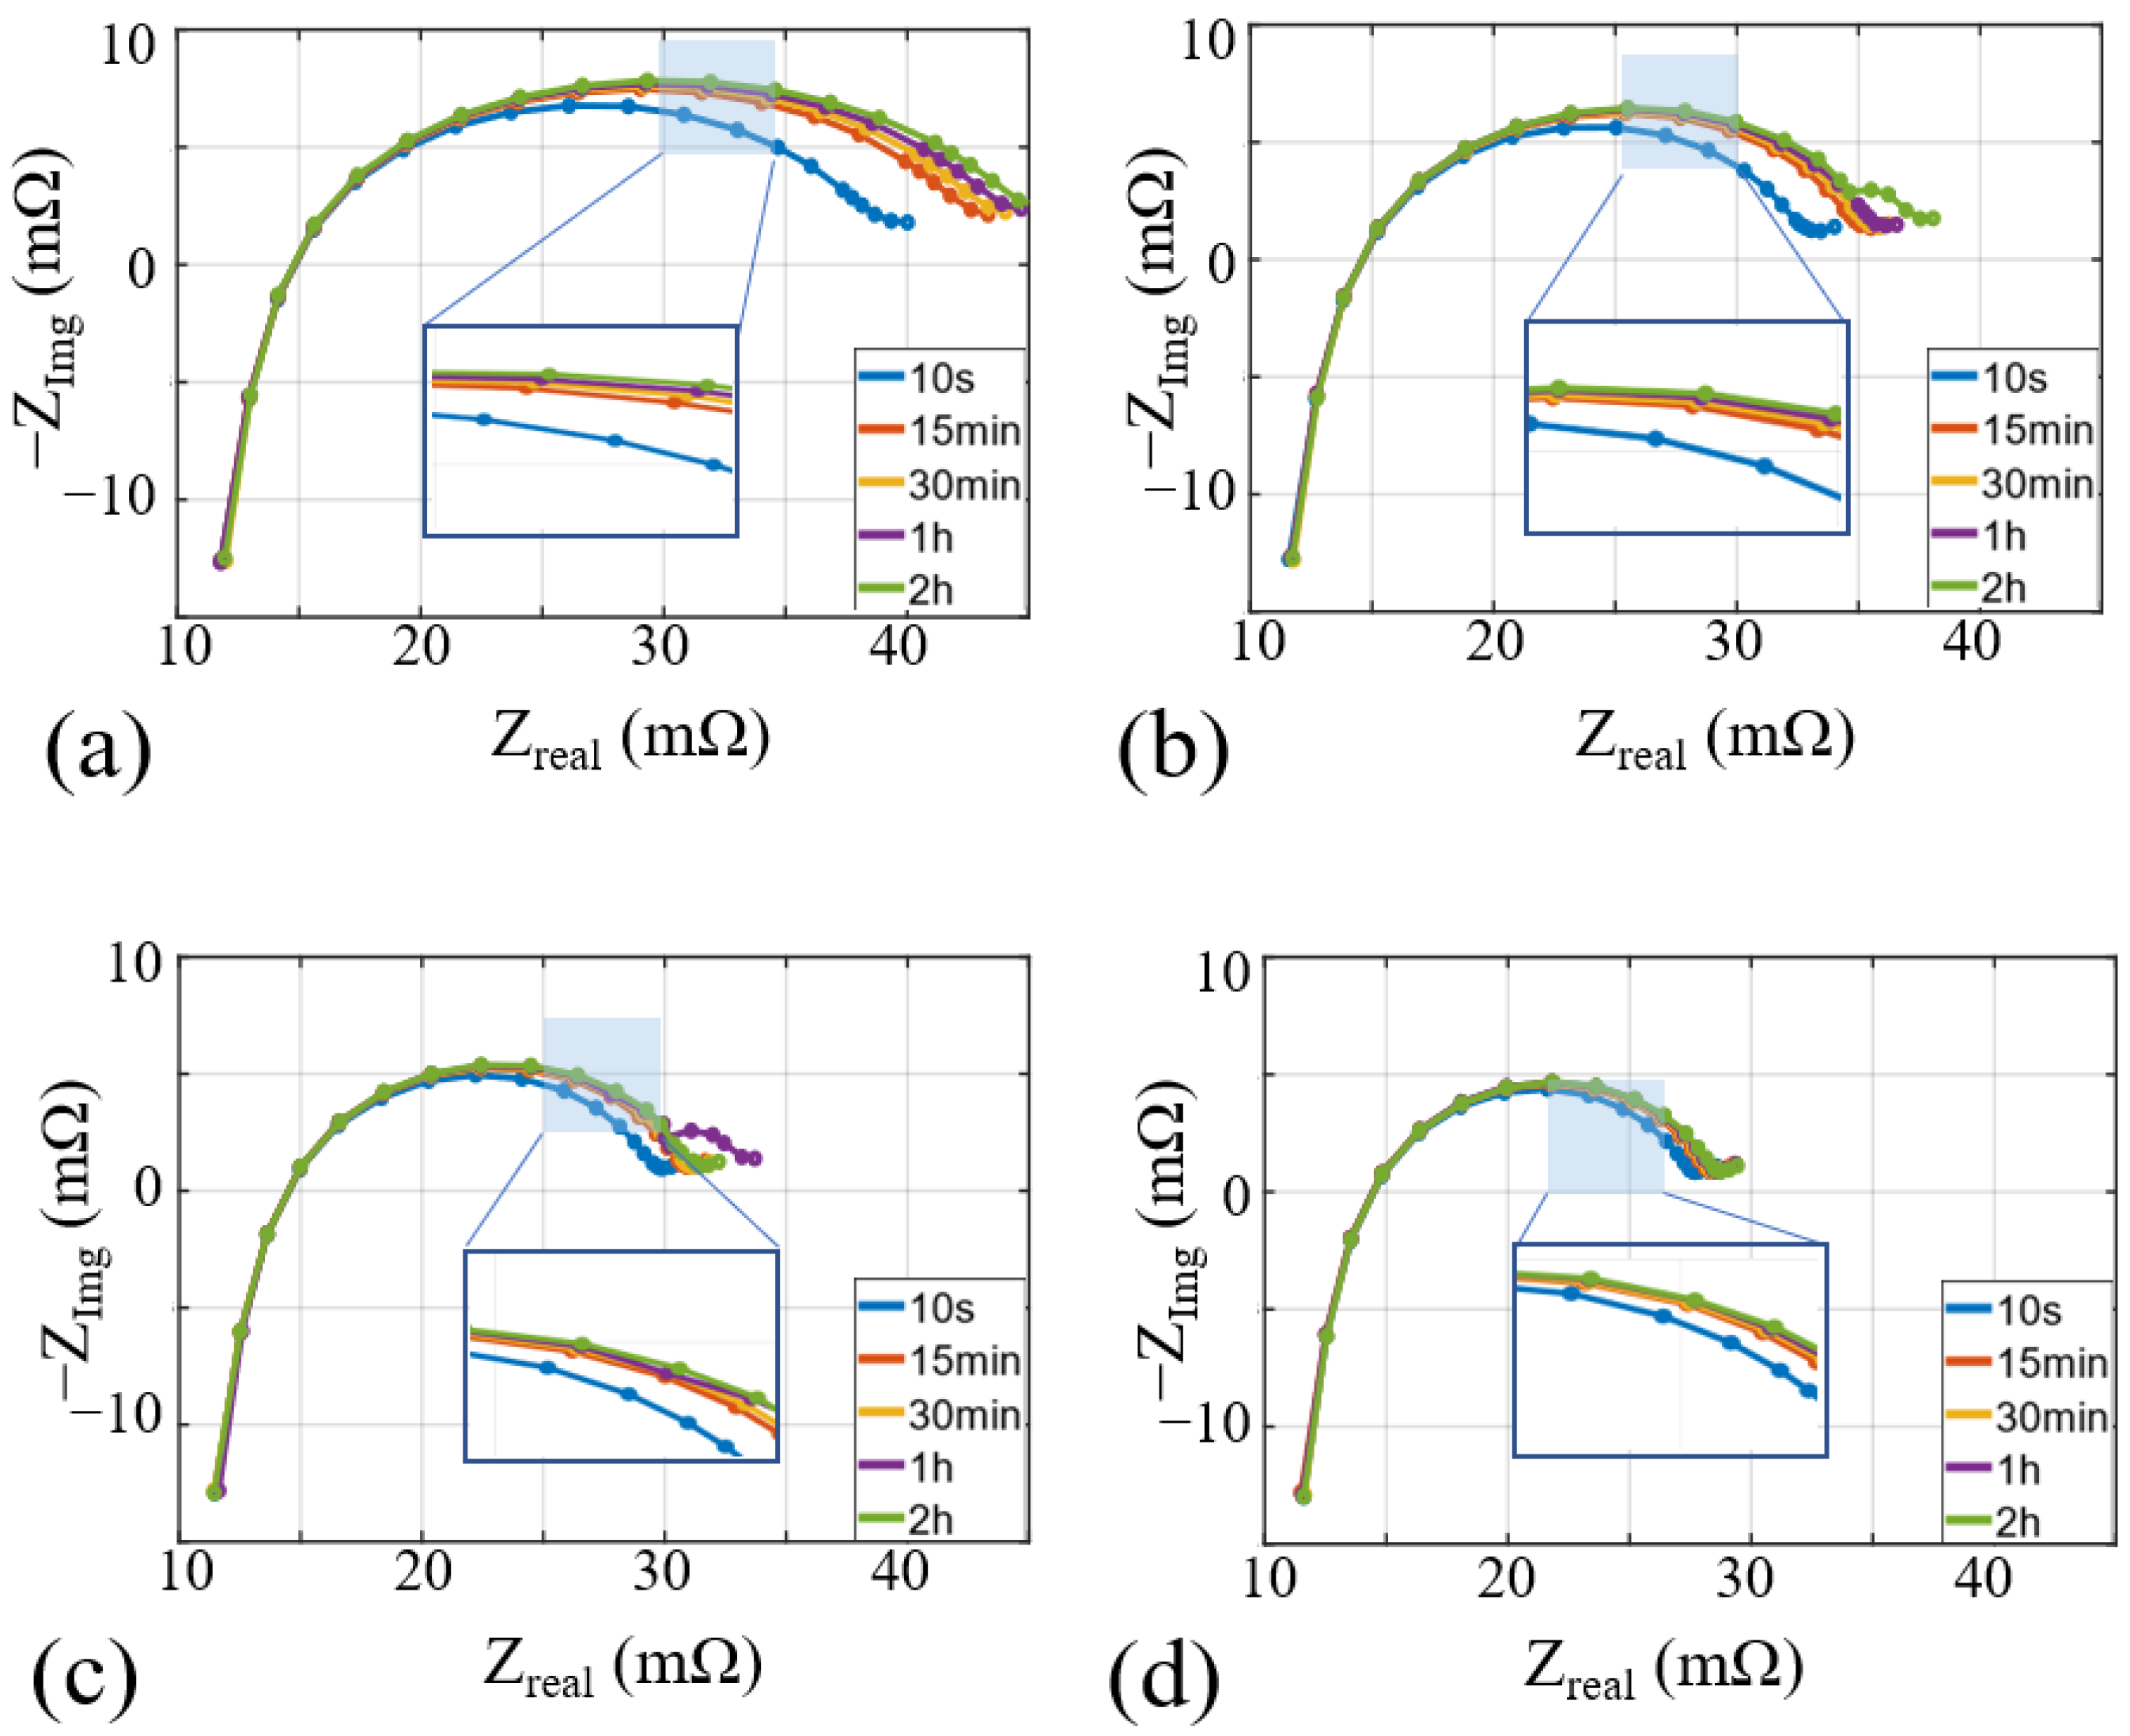
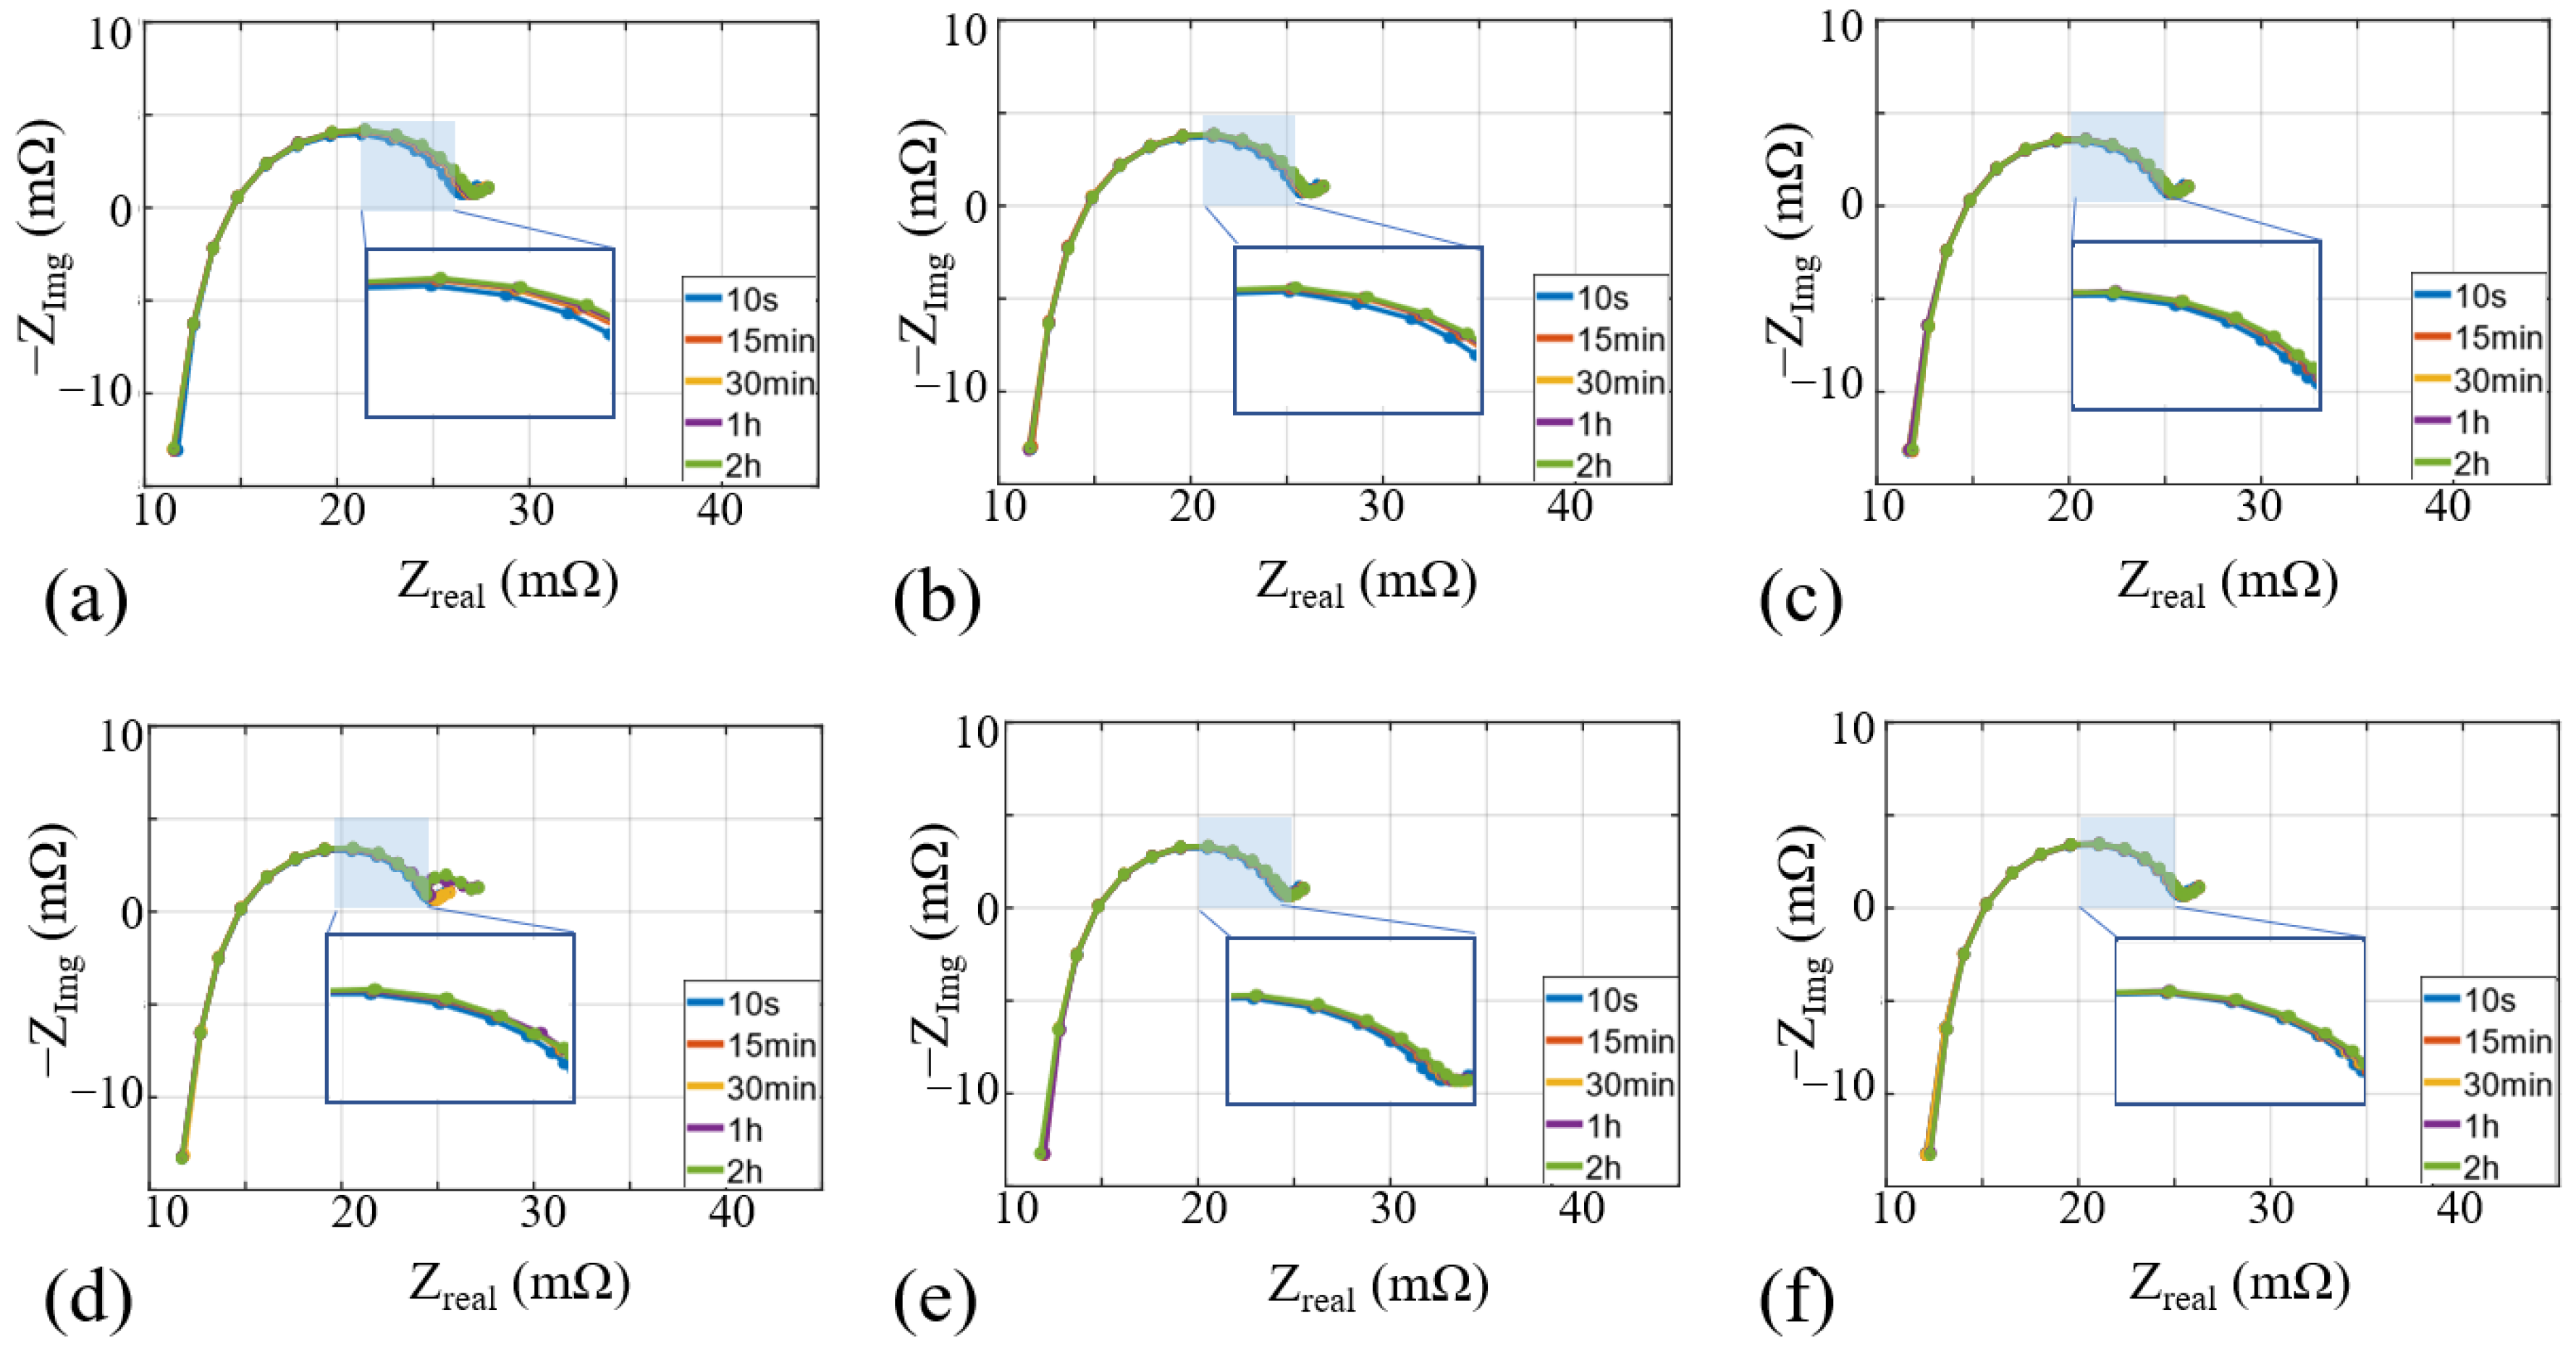
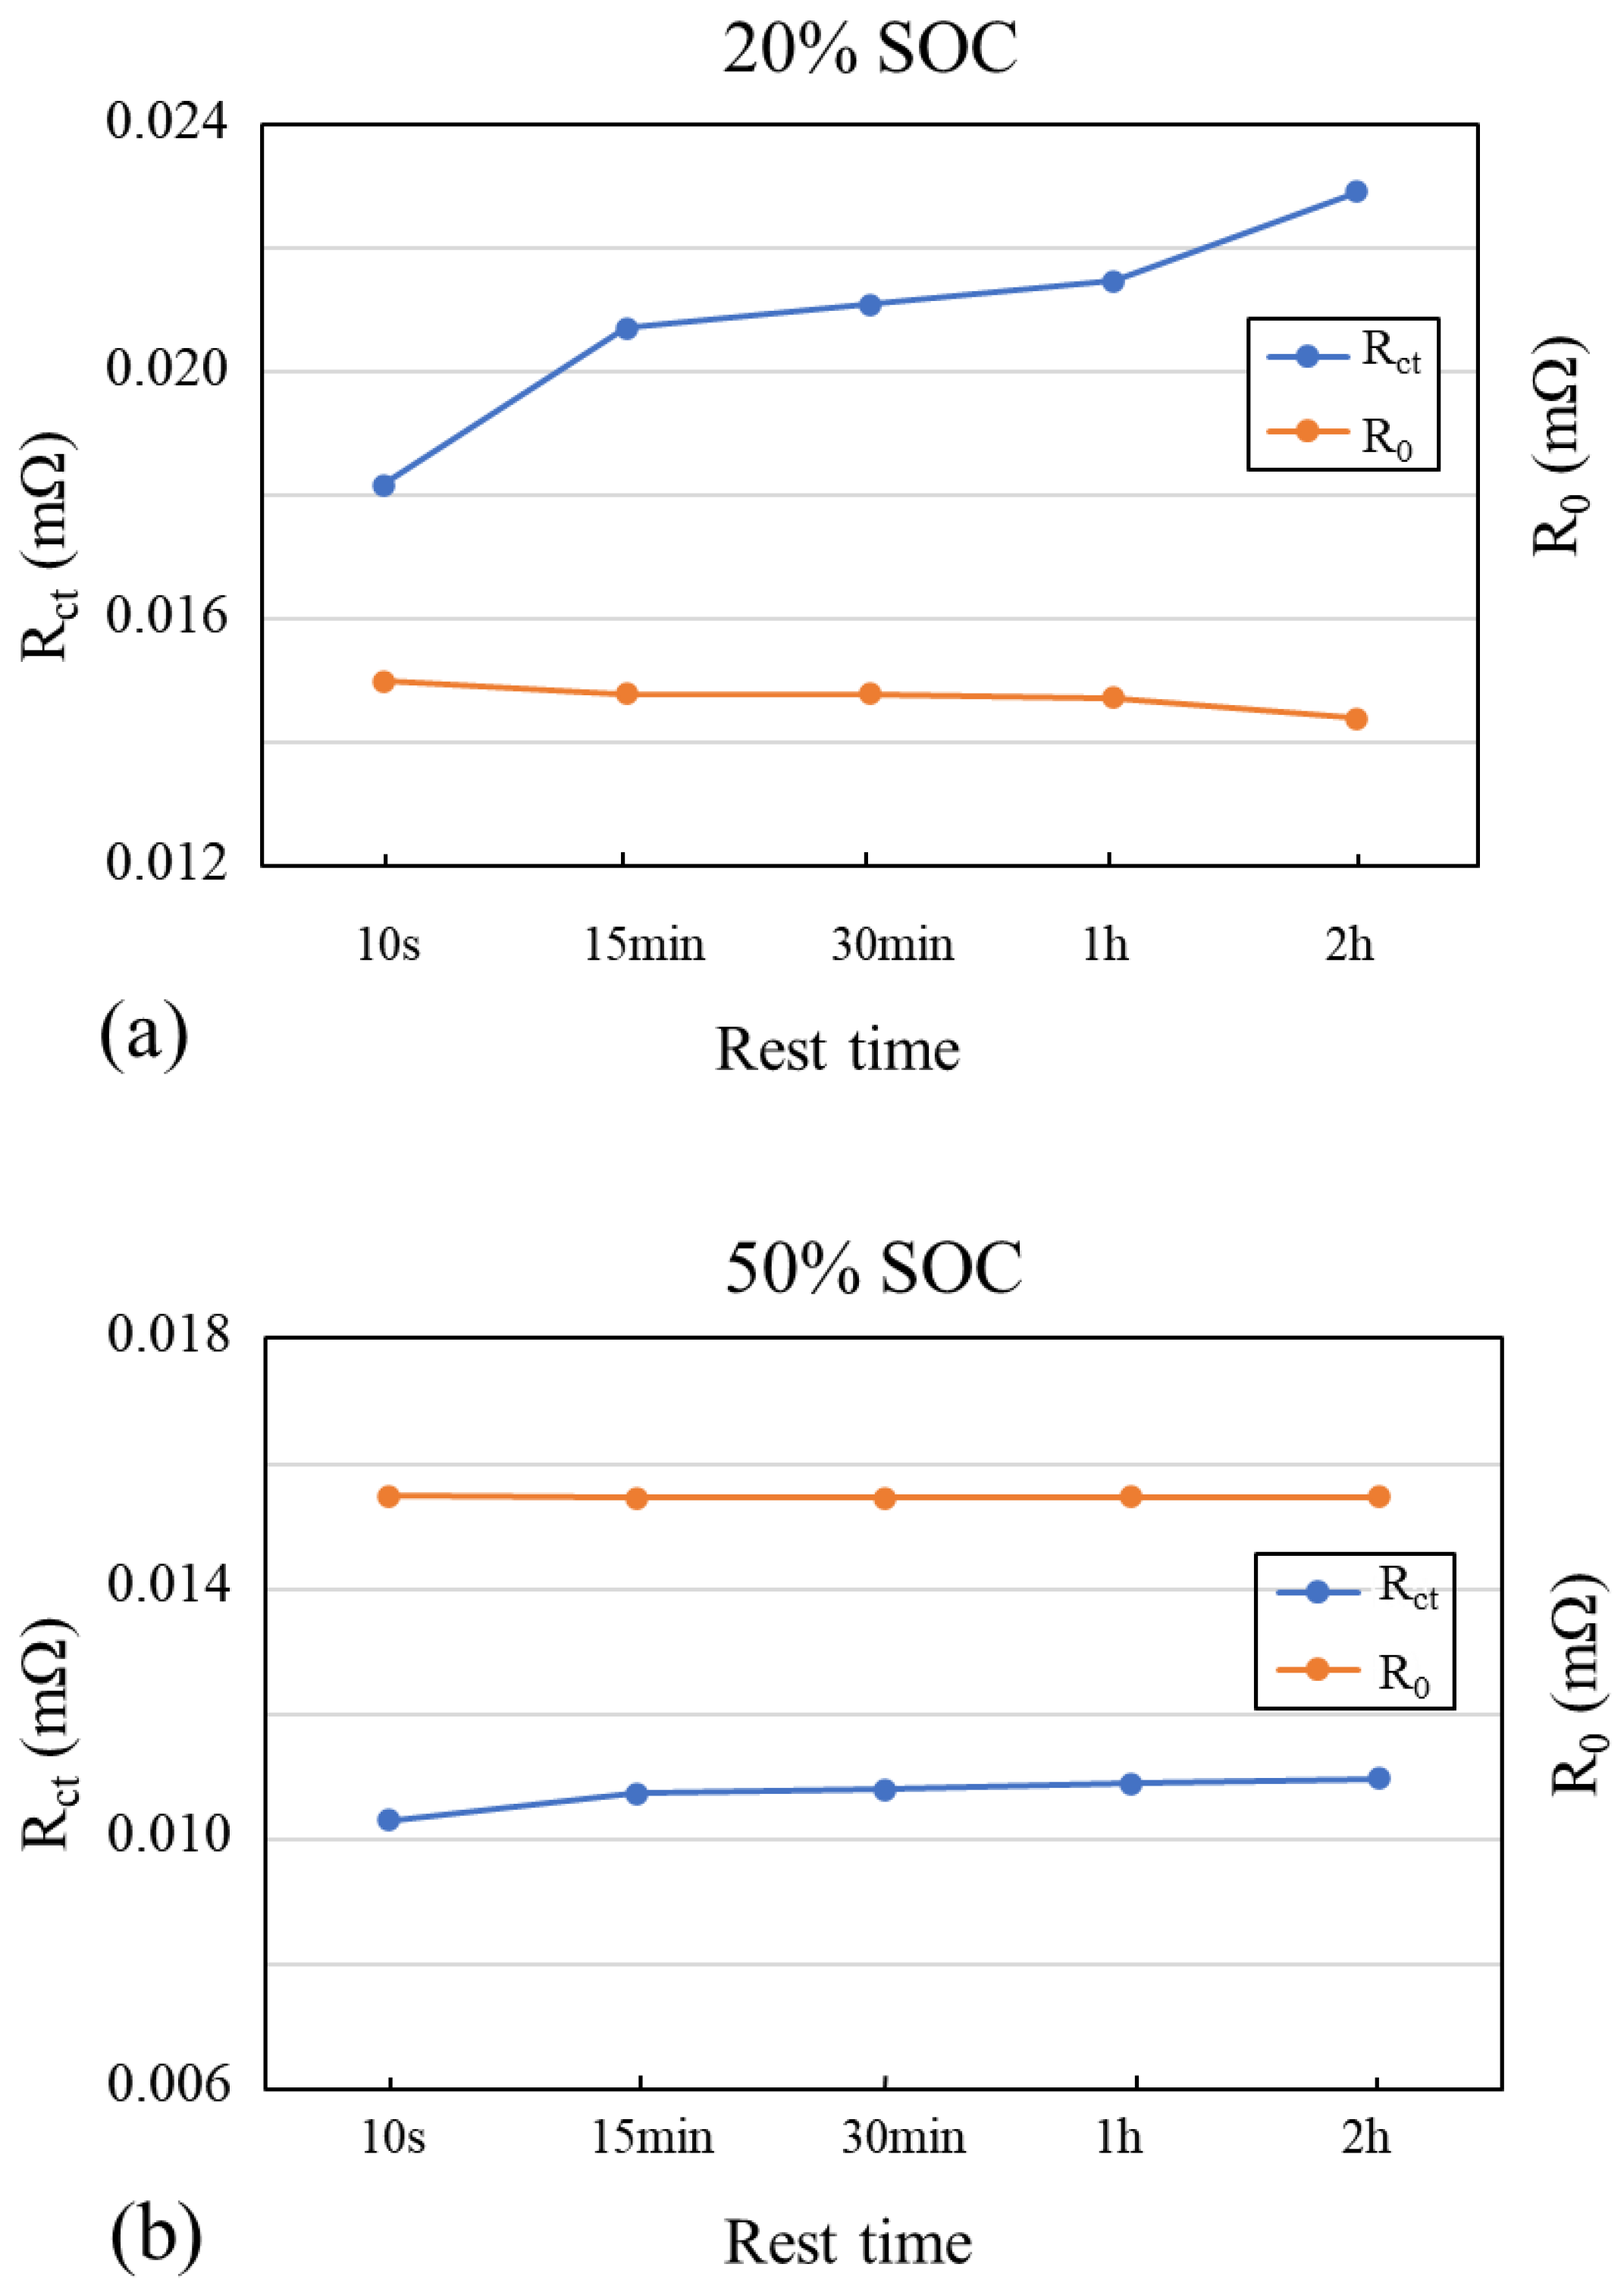
3.2. Different Resting Times at the Same SOC

This section further explores the effect of the resting time on the impedance results. As shown in Figure 6 and Figure 7, we compared the EIS results at the same SOC under different resting times and found that when the battery was at a low SOC, the resting time had a significant effect on the impedance results, and the impedance spectral arc radius measured immediately at 10 s was significantly smaller than that at other resting times, while the results under other resting times also showed the phenomenon of a gradual increase in the impedance spectral arc radius with an increase in the resting time. When the battery was in a medium-high SOC, the impedance varied less with different resting times, and even the immediate measurement at 10 s was very consistent with the other results. However, it was still observed that the radius of the impedance spectrum arc increased with an increasing resting time, but the increasing trend was relatively small. At a high SOC, i.e., an 80–100% SOC, the effect of the resting time on the impedance spectrum was very slight, and the radius of the impedance spectral arc was almost constant. Based on the above phenomenon, in order to further explore the effect of impedance measurements at different resting times on the equivalent circuit model, we used the equivalent circuit to fit the above impedance data.
The results for a low SOC of 20%, medium SOC of 50%, and high SOC of 80% were chosen as examples for the ECM fitting, and the parameter results of the fitted model are shown in Figure 8. The parameter Rct representing the radius of the impedance spectrum arc was consistent with the analysis above, and at a low SOC, the resting time affected the impedance results significantly. As the resting time increased, the Rct became significantly larger. When the battery was at a medium to high SOC, the Rct showed relatively consistent results, with the values varying slightly with the resting time. When the battery was at a high SOC, the Rct was almost constant and varied very slight with the resting time. The variation in the EIS with the resting time was more significant at a low SOC for the following probable reasons: (1) At low SOC levels, electrochemical polarization effects are typically more pronounced [27,28], which will be reflected in the EIS. Electrochemical polarization involves complex interactions at the electrode–electrolyte interface. As the polarization effect subsides with an increasing resting time, it may result in a significant change in impedance. (2) This may have been caused by the higher ion exchange resistance of the anode surface [15,29] at a low SOC, which would limit the migration rate of ions and electrons. This would lead to more pronounced diffusion effects within the battery, which would increase the electrochemical impedance. The diffusion effect decreased with an increasing resting time, making the EIS more responsive to changes in resting time. The R0 remained very consistent in all conditions, except at a 20% SOC, when it decreased very slightly with the resting time. This may have been due to the fact that the ohmic internal resistance is largely determined by the conductivity between the electrolyte and electrode material of the cell, and these factors do not usually change significantly over a short period of time.
Therefore, when evaluating the above battery state using the EIS, if the battery was at a low SOC state, the effect of the resting time on the impedance results needed to be considered. When the SOC was high, the resting time could be appropriately ignored to achieve a faster acquisition of the results because the effect of the resting time on the results was slight.

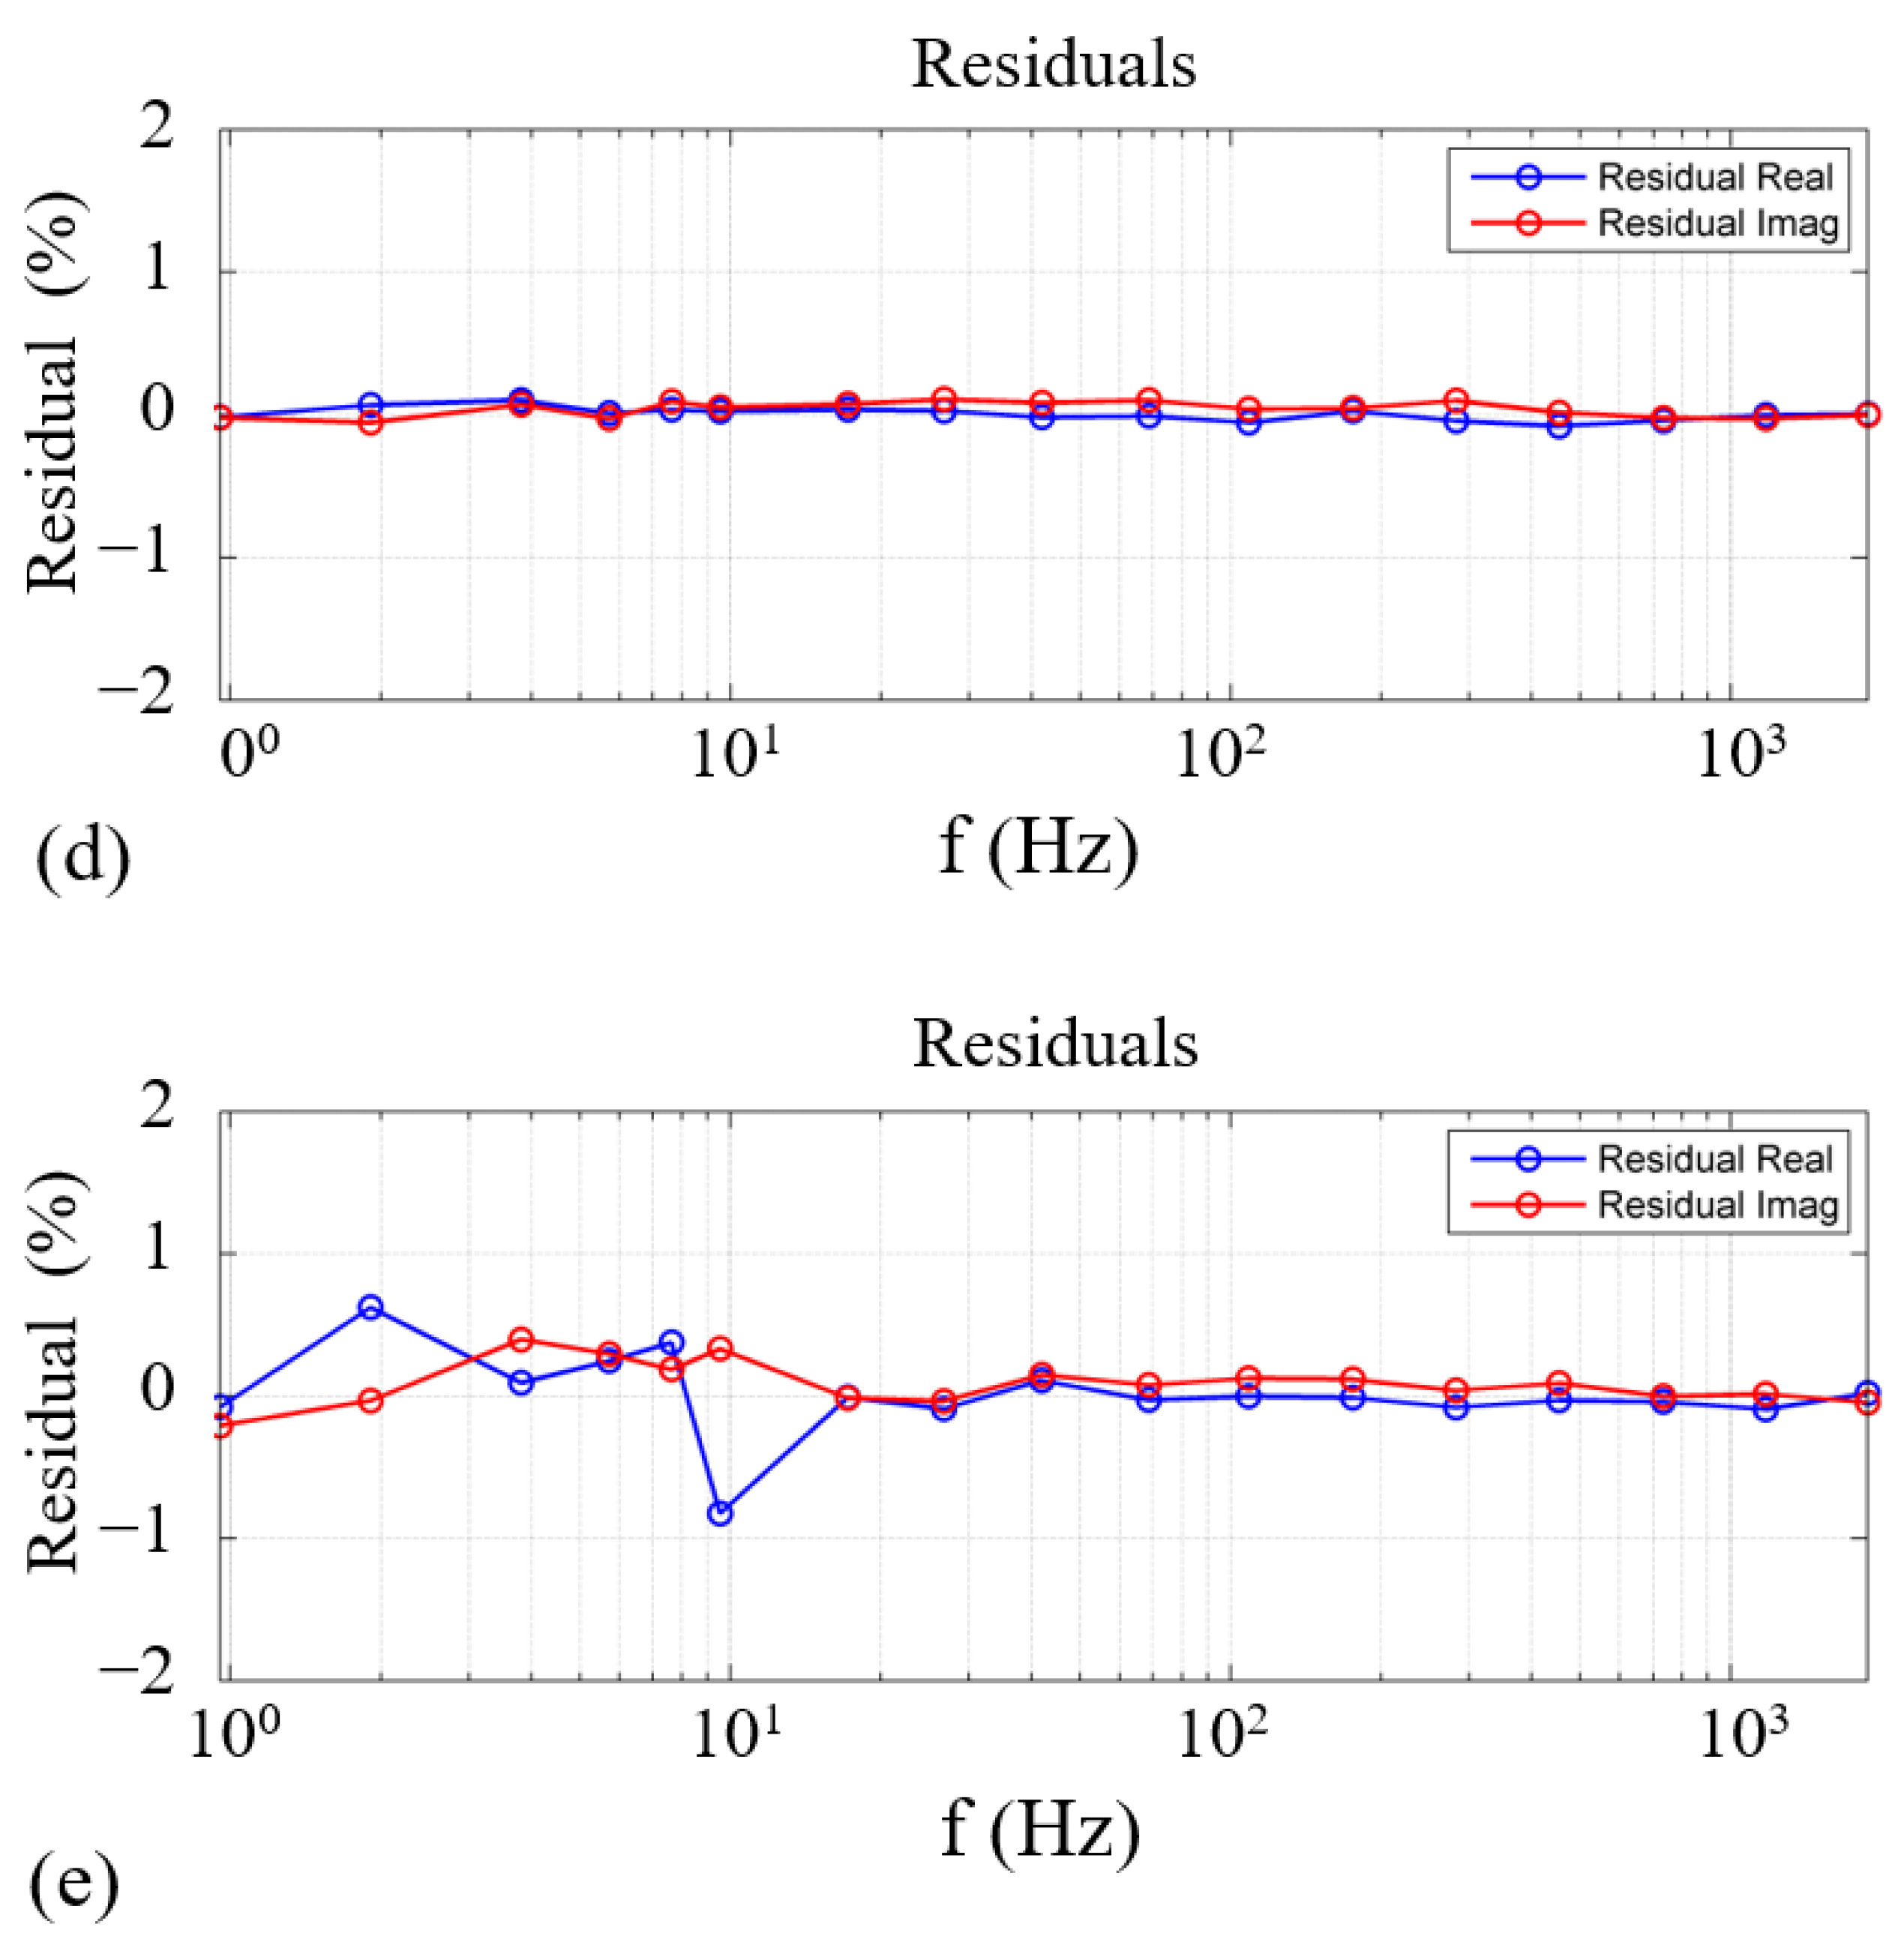
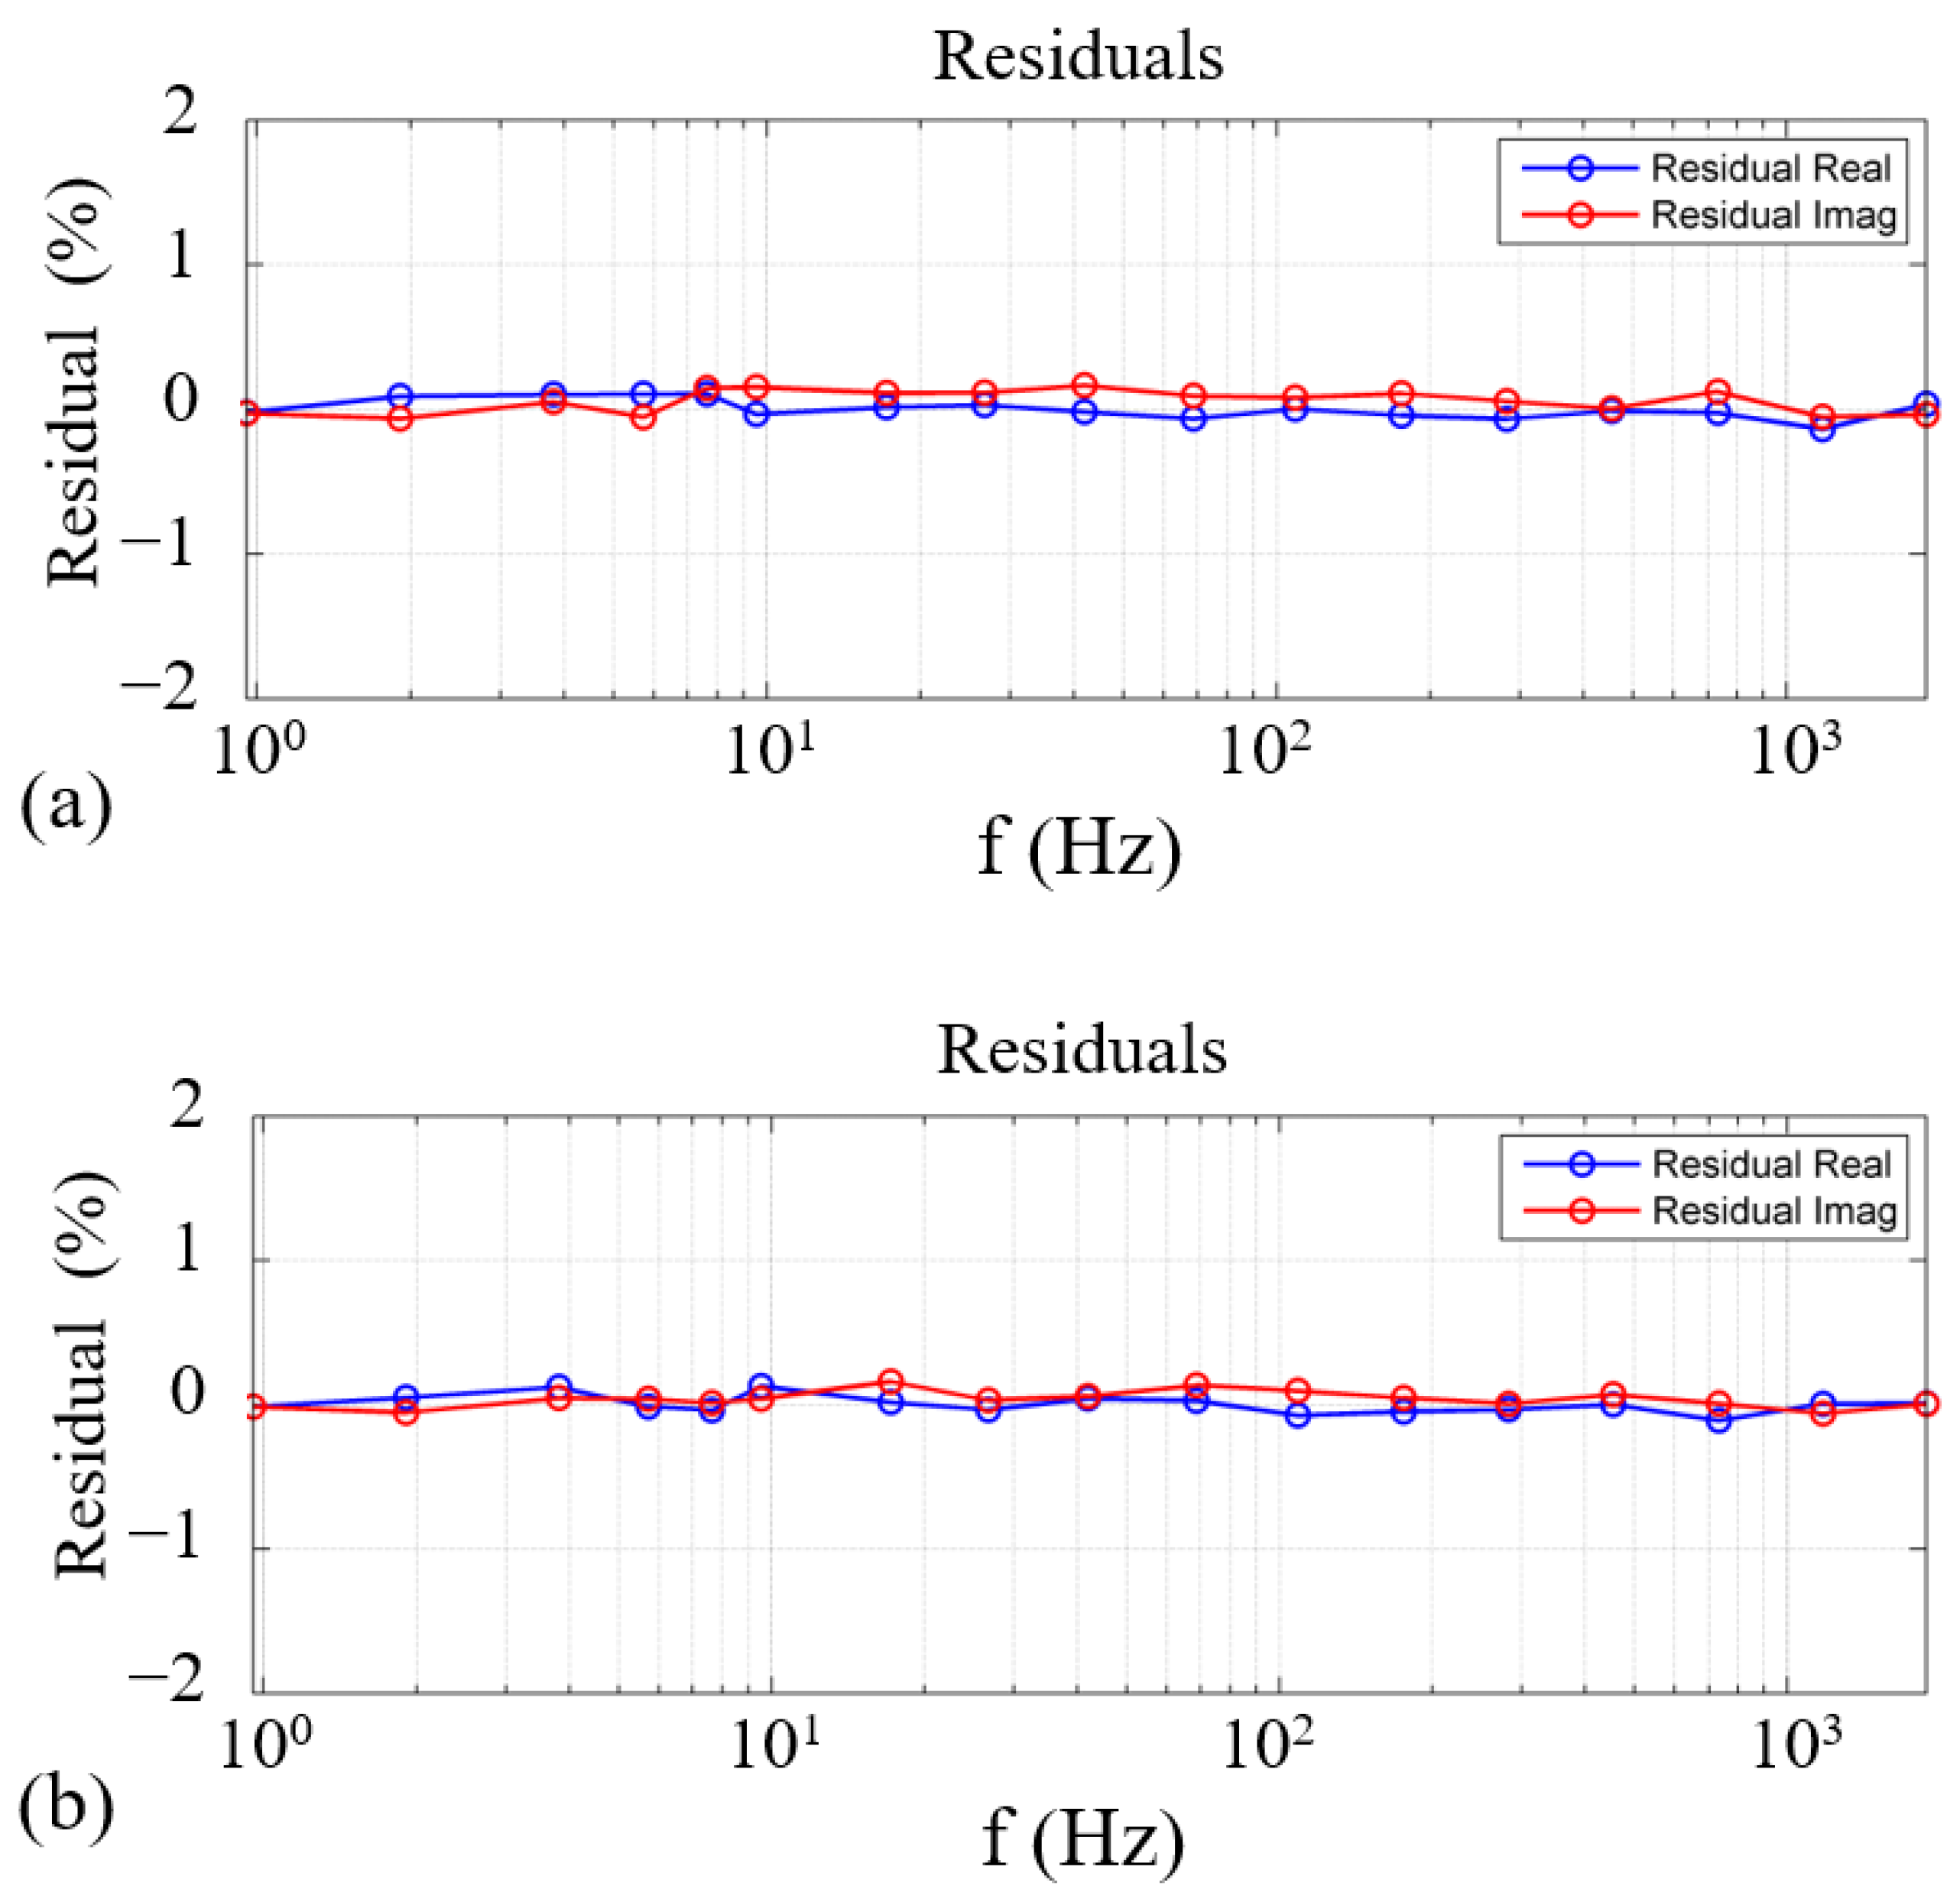
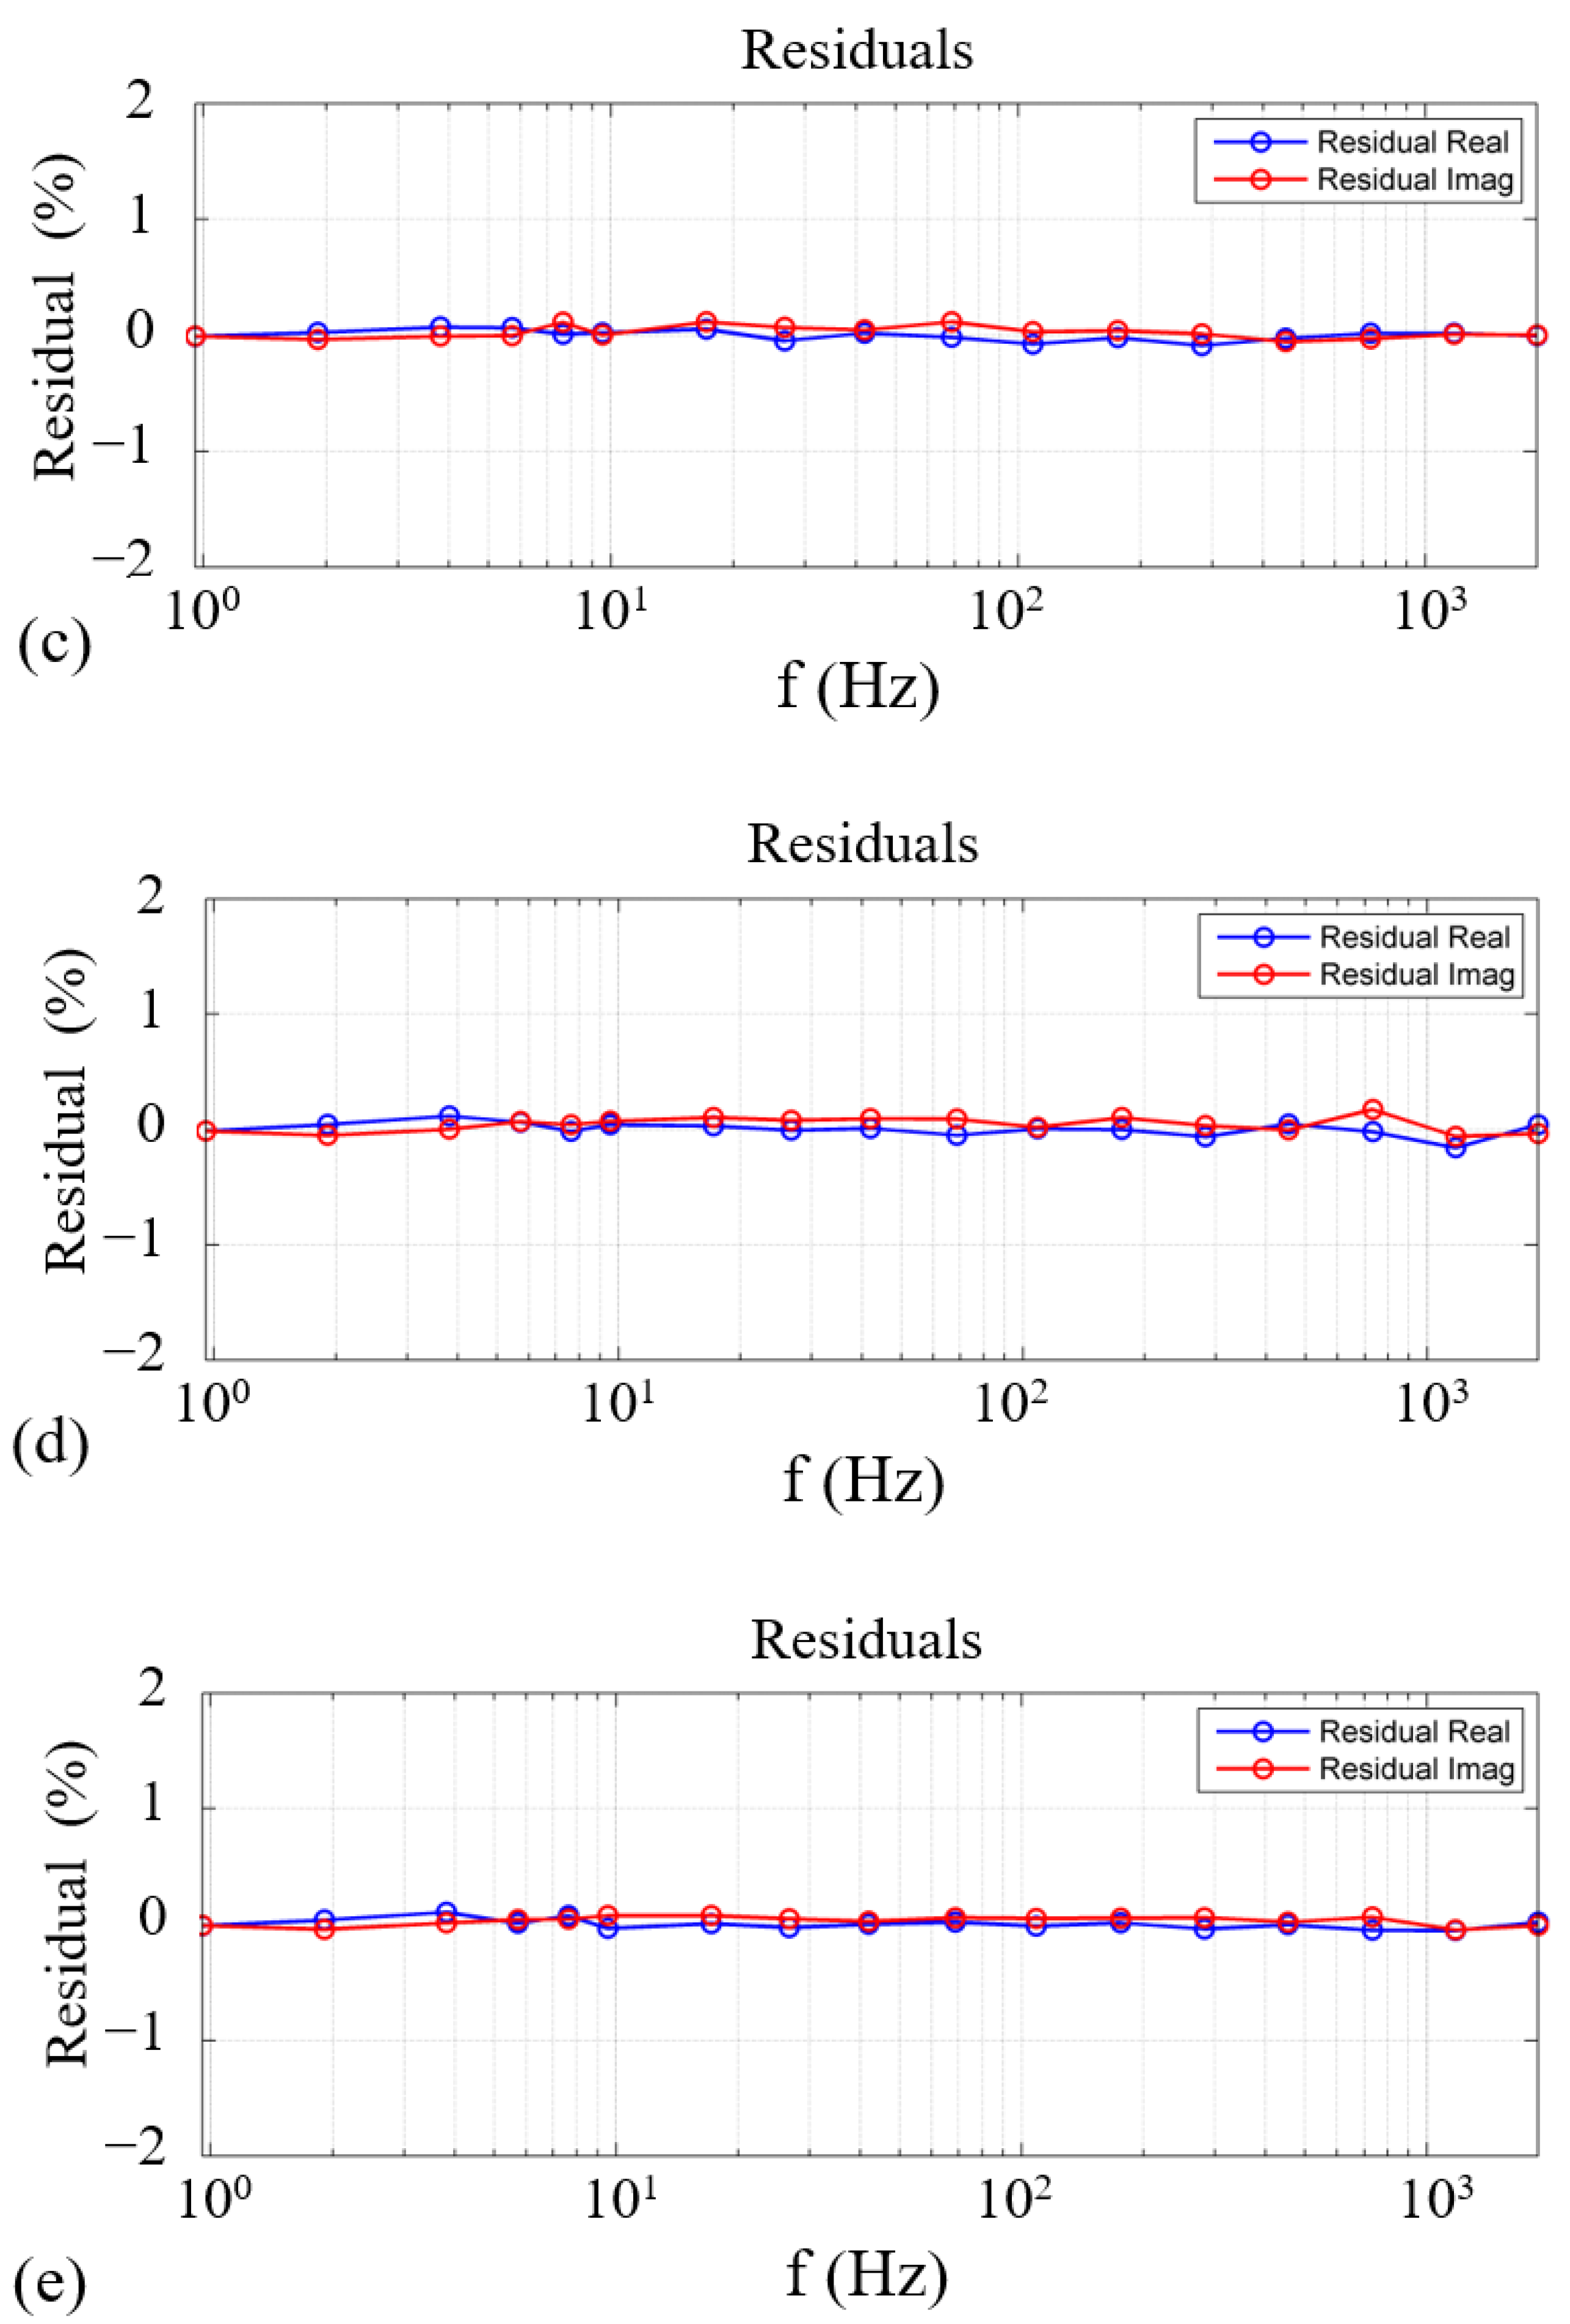
3.3. Reliability Analysis of Impedance Results

In this study, the KK transform was used to check the reliability of the impedance data. The method first fits the experimental impedance spectrum to the impedance expression with clear physical meaning and then extrapolates the fitting result so that the KK integral can be calculated over the whole frequency range from zero to infinity, which avoids the error of integral calculation and improves the accuracy of analyzing the impedance data reliability. For linear electronic component systems, the KK relationship for complex impedance is generally satisfied; however, in electrochemical electrode systems, the four conditions under which the KK relationship holds are not always satisfied. Therefore, the reliability of the obtained electrochemical impedance spectra data can be checked by the KK relationship [30,31,32], and based on reliable electrochemical impedance spectral data, one can accurately analyze the physicochemical properties of a system [33]. When a battery is in a quasi-steady state that satisfies the properties of causality, stability, linearity, and finiteness, it can be regarded as a linear system perturbed by small signals, and the real and imaginary parts of the measured impedance should satisfy the KK transformation relationship shown in Equation (3):
{ Z ( w ) Z ( ) = ( 2 π ) 0 x Z ( x ) w Z ( w ) x 2 w 2 d x Z ( w ) Z ( 0 ) = ( 2 w π ) 0 π x 2 w 2 d x Z ( w ) = ( 2 w π ) 0 Z ( x ) Z ( w ) x 2 w 2 d x
In Equation (3), x and w are the angular frequencies, and Z′(w) and Z″(w) represent the real and imaginary parts of the impedance Z(w), respectively.
In order to verify the reliability of the impedance test results measured by the above experimental methods, we performed KK transformation on the impedance measurements, including the results for a 20% SOC, 50% SOC, and 80% SOC, as shown in Figure 9, Figure 10 and Figure 11 corresponding to low, medium, and high SOC levels, respectively. Special attention was paid to the results with relatively short resting times of 10 s and 15 min, because their EIS varied most significantly with the resting time.
The KK transformation residual values of the impedance results were found to be less than 1% for all resting times, proving the reliability of the impedance data results. It is possible that the test equipment was subjected to external interference during the test, and some of the results had slightly larger but acceptable residual values at low frequencies, such as the results for 20% SOC, 2 h and the results for 80% SOC, 1 h and 2 h. In addition, the results for the relatively short resting times of 10 s and 15 min did not show significantly larger residual values, indicating that the measured EIS data were still highly reliable. In conclusion, all impedance test results had low residual values with ideal reliability, deeply satisfying the conditions for analysis.

4. Conclusions

This study investigated the EIS of lithium-ion batteries under various states of charge (SOC) and resting times using DNB1168 as an impedance tester. The EIS were obtained for different SOC levels with a fixed resting time, and the influence of the SOC on the impedance characteristics was analyzed. The results showed that the impedance spectrum arc radius magnitude decreased first and then slightly increased with an increasing SOC. An equivalent circuit model was employed to fit the impedance data and interpret the impedance data variation process through the parameters of the circuit elements. Although some studies have demonstrated that the resting time significantly affects the EIS of lithium-ion batteries, the literature has not yet comprehensively considered and analyzed the effect of the resting time on the EIS under different SOC and the differences in its extent. Therefore, the EIS were measured for different resting times at a constant SOC, and the effect of the resting time on the impedance behavior was examined. It was found that the impedance magnitude was significantly affected by the resting time at a low SOC, moderately affected at a medium SOC, and barely affected at a high SOC. The equivalent circuit with extracted parameters verified a similar pattern of variation concerning the SOC and resting time. Finally, the reliability of the impedance data was verified by applying the Kramers–Kronig (KK) transformation. This study revealed the impact of the resting time on the impedance measurements, which could help researchers to consider this variable when constructing EIS tests and to design accurate test protocols.

Author Contributions

Conceptualization, Q.L. and D.Y.; methodology, Q.L., H.Z., D.Y. and G.D.; validation, G.D. and Q.W.; investigation, Q.L., G.D., D.Y., T.L. and C.L.; writing—original draft preparation, Q.L. and H.Z.; writing—review and editing, H.Z., G.D., C.L. and T.L.; supervision, J.X.; project administration, T.L.; funding acquisition, T.L., C.L. and J.X. All authors have read and agreed to the published version of the manuscript.

Funding

This work was supported by the National Key R&D Program of China (2022YFB3305400) and the “Science and Technology Innovation Action Plan” of the Science and Technology Commission of Shanghai Municipality (No. 22DZ1200600).

Data Availability Statement

Data are not publicly available due to commercial restrictions.

Conflicts of Interest

The authors declare no conflict of interest.

References

  1. Qu, D.; Ji, W.; Qu, H. Probing process kinetics in batteries with electrochemical impedance spectroscopy. Commun. Mater. 2022, 3, 61. [Google Scholar] [CrossRef]
  2. Tatara, R.; Karayaylali, P.; Yu, Y.; Zhang, Y.; Giordano, L.; Maglia, F.; Jung, R.; Schmidt, J.P.; Lund, I.; Shao-Horn, Y. The Effect of Electrode-Electrolyte Interface on the Electrochemical Impedance Spectra for Positive Electrode in Li-Ion Battery. J. Electrochem. Soc. 2019, 66, A5090–A5098. [Google Scholar] [CrossRef]
  3. Qahouq, J.A.A. Online battery impedance spectrum measurement method. In Proceedings of the 2016 IEEE Applied Power Electronics Conference and Exposition (APEC), Long Beach, CA, USA, 20–24 March 2016; IEEE: Piscataway, NJ, USA, 2016; pp. 3611–3615. [Google Scholar]
  4. Tang, Z.; Huang, Q.-A.; Wang, Y.-J.; Zhang, F.; Li, W.; Li, A.; Zhang, L.; Zhang, J. Recent progress in the use of electrochemical impedance spectroscopy for the measurement, monitoring, diagnosis and optimization of proton exchange membrane fuel cell performance. J. Power Sources 2020, 468, 228361. [Google Scholar] [CrossRef]
  5. Heins, T.P.; Harms, N.; Schramm, L.-S.; Schröder, U. Development of a new Electrochemical Impedance Spectroscopy Approach for Monitoring the Solid Electrolyte Interphase Formation. Energy Technol. 2016, 4, 1509–1513. [Google Scholar] [CrossRef]
  6. Mingant, R.; Bernard, J.; Moynot, V.S.; Delaille, A.; Mailley, S.; Hognon, J.-L.; Huet, F. EIS Measurements for Determining the SoC and SoH of Li-Ion Batteries. ECS Trans. 2011, 33, 41–53. [Google Scholar] [CrossRef]
  7. Gaberšček, M. Understanding Li-based battery materials via electrochemical impedance spectroscopy. Nat. Commun. 2021, 12, 6513. [Google Scholar] [CrossRef]
  8. Ivers-Tiffée, E.; Weber, A. Evaluation of electrochemical impedance spectra by the distribution of relaxation times. J. Ceram. Soc. Jpn. 2017, 125, 193–201. [Google Scholar] [CrossRef]
  9. Wagner, N.; Gülzow, E. Change of electrochemical impedance spectra (EIS) with time during CO-poisoning of the Pt-anode in a membrane fuel cell. J. Power Sources 2004, 127, 341–347. [Google Scholar] [CrossRef]
  10. Wang, S.J.; Zhang, J.; Gharbi, O.; Vivier, V.; Gao, M.; Orazem, M.E. Electrochemical impedance spectroscopy. Nat. Rev. Methods Primers 2021, 1, 41. [Google Scholar] [CrossRef]
  11. Messing, M.; Shoa, T.; Ahmed, R.; Habibi, S. Battery SoC Estimation from EIS Using Neural Nets. In Proceedings of the 2020 IEEE Transportation Electrification Conference & Expo (ITEC), Chicago, IL, USA, 23–26 June 2020; pp. 588–593. [Google Scholar]
  12. Koleti, U.R.; Dinh, T.Q.; Marco, J. A new on-line method for lithium plating detection in lithium-ion batteries. J. Power Sources 2020, 451, 227798. [Google Scholar] [CrossRef]
  13. Zhou, X.; Huang, J. Impedance-Based diagnosis of lithium ion batteries: Identification of physical parameters using multi-output relevance vector regression. J. Energy Storage 2020, 31, 101629. [Google Scholar] [CrossRef]
  14. Zhang, Y.; Tang, Q.; Zhang, Y.; Wang, J.; Stimming, U.; Lee, A.A. Identifying degradation patterns of lithium ion batteries from impedance spectroscopy using machine learning. Nat. Commun. 2020, 11, 1706. [Google Scholar] [CrossRef] [PubMed]
  15. Waag, W.; Käbitz, S.; Sauer, D.U. Experimental investigation of the lithium-ion battery impedance characteristic at various conditions and aging states and its influence on the application. Appl. Energy 2013, 102, 885–897. [Google Scholar] [CrossRef]
  16. Kindermann, F.M.; Noel, A.; Erhard, S.V.; Jossen, A. Long-term equalization effects in Li-ion batteries due to local state of charge inhomogeneities and their impact on impedance measurements. Electrochim. Acta 2015, 185, 107–116. [Google Scholar] [CrossRef]
  17. Datang NXP Semiconductors, DNB1168 (Company Confidential) Datasheet–Rev 1.1. Available online: https://www.datangnxp.com/en/details/products/43 (accessed on 30 November 2021).
  18. Soni, R.; Robinson, J.B.; Shearing, P.R.; Brett, D.J.; Rettie, A.J.; Miller, T.S. Lithium-sulfur battery diagnostics through distribution of relaxation times analysis. Energy Storage Mater. 2022, 51, 97–107. [Google Scholar] [CrossRef]
  19. Schmidt, J.P.; Berg, P.; Schönleber, M.; Weber, A.; Ivers-Tiffée, E. The distribution of relaxation times as basis for generalized time-domain models for Li-ion batteries. J. Power Sources 2013, 221, 70–77. [Google Scholar] [CrossRef]
  20. Wildfeuer, L.; Gieler, P.; Karger, A. Combining the Distribution of Relaxation Times from EIS and Time-Domain Data for Parameterizing Equivalent Circuit Models of Lithium-Ion Batteries. Batteries 2021, 7, 52. [Google Scholar] [CrossRef]
  21. Wan, T.H.; Saccoccio, M.; Chen, C.; Ciucci, F. Influence of the Discretization Methods on the Distribution of Relaxation Times Deconvolution: Implementing Radial Basis Functions with DRTtools. Electrochim. Acta 2015, 184, 483–499. [Google Scholar] [CrossRef]
  22. Bard, A.J.; Faulkner, L.R. Electrochemical Methods: Fundamentals and Applications. Russ. J. Electrochem. 2002, 38, 1364–1365. [Google Scholar]
  23. Zhu, X.L.; Macía, L.F.; Jaguemont, J.; de Hoog, J.; Nikolian, A.; Omar, N. Hubin, Electrochemical impedance study of commercial LiNi0.8Co0.15Al0.05O2 electrodes as a function of state of charge and aging. Electrochim. Acta 2018, 287, 10–20. [Google Scholar] [CrossRef]
  24. Abraham, D.; Kawauchi, S.; Dees, D. Modeling the impedance versus voltage characteristics of LiNi0.8Co0.15Al0.05O2. Electrochim. Acta 2008, 53, 2121–2129. [Google Scholar] [CrossRef]
  25. Zhu, X.; Hallemans, N.; Wouters, B.; Claessens, R.; Lataire, J.; Hubin, A. Operando odd random phase electrochemical impedance spectroscopy as a promising tool for monitoring lithium-ion batteries during fast charging. J. Power Sources 2022, 544, 231852. [Google Scholar] [CrossRef]
  26. Kang, K.; Ceder, G. Factors that affect Li mobility in layered lithium transition metal oxides. Phys. Rev. B 2006, 74, 094105. [Google Scholar] [CrossRef]
  27. Nyman, A.; Zavalis, T.G.; Elger, R.; Behm, M.; Lindbergh, G. Analysis of the Polarization in a Li-Ion Battery Cell by Numerical Simulations. J. Electrochem. Soc. 2010, 157, A1236–A1252. [Google Scholar] [CrossRef]
  28. Zoerr, C.; Sturm, J.; Solchenbach, S.; Erhard, S.; Latz, A. Electrochemical polarization-based fast charging of lithium-ion batteries in embedded systems. J. Energy Storage 2023, 72, 108234. [Google Scholar] [CrossRef]
  29. Hosen, S.; Gopalakrishnan, R.; Kalogiannis, T.; Jaguemont, J.; Van Mierlo, J.; Berecibar, M. Impact of Relaxation Time on Electrochemical Impedance Spectroscopy Characterization of the Most Common Lithium Battery Technologies—Experimental Study and Chemistry-Neutral Modeling. World Electr. Veh. J. 2021, 12, 77. [Google Scholar] [CrossRef]
  30. Mansfeld, F.; Shih, H. Comment on “Kramers-Kronig Transformation of Constant Phase Impedances”. J. Electrochem. Soc. 1990, 137, 3303. [Google Scholar] [CrossRef]
  31. Carcione, J.M.; Cavallini, F.; Ba, J.; Cheng, W.; Qadrouh, A.N. On the Kramers-Kronig relations. Rheol. Acta 2018, 58, 21–28. [Google Scholar] [CrossRef]
  32. Luo, J.; Liang, X.; Zhang, Y.; Liang, C.; Yassine, H.; Leroy, G.; Carru, J.-C.; Mascot, M. Application of the Kramers–Kronig relationships in the electrochemical impedance models fit. J. Solid State Electrochem. 2021, 25, 2225–2233. [Google Scholar] [CrossRef]
  33. Schönleber, M.; Klotz, D.; Ivers-Tiffée, E. A Method for Improving the Robustness of linear Kramers-Kronig Validity Tests. Electrochim. Acta 2014, 131, 20–27. [Google Scholar] [CrossRef]
Figure 1. Overall research process for the EIS experiment.
Wevj 14 00321 g001
Figure 2. (a) Schematic diagram of NXP experimental test platform. (b) NXP experimental test platform and device connection diagram.
Wevj 14 00321 g002
Figure 3. EIS testing process.
Wevj 14 00321 g003
Figure 4. (ae) Results for the different SOC at the same resting time of 10 s, 15 min, 30 min, 1 h, and 2 h, respectively. (f) DRT results for EIS with resting time of 30 min and 50% SOC.
Wevj 14 00321 g004
Figure 5. Fitting results of the equivalent circuit. (a) Equivalent circuit structure. (b) Fitting results for Rct and R0.
Wevj 14 00321 g005
Figure 6. EIS for different resting times at the same SOC. (ad) Results for 10% SOC, 20% SOC, 30% SOC, and 40% SOC, respectively.
Wevj 14 00321 g006
Figure 7. EIS for different resting time at same SOC. (af) results for 50% SOC, 60% SOC, 70% SOC, 80% SOC, 90% SOC, and 100% SOC, respectively.
Wevj 14 00321 g007
Figure 8. Equivalent circuit fitting results. (ac) results for different resting times at 20% SOC, 50% SOC, and 80% SOC, respectively.
Wevj 14 00321 g008aWevj 14 00321 g008b
Figure 9. KK transformation results for different resting times at 20% SOC. (ae) The results for resting times of 10 s, 15 min, 30 min, 1 h, and 2 h, respectively.
Wevj 14 00321 g009aWevj 14 00321 g009b
Figure 10. KK transformation results for different resting times at 50% SOC. (ae) The results for resting times of 10 s, 15 min, 30 min, 1 h, and 2 h, respectively.
Wevj 14 00321 g010aWevj 14 00321 g010b
Figure 11. KK transformation results for different resting times at 80% SOC. (ae) The results for resting times of 10 s, 15 min, 30 min, 1 h, and 2 h, respectively.
Wevj 14 00321 g011aWevj 14 00321 g011b
Disclaimer/Publisher’s Note: The statements, opinions and data contained in all publications are solely those of the individual author(s) and contributor(s) and not of MDPI and/or the editor(s). MDPI and/or the editor(s) disclaim responsibility for any injury to people or property resulting from any ideas, methods, instructions or products referred to in the content.

