1. Introduction
The emissions of the internal combustion engine road transport are one of the main sources of air pollution in the modern world, affecting public health and the climate [
1]. Numerous researchers consider electric vehicles (EV) a reasonable solution for the reduction of the ongoing air pollution and greenhouse gas emissions [
2,
3,
4]. For this reason, the EV market grew quite rapidly over the last decade. A recent study of the International Energy Agency (IEA) [
5] shows that the global EV stock has risen substantially from the total number of 17,000 units in 2010 to more than 10 million vehicles worldwide in 2020. Obviously, the EV market is tightly linked with the EV charging market, which, in turn, shows an impressive development as well. In 2020, the total global number of publicly accessible electric vehicle charge points had reached 1.3 million units, among which almost 400,000 were fast chargers. Along with the numerical growth, the business models of the EV charging market evolve as well, trying to find the most optimal and viable solutions.
The existing literature on business modelling contains different qualitative frameworks and approaches with various elements and structures [
6,
7,
8]. However, it is noticeable that these approaches have a common part—the quantitative part. The quantitative part of a business model describes a company’s revenues and costs, which are the essential components of a company’s profitability and even viability. Since the EV charging market is relatively new, there is a clear shortage of studies focusing on the quantitative business models of its participants, while the importance of these studies for further market development is quite high. Due to the shortage of quantitative business modelling frameworks specifically designed for the participants of the EV charging market, its current participants have to spend time and funds on formulating the internal business analysis techniques gaining experience through trials and errors, and increasing the risk of losses and failure. Moreover, for the companies willing to enter the EV charging market, the shortage of these studies becomes an additional informational barrier that can be avoided.
The current paper covers this research gap by presenting a business model quantification framework designed for the core participants of the EV charging business ecosystem. Moreover, the major advantage of the defined framework is in its applicability both for the current and potential EV charging market participants. The framework includes two types of formulas, allowing for the calculation of revenues, costs and deriving earnings before interest and taxes (EBIT) of the core participants of the EV charging business ecosystem. The first type is the explicit formula set, which can be used for the internal business analysis by the current market participants. The application of the explicit formulas requires the use of full and precise data about the charging activities. However, for the new or potential market participants, the required data are not always fully available, and they have to make use of certain assumptions and aggregations. For this purpose, the current research offers the implicit formula set, allowing us to make grounded approximations by making use of simplified data.
The paper is structured as follows. In
Section 2, an overview of quantitative elements of the three most cited qualitative business modelling approaches is provided, along with the mapping of the EV charging business ecosystem.
Section 3 describes the methodology for the quantification of the business models of the core participants of the EV charging business ecosystem. Next,
Section 4 describes the application of the defined quantitative business modelling framework on
EBIT scenario of an archetypical charge point operator, based on real-life data. Finally,
Section 5 outlines the conclusions of this work.
2. Literature Overview
2.1. Business Modelling Approaches
As was already mentioned in the Introduction, various qualitative business modelling approaches have a common quantitative part.
Table 1 provides an overview of quantitative elements of the three most cited qualitative business modelling approaches.
As is shown in
Table 1, all the quantitative parts of the aforementioned business modelling approaches look quite similar, trying to capture the value through two main elements, namely, through revenues and costs, which are the only elements for the earnings before interest and taxes (
EBIT) calculation. Thus, it makes the
EBIT a relatively good indicator of the viability and profitability of the business model in the short-term. The investigation of the long–term viability requires the return on investment (ROI) and other factors analysis and falls out of the scope of this research.
2.2. EV Charging Business Ecosystem
According to De Cauwer et al. [
9] the structure of the total EV charging value chain is relatively broad and comprised of different types of stakeholders, belonging to different markets and niches: energy market (Transmission System Operators (TSO), Distribution System Operators (DSO), energy suppliers), vehicle market (vehicle manufacturer, vehicle owner, vehicle user), charging infrastructure (Equipment Manufacturer (EM), Charge Point Operator (CPO), Mobility Service Provider (MSP)) and policy makers (including official public authorities and regulators). The current paper focuses on the core participants of the EV charging business ecosystem, namely the ones directly related to the EV charging activities as their core business.
Initially, the concept of the business ecosystem was introduced by Moore [
10] and can be defined as a set of interrelated entities that interact with each other aiming at creating benefit (or other value). According to Moore, every business ecosystem is comprised of three layers of participants with different levels of involvement. The inner layer of the business ecosystem is its core, which includes only the entities directly involved in the core business of the ecosystem—the direct suppliers and distributors. The mid layer is the extended enterprise, including not only the core business participants, but also their customers, customers of customers, standard bodies, indirect suppliers and suppliers of complementary products and services. Finally, the top layer comprises the whole business ecosystem, including the inner layers, along with all the other stakeholders, such as policy makers, trade associations, labor unions, investors and so forth. The EV charging value chain [
9] can be translated in terms of a business ecosystem though the division of its stakeholders into the aforementioned three layers, as it is visualized in
Figure 1.
The current research focuses only on the following core participants of the EV charging business ecosystem, the entities most deeply involved into the EV charging core business [
9,
11,
12]:
Equipment Manufacturers (EMs): companies producing and selling the EV supply equipment (EVSE), that is, different types of EV chargers. The production range of an average EM typically includes slow residential EVSE, faster business (or semi-public) EVSE and ultra-fast EVSE for on-the-road charging.
Charge Point Operators (CPOs): companies responsible for the management and maintenance of the EV charging infrastructure. A CPO, owning and/or managing an EV charging infrastructure, can have a relatively wide range of services, including the installation of EVSE, technical services, connection to the controlled network of EVSE for interoperable MSPs, provision of access to the EV charging data and so forth.
Mobile Service Providers (MSPs): IT companies, that, by way of their software, provide access for customer EV users to the EV charging services on the EVSE of the interoperable CPOs. In general, access to EV charging is provided by the means of a mobile app and/or Radio Frequency Identification (RFID) charging keys. Moreover, the MSP mobile app usually has many additional functions, including the localization of interoperable EVSE, the initiation and tracking of EV charging, the generation of the bill, different payment methods, online customer support, and so forth.
3. Methodology for Quantification of the Business Models of the Core Participants of EV Charging Business Ecosystem
The following methodology for the quantification of the business models of the core participants of the EV charging business ecosystem is based on the
EBITconcept. The
EBIT of a company can be calculated as a difference between its revenues and costs before taking in consideration interests and taxes [
13].
Considering the fact that various countries and even provinces have their own different taxing systems, the
EBIT concept becomes a relatively convenient way to quantify a business model on a global perspective. The elements participating into revenues and costs calculations of the key participants of the EV charging market are based on the research of Madina et al. [
14] and Zhang et al. [
15], validated and/or complemented by the means of the investigation of the business models of numerous participants of the core of EV charging business ecosystem in the European Union [
16,
17,
18,
19,
20,
21,
22].
The current section presents the detailed descriptions of the formulas defining the costs, revenues and derived EBIT for the three core participants of EV charging market. Moreover, this research offers two sets of formulas: explicit and implicit.
Although these two types of formula imply the calculation of EBIT for EMs, CPOs and MSPs, there is a visible difference between them. The explicit set of formulas needs the full and detailed data, while the implicit allows for certain assumptions and aggregations.
For instance, while the calculation of EBIT for EMs is quite straightforward, this is not the case for CPOs and MSPs. The calculation of EBIT for the last two, depends on multiple factors such as electricity costs, and the location and utilization rate of EVSE among others. Therefore, in order to make use of the explicit formulas set, the user has to have access to the full data about every charging session on every controlled EVSE.
However, access to the full datasets is not always possible. The new market entrants or the current EV charging market participants, willing to expand their business over new locations and/or extensions of product range, would have to extrapolate the existing data or use bench-marking. Obviously, this decreases the data accuracy and creates the necessity to include certain assumptions in the calculation.
Therefore, the current research offers the implicit set of formulas, allowing for the use of aggregated and average data values. However, it is quite obvious that the use of implicit formulas, along with the simplified data, has a negative influence on the accuracy of results, which become the approximations of the results retrieved through explicit formulas.
Thus, depending on the capabilities and preferences of the user, either an explicit or an implicit version of the framework can be used.
3.1. Equipment Manufacturer
As has already been mentioned, the calculation of the EBIT components is quite straightforward and does not require any simplifications or aggregations. Therefore, in this section, a single formula set is provided, valid both for explicit and implicit calculations.
3.1.1. Costs
The costs of EV charging EM can be defined by the following formula:
: costs related to manufacturing of EVSE (excluding human resources (HR) costs);
: amortization costs of production plant and other machinery;
: costs related to HR;
: costs related to the research and development activities;
: other costs not included in the previous categories.
The costs of EVSE manufacturing (
C) can be defined as follows:
y: type of EVSE, from 1 to Z (e.g., y: slow AC charging system for residential use; y: faster AC charging system for business locations; : ultra-fast DC charging system for on-the-road charging);
: cost of production of one unit type y (not including the HR costs);
: number of produced units type y.
Thus, the total
Costs, initially defined by the Equation (
2), can be redefined as follows:
3.1.2. Revenues
The revenue streams of an EV charging EM are, quite obviously, generally dependent on the EVSE sales:
: total revenues from the sales of different types of EVSE;
: other revenues of EV charging equipment manufacturers, not related to sales of EV charging systems.
The total revenues from charging system sales are dependent on the number of items sold and their price. Thus, the
CS can be defined by the following formula:
Thus, the redefined
Revenues formula is:
3.1.3. EBIT
Earnings before interest and taxes can be then formulated as the difference between EMs’ revenues and costs:
3.2. Charge Point Operator
The calculations related to the EBIT include many more factors than those related to EBIT, making them subject to aggregations and simplifications. Therefore, the current section offers an implicit formula set (each implicit formula is put in a frame), along with the explicit one (each explicit formula is a part of general text).
3.2.1. Costs
The costs of a CPO depend on multiple factors and can be generally defined by the following formula:
: includes all the costs related to the infrastructure of EVSE owned by CPO;
: cost of electricity bill which is supplied through the EVSE owned by CPO;
: costs for assessing the marketplace, mainly including the interoperability costs paid by the market participants to the Roaming Service Providers.
CPO costs related to infrastructure can be defined by the following equation:
y: costs of depreciation of owned EVSE type y;
y: costs related to the management and maintenance of an EVSE type y owned/operated by the CPO;
: number of EVSE of type y.
The depreciation cost (
C) is defined through the methodology chosen by the company itself, based on the initial investment and expected lifetime of the asset. However, the basic formula for linear depreciation looks as follows:
: initial investment, being the price of EVSE type y;
: initial investment, being the installation costs of EVSE type y;
: defined useful lifetime of EVSE type y;
: salvage value of EVSE type y after the end of its defined useful lifetime .
According to the Commission for Electricity and Gas Regulation (CREG) [
23], electricity costs can be divided into variable (per kWh) and fixed. The variable cost component typically includes energy costs (energy production costs and suppliers’ mark-up), network costs (of both transmission and distribution) and variable taxes. The fixed component includes taxes charged on a yearly basis [
24]. Thus, the electricity costs (
C) of a CPO could be defined by the following formula:
k: index number of EVSE (ranging from 1 to N) participating into the CPO network;
i: index number of charging session (ranging from 1 to n) per EVSE number k;
: number of kWh charged during the charging session i at the EVSE number k;
: network costs per kWh, which include the transmission and distribution costs;
: energy cost per kWh, charged by the energy supplier;
: variable energy taxes paid per kWh;
: fixed energy taxes paid on yearly basis.
Implicit:
Even though the components of the electricity costs of EV charging paid by a CPO show certain fluctuations depending on daytime, location of the EVSE, peak loads and other factors, in general, these fluctuations do not show any significant deviation from the average cost per kWh, which depends on the total yearly energy consumption of the company [25]. Thus, the Equation (12) can be aggregated in the following manner:
: average electricity cost per kWh; : maximum capacity of kWhs, EVSE type y is able to transmit in 1 year time (24/7 availability); : actual usage rate (in %) of the total maximum capacity (MC) of EVSE type y; : number of EVSE type y.
|
The total CPO costs previously defined in Equation (
10) can be redefined in the following manner:
Implicit:
Furthermore, the total costs defined in the explicit Equation (15) can be redefined by making use of the approximated electricity costs calculation defined by the implicit Equation (14) as follows:
|
3.2.2. Revenues
Charge point operators’ revenues depend, in general, on the charging activities on the managed network of EVSE:
: total fee received from the charging activities on the CPO charge points network;
: other revenues generated by side activities not directly related to the EV charging (e.g., software subscription fees).
The total fee received from the charging activities (
) depends, in turn, on several other factors, defined by the following formula:
k: index number of charging point (ranging from 1 to N) participating into the CPO network;
i: index number of charging session (ranging from 1 to n) per charging point k;
ik: CPO charging fee per kWh during the charging session i at the charge point k;
: number of kWh charged during the charging session i at the charge point k.
Thus, the total CPO revenues defined by the Equation (
17) can be redefined as follows:
Implicit:
Considering the approximation of energy costs calculation provided in implicit Equation (14), the revenues of the CPO in total and its E component in particular can be approximated in the following manner:
|
3.2.3. EBIT
As was already mentioned in Equation (
1),
EBIT of a company in general, and a CPO in particular, can be calculated as a difference between its revenues and costs. Thus,
EBIT can be defined as follows:
Implicit:
Considering the approximations of CPO’s revenues (implicit Equation (20)) and costs (implicit Equation (16)), the EBIT can be approximated as follows:
|
3.3. Mobile Service Provider
3.3.1. Costs
The costs of MSPs can be defined by the following formula:
Thus, considering the previously defined
TF formula, the costs of an MSP can be redefined as follows:
Implicit:
The costs formula of an MSP can be approximated by making use of the formulas used in the approximation of CPO revenues (implicit Equation (20)). Thus, the implicit costs formula of an MSP looks as follows:
|
3.3.2. Revenues
The MSPs currently existing in the market follow two different pricing strategies, having a direct impact on their revenue calculation formulas. Therefore, the current research divides the framework for the calculation of MSPs’ revenues in two parts, namely revenues generated via variable and fixed pricing strategies [
16,
22,
26].
Variable Pricing Strategy
The charging fee per kWh, that the MSP uses to bill its customer EV users, is variable and dependent on the initial charging price (CP) determined by the CPO, managing the EVSE, while the MSP adds a fixed mark-up (MU). Furthermore, the CPO charging price fluctuates, being influenced by different factors (e.g., energy price at a given moment, EVSE location, etc.) [
14,
15], causing the fluctuation of the total charging fees paid by the final EV user. On the one hand, the advantage of this pricing strategy is quite obvious: the MSP transfers the risk of additional expenses to their customer EV users, maintaining a fixed mark-up. On the other hand, since the risk of additional expenses is transferred to the customers, the price fluctuations implied by the current approach increase the degree of uncertainty about the final price setting, having a negative influence on the brand loyalty. Thus, a sharp rise of EV charging price caused by the sudden increase in CPO fee can motivate the customers to go over to the competitor [
26,
27]. The revenues of an MSP following the variable price strategy can be defined by the following equation:
: total variable charging fees paid by the EV users;
: total subscription fees paid by the EV users on yearly (or monthly) basis;
: other MSP revenues not related to the EV charging activities.
Furthermore, typically, MSPs offer various subscriptions reducing their customers’ fees per kWh in exchange for a fixed periodical fee. The formula defining the MSP revenues from these subscription fees looks as follows:
s: number of subscription type (e.g., type 1—gold; type 2—silver etc.) ranging from type 1 to type M;
SP: subscription price of subscription type s;
NC: number of customers which have purchased the subscription type s.
Thus, the mark-up (MU) of an MSP following the variable pricing strategy is fixed on a predefined value, while the final price for charging paid by the customer EV user is fluctuating along with the CPO charging fee.
The total variable charging fees (
VarCF) of an MSP can be defined by the following formula:
k: index number of EVSE (from 1 to N) participating into the networks of partner CPOs ;
i: index number of charging session (ranging from 1 to n) per charging point k;
CFik: charging fee (of the CPO) per kWh during the charging session i at the charge point k.
MU: MSP mark-up per kWh on the charging fee (CF) of the CPO for charging session i at EVSE k.
E: number of kWh charged during the charging session i at the charge point k.
Thus, the redefinition of MSP revenue Equation (
26) following the variable price strategy looks as follows:
Implicit:
The revenue formula of an MSP using a variable price strategy can be approximated by making use of the formulas used in the approximation of CPO revenues (see implicit Equation (20)) as follows:
|
Fixed Pricing Strategy
The charging fee per kWh, which the MSP uses to bill its customers (EV users), is fixed by the MSP and independent from the fluctuations of the CPO charging price. An MSP can follow this strategy only by adjusting its own mark-up to the fluctuations of the CPO charging price. Thus, in contrast to the variable pricing strategy, the fixed pricing puts the risks of additional expenses on the company’s shoulders. However, the advantage of this pricing strategy is that the elimination of customers’ risks allows the increase of the degree of brand loyalty between the existing customers and its popularity between the potential customers [
26,
28]. The revenues of an MSP following the fixed price strategy can be defined by the following formula:
: total fixed charging fees paid by the EV users ;
SF: total subscription fees paid by the EV users on yearly (or monthly) basis;
: other MSP revenues not related to the EV charging activities.
It can be noticed that the only difference between the aforementioned formula (Equation (
31)) and the formula defining the revenues of the MSP following the variable pricing strategy (Equation (
29)) lies in the total charging fee, which has become fixed. Thus, the total charging fee of an MSP following the fixed price strategy can be defined as follows:
The subscription fees (
) and the other revenue (
) categories remain similar to the MSPs following the variable price strategy. Thus, the redefined revenue formula for an MSP following the fixed price strategy looks as follows:
3.3.3. EBIT
Considering the fact that the EBIT of a company can be calculated as the difference between its revenues and costs, the formula of the EBIT of an MSP can be defined in two different ways, depending on the price strategy it follows. Thus, the EBIT calculation of an MSP following either a variable or fixed price strategy uses the respective revenue formula, while the costs formula remains valid for both.
Thus, the
EBIT of an MSP following the variable price strategy looks as follows:
While the
EBIT of an MSP following the fixed price strategy can be defined in the following manner:
Implicit:
The aforementioned formulas for the calculation of the EBIT of MSPs can be approximated by replacing their elements related to the CPO charging fee with their approximation from the implicit Equation (20). Thus, the approximations of the MSPs’ EBITs following variable and fixed pricing strategies are given by:
|
3.4. Comparative Analysis
As was already mentioned in
Section 3, the elements of the business model quantification framework defined by the current paper are based, among others, on the research of Madina et al. [
14], validated and/or complemented by means of the investigation of the business models of the current participants of the EV charging market. This investigation of the business models has allowed the current work to enhance the level of detail of the formulas, by increasing the number of factors participating into the calculation into the explicit formulas set, eventually allowing us to retrieve precise and accurate results for these calculations. However, the implicit formulas set allows for certain assumptions and aggregations, which are more convenient in the case of a data shortage, but generating approximations of the exact calculations. Therefore, the implicit formulas set remains comparable with the framework provided by the research of Madina et al. [
14].
For instance, the framework of Madina et al. [
14] defines the
Revenues and
Costs (referred to as
CSOincome and
CSOcost respectively), allowing for the
EBIT calculation. The
EBIT calculation is represented in the current work by explicit Equation (21) and implicit Equation (22), while the last one is applied in the real-life use-case in
Section 4. Moreover, it could be useful to compare the
EBIT calculation processes, to highlight the differences and delineate their advantages and shortcomings.
As the calculation of
EBIT implies the difference between
Revenues and
Costs, the definition of the framework begins with the definition of these components. Madina et al. [
14] define the
Revenues as follows:
CP: charging price;
C: annual number of charging events on a charging point;
COS: other sources of revenue;
NCS: number of charging points.
By comparing the
Revenues Equation (
38) defined by Madina et al. [
14] with the implicit
Revenues formula defined by the current work (Equation (20)), it becomes noticeable that a number of factors participating in the calculation are similar (i.e., charging price, other sources of revenue, number of charging points). However, the differences are present as well. First, Equation (38) does not differentiate the charging price per type of charger (this difference can be overwhelmed by applying the equation separately for every charging price for every EVSE type and add the results). Second, the calculation in Equation (38) is based on the annual number of charging events, while the implicit
Revenues formula (Equation (20)) considers the consumed amount of energy, based on the maximum charging capacity of EVSE and its utilization rate. This last difference is relatively important, since the electricity bill of energy supplier also considers the consumed amount of energy, while the number of kWhs per charging event can vary substantially. Moreover, it is important to mention that the investigated revenue models of the current participants of EV charging market are also based on the amount of consumed energy [
17,
29].
At the same time, the
Costs (referred to as
CSOcost) calculations in the framework of Madina et al. [
14] do consider, among others, the costs of the consumed energy, and are defined as follows:
: the amortization of EVSE, which considers initial investment cost, discount rate and lifetime;
: operation and management costs;
: fixed part of energy bill;
: variable part of energy bill, which considers the amount of energy consumed;
: metering cost;
: communication cost;
: cost of accessing the marketplace;
: staff and overhead costs.
From Equation (
39), it is clearly visible that every part of the electricity bill issued by the energy supplier is taken into consideration. Moreover, the level of detail of Equation (
39) is comparable with the explicit
Costs formula defined by the current paper (Equation (
15)), lacking, however, the accuracy related to calculations per EVSE, and considering the energy consumption as an average value equal for every EVSE. Moreover, the fixed and variable costs of energy, along with metering and communication costs, could be eventually translated by the energy supplier to a per kWh tariff [
23]. This translation to a single per kWh tariff can make Equation (
39) also comparable with the implicit
Costs formula (Equation (16)).
Finally, the calculation
EBIT by making use of
Revenues and
Costs formulas defined by the research of Madina et al. [
14] looks as follows:
However, considering all the aforementioned shortcomings related
Revenues (Equation (
38)) and
Costs (Equation (
39)) calculations defined by Madina et al. [
14] framework, it becomes logical to conclude that
EBIT calculations defined by the current research in explicit Equation (21) and implicit Equation (22) are able to generate more accurate results and approximations, respectively, than the calculation method defined in Equation (40).
4. Results
Application of the dEfined Framework: EBIT Calculation in Approximation of the Real–Life Use Case
The current application serves as a showcase for the
EBIT calculation mechanism by making use of the implicit formula set. The values of the different parameters presented in
Table 2, have been gathered from chargers in the Vrije Univeristeit Brussel (VUB) campus and from partner companies [
16,
17,
18,
19,
20,
21,
22,
29,
30,
31,
32,
33].
However, the presented results can serve only as a snapshot of the situation faced by this simulated CPO at a certain moment. For this reason, it would be useful to simulate the influence on
EBIT caused by the changes of the relevant variables in order to define the power of their influence and define the most critical ones.
Figure 2,
Figure 3,
Figure 4 and
Figure 5 show the percentage influences of the increases of the relevant variables on the
EBIT of the simulated CPO.
Considering the given assumptions, the CPO gets the following results (
Table 3):
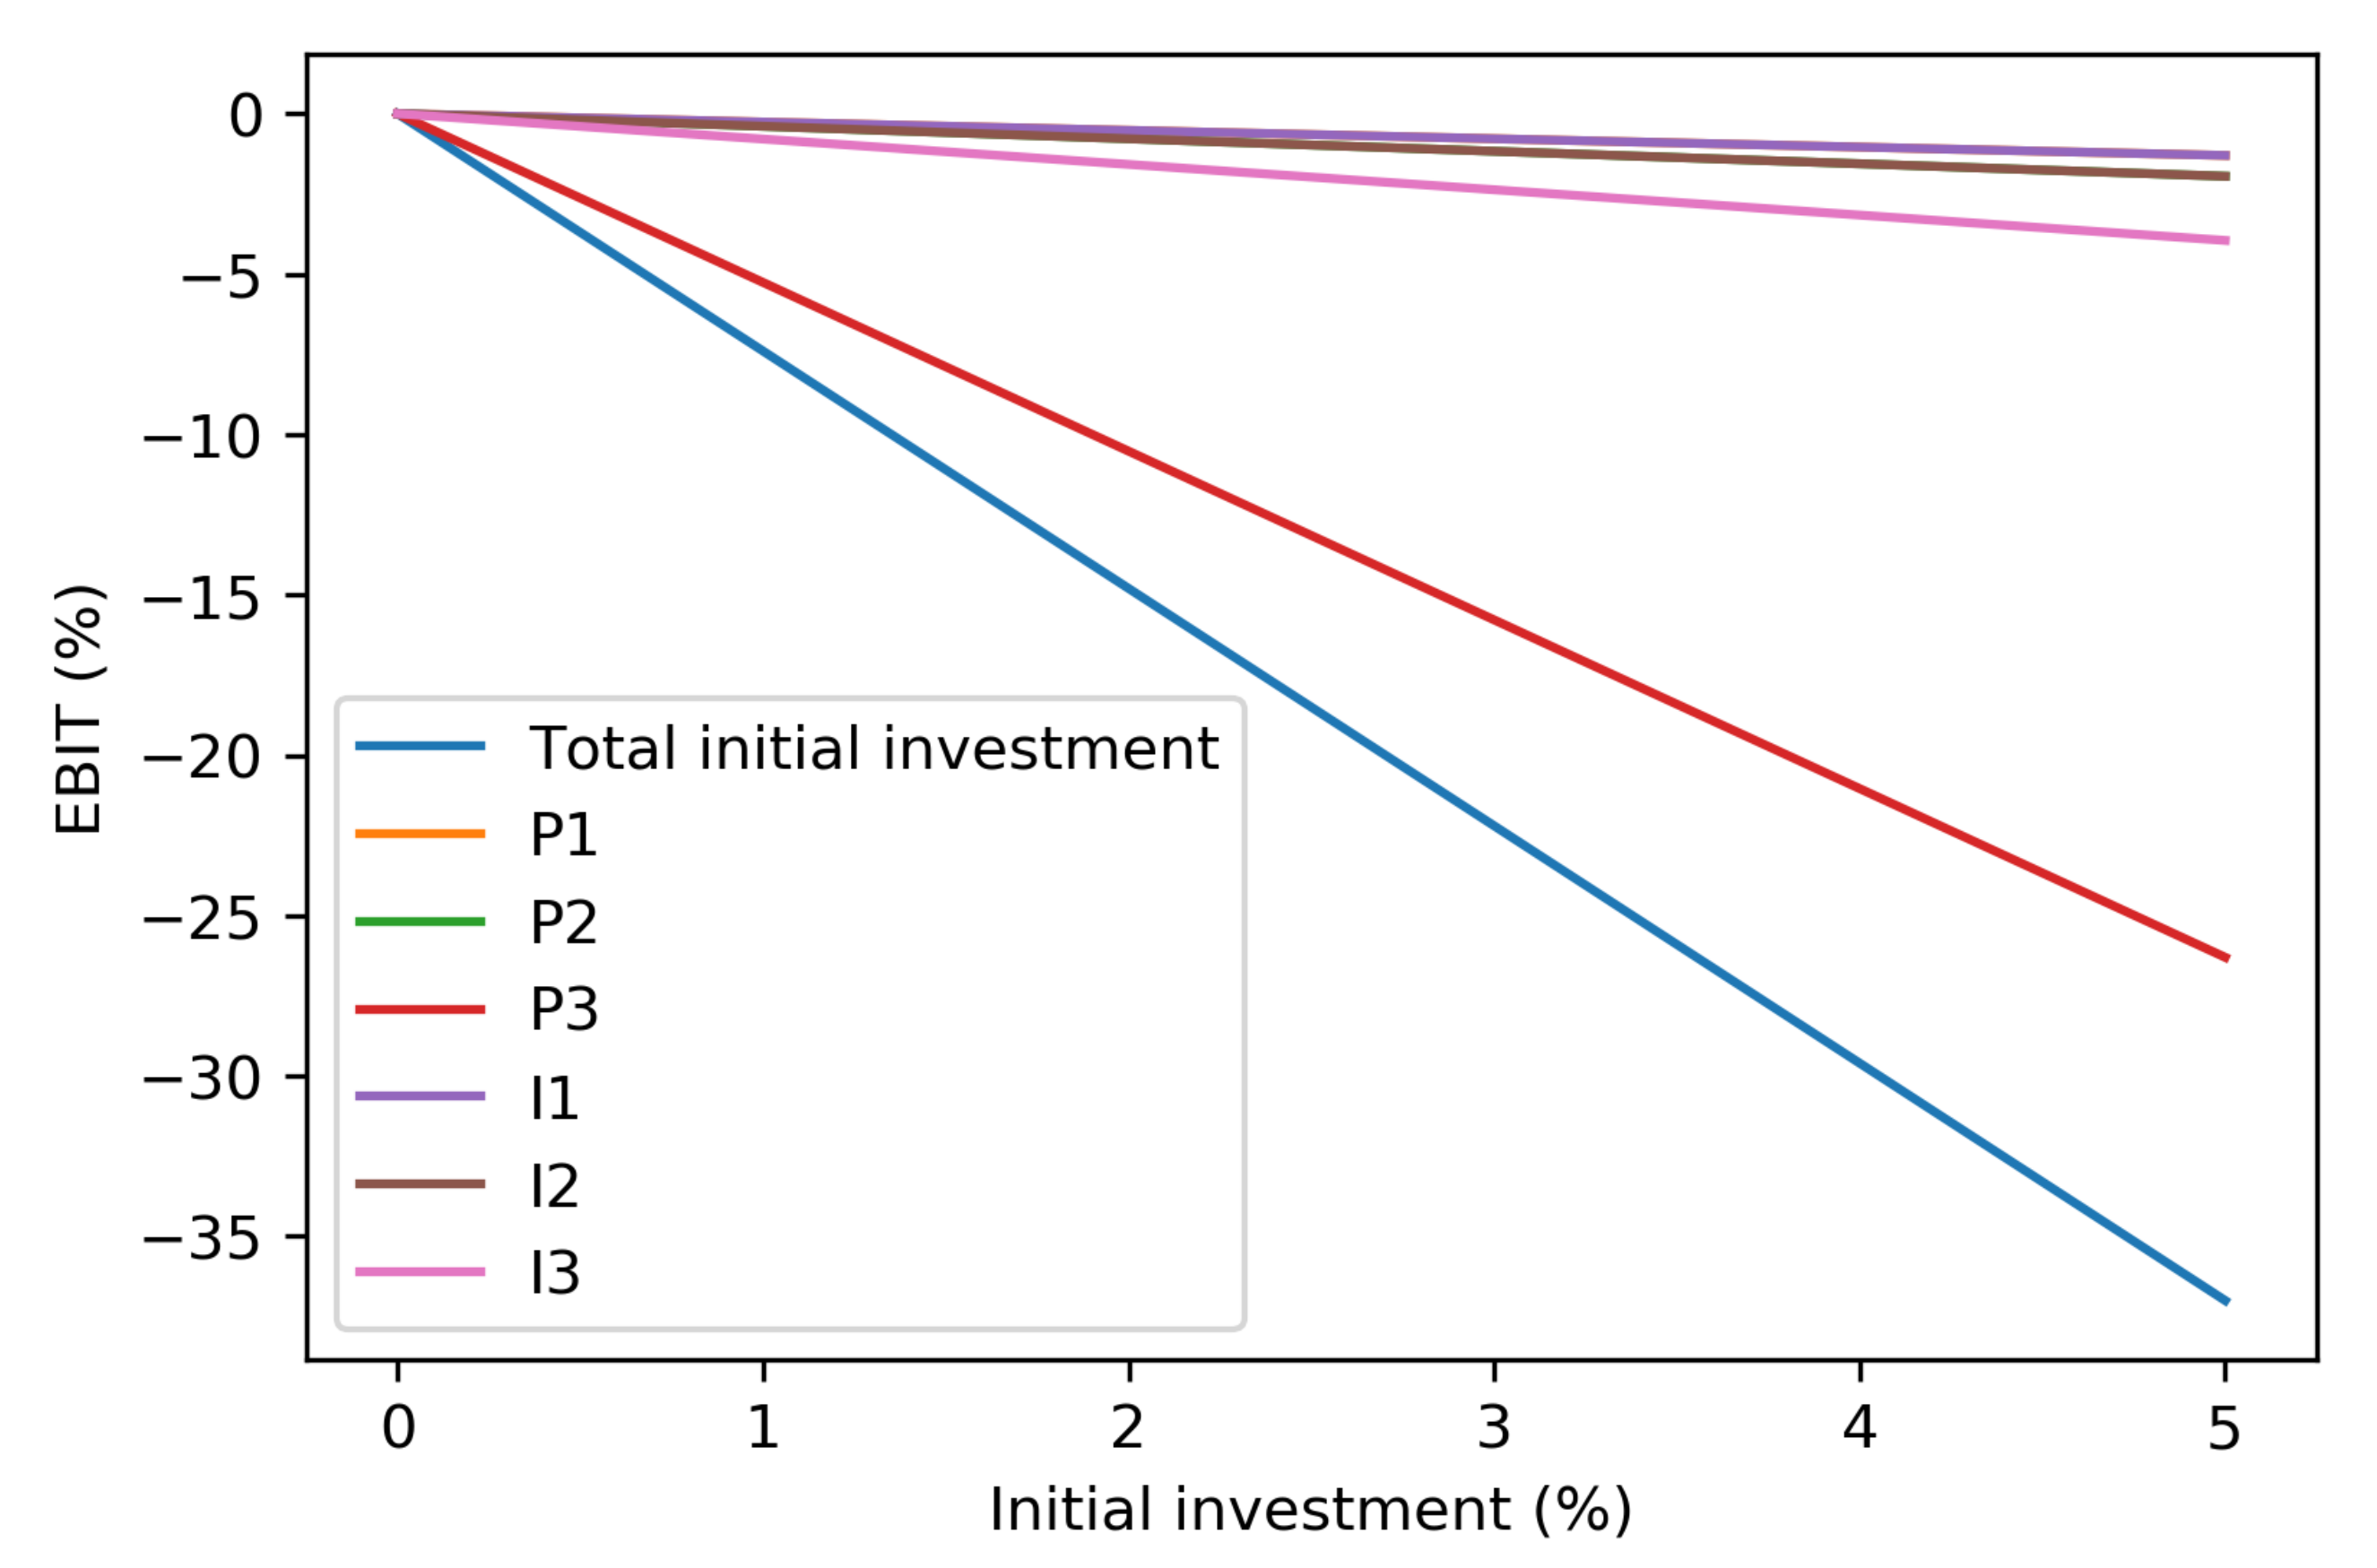
The increase in price and/or installation costs, represented in
Figure 2, has, obviously, a negative influence on the CPO’s
EBIT. Even though, the initial investment is, in general, considered as capital expenses (CAPEX) [
35] and cannot be a part of
EBIT, the negative influence is due to the rise of depreciation costs, that are, among others, dependent on the amount of initial investment [
36].
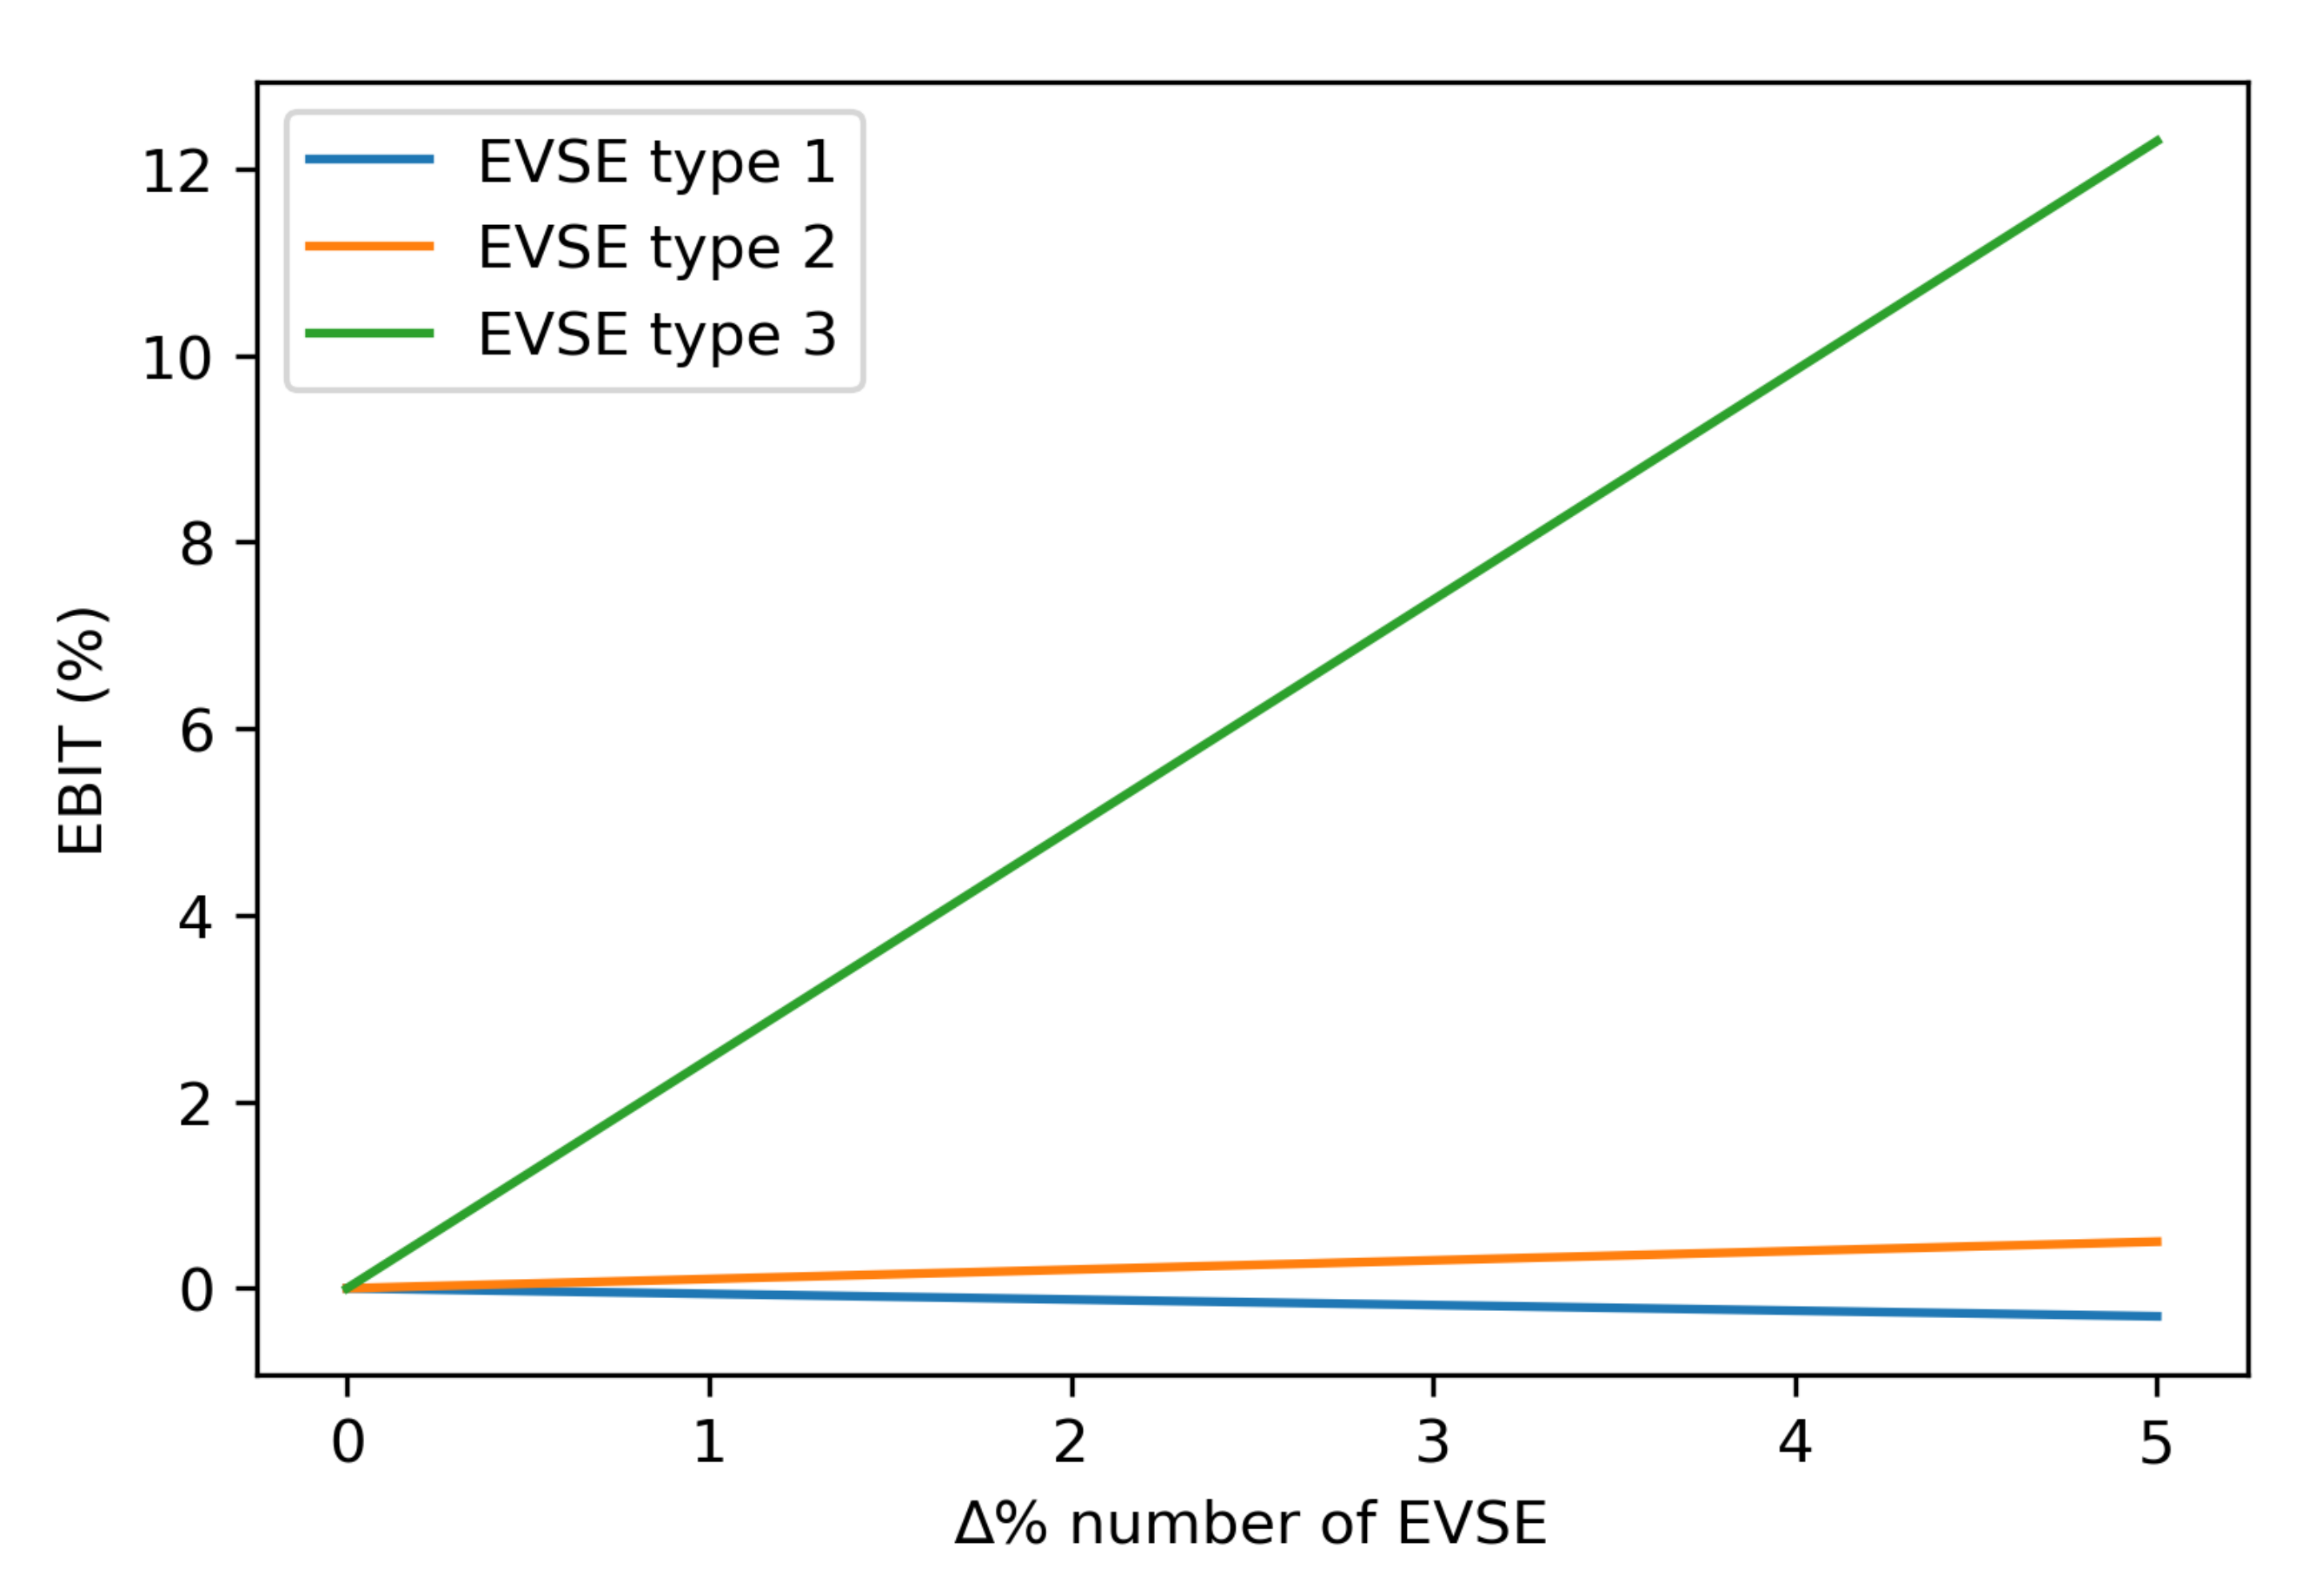
Figure 3 presents the increase in number of EVSEs, fixing the initial prices and installation costs.
As can be observed, in general, the increase in number of chargers shows a relatively positive influence on
EBIT. However, considering the current usage rate, the increase of the number of EVSE type 1 (with the lowest power level of 7.4 kW) [
16,
21,
30] shows a slight negative influence. The problem of the low usage rate of EVSE is currently quite common. One of the main reasons therefore is a relatively low total number of EVs on the roads, while EV charging infrastructure is already in place. The participants of the EV charging market invest in infrastructure in order to gain a bigger market share and presuming future profits [
15,
37]. Thus, the current revenues per kWh for the chargers with a low power level are not able to cover the expenses. Moreover, the
EBIT rises due to an increase in the number of EVSE of other types is also related to their usage rate. The increase in number of EVSE could become profitable only in case if the number of EVs is expected to grow respectively [
15].
Figure 4 shows the potential influence in charging fees and electricity price on
EBIT.
Obviously, the increase in electricity price causes the reduction of
EBIT, as it means the increase in costs, while the increase of charging fees shows a positive effect. However, it is important to underline that the current simulation does not consider the customers’ willingness to pay [
36]. Therefore, after a certain point the increase in price would show a negative effect, due to the loss of customers’ loyalty [
38,
39].
Finally,
Figure 5 shows the effect of the increase of usage rate of the chargers on
EBIT.
As can be observed, this parameter has the strongest effect, but is partially dependent on external factors. As already mentioned, the usage rate of EVSE is strongly related to the number of EVs on the roads [
15,
37]. Another factor influencing the EVSE usage rate is the location, meaning that the EV charging occurs more often in social destinations (e.g., shopping malls, business centers etc.) [
40]. Furthermore, there are other numerous factors rated to the EVSE usage rate, such as peak and off-peak hours, season of the year and others [
15].
Summarizing the observations from the above-mentioned graphs (
Figure 2,
Figure 3,
Figure 4 and
Figure 5), the increase in initial investments into the infrastructure, along with increase in electricity price, cause moderate negative decreases in
EBIT. At the same time, the moderate positive effects are shown by the increases in charging prices (limited by the customers’ willingness to pay) [
36] and number of EVSE (limited by the growth in number of EVs). The most significant positive influence on
EBIT shows the increase in usage rate of EVSE infrastructure, however, as it is already mentioned, this parameter is also dependent on a number of external factors.
5. Conclusions
The current paper has defined a quantitative business modelling framework for the core participants of the electric vehicle (EV) charging business ecosystem. This framework can serve as a good modelling and analytical tool both for new (or potential) market entrants and for its current participants.
The paper includes two sets of formulas, the explicit and the implicit. The explicit formulas set is mainly useful for the current participants in the market, as they already have an existing database with values of all the necessary parameters. These equations can be used as a business analysis tool, allowing these companies to make more precise and profitable steps in their business development.
The implicit formulas set can be a handy tool for the new EV charging market entrants and companies willing to expand their businesses by the means of new locations and value propositions. Due to the lack of precise data, these companies might not be able to use the explicit formula set. However, simulation of their potential costs, revenues and
EBIT will be possible with the implicit formula set, as shown in
Section 4. Moreover, the application of the framework in
Section 4 has not only shown the key numbers related to costs and revenues, but has also given an opportunity to define the influence of the most critical factors (initial investment costs, EVSE usage rate, number of EVSE, etc.) on these numbers. However, it is important to mention that the defined sensitivity is linear and does not take into account the interrelations between factors. Thus, the investigation of these interrelations would be a very useful next research step.
Finally, along with its application, the described business model quantification framework has its own limitations as well. The EV charging market is currently developing relatively fast, so do the business models of its participants and the variables engaged in their business models quantification. Therefore, it becomes impossible to generalize and apply these defined equations in every case and a readjustment is deemed necessary on a per site basis.
Author Contributions
Conceptualization, A.G.; methodology, A.G.; software, A.G.; validation, A.G., C.D.C., N.S., T.C. (Thomas Crispeels); formal analysis, A.G.; writing—original draft preparation, A.G.; writing—review and editing, N.S. and C.D.C.; visualization, A.G.; supervision, N.S., C.D.C. and T.C. (Thomas Crispeels); project administration, T.C. (Thierry Coosemans) and M.M.; funding acquisition, T.C. (Thierry Coosemans) and M.M. All authors have read and agreed to the published version of the manuscript.
Funding
This research was funded by Vlaams Agentschap Innoveren & Ondernemen (VLAIO) in the framework of the OPTIBIDS project with grant number HBC.2018.0519.
Institutional Review Board Statement
None.
Informed Consent Statement
None.
Data Availability Statement
The Vrije Universiteit Brussel (VUB) EV charging data used during the current study is not publicly available due to privacy reasons related to the EV users’ radio frequency identification (RFID).
Conflicts of Interest
The authors declare no conflict of interest.
References
- OECD. Decarbonising Urban Mobility with Land Use and Transport Policies; OECD Publishing: Paris, France, 2020; p. 144. [Google Scholar] [CrossRef]
- OECD. Non-Exhaust Particulate Emissions from Road Transport; OECD Publishing: Paris, France, 2020; p. 149. [Google Scholar] [CrossRef]
- Ou, S.; Lin, Z.; He, X.; Przesmitzki, S.; Bouchard, J. Modeling charging infrastructure impact on the electric vehicle market in China. Transp. Res. Part D Transp. Environ. 2020, 81, 102248. [Google Scholar] [CrossRef]
- Requia, W.J.; Mohamed, M.; Higgins, C.D.; Arain, A.; Ferguson, M. How clean are electric vehicles? Evidence-based review of the effects of electric mobility on air pollutants, greenhouse gas emissions and human health. Atmos. Environ. 2018, 185, 64–77. [Google Scholar] [CrossRef]
- IEA. Global EV Outlook 2021—Accelerating Ambitions Despite the Pandemic; Global EV Outlook 2021; International Energy Agency: Paris, France, 2021. [Google Scholar]
- Osterwalder, A.; Pigneur, Y. Business Model Generation: A Handbook for Visionaries, Game Changers, and Challengers; John Wiley & Sons: Hoboken, NJ, USA, 2010; p. 288. [Google Scholar]
- Richardson, J. The business model: An integrative framework for strategy execution. Strateg. Chang. 2008, 17. [Google Scholar] [CrossRef]
- Teece, D.J. Business models, business strategy and innovation. Long Range Plan. 2010, 43, 172–194. [Google Scholar] [CrossRef]
- De Cauwer, C.; Guillemot, A.; Cragues, G.; Van Mierlo, J.; Coosemans, T.; Messagie, M. Towards EU-wide Interoperability of charging infrastructure for electric vehicles—The Belgian Case. In Proceedings of the 31st International Electric Vehicle Symposium and Exhibition, EVS 2018 and International Electric Vehicle Technology Conference 2018, EVTeC 2018, Kobe, Japan, 30 September–4 October 2018. [Google Scholar]
- Moore, J.F. The Death of Competition: Leadership and Strategy in the Age of Business Ecosystems; Wiley Harper Business: Chichester, NY, USA, 1996. [Google Scholar]
- Ferwerda, R.; Bayings, M.; van der Kam, M.; Bekkers, R. Advancing E-roaming in Europe: Towards a single “language” for the European charging infrastructure. World Electr. Veh. J. 2018, 9, 1–15. [Google Scholar] [CrossRef] [Green Version]
- Pandazis, J.C.; Hann, C.; Lebrun, B.; Coppola, G.; Dupuy, P.; Hoe, M.L.P. Memorandum of Understanding (MoU) Fostering Seamless and Valuable EV Customer Experience in Europe; Technical Report; European Comission: Brussels, Belgium, 2017. [Google Scholar]
- Bodie, Z.; Kane, A.; Marcus, A. EBOOK: Essentials of Investments: Global Edition; McGraw Hill: New York, NY, USA, 2013. [Google Scholar]
- Madina, C.; Zamora, I.; Zabala, E. Methodology for assessing electric vehicle charging infrastructure business models. Energy Policy 2016, 89, 284–293. [Google Scholar] [CrossRef] [Green Version]
- Zhang, Q.; Li, H.; Zhu, L.; Campana, P.E.; Lu, H.; Wallin, F.; Sun, Q. Factors influencing the economics of public charging infrastructures for EV–A review. Renew. Sustain. Energy Rev. 2018, 94, 500–509. [Google Scholar] [CrossRef]
- NewMotion. Laadpunten Voor Bedrijven. 2021. Available online: https://newmotion.com/nl-be/locatie-oplossingen/zakelijk-laden/laadpunten-voor-bedrijven-be (accessed on 15 September 2021).
- Fastned. Financial Reports & Presentations. 2021. Available online: https://fastnedcharging.com/hq/reports-presentations/ (accessed on 21 September 2021).
- Alfen. Alfen Product Range. 2021. Available online: https://alfen.com/en/ev-charge-points/alfen-product-range (accessed on 10 September 2021).
- Powerdale. Electromobility. 2021. Available online: https://www.powerdale.com/en/electromobility (accessed on 1 October 2021).
- Maingau. EinfachStromLaden die Elektromobilität der Zukunft Starten. 2021. Available online: https://www.maingau-energie.de/e-mobilitaet/Autostrom-Tarif (accessed on 7 September 2021).
- FlexiCharge. Laadpaal Thuis. 2021. Available online: https://www.flexicharge.nl/product-category/dc-snelladers/ (accessed on 8 September 2021).
- Plugsurfing. Ontdek de Mogelijkheden van Opladen Met Plugsurfing. 2021. Available online: https://www.plugsurfing.com/drivers/pricing (accessed on 3 September 2021).
- CREG. Hoe Is de Energieprijs Opgebouwd? 2021. Available online: https://www.creg.be/nl/consumenten/prijzen-en-tarieven/hoe-de-energieprijs-opgebouwd (accessed on 15 September 2021).
- VREG. Netwerktarieven en Heffingen van Toepassing op de Professionele Elektriciteitsklanten Aangesloten op Het Laag-Spanningsnet Zonder Piekmeting. 2021. Available online: https://www.vreg.be/sites/default/files/uploads/distributienettarieven/2020/Elektriciteit/kleine_bedrijven_elek_01.04.2020_t.e.m._31.12.2020_excl._btw.pdf (accessed on 4 September 2021).
- VLAIO. Energiescans in Kmo’s: 2017–2018. EINDRAPPORT, DEEL 1. Agentschap Innoveren & Ondernemen. 2021. Available online: https://www.vlaio.be/nl/begeleiding-advies/duurzaam-ondernemen/energieadvies/energieadvies (accessed on 11 September 2021).
- Wolbertus, R.; Gerzon, B. Improving electric vehicle charging station efficiency through pricing. J. Adv. Transp. 2018, 2018, 4831951. [Google Scholar] [CrossRef]
- Gönsch, J.; Klein, R.; Neugebauer, M.; Steinhardt, C. Dynamic pricing with strategic customers. J. Bus. Econ. 2013, 83, 505–549. [Google Scholar] [CrossRef]
- Özer, Ö.; Phillips, R. Why are prices set the way they are? In The Oxford Handbook of Pricing Management; Oxford University Press: Oxford, UK, 2012; p. 34. [Google Scholar]
- BlueCorner. Onderweg Laden. 2021. Available online: https://www.bluecorner.be/laadpalen/onderweg/ (accessed on 28 September 2021).
- Laadpaal24. Laadpalen. 2021. Available online: https://www.laadpaal24.nl/ev-box/homeline (accessed on 18 September 2021).
- EVservice. Laadpaal Thuis. 2021. Available online: https://www.evservice.eu/laadpalen (accessed on 27 September 2021).
- Hubject. Intercharge CPO. 2021. Available online: https://www.hubject.com/intercharge-cpo (accessed on 16 September 2021).
- E-clearing. Intercharge CPO. 2021. Available online: https://e-clearing.net/partners/pricing (accessed on 24 September 2021).
- Nelder, C.; Rogers, E. Reducing EV Charging Infrastructure Costs; Rocky Mountain Institute: Basalt, CO, USA, 2019. [Google Scholar]
- Shaaban, M.F.; Mohamed, S.; Ismail, M.; Qaraqe, K.A.; Serpedin, E. Joint planning of smart EV charging stations and DGs in eco-friendly remote hybrid microgrids. IEEE Trans. Smart Grid 2019, 10, 5819–5830. [Google Scholar] [CrossRef]
- Zhang, Y.; Zhou, Y.; Jiang, C.; Wang, Y.; Zhang, R.; Chen, G. Plug-in Electric Vehicle Charging With Multiple Charging Options: A Systematic Analysis of Service Providers’ Pricing Strategies. IEEE Trans. Smart Grid 2020, 12, 524–537. [Google Scholar] [CrossRef]
- Morrissey, P.; Weldon, P.; O’Mahony, M. Future standard and fast charging infrastructure planning: An analysis of electric vehicle charging behavior. Energy Policy 2016, 89, 257–270. [Google Scholar] [CrossRef]
- Hidrue, M.K.; Parsons, G.R.; Kempton, W.; Gardner, M.P. Willingness to pay for electric vehicles and their attributes. Resour. Energy Econ. 2011, 33, 686–705. [Google Scholar] [CrossRef] [Green Version]
- Plenter, F.; von Hoffen, M.; Chasin, F.; Benhaus, S.; Matzner, M.; Paukstadt, U.; Becker, J. Quantifying consumers’ willingness to pay for electric vehicle charging. In Proceedings of the 2018 IEEE 20th Conference on Business Informatics (CBI), Vienna, Austria, 11–14 July 2018; Volume 1, pp. 196–203. [Google Scholar]
- Brooker, R.P.; Qin, N. Identification of potential locations of electric vehicle supply equipment. J. Power Sources 2015, 299, 76–84. [Google Scholar] [CrossRef]
| Publisher’s Note: MDPI stays neutral with regard to jurisdictional claims in published maps and institutional affiliations. |
© 2021 by the authors. Licensee MDPI, Basel, Switzerland. This article is an open access article distributed under the terms and conditions of the Creative Commons Attribution (CC BY) license (https://creativecommons.org/licenses/by/4.0/).


 ,
, 


