1. Introduction
Lithium-ion batteries (LiB) have become one of the main energy storage solutions due to their high power and energy density and their long cycle life. These characteristics, along with the stable cycling performance, make them a suitable technology for both mobile and stationary applications [
1,
2].
As any other battery technology, LiBs suffer degradation. Due to this degradation, the cells lose their initial energy and power capability progressively [
3,
4]. Since the cost of batteries typically represents a significant part of the upfront costs on many applications, it is imperative to determine the remaining battery life to ensure system profitability [
5,
6]. For this purpose, degradation models are developed in order to predict the degradation that the battery will suffer depending on the conditions in which it is being used.
In the literature, several ageing models have been proposed using different approaches [
7]. One problem with these methods is that they need a large amount of data to be trained [
8]. This typically implies carrying out extensive experimental tests in the laboratory, which is time- and cost-intensive. Furthermore, every time a model must be developed for a new cell technology, such laboratory tests must be performed again from scratch [
9].
The main contribution of this article is to minimise both the time and money involved in carrying out all these tests. To this end, it is proposed to use a Transfer Learning (TL) technique based on Neural Networks (NN): the initial weights of a NN model are trained with the ageing data available for one cathode chemistry, to then be refined with a reduced number of data corresponding to any new cathode chemistry [
10]. This allows us to conserve and transfer the patterns learned for the first chemistry into the predictive models used for any new chemistry. Through this technique, the amount of laboratory experiments required to train an accurate calendar ageing NN model could be effectively reduced. In this paper, the TL method was illustrated using two different Li-ion battery ageing datasets, corresponding to LiNiMnCoO
2 (NMC) and LiFePO
4 (LFP) cells.
In Li-ion batteries the relationship between usage conditions and battery degradation is strongly non-linear [
11,
12]. To cope with this problem, a deep neural network was used, as this type of network is suitable to perform battery degradation modelling, since a sufficiently large network can fit any nonlinearities [
13].
Li-ion battery degradation is typically observed as a loss of capacity and an increase in resistance [
12]. This study is only focused on the loss of capacity, and similar approaches for internal resistance increase prediction will also be carried out in the near future. Furthermore, in the literature, degradation is divided between cycling and calendar degradation, and in this paper the latter will be discussed [
14,
15]. In terms of calendar degradation, the most influential factors are the state of charge (SOC) and the temperature at which the battery is located, as they have an influence on the growth of the SEI [
16]. The application of TL techniques for cycle life battery lifetime prediction is already being carried out by the authors and will be published elsewhere once more conclusive results are obtained.
The rest of this paper is organised in as follows.
Section 2 describes the experimental data used. In
Section 3 the main characteristics of the NN model developed and how transfer learning was used are introduced.
Section 4 describes the obtained results, and
Section 5 shows the main conclusions drawn from this work.
2. Dataset
Two databases corresponding to two different LIB technologies were used to implement the TL method. On the one hand, data obtained from LiNiMnCoO2 cells from the manufacturer Leclanché, where an extensive dataset was available, were used. On the other hand, data from LiFePO4 cells from the manufacturer A123 were used, where a smaller dataset was available.
2.1. NMC Cells Ageing Data
Table 1 shows the ageing test matrix corresponding to the NMC cells, which consists of 30 cells tested at 10 different conditions (distributed on three different temperatures and six different SOC). Those cells were tested in temperature-controlled climatic chambers. Periodical characterisation tests were carried out at 25 °C to evaluate the capacity fall.
The characterisation test started 30 min after the cell’s surface temperature reached 25 °C. Then, the test started with a constant-current/constant-voltage (CC/CV) charging procedure, where a constant current of C/3 was applied until 4.15 V was reached. Then, the CV phase was held until a C/20 current was reached. After 30 min of relaxation period, a constant discharge current at C/3 was performed until a terminal voltage of 3 V was measured. The procedure was repeated three times, and the capacity value of the last repetition was considered as the actual cell capacity.
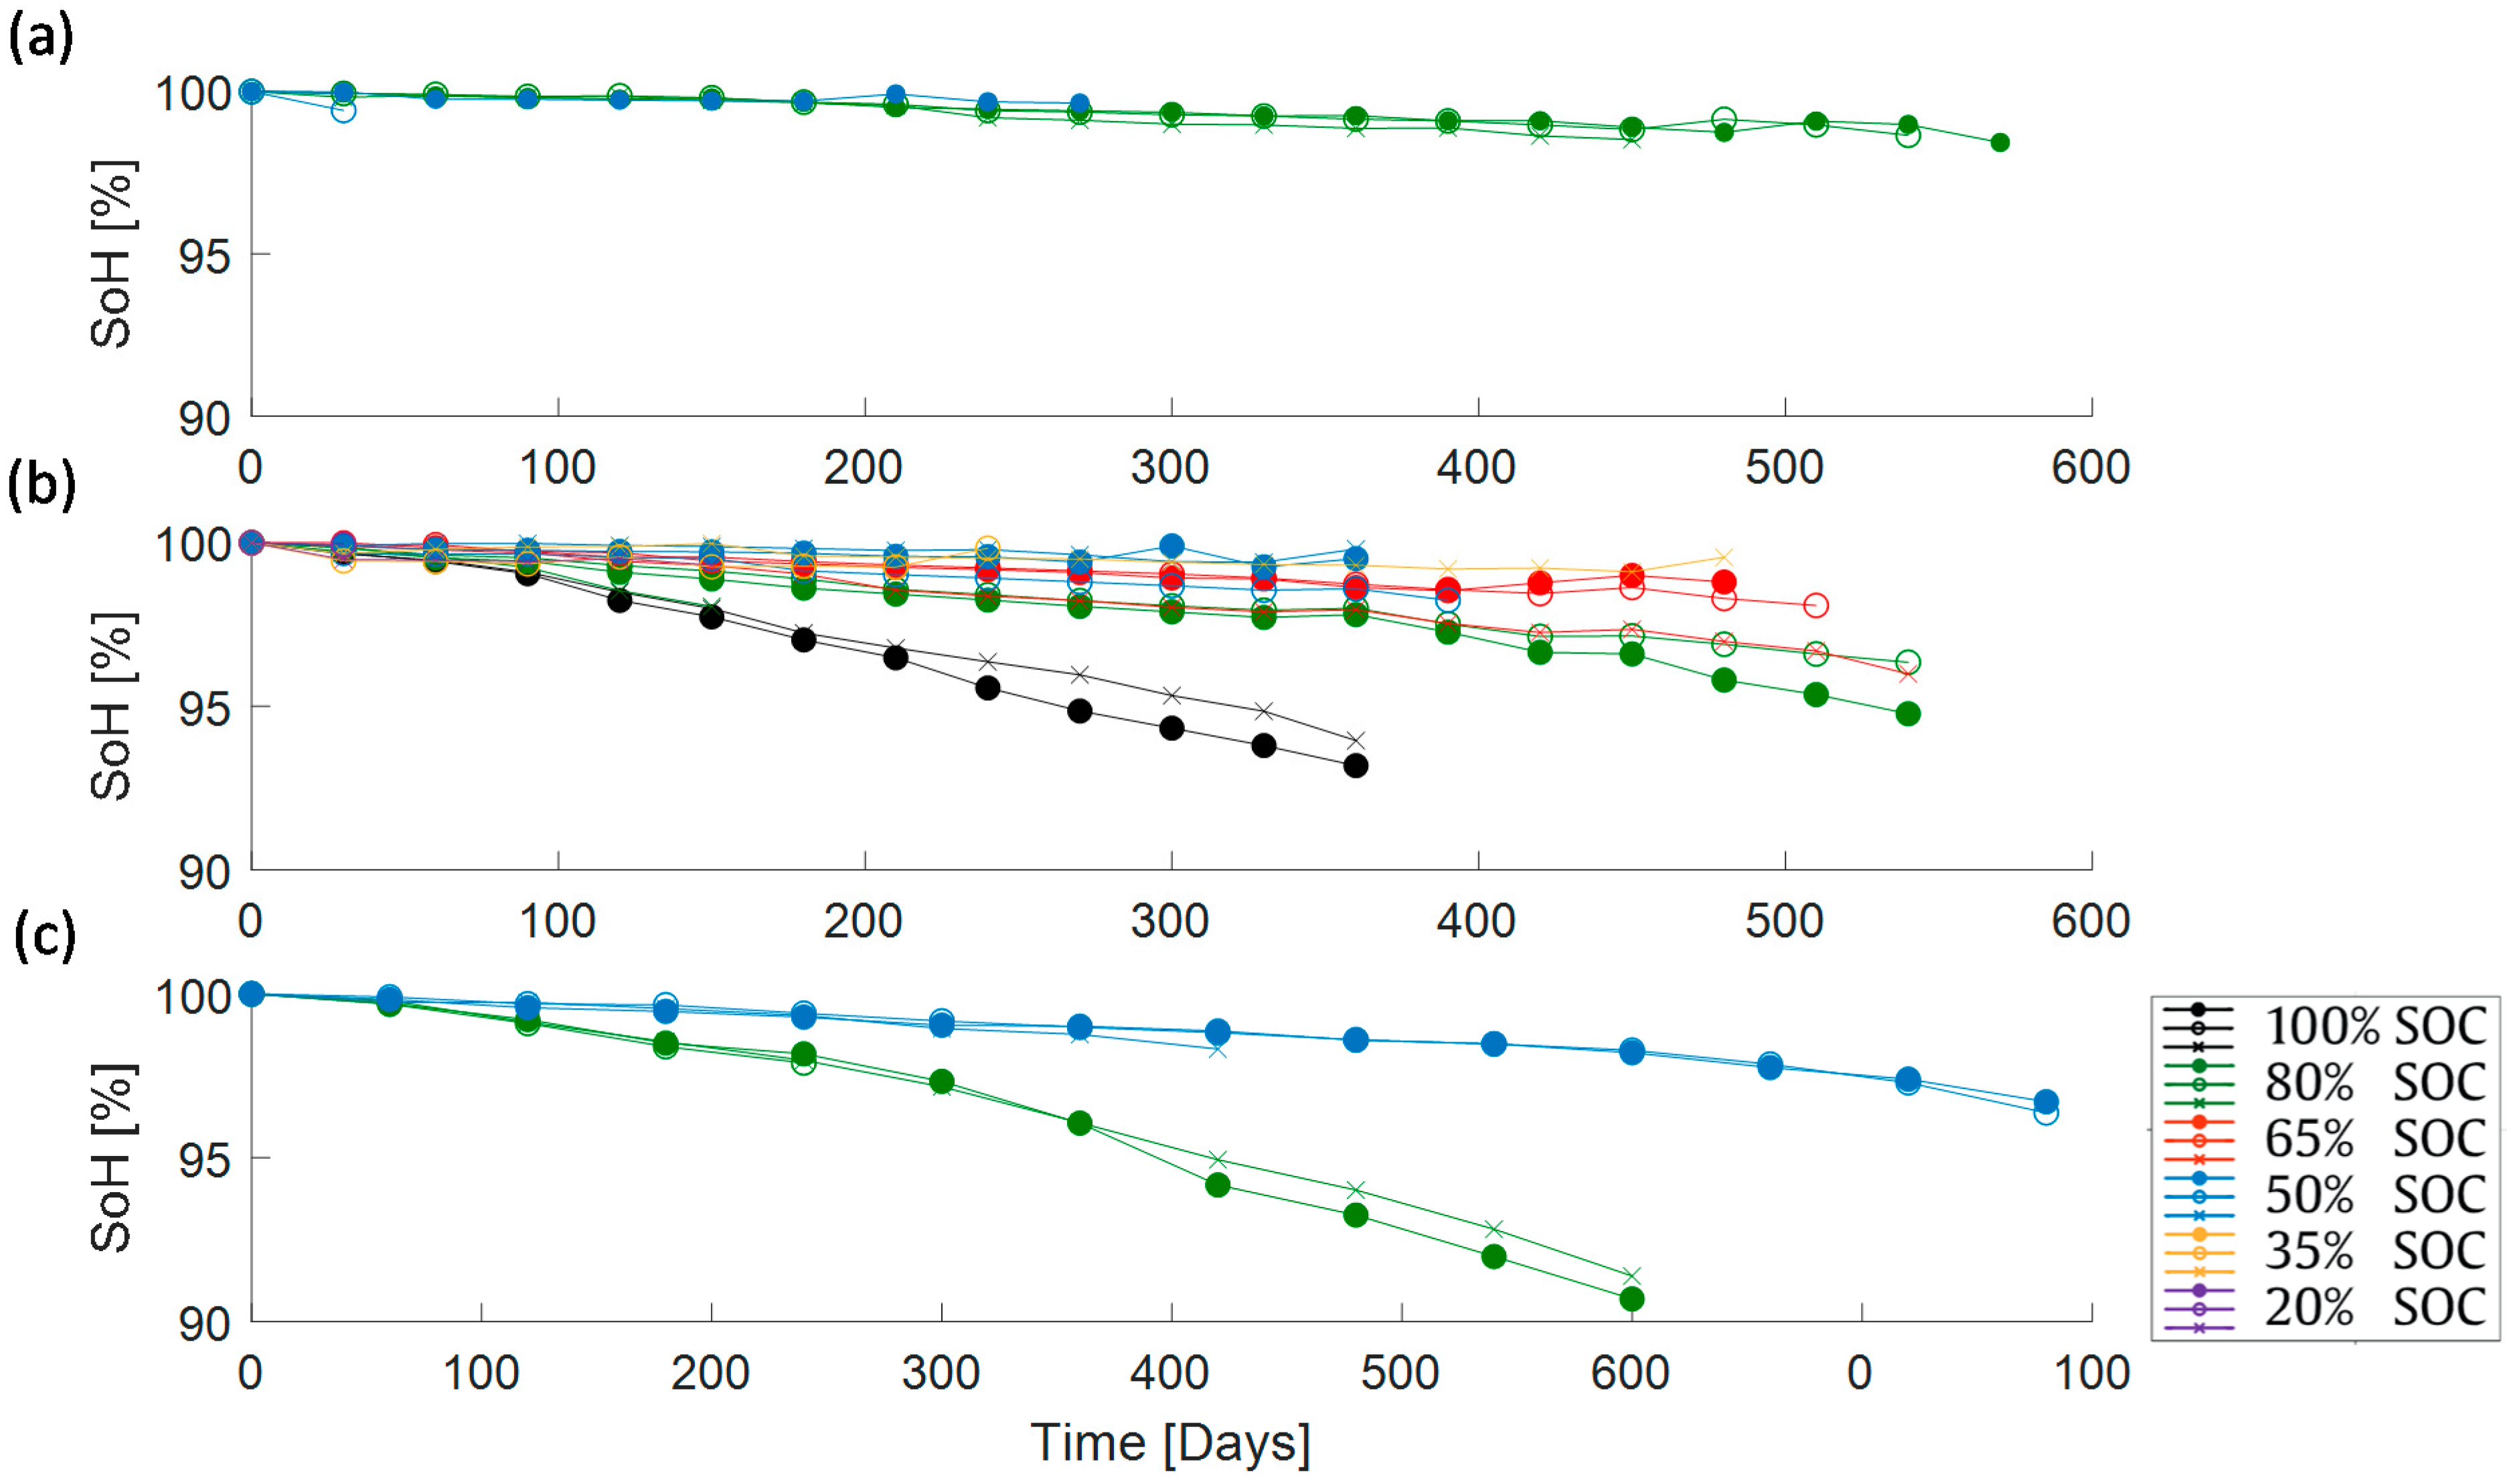
The capacity data obtained from these degradation tests were published in [
15]: the overall trends follow a first capacity gain, then a regular decrease and in some cases a sudden capacity drop at the end. As justified in [
15], the initial gain and the sudden capacity drop are disregarded for the particular modelling purposes targeted in this study, and, therefore, data were processed before training the models.
Figure 1 shows the processed capacity curves.
2.2. LFP Cell Ageing Data
As previously mentioned, the second dataset corresponds to the LFP cell technology.
Table 2 displays the ageing test matrix for those cells. In this case, data from seven different cells stored at seven different conditions were available (distributed between four different temperatures and four different SOC).
The colour of the cells in
Table 2 indicates whether the cells have been used for training or for validation, as further explained in
Section 4.2.
Cell characterisation tests were periodically carried out. The process for performing such tests was similar to NMC cell characterisation. Three charge–discharge cycles have been carried out, where the charge process has been a CC-CV and the discharge process at 1C between
Vmin and
Vmax, to assess both reversible and irreversible capacity losses and check the repeatability of the results [
17].
Figure 2 shows the degradation of the LFP cells. In this case, no capacity gain was observable in the beginning of life. The curves obtained show a squared-root-of-time shape, as widely reported in the literature [
18].
3. Modelling and Transfer Learning
3.1. NN Model for Calendar Ageing
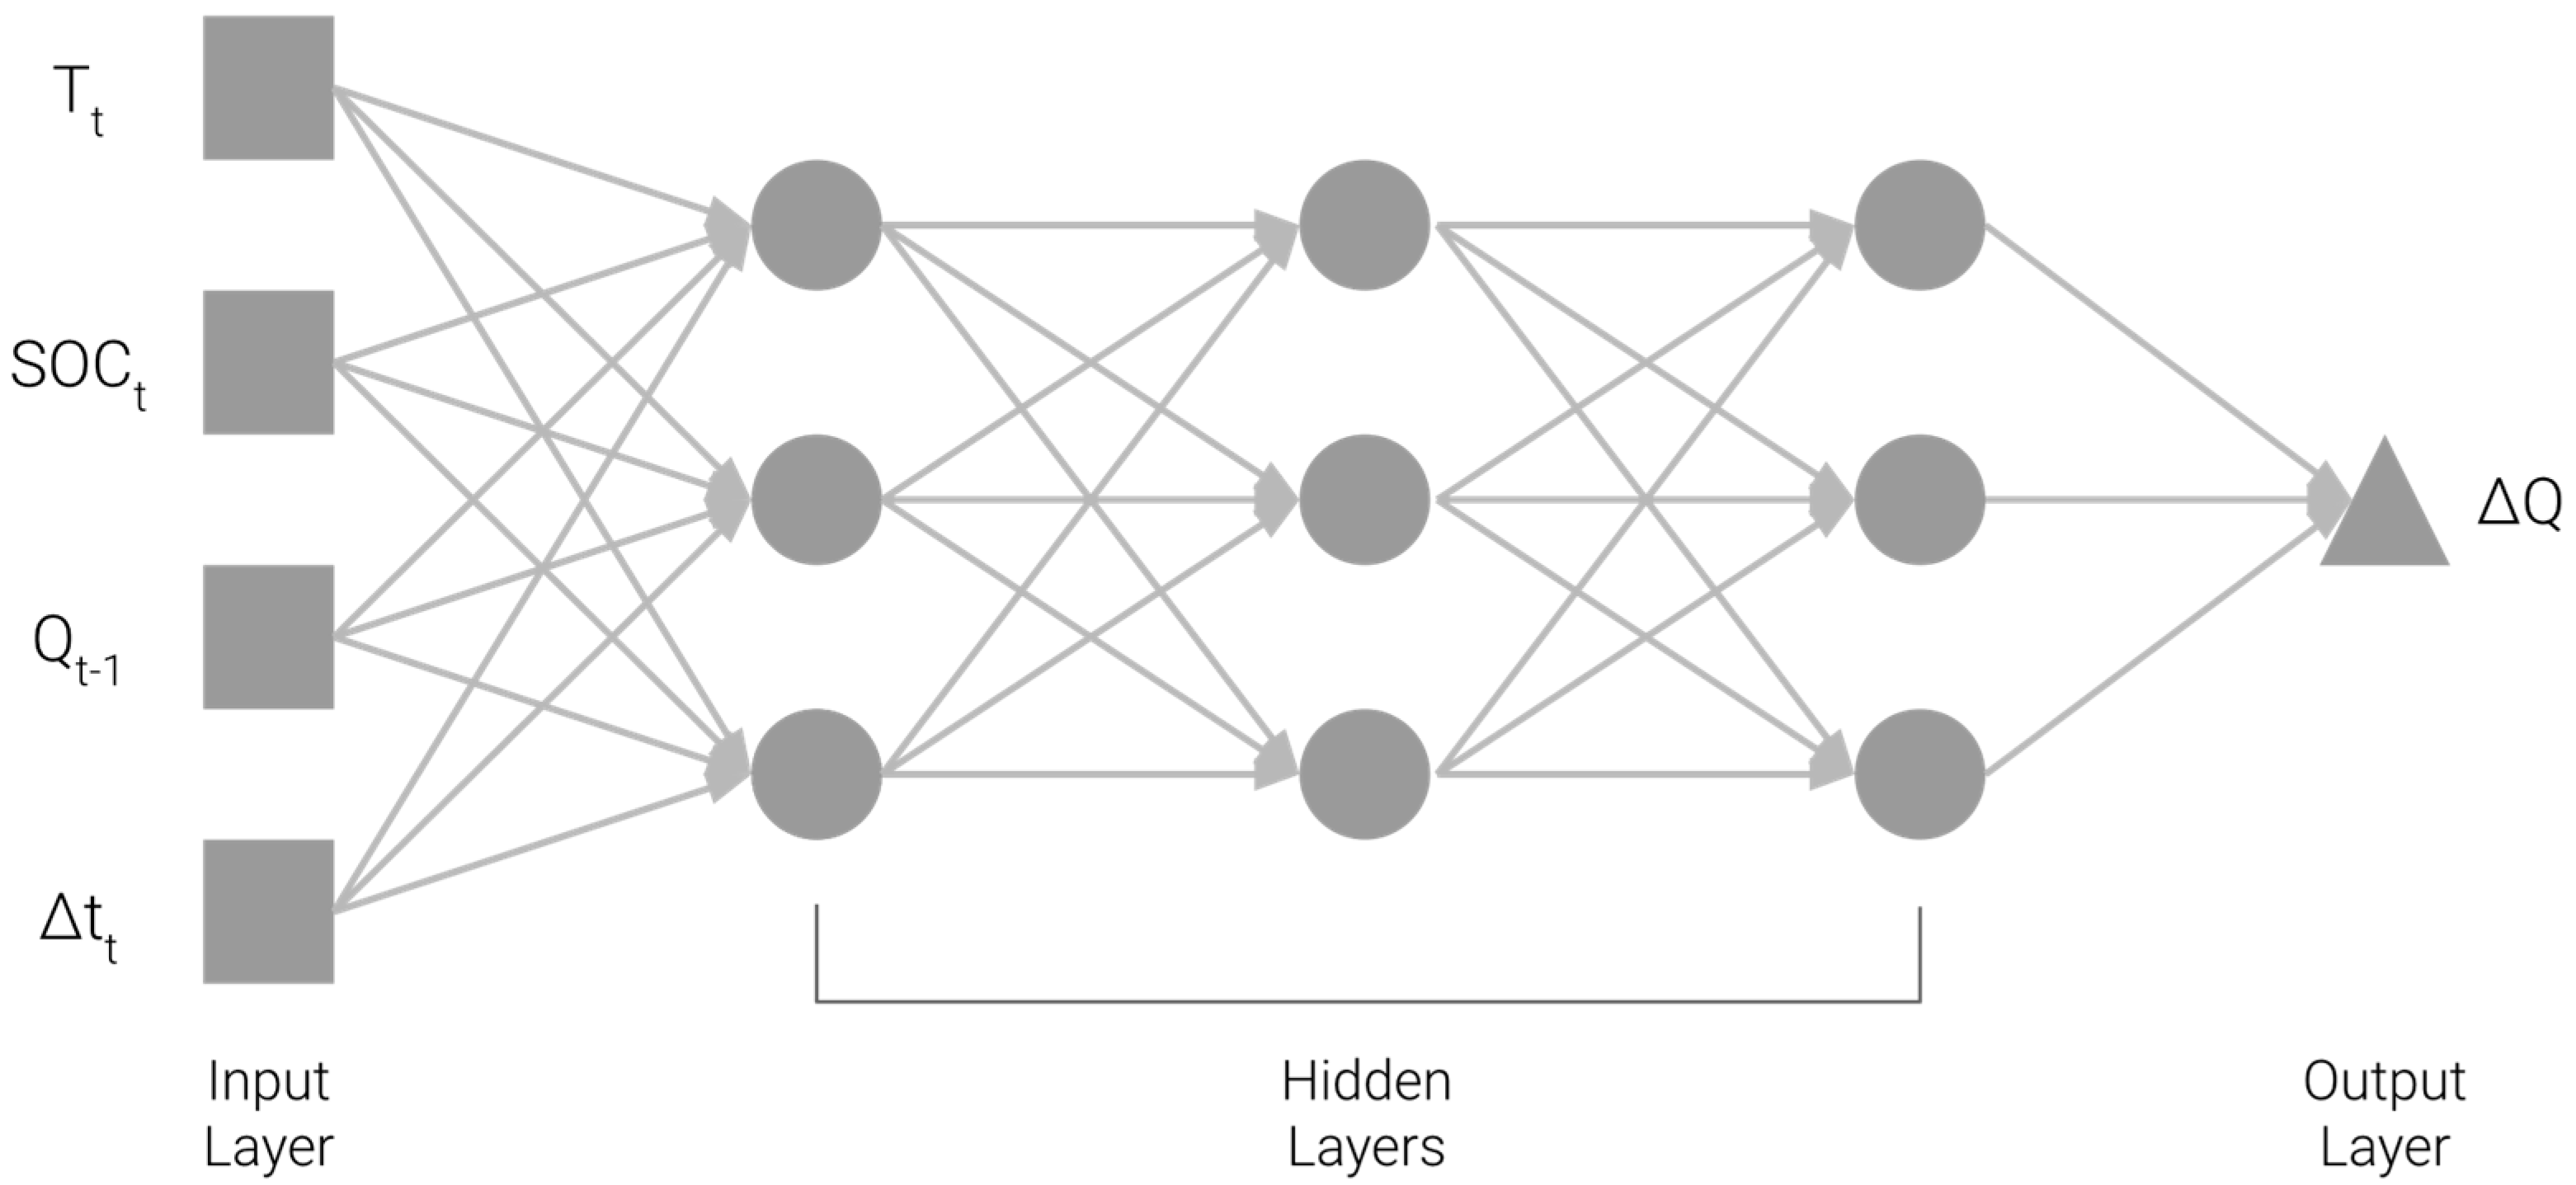
Figure 3 represents the designed feedforward NN calendar ageing model. The model involves three hidden layers with three neurons in each layer. It consists of four inputs, namely, ∆
tt, the timestep between two characterisation tests (in days);
Tt, the storage temperature (°C) during timestep ∆
tt;
SOCt, cell SOC (%) during timestep ∆
tt and
Qt−1, cell SOH (%) estimated in the previous timestep. The output is the lost capacity ∆
Qt.
The size of the neural network has been chosen with the aim of minimising the prediction error in both training and validation data. If a large network is selected, a high accuracy could be obtained in the training data. Nevertheless, the model could also overfit the training data, resulting in poor predictions for the validation data. On the other hand, if the network is too small, it will not be able to correctly learn the latent function. After trying several NN model structures, a 3 × 3 network was selected as a good trade-off to achieve at the same time a suitable fitting and generalisation capability.
3.2. Transfer Learning Method
This section describes the method used to implement transfer learning and illustrate its effectiveness. First, a baseline calendar ageing NN model was developed for NMC technology. Such model was trained only with NMC cells’ data (training data indicated in blue and validation data in purple in the
Table 1).
Then, such baseline NN model was used to apply TL and derive a calendar ageing model for LFP cells. Accordingly, the weights of the baseline NN model were subjected to a second training step, using only two cells from the LFP ageing data (training data indicated in blue in
Table 2). During this second training step, the internal weights of the initial NN are adapted to the new technology, while considering the input–output patterns learned from NMC/graphite technology in the first training.
For performance comparison purposes, two other NNs were trained using only the LFP cells’ data. The first NN was trained only with the cells marked in blue in
Table 2 (hereby called LFP2). The second NN was trained using the cells marked in blue and in black in
Table 2 (hereby called LFP5). The purpose of this training was to compare the performances of the TL-based LFP model with respect to more conventionally trained NN models using a limited amount of LFP data.
4. Results and Discussion
This section presents, successively, the prediction results achieved with: (1) the NN models trained with only NMC data, (2) LFP data (LFP2 and LFP5), and (3) applying the TL method
4.1. NMC Model
The NMC model was trained with the data represented in the first two subplot columns in
Figure 4 (blue dots in
Table 1). As can be seen, the NN fitted correctly the training data and achieved accurate results in the validation data (purple points in
Table 1), shown in the right column of
Figure 4.
The average prediction Mean Absolute Error (MAE) was 0.14% and 0.20% for the training and validation cells, respectively. The model performed accurately in both extrapolation and interpolation and correctly follows the experimental degradation trend.
4.2. LFP Model
As mentioned beforehand, two different LFP ageing models were also developed, using only LFP cells training data. The purpose of creating these LFP models was to have reference performance values to later evaluate the results obtained from the TL model.
The LFP2 model was trained with the data of two LFP cells (indicated in blue in
Table 2), and the LFP5 model was trained with the data obtained from five LFP cells (those indicated either in black or blue in
Table 2). The errors achieved from both models are indicated in
Table 3.
The LFP2 ageing model shows, as indicated in
Table 3, a low error in training cells but a high error in validation cells. This is because the two-cell data are insufficient for it to learn the relationships between input and output data. Moreover, they are not able to follow the degradation trend of the validation cells.
On the other hand, the error obtained with the LFP5 ageing model was 0.98% and 1.67% for the training and validation cells, respectively. Even though the error was higher than in the case of NMC cells, it can be seen, in
Figure 5 that the neural network was able to correctly follow the degradation in both the training and validation cells.
4.3. TL Model
Finally, the TL model was developed. As mentioned in
Section 3, this model took the NMC model as a baseline, and the neural network was retrained with 2 LFP data (data in blue in
Table 2) to obtain a LFP model. These two cells were selected because their storage conditions are complementary to those used to train the NMC model.
Figure 6 shows the MAE of the prediction achieved with the different models for each LFP cell. The red curve represents the error of the LFP2 model: it could be observed that the error is small for the training cells (i.e., CELL03 and CELL05), but significantly larger in the validation cells, with an average MAE (with the average MAE calculated as the mean value of all the MAE calculations performed for a single model for each of the cells considered) of 2.31%. The blue curve indicates the error of the LFP5 model: since the model has more cells to train, and therefore more conditions to learn form, the influence of calendar conditions on capacity loss was predicted accurately, and the average MAE of the model was reduced to 1.18%. Finally, the yellow curve depicts the performances of the model to which TL was applied. It can be observed that it achieves a similar performance to the LFP5, but still requiring a significantly reduced retraining with only two cells, and still improving the average MAE of the model to 1.01%.
As depicted in
Figure 6 and
Table 3, the model retrained by TL achieves more accurate predictions than the network trained with five LFP cells, on most storage conditions, and especially at the considered validation conditions. The results obtained suggest an enhanced generalisation capability of the TL model, while still reducing significantly the amount of LFP ageing data required. Subsequently, once a baseline calendar life model is available, the expected development costs of such TL-based model can be significantly reduced.
Figure 7 shows the degradation curves obtained in the laboratory and the prediction obtained by the TL model.
5. Conclusions and Future Works
In this paper, NN models were used to develop calendar ageing models for Li-ion batteries. Based on experimental ageing data available for NMC-cathode cells, an accurate prediction model was derived through transfer learning for LFP-cathode cells, using a reduced number of experimental data for this chemistry.
It was concluded that the implementation of TL methods for the development of LIB ageing models has significant benefits. In fact, it allows for the leveraging of the experimental labours carried out for NMC cells, for the development of LFP ageing models. This reduces the need for repeating exhaustive experiments for LFP cells, achieving a similar performance (even with an enhanced generalisation capability) to other ageing models involving a greater number of experimental conditions.
Nevertheless, it is noteworthy that the developed model only takes into account the degradation mechanisms in the storage operation. This model can be extended, and an algorithm capable of modelling cycling ageing can be developed. Moreover, the ageing data used for the training and validation of the models were obtained under static conditions. Therefore, such models should also be validated under dynamic and realistic operating conditions.
Finally, additional research could be necessary to identify the limits of the transfer learning methods, particularly among battery chemistries which could imply relatively different ageing mechanisms and different sensitivities to operating conditions. Further studies in this field are ongoing and will be disseminated on upcoming publications.
Author Contributions
Conceptualisation, M.A., M.L. and E.M.-L.; methodology, M.A. and M.L.; software, M.A.; validation, M.A. and M.L.; formal analysis, M.A.; investigation, M.A.; data curation, M.A.; writing—original draft preparation, M.A.; writing—review and editing, M.A., M.L., E.M.-L. and I.A., visualisation, M.A.; supervision, M.L., E.M.-L. and I.A.; project administration, I.A. and E.M.-L.; funding acquisition, I.A. and E.M.-L. All authors have read and agreed to the published version of the manuscript.
Funding
This research was partially funded by a CERVERA Research Program of CDTI, the Industrial and Technological Development Centre of Spain, through the Research Project HySGrid+ under Grant CER-20191019.
Data Availability Statement
The data used for NMC and LFP cells was respectively published in Lucu et al. [
15] and Sarasketa et al. [
17].
Acknowledgments
Authors would like to thank the FP7 European project Batteries2020 consortium (grant agreement No. 608936) for providing the valuable battery ageing data employed in this study.
Conflicts of Interest
The authors declare no conflict of interest.
References
- Liu, Y.; Zhang, R.; Wang, J.; Wang, Y. Current and future lithium-ion battery manufacturing. iScience 2021, 24, 102332. [Google Scholar] [CrossRef] [PubMed]
- Mathieu, R.; Baghdadi, I.; Briat, O.; Gyan, P.; Vinassa, J.-M. D-optimal design of experiments applied to lithium battery for ageing model calibration. Energy 2017, 141, 2108–2119. [Google Scholar] [CrossRef]
- Suri, G.; Onori, S. A control-oriented cycle-life model for hybrid electric vehicle lithium-ion batteries. Energy 2016, 96, 644–653. [Google Scholar] [CrossRef]
- Eddahech, A.; Briat, O.; Vinassa, J.-M. Performance comparison of four lithium–ion battery technologies under calendar aging. Energy 2015, 84, 542–550. [Google Scholar] [CrossRef]
- Elliott, M.; Swan, L.G.; Dubarry, M.; Baure, G. Degradation of electric vehicle lithium-ion batteries in electricity grid services. J. Energy Storage 2020, 32, 101873. [Google Scholar] [CrossRef]
- Kebede, A.A.; Coosemans, T.; Messagie, M.; Jemal, T.; Behabtu, H.A.; Van Mierlo, J.; Berecibar, M. Techno-economic analysis of lithium-ion and lead-acid batteries in stationary energy storage application. J. Energy Storage 2021, 40, 102748. [Google Scholar] [CrossRef]
- Tian, H.; Qin, P.; Li, K.; Zhao, Z. A review of the state of health for lithium-ion batteries: Research status and suggestions. J. Clean. Prod. 2020, 261, 120813. [Google Scholar] [CrossRef]
- Barré, A.; Deguilhem, B.; Grolleau, S.; Gérard, M.; Suard, F.; Riu, D. A review on lithium-ion battery ageing mechanisms and estimations for automotive applications. J. Power Sources 2013, 241, 680–689. [Google Scholar] [CrossRef] [Green Version]
- Tan, Y.; Zhao, G. Transfer Learning with Long Short-Term Memory Network for State-of-Health Prediction of Lithium-Ion Batteries. IEEE Trans. Ind. Electron. 2019, 67, 8723–8731. [Google Scholar] [CrossRef]
- Weiss, K.; Khoshgoftaar, T.M.; Wang, D. A survey of transfer learning. J. Big Data 2016, 3, 9. [Google Scholar] [CrossRef] [Green Version]
- Maheshwari, A.; Paterakis, N.G.; Santarelli, M.; Gibescu, M. Optimizing the operation of energy storage using a non-linear lithium-ion battery degradation model. Appl. Energy 2020, 261, 114360. [Google Scholar] [CrossRef]
- Stroe, D.-I.; Swierczynski, M.J.; Kar, S.K.; Teodorescu, R. Degradation Behavior of Lithium-Ion Batteries During Calendar Ageing—The Case of the Internal Resistance Increase. IEEE Trans. Ind. Appl. 2017, 54, 517–525. [Google Scholar] [CrossRef] [Green Version]
- Li, L.; Wang, L.G.; Teixeira, F.L.; Liu, C.; Nehorai, A.; Cui, T.J. DeepNIS: Deep Neural Network for Nonlinear Electromagnetic Inverse Scattering. IEEE Trans. Antennas Propag. 2019, 67, 1819–1825. [Google Scholar] [CrossRef] [Green Version]
- Lucu, M.; Martinez-Laserna, E.; Gandiaga, I.; Liu, K.; Camblong, H.; Widanage, W.; Marco, J. Data-driven nonparametric Li-ion battery ageing model aiming at learning from real operation data—Part B: Cycling operation. J. Energy Storage 2020, 30, 101410. [Google Scholar] [CrossRef]
- Lucu, M.; Martinez-Laserna, E.; Gandiaga, I.; Liu, K.; Camblong, H.; Widanage, W.; Marco, J. Data-driven nonparametric Li-ion battery ageing model aiming at learning from real operation data—Part A: Storage operation. J. Energy Storage 2020, 30, 101409. [Google Scholar] [CrossRef]
- Balagopal, B.; Huang, C.S.; Chow, M.-Y. Effect of calendar ageing on SEI growth and its impact on electrical circuit model parameters in Lithium ion batteries. In Proceedings of the 2018 IEEE International Conference on Industrial Electronics for Sustainable Energy Systems (IESES), Hamilton, New Zealand, 31 January–2 February 2018; pp. 32–37. [Google Scholar] [CrossRef]
- Sarasketa-Zabala, E.; Gandiaga, I.; Rodriguez-Martinez, L.; Villarreal, I. Calendar ageing analysis of a LiFePO4/graphite cell with dynamic model validations: Towards realistic lifetime predictions. J. Power Sources 2014, 272, 45–57. [Google Scholar] [CrossRef]
- Grolleau, S.; Delaille, A.; Gualous, H.; Gyan, P.; Revel, R.; Bernard, J.; Redondo-Iglesias, E.; Peter, J. Calendar aging of commercial graphite/LiFePO4 cell—Predicting capacity fade under time dependent storage conditions. J. Power Sources 2014, 255, 450–458. [Google Scholar] [CrossRef]
| Publisher’s Note: MDPI stays neutral with regard to jurisdictional claims in published maps and institutional affiliations. |
© 2021 by the authors. Licensee MDPI, Basel, Switzerland. This article is an open access article distributed under the terms and conditions of the Creative Commons Attribution (CC BY) license (https://creativecommons.org/licenses/by/4.0/).


