Article

Lattice Boltzmann Method Study on Liquid Water Dynamic inside Gas Diffusion Layer with Porosity Distribution

School of Automotive Studies, Tongji University, Cao’an Road, No. 4800, Shanghai 201804, China
*
Author to whom correspondence should be addressed.
World Electr. Veh. J. 2021, 12(3), 133; https://doi.org/10.3390/wevj12030133
Submission received: 23 July 2021 / Revised: 20 August 2021 / Accepted: 23 August 2021 / Published: 25 August 2021

Abstract

:
The gas diffusion layer (GDL) plays an important role in the mass transfer process during proton exchange membrane fuel cell (PEMFC) operation. However, the GDL porosity distribution, which has often been ignored in the previous works, influences the mass transfer significantly. In this paper, a 2D lattice Boltzmann method model is employed to simulate the liquid water transport process in the real GDL (considered porosity distribution) and the ideal GDL (ignore porous distribution), respectively. It was found that the liquid water transport in the real GDL will be significantly affected by the local low porosity area. In the real GDL, a liquid water saturation threshold can be noticed when the contact angle is about 118°. The GDL porosity distribution shows a stronger influence on liquid dynamic than hydrophobicity, which needs to be considered in future GDL modelling and design.

1. Introduction

The GDL in the proton exchange membrane fuel cell (PEMFC) is generally composed of carbon fiber substrate and micro-porous layer (MPL). The GDL mainly ensures two mass transfer processes: (i) the reactants penetrate the GDL and then reach the three-phase boundary (TPB), which is a diffusion process driven by the concentration gradient, and (ii) the water removal from the catalyst layer (CL) to the flow channel, which is known as one of the critical issues called “water management,” restricts the commercial development of PEMFC [1]. Under the conditions of high current density and high relative humidity (RH), the TPB produces excessive liquid water, which invades the pores of the GDL and decreases the porosity of the GDL [2]. Assuming the liquid water cannot be removed effectively, the flooding process happens [3,4]. Then, the mass transfer polarization will seriously affect the fuel cell’s output performance due to water accumulation in the CL, GDL and gas channel (GC).
The LBM (lattice Boltzmann method) was developed from the lattice gas method (LGA) in the 1990s. Unlike the traditional CFD method, the LBM has recently gained much attention as a powerful tool to simulate complex physical problems due to its advantages of capacity for investigating complicated geometries, simple implementation, high computation efficiency and easy implementation of parallel-processing [5].
In the past few years, there has been an increasing number of the 2D LBM (lattice Boltzmann method) studies on the mechanism of water transport in the GDL under the flow channel. Even though a 3D method can gain some valuable information, such as liquid water dynamic in the complex carbon fiber or permeability properties of a GDL [6,7,8,9], the huge computational cost restricts its application. Compared with 3D LBM modeling, a 2D method can enlarge the computational domain without sacrificing geometric resolution. This advantage ensures that more details can be considered inside a PEMFC, such as the effects on rib compression, the hydrophobicity of channel and liquid water dynamic near the GDL–BPP interface [10,11,12,13]. Jeon [10] found that the water saturation of the GDL under channel is higher than that under rib. Kim et al. [11] found that the presence of MPL can significantly reduce water saturation in the GDL. E. Shakerinejad et al. [12] accelerated the liquid water transfer in the GDL by inserting a hydrophilic layer into GDL. Yu et al. [7] developed a 3D LBM model to simulate the effects on liquid water flowing through the GDL with inhomogeneous Polytetrafluoroethylene (PTFE) distribution. However, non-uniform porosity distribution in the GDL has been found in recent years [14,15,16]. Compared with the real GDL (with porosity distribution), these ideal GDL (without porosity distribution) 2D models ignore the non-uniform porosity distribution, which has an impact on the accuracy of the model.
The accuracy of the LBM employed in the mass transport process is based on its scale-bridging nature [17] and can be ensured by many previous works [2,13]. Jeon et al. [13] compared the LBM results and the experiment results in their work. The liquid drop formation at the GDL-channel interface after liquid water breakthrough shows the same status as the experiments. Deng et al. [2] performed a LBM work to simulate the liquid water saturation inside the GDL and the LBM results show the same trend as Flückiger et al.’s [18] work. Overall, after a rigorous dimensionless process and assumption, the accuracy of the LBM can be guaranteed [2,7,10,17,19].
In this paper, the LBM is used to study the liquid water dynamics in the GDL. The geometric models of the ideal GDL with uniform pore distribution and the real GDL with non-uniform pore distribution are designed respectively. The influence of porosity distribution along the thickness direction of the GDL on the water saturation of the GDL is considered. The overall results of this study enhance the understanding of the mechanism of water transfer in the GDL and provide a reference for the design of the GDL.

2. Materials and Methods

2.1. Computational Domain and Boundary Conditions

The real GDL model with non-uniform thickness in the thickness direction is designed according to SGL sigreact 25AA. The ideal GDL is designed to have a uniform distribution of porosity in the thickness direction. The computational domain is generated by a random distribution algorithm. The porosity distribution [1] along the thickness direction before and after being compressed is shown in Figure 1.
The boundary conditions of the model are shown in Figure 2. The grid resolution is 1 μm. The GDL and flow channel is reconstructed as a rectangular computational domain with 2400 μm (length) × 250 μm (width). The thickness of GDL under channel and rib are 190 μm and 150 μm, respectively. The rib is set in the middle of the computational domain with a width of 1200LU. Velocity inlet is applied to the bottom wall with the Zou–He method. The outflow boundary is applied to the top wall for calculation stability. The periodic boundary is applied to the left and right walls.

2.2. Multiphase LBM Model

The LBM “Shan-Chen” pseudo-potential two-phase flow model is used to study the displacement of water in the GDL [20]. The core conception of this method considers the interaction forces between mesoscopic molecular groups. If reasonable factors are set, different interaction forces between phase 1 and phase 2, such as liquid and gas, liquid and solid surface, and gas and solid surface, will finally impel the phase separation after finite iteration. More details of this model can be found in our previous works [5,21].
The bubble test and Laplace test of this model have been verified. The interaction strength between two phases is set as GAB = 0.2, GAwall = −GBwall = 0.075 to simulate a highly hydrophobic (140° contact angle) GDL structure in the Section 3.1 and Section 3.2. The interaction strength between two phases is set as, GAB = 0.2, GAwall = −GBwall = 0.01, 0.05 and 0.075 to simulate different hydrophobic (97°, 118° and 140° contact angle) GDL structure in Section 3.3. The homemade C++ program used in this study is parallelized based on OpenMP. Each case is calculated on a 64-core Xeon processor for 20 h.

3. Results and Discussions

3.1. Effect on Water Dynamic

In this section, the GDL carbon fiber is assumed highly hydrophobic, the water contact angle of which is 140°. Figure 3a,b shows the water displacement process of real GDL and ideal GDL, respectively. Before 100,000 lattice steps, the liquid water distribution in the ideal GDL and the real GDL is very close. This is because there is a buffer zone in each computational domain, the height of which is about 10 lattice units (lu). At 500,000 lattice steps, the buffer zone is filled and liquid water in the ideal GDL successfully forms some pathways to the GDL upper surface, while in the real GDL, many “pools” appear in pores and no pathway is formed. Similar phenomena can also be observed in this time step; due to the higher porosity, GDL saturation under the channel is higher than that under the rib.
As shown in Figure 3a, water breakthrough happens at 725,000 lattice steps in the ideal GDL; two liquid bubbles are formed at the upper surface of the GDL. Liquid bubbles grow gradually, but the liquid water pathway shows no significant difference until 1,500,000 lattice steps. Water distribution under the rib shows no significant change during the water breakthrough process in the ideal GDL; this phenomenon is also shown in Kim et al.’s work [11]. As shown in Figure 3b, the GDL is highly saturated at 1,500,000 lattice steps. This is a result of high porosity at the upper and bottom surface in the real GDL, which can be found in Figure 1. It was found that the water breakthrough time in real GDL is at 1,725,000 LU steps, while in ideal GDL, water breakthrough occurs at 725,000 LU steps. This shows that the ideal GDL has good drainage capacity and can discharge the water produced by CL more quickly. Liquid water saturation in the real GDL is higher than that in the ideal GDL, not only under the channel, but also under the rib.

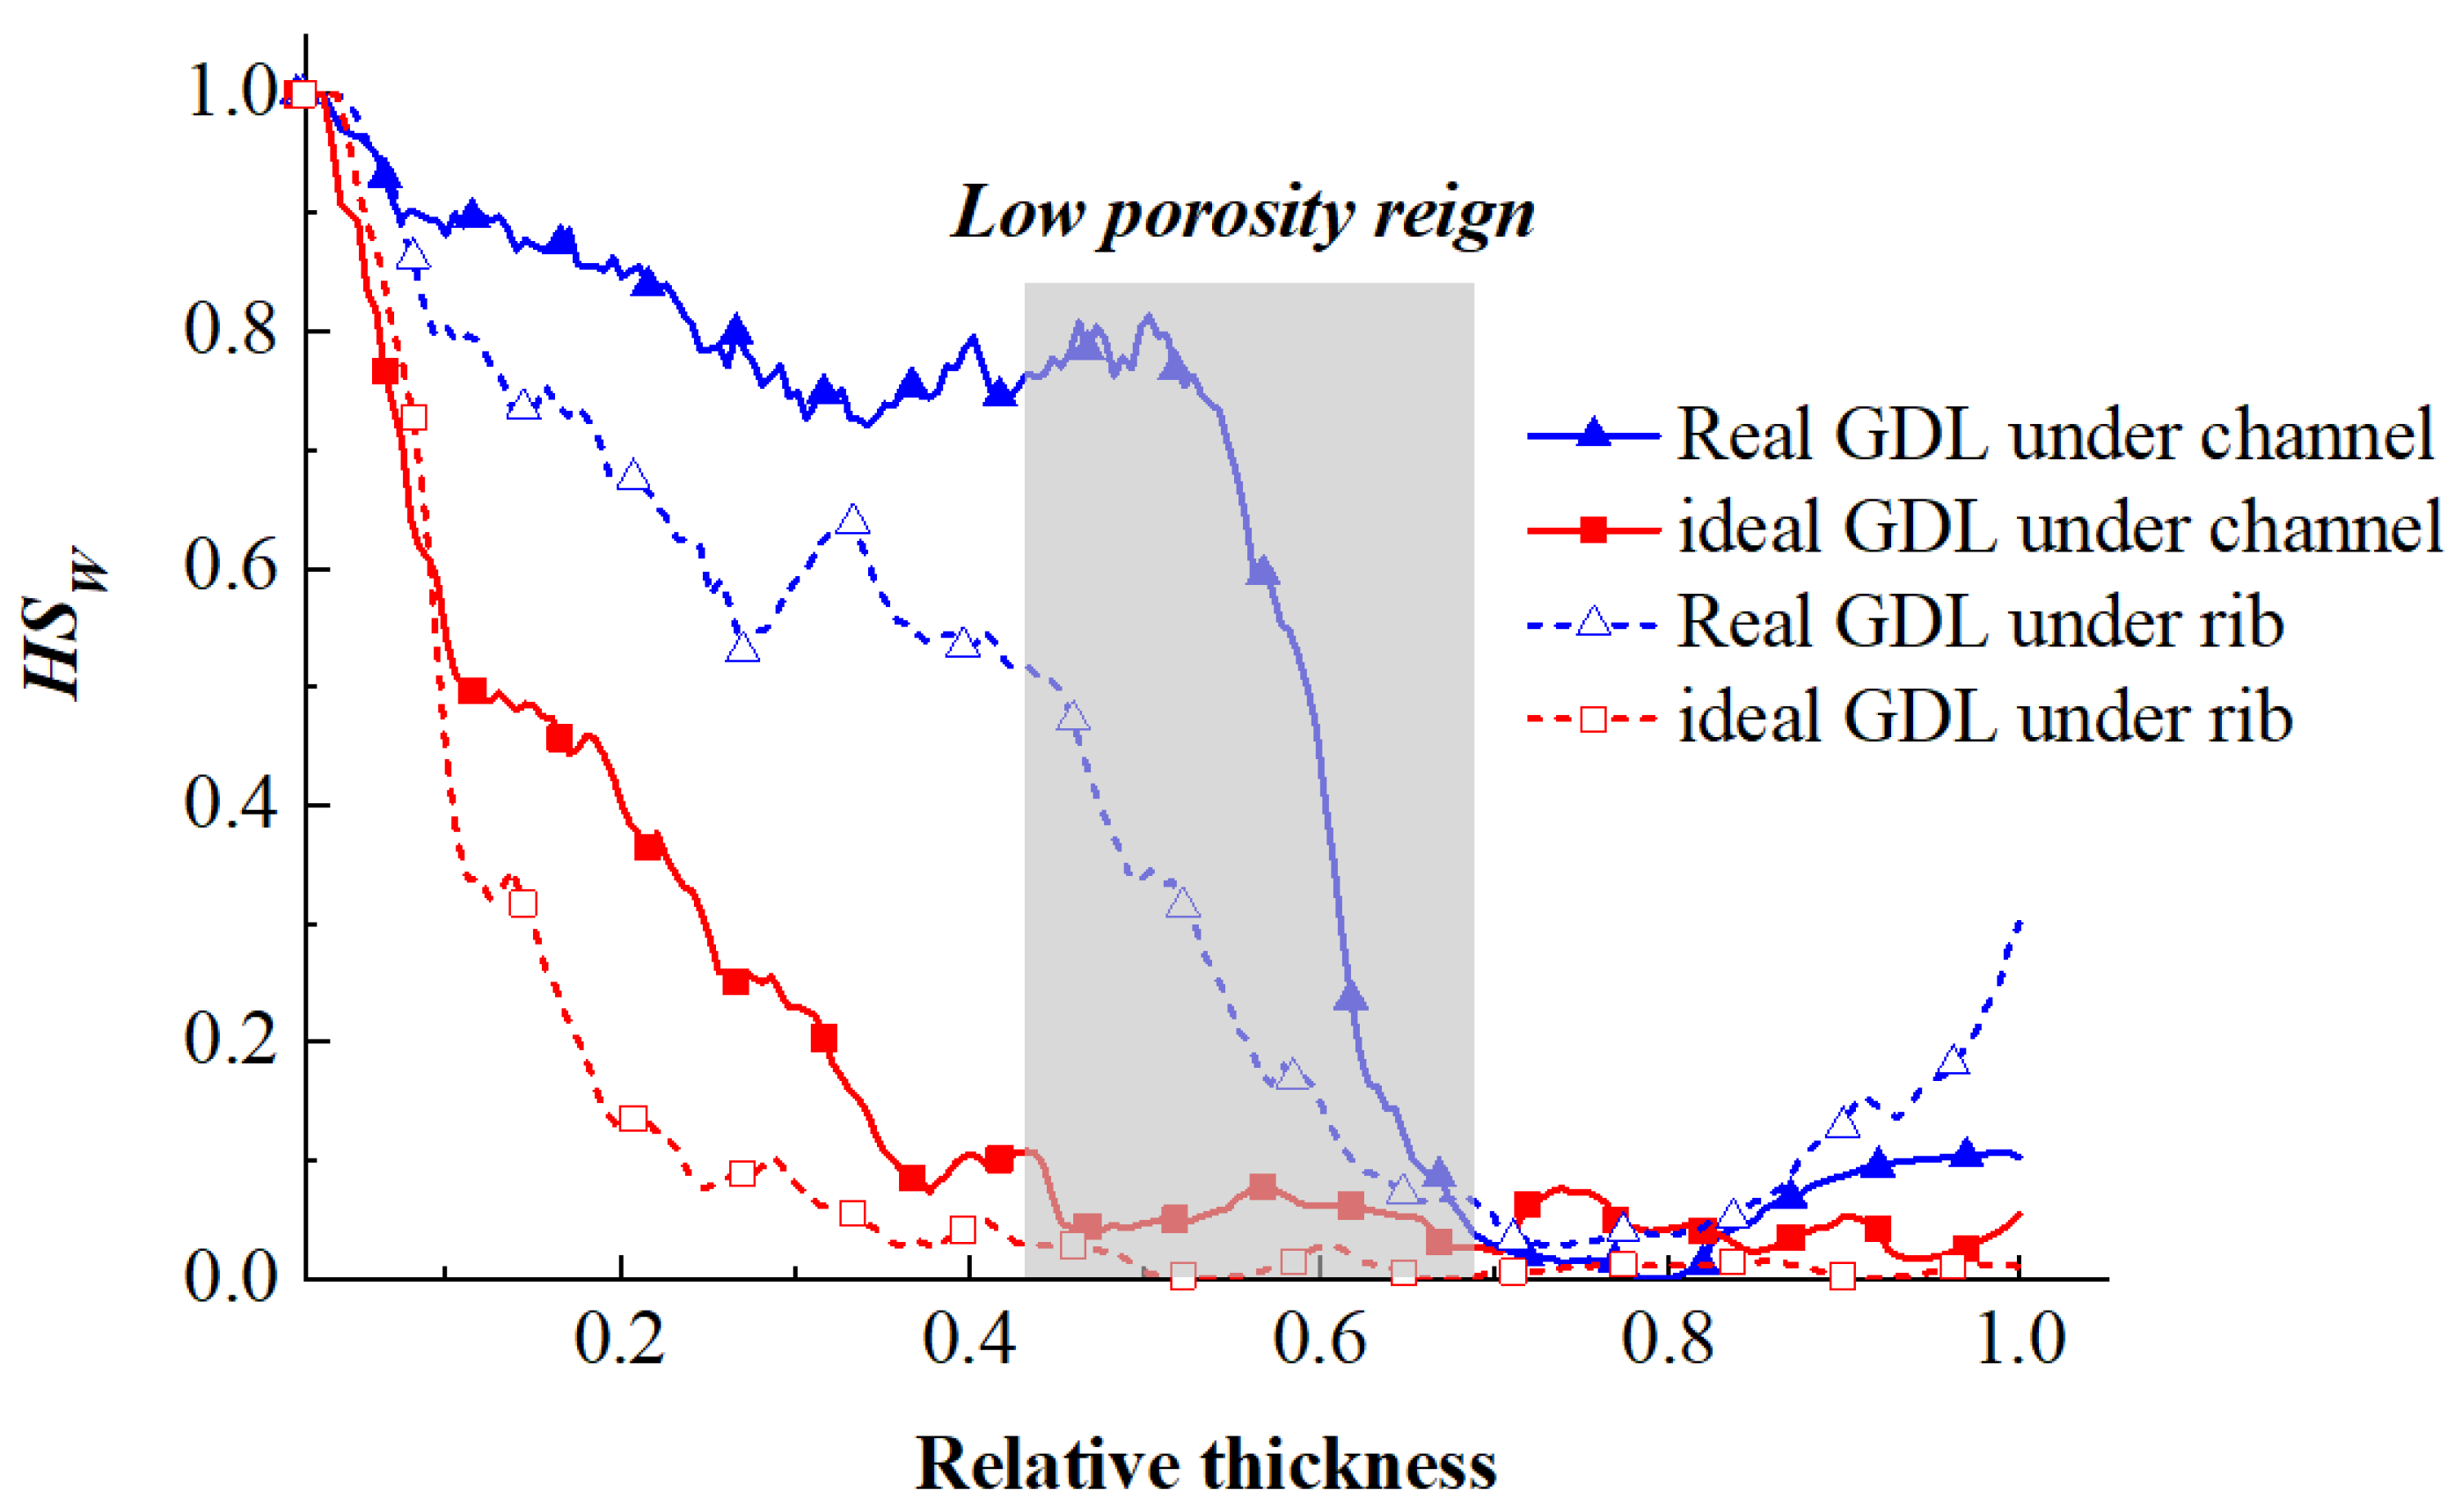
3.2. Effect on Water Saturation

Figure 4 shows the horizontal liquid water saturation (HSw) distribution of the two GDLs along the thickness direction. In this work, HSw is a parameter used to describe the degree of water saturation in the horizontal direction, which is defined as the ratio of liquid water area to pore area. Vertical water saturation (VSw) is different to the HSw, which is defined as the ratio of liquid water area to pore area in the vertical direction (the horizontal direction and vertical direction is shown in Figure 3). As shown in Figure 4, the HSw of the GDL under the channel (solid line) is higher than the rib (dash line). Both the real GDL model and ideal model show the above distribution characteristic. This is as a result of compression of rib. HSw decreases rapidly in the ideal GDL at a relative thickness of 0~0.4 and HSw is stable around 0.05 at relative thickness is 0.4~1.0. However, in the real GDL, the HSw decreases slowly at a relative thickness of 0~0.4 and decreases rapidly at a relative thickness of 0.4~0.7. These phenomena indicate that the local low porosity reign plays an important role in HSw distribution. Although the porosity of each part, namely, under the channel and under the rib, is the same, the ideal GDL HSw is lower than the real GDL. This is due to the influence of the average pore size. Compared with the real GDL, the pore radius distribution of the ideal GDL is more uniform, which results in a smaller average pore size.
As shown in Figure 5, VSw is higher in real GDL than in the ideal GDL, not only under the channel, but also under the rib. VSw under channel is higher under the channel, which is same as Figure 4. VSw under the rib shows higher consistency than the channel in the ideal GDL, but in the real GDL, the zigzag line is very random.

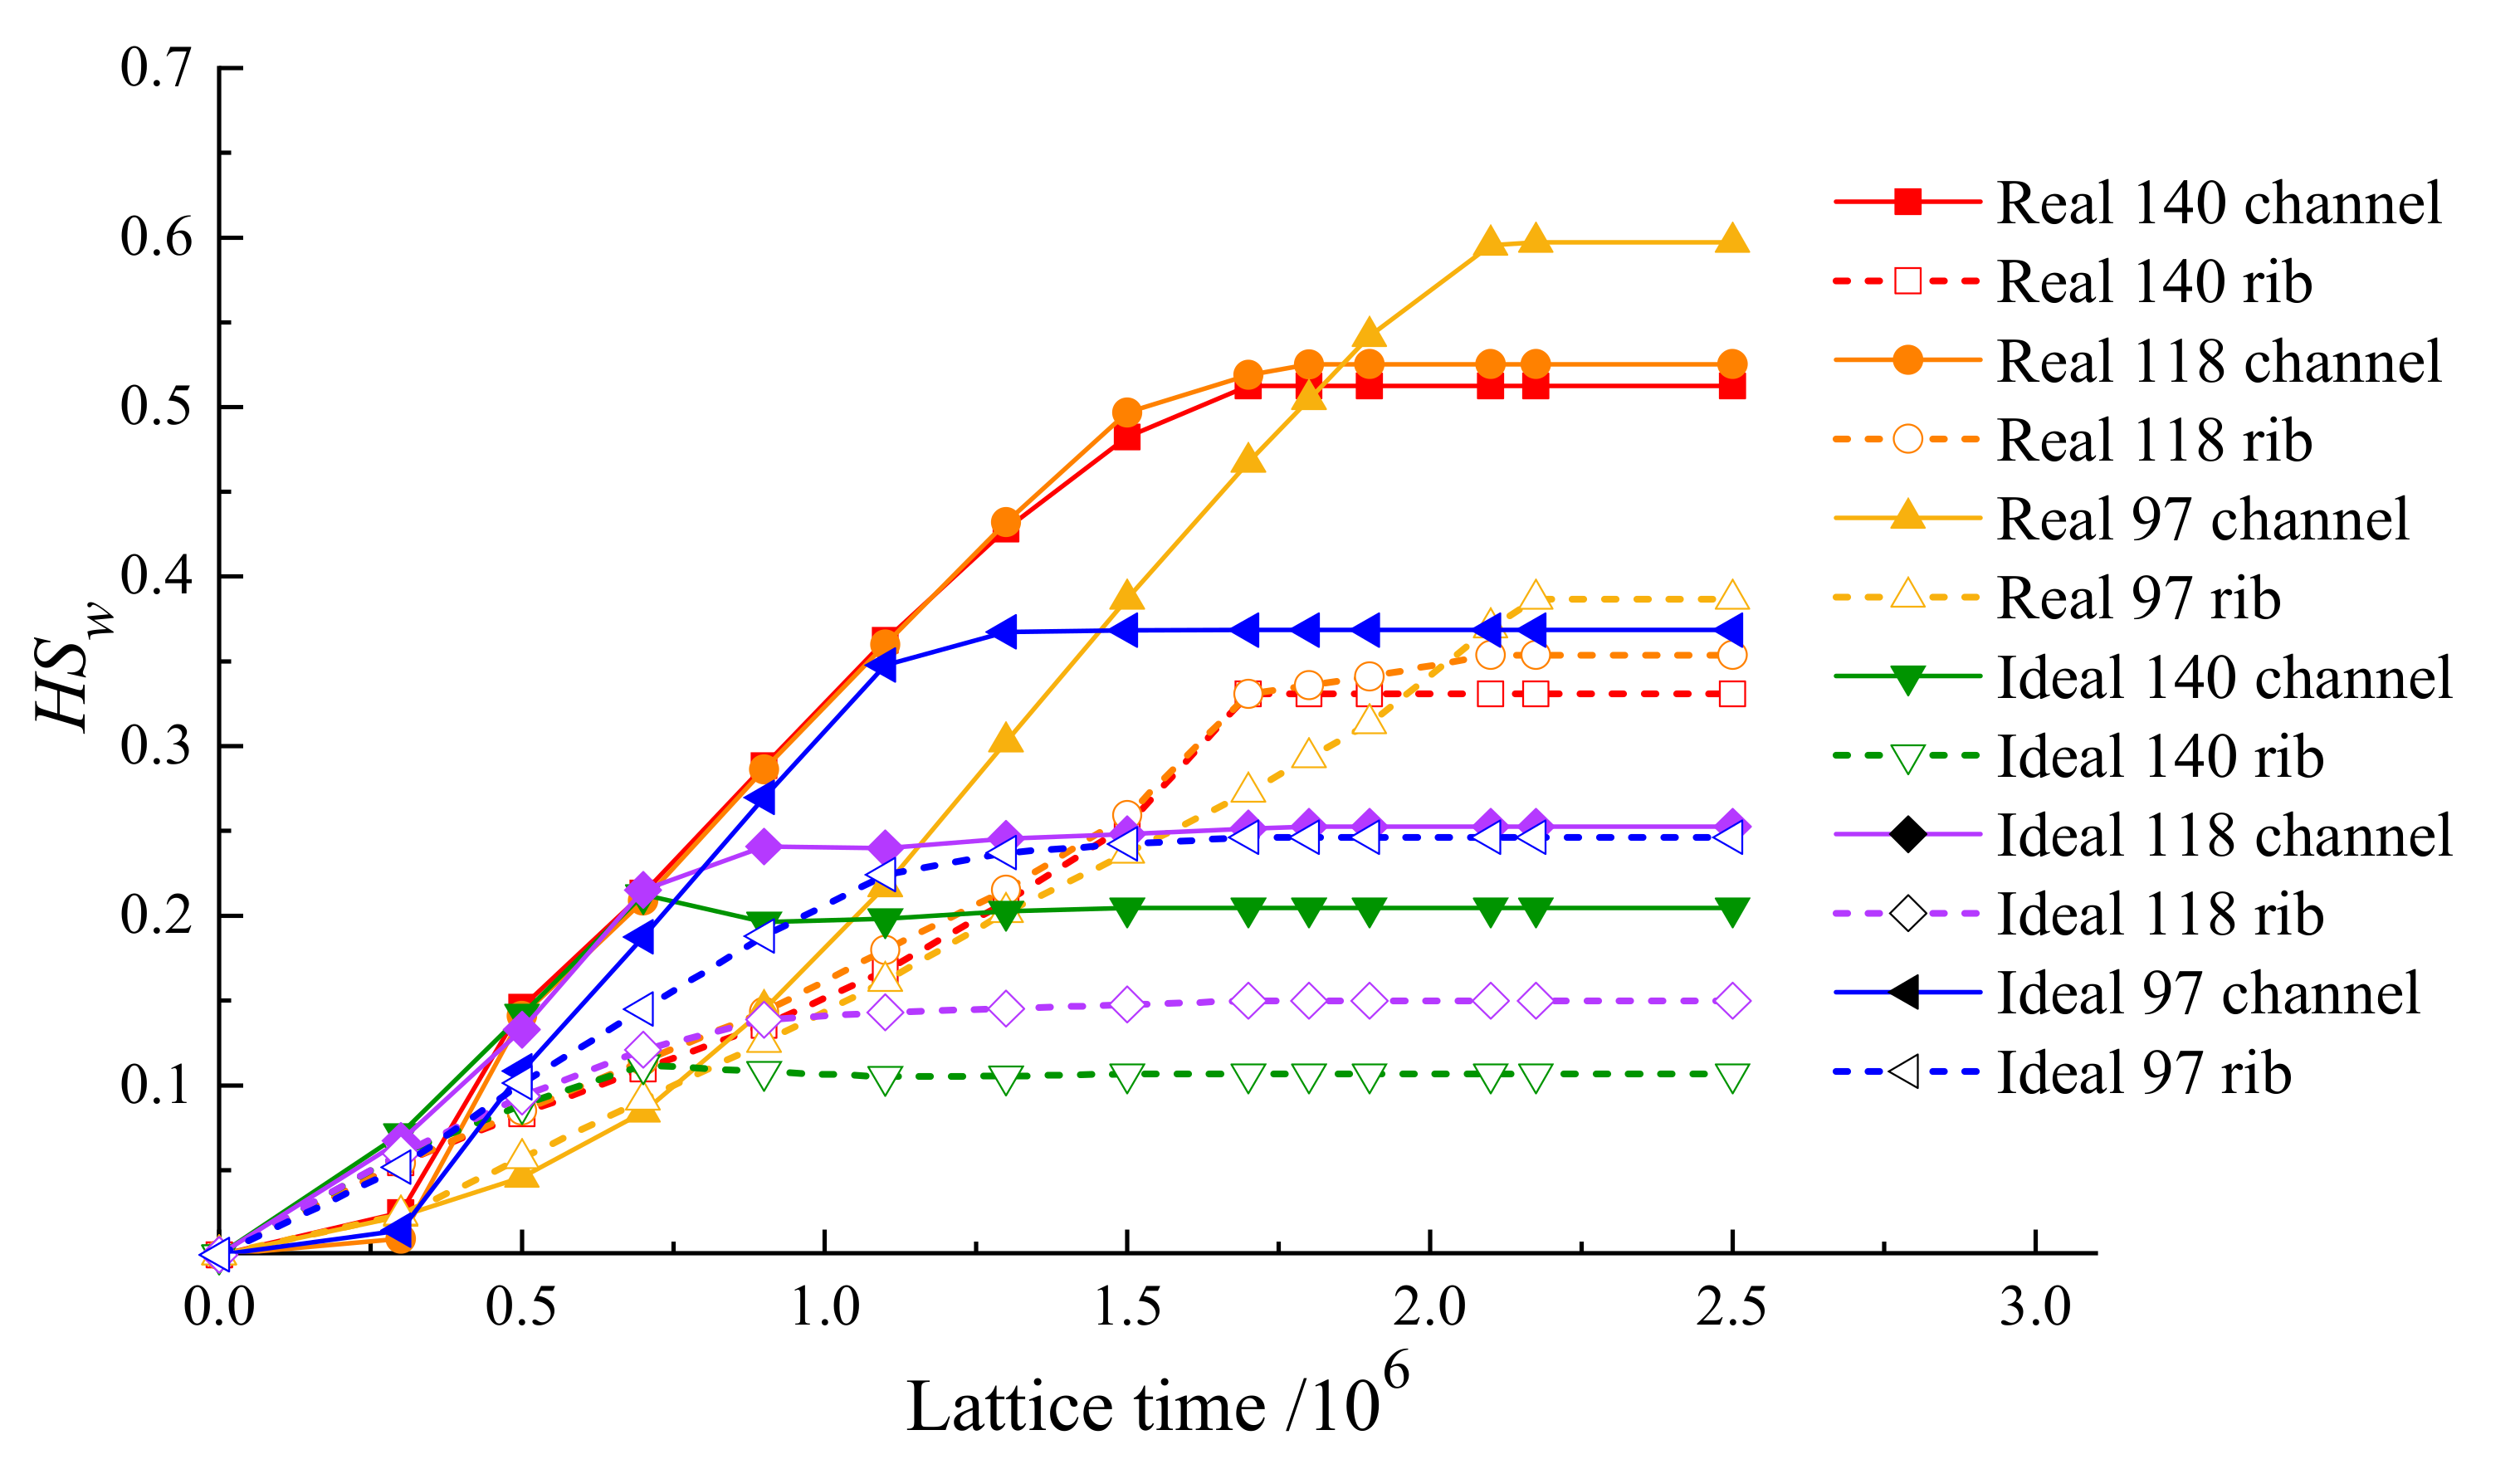
3.3. Effect of GDL Hydrophobicity on HSw

In this section, Figure 6, the effect of GDL hydrophobicity on HSw is discussed. At the beginning of liquid injection, i.e., lattice time = 0, all samples HSw are initialized to 0. The HSw increases in a relatively low slope when the lattice time is less than 0.5 × 10⁶. Due to the higher porosity at the real GDL bottom surface, the slope of real GDL is lower than that in the ideal GDL when the lattice time is less than 0.5 × 10⁶. With the extension of liquid water injection time, HSw increases in a similar slope because of the same liquid inlet velocity. After water breakthrough, the HSw keeps a stable equilibrium value, which means the GDL saturation condition will not change as the lattice time goes by.
The HSw under channel and rib shows a significant difference in the liquid water saturation process. The HSw under channel (solid line) always shows a higher value than that under the rib (dash line), whether in a real GDL or an ideal GDL. The time consumption to reach HSw equilibrium is slightly different between channel and rib, for which GDL under the rib need a little bit longer time than that under the channel.
GDL with lower hydrophobicity shows higher HSw after water breakthrough. In the ideal GDL, this phenomenon is apparent, where the HSw under channel are 0.2046, 0.2526 and 0.3685 when contact angles are 140°, 118° and 97°, respectively. However, in the real GDL, this phenomenon can be found only in low hydrophobicity (contact angle 97°). A contact angle threshold is shown in the real GDL; hydrophobicity higher than 118° shows no significant difference in water saturation. This indicates that contact angle and pore distribution are two important factors that influence the water distribution simultaneously. To obtain a better water management ability, a local low porous reign shows higher influence than hydrophobicity.

4. Conclusions

A 2D two-phase flow LBM model is designed. The characteristics of liquid water transport are studied using LBM. Porosity distribution, channel and rib, water breakthrough time and contact angle are the parameters considered in the modeling process.
The main results are shown as follows:
  • Porosity distribution influences the water transfer significantly, which has often been ignored in previous works. The area with the lowest porosity in the thickness direction in the real GDL will prevent the water penetration. Even at the same porosity, a small pore radius will reduce GDL water saturation, but narrow pores will also increase gas mass transfer resistance.
  • High hydrophobicity is important in water management ability. However, a contact angle threshold is shown in the real GDL; a hydrophobicity higher than 118° shows no significant difference in water saturation.

Author Contributions

Conceptualization, A.D. and S.X.; methodology, software, validation, formal analysis, writing—original draft preparation, writing—review and editing, M.Y.; supervision, J.L. All authors have read and agreed to the published version of the manuscript.

Funding

This work is financially supported by the National Natural Science Foundation of China Grant No. 21776221.

Conflicts of Interest

The authors declare no conflict of interest. The funders had no role in the design of the study; in the collection, analyses, or interpretation of data; in the writing of the manuscript, or in the decision to publish the results.

References

  1. Jiao, K.; Li, X. Water transport in polymer electrolyte membrane fuel cells. Prog. Energy Combust. Sci. 2011, 37, 221–291. [Google Scholar] [CrossRef]
  2. Deng, H.; Hou, Y.; Jiao, K. Lattice Boltzmann simulation of liquid water transport inside and at interface of gas diffusion and micro-porous layers of PEM fuel cells. Int. J. Heat Mass Transf. 2019, 140, 1074–1090. [Google Scholar] [CrossRef]
  3. Li, Y.; Pei, P.; Wu, Z.; Ren, P.; Jia, X.; Chen, D.; Huang, S. Approaches to avoid flooding in association with pressure drop in proton exchange membrane fuel cells. Appl. Energy 2018, 224, 42–51. [Google Scholar] [CrossRef]
  4. Roy, S.K.; Orazem, M.E. Analysis of flooding as a stochastic process in polymer electrolyte membrane (PEM) fuel cells by impedance techniques. J. Power Sources 2008, 184, 212–219. [Google Scholar] [CrossRef]
  5. Xu, P.; Xu, S.; Liu, P.; Liu, X. A Lattice Boltzmann Simulation of Gas Purge in Flow Channel with Real GDL Surface Characteristics for Proton Exchange Membrane Fuel Cell. SAE Tech. Pap. Ser. 2019, 831–836. [Google Scholar] [CrossRef]
  6. Hou, Y.; Li, X.; Du, Q.; Jiao, K.; Zamel, N. Pore-Scale Investigation of the Effect of Micro-Porous Layer on Water Transport in Proton Exchange Membrane Fuel Cell. J. Electrochem. Soc. 2020, 167, 144504. [Google Scholar] [CrossRef]
  7. Yu, J.; Froning, D.; Reimer, U.; Lehnert, W. Polytetrafluorethylene effects on liquid water flowing through the gas diffusion layer of polymer electrolyte membrane fuel cells. J. Power Sources 2019, 438, 226975. [Google Scholar] [CrossRef]
  8. Zhang, D.; Cai, Q.; Gu, S. Three-dimensional lattice-Boltzmann model for liquid water transport and oxygen diffusion in cathode of polymer electrolyte membrane fuel cell with electrochemical reaction. Electrochim. Acta 2018, 262, 282–296. [Google Scholar] [CrossRef]
  9. Kakaee, A.; Molaeimanesh, G.; Garmaroudi, M.E. Impact of PTFE distribution across the GDL on the water droplet removal from a PEM fuel cell electrode containing binder. Int. J. Hydrogen Energy 2018, 43, 15481–15491. [Google Scholar] [CrossRef]
  10. Jeon, D.H. The impact of rib structure on the water transport behavior in gas diffusion layer of polymer electrolyte membrane fuel cells. J. Energy Inst. 2019, 92, 755–767. [Google Scholar] [CrossRef]
  11. Kim, K.; Kang, J.H.; Lee, S.G.; Nam, J.H.; Kim, C.-J. Lattice Boltzmann simulation of liquid water transport in microporous and gas diffusion layers of polymer electrolyte membrane fuel cells. J. Power Sources 2015, 278, 703–717. [Google Scholar] [CrossRef]
  12. Shakerinejad, E.; Kayhani, M.; Nazari, M.; Tamayol, A. Increasing the performance of gas diffusion layer by insertion of small hydrophilic layer in proton-exchange membrane fuel cells. Int. J. Hydrogen Energy 2018, 43, 2410–2428. [Google Scholar] [CrossRef]
  13. Jeon, D.H.; Kim, H. Effect of compression on water transport in gas diffusion layer of polymer electrolyte membrane fuel cell using lattice Boltzmann method. J. Power Sources 2015, 294, 393–405. [Google Scholar] [CrossRef]
  14. García-Salaberri, P.A.; Zenyuk, I.; Shum, A.D.; Hwang, G.; Vera, M.; Weber, A.Z.; Gostick, J.T. Analysis of representative elementary volume and through-plane regional characteristics of carbon-fiber papers: Diffusivity, permeability and electrical/thermal conductivity. Int. J. Heat Mass Transf. 2018, 127, 687–703. [Google Scholar] [CrossRef]
  15. Fishman, Z.; Hinebaugh, J.; Bazylak, A. Microscale Tomography Investigations of Heterogeneous Porosity Distributions of PEMFC GDLs. J. Electrochem. Soc. 2010, 157, B1643–B1650. [Google Scholar] [CrossRef]
  16. Zenyuk, I.V.; Parkinson, D.Y.; Connolly, L.G.; Weber, A.Z. Gas-diffusion-layer structural properties under compression via X-ray tomography. J. Power Sources 2016, 328, 364–376. [Google Scholar] [CrossRef] [Green Version]
  17. Li, Q.; Luo, K.; Kang, Q.; He, Y.; Chen, Q. Lattice Boltzmann methods for multiphase flow and phase-change heat transfer. Prog. Energy Combust. Sci. 2016, 52, 62–105. [Google Scholar] [CrossRef] [Green Version]
  18. Flückiger, R.; Marone, F.; Stampanoni, M.; Wokaun, A.; Büchi, F. Investigation of liquid water in gas diffusion layers of polymer electrolyte fuel cells using X-ray tomographic microscopy. Electrochim. Acta 2011, 56, 2254–2262. [Google Scholar] [CrossRef]
  19. Chen, W.; Jiang, F. Impact of PTFE content and distribution on liquid–gas flow in PEMFC carbon paper gas distribution layer: 3D lattice Boltzmann simulations. Int. J. Hydrogen Energy 2016, 41, 8550–8562. [Google Scholar] [CrossRef]
  20. Shan, X.; Chen, H. Lattice Boltzmann model for simulating flows with multiple phases and components. Phys. Rev. E 1993, 47, 1815–1819. [Google Scholar] [CrossRef] [Green Version]
  21. Xu, P.; Xu, S.; Gao, Y. Using Orthorhombic Lattice Boltzmann Model to Research the Liquid Transport in Gas Diffusion Layer with Different Micro Porous Layer Coated. Commun. Comput. Phys. 2018, 23, 1078–1093. [Google Scholar] [CrossRef]
Figure 1. The change of porosity in the thickness direction of the GDL before and after compression.
Wevj 12 00133 g001
Figure 2. Reconstructed computational field.
Wevj 12 00133 g002
Figure 3. Water saturation of (a) ideal GDL (left) and (b) real GDL (right).
Wevj 12 00133 g003
Figure 4. HSw of real GDL and ideal GDL in the thickness direction.
Wevj 12 00133 g004
Figure 5. VSw of real GDL and ideal GDL in the thickness direction.
Wevj 12 00133 g005
Figure 6. HSw in the GDL with different hydrophobicity in real GDL and ideal GDL.
Wevj 12 00133 g006
Publisher’s Note: MDPI stays neutral with regard to jurisdictional claims in published maps and institutional affiliations.

