Article

Numerical Simulation of Hydrogen Leakage from Fuel Cell Vehicle in an Outdoor Parking Garage

1
School of Automotive Studies, Tongji University, Shanghai 201804, China
2
Clean Energy Automotive Engineering Center, Tongji University, Shanghai 201804, China
*
Author to whom correspondence should be addressed.
World Electr. Veh. J. 2021, 12(3), 118; https://doi.org/10.3390/wevj12030118
Submission received: 13 July 2021 / Revised: 9 August 2021 / Accepted: 10 August 2021 / Published: 12 August 2021

Abstract

:
It is significant to assess the hydrogen safety of fuel cell vehicles (FCVs) in parking garages with a rapidly increased number of FCVs. In the present work, a Flame Acceleration Simulator (FLACS), a computational fluid dynamics (CFD) module using finite element calculation, was utilized to predict the dispersion process of flammable hydrogen clouds, which was performed by hydrogen leakage from a fuel cell vehicle in an outdoor parking garage. The effect of leakage diameter (2 mm, 3 mm, and 4 mm) and parking configurations (vertical and parallel parking) on the formation of flammable clouds with a range of 4–75% by volume was considered. The emission was assumed to be directed downwards from a Thermally Activated Pressure Relief Device (TPRD) of a 70 MPa storage tank. The results show that the 0.7 m parking space stipulated by the current regulations is less than the safety space of fuel cell vehicles. Compared with a vertical parking configuration, it is safer to park FCVs in parallel. It was also shown that release through a large TPRD orifice should be avoided, as the proportion of the larger hydrogen concentration in the whole flammable domain is prone to more accidental severe consequences, such as overpressure.

1. Introduction

Hydrogen safety in diverse situations is the most critical aspect of FCVs as hydrogen has high flammability (4–75% by volume) [1] and low ignition energy and is prone to leakage. The United States has invested 5–10% of the total funding of the hydrogen program into safety research [2]. Compressed hydrogen is typically stored under high pressure (35 MPa for buses and 70 MPa for cars) in storage tanks fitted with TPRD to release hydrogen, avoiding tank rupture when the ambient temperature reaches 110 ℃, melting the TPRD sensing element. The phenomenon of unignited hydrogen release can occur once TPRD fails. The possible subsequent deflagration and detonation events will not be discussed in this paper, which only focuses on leakage and dispersion. Some relevant safety studies have been performed using Computational Fluid Dynamics (CFD) tools to reveal the accidental risks in various scenarios, such as around fuel cell vehicles [3,4,5,6,7,8], in tunnels [9,10,11,12,13], and in enclosed areas [14,15,16,17,18]. Some researchers have experimentally investigated hydrogen behavior by transporting hydrogen in semi-closed or confined structures [7,8,19]. For security reasons, helium has been widely applied as an alternative experimental gas for the prediction of hydrogen behavior in many studies, since helium has similar physical properties to hydrogen [7,20].
By necessity, FCVs must be parked in vehicle garages, tunnels, etc. One of the most hazardous scenarios is hydrogen leakage from a high-pressure storage tank placed on the chassis underneath the vehicle in an outside parking garage since the semi-closed space formed by adjacent automobiles contributes to hydrogen accumulation. Hajji, Y. et al. [21] experimentally studied the effects of residential-garage geometry, shape, and number of vents on hydrogen concentration and delamination. They concluded that rectangular vents are most suitable for a prismatic garage, and the number of vents is critical to reducing hydrogen concentration than the shape. CFD methods have also been performed to numerically evaluate the behavior of hydrogen dispersion so that emergency measures can be taken immediately to reduce the hydrogen concentration under a lower flammable limit (LFL) [22,23,24]. H. Hussein et al. [25] numerically assessed the impact of various conditions by varying leakage orifice, direction, and angle of flammable hydrogen cloud. It was concluded that a larger orifice contributes to a massive flow rate, leading to a severe pressure-peaking phenomenon. The permeated hydrogen dispersion with the permeation rate of 1 Nml/h/L and 45 Nml/h/L from a high-pressure storage tank in a typical garage was studied analytically by Saffers, J.-B. et al. [26]. Hydrogen diffused and accumulated uniformly upward toward the ceiling after the leakage, and the concentration reached quasi-steady at 60 s and 12 s for 1 Nml/h/L and 45 Nml/h/L permeation rate, respectively. In addition, the detection of hydrogen dispersion is of critical importance in confined garage-like spaces, so Zhao, M. et al. [19] developed a localization technology for safe monitoring of large parking garages, and the model’s accuracy can be improved by learning more training data.
The aforementioned research mainly focuses on hydrogen release and dispersion in confined spaces such as underground garages. The behavior of hydrogen dispersion in semi-closed spaces has not been investigated specifically. In addition, the release flow rate was typically assumed to be constant. However, the mass rate of hydrogen release from hydrogen storage tanks through TPRD decreases with decreased internal pressure. The objective of this paper was to investigate the hydrogen dispersion for an outdoor parking garage model in various scenarios by varying TPRD orifice and parking configurations. The Computational Fluid Dynamics (CFD) tool FLACS was utilized to simulate the cases and analyze the diffusion phenomenon based on the spatial and temporal evolution of the flammable cloud.

2. Numerical Simulation

2.1. FLACS-Hydrogen Code

The grid-based resolution in FLACS, unlike other commercial simulation tools, relies on the so-called porosity/distributed resistance (PDR), where sub-grid geometry is represented as area and volume porosities (denoting the degree of “openness” for each grid cell), instead of resolving individual obstacles by a grid. Moen, A. et al. [27] conducted a comparative study of k-ε models in impinging hydrogen jet dispersion scenarios using the CFD code FLACS. The simulation results were compared with the Schlieren photographs from experiments in Reference [28]. Figure 1 shows the two-dimensional simulation results of comparing three turbulent models (standard, RNG, and realizable k-ε). It can be summarized from a comparison results that the standard k-ε model exhibits the best performance regardless of whether high- or low-momentum hydrogen releases are used. Thus, this paper applied the standard k-ε model with additional turbulence generation terms to solve turbulent kinetic energy (Equation (1)) and the dissipation of turbulent kinetic energy (Equation (2)). Following the Boussinesq eddy viscosity assumption, an eddy viscosity models the Reynolds stress tensor as Equation (3). Boundary conditions were defined as Nozzle (free outflow) on all sides. [29]
t ( β v ρ k ) + x j ( β j ρ u j k ) = x j ( β j μ e f f σ k k x j ) + β v P k β v ρ ε
t ( β v ρ ε ) + x j ( β j ρ u j ε ) = x j ( β j μ e f f σ k ε x j ) + β v P ε C 2 ε β v ρ ε 2 k
ρ u i u j ˜ = μ e f f ( u i ˜ x j + u j ˜ x i ) ρ 2 3 k δ i j
where βv is the volume porosity of the geometry, βj is the area porosity in the j direction, ρ is the density, u j ˜ is the mean velocity in the j direction, k is the turbulent kinetic energy, ε is the dissipation of turbulent kinetic energy, μeff is the effective viscosity, μeff = μ + μt, μt is the dynamic turbulent viscosity, σ is the Prandtl–Schmidt number, σk = 1.0, σε = 1.0, Pk is the production of turbulent kinetic energy, Pε is the production of dissipation of turbulent kinetic energy, C2ε is a model constant in transportation equation for dissipation with the default value of 1.92. δij is the Kronecker delta function, δij = 1 if i = j, δij = 0 if i ≠ j, and u i u j ˜ is the mean velocity in the i and j directions.
The leaked hydrogen through the TPRD orifice from a high-pressure storage tank is modeled as an under-expanded jet. A pseudo-source approach was applied to calculate the parameters of an under-expanded jet at the status where the pressure is atmosphere in terms of reservoir pressure, temperature, orifice diameter, and density. Table 1 presents the summary description of the jet source model in FLACS, where A1 is the effective nozzle area, γ is the isentropic ratio, cp is the specific heat at constant pressure, pa is the ambient pressure, and m ˙ 1 is the mass flow rate. More detailed information about the model can be found in References [30,31].

2.2. Geometry Configuration and Grids

In the present study, we considered two parking configurations based on the relative positions of the car body to the aisle. Figure 2 shows the configuration and dimension of the computational domain. Considering fire safety, a certain fire prevention distance was reserved between parking spaces to prevent flame propagation between vehicles. In the first configuration (Figure 2a), four vehicles, separated by 0.7 m [32], were arranged in vertically parking where the car body was perpendicular to the aisle. In the second configuration, three vehicles shown in Figure 2c were assumed to be parked parallel to the aisle where the spacing was set to 1.3 m in view of easy access for vehicles. The green geometry represents the curb.
FLACS uses a Cartesian grid arrangement to solve the governing equations using a finite volume method [29]. The grid scope contains three regions: central core domain, stretched domain, and refinement domain. The fuel cell vehicle model established in the simulation was based on EUNIQ7 with dimensions of 5 m × 2.2 m × 1.8 m, while the overall size of the total computational region was approximately 32 m in length, 25 m in width, and 75 m in height, high enough that the boundary had little effect on hydrogen diffusion considering the high buoyancy of hydrogen. As shown in Figure 2a,c, the central core region covers the vehicle where the leak position was located, and the normal uniform grid size was set to 0.5 m; the default stretch factor of 1.2 was applied to establish the stretched region which wraps around the central core region to simulate the hydrogen diffusion in the far field. Furthermore, the mesh was further refined around the leakage point, forming the refinement region.
Since the simulation progress was conducted using transient numerical calculation, the vehicle model is simplified to minimize the calculation time and save calculation resources. Due to hydrogen leakage and dispersion occurring externally to the vehicle, many elements of the vehicle geometry were assumed to have little effect on hydrogen dispersion, so some internal components, such as seats, steering wheel, instrument panel, brake, and accelerator pedals were ignored. Consequently, the remaining parts contained a car body modeled as an entity without any pores, three hydrogen tanks mounted under the chassis, and connecting pipes.

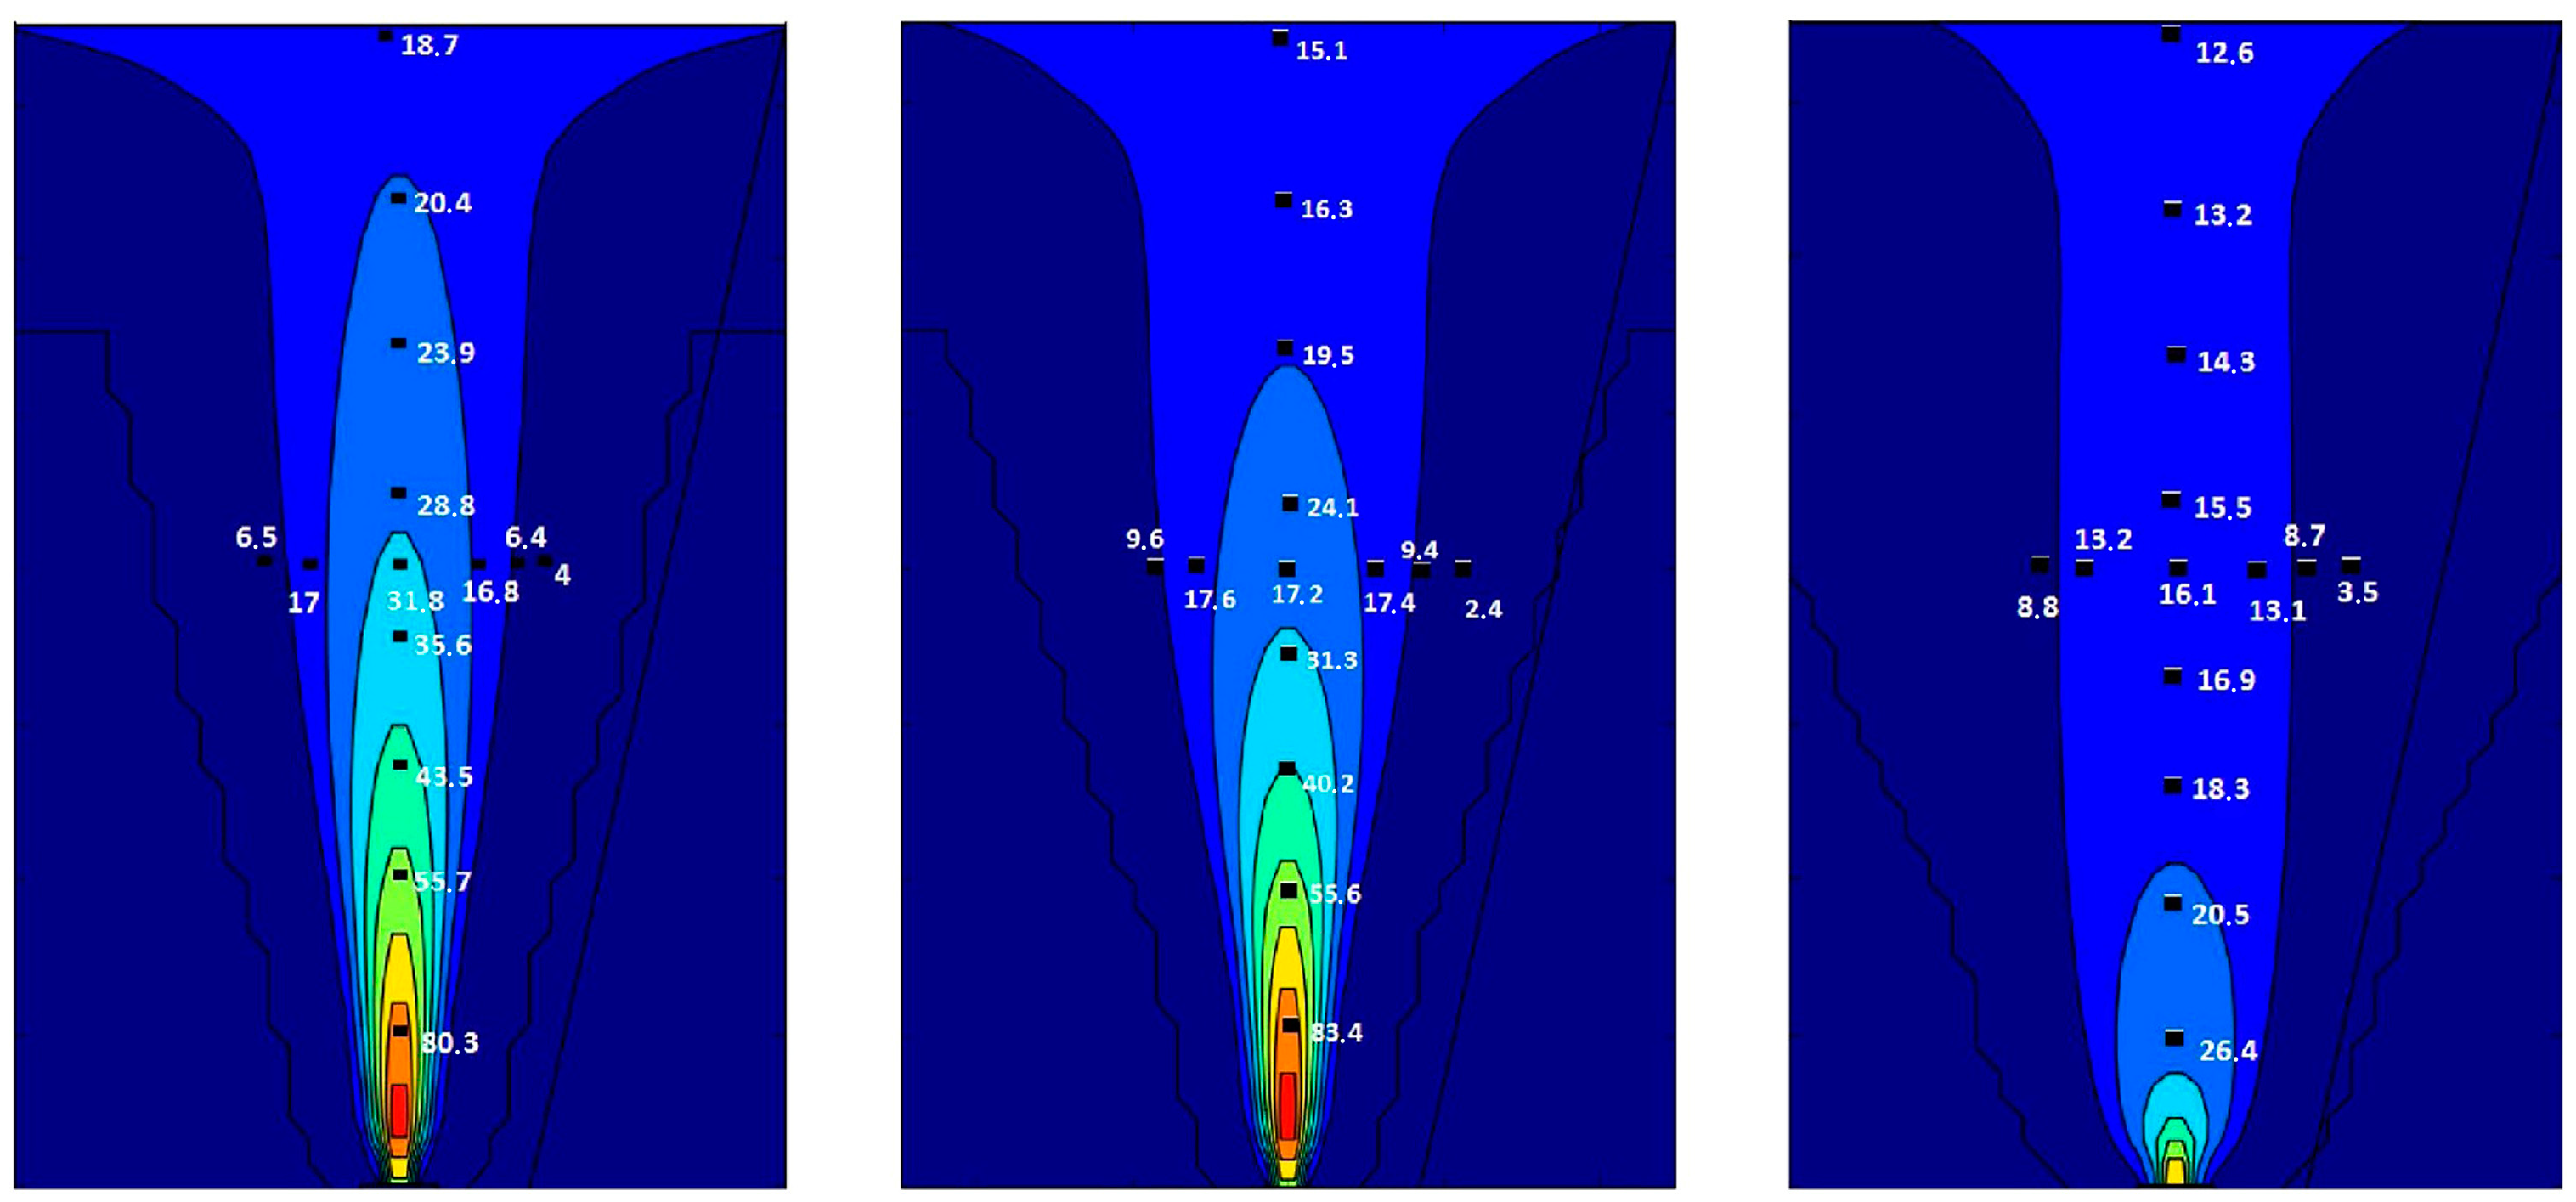
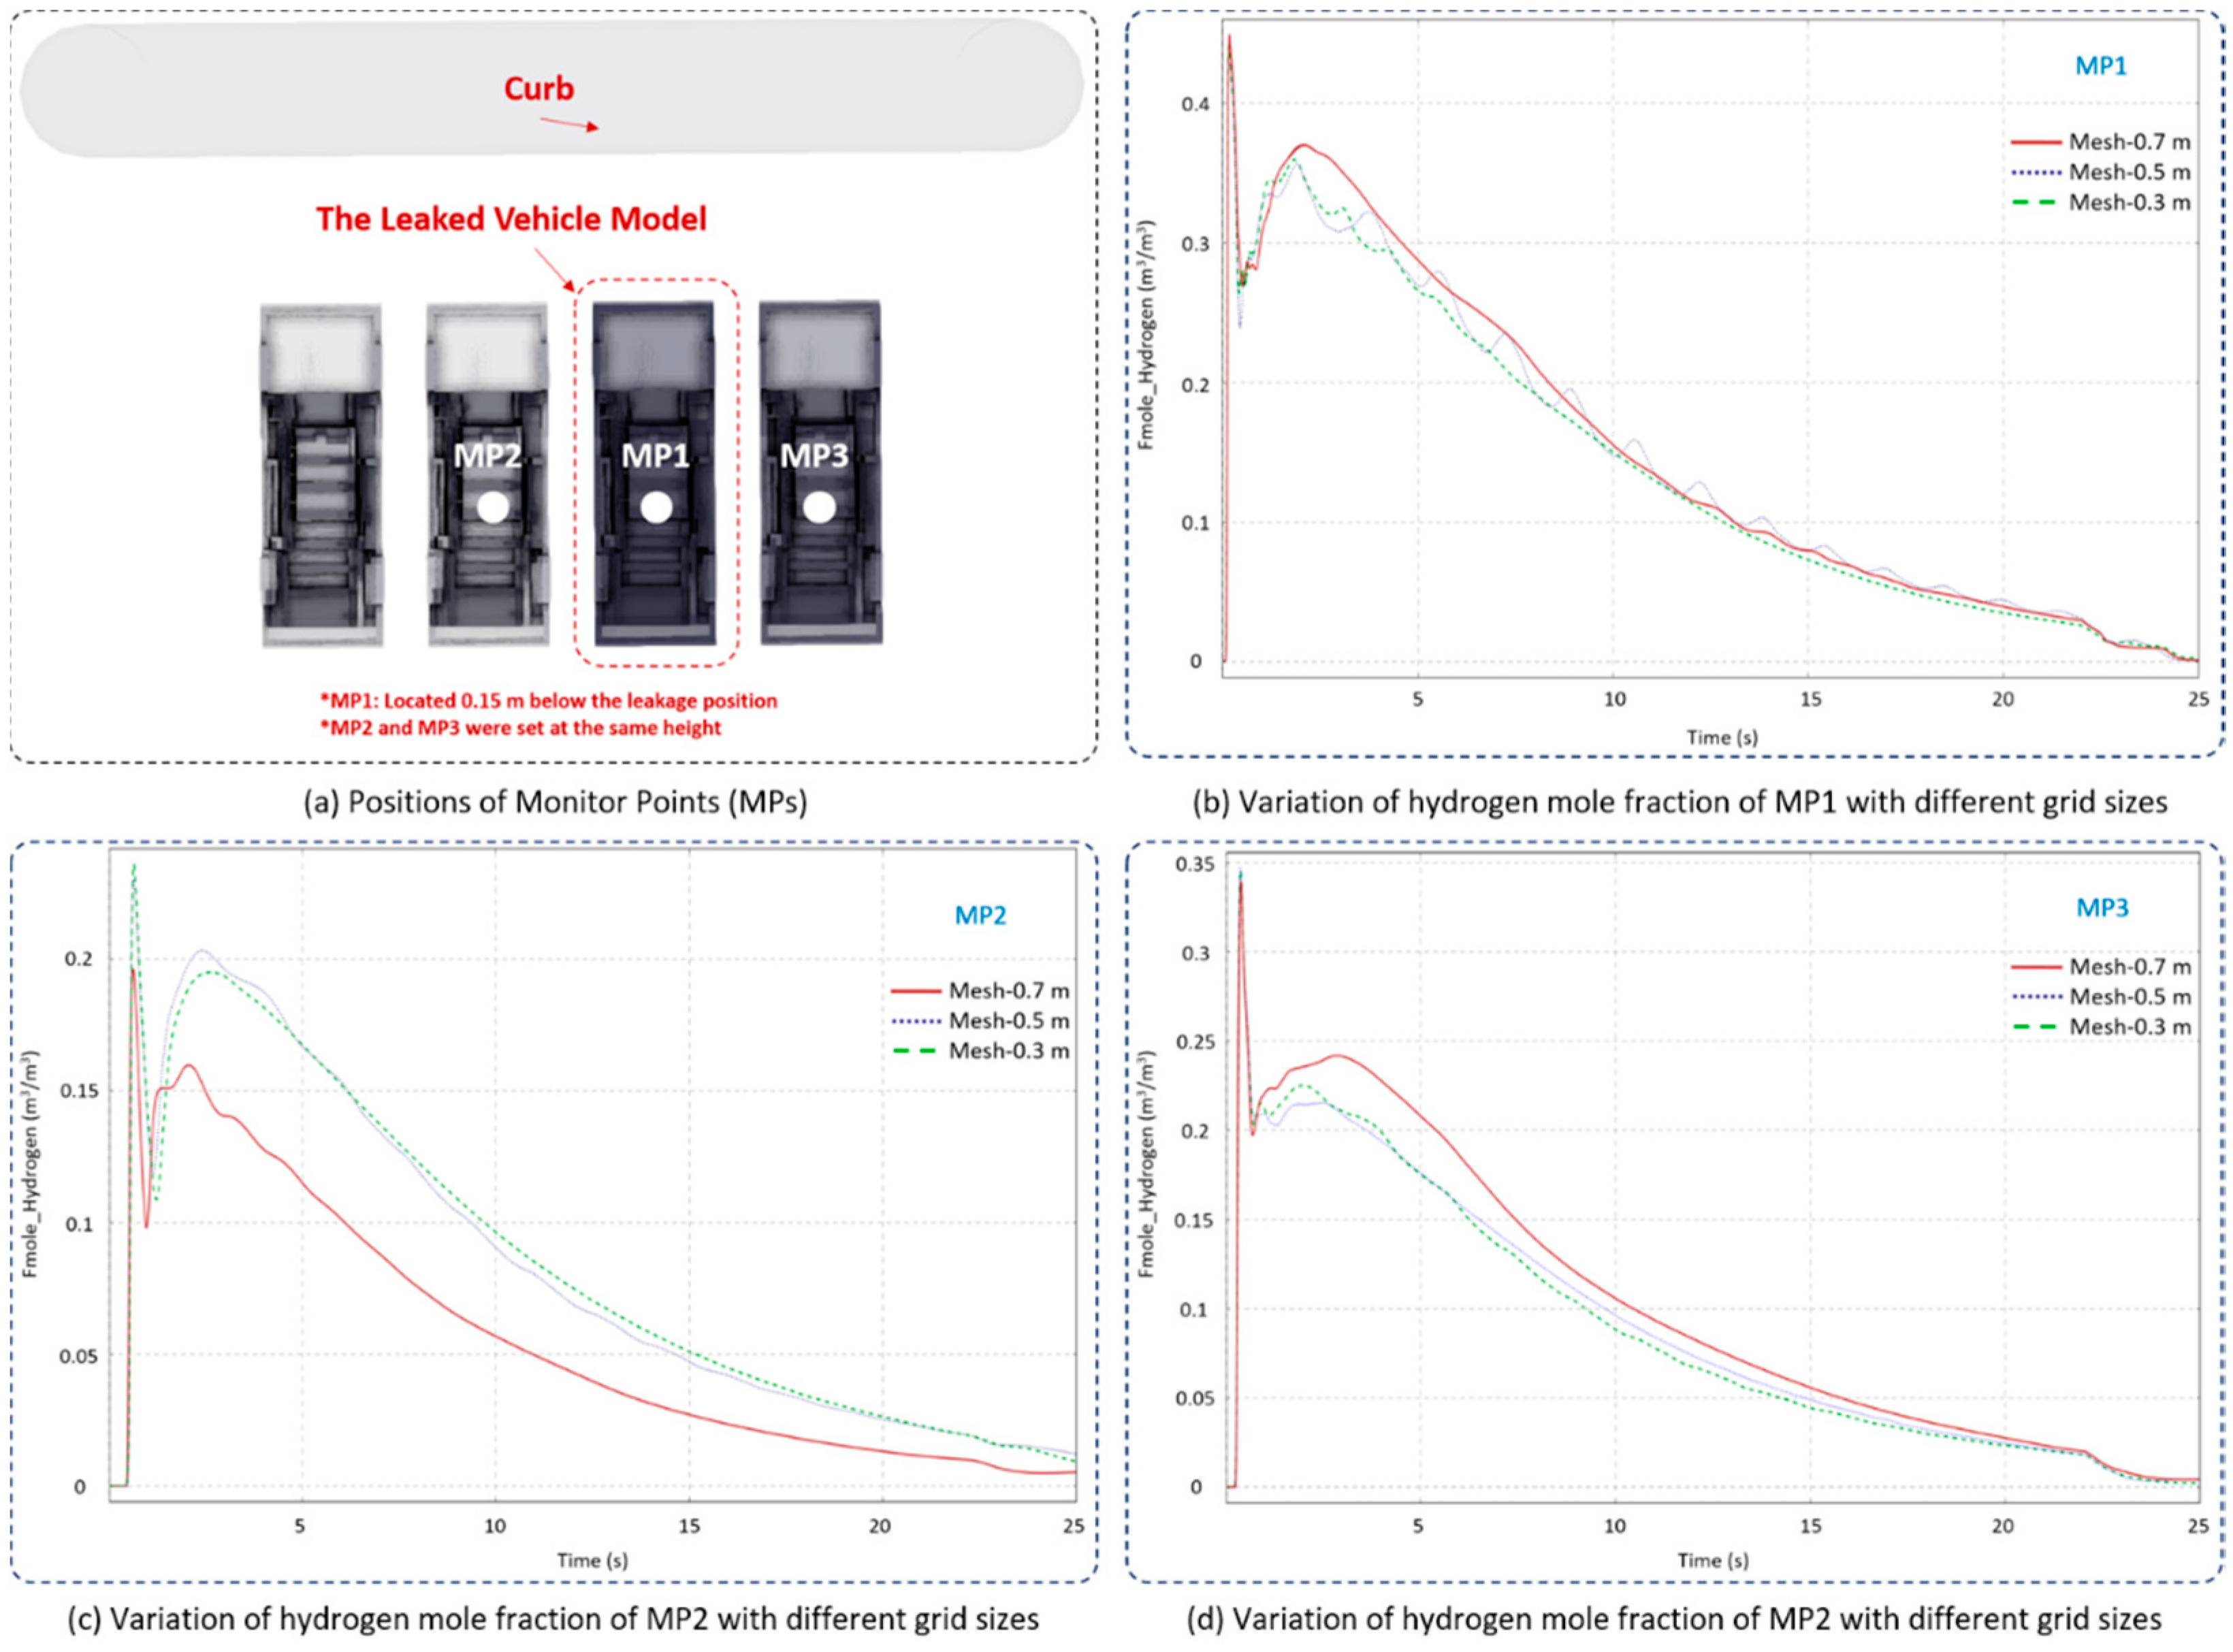
2.3. Grid Independency Validation

Two additional grid dimensions, 0.3 m and 0.7 m, were used to perform the grid independency validation. As shown in Figure 3, Monitor Point 1 (MP1) was created 0.15 m below the leakage position, and the other MPs (MP2 and MP3) were similarly set at the same height underneath the adjacent vehicles. The hydrogen mole fraction with time was chosen as the monitoring parameter for evaluating grid independency under various grid sizes. It can be seen from Figure 3 that the general behavior of hydrogen diffusion at all grid sizes is generally consistent, while the values were in better agreement when the simulations were conducted under the core-domain grid size of 0.3 m or 0.5 m. The hydrogen mole fraction simulated under a grid size of 0.7 m showed a larger deviation. Apparently, no further significant inconsistency exists when the grid dimension is smaller than 0.5 m, and therefore grid size of 0.5 m was utilized in this paper.

2.4. Determination of Hydrogen Leakage Rate

TPRD valve was assumed to be triggered, and the empty rate was taken as the input condition in this paper. The hydrogen leak originating from a 70 MPa high-pressure storage tank at a temperature of 20 °C was shown in Figure 2. The release orifice of the TPRD was set to 2 mm, 3 mm, and 4 mm in diameter, which is typically used in current fuel cell vehicles with the leak oriented vertically downward as the default release direction. Six scenarios were considered by varying the TPRD orifice and parking configurations. The time-dependent leakage rate of TPRD from 55 L hydrogen storage tank was calculated using equations mentioned in Section 2.1. Six scenarios were considered, varying TPRD diameters and parking configurations, which are listed in Table 2. The initial leakage rate was 0.126, 0.283, 0.428 kg/s when the orifice diameter was 2 mm, 3 mm, and 4 mm, respectively, and then attenuates exponentially with time. Correspondingly, the total leakage time (166, 70, and 44 s for the leakage orifice of 2, 3, and 4 mm), defined as the time interval when hydrogen storage pressure relief from 70 MPa to atmospheric pressure, decreases with increased orifice diameter. For the hydrogen release from the 4.2 mm orifice, 171 L storage tank at 35 MPa, the blowdown time is less than 110 s (around 108 s) [33]. For accuracy comparison, the total leakage time was calculated as 102.5 s under the same conditions in FLACS. The deviation rate was less than 7%. In addition, HyRAM, a software toolkit integrating validated science and engineering models and data relevant to hydrogen safety, contains a validated engineering toolkit that can be applied to predict physical effects, including the empty time of the high-pressure storage tanks [34]. The leakage time and deviation rate calculated by HyRAM were presented in column 6 of Table 2.

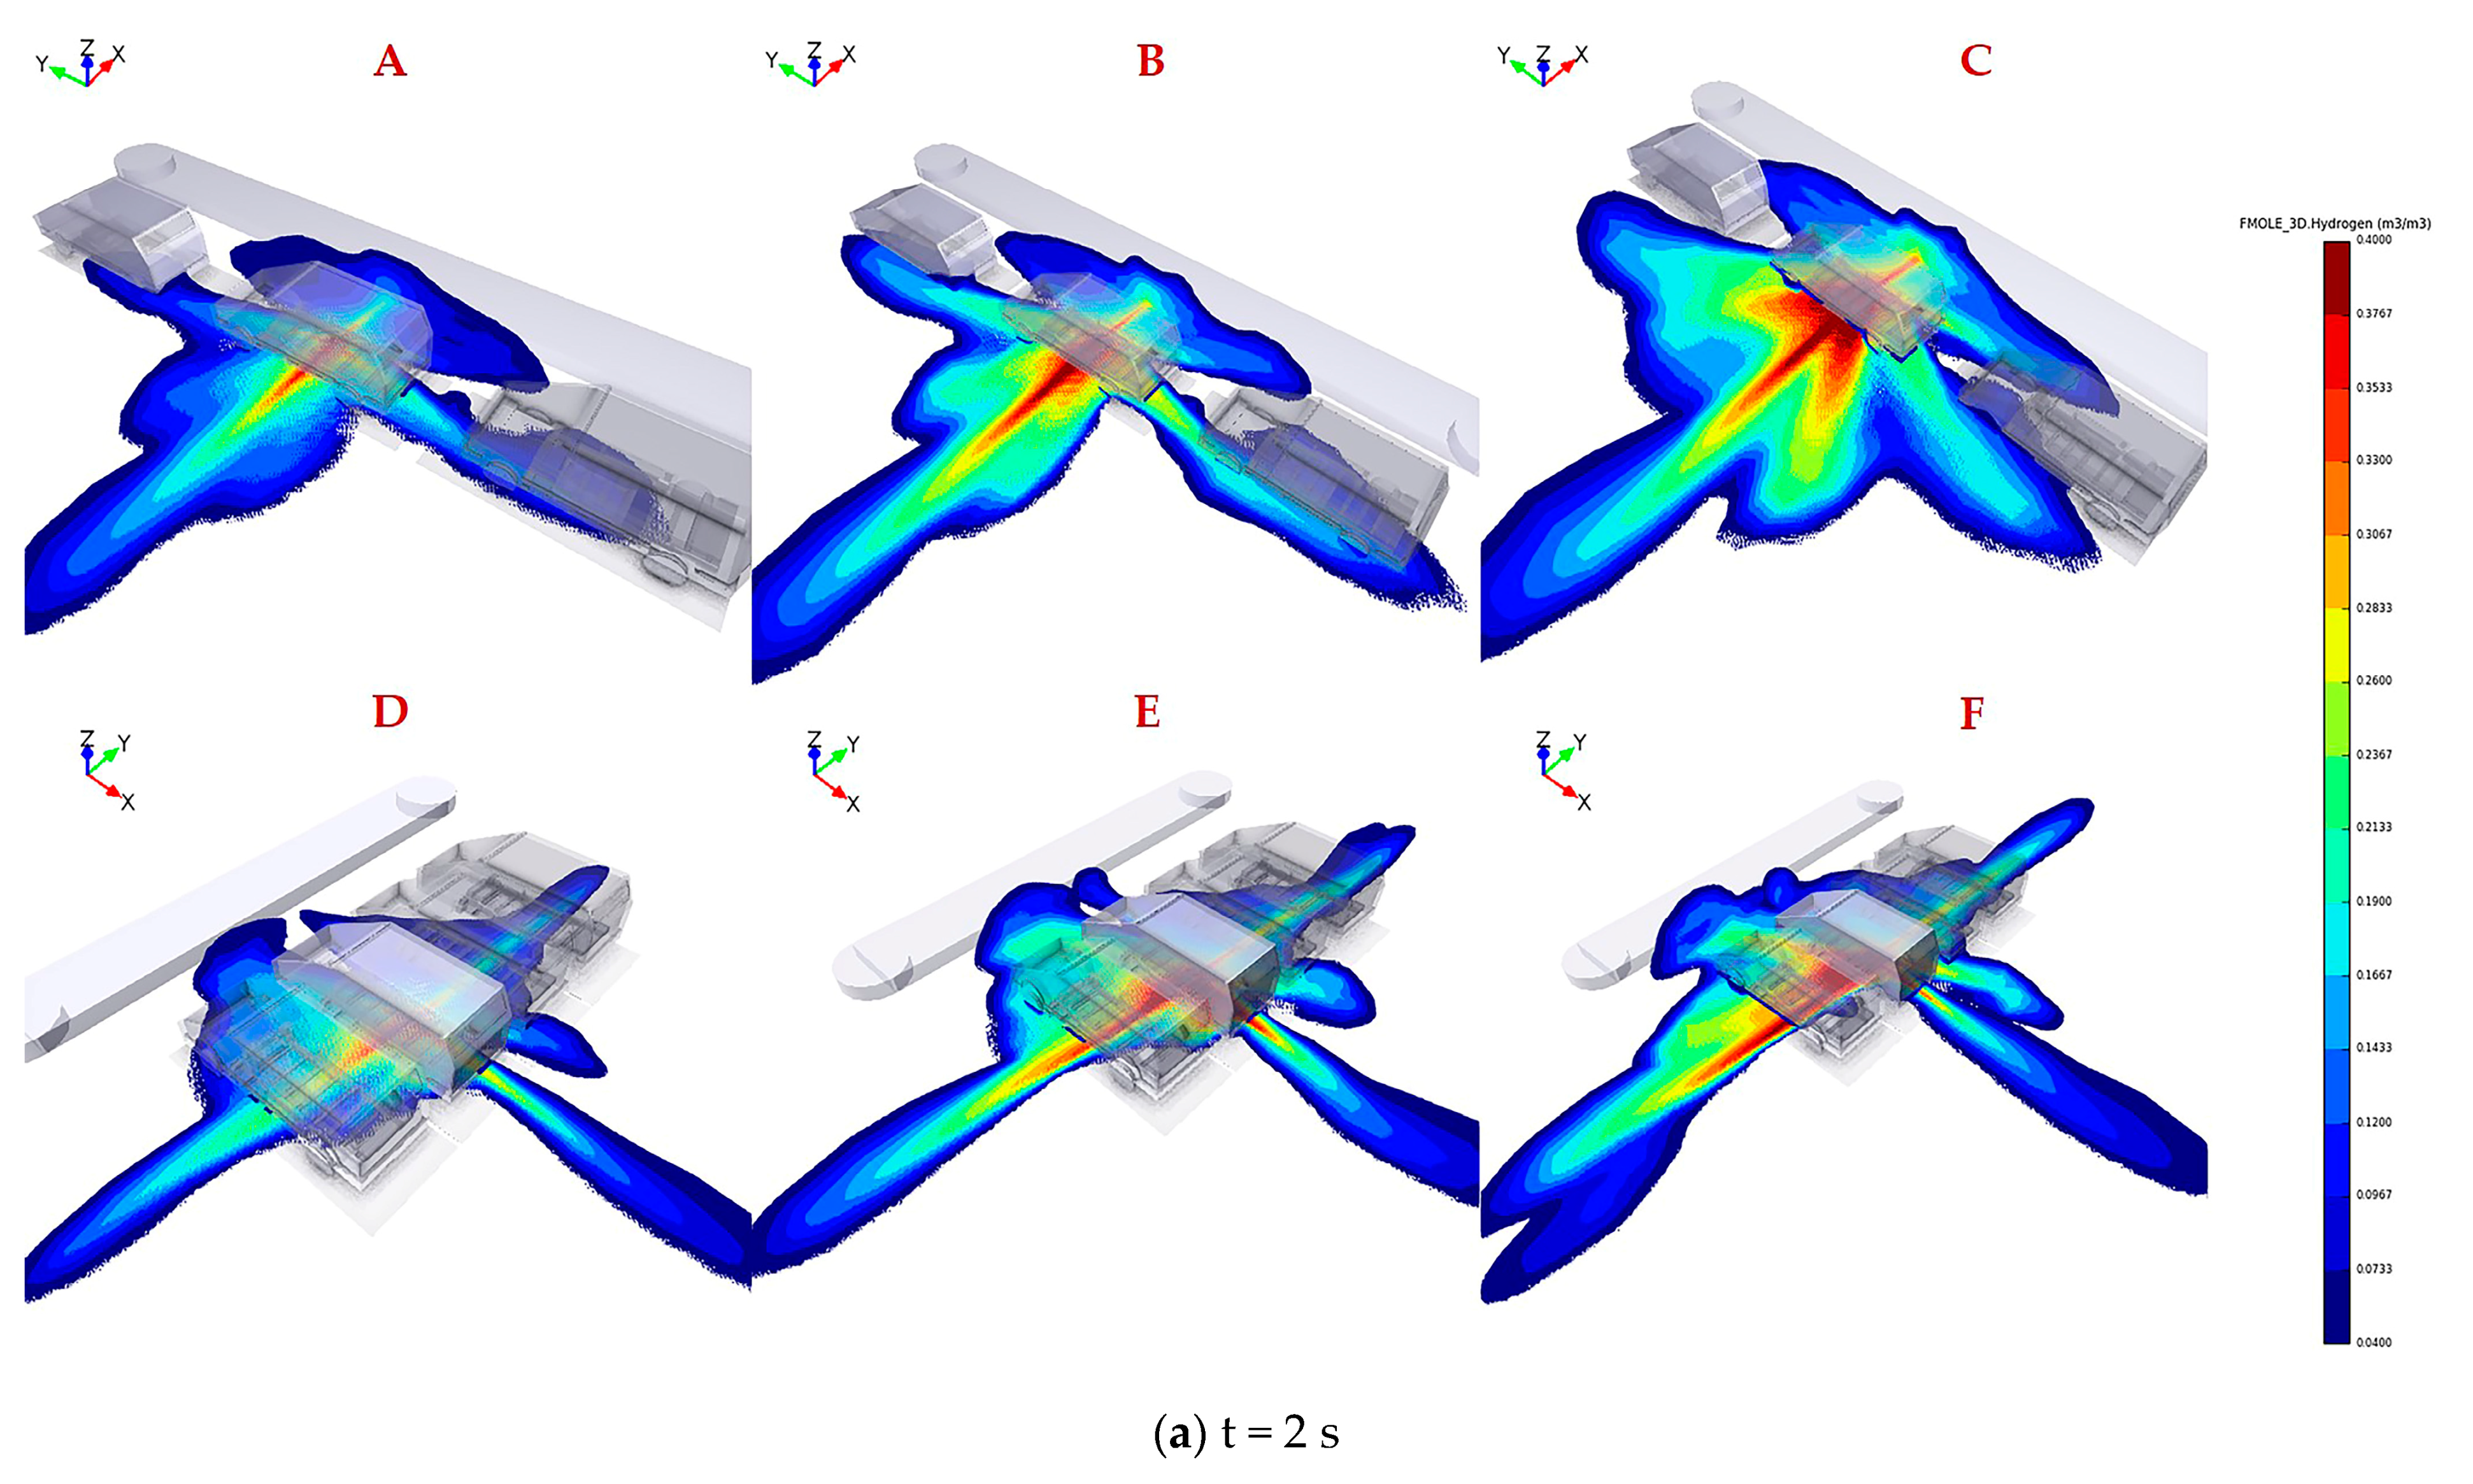
3. Results and Discussions

The legend located at the right of the figure represents hydrogen concentration ranging from 0.04 to 0.4 by volume. Figure 4 shows the distribution of flammable hydrogen gas cloud in six scenarios varying TPRD diameters and parking configurations. The explanation of the uppercase letters in each subgragh were presented in Table 2. As shown in Figure 4a, at 2 s after leakage, higher hydrogen concentrations with a range of 0.3–0.6 by volume are observed clearly for all conditions underneath the leaked vehicle, where the leakage position is located. Alcock et al. [35] recommended that the widest detonability limit of hydrogen in air is 0.11–0.59 by volume. The results reveal that the entire domain under the fuel cell vehicle has already become explosion hazard areas; therefore, hydrogen sensors need to be installed under the chassis close to the TPRD vent pipe to detect any hydrogen leakage and raising an alarm in advance to help personals take appropriate emergency measures.
It is obvious that hydrogen diffuses faster along the width direction of the car body than in the length direction after leakage for two different parking configurations, thus revealing the advantages of parallel parking over vertical parking. The hydrogen concentration value underneath 2–3 vehicles adjacent to the leakage source can reach 0.15–0.35 by volume in vertical parking, while in parallel parking, this value is only 0.04–0.15 by volume. The adiabatic premixed flame temperature of hydrogen with a stoichiometric mixture in the air can reach up to 2403 K [36]. If ignition occurs, the flame will spread along with the premixed hydrogen gas cloud to the adjacent vehicles, meaning that the personnel will have little time to escape in a vertical parking configuration. On the other hand, the body along the X direction (hydrogen diffuses faster) is much closer to the obstacles, such as walls or steps, when parking parallel, contributing to hydrogen accumulation in narrow space. However, only a small amount of hydrogen extends to the front and rear of the compartment; thus, the hydrogen concentration is low, so the flame will propagate to the aisle and have little effect on surrounding vehicles even if ignition happens.
The results of Figure 4b reveal that the coverage area of hydrogen mole fraction between 0.2 and 0.4 shrinks under the combined action of decreased leakage rate and high diffusion rate of hydrogen, which is conducive to a fast propagation of hydrogen with a mole fraction between 0.04 and 0.2. The hydrogen flammable mass keeps increasing, although the leakage rate is decreasing, until the peak time when the mass attains the maximum in each case is reached. Nevertheless, the flammable cloud gradually dissipates after exceeding the equilibrium point, as the higher buoyancy is dominant in the later period of leakage. The proportion of the larger hydrogen concentration of 0.2–0.4 by volume in the whole flammable domain is greater for larger TPRD orifice at the same leakage time, indicating that the accidental risk will be more unacceptable once ignition happens, such as the overpressure.

4. Conclusions

Unignited hydrogen release through a Thermally Activated Pressure Relief Device (TPRD) from onboard hydrogen storage tanks in an outdoor parking garage has been studied in the present numerical work. The results indicate that further research of more scenarios, such as ignited releases, should be conducted to improve the safety demands for fuel cell vehicles.
Simulations were carried out in an outdoor parking garage with a computational region of 32 m in length, 25 m in width, and 75 m in height. The release scenario assumed that hydrogen leaked through TPRD from a 70 MPa hydrogen storage tank with a hydrogen mass of 2.5 kg. The mass flow rate was assumed to decrease with decreased internal pressure of the storage tank, which are different from the constant value selected in other research. Six release cases varying between three leakage orifices (2 mm, 3 mm, 4 mm) and two parking configurations (parallel parking, vertical parking) were considered.
As expected, higher hydrogen concentrations within detonation limits were clearly observed for all cases in the vicinity of the leakage position at the beginning of the release. The flammable cloud diffuses fast under the combined action of decreased leakage rate and high diffusion rate of hydrogen, which was conducive to a fast propagation of hydrogen with a mole fraction between 0.04 and 0.2. The flammable cloud gradually dissipates in the later period of leakage, as the higher buoyancy is dominant. Downward release of hydrogen pushed the flammable gas diffusion around the vehicle. The coverage of flammable cloud indicates that the parking space between vehicles was not safe enough. These factors should be considered in the design of the parking space for hydrogen safety.

Author Contributions

Conceptualization, Y.S. and T.Z.; methodology, software, validation, Y.S.; formal analysis, H.L.; investigation, resources, data curation, writing—original draft preparation, writing—review and editing, visualization, supervision, project administration, Y.S., T.Z., H.L., W.Z. and C.Z.; funding acquisition, H.L. All authors have read and agreed to the published version of the manuscript.

Funding

This research was funded by Key Technologies Research and Development Program (CN), grant number 2020YFB1506205; and Scientific and Innovative Action Plan of Shanghai, grant number 18DZ1201900.

Conflicts of Interest

The authors declare no conflict of interest. The funders had no role in the design of the study; in the collection, analyses, or interpretation of data; in the writing of the manuscript, or in the decision to publish the results.

References

  1. Coward, H.F.; Jones, G.W. Limits of Flammability of Gases and Vapors; US Government Printing Office: Washington, DC, USA, 1952; Volume 503.
  2. San Marchi, C.; Hecht, E.S.; Ekoto, I.W.; Groth, K.M.; LaFleur, C.; Somerday, B.P.; Mukundan, R.; Rockward, T.; Keller, J.; James, C.W. Overview of the DOE hydrogen safety, codes and standards program, part 3: Advances in research and development to enhance the scientific basis for hydrogen regulations, codes and standards. Int. J. Hydrogen Energy 2017, 42, 7263–7274. [Google Scholar] [CrossRef] [Green Version]
  3. Houf, W.G.; Evans, G.H.; Ekoto, I.W.; Merilo, E.G.; Groethe, M.A. Hydrogen fuel-cell forklift vehicle releases in enclosed spaces. Int. J. Hydrogen Energy 2013, 38, 8179–8189. [Google Scholar] [CrossRef]
  4. Tamura, Y.; Takeuchi, M.; Sato, K. Effectiveness of a blower in reducing the hazard of hydrogen leaking from a hydrogen-fueled vehicle. Int. J. Hydrogen Energy 2014, 39, 20339–20349. [Google Scholar] [CrossRef]
  5. Liu, W.; Christopher, D.M. Dispersion of hydrogen leaking from a hydrogen fuel cell vehicle. Int. J. Hydrogen Energy 2015, 40, 16673–16682. [Google Scholar] [CrossRef]
  6. Yu, X.; Wang, C.; He, Q. Numerical study of hydrogen dispersion in a fuel cell vehicle under the effect of ambient wind. Int. J. Hydrogen Energy 2019, 44, 22671–22680. [Google Scholar] [CrossRef]
  7. Chen, M.; Zhao, M.; Huang, T.; Ji, S.; Chen, L.; Chang, H.; Christopher, D.M.; Li, X. Measurements of helium distributions in a scaled-down parking garage model for unintended releases from a fuel cell vehicle. Int. J. Hydrogen Energy 2020, 45, 22166–22175. [Google Scholar] [CrossRef]
  8. Hao, D.; Wang, X.; Zhang, Y.; Wang, R.; Chen, G.; Li, J. Experimental Study on Hydrogen Leakage and Emission of Fuel Cell Vehicles in Confined Spaces. Automot. Innov. 2020, 3, 111–122. [Google Scholar] [CrossRef]
  9. Tolias, I.C.; Venetsanos, A.G.; Markatos, N.; Kiranoudis, C.T. CFD modeling of hydrogen deflagration in a tunnel. Int. J. Hydrogen Energy 2014, 39, 20538–20546. [Google Scholar] [CrossRef]
  10. Bie, H.Y.; Hao, Z.R. Simulation analysis on the risk of hydrogen releases and combustion in subsea tunnels. Int. J. Hydrogen Energy 2017, 42, 7617–7624. [Google Scholar] [CrossRef]
  11. Seike, M.; Kawabata, N.; Hasegawa, M.; Tanaka, H. Heat release rate and thermal fume behavior estimation of fuel cell vehicles in tunnel fires. Int. J. Hydrogen Energy 2019, 44, 26597–26608. [Google Scholar] [CrossRef]
  12. LaFleur, C.B.; Bran Anleu, G.A.; Muna, A.B.; Ehrhart, B.D.; Blaylock, M.L.; Houf, W.G. Hydrogen Fuel Cell Electric Vehicle Tunnel Safety Study; Sandia National Lab. (SNL-NM): Albuquerque, NM, USA, 2017. [Google Scholar]
  13. Li, Y.; Xiao, J.; Zhang, H.; Breitung, W.; Travis, J.; Kuznetsov, M.; Jordan, T. Numerical analysis of hydrogen release, dispersion and combustion in a tunnel with fuel cell vehicles using all-speed CFD code GASFLOW-MPI. Int. J. Hydrogen Energy 2021, 46, 12474–12486. [Google Scholar] [CrossRef]
  14. Hussein, H.G.; Brennan, S.; Shentsov, V.; Makarov, D.; Molkov, V. Numerical validation of pressure peaking from an ignited hydrogen release in a laboratory-scale enclosure and application to a garage scenario. Int. J. Hydrogen Energy 2018, 43, 17954–17968. [Google Scholar] [CrossRef]
  15. Malakhov, A.A.; Avdeenkov, A.V.; du Toit, M.H.; Bessarabov, D.G. CFD simulation and experimental study of a hydrogen leak in a semi-closed space with the purpose of risk mitigation. Int. J. Hydrogen Energy 2020, 45, 9231–9240. [Google Scholar] [CrossRef]
  16. De Stefano, M.; Rocourt, X.; Sochet, I.; Daudey, N. Hydrogen dispersion in a closed environment. Int. J. Hydrogen Energy 2019, 44, 9031–9040. [Google Scholar] [CrossRef]
  17. Giannissi, S.G.; Tolias, I.C.; Venetsanos, A.G. Mitigation of buoyant gas releases in single-vented enclosure exposed to wind: Removing the disrupting wind effect. Int. J. Hydrogen Energy 2016, 41, 4060–4071. [Google Scholar] [CrossRef]
  18. Dadashzadeh, M.; Ahmad, A.; Khan, F. Dispersion modelling and analysis of hydrogen fuel gas released in an enclosed area: A CFD-based approach. Fuel 2016, 184, 192–201. [Google Scholar] [CrossRef]
  19. Zhao, M.; Huang, T.; Liu, C.; Chen, M.; Ji, S.; Christopher, D.M.; Li, X. Leak localization using distributed sensors and machine learning for hydrogen releases from a fuel cell vehicle in a parking garage. Int. J. Hydrogen Energy 2021, 46, 1420–1433. [Google Scholar] [CrossRef]
  20. He, J.; Kokgil, E.; Wang, L.L.; Ng, H.D. Assessment of similarity relations using helium for prediction of hydrogen dis-persion and safety in an enclosure. Int. J. Hydrogen Energy 2016, 41, 15388–15398. [Google Scholar] [CrossRef] [Green Version]
  21. Hajji, Y.; Bouteraa, M.; Elcafsi, A.; Belghith, A.; Bournot, P.; Kallel, F. Natural ventilation of hydrogen during a leak in a residential garage. Renew. Sustain. Energy Rev. 2015, 50, 810–818. [Google Scholar] [CrossRef]
  22. Xie, H.; Li, X.; Christopher, D.M. Emergency blower ventilation to disperse hydrogen leaking from a hydrogen-fueled vehicle. Int. J. Hydrogen Energy 2015, 40, 8230–8238. [Google Scholar] [CrossRef]
  23. Ehrhart, B.D.; Harris, S.R.; Blaylock, M.L.; Muna, A.B.; Quong, S.; Olivia, D. Risk Assessment and Ventilation Modeling for Hydrogen Vehicle Repair Garages; Sandia National Lab. (SNL-NM): Albuquerque, NM, USA, 2019. [Google Scholar]
  24. Choi, J.; Hur, N.; Kang, S.; Lee, E.D.; Lee, K.-B. A CFD simulation of hydrogen dispersion for the hydrogen leakage from a fuel cell vehicle in an underground parking garage. Int. J. Hydrogen Energy 2013, 38, 8084–8091. [Google Scholar] [CrossRef]
  25. Hussein, H.; Brennan, S.; Molkov, V. Dispersion of hydrogen release in a naturally ventilated covered car park. Int. J. Hydrogen Energy 2020, 45, 23882–23897. [Google Scholar] [CrossRef]
  26. Saffers, J.-B.; Makarov, D.; Molkov, V. Modelling and numerical simulation of permeated hydrogen dispersion in a garage with adiabatic walls and still air. Int. J. Hydrogen Energy 2011, 36, 2582–2588. [Google Scholar] [CrossRef]
  27. Moen, A.; Mauri, L.; Narasimhamurthy, V.D. Comparison of k-ε models in gaseous release and dispersion simulations using the CFD code FLACS. Process. Saf. Environ. Prot. 2019, 130, 306–316. [Google Scholar] [CrossRef]
  28. Friedrich, A.; Grune, J.; Kotchourko, N.; Kotchourko, A.; Stern, G.; Sempert, K.; Kuznetsov, M. Experimental Study of Jet-Formed Hydrogen-Air Mixtures and Pressure Loads from Their Deflagrations in Low Confined Surroundings. In Proceedings of the 2nd International Conference on Hydrogen Safety, San Sebastian, Spain, 11–13 September 2007. [Google Scholar]
  29. Hisken, H. Investigation of Instability and Turbulence Effects on Gas Explosions: Experiments and Modelling; Department of Physics and Technology, University of Bergen: Bergen, Norway, 2018. [Google Scholar]
  30. Li, J.; Hernandez, F.; Hao, H.; Fang, Q.; Xiang, H.; Li, Z.; Zhang, X.; Chen, L. Vented methane-air explosion overpressure calculation—A simplified approach based on CFD. Process. Saf. Environ. Prot. 2017, 109, 489–508. [Google Scholar] [CrossRef] [Green Version]
  31. Hjertager, B.H. Computer modelling of turbulent gas explosions in complex 2D and 3D geometries. J. Hazard. Mater. 1993, 34, 173–197. [Google Scholar] [CrossRef]
  32. Jian-ping, Y.; Zheng, F.; Zhi, T.; Jia-Yun, S. Numerical simulations on sprinkler system and impulse ventilation in an underground car park. Procedia Eng. 2011, 11, 634–639. [Google Scholar] [CrossRef] [Green Version]
  33. Li, Z.; Makarov, D.; Keenan, J.; Molkov, V.V. CFD Study of the Unignited and Ignited Hydrogen Releases from Trpd under a Fuel Cell Car. In Proceedings of the 6st International Conference on Hydrogen Safety, Yokohama, Japan, 14–17 October 2015; Volume 131. [Google Scholar]
  34. Groth, K.M.; Hecht, E.S. HyRAM: A methodology and toolkit for quantitative risk assessment of hydrogen systems. Int. J. Hydrogen Energy 2017, 42, 7485–7493. [Google Scholar] [CrossRef] [Green Version]
  35. Alcock, J.; Shirvill, L.; Cracknell, R. Compilation of Existing Safety Data on Hydrogen and Comparative Fuels. European Integrated Hydrogen Project. 2001. Available online: http://www.eihp.org/public/documents/CompilationExistingSafetyData_on_H2_and_ComparativeFuels_S..pdf (accessed on 10 July 2021).
  36. Molkov, V. Fundamentals of Hydrogen Safety Engineering (Part 1 and 2). In Proceedings of the 4th European Summer School on Hydrogen Safety. 2012, pp. 114–124. Available online: www.bookboon.com (accessed on 10 July 2021).
Figure 1. 2D plots showing impinging hydrogen-jet concentration predictions from three turbulent models (Standard, RNG, and Realizable k-ε). Reproduced with permission [27]. Copyright 2019, Elsvier.
Wevj 12 00118 g001
Figure 2. Model of the outside parking garage; (a) vertical parking configuration; (b) leakage position in vertical parking configuration; (c) parallel parking configuration; (d) leakage position in parallel parking configuration.
Wevj 12 00118 g002
Figure 3. Simulated hydrogen mole fraction variation with time under different grid dimensions.
Wevj 12 00118 g003
Figure 4. Hydrogen mole fraction between 0.04 and 0.4 by volume for downward releases from 700 bar through 2 mm, 3 mm, and 4 mm in parallel (AC) and vertical (DF) parkingconfiguration after 2 s, 6 s, 10 s leakage.
Wevj 12 00118 g004aWevj 12 00118 g004b
Table 1. Numerical simulation of the jet model for hydrogen leakage from the storage tank.
Initial Reservoir ConditionNozzle ConditionsJet Conditions
Pressure: p0Effective nozzle area: A1Velocity: u 2 = u 1 + p 1 p 2 ρ 1 u 1
Temperature: T0Temperature:
T 1 = T 0 ( 2 / ( γ + 1 ) )
Enthalpy: h 2 = h 1 + 1 2 ( u 1 2 u 2 2 )
Volume: V0Pressure:
p 1 = p 1 ( T 1 / T 0 ) γ / ( γ 1 )
Temperature: T 2 = T 1 + 1 2 u 1 2 u 2 2 c p
Density: ρ 0 = p 0 R T 0 Density: ρ 1 = p 1 R T 1 Pressure: p 2 = p a
Total mass: m 0 = ρ 0 V 0 Sound speed: c 1 = γ R T 1 Density: ρ 2 = p 2 R T 2
Heat exchange coefficient: hwallVelocity: u 1 = c 1 Effective outlet area: A 2 = A 1 ρ 1 u 1 ρ 2 u 2
Enthalpy: h 1 = c p T 1 Mass flow: m ˙ 1 = ρ 1 u 1 A 1
Mass flow: m ˙ 1 = ρ 1 u 1 A 1
Table 2. Scenarios considered varying release diameter and parking configurations for unignited hydrogen release.
Case NumberParking ConfigurationRelease Diameter (mm)Initial Hydrogen Leakage Rate (kg/s)Leakage Time (s)by HyRAM(s)
AParallel Parking20.126166164 (1.2%)
BParallel Parking30.28370.572.9 (3.3%)
CParallel Parking40.4284441 (6.8%)
DVertical Parking20.126166164 (1.2%)
EVertical Parking30.28370.572.9 (3.3%)
FVertical Parking40.4284441 (6.8%)
G4.2 mm, 171 L at 35 MPa102.5100.66 (1.8%)
Publisher’s Note: MDPI stays neutral with regard to jurisdictional claims in published maps and institutional affiliations.

