Are Battery-Electric Trucks for 24-Hour Delivery the Future of City Logistics?—A German Case Study


Abstract
:
1. Introduction
- Are battery-electric HDTs able to compete with diesel HDTs in a cost-based comparison from the perspective of a LSP, assuming that only electric HDTs are able to deliver 24 hours a day?
- How might battery-electric HDTs diffuse in the LSP’s fleet and how might 24-hour delivery diffuse among the LSP’s customers; i.e., retail stores?
2. Theoretical Background
3. Methods and Data
3.1. Methods
3.2. Data and Assumptions
4. Results
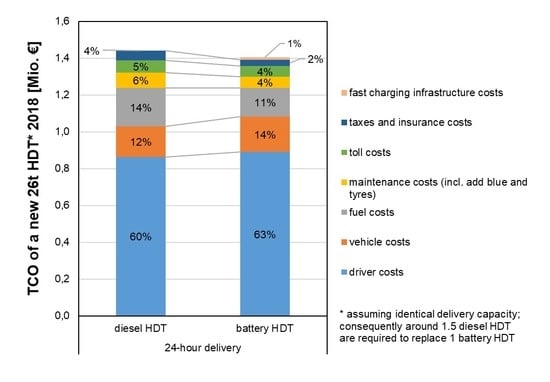
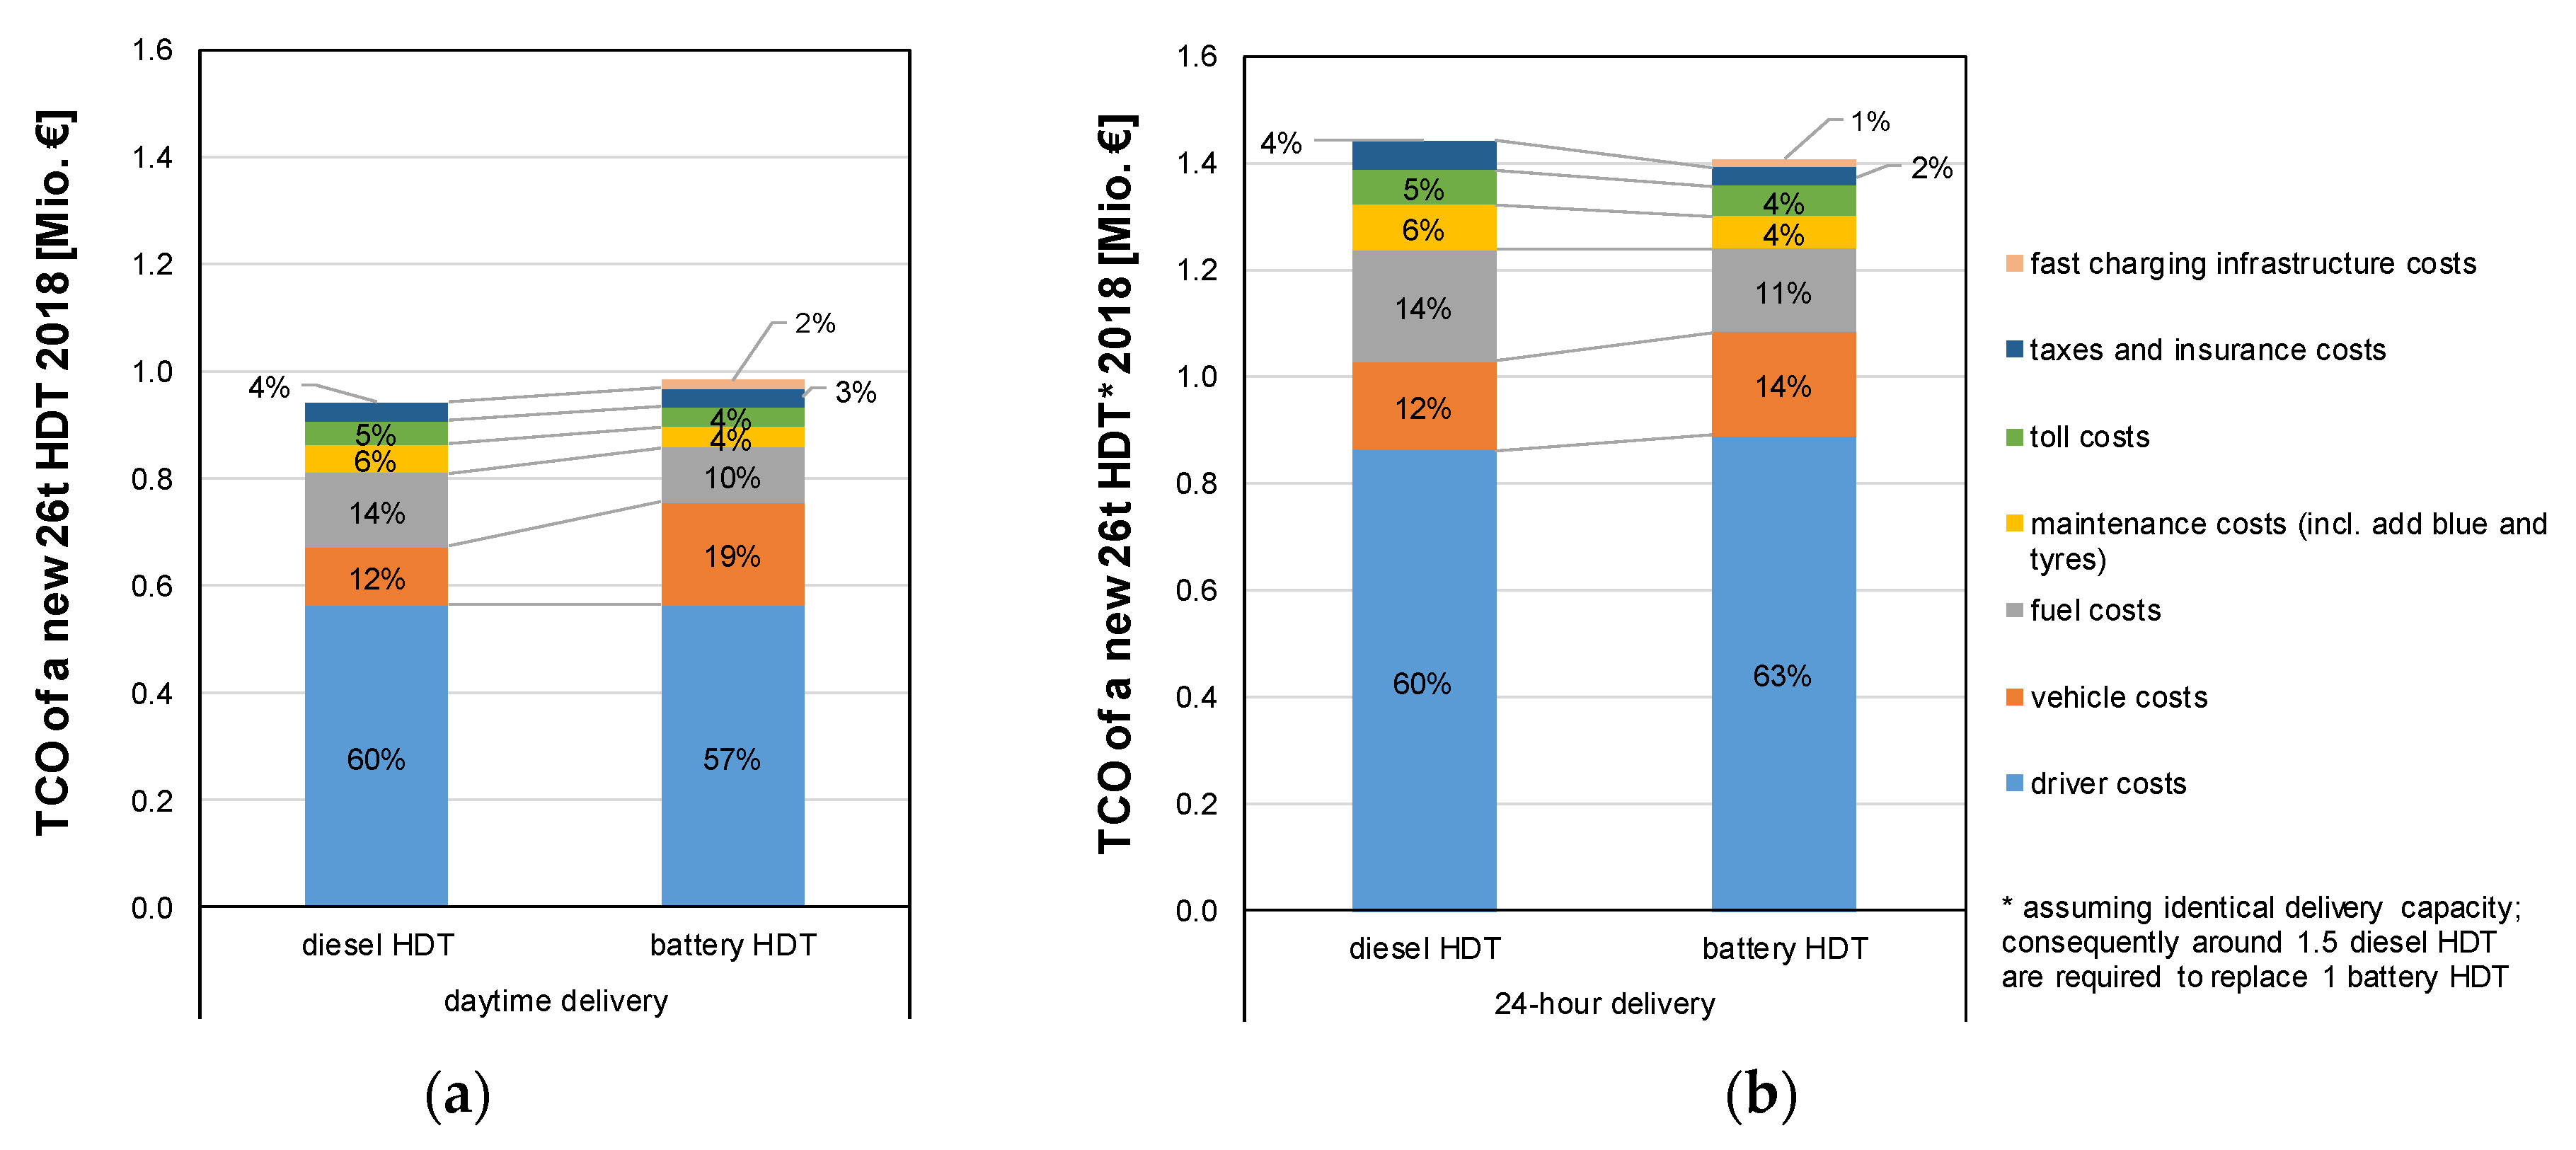
4.1. TCO
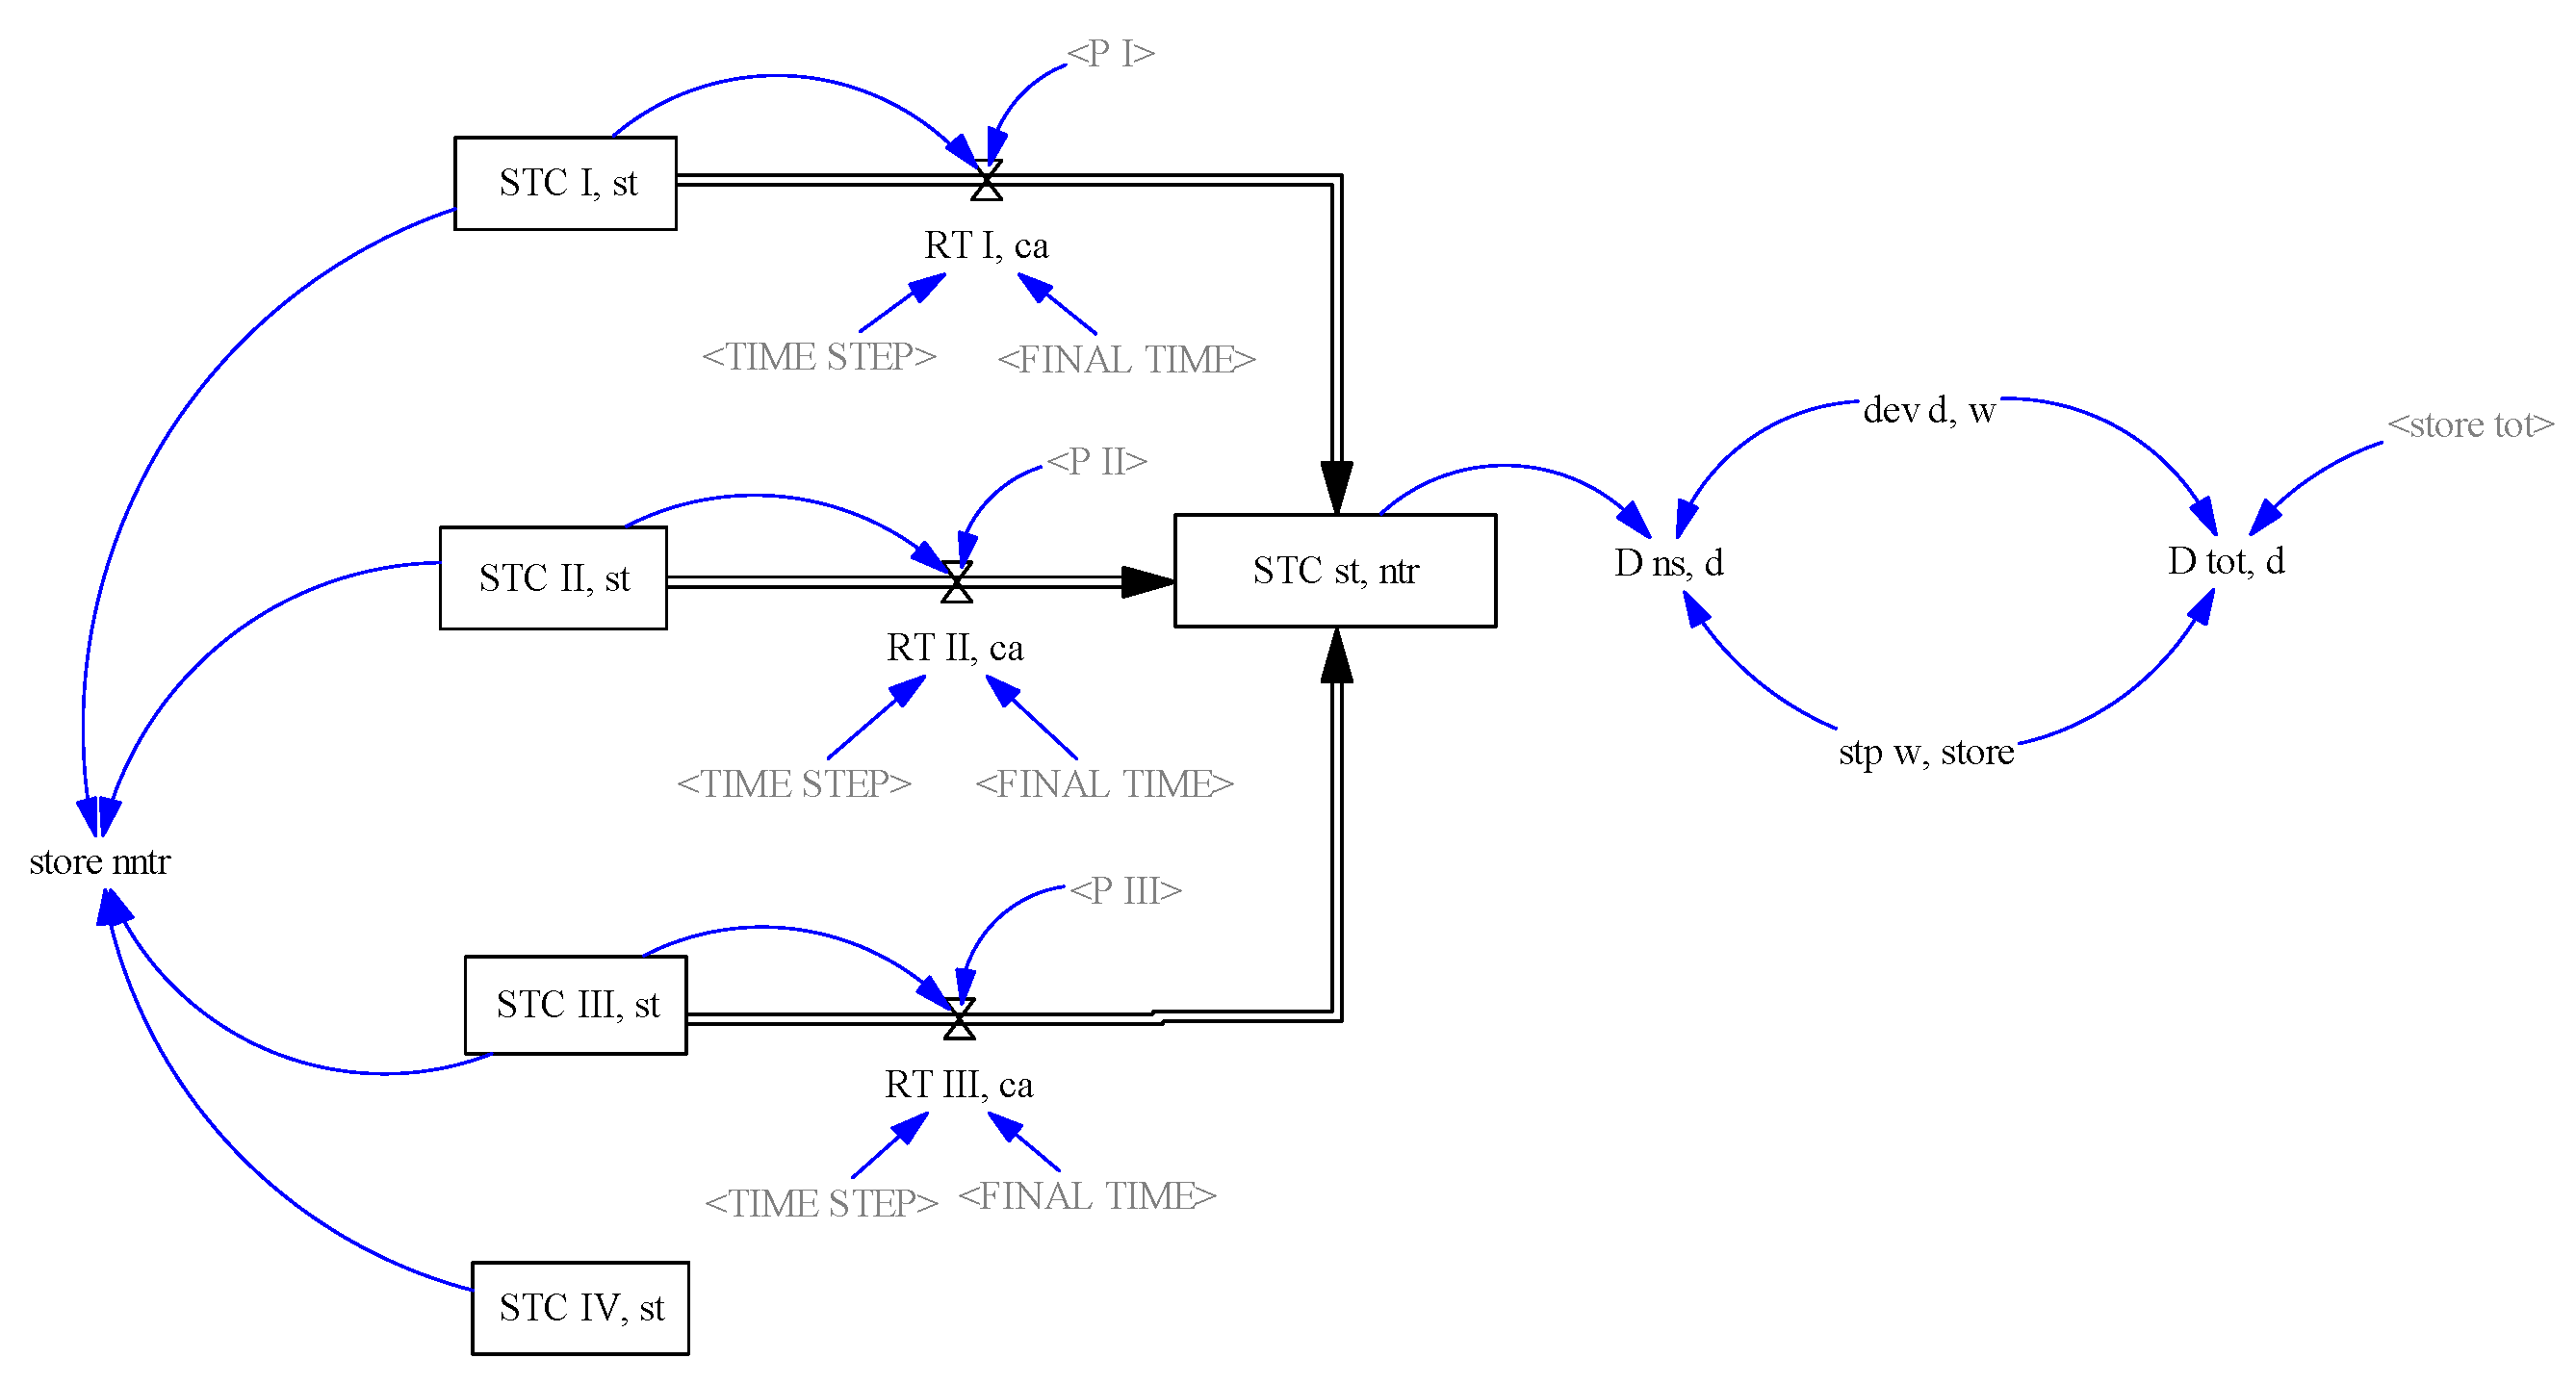
4.2. Diffusion
5. Discussion and Conclusions
Author Contributions
Funding
Conflicts of Interest
References
- European Commission. Impact Assessment. Annex to: The Communication on Thematic Strategy on Air Pollution and the Directive on “Ambient Air Quality and Cleaner Air for Europe”, SEC (2005) 1133; European Commission: Brussels, Belgium, 2005. [Google Scholar]
- European Environment Agency. National Emissions Reported to the Convention on Long-Range Transboundary Air Pollution (LRTAP Convention); European Environment Agency: Copenhagen, Denmark, 2018. [Google Scholar]
- Urban Access Regulations in Europe. Sadler Consultants Europe GmbH, European Commission. Available online: http://urbanaccessregulations.eu/ (accessed on 11 March 2019).
- Wissenbach, I. German Court Says Frankfurt Must Ban Older Diesel Cars; Thomson Reuters: New York, NY, USA, 2018. [Google Scholar]
- Weken, H.; Bestebreurtje, E.; Kroon, R. Electric Heavy Duty Trucks in Europe More and More Upcoming; EVS30: Stuttgart, Germany, 2017. [Google Scholar]
- Fu, J.; Jenelius, E. Transport efficiency of off-peak urban goods deliveries. A Stockholm pilot study. Case Stud. Transp. Policy 2018, 6, 156–166. [Google Scholar] [CrossRef]
- Holguín-Veras, J.; Ozbay, K.; Kornhauser, A.; Brom, M.A.; Iyer, S.; Yushimito, W.F.; Ukkusuri, S.; Allen, B.; Silas, M.A. Overall Impacts of Off-Hour Delivery Programs in New York City Metropolitan Area. Transp. Res. Rec. J. Transp. Res. Board 2011, 2238, 68–76. [Google Scholar] [CrossRef]
- Sánchez-Díaz, I.; Georén, P.; Brolinson, M. Shifting urban freight deliveries to the off-peak hours. A review of theory and practice. Transp. Rev. 2016, 37, 521–543. [Google Scholar] [CrossRef] [Green Version]
- Fishbein, M.; Ajzen, I. Belief, attitude, intention, and behavior: An introduction to theory and research. In Addison-Wesley Series in Social Psychology; Addison-Wesley Pub. Co.: Boston, MA, USA, 1975. [Google Scholar]
- Rogers, E.M. Diffusion of Innovations, 3rd ed.; The Free Press: New York, NY, USA; London, UK, 1983. [Google Scholar]
- Frambach, R.T.; Schillewaert, N. Organizational innovation adoption: A multi-level framework of determinants and opportunities for future research. J. Bus. Res. 2002, 55, 163–176. [Google Scholar] [CrossRef]
- Venkatesh, V.; Morris, M.G.; Davis, G.B.; Davis, F.D. User acceptance of information technology: Toward a unified view. Mis Q. 2003, 27, 425–478. [Google Scholar] [CrossRef] [Green Version]
- Davis, F.D. Perceived Usefulness, Perceived Ease of Use, and User Acceptance of Information Technology. Mis Q. 1989, 13, 319–340. [Google Scholar] [CrossRef] [Green Version]
- Hadwich, K. Entwicklung und Implementierung von Technologiebasierten Serviceinnovationen: Konzeptionierung eines Wirkungsmodells und Empirische Befunde aus Anbieter- und Kundenperspektive; Habilitationsschrift, Wirtschaftswissenschaftliche Fakultät der Universität Basel: Basel, Switzerland, 2008. [Google Scholar]
- Kamakura, W.A.; Mittal, V.; de Rosa, F.; Mazzon, J.A. Assessing the service-profit chain. Mark. Sci. 2002, 21, 294–317. [Google Scholar] [CrossRef]
- Stumpfe, J. Interdependenzen von Produkt- und Prozessinnovationen in Industriellen Unternehmen: Eine System-Dynamics-Basierte Analyse; Europäische Hochschulschriften. Reihe 5, Volks- und Betriebswirtschaft v. 3031; Peter Lang: Frankfurt am Main, Germany, 2003. [Google Scholar]
- Forrester, J.W. Industrial Dynamics; The MIT Press: Cambridge, MA, USA, 1961. [Google Scholar]
- Moutinho, L.; Witt, S.F. Application of cross-impact analysis in tourism. J. Travel Tour. Mark. 1994, 3, 83–96. [Google Scholar] [CrossRef]
- Osorio, S.; van Ackere, A.; Larsen, E.R. Interdependencies in security of electricity supply. Energy 2017, 135, 598–609. [Google Scholar] [CrossRef] [Green Version]
- Moll, C. Nachhaltige Dienstleistungsinnovationen in der Logistik: Ein Ansatz zur Entwicklung von Entscheidungsmodellen; Springer Fachmedien: Wiesbaden, Germany, 2019. [Google Scholar]
- Moll, C.; Kirsch, D.; Bernsmann, A. Geräuscharme Nachtlogistik. In Elektromobiler Wirtschaftsverkehr im urbanen Raum Elektromobil durch die Zukunft: Zukunftsszenarien und neue Dienstleistungen für die Elektromobilität 2030; Hawig, D., Ed.; Books on Demand: Norderstedt, Germany, 2017; pp. 210–231. [Google Scholar]
- Sterman, J.D. Business Dynamics: System Thinking and Modelling for a Complex World; McGraw-Hill: Boston, MA, USA, 2000. [Google Scholar]
- Morecroft, J.D.W. Strategic Modelling and Business Dynamics: A Feedback Systems Approach; John Wiley & Sons: Chichester, UK, 2007. [Google Scholar]
- BMF. AfA-Tabelle für die Allgemein Verwendbaren Anlagegüter (AfA-Tabelle “AV”): IV D 2-S 1551-188/00; Bundesministerium der Finanzen: Berlin, Germany, 2000.
- Thielmann, A. Energiespeicher-Roadmap (Update 2017). Hochenergie-Batterien 2030+ und Perspektiven zukünftiger Batterietechnologien; Fraunhofer Institute for Systems and Innovation Research ISI: Karlsruhe, Germany, 2017. [Google Scholar]
- Kirsch, D.; Bernsmann, A.; Moll, C.; Stockmann, M. Potenziale einer geräuscharmen Nachtlogistik. Potenziale einer geräuscharmen Nachtlogistik; Fraunhofer Verlag: Stuttgart, Germany, 2017. [Google Scholar]
- Özdemir, E.D. The Future Role of Alternative Powertrains and Fuels in the German Transport Sector—A Model Based Scenario Analysis with Respect to Technical, Economic and Environmental Aspects with a Focus on Road Transport. Ph.D. Thesis, University of Stuttgart, Forschungsbericht/Institut für Energiewirtschaft und Rationelle Energieanwendung, 108, Stuttgart, Germany, 2012. [Google Scholar]
- Ventana Systems. Vensim Software. Available online: https://vensim.com/vensim-software/ (accessed on 16 January 2020).
- Bieg, H.; Kußmaul, H.; Waschbusch, G. Investition; Vahlen: Munich, Germany, 2016. [Google Scholar]
- Strohhecker, J.; Sehnert, J. (Eds.) System Dynamics für die Finanzindustrie: Simulieren und Analysieren Dynamisch-Komplexer Probleme; Frankfurt School Verlag: Frankfurt am Main, Germany, 2008. [Google Scholar]
- McPhee, J.; Paunonen, A.; Ramji, T.; Bookbinder, J.H. Implementing off-peak deliveries in the greater Toronto area costs, benefits, challenges. Transp. J. 2015, 54, 473–495. [Google Scholar] [CrossRef]
- Ehmke, J.F.; Campbell, A.M.; Thomas, B.W. Vehicle routing to minimize time-dependent emissions in urban areas. Eur. J. Oper. Res. 2016, 251, 478–494. [Google Scholar] [CrossRef]
- Cattaruzza, D.; Absi, N.; Feillet, D.; González-Feliu, J. Vehicle routing problems for city logistics. J. Transp. Logist. 2017, 6, 51–79. [Google Scholar] [CrossRef]
- Gass, V.; Schmidt, J.; Schmid, E. Analysis of alternative policy instruments to promote electric vehicles in Austria. Renew. Energy 2014, 61, 96–101. [Google Scholar] [CrossRef]
- Hagman, J.; Ritzén, S.; Stier, J.J.; Susilo, Y.O. Total cost of ownership and its potential implications for battery electric vehicle diffusion. Res. Transp. Bus. Manag. 2016, 18, 11–17. [Google Scholar] [CrossRef] [Green Version]
- Gnann, T. Market diffusion of Plug-in Electric Vehicles and their Charging Infrastructure. Ph.D. Thesis, Karlsruhe Institute of Technology, Faculty of Economics, Karlsruhe, Germany, 2015. [Google Scholar]
- Blohm, H.; Lüder, K.; Schaefer, C. Investition, Schwachstellenanalyse des Investitionsbereichs und Investitionsrechnung; Vahlen: Munich, Germany, 2012. [Google Scholar]
- Al-Alawi, B.M.; Bradley, T.H. Review of hybrid, plug-in hybrid, and electric vehicle market modeling Studies. Renew. Sustain. Energy Rev. 2013, 21, 190–203. [Google Scholar] [CrossRef]
- Ben-Akiva, M.; Bierlaire, M. Discrete Choice Models with Applications to Departure Time and Route Choice. In Handbook of Transportation Science; Hall, R.W., Ed.; Kluwer Academic Publishers: Boston, MA, USA, 2003; pp. 7–37. [Google Scholar]
- Richter, C. Einfluss der Qualität des ÖPNV auf die Verkehrsmittelwahl im Regionalverkehr. Ph.D. Thesis, WWU Münster, Wissenschaftliche Schriften der WWU Münster, IV, 7, Münster, Germany, 2013. [Google Scholar]
- Thies, C.; Kieckhäfer, K.; Spengler, T.S. Market introduction strategies for alternative powertrains in long-range passenger cars under competition. Transp. Res. Part D Transp. Environ. 2016, 45, 4–27. [Google Scholar] [CrossRef]
- Statista. Umsatz im Lebensmitteleinzelhandel in Deutschland bis 2017. Available online: https://de.statista.com/statistik/daten/studie/161986/umfrage/umsatz-im-lebensmittelhandel-seit-1998/ (accessed on 19 March 2018).
- UBA. Schwere Nutzfahrzeuge. Available online: https://www.umweltbundesamt.de/themen/verkehr-laerm/emissionsstandards/schwere-nutzfahrzeuge (accessed on 15 September 2019).
- International Energy Agency. World Energy Outlook 2017; OECD Publishing: Paris, France, 2017. [Google Scholar]
- Kirsch, D.; Stockmann, M.; Bernsmann, A.; Moll, C.; Ruhnke, J.; Schumann, S. Geräuscharme Nachtlogistik—Geräuscharme Logistikdienstleistungen für Innenstädte durch den Einsatz von Elektromobilität (GeNaLog); Schlussbericht des Verbundprojekts: Dortmund, Germany, 2018. [Google Scholar]
- Gerbert, P.; Herhold, P.; Buchardt, J.; Schönberger, S.; Rechenmacher, F.; Kirchner, A.; Kemmler, A.; Wünsch, M. Klimapfade für Deutschland; The Boston Consulting Group; Prognos AG: Basel, Switzerland, 2018. [Google Scholar]
- Bäuml, S.; Brügelmann, R.; Gellrich, K.; von der Hellen, C.; Hentze, T.; King, C.C.; Lehmann, C.; Raber, H.G.; Voss, T.O.; Welling, B. Die Steuerbelastung der Unternehmen in Deutschland: Vorschläge für ein wettbewerbsfähiges Steuerrecht 2017/18; Institut der deutschen Wirtschaft Köln Medien: Berlin/Frankfurt am Main, Germany, 2017. [Google Scholar]
- Funke, S.Á.; Plötz, P.; Wietschel, M. Invest in fast-charging infrastructure or in longer battery ranges?: A cost-efficiency comparison for Germany. Appl. Energy 2019, 235, 888–899. [Google Scholar] [CrossRef]
- Wietschel, M. Machbarkeitsstudie zur Ermittlung der Potentiale des Hybrid-Oberleitungs-Lkw: Studie im Rahmen der Wissenschaftlichen Beratung des BMVI zur Mobilitäts- und Kraftstoffstrategie; Fraunhofer Institute for Systems and Innovation Research ISI: Karlsruhe, Germany, 2017. [Google Scholar]
- Hacker, F.; von Waldenfels, R.; Mottschall, M. Wirtschaftlichkeit von Elektromobilität in gewerblichen Anwendungen: Betrachtung von Gesamtnutzungskosten, ökonomischen Potenzialen und möglicher CO2-Minderung; Öko-Institut: Berlin, Germany, 2015. [Google Scholar]
- Jöhrens, J.; Rücker, J.; Bergk, F.; Schade, W.; Hartwig, J. Roadmap OH-Lkw: SWOT-Analyse: Strategische Analyse des OH-Lkw-Systems und konkurrierender Betriebskonzepte im Umfeld des schweren Straßengüterverkehrs; Institut für Energie- und Umweltforschung Heidelberg ifeu, M-Five: Heidelberg/Karlsruhe, Germany, 2017. [Google Scholar]
- Toll Collect. Maut-Tarife. Available online: https://www.toll-collect.de/de/toll_collect/bezahlen/maut_tarife/maut_tarife.html (accessed on 29 October 2018).
- Propfe, B.; Redelbach, M.; Santini, D.J.; Friedrich, H. Cost analysis of plug-in hybrid electric vehicles including maintenance & repair costs and resale values; EVS 26: Los Angeles, CA, USA, 2012. [Google Scholar]
- BGL. Kostenentwicklung im Güterkraftverkehr. Available online: http://www.bgl-ev.de/web/der_bgl/informationen/branchenkostenentwicklung.htm&v=2#form (accessed on 24 October 2018).
- Wietschel, M.; Moll, C.; Oberle, S.; Lux, B.; Timmerberg, S.; Ashley-Belbin, N. Klimabilanz, Kosten und Potenziale verschiedener Kraftstoffarten und Antriebssysteme für Pkw und Lkw: Endbericht; Gefördert vom Biogasrat+ e.V. Fraunhofer Institute for Systems and Innovation Research ISI: Karlsruhe, Germany, 2019. [Google Scholar]
- Thielmann, A.; Wietschel, M.; Funke, S.; Grimm, A.; Hettesheimer, T.; Langkau, S.; Loibl, A.; Moll, C.; Neef, C.; Plötz, P.; et al. Batterien für Elektroautos: Faktencheck und Handlungsbedarf; Fraunhofer Institute for Systems and Innovation Research ISI: Karlsruhe, Germany, 2020. [Google Scholar]
- UBA. Erneuerbare Energien in Zahlen. Available online: https://www.umweltbundesamt.de/themen/klima-energie/erneuerbare-energien/erneuerbare-energien-in-zahlen#statusquo (accessed on 21 January 2020).
- European Commission. Reducing CO2 emissions from heavy-duty vehicles—Climate Action—European Commission. Available online: https://ec.europa.eu/clima/policies/transport/vehicles/heavy_en (accessed on 20 January 2020).


| Truck Type | Diesel HDTs [EUR] | Battery-Electric HDTs [EUR] | Share in LSP’s Fleet [%] |
|---|---|---|---|
| Straight truck (max. GVW 18t) | 120,000 | 227,000 | 5 |
| Straight truck (max. GVW 26t) | 145,000 | 256,000 | 55 |
| Semi-trailer truck | 175,000 | 291,000 | 20 |
| Straight truck with full trailer | 200,000 | 320,000 | 20 |
| Parameter | Unit | Value |
|---|---|---|
| Total number of retail stores | # | 670 |
| Share of retail stores type I | % | 20 |
| Share of retail stores type II | % | 10 |
| Share of retail stores type III | % | 11 |
| Share of retail stores type IV | % | 59 |
| Weekly retail store demand | TU/(w∙store) | 115 |
| Weekly stops per store | Stop/(w∙store) | 9.4 |
| Annual demand increase | % | 0.5 |
| Duration of stop | h | 1 |
| thereof usable for charging | h | 1 |
| Duration of warehouse stop | h | 1.6 |
| thereof usable for charging | h | 1.3 |
| Share of trip in city | % | 20 |
| Share of trip out of city | % | 20 |
| Share of trip on highway | % | 60 |
| Average speed daytime in city | km/h | 30 |
| Average speed daytime outside city | km/h | 50 |
| Average speed daytime on highway | km/h | 70 |
| Average speed nighttime in city | km/h | 40 |
| Average speed nighttime out of city | km/h | 60 |
| Average speed nighttime on highway | km/h | 80 |
| Capacity straight truck (max. GVW 18t) | TU/trip | 28 |
| Capacity straight truck (max. GVW 26t) | TU/trip | 29 |
| Capacity semi-trailer truck | TU/trip | 44 |
| Capacity straight truck with full trailer | TU/trip | 58 |
| Parameter | Abbreviation | Unit | Value |
|---|---|---|---|
| Weighting risk | % | 25 | |
| Weighting transportation cost | % | 50 | |
| Weighting delivery quality | % | 25 | |
| Threshold customer risk | % | 100 | |
| Threshold customer transportation cost | % | 10 | |
| Construction costs store type I | EUR | 15,000 | |
| Construction costs store type II | EUR | 55,000 | |
| Anticipated payback period | a | 5 | |
| Innovation factor store type I | % | 2.5 | |
| Innovation factor store type II | % | 1.25 | |
| Innovation factor store type III | % | 0.625 |
| Parameter | Abbreviation | Unit | Diesel HDT | Battery-Electric HDT |
|---|---|---|---|---|
| Driver wage daytime | wday | EUR/h | 25 | |
| Driver wage nighttime | wnight | EUR/h | 28.8 | |
| Number of trips daytime | trday | #/d | 2.8 | 2.8 |
| Number of trips nighttime | trnight | #/d | - | 1.5 |
| Trip duration daytime | durday | h | 5.7 | |
| Trip duration nighttime | durnight | h | 5.4 | |
| Days in use per year | diu | d/y | 306 | |
| Company tax rate | ctr | % | 30 | |
| Operating life | n | y | 9 | |
| Common interest rate | i | % | 6.5 | |
| Annuity present value factor | APV | - | 6.7 | |
| Vehicle list price | LP(t)veh | EUR | 145,000 | 256,000 |
| Vehicle sales price | SP(t)veh | EUR | 11,100 | 18,700 |
| Fuel consumption | fc | l/km or kWh/km | 0.28 | 1.26 |
| Fuel price | fp | EUR/l or EUR/kWh | 1.01 | 0.17 |
| Maintenance and repair costs | m | EUR/km | 0.09 | 0.05 |
| Tire costs | ty | EUR/km | 0.04 | |
| Toll costs | tl | EUR/km | 0.09 | 0.08 |
| Vehicle kilometers traveled | VKT | km/y | 100,000 | 138,000 |
| Tax | tx | EUR/y | 506 | |
| Insurance costs | ins | EUR/y | 6729 | |
| List price fast charging point | LP(t)infra | EUR | - | 79,500 |
| Maintenance and repair costs Infrastructure | minfra | EUR/y | - | 2500 |
| Operating life infrastructure | l | y | - | 15 |
© 2020 by the authors. Licensee MDPI, Basel, Switzerland. This article is an open access article distributed under the terms and conditions of the Creative Commons Attribution (CC BY) license (http://creativecommons.org/licenses/by/4.0/).
Share and Cite
Moll, C.; Plötz, P.; Hadwich, K.; Wietschel, M. Are Battery-Electric Trucks for 24-Hour Delivery the Future of City Logistics?—A German Case Study. World Electr. Veh. J. 2020, 11, 16. https://doi.org/10.3390/wevj11010016
Moll C, Plötz P, Hadwich K, Wietschel M. Are Battery-Electric Trucks for 24-Hour Delivery the Future of City Logistics?—A German Case Study. World Electric Vehicle Journal. 2020; 11(1):16. https://doi.org/10.3390/wevj11010016
Chicago/Turabian StyleMoll, Cornelius, Patrick Plötz, Karsten Hadwich, and Martin Wietschel. 2020. "Are Battery-Electric Trucks for 24-Hour Delivery the Future of City Logistics?—A German Case Study" World Electric Vehicle Journal 11, no. 1: 16. https://doi.org/10.3390/wevj11010016