Article

Benefits of Electrified Powertrains in Medium- and Heavy-Duty Vehicles

Argonne National Laboratory, 9700 S. Cass Ave., Lemont, IL 60439, USA
*
Author to whom correspondence should be addressed.
World Electr. Veh. J. 2020, 11(1), 12; https://doi.org/10.3390/wevj11010012
Submission received: 17 October 2019 / Revised: 2 January 2020 / Accepted: 16 January 2020 / Published: 18 January 2020

Abstract

:
The benefits of electrified powertrains for light-duty vehicles are well understood, however sufficient published information is not available on the benefits of advanced powertrains on the various types of medium and heavy duty vehicles. Quantifying the benefits of powertrain electrification will help fleet operators understand the advantages or limitations in adopting electrified powertrains in their truck fleets. Trucks vary in size and shape, as they are designed for specific applications. It is necessary to model each kind of truck separately to understand what kind of powertrain architecture will be feasible for their daily operations. This paper examines 11 types of vehicles and 5 powertrain technology choices to quantify the fuel saving potential of each design choice. This study uses the regulatory cycles proposed by the US Environmental Protection Agency (EPA) for measuring fuel consumption.

1. Introduction

Medium- and heavy-duty (MD-HD) vehicles account for over 26% of the petroleum consumption in the United States [1]. Vehicle inventory and use survey data provides the numbers of various types of trucks in the United States and their daily driving requirements [2]. This information guides the vehicle selection in this study. Based on this data, several classes and purposes were shortlisted. Together, these vehicles represent over 50% of the medium- and heavy-duty vehicles on U.S. roads. Table 1 lists the vehicles and their purposes. The models were built using the library files available in Autonomie [3], a simulation tool developed by Argonne National Laboratory capable of simulating various kinds of vehicles. The design requirements and performance of these trucks vary significantly. The power ratings of truck engines are easy to find, but trucks’ performance capabilities are not always advertised. For this study, we needed to determine the cargo and performance capabilities of each vehicle in order to design comparable electrified variants that can perform the same duties as the baseline vehicle. Each conventional vehicle is modelled in Autonomie using publicly available information. Cargo-carrying capability, grade capability, acceleration capability and possibly many more factors can be used to define the unique demands on a truck. Benchmarking tests are then simulated to obtain performance data. The details of these tests appear in a previous paper [4] about fuel-cell vehicle sizing.
Several efforts have been already made to understand the potential of fuel savings in these trucks. Real world operation is recorded and shared from FleetDNA database for many fleets across US [5]. Other studies have evaluated identifying the impact of individual technologies on specific vehicles. Some of these projects evaluated prototype vehicles tailored for a specific customer [6]. Past work has also quantified the impact of aerodynamic factors and rolling resistance on parcel delivery trucks [7]. Supertruck teams worked on doubling the fuel economy of class 8 sleeper trucks by improving several vehicle characteristics [8]. Cummins had explored the use of plug-in hybrid architectures for medium and heavy trucks [9]. The International Council on Clean Transportation has shown the potential of fuel savings in heavy duty trucks for various global markets [10].
In most of these existing studies, the vehicles being compared are not functionally equivalent. They may not carry the same load or achieve the same performance. Real-world evaluations normally measures fuel saving achieved against the old vehicles they being replaced. It is a good way to show the benefits of a new vehicle, but it is not a fair method for examining the fuel saving potential of technologies. This paper presents a fair comparison of 5 different powertrains across several vehicle classes by comparing vehicles that are designed to carry the same cargo and achieve the same performance. On light-duty vehicles similar studies have been conducted before [11], but this would be one of the first such efforts for the medium- and heavy-duty vehicle segment in US.

2. Powertrain Component Sizing
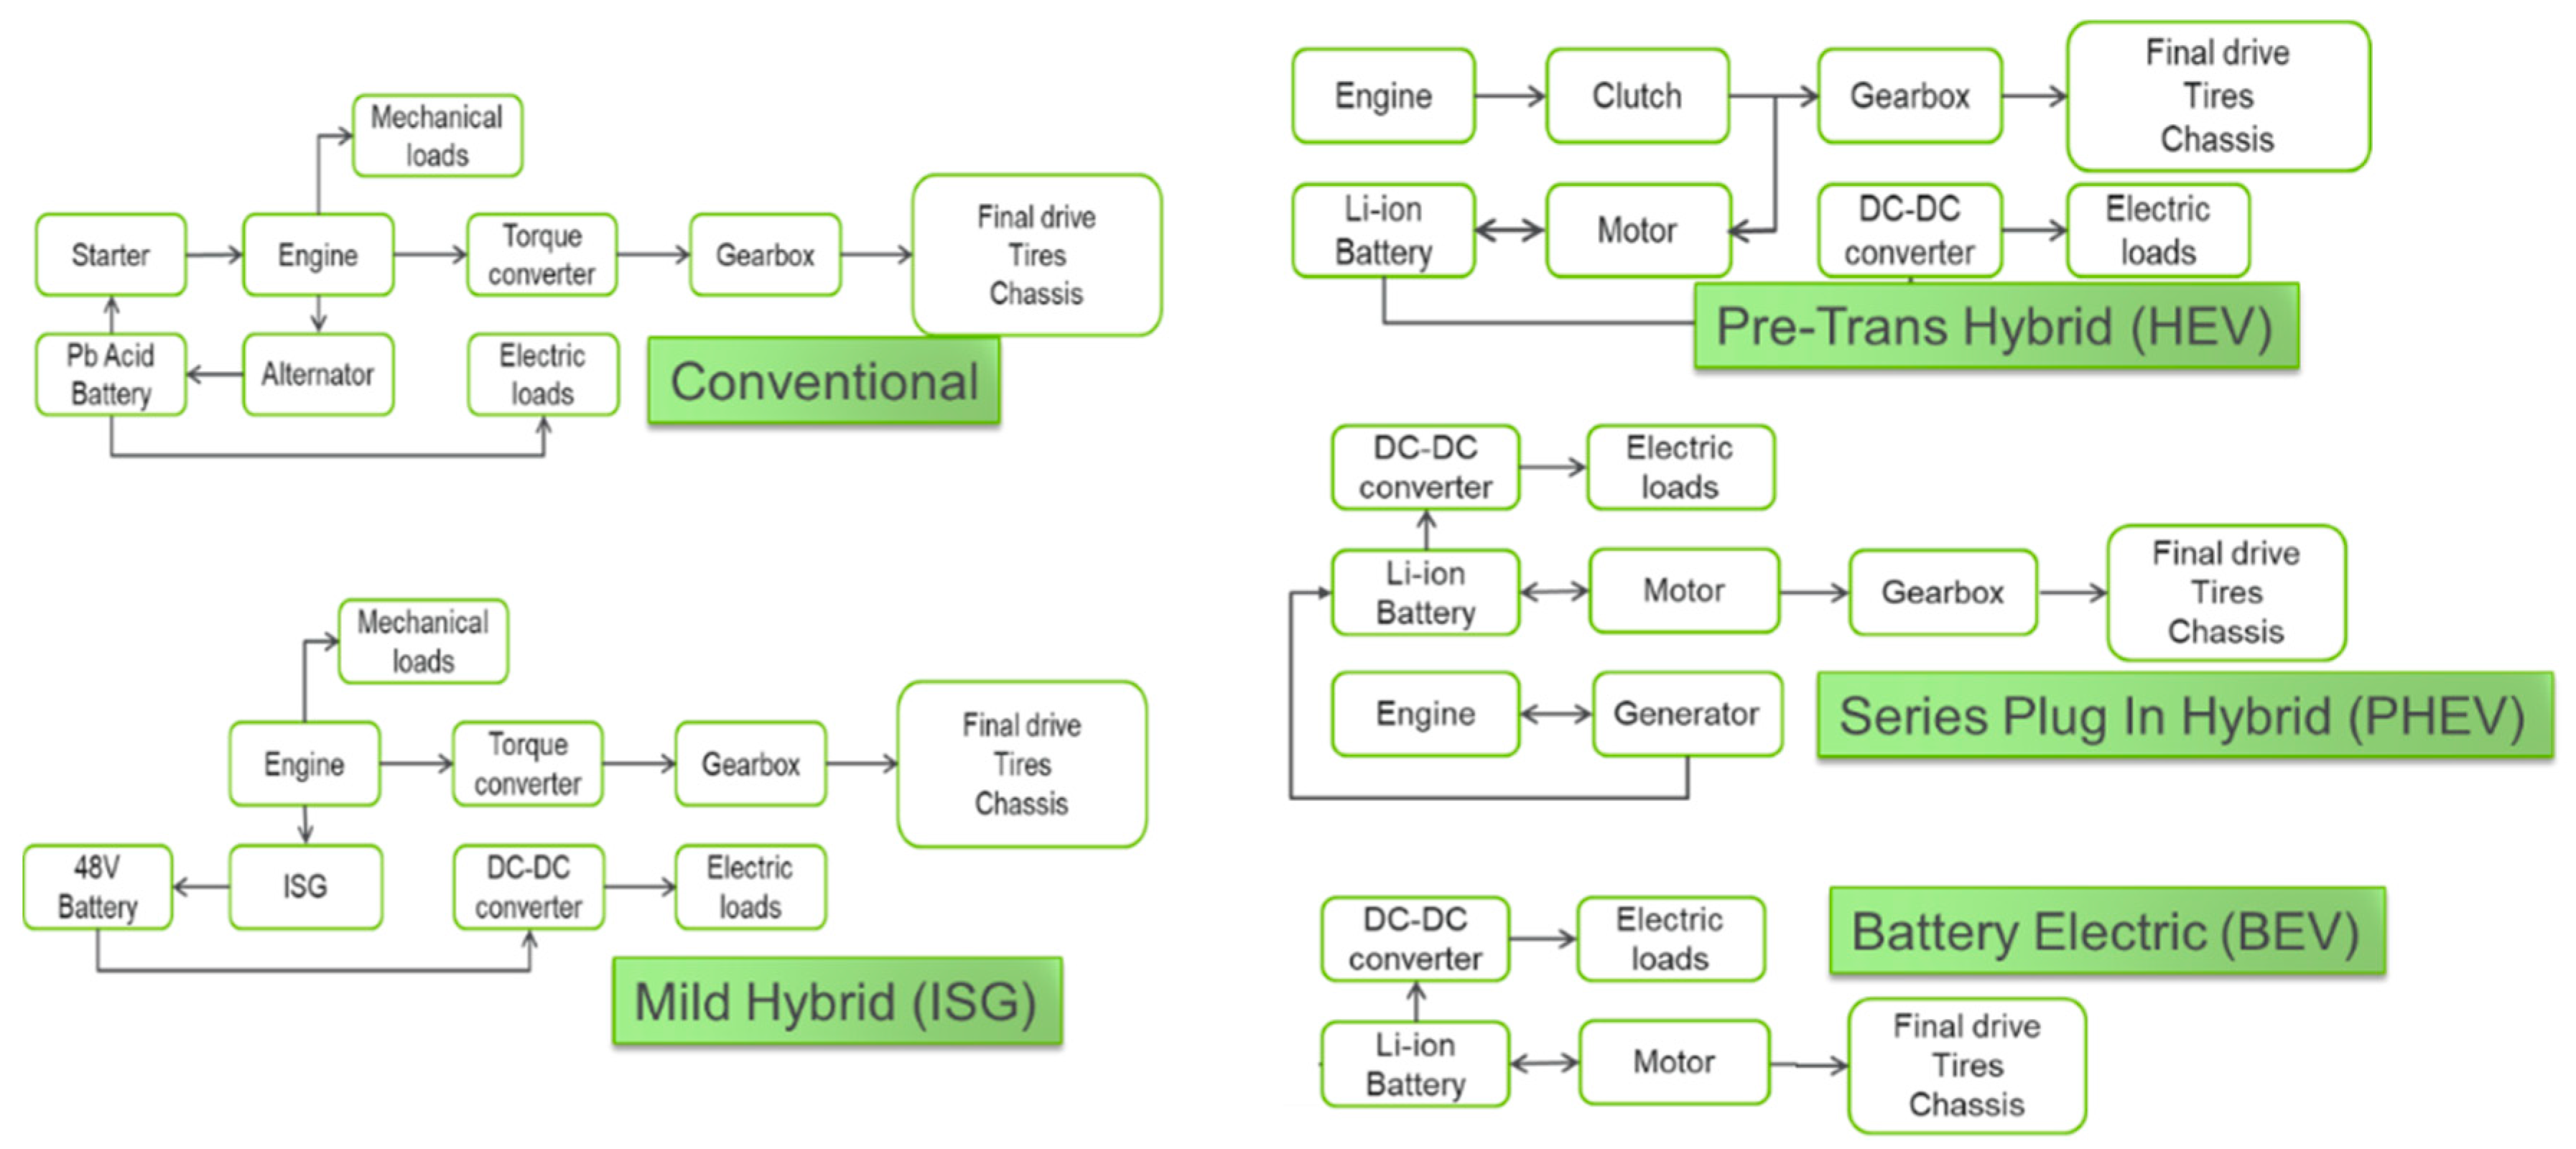
2.1. Architectures

The five powertrain architectures considered in this work is described below:
  • Conventional (Conv) powertrain with a diesel engine;
  • Mild hybrid with start-stop system using an integrated starter generator (ISG);
  • Strong hybrid electric vehicle (HEV) with a motor that will assist the engine during a launch and enable regenerative braking;
  • Series plug-in electric vehicle (PHEV), which can drive half of the daily driving requirements with the energy from an onboard battery pack;
  • Battery-powered electric vehicle (BEV), which can drive the entire desired daily driving range with energy from an onboard battery pack.
An approximate representation of the component layout is shown Figure 1. More details on these architectures and component assumptions are available in Autonomie.
All engines considered in this study are diesel powered. Gasoline and natural gas powered variants were modelled for certain classes but are not included in this paper. For this study, it is assumed that the body and glider of the conventional vehicle remains unchanged when powertrain changes are implemented. For smaller trucks, this approach is reasonable enough to give a good estimate of the power and energy requirements of the vehicles. In the cases of heavy vehicles with a longer range, an additional scenario is considered. Several manufacturers have announced plans to build class 8 BEV tractors. All of these proposed vehicles have much better aerodynamics than baseline conventional vehicles, which reduces the propulsion power requirement during highway driving. To represent such a vehicle, the “Sleeper Aero” category was added as a class 8 truck. It represents a present day truck with aggressive aerodynamic improvements [12]. We expect to achieve 28% reduction in aerodynamic drag in this case. Some OEMs claim even lower drag coefficient (Cd) values by using custom trailers and devices such as camera-based rearview mirrors. This study uses a more conservative estimate.

2.2. Sizing Requirements and Approach

This study assumes that a truck with an electrified powertrain will be functionally equivalent to or better than its conventional counterpart. It should be able to carry the same cargo over the desired daily driving distance in the same amount of time as a conventional vehicle. To ensure this, a few performance parameters are identified as performance benchmarks. These parameters are (a) 0–30 mph acceleration time, (b) 0–60 mph acceleration time, (c) maximum sustainable speed at 6% grade, and (d) sustained cruising speed at highway conditions. A summary of the performance requirements is shown in Table 2.
These values were estimated by simulating the conventional vehicle models for performance tests. It should be noted that the actual vehicle may have been originally designed with very different functional considerations. Sizing alternate powertrains for comparable performance based on these parameters is just one way to ensure a fair comparison between powertrains.
Component size for each powertrain is guided by unique requirements. The sizing procedure is explained in a previous work [5], and the dependence of each component on the requirements is summarized in Table 3. Engine power is determined by the grade climbing requirements in the case of heavy-duty trucks, which are designed to haul large loads. A class 8 sleeper truck is a good example of an application where continuous operation requirements, such as highway driving and grade climbing, are a lot more important than acceleration performance. For this study, grade climbing capability is tested using an 11-mile drive on a 6% grade. Conventional, ISG and HEVs require an engine sized big enough to meet the grade power requirements. Although HEVs have the option of assisting the engine using the motor, the relatively small battery size makes it impossible to sustain that assistance for the entire 11 miles. Once the battery runs out of energy, the engine still has to provide sufficient power to drive the vehicle. Hybridizing such trucks may even require the use of a larger engine, as more weight is added to the truck in the form of motor and batteries. PHEVs have a larger battery pack and can ameliorate this issue. The batteries in PHEVs are large enough to meet part of the power requirement during the entire grade test. In this case, the engine can be sized to meet the remaining load on grade tests or to meet continuous power needed to cruise at highway speeds.
Acceleration is a critical requirement for smaller trucks because they have to drive alongside other light-duty vehicles in urban environments. They are also likely to have a higher power-to-weight ratio compared to heavier trucks. In this case, hybridizing offers the chance to downsize the engine and augment the propulsion power using a motor. Trucks in the class 2–4 segment are examples of this.
PHEVs and BEVs see significant weight increase due to the on-board battery requirement. However, they are sized to carry the same payload, so functionally they are still as useful as the conventional vehicles. The cargo volume was not considered in this work, as we expect the batteries to be stored along the side rails or under the body of the truck. Figure 2 highlights the weight increase for PHEVs and BEVs.
Engine downsizing is possible for hybrid vehicles, but not in all applications. For certain applications such as large sleeper trucks, the maximum power requirement is experienced during prolonged grade climbing. In such cases, hybridization will not help downsizing the engine. So even in some medium duty applications (e.g., class 5 utility) where grade speed is critical, we see little change in engine size with hybridization. For PHEVs, we expect the grade can be negotiated with help from battery. The grade test is initiated with 70% charge in battery, and this helps in downsizing the engine. The engine power output for various applications are shown in Figure 3.
The electric motor in an ISG is used to start the engine and provide auxiliary electric power in an efficient manner. The HEV motor is sized to achieve a higher level of regenerative braking in the transient cycle. This cycle is used because it is the only transient speed cycle used in the proposed regulatory framework put forward by the US Environmental Protection Agency (EPA). The motor power for the various vehicles is shown in Figure 4.
For PHEVs and BEVs, the motor is sized to meet the performance requirements. This necessitates the use of electric machines with continuous power outputs comparable to those of the baseline engine. For these vehicles, the battery is sized for the driving range. For heavy-duty applications, the battery packs used in PHEVs and BEVs are assumed to be quite similar and they are assumed to use 90% of the total stored energy for driving the maximum electric range. The results for the total battery energy required for these vehicles are shown in Figure 5. The 65 mph driving cycle from EPA is the most demanding of the three regulatory cycles proposed by EPA. It is observed that that use of a high-speed cycle for range estimation results in oversizing of battery for vehicles with poor aerodynamic characteristics e.g., delivery vans. To have a conservative estimate of the battery size, the range is measured using EPA’s 65 mph drive cycle.
Battery energy in HEVs are around 5–8 kWh, and ISGs have a battery pack under 1 kWh. Those packs are designed to provide the necessary power to the motor for very short amount of time.

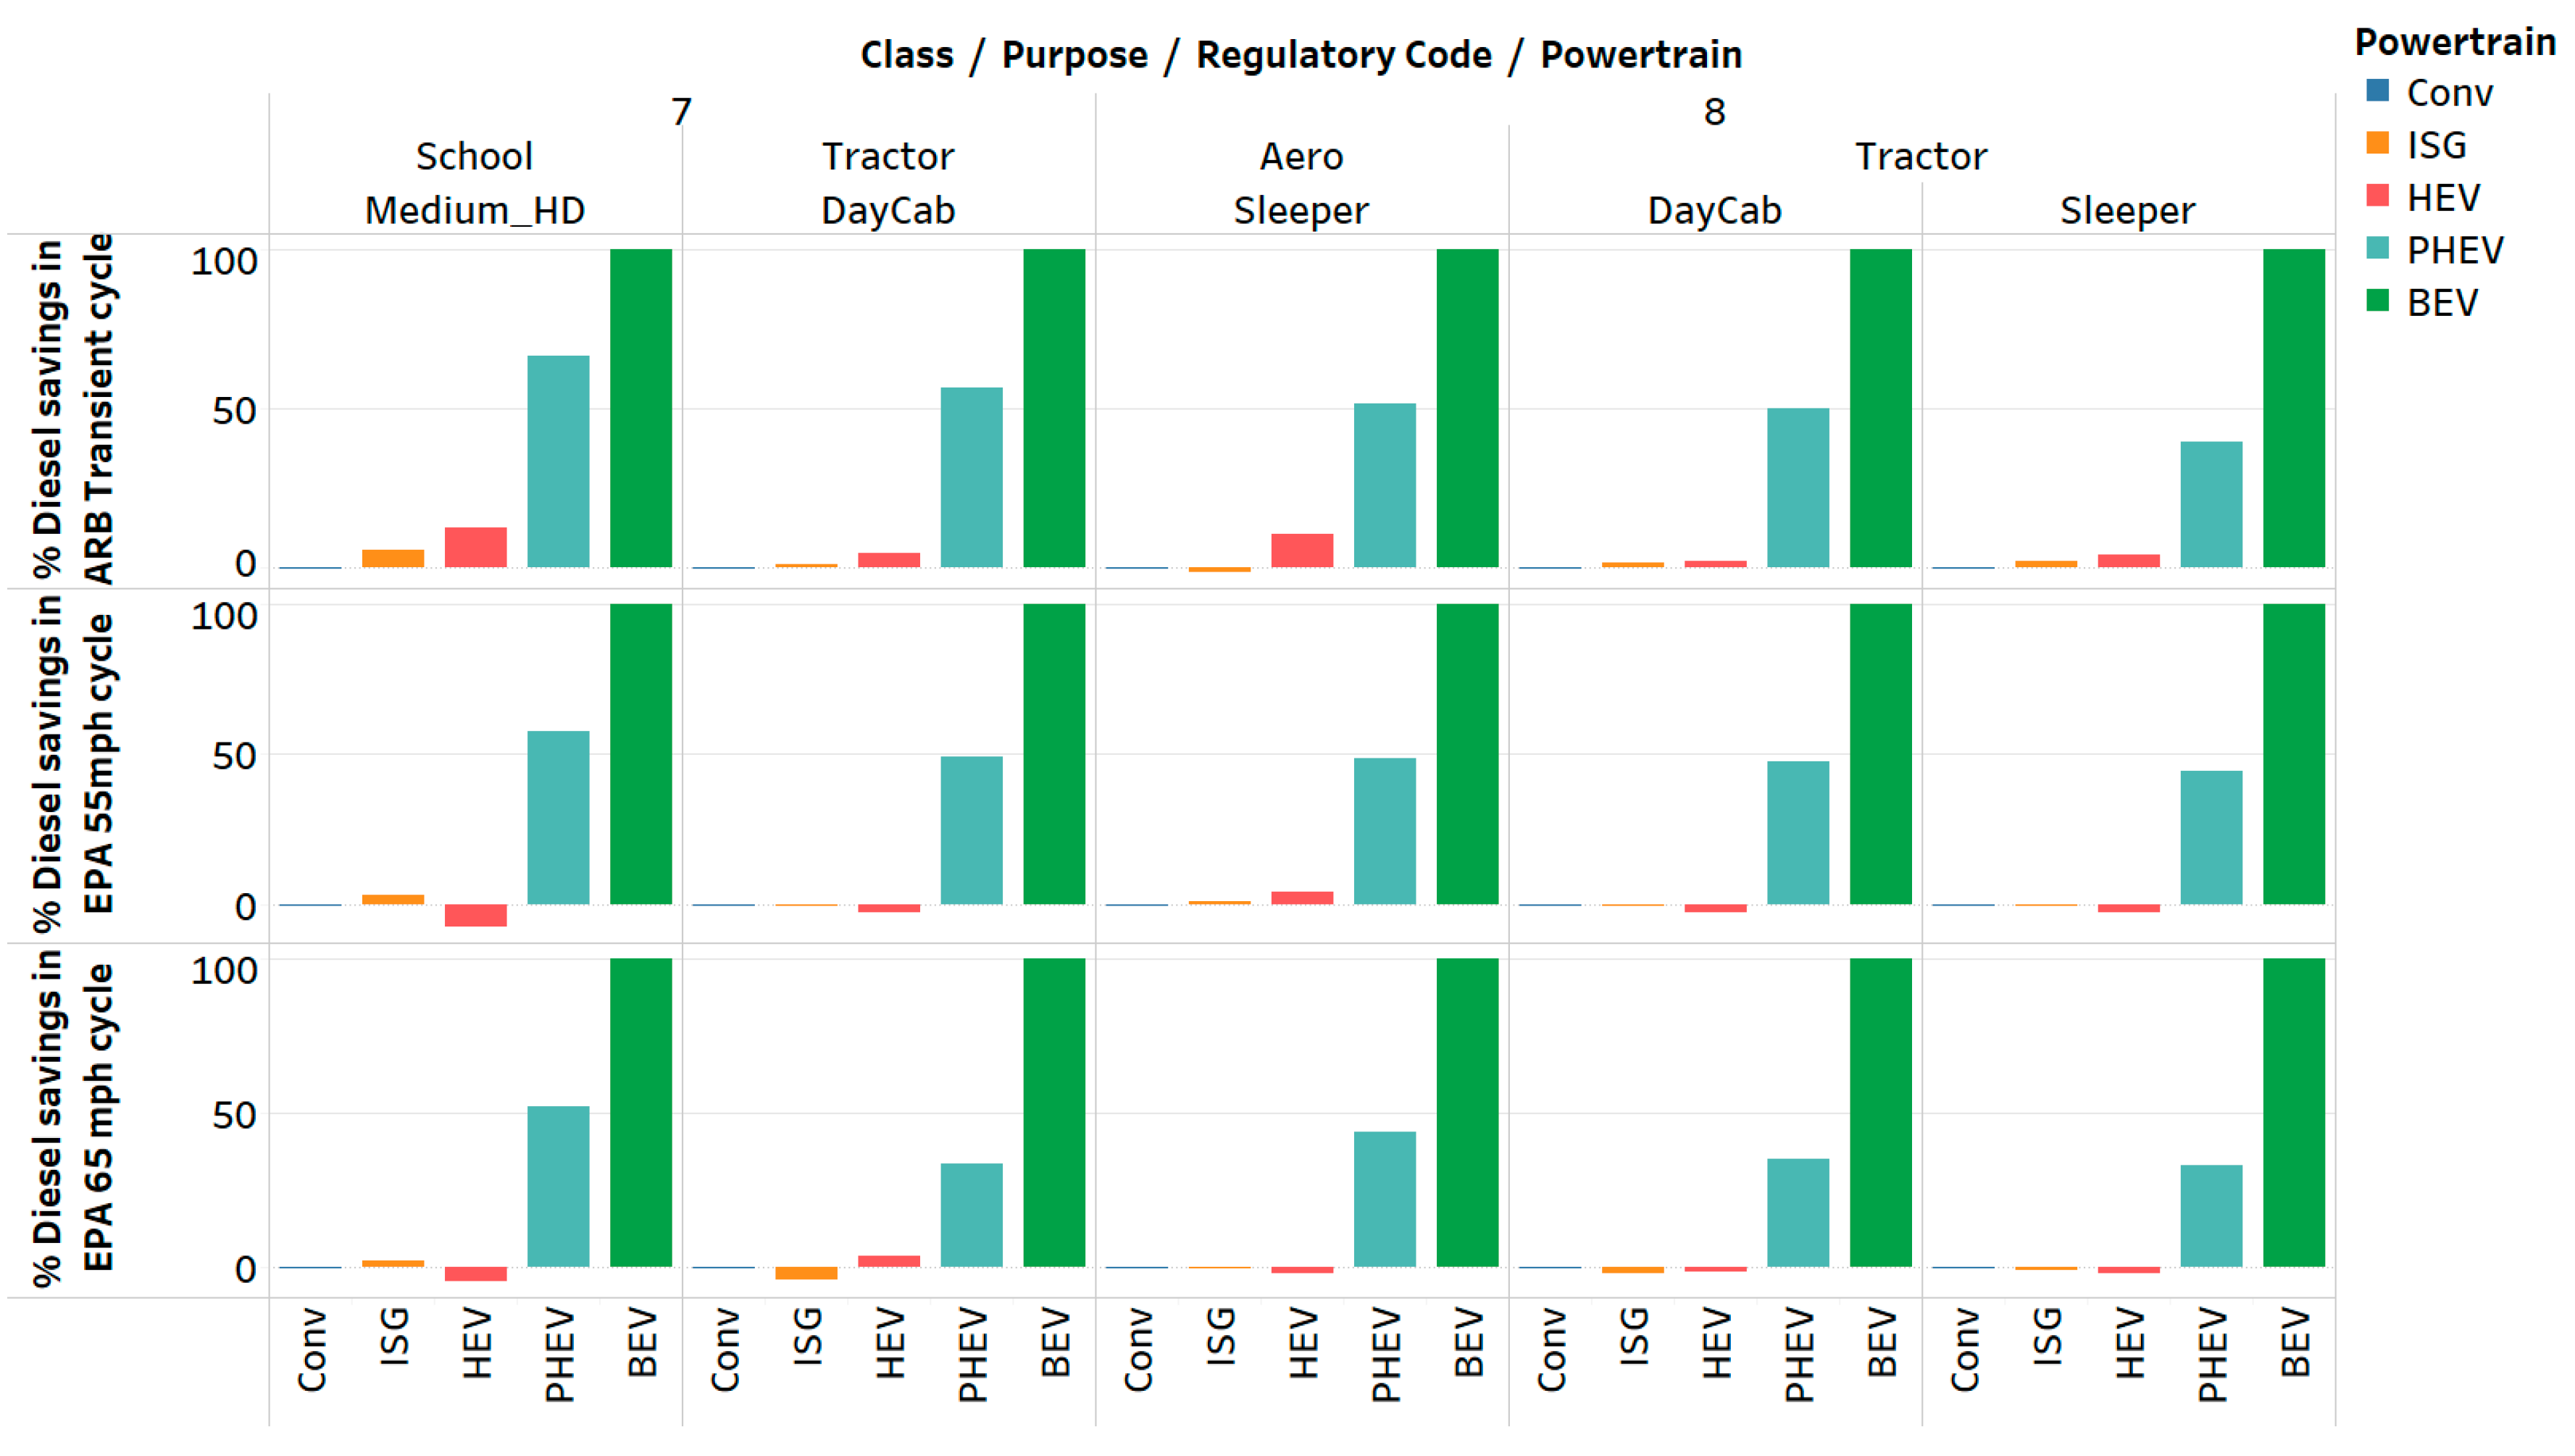
3. Fuel Consumption Comparison

US EPA has put forward regulatory drive cycles for medium and heavy duty vehicles. The test procedure from EPA is applicable only to conventional vehicles, and it could be difficult to apply it to PHEVs and BEVs in a fair manner. In this study, we quantify the petroleum displacement potential of advanced powertrains using an approach explained in a previous work [13]. Every vehicle is driven over the desired daily driving distance in each of the three regulatory cycles. One of those cycles is a transient cycle, which allows the ISGs and HEVs to demonstrate their potential in urban driving conditions. The other two are highway cycles at 55 mph and 65 mph, where conventional diesel trucks can achieve their best performance. These cycles are shown in Figure 6. The appropriate powertrain for each case can be identified by analyzing these results for every class and vocation.
The fuel saving potential of various powertrains for medium-duty trucks is shown in Figure 6. ISGs get only about 5% benefit at most in transient driving conditions, and do not show any benefit in highway driving. HEVs can obtain a substantial 20%–30% saving in medium-duty applications during the transient drive cycle. On high-speed cycles without any stops or appreciable regenerative braking, the benefit drops to less than 15%. This shows that HEVs are a technically sound solution for small trucks operating under urban driving conditions.
The fuel saving potential of various powertrains for medium duty trucks is shown in Figure 7. It shows 20%–30% savings are possible for these trucks in ARB transient cycle. On steady speed cycles, the benefits drop to under 10%, and can be attributed mostly to the engine downsizing.
Figure 8 shows that HEVs gain about 15% savings in overall fuel usage in urban driving in the cases of school buses. ISGs don’t show any appreciable fuel savings in this category. PHEVs or BEVs are needed to achieve significant fuel savings in heavy-duty vehicles. PHEVs designed in the way described in this study have the potential to displace 40% or more fuel in all the applications. In the case of many small trucks, 100% fuel displacement is achieved for urban driving conditions.
This would indicate that sizing the battery for the most demanding driving conditions is a very conservative approach, and it could be relaxed. On the other hand, there are several heavy trucks for which PHEVs produce only a 40% savings in fuel. BEVs are able to run the daily desired range in all three cycles and achieve 100% petroleum displacement as expected.

4. Conclusions and Next Steps

This study shows that HEVs are an attractive choice for medium-duty trucks that operate mostly in urban conditions. For other, heavier vehicles or those operating mostly on highways, fuel savings can be achieved by using PHEV or BEV variants.
Having a common sizing approach across all medium- and heavy-duty vehicles ensures a fair comparison for most applications. There could be some limitations for this approach. For example, Class 4 walk-in trucks are typically not designed for highway driving. They are quite boxy, as the design objective is to maximize the cargo volume, while keeping the truck short enough to make it maneuverable in urban driving conditions. The sizing approach in this paper will require a PHEV in this category to have an engine powerful enough to sustain highway driving. This might result in an engine that is not fully utilized in real-world conditions. The next step in improving sizing logic would be to look at real world driving conditions for each of these trucks and design the powertrain specifically for those application-specific requirements.
It should be noted that none of these vehicles were optimized for fuel economy. This study focused on a rule-based sizing logic likely to produce an economically viable design. Optimizing the powertrain for fuel economy will be an appropriate follow-up work.

Author Contributions

R.V. carried out all simulations and analysis. A.R. provided guidance on the classes of vehicles to analyze and helped with improving the analysis involved in this paper. All authors have read and agreed to the published version of the manuscript.

Funding

This work was supported by the US Department of Energy (DOE), Vehicle Technology Office, under the direction of J. Ward and R. Nealer, under contract DE-AC02-06CH11357.

Acknowledgments

This work was supported by the US Department of Energy (DOE), Vehicle Technology Office, under the direction of J. Ward and R. Nealer, under contract DE-AC02-06CH11357. The submitted manuscript has been created by UChicago Argonne, LLC, Operator of Argonne National Laboratory (“Argonne”). Argonne, a DOE Office of Science laboratory, is operated under Contract No. DE-AC02-06CH11357. The U.S. Government retains for itself, and others acting on its behalf, a paid-up, nonexclusive, irrevocable worldwide license in said article to reproduce, prepare derivative works, distribute copies to the public, and perform publicly and display publicly, by or on behalf of the Government.

Conflicts of Interest

The authors declare no conflict of interest.

References

  1. Energy Information Administration. Annual Energy Outlook. 2019. Available online: http://www.eia.gov/forecasts/aeo/ (accessed on 1 September 2018).
  2. United States Census Bureau. Vehicle Inventory and Use Survey. 2002. Available online: http://www.census.gov/svsd/www/vius/2002.html (accessed on 1 September 2018).
  3. Argonne National Laboratory. Autonomie. Available online: www.autonomie.net (accessed on 1 August 2017).
  4. Marcinkoski, J. Driving an Industry: Medium and Heavy Duty Fuel Cell Electric Truck Targets. In Proceedings of the EVS29 Symposium, Montreal, QC, Canada, 19–22 June 2016. [Google Scholar]
  5. National Renewable Research Laboratory. FleetDNA Database. Available online: http://www.nrel.gov/transportation/fleettest_fleet_dna.html (accessed on 15 November 2018).
  6. Barnitt, R. FedEx Express Gasoline Hybrid Electric Delivery Truck Evaluation: 12-Month Report. Available online: https://www.nrel.gov/docs/fy11osti/48896.pdf (accessed on 5 October 2019).
  7. Wang, L.; Duran, A.; Kelly, K.; Koana, A.; Prohaska, R. The Evaluation of the Impact of New Technologies for Different Powertrain Medium-Duty Trucks on Fuel Consumption (No 2016-01-8134). SAE Technical Paper, 27 September 2016. [Google Scholar] [CrossRef]
  8. US DOE. Supertruck Project. Available online: https://www.energy.gov/eere/articles/supertruck-making-leaps-fuel-efficiency (accessed on 9 January 2019).
  9. Cummins Working on Two Medium- And Heavy-Duty PHEV Projects; Class 6 Truck, Class 7 And 8 Buses. Available online: https://www.greencarcongress.com/2016/11/20161103-cummins.html (accessed on 9 January 2019).
  10. ICCT. Estimating the Fuel Effieicny Technology Potential of Heavy Duty Trucks in Major Markets around the World. Available online: https://www.globalfueleconomy.org/media/404893/gfei-wp14.pdf (accessed on 9 January 2019).
  11. Islam, E.; Kim, N.; Moawad, A.; Rousseau, A. An Extensive Study on Sizing, Energy Consumption, and Cost of Advanced Vehicle Technologies; Contract ANL/ESD-17/17; Argonne Report: Lemont, IL, USA, 2018. [Google Scholar]
  12. Smith, S.; Younessi, K.; Markstaller, M.; Schlesinger, D.; Bhatnagar, B.; Smith, D.; Banceu, B.; Schoon, R.; Sharma, V.K.; Kachmarsky, M.; et al. Test, Evaluation, and Demonstration of Practical Devices/Systems to Reduce Aerodynamic Drag of Tractor/Semitrailer Combination Unit Trucks; US Dept of Energy: Washington, DC, USA, 2007. [CrossRef] [Green Version]
  13. Vijayagopal, R.; Rousseau, A.; Vallet, A. Fuel Consumption and Performance Benefits of Electrified Powertrains for Transit Buses (No 2018-01-0321). SAE Technical Paper, 3 April 2018. [Google Scholar] [CrossRef]
Figure 1. Layout in powertrain architectures considered in this work.
Wevj 11 00012 g001
Figure 2. Plug-in electric vehicles (PHEVs) and battery-powered electric vehicles (BEVs) result in vehicles heavier than conventional baseline.
Wevj 11 00012 g002
Figure 3. Engine size varies for each truck based on the powertrain choice.
Wevj 11 00012 g003
Figure 4. Peak motor power required for various truck variants.
Wevj 11 00012 g004
Figure 5. Battery energy for PHEV and BEV.
Wevj 11 00012 g005
Figure 6. Drive cycles used in this study to estimate fuel consumption of trucks.
Wevj 11 00012 g006
Figure 7. Fuel savings in medium-duty trucks.
Wevj 11 00012 g007
Figure 8. Fuel savings in heavy-duty trucks.
Wevj 11 00012 g008
Table 1. Vehicles chosen to represent the medium- and heavy-duty market in the US.
Vehicle ClassPurpose
Class 2b: 6000–10,000 lb.Small Van
Class 3: 10,001–14,000 lb.Enclosed Van
Class 3: 10,001–14,000 lb.Service, Utility Truck
Class 4: 14,001–16,000 lb.Walk-In, Multi-Stop, Step Van
Class 5: 16,001–19,500 lb.Utility, Tow Truck
Class 6: 19,501–26,000 lb.Construction, Dump Truck
Class 7: 26,001–33,000 lb.School Bus
Class 7: 26,001–33,000 lb.Day Cab
Class 8: >33,000 lbSleeper
Class 8: >33,000 lbSleeper Aero
Class 8: >33,000 lbDay Cab
Table 2. Performance summary for all vehicles considered in this study.
ClassPurpose0–30 mph (s)0–60 mph (s)Grade Speed 6% (mph)Cruise Speed (mph)90 Percentile Daily Driving Range (Miles)
2Van721.56570200
3Service5.8186570150
3Van6.4244970200
4WalkIn7.5354070150
5Utility9246565150
6Construction11.646.52765150
7DayCab18663165250
7School18.5603060150
8DayCab18663165250
8Sleeper18603265500
Table 3. Factors affecting the component size for different powertrains.
PowertrainEngineMotorBattery
ConventionalAcceleration grade and cruise--
ISGSize based on starter and alternatorEnergy: Sustain electric loads for at least one minute
HEVMaximize regen in ARB transientPower and energy: sustain peak motor output during acceleration, as well as regenerative braking events
PHEVGrade and cruiseAcceleration grade and cruiseEnergy: Electric range determined using EPA’s 65 mph cycle.
Power: To support motor & aux loads
BEV-

