Understanding the Thermal Runaway of Ni-Rich Lithium-Ion Batteries

 , ,
, ,
Abstract
:
1. Introduction
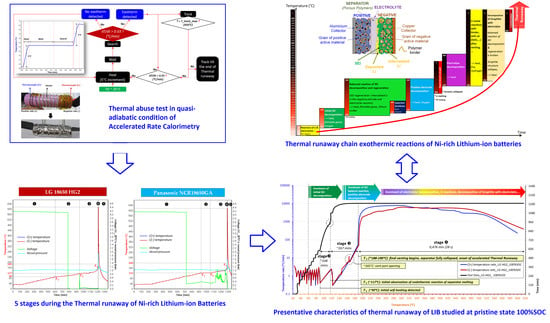
2. Experimental Methodology of Investigating the Thermal Runaway
- The complete multiscale cell analysis, in order to address the pristine and thermally abused states of LIBs;
- The thermal abuse tests, in order to perform and investigate the thermal runaway phenomenon.
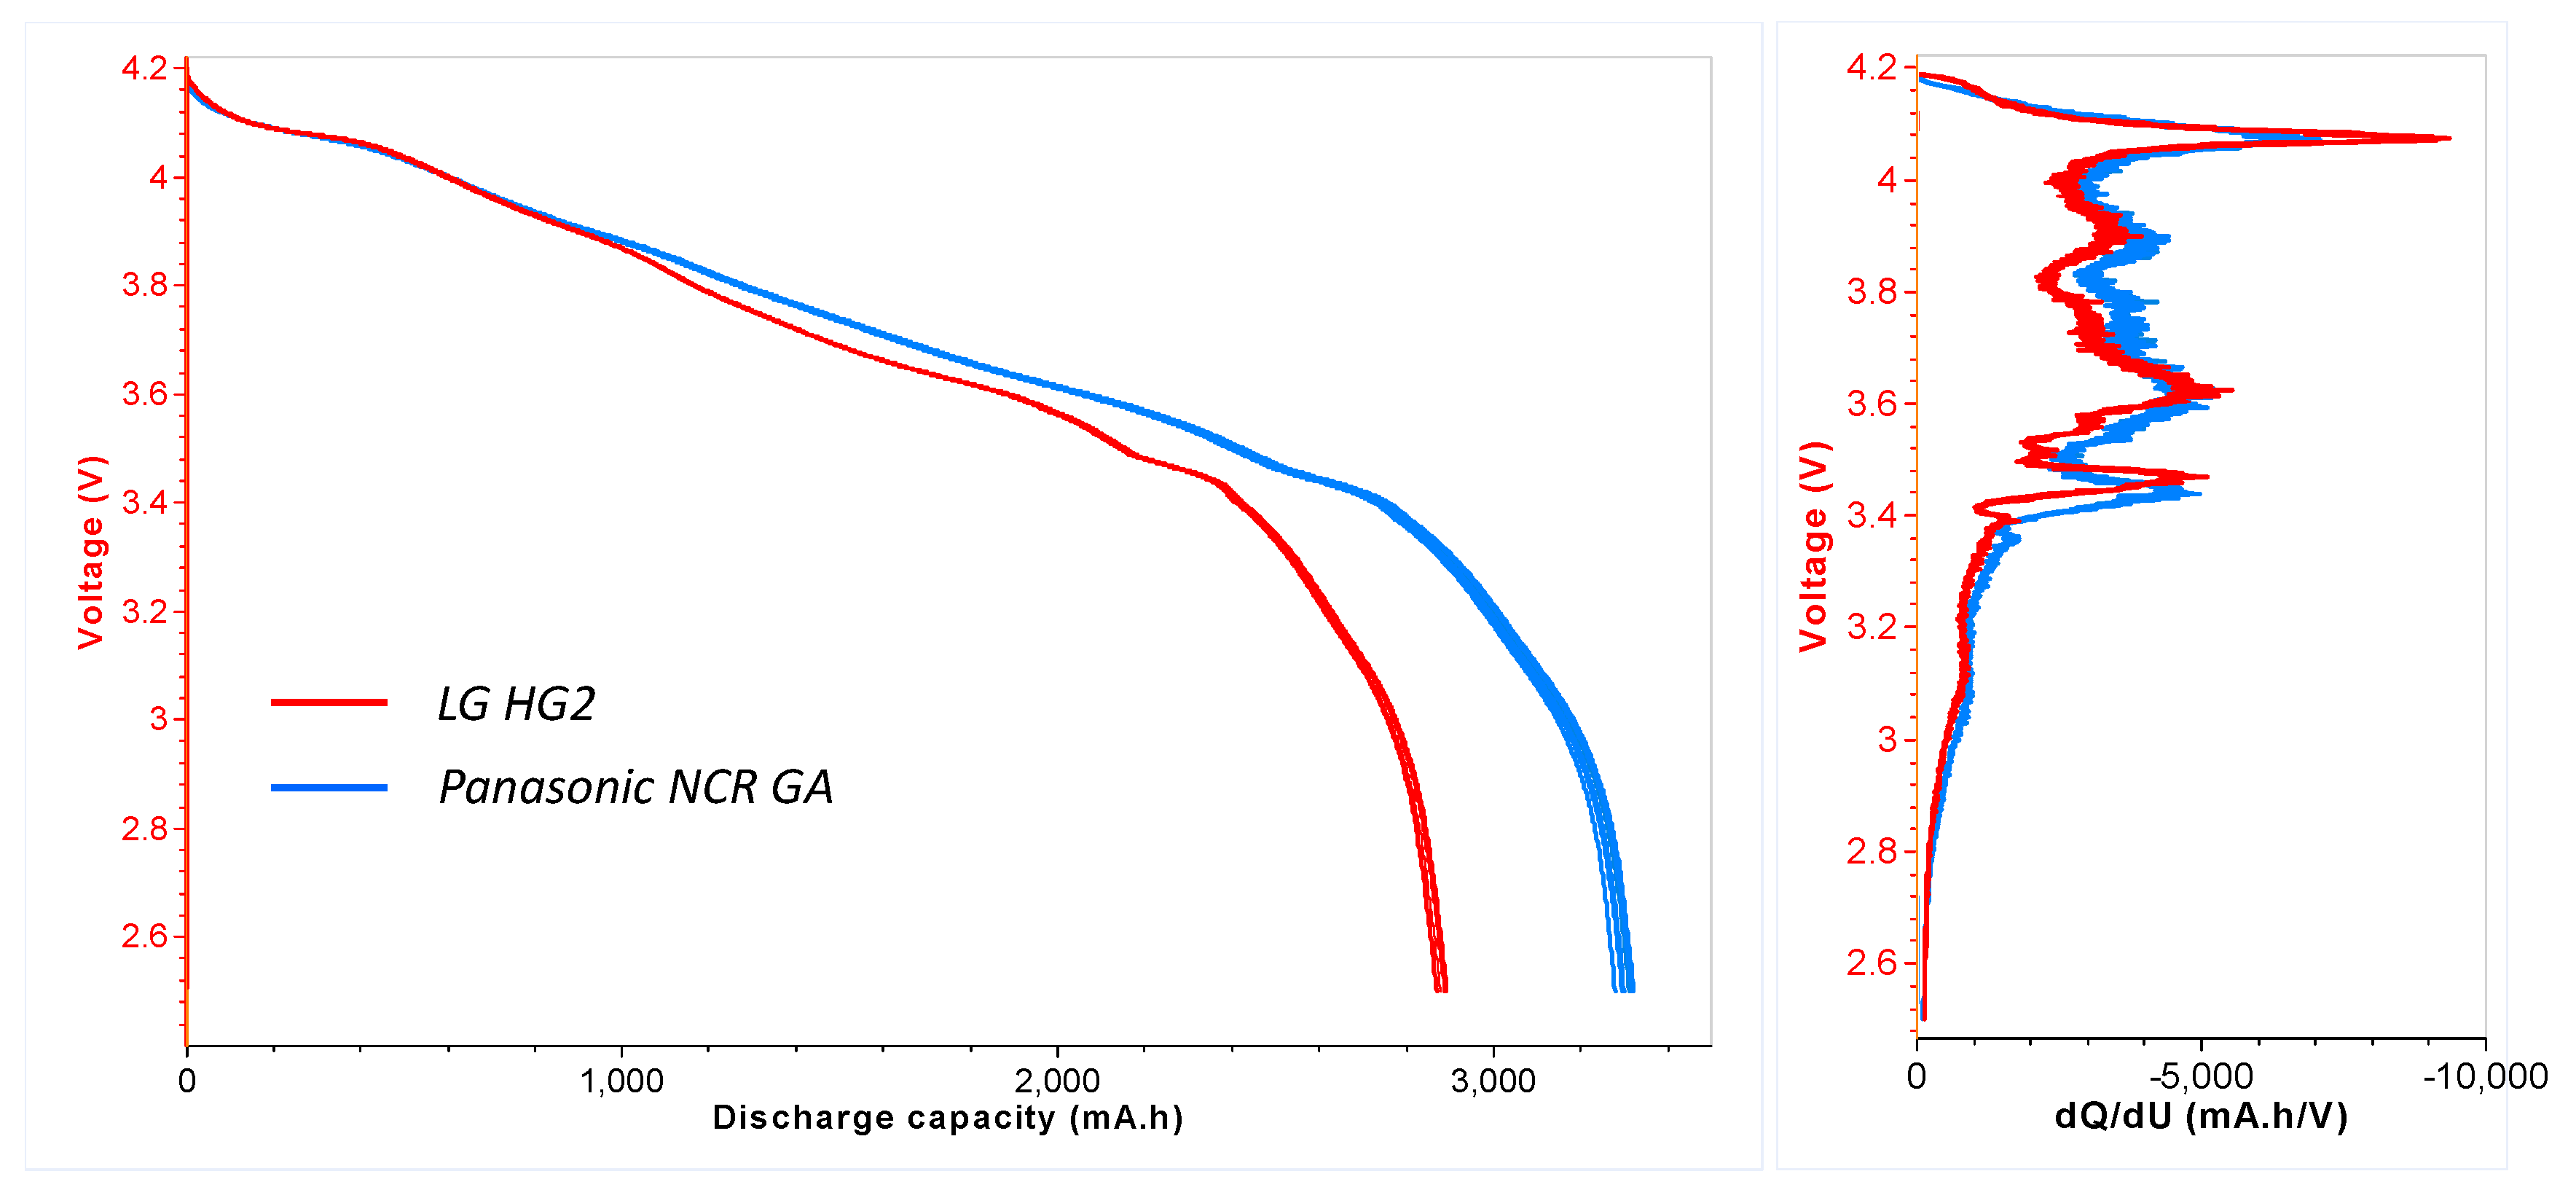
2.1. Multiscale Cell Analysis
- SOC represents the rate of the available capacity to the maximum capacity when a battery is completely charged [18];
- Charge/discharge C-rate is the measurement of the rate at which a battery is charged/discharged relative to its maximum capacity (e.g., C/20 C-rate means that the current will charge/discharge the entire battery in 20 h ideally, therefore, for a battery with a capacity of 3Ah, this is equivalent to a charge/discharge current of 0.15A).
2.2. Thermal Abuse Tests
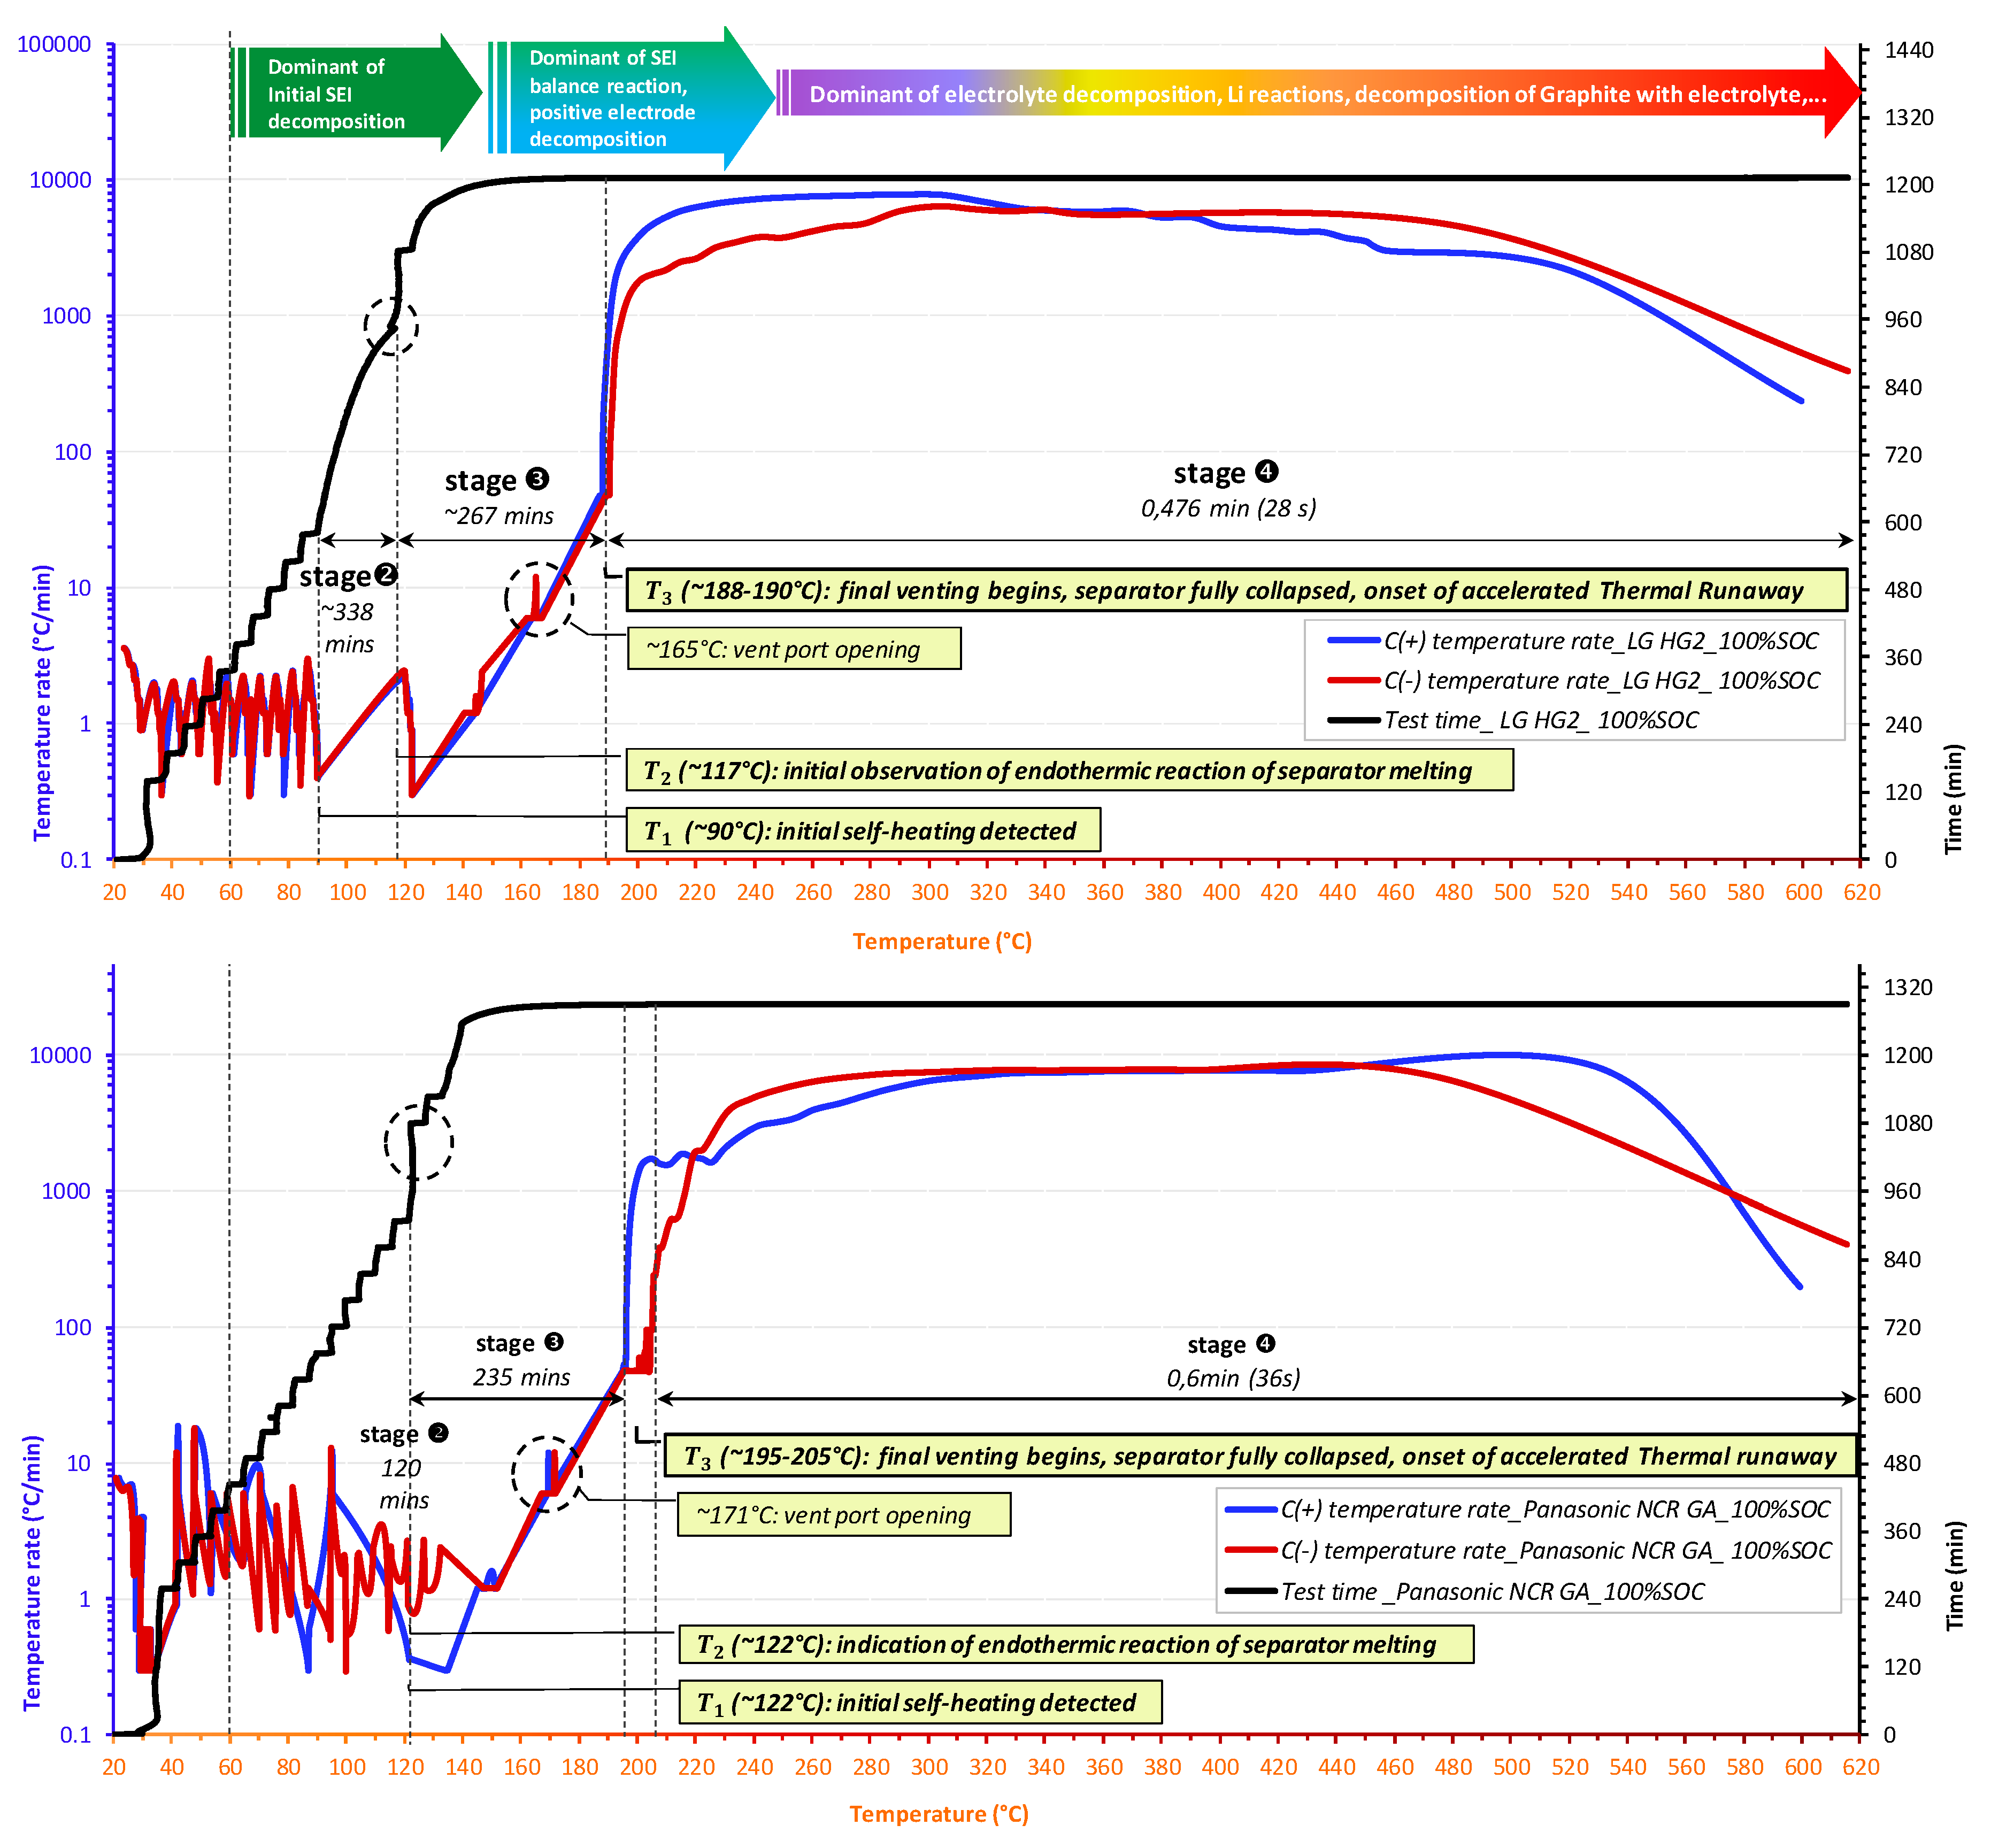
- is the temperature corresponding to the initial detected self-heating. The detection of depends on the detection sensitivity of the testing device for the exothermic reaction, which is indicated in the testing program. In this work, the detection sensitivity for exothermic reactions is 0.03 °C/min;
- is the temperature referred to the initial observation of the endothermic reaction of the separator melting process;
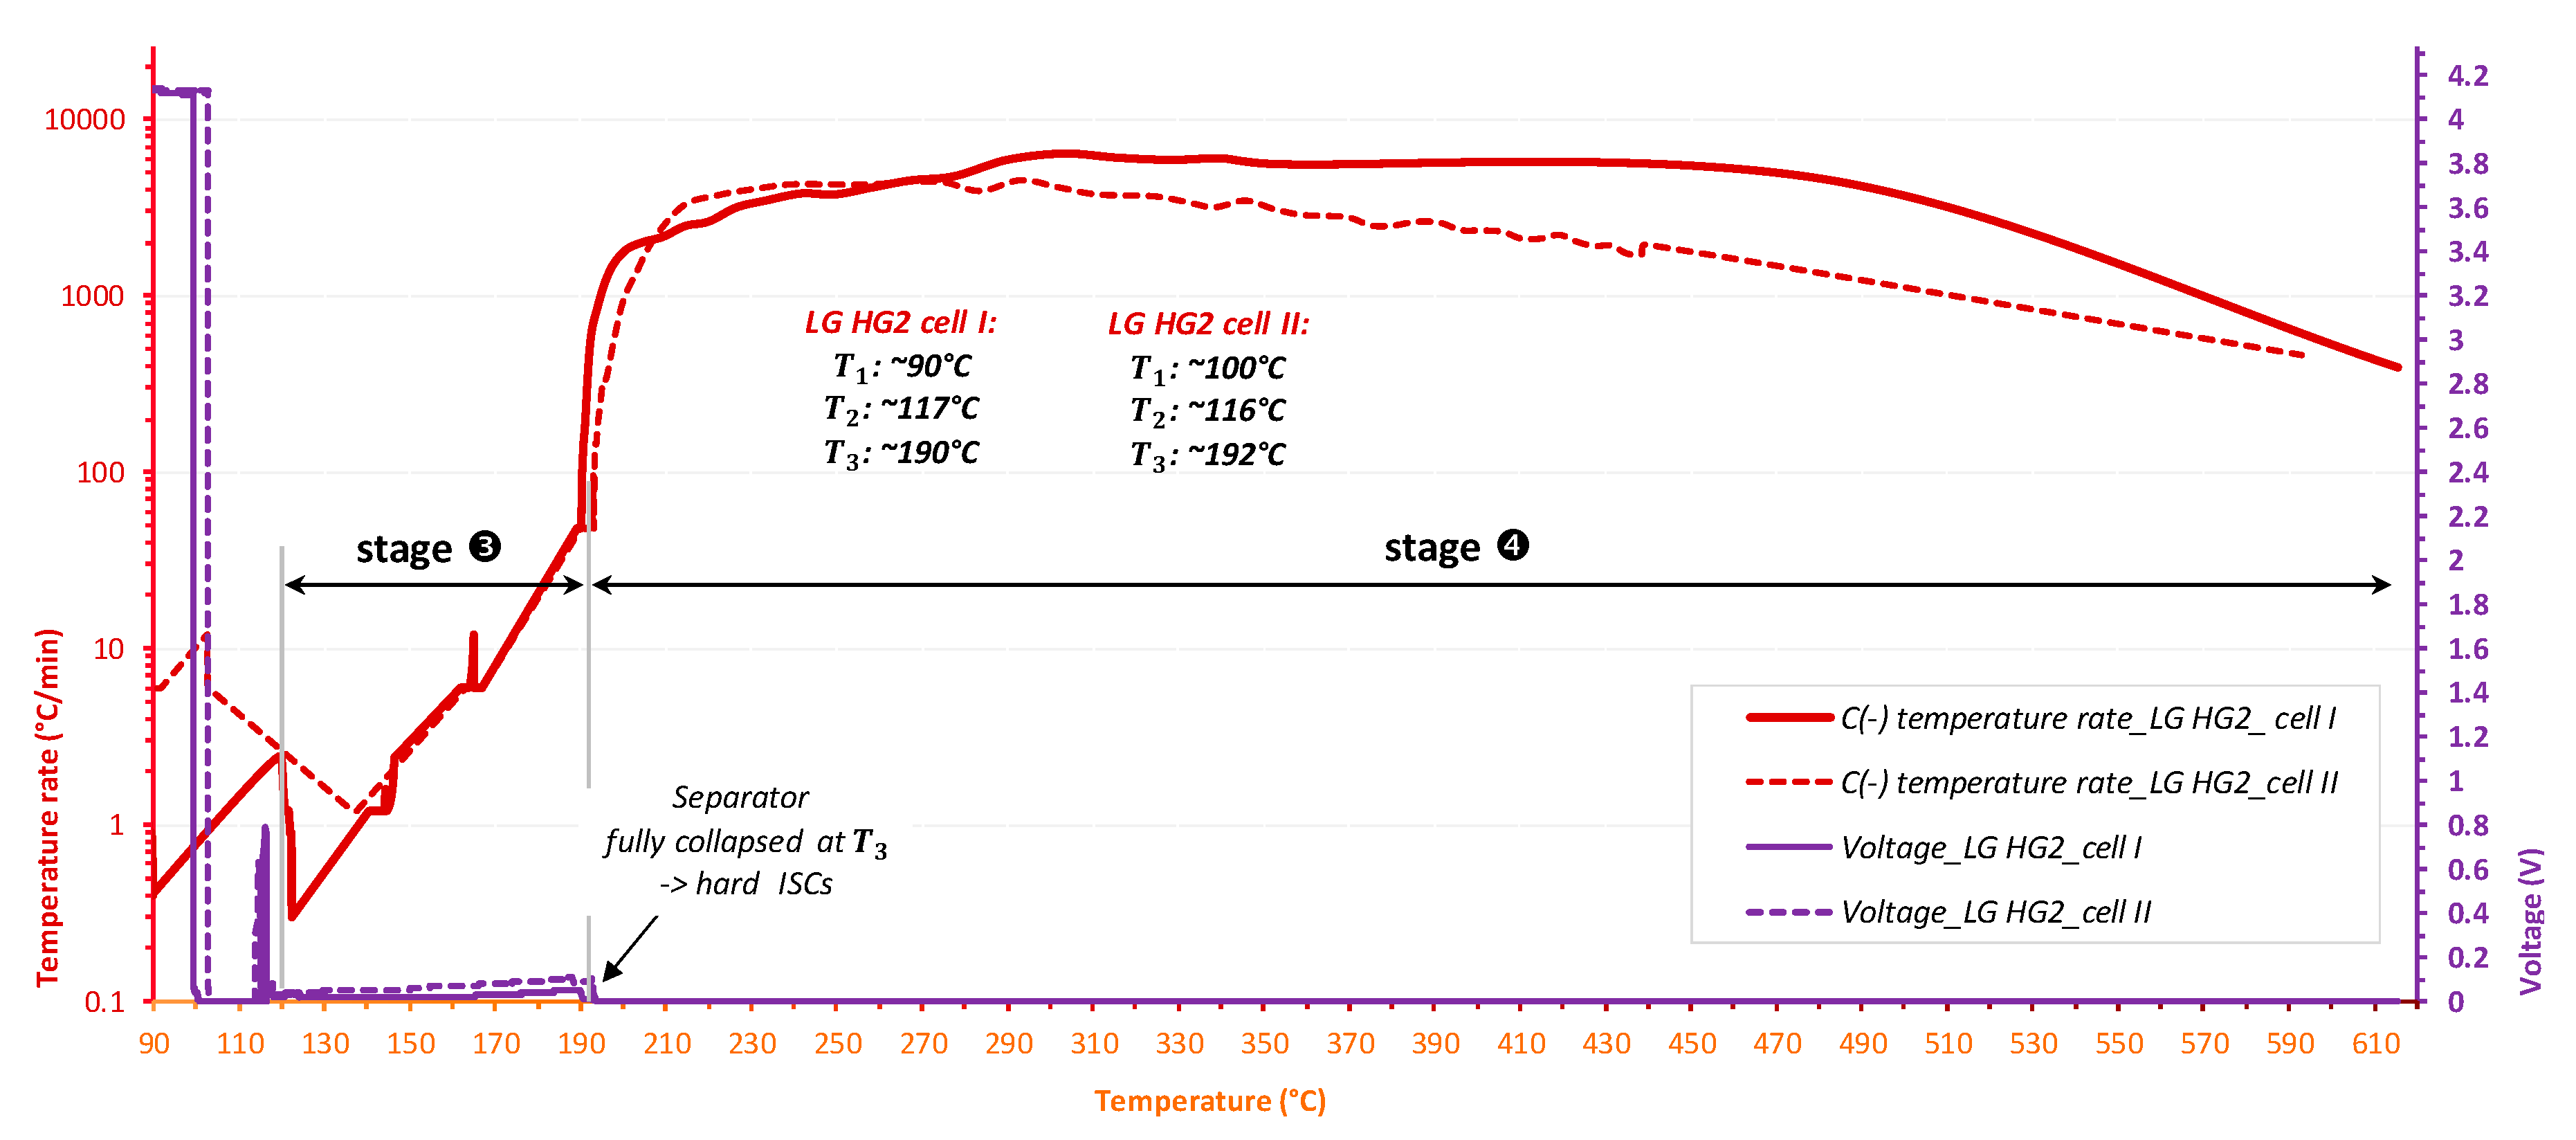
- is the temperature corresponding to the sudden acceleration of temperature rate due to the final venting, indicated by the strongest gassing rate and the hard ISC after the ceramic layer has collapsed.
2.3. Technology Selection
- The cylindrical format is one of the most common cell formats and the basic phenomenology of the provided battery chemistry is the same, while difficulties may arise from mechanical aspects;
- 18650 size: 18650 cells (e.g., from Japanese/Korean manufacturers) have been widely used by consumers and electric vehicles for quite a while, and according to international regulations for transport of dangerous goods (UN TDG model regulations), these are subject to reportable quality control procedures. Therefore, functional and safety performance repeatability could be assumed as representative of best products currently available on the market;
- The detection of a temperature rise could be easier in the case of small cells, since only one or two sensors (thermocouples) might be needed for detection. In contrast, for larger cells, more sensors are needed. The thermocouple type used in this research is the K-Type Inconel 600 Class 1, which has accuracy of ±1.5 °C from −40 °C to 375 °C and ±0.004 × T (°C) from 375 °C to 1000 °C.
3. Results and Discussion
3.1. Thermal Runaway Chain Exothermic Reactions of Ni-Rich Lithium-Ion Batteries
- Reactions of deposited Li and electrolytes, namely SEI and “dead Li” formation;
- Initial decomposition of SEI (dominant reaction of this stage). This is regarded as the first side reaction during the full thermal runaway process. It occurs around 60–130 °C. The exact temperature range depends upon cell chemistry, the thickness of SEI, and SOC level;
- SEI regeneration: Once the SEI decomposes, the intercalated Li in the graphite negative electrodes can contact the electrolyte again, thereby regenerating SEI.
- Further electrolyte balance reaction of SEI regeneration and decomposition at negative electrodes (dominant reactions at the beginning of this stage): Within the temperature range of about 120–250 °C, the SEI decomposition will not stop as long as there is sufficient regenerated SEI, meanwhile the SEI regeneration will not increase because the surface of the negative electrode is still covered by a certain thickness of the SEI layer. This exothermic process represents the balance reaction of SEI decomposition and regeneration, with the average thickness of SEI remaining at a stabilized level;
- The start of positive electrode decomposition and electrolyte oxidation (dominant reactions at the end of this stage): The highly exothermic decomposition of positive electrode starts at temperatures ranging 130–200 °C and produces oxygen.
- Further highly exothermic decomposition of positive electrodes (~200–250 °C): Cells manufactured from the higher energy density positive electrode materials will be subjected to more severe exothermic reactions;
- Strong exothermic reaction between oxygen (released from positive electrode) and electrolytes;
- Decomposition of electrolytes (combustion reactions): A part of the carbonate electrolyte decomposes inside the cell and releases gases, whereas the other part evaporates and bursts out of the cell. During the final venting, the ultimate severity of the reaction is dominated by the ignition of flammable vent gases. Auto-ignition temperatures of some typical organic electrolyte components are ~440 °C for ethyl methyl carbonate (EMC), ~445 °C for diethyl carbonate (DEC), ~455 °C for propylene carbonate (PC), ~458 °C for dimethyl carbonate (DMC), and ~465 °C for ethylene carbonate (EC) [4];
- Reactions between deposited Li and air (H2O) diffused into the cell after venting;
- Reactions between deposited Li and the binder;
- Decomposition of negative electrodes with electrolytes: The balance reaction of SEI decomposition and regeneration is broken as the temperature increases. Then, the graphite structure collapses;
- Binder reactions.
3.2. The Thermal Runaway of Selected Ni-Rich Technologies
3.3. The Factors Impacting the Thermal Runaway of Selected Technologies in Pristine State
3.3.1. The Impact of Electrode Materials
3.3.2. The Impact of Separator
3.3.3. The Impact of SOC
3.3.4. The Impact of Safety Features and SOC on Venting and Component Ejection Mechanism
4. Conclusions
- (1)
- For all tested SOC levels, the initial significant self-heating of Panasonic NCR GA was always detected at a higher temperature. Therefore, the safe region of this technology is wider than that of LG HG2. This might originally be due to the stronger initial SEI decomposition/regeneration reaction occurring in LG HG2 cells.
- (2)
- As a critical element in terms of safety, the separator technology significantly impacts the reversible self-heating stages and the onset of the accelerated thermal runaway. Having a 3-fold thicker separator, Panasonic NCR GA exhibited the final venting and hard ISC at the higher temperatures which were ~205 °C for 100% SOC compared to ~190 °C for the LG HG2, and ~228 °C for 50% SOC compared to ~222 °C for the LG HG2.
- (3)
- Regardless of SOC, the positive electrode material strongly influences the severity during the final stage of thermal runaway. NCA technology appears to be more reactive, with a higher self-heating temperature rate over a longer duration (Figure 14c). However, the final venting of LG HG2 is the most violent due to the stronger gassing from positive electrode decomposition due to NMC811 technology compared to NCA technology.
- (4)
- The impact of SOC on the thermal runaway was significantly observed for all selected Ni-rich technologies. We found that the cells at reduced SOC were less reactive. They required more time before undergoing thermal runaway and their accelerated thermal runaway stage had lower temperature rates over a shorter duration and were only activated at higher temperature, thereby meaning their gasket seal collapsed and they exhibited cell jellyroll ejection but lower mass loss after the thermal runaway.
- (5)
- All tested cells exhibited the same self-heating temperature rate of ~6 °C/min at the beginning of vent port opening and ~48 °C/min at the onset of the accelerated thermal runaway ().
Supplementary Materials
Author Contributions
Funding
Acknowledgments
Conflicts of Interest
Abbreviations
| LIB | Lithium-ion battery |
| SOC | state of charge |
| NMC811 | |
| NCA | |
| 3D | 3 dimensions |
| LFP | |
| SEI | solid electrolyte interphase |
| GEIS | galvano electrochemical impedance spectroscopy |
| SEM | scanning electron microscopy |
| EDS | energy-dispersive X-ray spectroscopy |
| XRD | X-ray diffraction |
| DSC | differential scanning calorimetry |
| ISC | internal short circuit |
| ARC | accelerating rate calorimetry |
| HWS | heat–wait–search |
| PPC | pulse power characterization |
| GITT | galvanostatic intermittent titration technique |
| GC-MS | gas chromatography-mass spectrometry |
Nomenclature
| Nomenclature | Description |
| T | cell skin temperature |
| U | cell voltage |
| Q | cell capacity |
| P | pressure of BTC’s vessel |
Appendix A

Appendix B

| Full cell |  |
| Positive side |  |
| Negative side |  |
| Full cell |  |
| Positive side |  |
| Negative side |  |
| Full cell |  |
| Positive side |  |
| Negative side |  |
| Full cell |  |
| Positive side |  |
| Negative side |  |
References
- Myung, S.-T.; Maglia, F.; Park, K.-J.; Yoon, C.S.; Lamp, P.; Kim, S.-J.; Sun, Y.-K. Nickel-Rich Layered Cathode Materials for Automotive Lithium-Ion Batteries: Achievements and Perspectives. ACS Energy Lett. 2017, 2, 196–223. [Google Scholar] [CrossRef]
- Thaler, A.; Watzenig, D. Automotive Battery Technology; Springer: Cham, Switzerland, 2014; ISBN 978-3-319-02522-3. [Google Scholar]
- Feng, X.; Ouyang, M.; Liu, X.; Lu, L.; Xia, Y.; He, X. Thermal runaway mechanism of lithium ion battery for electric vehicles: A review. Energy Storage Mater. 2018, 10, 246–267. [Google Scholar] [CrossRef]
- Mikolajczak, C.; Kahn, M.; White, K.; Long, R.T. Lithium-Ion Batteries Hazard and Use Assessment; Springer: New York, NY, USA, 2013; ISBN 978-1-4614-3486-3. [Google Scholar]
- Galushkin, N.E.; Yazvinskaya, N.N.; Galushkin, D.N. Mechanism of Thermal Runaway in Lithium-Ion Cells. J. Electrochem. Soc. 2018, 165, A1303–A1308. [Google Scholar] [CrossRef]
- FAA Office of Security and Hazardous Materials Safety. Aviation Cargo and Passenger Baggage Events Involving Smoke, Fire, Extreme Heat or Explosion Involving Lithium Batteries or Unknown Battery Types. 2017. Available online: https://lessonslearned.faa.gov/UPS6/battery_incident_chart.pdf (accessed on 7 January 2019).
- Benger, R.; Wenzl, H.; Beck, H.-P.; Jiang, M.; Ohms, D.; Schaedlich, G. Electrochemical and thermal modeling of Lithium-ion cells for use in HEV and EV application. WEVJ 2009, 3, 342–351. [Google Scholar] [CrossRef]
- Ouyang, D.; Chen, M.; Huang, Q.; Weng, J.; Wang, Z.; Wang, J. A Review on the Thermal Hazards of the Lithium-Ion Battery and the Corresponding Countermeasures. Appl. Sci. 2019, 9, 2483. [Google Scholar] [CrossRef]
- Liao, Z.; Zhang, S.; Li, K.; Zhang, G.; Habetler, T.G. A survey of methods for monitoring and detecting thermal runaway of lithium-ion batteries. J. Power Sources 2019, 436, 226879. [Google Scholar] [CrossRef]
- Abada, S.; Petit, M.; Lecocq, A.; Marlair, G.; Sauvant-Moynot, V.; Huet, F. Combined experimental and modeling approaches of the thermal runaway of fresh and aged lithium-ion batteries. J. Power Sources 2018, 399, 264–273. [Google Scholar] [CrossRef]
- Abada, S.; Marlair, G.; Lecocq, A.; Petit, M.; Sauvant-Moynot, V.; Huet, F. Safety focused modeling of lithium-ion batteries: A review. J. Power Sources 2016, 306, 178–192. [Google Scholar] [CrossRef]
- Petit, M.; Marlair, G.; Abada, S.; Wang, C.-Y. Safety Tests for Li-secondary Batteries—Modeling of Safety Tests and Events. In Electrochemical Power Sources: Fundamentals, Systems and Applications—Li-Battery Safety; Garche, J., Brandt, K., Eds.; Elsevier: Amsterdam, The Netherlands, 2019. [Google Scholar]
- Panchal, S.; Dincer, I.; Agelin-Chaab, M.; Fraser, R.; Fowler, M. Thermal modeling and validation of temperature distributions in a prismatic lithium-ion battery at different discharge rates and varying boundary conditions. Appl. Therm. Eng. 2016, 96, 190–199. [Google Scholar] [CrossRef]
- Panchal, S.; Mathew, M.; Fraser, R.; Fowler, M. Electrochemical thermal modeling and experimental measurements of 18650 cylindrical lithium-Ion battery during discharge cycle for an EV. Appl. Therm. Eng. 2018, 135, 123–132. [Google Scholar] [CrossRef]
- Panchal, S.; Haji Akhoundzadeh, M.; Raahemifar, K.; Fowler, M.; Fraser, R. Heat and mass transfer modeling and investigation of multiple LiFePO4/graphite batteries in a pack at low C-rates with water-cooling. Int. J. Heat Mass Transf. 2019, 135, 368–377. [Google Scholar] [CrossRef]
- Said, M.; Tohir, M. Prediction of Lithium-ion Battery Thermal Runaway Propagation for Large Scale Applications Fire Hazard Quantification. Processes 2019, 7, 703. [Google Scholar] [CrossRef]
- Golubkov, A.W.; Scheikl, S.; Planteu, R.; Voitic, G.; Wiltsche, H.; Stangl, C.; Fauler, G.; Thaler, A.; Hacker, V. Thermal runaway of commercial 18650 Li-ion batteries with LFP and NCA cathodes—Impact of state of charge and overcharge. RSC Adv. 2015, 5, 57171–57186. [Google Scholar] [CrossRef]
- Rivera-Barrera, J.; Muñoz-Galeano, N.; Sarmiento-Maldonado, H. SoC Estimation for Lithium-ion Batteries: Review and Future Challenges. Electronics 2017, 6, 102. [Google Scholar] [CrossRef]
- Lei, B.; Zhao, W.; Ziebert, C.; Uhlmann, N.; Rohde, M.; Seifert, H. Experimental Analysis of Thermal Runaway in 18650 Cylindrical Li-Ion Cells Using an Accelerating Rate Calorimeter. Batteries 2017, 3, 14. [Google Scholar] [CrossRef]
- Liu, K.; Liu, Y.; Lin, D.; Pei, A.; Cui, Y. Materials for lithium-ion battery safety. Sci. Adv. 2019, 4, eaas9820. [Google Scholar] [CrossRef] [PubMed]
- Golubkov, A.W.; Fuchs, D. Thermal Runaway: Causes and Consequences on Cell Level. In Automotive Battery Technology; Thaler, A., Watzenig, D., Eds.; Springer: Cham, Switzerland; New York, NY, USA, 2014; pp. 37–51. ISBN 978-3-319-02522-3. [Google Scholar]
- Jaguemont, J.; Boulon, L.; Dubé, Y. A comprehensive review of lithium-ion batteries used in hybrid and electric vehicles at cold temperatures. Appl. Energy 2016, 164, 99–114. [Google Scholar] [CrossRef]
- Waldmann, T.; Wohlfahrt-Mehrens, M. Effects of rest time after Li plating on safety behavior—ARC tests with commercial high-energy 18650 Li-ion cells. Electrochim. Acta 2017, 230, 454–460. [Google Scholar] [CrossRef]
- Smart, M.C.; Whitcanack, L.D.; Ratnakumar, B.V. Safe Charge Rates for Lithium-Ion Cells. Effects of Li Plating; NASA Battery Workshop: Huntsville, AL, USA, 2007.
- Waldmann, T.; Hogg, B.-I.; Wohlfahrt-Mehrens, M. Li plating as unwanted side reaction in commercial Li-ion cells—A review. J. Power Sources 2018, 384, 107–124. [Google Scholar] [CrossRef]


 +
+  ) and duration of the irreversible self-heating region (stage
  ) during thermal runaway of the presented cells.
+ ) and duration of the irreversible self-heating region (stage ) during thermal runaway of the presented cells.
) during thermal runaway of the presented cells.
+ ) and duration of the irreversible self-heating region (stage ) during thermal runaway of the presented cells.


| Cell Technology | LG 18650 HG2 | Panasonic NCR 18650 GA |
|---|---|---|
| Cell chemistry (Identified by multiscale cell analysis in Section 2.1.): | NMC811/(graphite-) | NCA/(graphite-) |
| Electrolyte | in EC-DMC-PC 1 | in EC-DMC-DEC-PC 1 |
| Format | cylindrical | cylindrical |
| Diameter × Length | 18 mm × 65 mm | 18 mm × 65 mm |
| Weight | 44.56 g ± 0.2 g | 47.26 g ± 0.2 g |
| Nominal capacity | 3000 mAh | 3450 mAh |
| Charging voltage | 4.20 V ± 0.05 V | 4.20 V ± 0.03 V |
| Cut off voltage | 2.5 V | 2.5 V |
| Standard charge | 1500 mA (C/2) | 1725 mA (C/2) |
| Standard discharge | 600 mA (C/5) | 690 mA (C/5) |
| Operating temperatures (from manufacturer) | Charge: 0 °C~50 °C Discharge: −20 °C~75 °C | Charge: +10~+45 °C Discharge: −20~+60 °C |
| LG 18650 HG2 | Panasonic NCR GA | |
|---|---|---|
| Cell internal structure global view |  |  |
| Original design of safety features near cell gasket |  |  |
| The 100% SOC cells after thermal runaway |  |  |
| The 50% SOC cells after thermal runaway |  |  |
© 2019 by the authors. Licensee MDPI, Basel, Switzerland. This article is an open access article distributed under the terms and conditions of the Creative Commons Attribution (CC BY) license (http://creativecommons.org/licenses/by/4.0/).
Share and Cite
Nguyen, T.T.D.; Abada, S.; Lecocq, A.; Bernard, J.; Petit, M.; Marlair, G.; Grugeon, S.; Laruelle, S. Understanding the Thermal Runaway of Ni-Rich Lithium-Ion Batteries. World Electr. Veh. J. 2019, 10, 79. https://doi.org/10.3390/wevj10040079
Nguyen TTD, Abada S, Lecocq A, Bernard J, Petit M, Marlair G, Grugeon S, Laruelle S. Understanding the Thermal Runaway of Ni-Rich Lithium-Ion Batteries. World Electric Vehicle Journal. 2019; 10(4):79. https://doi.org/10.3390/wevj10040079
Chicago/Turabian StyleNguyen, Thi Thu Dieu, Sara Abada, Amandine Lecocq, Julien Bernard, Martin Petit, Guy Marlair, Sylvie Grugeon, and Stéphane Laruelle. 2019. "Understanding the Thermal Runaway of Ni-Rich Lithium-Ion Batteries" World Electric Vehicle Journal 10, no. 4: 79. https://doi.org/10.3390/wevj10040079