
Hospital Readmission and Length-of-Stay Prediction Using an Optimized Hybrid Deep Model


Abstract
:1. Introduction
- A novel cost function for the genetic optimization process to leverage the feature extraction process toward a better performance is presented;
- The proposed approach outperformed both ML and DL methods for short- and long-term LOS predictions;
- The proposed approach outperformed the surveyed ML methods in related works with respect to diabetic readmission time predictions;
- The most important features for both the LOS and readmission time frame predictions are provided.
2. Related Works
3. Methodology
3.1. Dataset
3.1.1. Diabetes
3.1.2. COVID-19
3.1.3. ICU
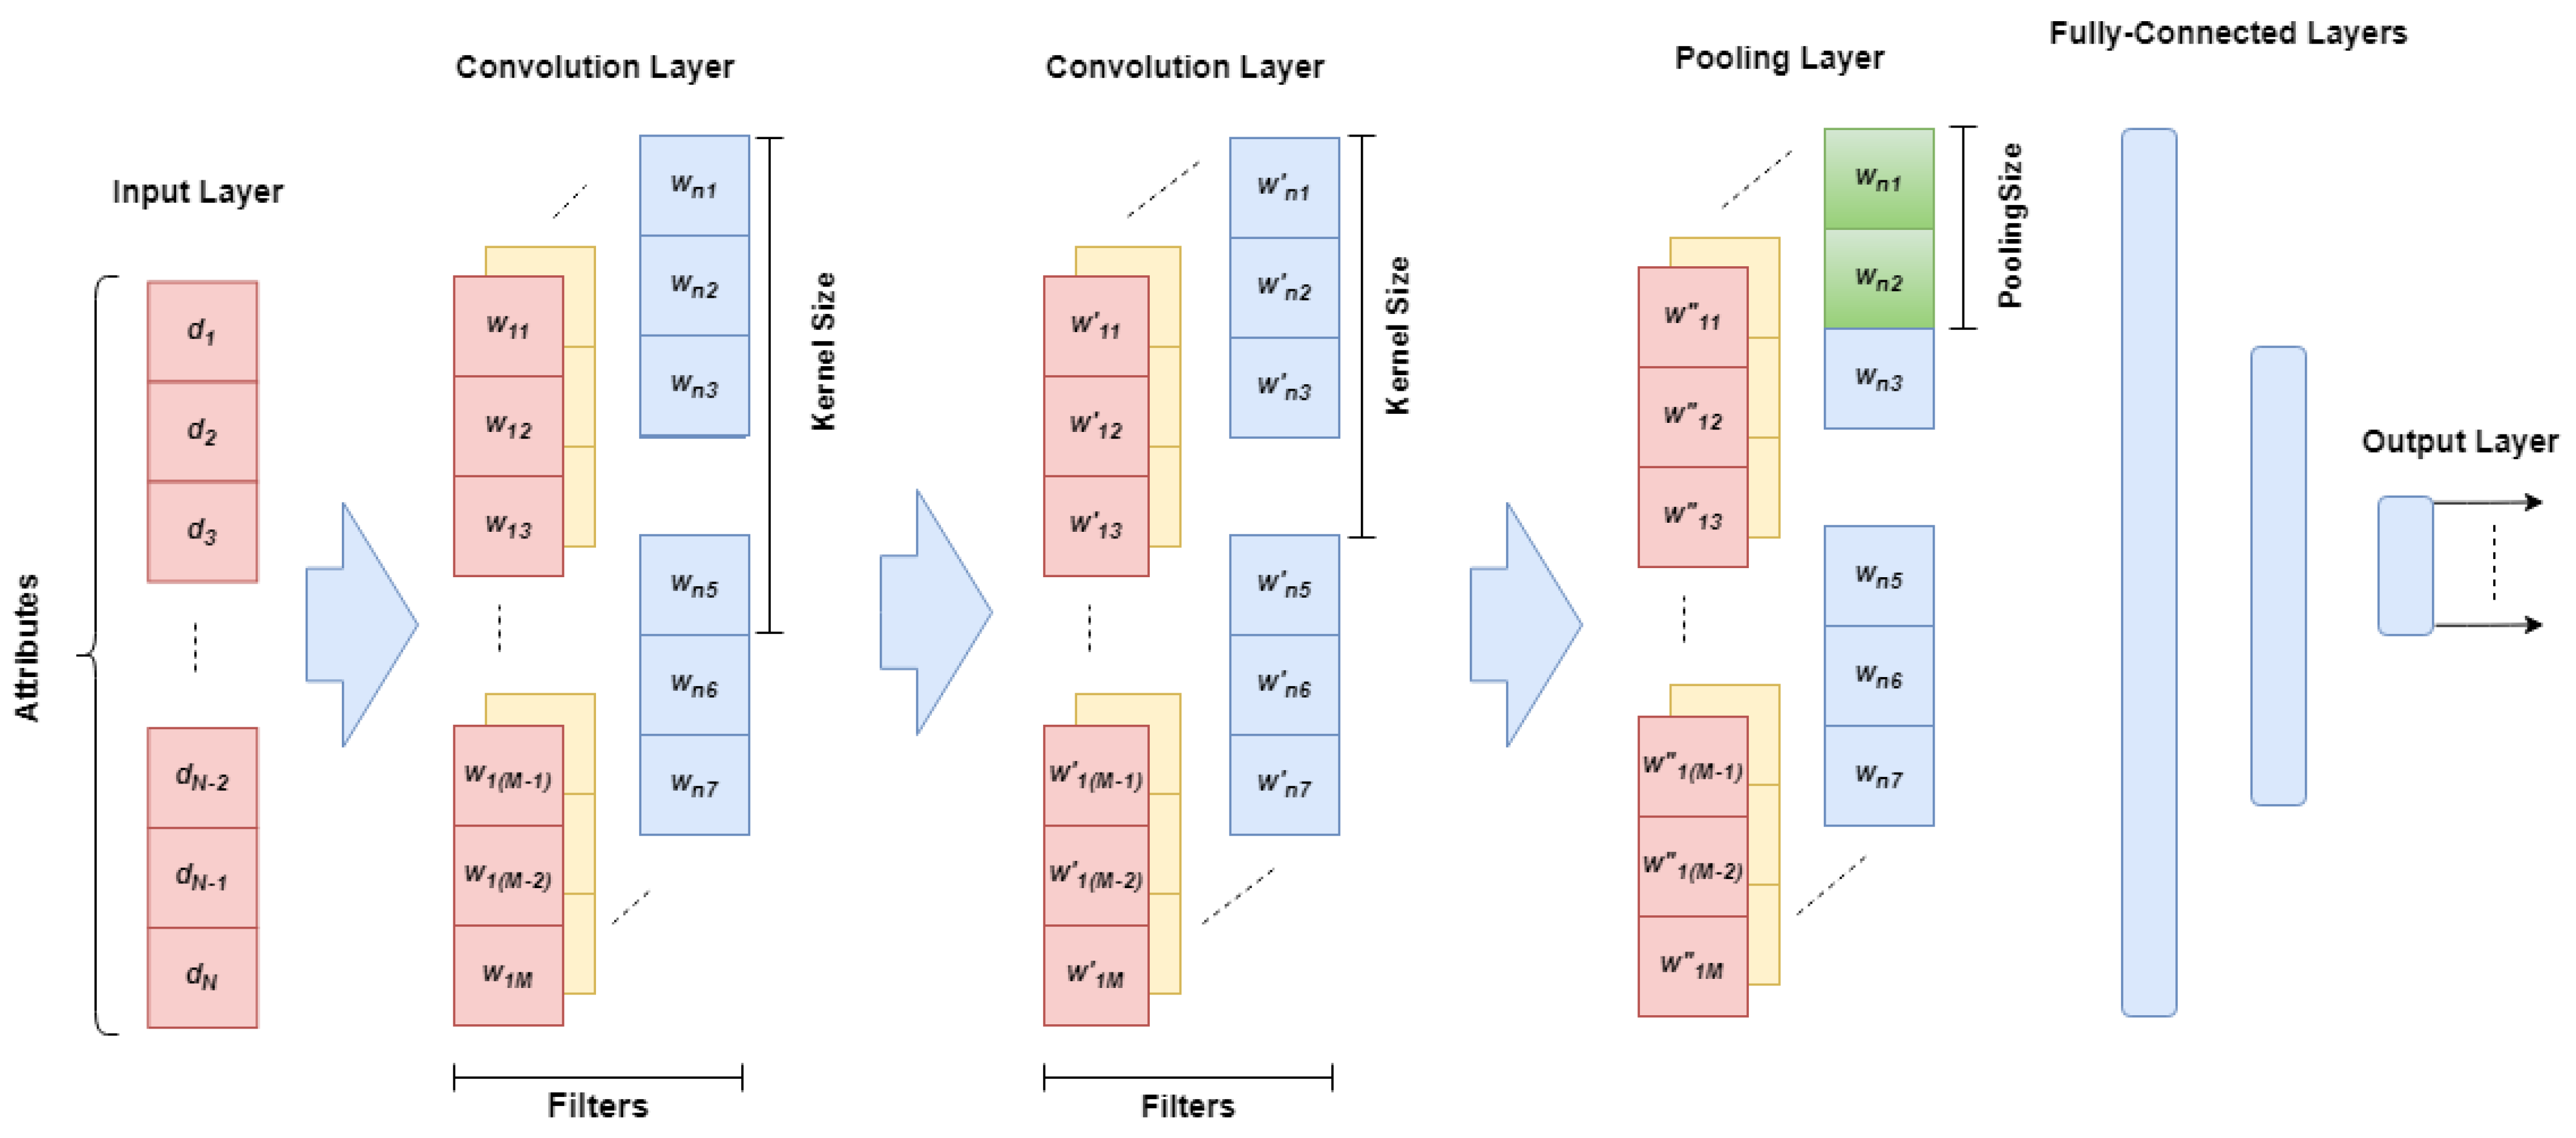
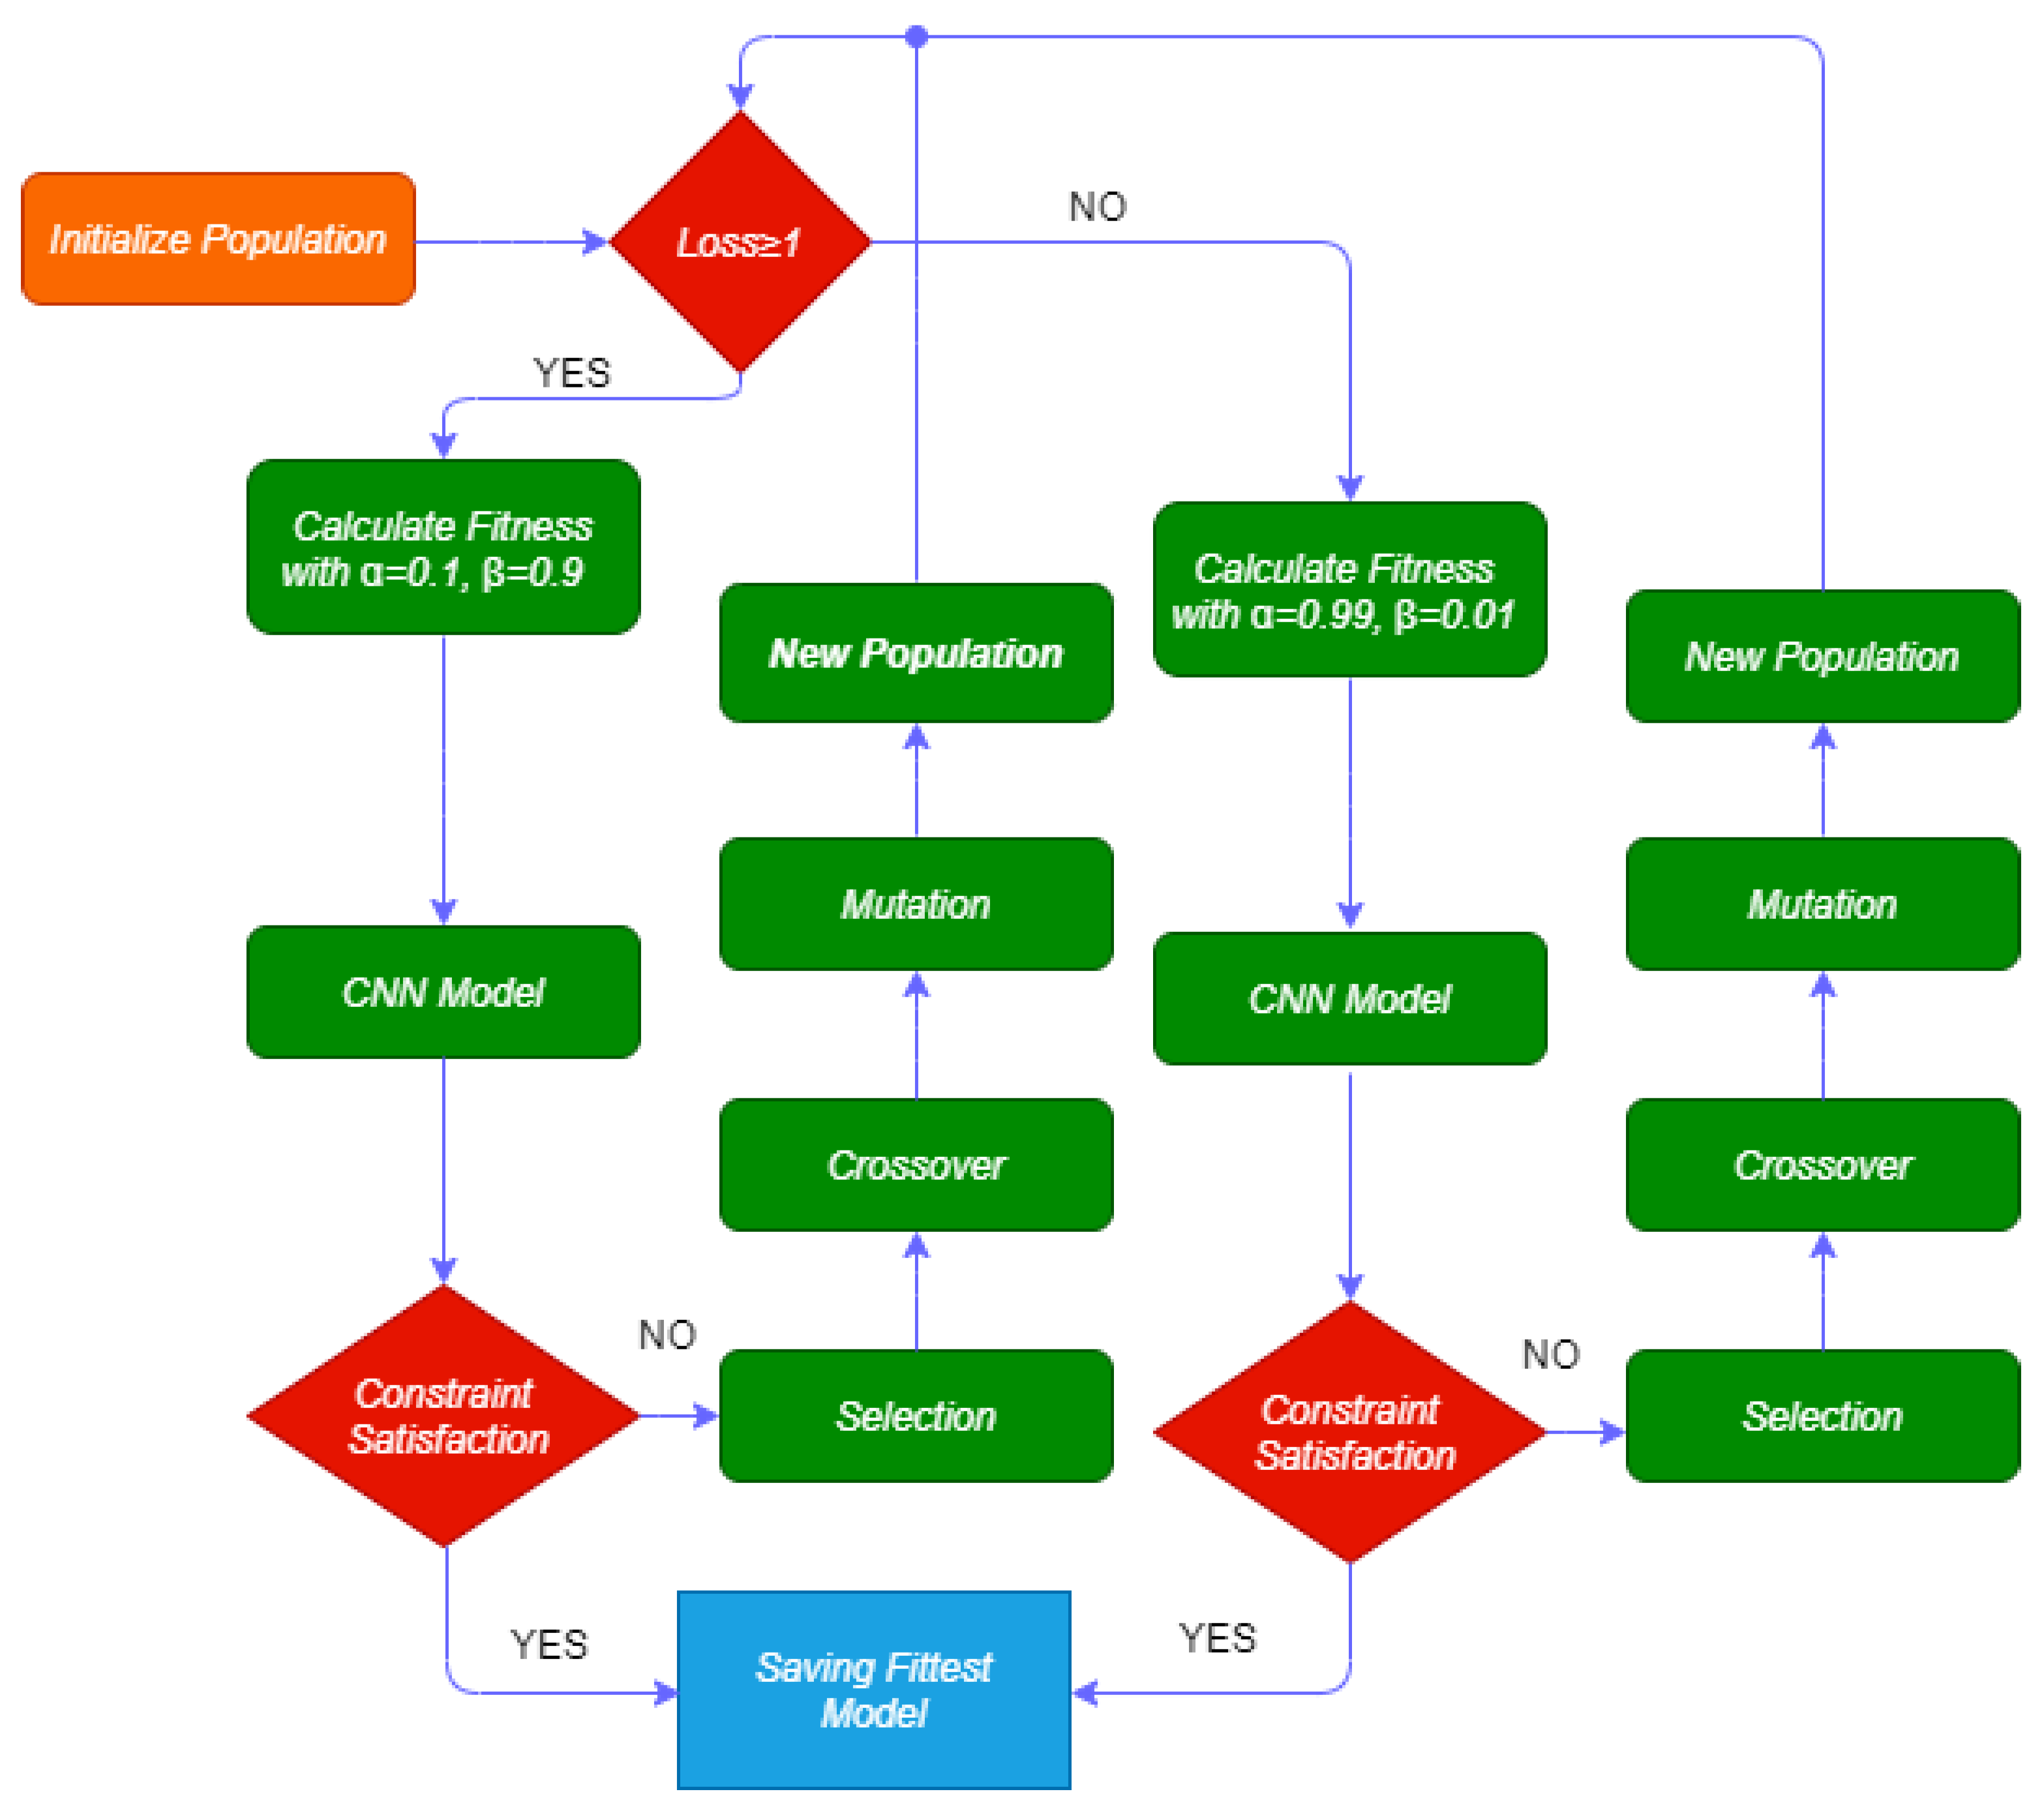
3.2. Gaocnn
- If the loss (l) is greater than or equal to 1, the categorical cross-entropy loss (CCL) varies between 1 and 10. Thus, we define alpha and beta as 0.1 and 0.9, respectively;
- If the loss (l) is less than 1, the CCL varies between 0.001 and 1. Thus, we define and as 0.99 and 0.01, respectively.
4. Experimental Results
4.1. Preprocessing
4.2. Performance Analysis
4.3. Comparison to Similar Research
5. Discussion
6. Limitations and Future of the Work
7. Conclusions
Author Contributions
Funding
Data Availability Statement
Conflicts of Interest
Abbreviations
| AUROC | Area Under the Receiver Operating Curve |
| CNN | Convolutional Neural Network |
| CCL | Categorical Cross-Entropy Loss |
| DL | Deep Learning |
| RF | Random Forest |
| GA | Genetic Algorithm |
| GAOCNN | Genetic Algorithm-Optimized Convolutional Neural Network |
| ICD | International-statistical Classification of Diseases |
| ICU | Intensive Care Unit |
| LR | Logistic Regression |
| LSTM | Long Short Term Memory |
| ML | Machine Learning |
| MLP | Multi-Layer Perceptron |
| SGAN | Semi-Supervised Generative Adversarial Network |
| SVM | Support Vector Machine |
| XGB | Extreme Gradient Boosting |
References
- Desai, D.; Mehta, D.; Mathias, P.; Menon, G.; Schubart, U.K. Health care utilization and burden of diabetic ketoacidosis in the US over the past decade: A nationwide analysis. Diabetes Care 2018, 41, 1631–1638. [Google Scholar] [CrossRef]
- Friedberg, M.W.; Rosenthal, M.B.; Werner, R.M.; Volpp, K.G.; Schneider, E.C. Effects of a medical home and shared savings intervention on quality and utilization of care. JAMA Intern. Med. 2015, 175, 1362–1368. [Google Scholar] [CrossRef]
- Mata-Cases, M.; Casajuana, M.; Franch-Nadal, J.; Casellas, A.; Castell, C.; Vinagre, I.; Mauricio, D.; Bolíbar, B. Direct medical costs attributable to type 2 diabetes mellitus: A population-based study in Catalonia, Spain. Eur. J. Health Econ. 2016, 17, 1001–1010. [Google Scholar] [CrossRef]
- Huang, E.S.; Laiteerapong, N.; Liu, J.Y.; John, P.M.; Moffet, H.H.; Karter, A.J. Rates of complications and mortality in older patients with diabetes mellitus: The diabetes and aging study. JAMA Intern. Med. 2014, 174, 251–258. [Google Scholar] [CrossRef]
- Riddle, M.C.; Herman, W.H. The cost of diabetes care—An elephant in the room. Diabetes Care 2018, 41, 929–932. [Google Scholar] [CrossRef]
- Pasquini-Descomps, H.; Brender, N.; Maradan, D. Value for money in H1N1 influenza: A systematic review of the cost-effectiveness of pandemic interventions. Value Health 2017, 20, 819–827. [Google Scholar] [CrossRef]
- Tsai, Y.; Vogt, T.M.; Zhou, F. Patient characteristics and costs associated with COVID-19–related medical care among Medicare fee-for-service beneficiaries. Ann. Intern. Med. 2021, 174, 1101–1109. [Google Scholar] [CrossRef]
- Gural, A. Algorithmic Techniques for Neural Network Training on Memory-Constrained Hardware; Stanford University: Stanford, CA, USA, 2021. [Google Scholar]
- Faes, C.; Abrams, S.; Van Beckhoven, D.; Meyfroidt, G.; Vlieghe, E.; Hens, N.; Belgian Collaborative Group on COVID-19 Hospital Surveillance. Time between symptom onset, hospitalisation and recovery or death: Statistical analysis of Belgian COVID-19 patients. Int. J. Environ. Res. Public Health 2020, 17, 7560. [Google Scholar] [CrossRef]
- Muniyappa, R.; Gubbi, S. COVID-19 pandemic, coronaviruses, and diabetes mellitus. Am. J. Physiol.-Endocrinol. Metab. 2020, 318, E736–E741. [Google Scholar] [CrossRef]
- Tavakolian, A.; Hajati, F.; Rezaee, A.; Fasakhodi, A.O.; Uddin, S. Fast COVID-19 versus H1N1 screening using Optimized Parallel Inception. Expert Syst. Appl. 2022, 204, 117551. [Google Scholar] [CrossRef]
- Arnaud, É.; Elbattah, M.; Gignon, M.; Dequen, G. Deep learning to predict hospitalization at triage: Integration of structured data and unstructured text. In Proceedings of the 2020 IEEE International Conference on Big Data (Big Data), Atlanta, GA, USA, 10–13 December 2020; pp. 4836–4841. [Google Scholar]
- Shinde, P.P.; Shah, S. A review of machine learning and deep learning applications. In Proceedings of the 2018 Fourth International Conference on Computing Communication Control and Automation (ICCUBEA), Pune, India, 16–18 August 2018; pp. 1–6. [Google Scholar]
- Desai, K.M.; Survase, S.A.; Saudagar, P.S.; Lele, S.; Singhal, R.S. Comparison of artificial neural network (ANN) and response surface methodology (RSM) in fermentation media optimization: Case study of fermentative production of scleroglucan. Biochem. Eng. J. 2008, 41, 266–273. [Google Scholar] [CrossRef]
- Alloghani, M.; Aljaaf, A.; Hussain, A.; Baker, T.; Mustafina, J.; Al-Jumeily, D.; Khalaf, M. Implementation of machine learning algorithms to create diabetic patient re-admission profiles. BMC Med. Inform. Decis. Mak. 2019, 19, 253. [Google Scholar] [CrossRef]
- Mai, Q. A review of discriminant analysis in high dimensions. Wiley Interdiscip. Rev. Comput. Stat. 2013, 5, 190–197. [Google Scholar] [CrossRef]
- Pranckevičius, T.; Marcinkevičius, V. Comparison of naive bayes, random forest, decision tree, support vector machines, and logistic regression classifiers for text reviews classification. Balt. J. Mod. Comput. 2017, 5, 221. [Google Scholar] [CrossRef]
- Hammoudeh, A.; Al-Naymat, G.; Ghannam, I.; Obied, N. Predicting hospital readmission among diabetics using deep learning. Procedia Comput. Sci. 2018, 141, 484–489. [Google Scholar] [CrossRef]
- Mingle, D. Predicting diabetic readmission rates: Moving beyond Hba1c. Curr. Trends Biomed. Eng. Biosci. 2017, 7, 555707. [Google Scholar] [CrossRef]
- Voyant, C.; Notton, G.; Kalogirou, S.; Nivet, M.L.; Paoli, C.; Motte, F.; Fouilloy, A. Machine learning methods for solar radiation forecasting: A review. Renew. Energy 2017, 105, 569–582. [Google Scholar] [CrossRef]
- Chauhan, V.K.; Dahiya, K.; Sharma, A. Problem formulations and solvers in linear SVM: A review. Artif. Intell. Rev. 2019, 52, 803–855. [Google Scholar] [CrossRef]
- Morton, A.; Marzban, E.; Giannoulis, G.; Patel, A.; Aparasu, R.; Kakadiaris, I.A. A comparison of supervised machine learning techniques for predicting short-term in-hospital length of stay among diabetic patients. In Proceedings of the 2014 13th International Conference on Machine Learning and Applications, Detroit, MI, USA, 3–6 December 2014; pp. 428–431. [Google Scholar]
- Yakovlev, A.; Metsker, O.; Kovalchuk, S.; Bologova, E. Prediction of in-hospital mortality and length of stay in acute coronary syndrome patients using machine-learning methods. J. Am. Coll. Cardiol. 2018, 71, A242. [Google Scholar] [CrossRef]
- Tsai, P.F.J.; Chen, P.C.; Chen, Y.Y.; Song, H.Y.; Lin, H.M.; Lin, F.M.; Huang, Q.P. Length of hospital stay prediction at the admission stage for cardiology patients using artificial neural network. J. Healthc. Eng. 2016, 2016, 7035463. [Google Scholar] [CrossRef] [PubMed]
- Wang, S.; McDermott, M.B.; Chauhan, G.; Ghassemi, M.; Hughes, M.C.; Naumann, T. Mimic-extract: A data extraction, preprocessing, and representation pipeline for mimic-iii. In Proceedings of the ACM Conference on Health, Inference, and Learning, Toronto, ON, Canada, 2–4 April 2020; pp. 222–235. [Google Scholar]
- Rafiei, A.; Rezaee, A.; Hajati, F.; Gheisari, S.; Golzan, M. SSP: Early prediction of sepsis using fully connected LSTM-CNN model. Comput. Biol. Med. 2021, 128, 104110. [Google Scholar] [CrossRef]
- Nallabasannagari, A.R.; Reddiboina, M.; Seltzer, R.; Zeffiro, T.; Sharma, A.; Bhandari, M. All Data Inclusive, Deep Learning Models to Predict Critical Events in the Medical Information Mart for Intensive Care III Database (MIMIC III). arXiv 2020, arXiv:2009.01366. [Google Scholar]
- Albahli, S.; Meraj, T.; Chakraborty, C.; Rauf, H.T. AI-driven deep and handcrafted features selection approach for COVID-19 and chest related diseases identification. Multimed. Tools Appl. 2022, 81, 37569–37589. [Google Scholar] [CrossRef] [PubMed]
- Rehman, N.U.; Zia, M.S.; Meraj, T.; Rauf, H.T.; Damaševičius, R.; El-Sherbeeny, A.M.; El-Meligy, M.A. A self-activated CNN approach for multi-class chest-related COVID-19 detection. Appl. Sci. 2021, 11, 9023. [Google Scholar] [CrossRef]
- Mahboub, B.; Al Bataineh, M.T.; Alshraideh, H.; Hamoudi, R.; Salameh, L.; Shamayleh, A. Prediction of COVID-19 hospital length of stay and risk of death using artificial intelligence-based modeling. Front. Med. 2021, 8, 592336. [Google Scholar] [CrossRef] [PubMed]
- Nemati, M.; Ansary, J.; Nemati, N. Machine-learning approaches in COVID-19 survival analysis and discharge-time likelihood prediction using clinical data. Patterns 2020, 1, 100074. [Google Scholar] [CrossRef] [PubMed]
- Ajit, A.; Acharya, K.; Samanta, A. A review of convolutional neural networks. In Proceedings of the 2020 International Conference on Emerging Trends in Information Technology and Engineering (ic-ETITE), Vellore, India, 24–25 February 2020; pp. 1–5. [Google Scholar]
- Strack, B.; DeShazo, J.P.; Gennings, C.; Olmo, J.L.; Ventura, S.; Cios, K.J.; Clore, J.N. Impact of HbA1c measurement on hospital readmission rates: Analysis of 70,000 clinical database patient records. BioMed Res. Int. 2014, 2014, 781670. [Google Scholar] [CrossRef]
- Quan, H.; Sundararajan, V.; Halfon, P.; Fong, A.; Burnand, B.; Luthi, J.C.; Saunders, L.D.; Beck, C.A.; Feasby, T.E.; Ghali, W.A. Coding algorithms for defining comorbidities in ICD-9-CM and ICD-10 administrative data. Med. Care 2005, 43, 1130–1139. [Google Scholar] [CrossRef]
- Xu, B.; Kraemer, M.U. Open access epidemiological data from the COVID-19 outbreak. Lancet 2020, 20, 534. [Google Scholar] [CrossRef]
- Johnson, A.E.; Pollard, T.J.; Shen, L.; Li-Wei, H.L.; Feng, M.; Ghassemi, M.; Moody, B.; Szolovits, P.; Celi, L.A.; Mark, R.G. MIMIC-III, a freely accessible critical care database. Sci. Data 2016, 3, 160035. [Google Scholar] [CrossRef]
- Sun, Y.; Xue, B.; Zhang, M.; Yen, G.G.; Lv, J. Automatically designing CNN architectures using the genetic algorithm for image classification. IEEE Trans. Cybern. 2020, 50, 3840–3854. [Google Scholar] [CrossRef] [PubMed]
- Peng, Y.; Nagata, M.H. An empirical overview of nonlinearity and overfitting in machine learning using COVID-19 data. Chaos Solitons Fractals 2020, 139, 110055. [Google Scholar] [CrossRef] [PubMed]
- Tavakolian, A.; Hajati, F.; Rezaee, A.; Fasakhodi, A.O.; Uddin, S. Source code Optimized Parallel Inception: A fast COVID-19 screening software. Softw. Impacts 2022, 13, 100337. [Google Scholar] [CrossRef] [PubMed]
- Luo, G. A review of automatic selection methods for machine learning algorithms and hyper-parameter values. Netw. Model. Anal. Health Inform. Bioinform. 2016, 5, 18. [Google Scholar] [CrossRef]
- Isa, S.M.; Suwandi, R.; Andrean, Y.P. Optimizing the Hyperparameter of Feature Extraction and Machine Learning Classification Algorithms. Int. J. Adv. Comput. Sci. Appl. 2019, 10, 69–76. [Google Scholar] [CrossRef]
- Kumar, A.; Kumar, D.; Jarial, S. A review on artificial bee colony algorithms and their applications to data clustering. Cybern. Inf. Technol. 2017, 17, 3–28. [Google Scholar] [CrossRef]
- García, S.; Luengo, J.; Herrera, F. Tutorial on practical tips of the most influential data preprocessing algorithms in data mining. Knowl.-Based Syst. 2016, 98, 1–29. [Google Scholar] [CrossRef]
- Daghistani, T.A.; Elshawi, R.; Sakr, S.; Ahmed, A.M.; Al-Thwayee, A.; Al-Mallah, M.H. Predictors of in-hospital length of stay among cardiac patients: A machine learning approach. Int. J. Cardiol. 2019, 288, 140–147. [Google Scholar] [CrossRef]
- Gowd, A.K.; Agarwalla, A.; Amin, N.H.; Romeo, A.A.; Nicholson, G.P.; Verma, N.N.; Liu, J.N. Construct validation of machine learning in the prediction of short-term postoperative complications following total shoulder arthroplasty. J. Shoulder Elb. Surg. 2019, 28, e410–e421. [Google Scholar] [CrossRef]
- Guo, A.; Lu, J.; Tan, H.; Kuang, Z.; Luo, Y.; Yang, T.; Xu, J.; Yu, J.; Wen, C.; Shen, A. Risk factors on admission associated with hospital length of stay in patients with COVID-19: A retrospective cohort study. Sci. Rep. 2021, 11, 7310. [Google Scholar] [CrossRef]
- Kumar, R.N.; Kumar, M.A. Enhanced fuzzy K-NN approach for handling missing values in medical data mining. Indian J. Sci. Technol. 2016, 9, 1–6. [Google Scholar]
- Rodríguez, P.; Bautista, M.A.; Gonzalez, J.; Escalera, S. Beyond one-hot encoding: Lower dimensional target embedding. Image Vis. Comput. 2018, 75, 21–31. [Google Scholar] [CrossRef]
- Gikunda, P.K.; Jouandeau, N. State-of-the-art convolutional neural networks for smart farms: A review. In Proceedings of the Intelligent Computing-Proceedings of the Computing Conference, London, UK, 16–17 July 2019; Springer: Berlin/Heidelberg, Germany, 2019; pp. 763–775. [Google Scholar]
- Popel, M.H.; Hasib, K.M.; Habib, S.A.; Shah, F.M. A hybrid under-sampling method (HUSBoost) to classify imbalanced data. In Proceedings of the 2018 21st International Conference of Computer and Information Technology (ICCIT), Dhaka, Bangladesh, 21–23 December 2018; pp. 1–7. [Google Scholar]
- Li, Y.; Xia, J.; Zhang, S.; Yan, J.; Ai, X.; Dai, K. An efficient intrusion detection system based on support vector machines and gradually feature removal method. Expert Syst. Appl. 2012, 39, 424–430. [Google Scholar] [CrossRef]
- Yang, S.; Gu, L.; Li, X.; Jiang, T.; Ren, R. Crop classification method based on optimal feature selection and hybrid CNN-RF networks for multi-temporal remote sensing imagery. Remote Sens. 2020, 12, 3119. [Google Scholar] [CrossRef]
- Miao, X.; Wu, Y.; Wang, J.; Gao, Y.; Mao, X.; Yin, J. Generative semi-supervised learning for multivariate time series imputation. In Proceedings of the AAAI Conference on Artificial Intelligence, Virtual Event, 2–9 February 2021; Volume 35, pp. 8983–8991. [Google Scholar]
- Balasch, A.; Beinhofer, M.; Zauner, G. The Relative Confusion Matrix, a Tool to Assess Classifiablility in Large Scale Picking Applications. In Proceedings of the 2020 IEEE International Conference on Robotics and Automation (ICRA), Paris, France, 31 May–31 August 2020; pp. 8390–8396. [Google Scholar]
- Tamin, F.; Iswari, N.M.S. Implementation of C4. 5 algorithm to determine hospital readmission rate of diabetes patient. In Proceedings of the 2017 4th International Conference on New Media Studies (CONMEDIA), Yogyakarta, Indonesia, 8–10 November 2017; pp. 15–18. [Google Scholar]
- Alturki, L.; Aloraini, K.; Aldughayshim, A.; Albahli, S. Predictors of Readmissions and Length of Stay for Diabetes Related Patients. In Proceedings of the 2019 IEEE/ACS 16th International Conference on Computer Systems and Applications (AICCSA), Abu Dhabi, United Arab Emirates, 3–7 November 2019; pp. 1–8. [Google Scholar]
- Goudjerkan, T.; Jayabalan, M. Predicting 30-day hospital readmission for diabetes patients using multilayer perceptron. Int. J. Adv. Comput. Sci. Appl. 2019, 10. [Google Scholar] [CrossRef]
- Seraphim, I.; Ravi, V.; Rajagopal, A. Prediction of Diabetes Readmission using Machine Learning. Int. J. Adv. Sci. Technol. 2020, 29, 42–49. [Google Scholar]
- Norbrun, G. Reduction of Hospital Readmissions in Patients with a Diagnosis of COPD: An Integrative Review. Doctoral Dissertation, Liberty University, Lynchburg, VA, USA, 2021. [Google Scholar]
- Gentimis, T.; Ala’J, A.; Durante, A.; Cook, K.; Steele, R. Predicting hospital length of stay using neural networks on mimic iii data. In Proceedings of the 2017 IEEE 15th Intl Conf on Dependable, Autonomic and Secure Computing, 15th Intl Conf on Pervasive Intelligence and Computing, 3rd Intl Conf on Big Data Intelligence and Computing and Cyber Science and Technology Congress (DASC/PiCom/DataCom/CyberSciTech), Orlando, FL, USA, 6–10 November 2017; pp. 1194–1201. [Google Scholar]
- Steele, R.J.; Thompson, B. Data mining for generalizable pre-admission prediction of elective length of stay. In Proceedings of the 2019 IEEE 9th Annual Computing and Communication Workshop and Conference (CCWC), Las Vegas, NV, USA, 7–9 January 2019; pp. 0127–0133. [Google Scholar]
- Etu, E.E.; Monplaisir, L.; Arslanturk, S.; Masoud, S.; Aguwa, C.; Markevych, I.; Miller, J. Prediction of Length of Stay in the Emergency Department for COVID-19 Patients: A Machine Learning Approach. IEEE Access 2022, 10, 42243–42251. [Google Scholar] [CrossRef]
- Alabbad, D.A.; Almuhaideb, A.M.; Alsunaidi, S.J.; Alqudaihi, K.S.; Alamoudi, F.A.; Alhobaishi, M.K.; Alaqeel, N.A.; Alshahrani, M.S. Machine learning model for predicting the length of stay in the intensive care unit for COVID-19 patients in the eastern province of Saudi Arabia. Inform. Med. Unlocked 2022, 30, 100937. [Google Scholar] [CrossRef] [PubMed]
- Déjean, S.; Ionescu, R.T.; Mothe, J.; Ullah, M.Z. Forward and backward feature selection for query performance prediction. In Proceedings of the 35th Annual ACM Symposium on Applied Computing, Brno, Czech Republic, 30 March–3 April 2020; pp. 690–697. [Google Scholar]
- Pellerin, R.; Perrier, N.; Berthaut, F. A survey of hybrid metaheuristics for the resource-constrained project scheduling problem. Eur. J. Oper. Res. 2020, 280, 395–416. [Google Scholar] [CrossRef]


| Authors | Dataset | Model | Accuracy (%) | Strengths/Weakness |
|---|---|---|---|---|
| Alloghani et al. [15] (2019) | Diabetes | naive Bayesian | 65 | -/Weak performance, relatively old method. |
| Hammoudeh et al. [18] (2018) | Diabetes | CNN | 80 | High performance/Only two classes of readmission were predicted. |
| Mingle et al. [19] (2017) | Diabetes | Gradient boosted trees | 78 | -/Poor performance |
| Morton et al. [22] (2014) | Diabetes | SVM+ | 68 | -/Poor performance for discriminating between short and long term LOS, relatively old method. |
| Mahboub et al. [30] (2021) | COVID-19 | Decision Tree | 50 | -/Poor performance, relatively old method. |
| Mahboub et al. [30] (2021) | COVID-19 | gradient boost algorithm | 72 | -/Poor performance, No hyperparameter tuning was performed. |
| Wang et al. [25] (2020) | ICU | LSTM | 84 | High performance/No hyperparameter tuning was performed. |
| Nallabasannagari et al. [27] (2020) | ICU | MLP | 66 | -/Weak performance, No augmentation method was used. |
| Dataset Name | Number of Instances | Number of Features | Gender | Collected Years | LOS Range |
|---|---|---|---|---|---|
| Diabates | 101,766 | 50 (37 descriptive and 13 numerical features) | 53.8% male, 46.2% female | 1999–2008 | (0–14] |
| COVID-19 | 1085 | 23 (17 descriptive and 6 numerical features) | 64.7% male, 35.3% female | 2020–2021 | (0–30] |
| ICU | 58,976 | 28 (9 descriptive and 19 numerical features) | 59.1% male, 41.9% female | 2001–2012 | (0–294] |
| Model | Accuracy (%) | Sensitivity (%) | Specificity (%) | F-Measure (%) | Precision (%) |
|---|---|---|---|---|---|
| GAOCNN | 97.2 | 96.7 | 99.3 | 96.9 | 97.1 |
| VGG16 | 38.0 | 38.2 | 37.8 | 45.6 | 38.2 |
| ResNet | 38.0 | 38.2 | 38 | 44.2 | 38.2 |
| GoogLeNet | 39.6 | 38.4 | 50.3 | 38.4 | 38.4 |
| LR | 86.8 | 86.8 | 93.4 | 86.8 | 86.8 |
| RF | 90.0 | 94.4 | 96.5 | 90.0 | 90.0 |
| XGB | 94.4 | 94.4 | 97.8 | 94.4 | 94.5 |
| SVM | 94.9 | 94.3 | 98.4 | 94.9 | 94.9 |
| CNN + LR | 87.5 | 86.5 | 94.2 | 87.5 | 87.4 |
| CNN + RF | 91.7 | 91.4 | 96.8 | 91.7 | 91.7 |
| CNN + XGB | 94.8 | 94.6 | 98.9 | 94.8 | 94.8 |
| CNN + SVM | 95.1 | 95.1 | 95.1 | 95.1 | 95.1 |
| SGANs | 58.9 | 51.7 | 52.6 | 56.9 | 63.3 |
| Model | Accuracy (%) | Sensitivity (%) | Specificity (%) | F1-Measure (%) | Precision (%) |
|---|---|---|---|---|---|
| GAOCNN | 89.0 | 89.8 | 97.8 | 90.2 | 90.4 |
| VGG16 | 18.1 | 18.1 | 25.4 | 18.1 | 18.1 |
| ResNet | 17.7 | 17.7 | 20.8 | 17.7 | 17.7 |
| GoogLeNet | 28.6 | 2.3 | 35.6 | 4.5 | 67.9 |
| LR | 28.9 | 28.9 | 32.6 | 26.4 | 26.3 |
| RF | 79.9 | 79.9 | 92.7 | 79.7 | 79.6 |
| XGB | 78.8 | 78.8 | 92.6 | 78.3 | 77.9 |
| SVM | 36.5 | 33.5 | 42.3 | 32.1 | 31.9 |
| CNN + LR | 32.7 | 32.7 | 45.3 | 31.3 | 30.9 |
| CNN + RF | 80.0 | 80.0 | 93.4 | 79.7 | 79.6 |
| CNN + XGB | 78.8 | 78.8 | 94.4 | 78.3 | 77.9 |
| CNN + SVM | 36.2 | 36.2 | 43.3 | 34.8 | 34.5 |
| SGANs | 43.5 | 14.9 | 75.1 | 23.6 | 72.9 |
| Model | Accuracy (%) | Sensitivity (%) | Specificity (%) | F1-Measure (%) | Precision (%) |
|---|---|---|---|---|---|
| GAOCNN | 99.4 | 99.4 | 99.8 | 99.4 | 99.4 |
| VGG16 | 14.1 | 14.6 | 20.5 | 14.6 | 14.6 |
| ResNet | 12.7 | 12.7 | 17.8 | 12.7 | 12.7 |
| LR | 92.1 | 92.1 | 98.8 | 92.1 | 92.3 |
| RF | 89.3 | 89.3 | 95.6 | 89.2 | 89.1 |
| XGB | 91.4 | 91.4 | 98.4 | 91.4 | 91.3 |
| SVM | 84.7 | 84.7 | 92.8 | 84.7 | 84.8 |
| CNN + LR | 70.3 | 70.3 | 89.9 | 70.2 | 70.6 |
| CNN + RF | 87.3 | 87.3 | 96.1 | 87.3 | 87.4 |
| CNN + XGB | 87.7 | 87.7 | 96.2 | 87.8 | 88.6 |
| CNN + SVM | 81.3 | 81.3 | 92.5 | 81.3 | 81.8 |
| SGANs | 93.5 | 93.3 | 98.8 | 93.6 | 93.9 |
| Model | Accuracy (%) | Sensitivity (%) | Specificity (%) | F1-Measure (%) | Precision (%) |
|---|---|---|---|---|---|
| GAOCNN | 94.1 | 94.0 | 98.8 | 94.2 | 94.5 |
| VGG16 | 10.1 | 10.1 | 20.6 | 10.1 | 10.1 |
| ResNet | 8.7 | 28.7 | 8.9 | 17.7 | 17.7 |
| GoogLeNet | 17.7 | 15.9 | 42.6 | 25.2 | 60.1 |
| LR | 43.9 | 43.9 | 65.1 | 38.4 | 36.2 |
| RF | 76.1 | 76.1 | 89.6 | 76.1 | 76.0 |
| XGB | 83.5 | 83.5 | 93.7 | 83.3 | 83.2 |
| SVM | 56.0 | 59.4 | 83.3 | 56.1 | 56.0 |
| CNN + LR | 43.6 | 43.6 | 72.7 | 42.4 | 41.8 |
| CNN + RF | 80.9 | 80.9 | 90.6 | 80.9 | 81.0 |
| CNN + XGB | 83.2 | 83.2 | 96.5 | 83.1 | 82.9 |
| CNN + SVM | 39.8 | 39.8 | 59.0 | 39.3 | 39.6 |
| SGANs | 56.1 | 45.7 | 92.6 | 54.5 | 67.7 |
| Authors | Accuracy (%) | AUROC (%) |
|---|---|---|
| Tamin and Iswari [55] (2017) | 75.9 | - |
| Hammoudeh et al. [18] (2018) | 92 | 95 |
| Popel et al. [50] (2018) | 82.27 | - |
| Alturki et al. [56] (2019) | 94.8 | - |
| Goudjerkan and Jayabalan [57] (2019) | 95 | 95 |
| Seraphim et al. [58] (2020) | 86 | 66.7 |
| Norbrun [59] (2021) | 89.7 | 96 |
| GAOCNN | 97.2 | 99 |
| Authors | Number of Classes | Accuracy (%) | AUROC (%) | Dataset |
|---|---|---|---|---|
| Gentimis et al. [60] (2017) | 2 | 79.8 | - | MIMIC-III |
| Steele and Thompson [61] (2019) | 2 | 87.7 | 88 | Diabetes |
| Alturki et al. [56] (2019) | 3 | 85.4 | - | Diabetes |
| Nallabasannagari et al. [27] (2020) | 2 | 66.2 | 88 | MIMIC-III |
| Wang et al. [25] (2020) | 2 | 68.3 | 73.3 | MIMIC-III |
| Wang et al. [25] (2020) | 2 | 91.2 | 71 | MIMIC-III |
| Etu et al. [62] (2022) | 2 | 85 | 93 | COVID-19 |
| Alabbad et al. [63] (2022) | 9 | 94.16 | - | COVID-19 |
| GAOCNN | 7 | 89 | 96 | Diabetes |
| GAOCNN | 13 | 94.1 | 99 | MIMIC-III |
| GAOCNN | 9 | 99.4 | 99 | COVID-19 |
Disclaimer/Publisher’s Note: The statements, opinions and data contained in all publications are solely those of the individual author(s) and contributor(s) and not of MDPI and/or the editor(s). MDPI and/or the editor(s) disclaim responsibility for any injury to people or property resulting from any ideas, methods, instructions or products referred to in the content. |
© 2023 by the authors. Licensee MDPI, Basel, Switzerland. This article is an open access article distributed under the terms and conditions of the Creative Commons Attribution (CC BY) license (https://creativecommons.org/licenses/by/4.0/).
Share and Cite
Tavakolian, A.; Rezaee, A.; Hajati, F.; Uddin, S. Hospital Readmission and Length-of-Stay Prediction Using an Optimized Hybrid Deep Model. Future Internet 2023, 15, 304. https://doi.org/10.3390/fi15090304
Tavakolian A, Rezaee A, Hajati F, Uddin S. Hospital Readmission and Length-of-Stay Prediction Using an Optimized Hybrid Deep Model. Future Internet. 2023; 15(9):304. https://doi.org/10.3390/fi15090304
Chicago/Turabian StyleTavakolian, Alireza, Alireza Rezaee, Farshid Hajati, and Shahadat Uddin. 2023. "Hospital Readmission and Length-of-Stay Prediction Using an Optimized Hybrid Deep Model" Future Internet 15, no. 9: 304. https://doi.org/10.3390/fi15090304