Article

A Multiverse Graph to Help Scientific Reasoning from Web Usage: Interpretable Patterns of Assessor Shifts in GRAPHYP

1
Dionysian Economics Laboratory (LED), University of Paris 8, 93200 Saint-Denis, France
2
German Centre for Higher Education Research and Science Studies (DZHW), 10117 Berlin, Germany
3
GERiiCO-Labor, Groupe d’Études et de Recherche Interdisciplinaire en Information et Communication, University of Lille, 59000 Lille, France
4
Aix Marseille University (AMU), CNRS, LIS, 13007 Marseille, France
5
Observatoire de Paris, PSL University, 75006 Paris, France
*
Author to whom correspondence should be addressed.
Future Internet 2023, 15(4), 147; https://doi.org/10.3390/fi15040147
Submission received: 20 March 2023 / Revised: 4 April 2023 / Accepted: 7 April 2023 / Published: 10 April 2023
(This article belongs to the Special Issue Information Retrieval on the Semantic Web)

Abstract

:
The digital support for scientific reasoning presents contrasting results. Bibliometric services are improving, but not academic assessment; no service for scholars relies on logs of web usage to base query strategies for relevance judgments (or assessor shifts). Our Scientific Knowledge Graph GRAPHYP innovates with interpretable patterns of web usage, providing scientific reasoning with conceptual fingerprints and helping identify eligible hypotheses. In a previous article, we showed how usage log data, in the form of ‘documentary tracks’, help determine distinct cognitive communities (called adversarial cliques) within sub-graphs. A typology of these documentary tracks through a triplet of measurements from logs (intensity, variety and attention) describes the potential approaches to a (research) question. GRAPHYP assists interpretation as a classifier, with possibilistic graphical modeling. This paper shows what this approach can bring to scientific reasoning; it involves visualizing complete interpretable pathways, in a multi-hop assessor shift, which users can then explore toward the ‘best possible solution’—the one that is most consistent with their hypotheses. Applying the Leibnizian paradigm of scientific reasoning, GRAPHYP highlights infinitesimal learning pathways, as a ‘multiverse’ geometric graph in modeling possible search strategies answering research questions.

Graphical Abstract

1. Introduction

In general, the scientific approach is based on reading and possibly on citing articles previously published on the same research question, including articles which may be defended or, on the contrary, criticized, in cases in which a subject is controversial. How can we make better use of the documentary tracks revealed by the traces left by previous users of scientific publication servers? How can we use these documentary tracks to assist the scientific reasoning of new users exploring the same research problem? These are questions that motivate the present work, in the continuation of a paper [1] dedicated to a new knowledge graph model, GRAPHYP, and its application to identify adversarial scientific communities. Our hypothesis is that a comprehensive modeling of web usage logs can make it possible to represent the main directions of answers that researchers have previously given to a research question.
Recent developments in Artificial Intelligence (AI) suggest that new answers to these questions are possible but require additional research on science analytics and data modeling. Although ubiquitous, AI abilities to contribute to human reasoning still resist comprehensive and stable scientific categorization. For example, common sense reasoning is still insufficiently assessed considering all related aspects, as noted by Davis [2], relying on a survey of no less than 139 benchmarks. Categorization is also challenging regarding AI’s abilities to support scientific reasoning, which remains a matter of debate. Either Artificial Intelligence is seen as a threat due to its “dark sides” [3], or, on the contrary, it is studied extensively across a wide range of methodologies as a “powerful paradigm in scientific research” [4].
However, the current digital support for scientific reasoning in the communication of scholarly knowledge, despite intensive research [5], leads to unsatisfactory results; the assistance for scientific reasoning is still deemed embryonic [6]. Such a shortcoming raises a paradox and a priority.
The paradox is between, on the one hand, a strong incentive for “continuous online learning” in science; legislation steering the web and data mining in research has multiplied over the last decade on a global scale, in the USA and Japan, followed by the UK in 2014, France in 2016, Germany in 2017 and an EC Directive in 2022. On the other hand, there are few initiatives for modeling web usage technologies for the benefit of scientific reasoning. Search log data recorded from scholarly research remain either concealed or hidden [7] and always underexploited. However, these are data from the “reverse side of the coin” of web technologies. On one side is the response to a request; on the other is the trace left on the origin and the nature of the asked question. Abundant new knowledge can be captured in this context from web usage, with the aim of helping scientific reasoning by representing the choices of predecessors in the framework of continuous online learning.
This article aims to be a contribution in that direction. We present hereunder the motivation, the problem and the results.

1.1. Motivation: Turning Assistance to Scientific Reasoning into ‘Continuous Online Learning’

Scientific reasoning currently benefits from bibliometric services bringing new logic and new tools in the analysis of results, categorized where necessary in Scientific Knowledge Graphs (SKGs). In addition, the ORKG community (Open Research Knowledge Graph https://orkg.org/) recommends a significant extension of the representation of alternative assessments of scientific results. However, we currently observe that no digital service is available to assist scientific reasoning in canonical hypothesis-based science.
In that direction, it appears fruitful to start by collecting and modeling the search experience of researchers. As mentioned previously, this was our approach when we proposed GRAPHYP, a conceptual framework informed and modeled from the search experience of scholars who have explored the same research question [1]. From this descriptive conceptual framework, we now approach the process of the documentary choice of users/researchers among the available representations of data and documents. For this, we propose the modeling, again from the analysis of logs, of ‘interpretable patterns’ of changes in document judgment (‘assessor shifts’) coupled with the corresponding documentary tracks. The objective of the present study is to propose solutions to represent such interpretable patterns of assessor shifts through the comprehensive modeling of adversarial query strategies on a knowledge graph.
We observe that, today, it is hardly possible to explore eligible theories on the basis of a cartography of the uses of interrogation and choices of predecessors obtained via data mining techniques. Satisfying this need is our first motivation, in a framework of ‘continuous online learning’, also taking into account the dynamics of the evolution of scientific categorizations.
As we know, scientific information is constantly changing due to the daily stockpiling of new contributions in all fields, and categorizations are impacted by the ever-changing reactions (citations, annotations, social media features, etc.) of cognitive communities. In addition, an assessor’s shift in document judgment is depicted as being “relatively relevant”, as assessors often disagree about relevance and can be inconsistent among themselves [8]. Moreover, the epistemological directions of assessment can reveal contrast, whereas studies experimenting with the large-scale use of the same data show a radical dispersion of results [9]. The ability of AI to produce new outcomes from graphs of web usage data—already a long story [10]—receives with our research an additional extension; “continuous online learning” aims to connect comprehensive dynamic adaptations in the vocabulary and syntax of scientific reasoning, and to analyze the incoming flow of data and contributions.
Despite the construction of continuous online learning, the risk for science prevails in that the web content may spread without timely updates and without relevant concepts, in a “Tower of Babel” effect, driven by growing interactions of plain scientific categorizations that are barely updated. However, even though web mining technology is extensively practiced in scientific applications, there is still hardly any Scientific Knowledge Graph providing users with comprehensive dynamic modeling of the “commonwealth” of web usage and proposing a language for its interpretation; GRAPHYP 2 is intended to be a contribution in this direction.

1.2. Modeling an ‘Assessor’s Shift’ in Assistance to Scientific Reasoning

We come later (Section 2, Background) to the corpus of the literature that underlies our “multiverse graph for scientific reasoning”. The main assumptions for the development of GRAPHYP 2 (GR2) are first sketched below to provide a perspective to our research question. Research methods are developed in Section 3.
We assume that the assistance to scientific reasoning should rely on data captured from web usage traces, left in usage logs or in a restricted form, from any dataset equipped with a log record. The challenge is then to model differing uses and changing choices (assessor shifts) that the user can encounter, simulate and interpret, by visualizing and modeling the ‘documentary tracks’ (i.e., the profile of the documents consulted by the users of similar queries on a research question).
In a previous article [1], we published a background of our methodology, GRAPHYP 1, hereafter called GR1, depicting documentary tracks of scientific literature in retrievable cliques of interpretable adversarial subgraphs. In what follows, with an extended methodology, hereafter called GR2, we seek to model the documentary choices made by previous users in order to detect assessor shifts between documentary tracks. Our primary goal is to show that web usage modeling can serve as an aid to scientific reasoning, when taking advantage of the “assessor shifts” recorded during previous search experiments. GRAPHYP thus functions as a Graph Adversarial Network, in which GR1 is a “generator” of assessments (here, modeled documentary tracks) and GR2 a “discriminator” of modeled patterns [11] between assessment shifts.
With these two successive functions, GRAPHYP offers an original type of aid to scientific reasoning; in fact, it is neither a model for interpreting scientific documents nor a “discovery tool” documenting alternative theories. The added value of GRAPHYP is its production of a complete model of the documentary practices of a scientific subject by representing the contradictory paths and the patterns of choice that can be modeled between them. It aims to stimulate the understanding of the evaluations and to facilitate a possible change in evaluation, or assessor shift, that the choice of the users can privilege, according to their research question. The specific originality of this type of browser is its operation on an inverted matrix. It does not list the answers to a question as a classic browser does, but it represents the possible practices of answering a question (hypergraph modeling) and their uses (recorded logs of responses positioned on the hypergraph). The concept of GRAPHYP is essentially a modeling of the adversarial use of the web during a search and an identification of the changes in the appreciation of the relevance of documents.
We observe that assessment shift digital representations are important units of data in the support of scientific reasoning, and that there is currently no modeling of those representations. In addition, we note the importance for scientific reasoning of displaying disputes and controversies. A recent bibliometric analysis, studying scientific disagreements on a large scale [12], highlights the importance of “relative differences” as well as the “heterogeneity” of observed practices of disagreements. We therefore speculate that the representation of differences in retrieval practices of predecessors in cliques, which is a result that AI can perform with neutrality, can help users verify and secure their own assessment shifts on methods or on results, with regard to the observed usage of the other members of a cognitive community, labeled by keywords.
Our research question is thus as follows: How can we assist scientific reasoning with comprehensive representations of adversarial documentary tracks as a generator (see GR1 [1]), which can both be meaningful and usable to enable understanding in a discriminator (GR2)?
The analysis of assessor shifts can allow identifying which documentary “world” the assessor’s search experience belongs to; secondly, what the other possible documentary choices are for the same keyword, regardless of the assessment they represent; and third, what the “best possible” modelized documentary track is, in the assessor’s opinion. The judge here is the assessor. The documentary tracks are modeled data in a discriminator, and the assessor is the human in the loop.
The research question thus becomes the following: Which bodies of literature can we mobilize, and to what extent, to build the modeling of GRAPHYP2? Two main bodies of literature shall be mobilized. One deals with web usage mining to collect and model data, and the other deals with the methodologies of AI for aiding scientific reasoning in that context in this context.
Web usage log analysis and the interpretation of log data in scientific activities cover already some important tasks in research practices, for instance, in the comparison of exploration strategies across ontologies from usage logs in the NCBO BioPortal [13].
In addition, our modeling sources benefit from other fields of research to define assistance for scientific reasoning. The first field is Explainable AI [14], with a wide range of applications in this direction, and a second growing field concerns “message passing” geometric graphs [15].
Scientific reasoning progresses with efficient solutions found from controversies; more generally, in GR2, even more systematically than in GR1, adversarial modeling is at work to represent assessor shift patterns and applications. A resulting problem is that of censoring; with GRAPHYP, we model it via the representation of partial information adjusted to sensitive attributes (classes of documentary tracks), given a utility constraint, in the censoring framework of a geometric hypergraph [16]. In our opinion, current research on possibilistic graphical modeling methodologies [17] confirms the ability of our model in reasoning about assessor shifts in an environment of uncertainty and imprecision.
The type of reasoning analytics that we adopt is causal inference reasoning [18] and a very useful transfer learning methodology [19].
Finally, we link web usage mining techniques and innovative reasoning methodologies to build and use the classifier that is GRAPHYP. We integrate it in an operative type of explainable graph that we call a ‘Multiverse’ graph because it transposes the Leibnizian paradigm of possibilistic logics into the digital space of hypergraph representations [17]. The corresponding research methods are described at the beginning of Section 3.

1.3. Mapping Explainable Dialogue Search/Research with a Multiverse Graph

In GR1, we observed that GRAPHYP “is a graph designed not to represent information, but to model information representation”. By applying our modeling to assessor shifts of researchers, we showed that SKG GRAPHYP is able to describe interpretable pathways among the set of underlying documentary tracks, in a multi-hop assessor shift. We also showed that this approach is helping researchers explore the “best possible” documentary tracks, i.e., that which is the most consistent with their eligible hypotheses. In this way, we found that assessor shifts, coupled with documentary tracks, are key units of data for building up interpretable user pathways. We present in Section 3 a first implementation of these concepts and the results of tests carried out on a large sample of users.
Implemented in GRAPHYP, as observed above, the Leibnizian paradigm of scientific reasoning highlights infinitesimal learning pathways, in the announced new type of ‘multiverse graph’ with additional impacts on search strategies and pattern discovery (see Section 2).
The unit of output in GRAPHYP, a shift in assessment, can be retrieved, compared, simulated, mapped in time and space and analyzed in its qualitative documentary composition (data and analysis). Both of these features leverage existing refinements of web usage log analysis (see Section 2 and Section 3), which offer a wide range of potential services.
Given our assumption, our modeling seeks to provide users with functionalities of assistance to scientific reasoning, insofar as the outcomes of GRAPHYP are as follows:
“indirect”: SKG GRAPHYP does not provide ‘results’, but a comprehensive representation of clickable maps of topologized results;
“intermediary”: It does not deliver any final scientific assessment, but a methodology to reach the documentary set that seems to a scientist as being best adjusted to the hypotheses that are under review, as well as those that the user expects to simulate;
“neutral”: Our typology of classification, not being referred to any assessment on the scientific content of captured documents, deals only with the information profile and content of user logs, formalized in a triplet of parameters measured from anonymized data (see [1] and Appendix A for more details): Intensity (How many readers?), Variety (How many documents?) and Attention (What degree of balance-ratio between the number of readers and number of documents?).
Scheme 1 summarizes our implementation of the conceptual approach of a multiverse graph with two interactive phases (generator/discriminator) in which documentary tracks, recorded from our three variables, can provide a background helping scientific reasoning.
The rest of the paper is organized as follows: Section 2 reviews the background and other works. Section 3 analyzes GRAPHYP’s search of the best possible fit between documentary tracks and eligible theories. Section 4 conducts a discussion. Section 5 presents future works, and Section 6 provides the conclusions.

2. Background and Other Works

2.1. Background

Undiscovered interactions have been searchable treasures since long before the web; web usage gives them incredible extension, provided that there are data identification and comprehensive modeling, as well as ways to query the ‘second world’ of the web that are unevenly explored. At the same time, the Declaration on Research Assessment (DORA) gives high priority to “Reimagining academic assessment” (https://sfdora.org/dora-case-studies/, accessed on 15 March 2023).
For the present work on a ‘Multiverse graph for scientific reasoning’, we propose a background with two components: data and their interpretation. First, we review the literature on data availability and the capture and representation of logs in web usage techniques, with reference to scientific documentation from the perspective of where assessor shifts can be identified. We then review the literature that is applicable to scientific reasoning that is linked to modeling documentary uses and their exploitation and interpretation in relevance judgments. Using Scheme 2 below, we show the background for interpretable patterns of assessor shift.

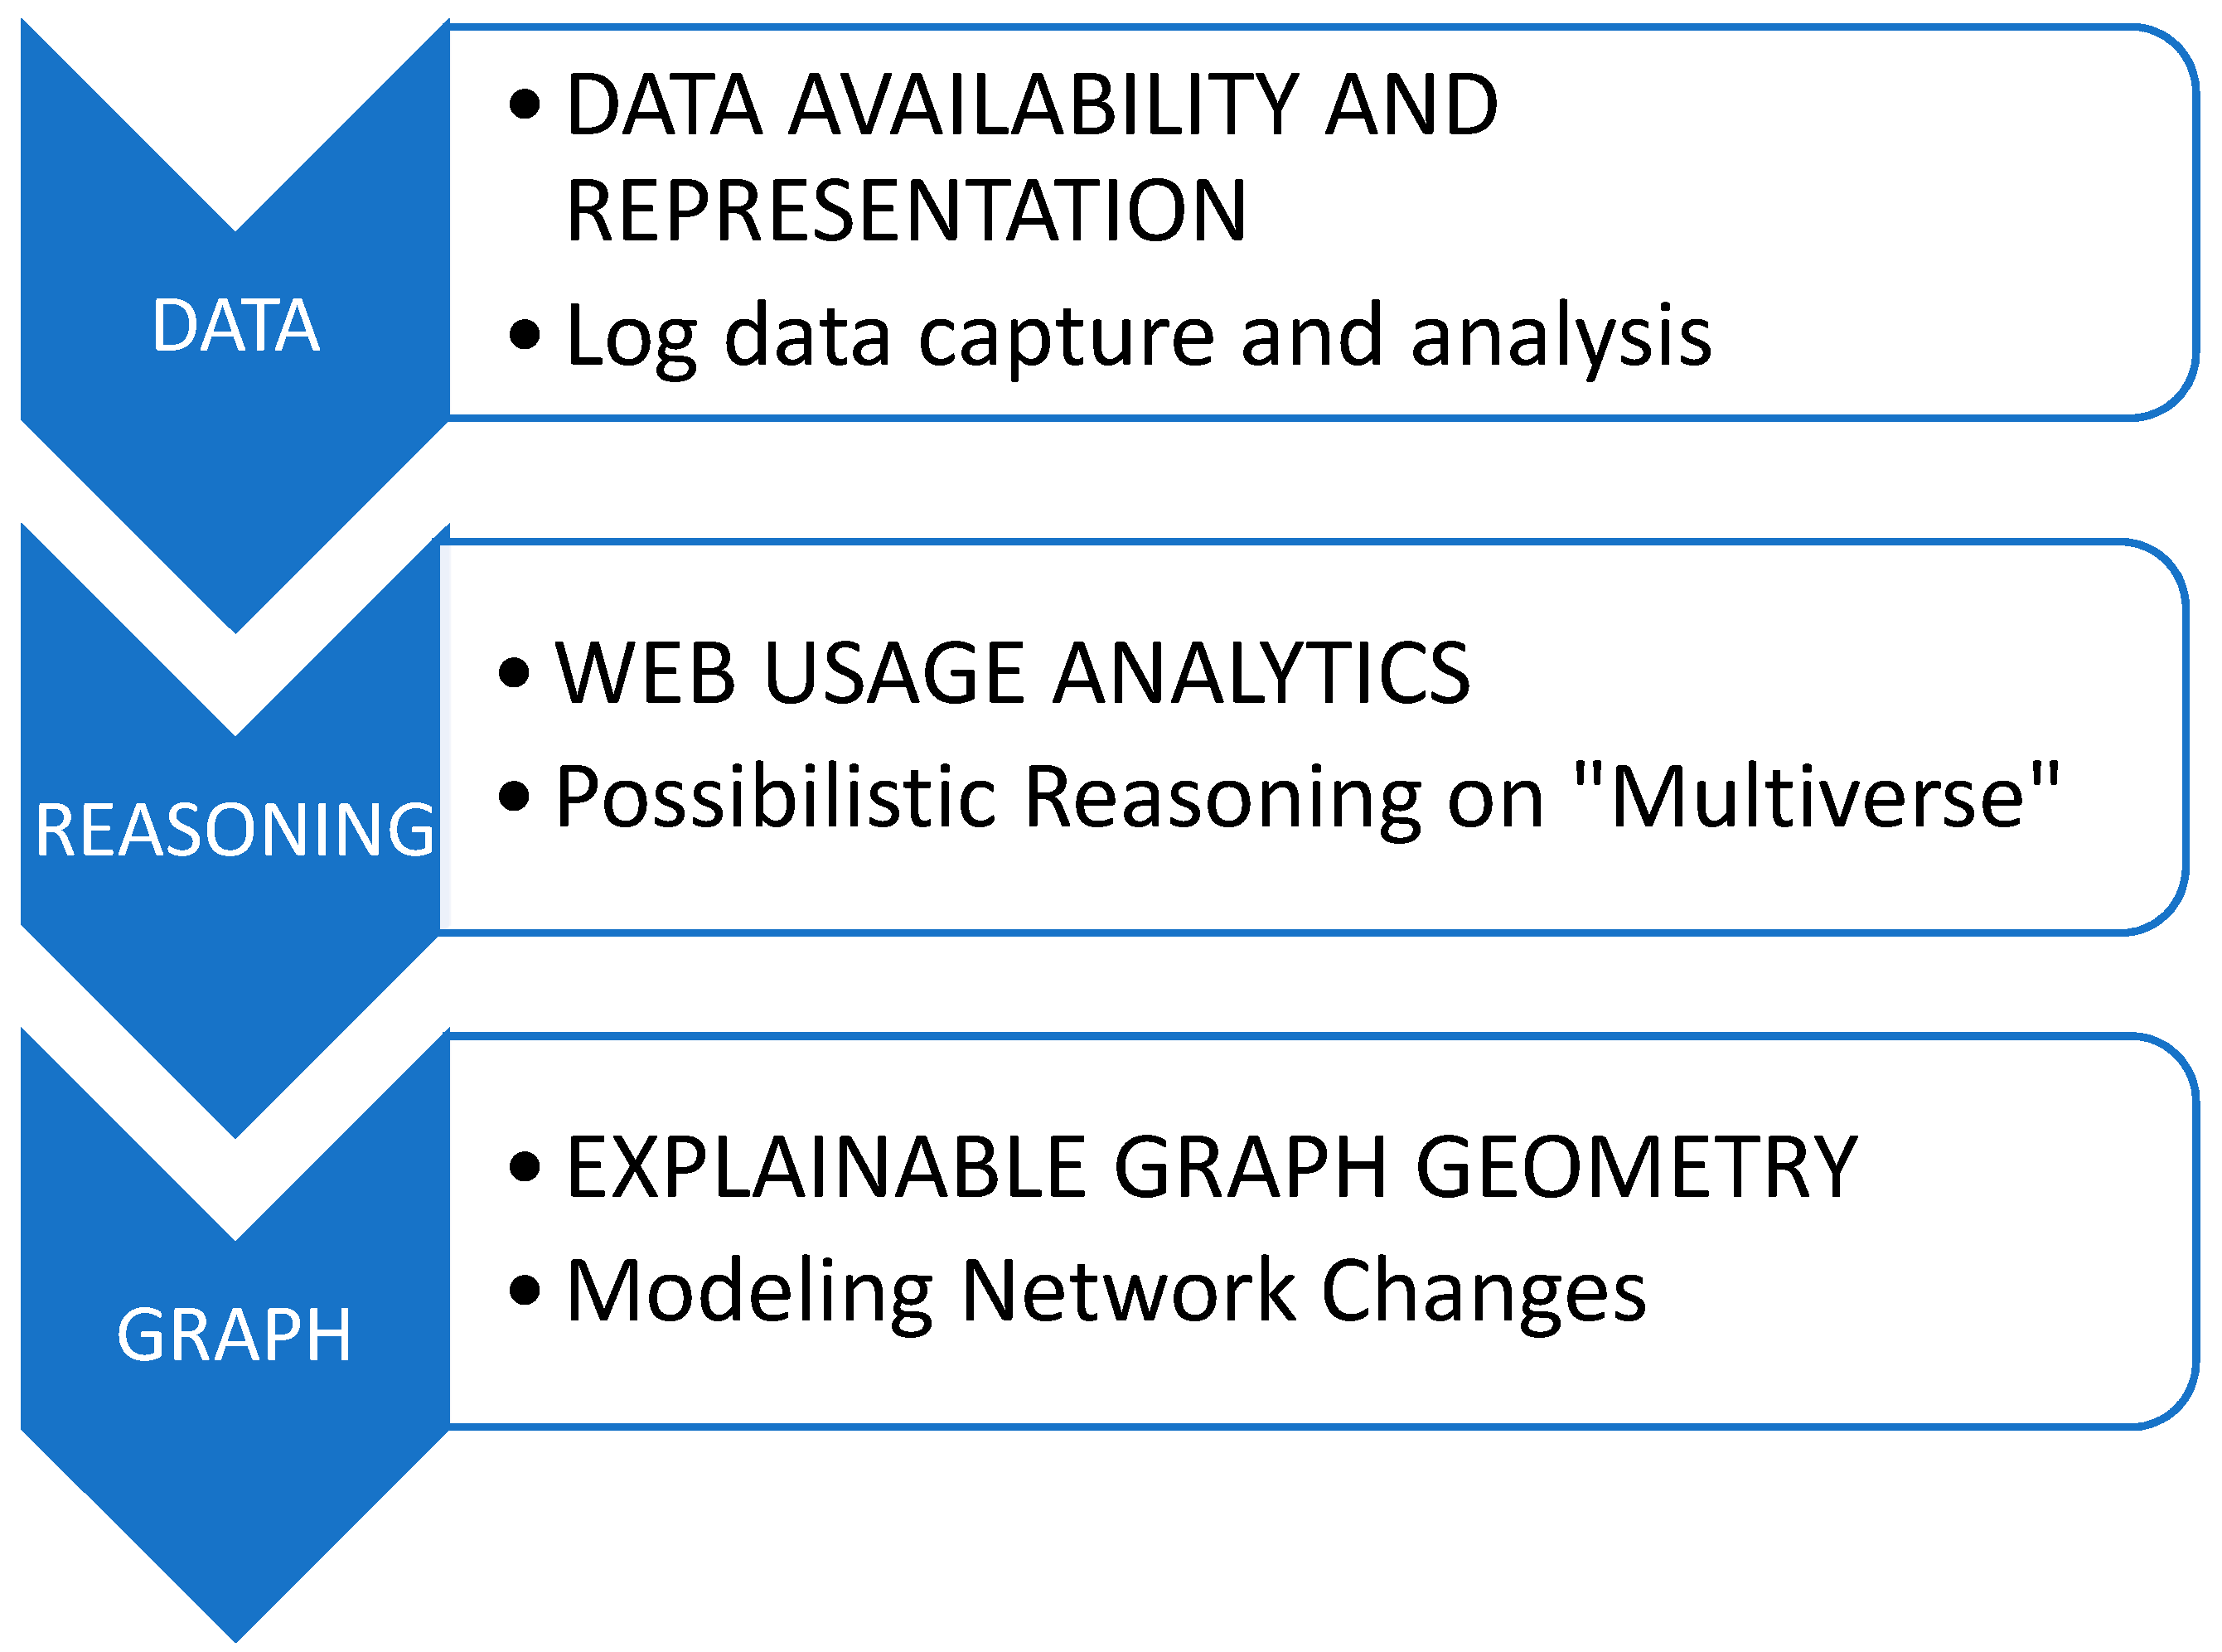
2.1.1. Data Availability and Representation

We first review the literature relating to the availability and capture of data and then the literature relating to data representations.
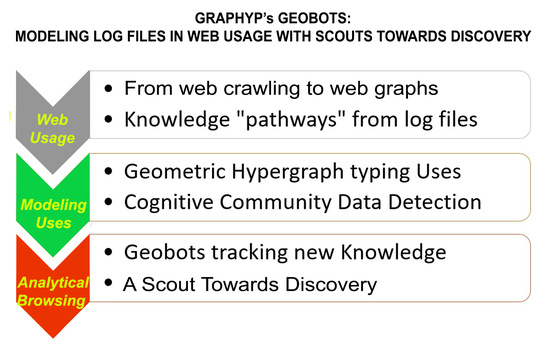
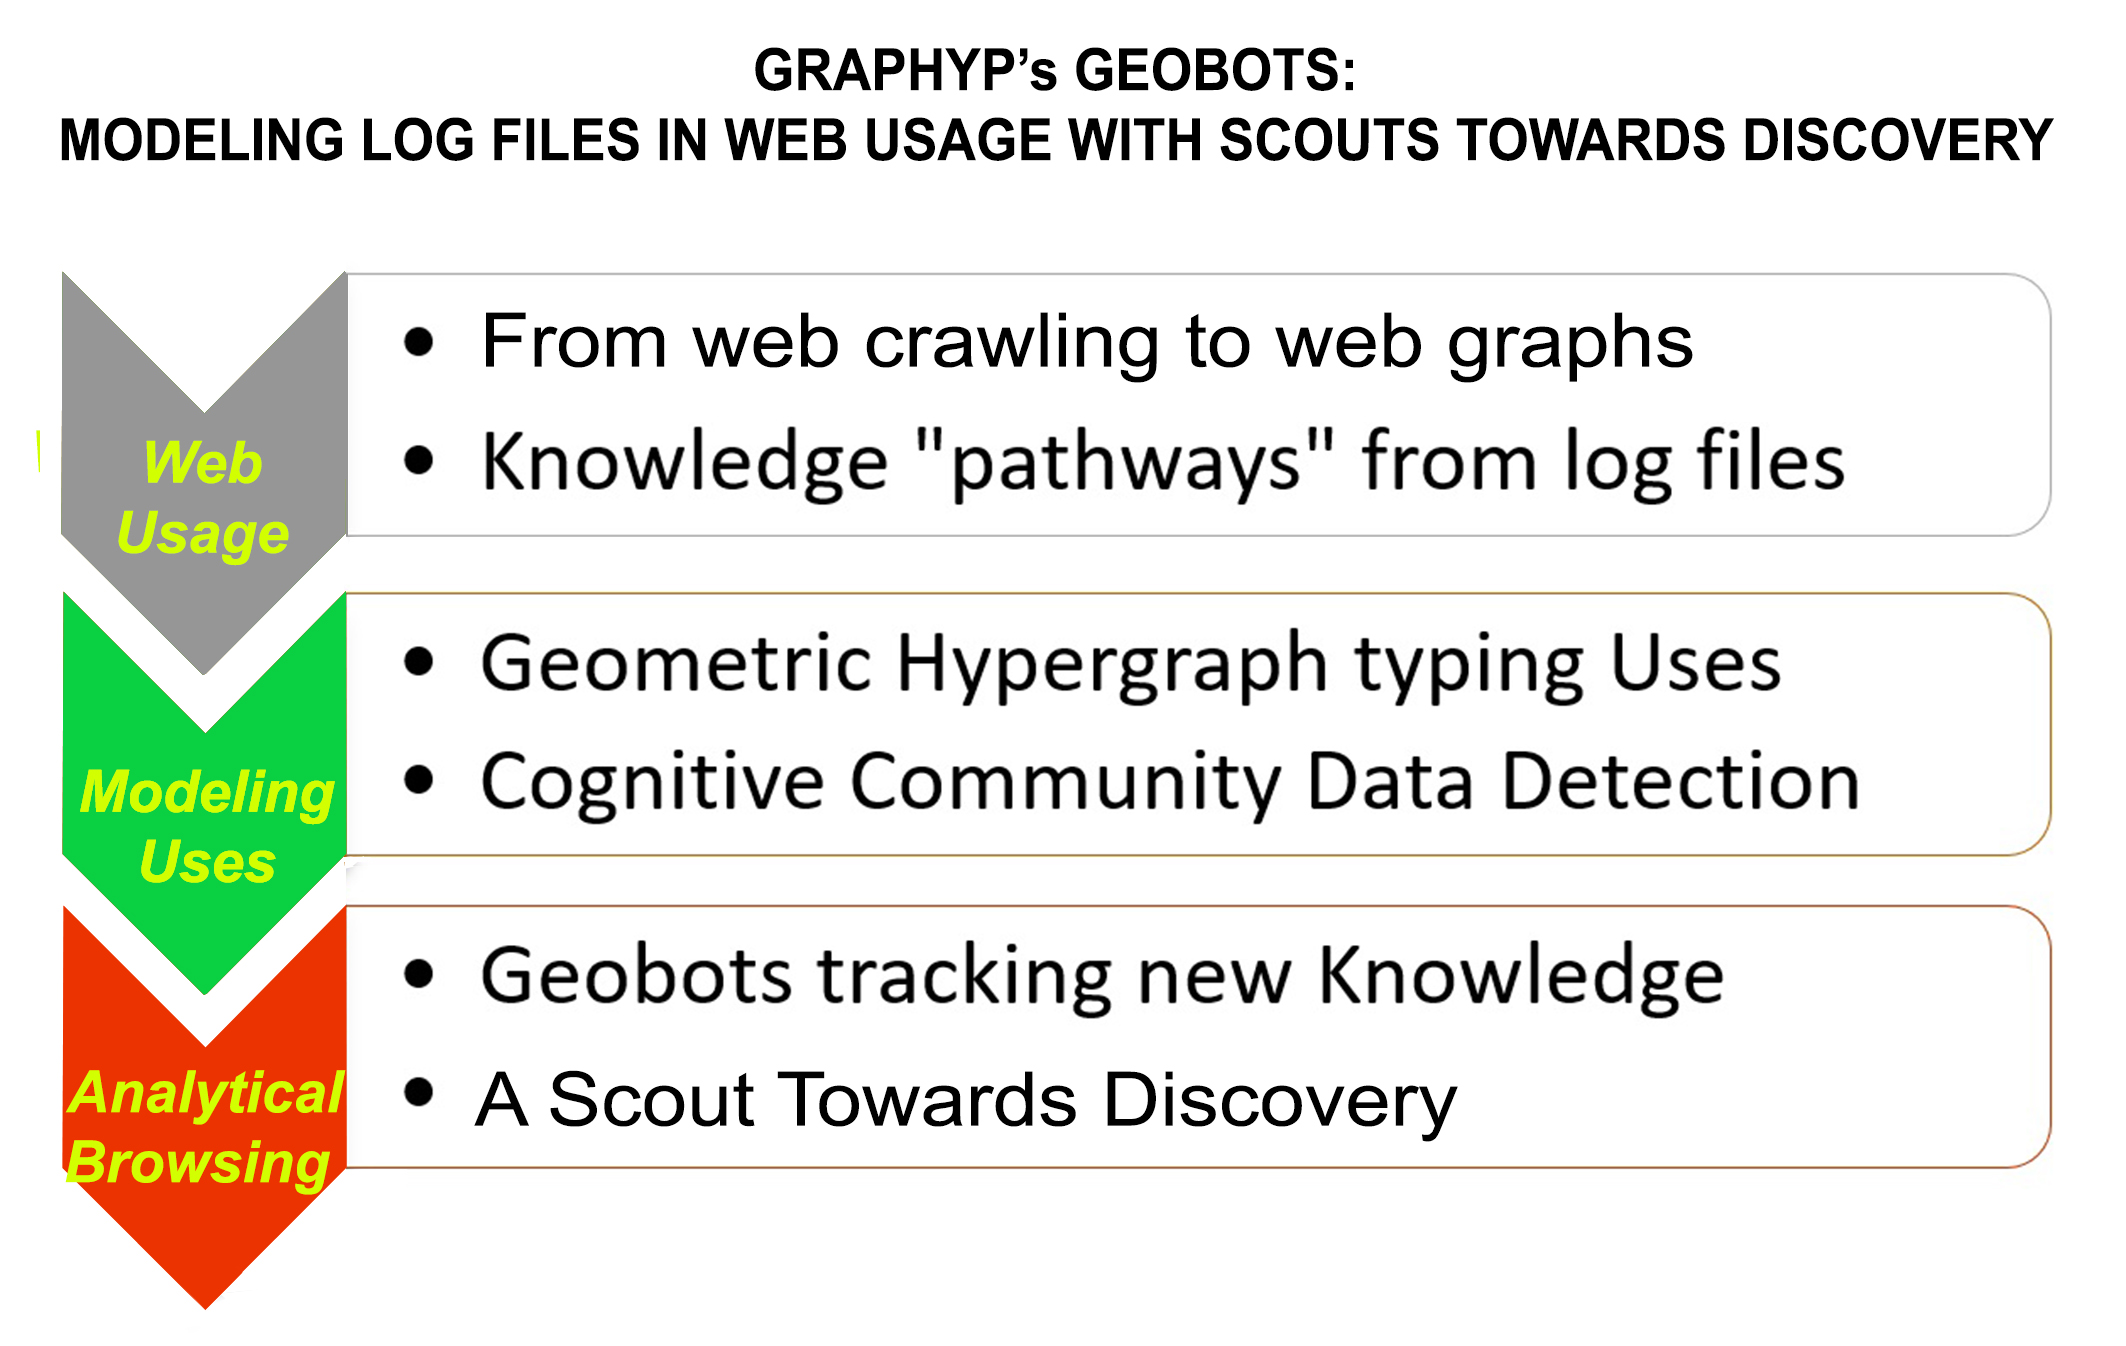
  • EXTRACTION OF NEW KNOWLEDGE FROM LOGS
Any new scientific contribution must be retrieved from a dedicated “conceptual fingerprint” [20] that must be precisely defined, which is an uneasy task in any innovative context and depends on the network-based learning of cognitive communities, which allows for the identification of possible undiscovered interactions [21]. This raises difficult questions of adversarial recommendations, not only in the categorization of scientific contributions [22].
The extraction of new knowledge can also proceed from the structural components of meaning with related metrics (e.g., Altmetrics: a manifesto http://altmetrics.org/manifesto/ accessed on 11 March 2023) in systems in which the interactions of the users and the search engine make sense [23]. ‘Searching as learning’ thus becomes a tandem of interactions between the exploration of search behaviors and outcomes in learning-related tasks [24]. This trend raises questions on the fairness, security and trustworthiness of those models within this type of deep learning model [25] and opens avenues toward meta-heuristics.
  • DATA CAPTURE AND EXPLOITATION
Availability
The methodology of usage patterns from the analysis of web-based library catalog logs has been developed for almost two decades [26]. Librarians and publishers of scientific materials, notably with Elastic Stack suite (https://www.elastic.co/elastic-stack/, accessed on 23 February 2023) and Kibana for the management of logs of big data contents, have long been exploiting (more than 10 years) logs of documentary tracks of research activities (https://www.ezpaarse.org/) on a global scale for multipurpose data management operations. Data availability is generally limited by rules of integrity and privacy. Citation counts and usage analytics from logs are two alternative ways to document the quality of the same ‘seed article’ in scholarly digital libraries; both methodologies are supposed to present a complementarity [27]. Tests of data availability and first-degree analytics are given on a large scale in WorldWideScience (http://worldwidescience.org/), including experimentations on reusing log data to analyze the semantics of queries in science, with a comparative approach [28] and a large number of participating databases worldwide.
Exploitations in large scientific infrastructure: A few examples
Data capture and re-use from logs to improve services to users/researchers is at work in a growing body of very large infrastructure; we select here a few significant practices in techniques and results.
The OakRidge Leadership Computing Facility, which exploits logs in petascale file systems, has been developing since 2017, profiling usage behavior trends and the sharing trends of users, and it invites other HPC centers to develop a similar approach [29] with new methodologies [30] for efficient web mining taxonomy.
We already mentioned Bioportal, at the NCBO, for similar log management in the workflow of scientific research, at which they identify and profile browsing behavior types and “compare exploration strategies across ontologies” [13].
  • DATA REPRESENTATIONS
Turning web usage data into knowledge involves a variety of operations, techniques and architecture that we examine in accordance with the related phases in GRAPHYP’s results on assessor shifts (see Section 3).
Techniques of log analytics
The main operations of log capture and exploitation for new knowledge have been well established for over a decade [31]. An extensive survey of researchers’ practices and opinions showed a favorable welcome to data sharing in general, as well as interest in modeling for data discovery [32]. Log files usually contain an important amount of accurate information about the user, typically the IP address, time stamp, access request, number of bytes transferred, result status, referred URL and user agent, plus others derived from this first list of data, as well as additional parameters that can be used for path analysis that are most commonly managed with graphs [33] and for additional analytical tasks, such as classification rules, clustering, pattern discovery and association rules. We consider these parameters in the different phases of the conceptual framework of GRAPHYP.
Data Architecture for log representation
Most data architecture aims at producing a scientific result for a unique scientist (for instance, in the technique of personalized web search), for the management of a research community or institution or for a learning entity [10]. We note here that the architecture of GRAPHYP does not belong to those categories and is fully neutral in its destination. The original feature of our approach is that we do not aim to create scientific knowledge or results, but to provide comprehensive and explanatory documentary assistance that is likely to stimulate the scientific reasoning of all potential users by responding to a need that scientists have always expressed. It accesses adversarial expressions of research questions and gathers comprehensive documentation for their own conclusions.
We can say that, put simply, the GRAPHYP approach is web-friendly and includes serendipity. The heterogeneity of log parsers remains a significant restriction on the expected commonality of web usage analytics in science; fortunately, for given inputs, there is a wide range of solutions regarding expected analytical outputs and performance levels of existing categories of parsers [34].

2.1.2. Reasoning Analytics

GRAPHYP aims at bringing assistance to scientific reasoning in relevance judgments, applying the innovative rules of possibilistic graphical models to representations expressed in a geometric graph [35] with multiverse reasoning analytics. We rapidly introduce those two points with remarks on the aid to scientific reasoning in the context of web usage analytics.
  • Scientific reasoning and web usage analytics
Scientific reasoning is approached in the literature via attempts to reach the frontiers of the scientific method [36]. The numeric transposition of scientific reasoning [37] and assessments of results (articles, data and annotations) by means of interpretable metrics are still an ongoing challenge [38]. Differing conclusions of methodologies while observing the same body of facts are not unfamiliar (as shown in [9], already mentioned) when studying scientific disagreements and, namely, peer disagreement, thus highlighting the importance of interpreting the pathways of assessor shifts [39]. Digital technologies, for the first time, are enabling the powerful delineation of scientific information included in scientific evaluations to connect any assessment to existing results and to achieve results, such as an information extraction pipeline for knowledge graphs [37], with neural algorithmic reasoning [40]. We found justifications for a relativistic approach to assessor shifts in GRAPHYP, measuring the differences between the differences, with possibilistic logic [41] applied to the explainable geometric graphs [42]. We consider this as the only mode of reasoning, allowing a neutral representation of the documented adversarial opinions, and delivering a neutral classification of contradictory documentary tracks to let any scientist form their own opinion, with an overview of the practices of peers.
  • Modeling assessor shifts in a framework of possibilistic graphs
Web usage modeling techniques are familiar in multipurpose analyses [43]. Methodologies analyzing adversarial web usage, elaborated from former adversarial web searches [44], allow pattern mining in web search or identifying process scenario discovery from web log captures [45]. Possibilistic modeling makes it possible to represent information in contexts of uncertainty and imprecision, when “information is obtained from human observers or imprecise measuring instruments” [17].
It should be noted that, in GRAPHYP, we do not stop at enumeration without borders, but we propose interpretable possibilistic modeling. Interpretation is ‘possible’ from the specific geometry of GRAPHYP (for a complete description, see [1]), and the answer delivered to the user is not presented as a solution. It is neutral assistance to reasoning that takes the form of the ability to exhaustively represent all ‘possible’ adversarial documentary tracks, considering the measured parameters and their geometry of representation in a bi-partite symmetrical hypergraph. This hypergraph indeed connects all ‘possible’ cliques in the modeling, which represents all the feasible associations of users and items based on a predefined triplet [1] (pp. 271–272).
Referring to the theory of “decidable forms” of Edmund Husserl (notoriously introduced by Jacques Derrida [46]), we follow here the recent contributions to the geometry of graphs [1]. The geometry of graphs quickly became popular because of its ability to assist scientific reasoning with directly interpretable graphs. The superposition of geometric laws in the design of a graph and of the corresponding information network makes it possible to represent the activation functions of nodes and edges, thus facilitating direct interpretation. GRAPHYP has the originality of linking its graphs in a bipartite symmetrical hypergraph (adversarial cliques: see [1]), which gives its expressive power to the neutral modeling of assessor shifts, which are isomorphic in our representation, with the analytic advantages of three-layer knowledge hypergraphs [47].
  • Reasoning on assessor shifts from data logs of documentary tracks
Decidable information is the foundation of our modeling of assessor shifts, which represents the human assessments expressed in documentary track choices. Relevance judgments can differ, as a document is relevant to a specified search request and an assessor’s conceptions of a request [8]. This translates into the fact that assessments are “relatively relevant”, which provides confirmation, through the assessor shift observation, to the geometry of the GRAPHYP model. The theory of evolutionary games on graphs that optimizes behavior in adversarial environments contains similar premises [48]. Finally, the research question to be solved is, “how can a network be moved from one state to another state” [49], in conciliating causality and complexity in assessor shifts. This is also the case for science as a whole and in all its documented contributions, insofar as undiscovered information is the goal of its approach and where it strives to place it in the context of already known information (theories and facts recorded by predecessors). Among the issues we seek to address is the need to achieve modeling for adversarial positions with subgraph analytics (GR1), included in a hypergraph modeling of assessor shifts (GR2).
  • A multiverse graph structure of search for research
In direct agreement with the geometry of GRAPHYP, the idea of a multiverse graph corresponds to assessor shifts that can be said to comprehensively identify the “possible worlds”, their compossibility and self-reference [50], founded on a clear methodology and fueled but not overtaken by idealistic references [51]. We therefore propose that our conceptual framework be given the name “multiverse graphs”, with the design of ‘possible’ solutions [41], opening the way to a multi-hop path to select “a best possible” choice. Methodologies of the multiverse analysis in machine learning have received well-identified applications in science analytics in various domains [52]. To our knowledge, this is the first application of the paradigm of Leibnizian scientific reasoning on the famous “best possible results” in the area of knowledge graphs, issued from a set of ‘possible’ options of choice (e.g., [53,54,55]).
Scheme 2. How can a network be moved from one state to another state? Background for assessor shift interpretable patterns.
Futureinternet 15 00147 sch002

3. Results: Retrieval Modeling in Research

We already mentioned that the assessor shift in document judgments can be described as “relatively relevant” [8]. We propose hereafter a model of this relativity in the document presentation and retrieval, adapted to the practices of scientific documentation in research activities. Section 3 is organized as follows:
  • GRAPHYP modeling: main steps (summarizing [1]);
  • Research methods and range of applications;
  • Additional retrieval strategies toward modeling web usage;
  • Search exploration and pattern discovery;
  • Qualitative vs. quantitative features of measured assessor shifts;
  • New explainable patterns for the search profile.

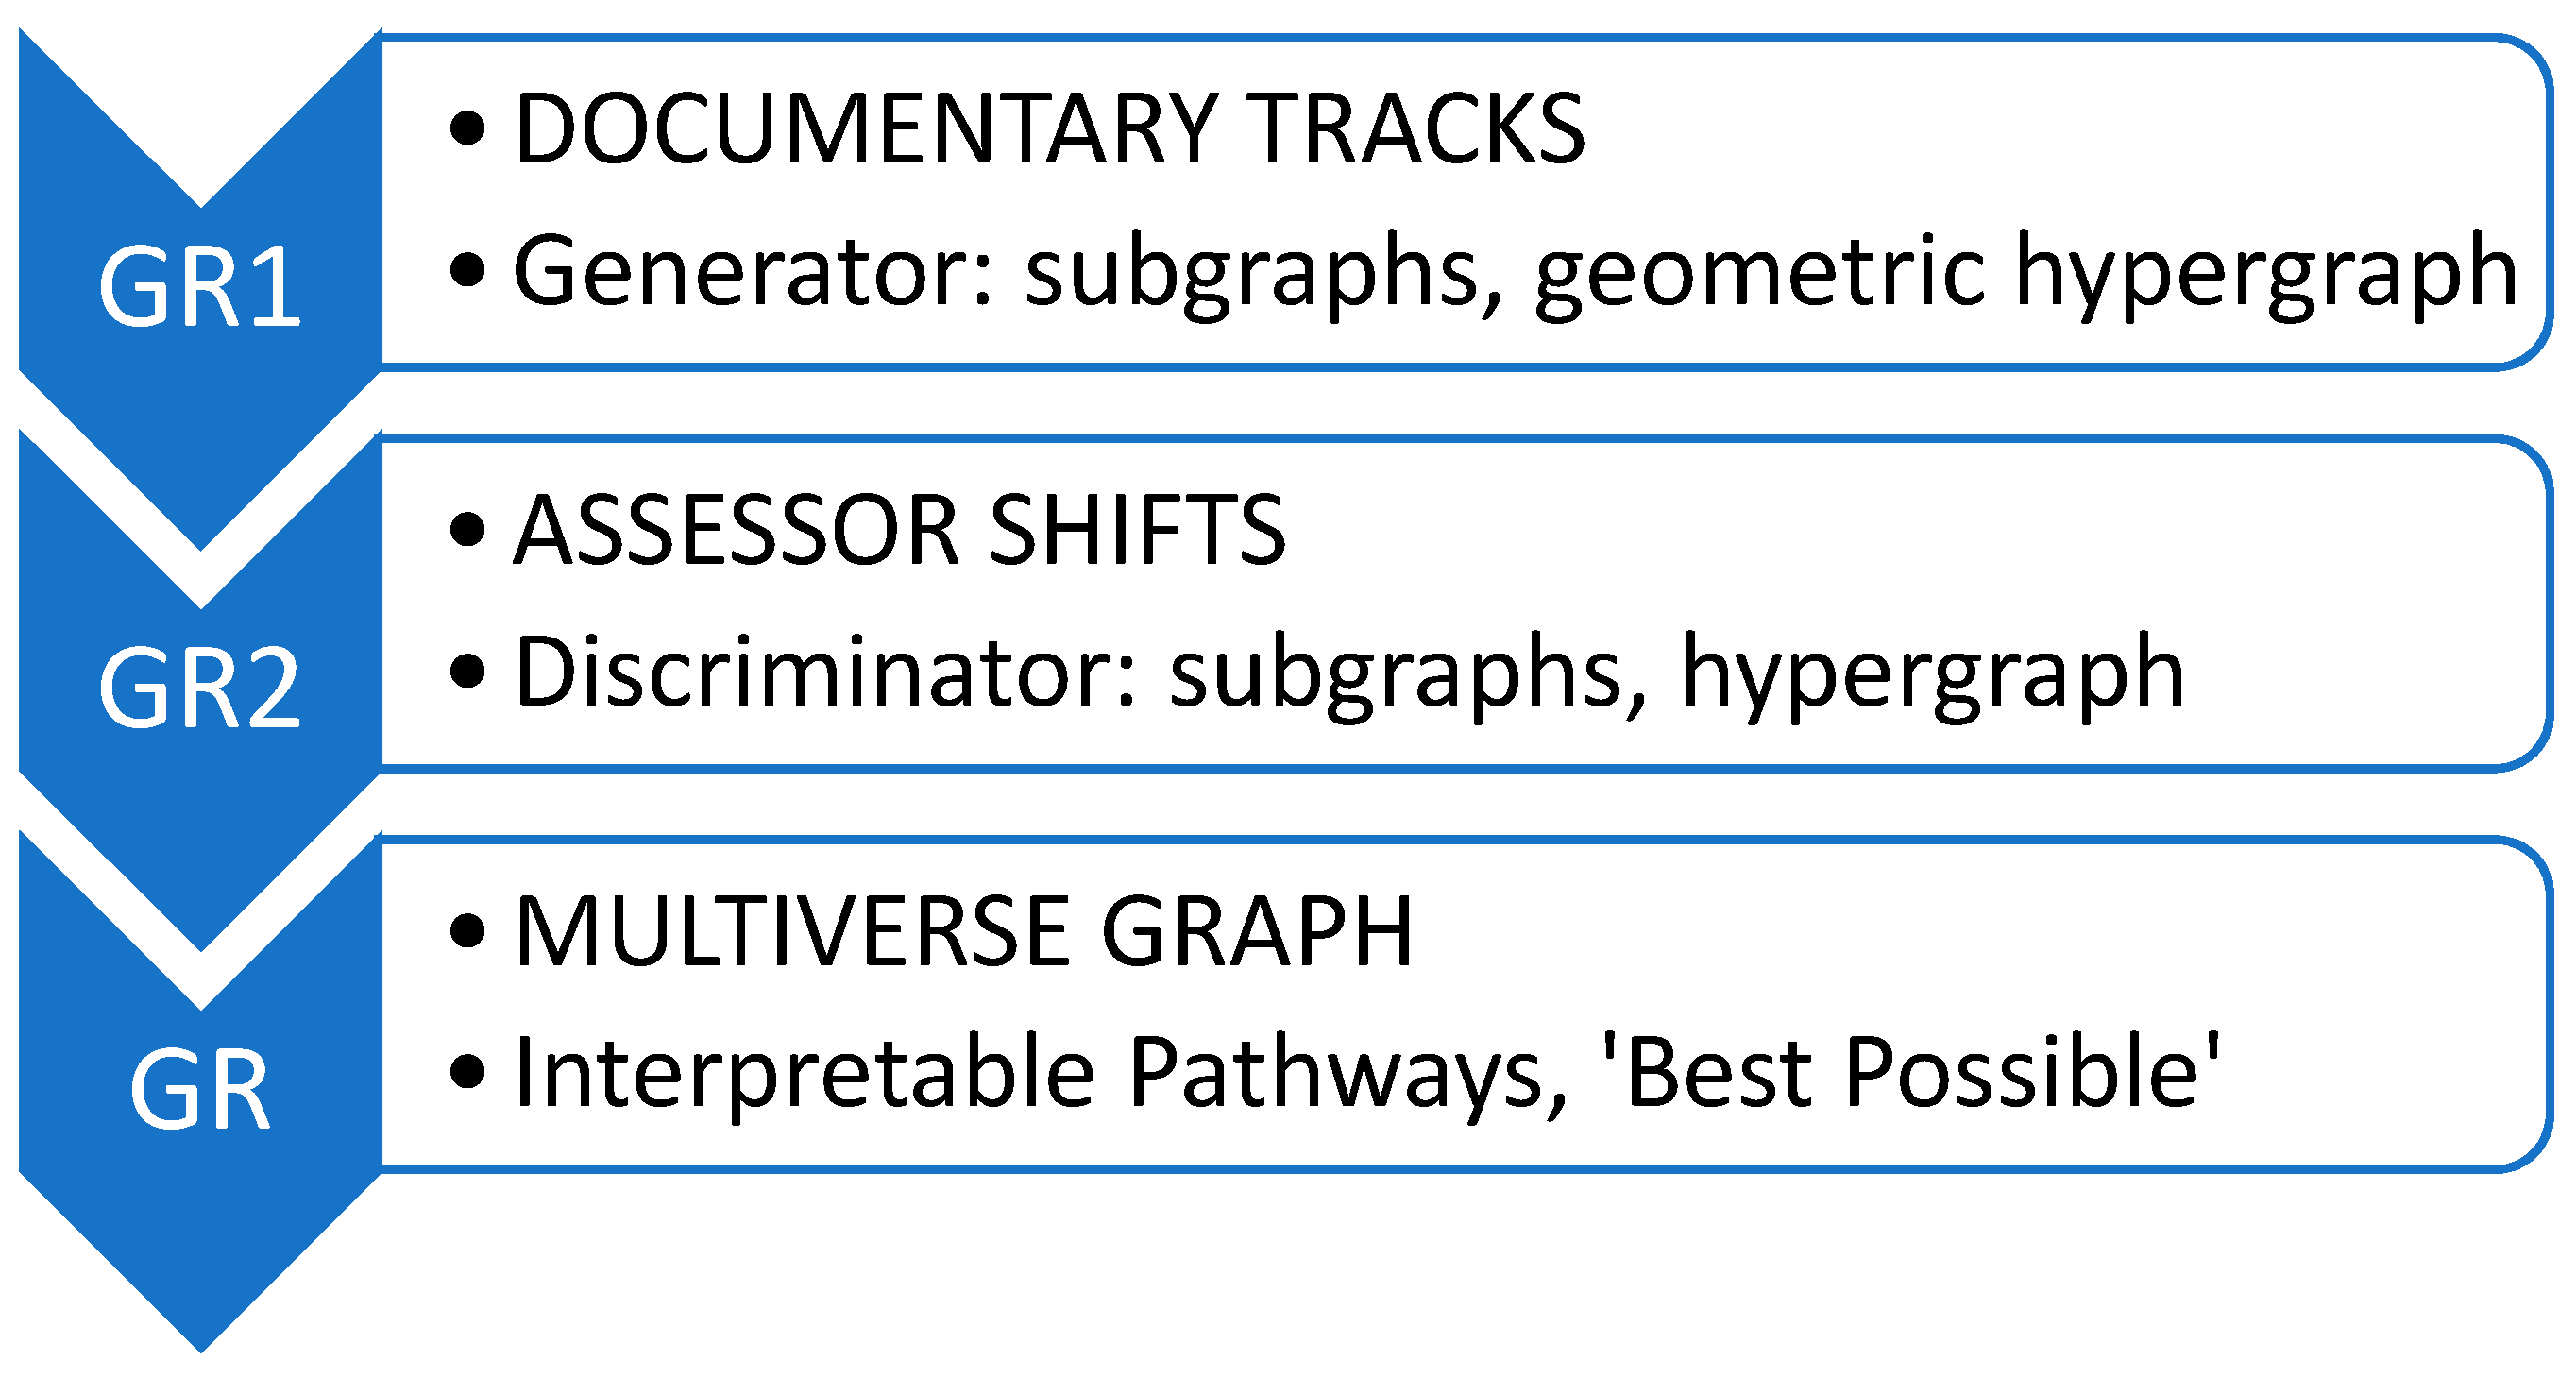
3.1. GRAPHYP Modeling: Main Steps

In GR1 [1], we showed how usage log data, in the form of ‘documentary tracks’ in assessment building, make it possible to determine distinct cognitive communities (called adversarial cliques) within sub-graphs; we established a typology of these documentary tracks through triplets of measurements (intensity, variety and attention) to describe the potential approaches to a research question (see Scheme 3). Our geometric hypergraph GRAPHYP assists interpretation as a classifier, with possibilistic graphical modeling. GRAPHYP shows a complete representation of all the typical intermediary situations between two limits of triplets of nodes, which gives us a tool for the classification of observed search sessions in documentary tracks.
Table 1 provides a summary of GRAPHYP’s main steps, following [1].
Table 1. GRAPHYP’s methodology: key steps. More details are given in Appendix A.
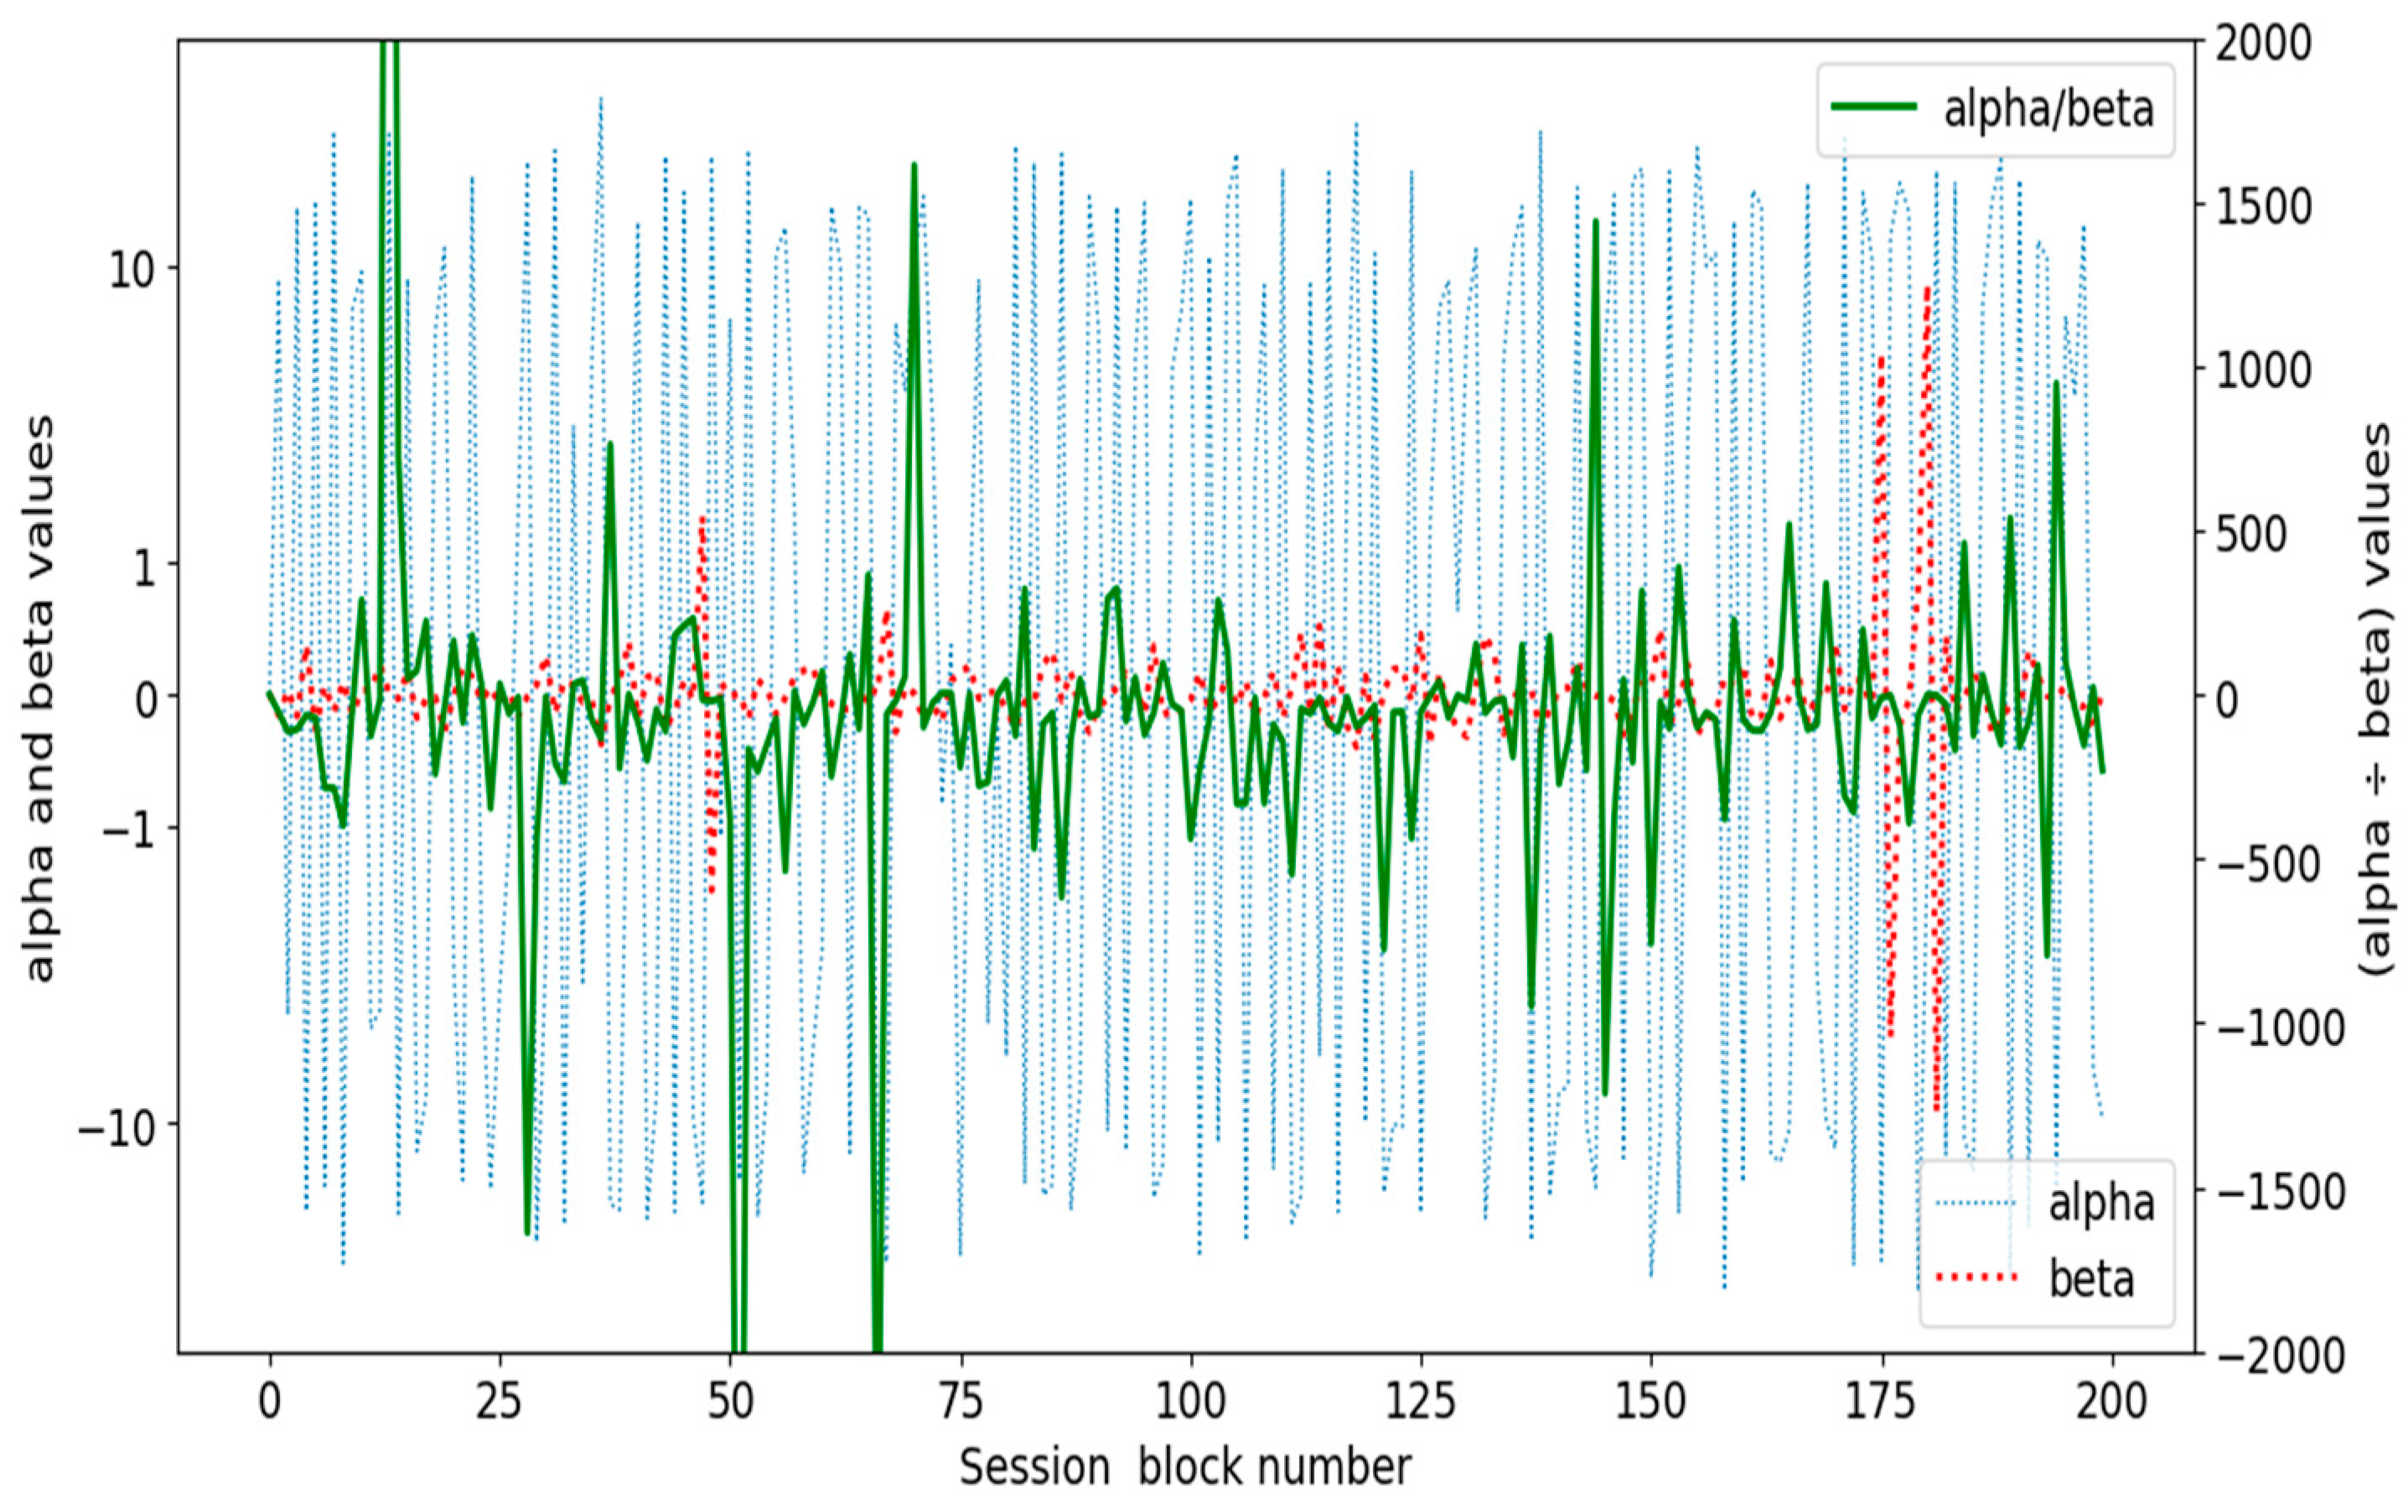
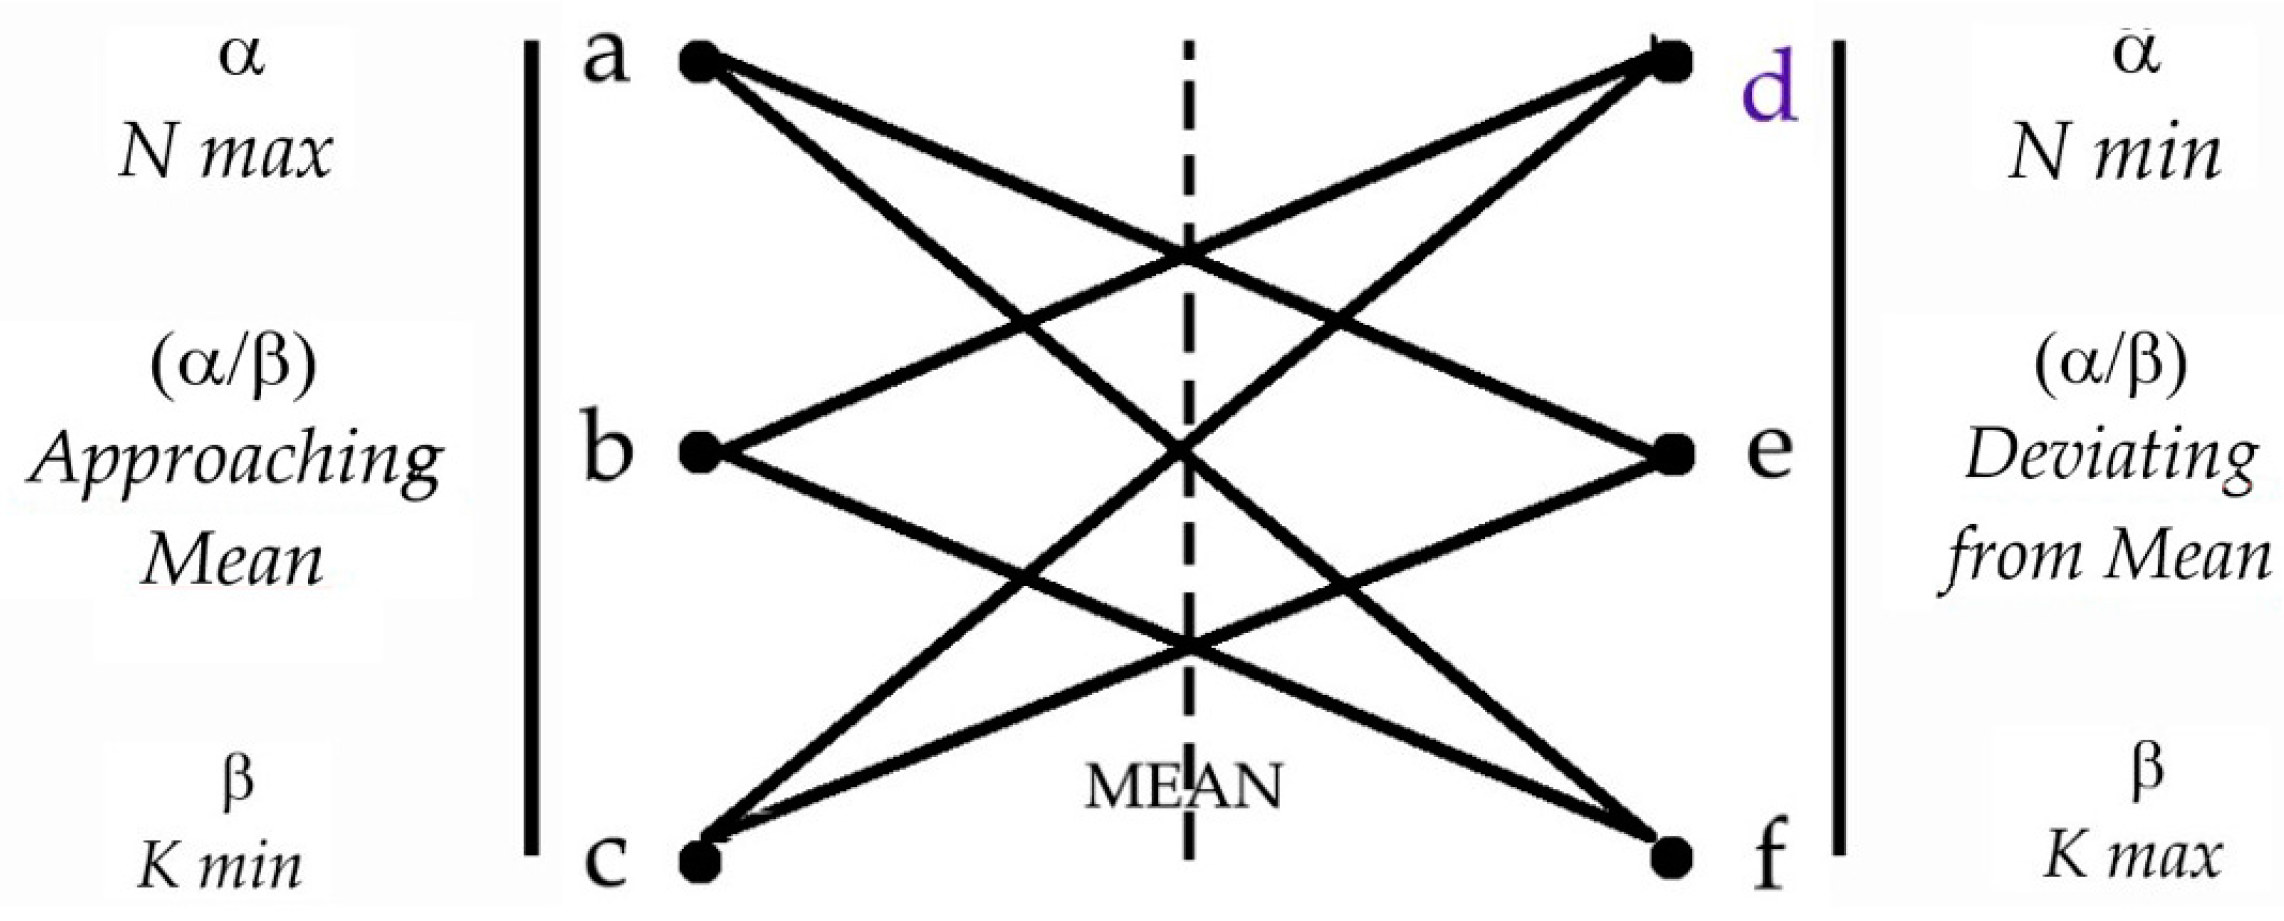
  A. Definition of documentary tracks: We note N, the number of users in a session log, and K, the number of documents read; we note α/β, the ratio of their average values over a series of different sessions. α/β is an “expression of stability/disruption of behaviors” 1. It expresses the degree of attention emerging in cliques of the cognitive community’s documentary practice and makes it possible to measure the ‘stability’ or ‘disruption’ of the behaviors of users over the considered search sessions. Therefore, the ‘attention’ parameter contributes to measured changes in the dynamic of the search of documents met on documentary tracks.
  B. Web usage classification of documentary tracks: Documentary tracks are being defined and measured with min and max values, and web usage logs find their explainable integration in the proposed modeling. This implies the classification of all non-contradictory solutions of the triplet parameters (N or K must be min or max and cannot be logically combined) with reference to their mean values measured for the whole sample (see Figure 1 in [1]).
  C. User’s documentary track positioning: According to A and B, users of GRAPHYP can localize identifiable types of classified documentary tracks on a research question and, with the help of the modeling, they can localize the interpreted selection of documents that the laboratory has realized, compared to other typologized practices on the same research question.
1 The ratio α/β is “calculated from a value of normalization, expressed from the mean value of N/K. We can consider a fraction α/β where α is the numerator calculated from N mean value and β is the denominator derived from the mean value of K. This fraction α/β will vary, consequently, with any recorded group of reader and article values. (An alternative procedure could be to note α the coefficient of increase of N and β the coefficient of increase of K when Q varies by one unit when an additional query on the same search is recorded.)”
Scheme 3. GRAPHYP parameters used for measuring the variations in assessor shifts.
Futureinternet 15 00147 sch003

3.2. Research Methods and Range of Applications

The research methods are applied in the GRAPHYP modeling stages of GR2 use, as in the first stages (GR1), in which data from user logs of scientific research documentation are used (see GitHub link in GR1).
The main objective is to approach quantitatively and qualitatively the representation of the documentary choices made by the users on the items (in general, scientific articles) proposed for their common choice. For any documentary track, GRAPHYP is able to transmit its comparative position and thus provides researchers with data that can be used to
  • position their own assessor shifts on the same research question;
  • appreciate the conditions under which a given documentary track is selected (for example, many users, few items and an unbalanced ratio of users to items, relative to the sample mean).
We first tested this method with data that were presented first in Paper 1 [1] (document and item dynamics). In the following, as a complement, we include a synthetic appreciation of the different types of assessor shifts at various levels of measurement.

3.3. Application Scope: Additional Retrieval Strategies toward Modeling Web Usage

Assessor shift modeling with GRAPHYP opens the way to the management of a wide range of retrieval strategies. We propose hereafter a first classification of these new possible domains.
The literature on search experiences often suggests the need to supplement a keyword, not only with additional keywords, but also with retrieval strategies on the elicitation of data discovery contexts and with the construction of a collection of tests for assessing search results. Task models have also been implemented for the exploitation of usability test logs, which contribute significantly to web analytics [56]. Modeling web usage in the search for scientific concepts becomes more attractive as the approaches diversify; a recent survey underlined the growing impact of new metrics, such as “atypicality” and “disruption”, which highlight the adversarial motivations possibly carried by similar keywords or, conversely, the contradictory modes of retrieval by which a similar concept can be revealed. “Science is built on a scholarly consensus that shifts with time” [57]; it is clear that innovative contributions emerge at borders between old categorizations, where discovery traces its paths.
Modeling web usage is a prerequisite for modeling retrieval in research. Items and corpuses are considered successively below.
  • Items
The technologies of web usage mining, as well as examples of applications (Section 2.1.1), illustrate the large range of technical opportunities for capturing log data in research analytics. Items must be adapted to the dimension of the involved cognitive community, which can be configured on different scales (from small to very large research infrastructure; see examples in Section 3.4).
GRAPHYP models search experiences on various scales of web usage, among which we can list three indicative levels of search strategies that can benefit from the observation of changes in relevance judgments and of the retrieval of assessor shifts:
First level: search optimization (search off the beaten track, search with a better method, search with better vocabulary…);
Second level: graph completion of documentation (Is a theory fully documented? In what unknown direction can new knowledge be expanded, and what are the best pathways?);
Third level: adversarial search experiences and adversarial theories (What are the items of correspondence between documents and eligible theories? Are there overlapping boundaries between a documentary track and an eligible theory?).
  • Corpuses
The corpus’s size and scope are an open question that depends on the research question and on the degree of its semantic evolution over time, as well as the composition of cognitive communities. We can only say that the requirements are those of the already classic methodologies of text and data mining in research activities. This question must be answered with the relevant collegiality of scientists.

3.4. Assessor Shift Modeling: A Grid for Usability Test Logs

Starting from the modeling features of GRAPHYP, we developed a first analytic functionality of the model, with assessor shift retrieval for classification and navigation tasks.
SKG GRAPHYP can be considered a “compass”, recording and indicating the direction of digital navigation in an environment of articles and other scientific resources, with a methodology referenced to exploring generative adversarial networks and adversarial training [58].
More generally, GRAPHYP can contribute positively to the management of scientific information by improving the usability of the web and by promoting the overall optimization of service uses. We observe that recommendations to mine usage logs have already been familiar for a long time for the composition of web services and are at the source of important methodological evolutions [59]. In this section, we show that GRAPHYP, by helping to model the design of web services, contributes to bringing more flexibility and accuracy to the benefit of users, according to the assessor shifts revealed by the analysis of usage logs in the context of documentary tracks.
Hereafter, we give illustrations of usability tests that can explain or plead in favor of an assessor’s shift, and then we present the mechanism of analysis proposed in GRAPHYP’s methodology.
  • Usability test logs of documentary tracks
Recreating users’ experiences in log files is a familiar technology with well-known techniques for extending the usability of websites [60]. In addition to its many advantages (accuracy, pattern description, ubiquitous data, standards formats, timestamps, user clicks, etc.), usability test logs find new added value in the comparison of documentary tracks, as proposed by the global modeling of GRAPHYP. It adds a comparative structural understanding of the whole set of logs on a queried keyword. A few examples follow.
Usage-based and citation-based methods are often compared as differing methods for recommending scholarly research articles [27]; changes in relevance judgment and assessor shifts between documentary tracks can highlight the additional comparative features of the two methods. GRAPHYP’s comparative study of assessor shifts and corresponding documentary tracks can also help enable semantic analyses of user browsing patterns in a wide variety of contexts and circumstances for which a theory or methodology is under discussion [61].
  • Usability test log analysis grids
Pairs of edges in the GRAPHYP knowledge graph always belong to a given node (here, a, b, c, d….). Each node designates a grid of proximities between partially neighboring nodes; we then exploit these partial proximities to identify paths that, by using links with next neighbor circulation paths, can
  • help identify the optimal “route of preferences” of a user, according to relevant identified proximities of edges and nodes in a given documentary track;
  • record any observed path of users that, during their past search sessions, have used a recorded method in their successive document assessments.
Figure 1 shows the genealogy that identifies search routes and documentary track characteristics, analyzing the different paths of discovery. More details about the key features of GRAPHYP are given in Appendix A.
In Figure 1, we represent possible circulation paths in the GRAPHYP grids.
The grid on the left part of Figure 1a, whose basic characteristics are described in [1], shows how a user can
characterize their position from available data, around one of the six typical nodes of GRAPHYP;
assess, depending on the triplet values of the summit corresponding to their documentary track, which elements that this situation creates differences with other choices that could be preferable.
From the grid on the right of Figure 1b, the user can
assess the steps by which a move can be executed from the current position, to any preferred one;
measure the distance between different positions and calculate the “length of the route” separating two possible courses.
By successively using the two graph grids, GRAPHYP makes it possible to navigate from the position of any documentary track to another, until reaching the optimal choice. Depending on the types of documentary tracks and routes of assessor shifts experienced by the users, it becomes possible to carry out a comparative analysis of the sets of logs, according to their content with reference to the parameters N, K and α/β.

3.5. Comparison of Assessor Shifts

In Figure 2, three documentary tracks (A, B, C) are represented, with, for each of them, the measured values of the three parameters of GRAPHYP’s triplet: N, α /   β and K.
In this representation, the locations are proportional to the values and the respective positions of A, B and C for the three values of the triplet, which give a ‘real world’ representation of our methodology and which can support both qualitative and quantitative analyses.

3.5.1. A Tool for Qualitative Comparisons of Assessor Shifts

In the example illustrated by Figure 2, A, B and C clearly show exploitable differences that can be interpreted in context.
Assessment C is considered as a ‘convivial’ assessment with comfortable situations in N and K, and α /   β is located on the median line of mean values.
Assessment A, conversely, represents a ‘minority’ position, with weak values for N and K and, with A2, a value for α /   β that is out of the mean values.
Assessment B can be considered a ‘profitable’ one with N users that is measured in a slightly favorable position in the Nmax zone, combined with a great score on the quantity of items (value of K is not so far from the Kmax frontier). Compared to the mean line value of the sample, the α /   β value of assessment B is located exactly on the line, with B2.
There are many possible declinations of this figure that remain to be implemented in further testing and applied research with typologies in the real world.
A few examples of log analytics extracted from Figure 2 are as follows:
Learning to rank query recommendations via semantic similarities [62] is in use for all situations in which query expansion and optimization are under discussion; a formal overview, as in Figure 2, illustrates the help in orienting incoming query strategies.
Users’ exploration of ontologies on the web: In the already mentioned study of NCBO BioPortal usage logs [13], the authors remarked that “very little is known about how exactly users search and explore ontologies” and “what kind of usage patterns or user group exist in the first place”. They concluded that deeper insight into user support are requested, and they proposed browsing behavior types (see Section 2).
An approach such as that shown in Figure 2 provides a basis for additional methodology.

3.5.2. Additional Tests on the Added Value of the “Attention” Parameter

Successful tests of the robustness and significance of node triplets integrated in the image of various documentary tracks have been realized from real world search history records on a test panel of 10 million search sessions, with the first prototype using access log files from OpenEdition.org platforms, filtered to eliminate requests for files others than papers, and with readers coming mostly directly from web search engines. Log files were collected by the web analytics platform Matomo (https://matomo.org/about/, accessed on 10 February 2023). The logs were filtered in order to remove bots and access to pages that were not papers or lists of papers. Users were identified from anonymous addresses (over time, it was possible that several identifiers corresponded to the same user), and sessions were estimated from the timestamps. Hence, a session is a sequence of content requests and content accessed in a limited time. About 3/4 of the sessions correspond to access to three articles at most, but some sessions are very long with access to more than 100 papers. For each session, we estimated the number of other sessions in which the same items were offered and, for each possible item, the number of times it was accessed. Detailed results and analyses are given in [1].
As a complement to Figure 2, we present in Figure 3 new results of the above-mentioned testing on the parameter of attention (α/β) measured in the model, and we show its ‘added value’ to assessor shifts metrics. We note that this third parameter expresses the stability/disruption of behaviors and allows addressing multiple factors bound to attention as an additional feature (mechanisms, types of co-attention, intra-attention and all documentary behaviors to measure a “real-valued hint” in information retrieval), measuring prominent features of assessor shift transition. We recall that the process is as follows: “First, we divide all the logs into blocks of sessions. Then, for each session, within each block, we estimate the values of K as the number of articles read by a reader. This makes it possible to estimate, in each block, the number of readers N who have read K articles and thus the mean values of the different N and K for this block. α and β values as well as their ratio are calculated, for each block of sessions except the first one, from the mean values of N and K” [1].
Figure 3 shows the variations above and under the mean value of this parameter for a panel of 200 blocks of search sessions. For some sessions, the β value deviates significantly from the average. The same is true for the ratio α/β, which also deviates significantly from its average for about 10% of the sessions (values between −500 and +500). These measurements confirm that the majority of the studied sessions correspond to a consensual behavior, and a minority is interested, at least occasionally, either in very specific and rare requests or consults documents that are not considered often for similar queries. If we had access to the queries used as input, we could thus differentiate the uses and see behavioral or contextual breaks emerge.
The test shows the magnitude of the recorded variations and makes it possible to determine the type of each session, according to the associated values of N, K and α / β . Thresholds are applied to identify the tendencies toward the min/max values of N and K and toward variations for α β above and under the mean values of the parameters in the recorded sample.
Lastly, the sequence of types (a, b, c, d, e, f) gives us the “routes of search” between assessor shifts.
The variations and amplitudes of the α / β ratio around their mean allow for the detection of breaks in behavior and assessor shifts, as well as the type of search session. The link between these values and both the search objects and the possible (retrieved) documents could be the subject of specific studies. It could allow for the identification of innovative research objects (their disruptive character moves the exploration away from the usual research paths), subjects of strong controversy or, on the contrary, those that are consensual.
These results pave the way for a wide range of future services in the exploration of the documentary tracks actually followed by researchers. Further comparative developments of „bibliography and citation optimization” can be seen by examining the results of real-world researchers. This examination could reveal, on the nodes of GRAPHYP, “topologies of citations” varying according to the cases recorded on the same research question. The challenge could then be to observe how the citation of an author is favored, according to the different values of intensity, variety and attention.

3.5.3. Visualization of User Selections of URLs Consulted during the Search

Opening the way to further studies implies visualizing users’ selections of consulted URLs on any route, as illustrated by Figure 4. Each node (blue points) corresponds to a URL (a web page associated with a paper) for sessions in which multiple pages were viewed. An edge connects two nodes when the user has successively consulted the corresponding pages. Edges are represented either with blue lines (low frequency) or red lines (high frequency). A total of 4704 nodes and 4550 edges for 1532 sessions are represented here. Nodes are positioned using the Fruchterman–Reingold force-directed algorithm (Spring Layout of Network Python package). Some long routes appear, with most of them in the middle of the graph.
Figure 4 offers another representation of the GRAPHYP source data of Figure 3. It presents a more direct visualization of the selections made by the readers and their search strategies, initiating further interpretations. Some long roads (long blue lines with multiples nodes) can be seen close to the center of the graph. One interpretation is that they correspond to sessions in which users deviated from the average behavior, viewing fringe and otherwise unpopular papers.
This result is decisive for future documentary services. By zooming into the results of Figure 4, it becomes possible to explore ways of analyzing discovery, by comparing the strengths and weaknesses of each of the pathways. Depending on the respective values of our three parameters, we thus have a robust tool for deepening this domain at the heart of the representation of information on the discovery process, in its environment of competitive attempts. “Explainable Pathways” can be developed in a large range of services to the authors and reviewers, significantly augmenting the efficiency of documentation tasks and the readability of documents.

3.6. Possible New Patterns for Search Profile Retrieval

  • A new conceptual venue of “modeling retrievability” (opportunities, behaviors)
Within the framework of “multimodal knowledge acquisition”, scholarly knowledge appears open to the innovations that we have discussed in the previous sections and that can find additional value in novel ways of modeling information retrieval. User modeling that combines access logs, page contents and semantics [63] may appear out of reach in the near future, but is nonetheless consistent with a mainstream attitude found in this research, namely to “represent each user by a set of features derived from the different data sources, where some feature values may be missing for some users”.
The need for new patterns is clearly identified in the Woods Hole Open Access Server [64] and is illustrated by text analyses aimed at “mapping research output” (e.g., [65]).
  • Real world practices and elaboration of patterns
Practices of observation and the exploitation of usage logs benefit scientific workflows such as Embase and its parallel universe, Scopus [66], to evaluate the degree of overlap between the “offer” and “demand” of scientific documentation through “the search carried out for a systematic review investigating validated existing track and trigger scores”. It creates a new method for the ‘canonicalization’ of the dataset’s uses and modeling at W3C with ongoing discussion on new standards (https://www.w3.org/TR/rdf-canon/#intro-uses/, accessed on 14 February 2023).
  • Routes of knowledge and rules of linkage
Hypertext and hyperlink analysis is an open highway for modeling scientific logs for identifying the “routes of knowledge” taken by any cognitive community. In this direction, we should mention that research topic identification, in relation to search activities [67] and new mutualization initiatives, such as COST, can be used to implement crowd-sourced complex search tasks. Thus, there is the need to configure dynamic search results in scientific topics that we propose to call “IMAGO”, with reference to the biological equivalent concept, to distinguish those search results from other meta-data existing around scientific contributions, such as Google Trends [68].
  • Search patterns and the canonicalization of datasets
Search patterns in the literature in the context of scientific research are opportunities to develop original analyses of “non factoid” answers [69] that aim at “investigating research gaps and research objectives that are promising to obtain insight into future research directions” and for which GRAPHYP’s methodology provides a prototype. Multimodal search creates the need to improve observations of new interactions between research documentation and influence, such as from other sources [70].
Are there modellable behaviors in the search experience? How are those behaviors related to sense-making activities on web graphs (WebGraph: https://webgraph.di.unimi.it/, accessed on 4 March 2023)? Is scientific research characterized by specific regularities?

4. Discussion

To answer the research questions raised in the Introduction of this study, we showed, with GRAPHYP, how a novel scientific knowledge graph can assist scientific reasoning with complete representations of adversarial documentary tracks, serving as a generator (GR1) and a discriminator (GR2). We found assessor shift representation to be a key unit of data in this regard, as it signals critical changes in the path of reasoning, and we advocate for a system that provides users with indirect, intermediary and neutral information about the research topic they are exploring.
Readers are endemic producers of information about the texts they consult, through the traces they leave, including traces that constitute documentary routes. Computer science now has the ability to exploit this information to the benefit of new knowledge [71]; with the filtering of search records on any research question, we argue that it becomes possible to capture the characteristics of the acquisition of documented knowledge. For the first time in the history of scientific work, one can apprehend, on the scale of the global web, a new type of information about sense-making activities, the impacts of which are considerable on the research workflow. This information can be sketched out as the ‘route’ that all new knowledge follows, based on the data on the search experience and its connections between users and items. In addition, the directions and choices of predecessors—previous users of a given query—can be captured from user logs recording the items selected during search sessions. New methodologies involve tagging a lot of interpretable data resulting from search experiences; formerly hidden or concealed, those technologies are now more widely shared.
We outlined the rich commonality of logs for research, and, with GRAPHYP modeling, we proposed a prototype to model assessor shifts.
Web mining usage and its related analytics too often remain an unfertilized commonality of cognitive communities in research activities; on the web as well as in databases, modelized data on the use of the web remains a kind of “res nullius” of the Roman era [72]. Modeled uses of predecessors are too often ignored, hidden or hardly defined and ill-protected.
However, retrieving a relevant result on the web remains an ambiguous practice. On one hand, the progression toward the result is instantaneous and obvious, and on the other hand, the diversity of neighboring results is so rich that the search remains full of unanswered questions. As keywords provide access to a zoo of meanings within which we are compelled to express our preferences, we show in an inverted approach what are the adversarial features of the existing choices to allow everyone to benefit from the comprehensive mapping of possible results, either to find others features to reach the same place or other places that can express the same features.
This was the reason why we designed a neutral model with a full inverted matrix of choices from research, to search adversarial characteristics. We then discovered rich additional search strategies and tools implied by geometric graphs, which can be applied in web graph approaches.
New approaches toward the exploitation of web usage open a wide avenue toward opportunities that have not yet all been measured, but which could make it possible to open or extend research in many fields with existing technology, mature and fully adapted to the tasks of research. Moreover, compared to other domains, these technologies are developed with common natural language standards (dictionaries, definitions and categorizations).
However, these options leave many important questions open in fields such as graph alignment methodologies [73], and we are also aware of having designed a methodology that must be completed in further subgraph interpretations [74] that we plan to develop in further research.

5. Conclusions

We have shown, throughout our study, the urgency of resorting to the uses of the web to characterize the documentary routes and, thus, to assist the scientific reasoning of new readers wishing to compare the paths used by predecessors when exploring a research question. We have also shown that a new generation of knowledge graphs has the capacity to visualize, for the users of new services which remain to be developed, not only the paths of knowledge but also the changes and reversals of evaluations (assessor shifts) that generally characterize scientific controversies. We have introduced a new methodology for visualizing the URLs consulted during the search process. Finally, GRAPHYP plays its role as a ‘multiverse’ geometric graph in modeling possible search strategies answering research questions.
Moreover, the documentary tracks followed during the scientific process deserve comments on their status and their uses, as here arises a question of correlation between information and results, theoretical and practical, which is not addressed in this study and is limited to direct relationships between data and assessment.
We assume in this article that retrievable adversarial documentary tracks of scientific reasoning have the value of possible ‘knowledge contents’ about revised assessments. What the user of the SKG GRAPHYP can identify and consider as evidence is that it exists as a modeled resource regarding a corresponding yet unreached research question.

6. Further Works

Due to the strategic importance of integrity and privacy in those fields, which is a matter in itself and cannot take place in the present article, the authors are preparing an additional article devoted to this issue that opens new venues in ethical and legal aspects of scientific investigation under the conditions of web usage.
With the analysis of web usage logs, GRAPHYP can contribute to highlighting the integrity issues of digital categorizations in relation to the indexing of scientific contributions in large datasets; experiments are expected in this direction.
In another work in progress, we plan to explore how data management and visualization are used in organizations adopting Elastic Stack solutions to collect integrated data from different sources in one place, and then to visualize and analyze them in near real time.

Author Contributions

Conceptualization, R.F.; investigation, R.F., O.A. and P.B.; methodology, R.F. and O.A.; supervision, R.F. and D.E.; writing—original draft preparation, R.F.; writing—review and editing, O.A., P.B., J.S. and D.E. All authors have read and agreed to the published version of the manuscript.

Funding

This research received no external funding.

Data Availability Statement

Not applicable; this study does not report any data.

Conflicts of Interest

The authors declare no conflict of interest.

Appendix A. Design of SKG GRAPHYP (Already Published in Paper GR1 [1])

For the convenience of the readers and reviewers, we reproduce here the extracts of Fabre et al., 2022 [1] that contain the description of the key features of GRAPHYP.
The graph design of SKG GRAPHYP is a crown bipartite graph with connected edges (https://mathworld.wolfram.com/UtilityGraph.html, accessed on 2 August 2022) featured with distance-transitivity (https://mathworld.wolfram.com/Distance-TransitiveGraph.html, accessed on 2 August 2022). A first sketch of this modeling has already been described in [7].
SKG GRAPHYP achieves its purpose by positioning search communities in a “searchable space” where all users gathered in cliques of searching communities share the same keywords. The geometry of GRAPHYP allows two functions:
It allows each clique in its community to be positioned in the searchable space, according to the characteristics of its search history;
It assists a clique inside a community in navigating on the graph, to reach the position of neighboring cliques in the same community, linked by the same characteristics of search goals (‘search goals’, as a generic term, encompasses similar queries, keywords or groups of URLs).
Let us develop in operational terms the methodology initially sketched in [7], which has been transformed here in terms of calculation bases. In order to record the “search routes” of any clique in a community for a given keyword and for routes that may differ and are intended to be compared, we write the following:
Qn = f(Nn;Kn)
where Qn is the number of searches related to a given topic. Q expresses the quantitative weight of any community as measured by the documentary usage of this community for its cognitive purpose of answering a research question. In addition, Q can compile different queries provided that they belong to the same parameter of research question.
Let us also consider that, for each search Q, we identify a parameter of mass that corresponds to a number N of users, and a parameter of intensity K that corresponds to the number of items (URL, documents and articles) constituting the search outcomes, among a corpus of items related to the keyword or the group of related keywords. We can consider the N users of K items as a community of users of the same query route Q (alternatively, we can represent Q search session results via another expression of preferences, i.e., not a user/item approach, but an item/item approach, in which N items and K items are mixable in communities of preferences in which we consider that this mix of publications characterizes comparable sets of search sessions). The positioning of any distinct route can be expressed for a given search within the limits of a system of typical search sessions.
Recording dynamics of search sessions: A third node measuring the value of a parameter of attention
Here, we propose a new method for recording the dynamics of GRAPHYP, which clarifies and differs from [7]. Let us calculate the mean values of N and K on the whole set of search sessions; we can normalize the presentation of all search sessions, as located above or below the mean ratio N/K. Additional information on that ratio is given by its dynamics at the scale of the whole set of analyzed search sessions, as well as by its value in any triplet. In fact, with any recorded value of the N/K ratio, the ratio of attention is an associated index of dynamics in documentation behavior, which expresses that N/K preferences can be conversely recorded either from an abruptly changing behavior or from a steadily increasing or decreasing behavior in reading articles (in our example). “Attention” is thus a behavioral component of the observed retrieval experience that measures the “permanence” or, conversely, the “rupture” in the search experience rhythm; this third parameter can be “stable” or “erratic”. When combined with intensity (which can measure few or many documents) and mass (which can represent a large or a small number of users), attention thus integrates a useful additional parameter of stability/disruption in search practice.
By adding a parameter of attention, we change our function Q of two variables, N and K, into a triplet in which the third term linking N and K represents this expression of stability/disruption of behaviors and that allows us to address the multiple factors bound to attention (mechanisms, types of co-attention, intra-attention and all documentary behaviors to measure a “real-valued hint” in information retrieval). For instance, we can practice the community detection of the readers of a usual group of chemistry articles “before” and “after” the publication of a new important article, and we would thus notice if this additional publication “accelerated”—or not—the readings in peripherally related domains.
Let us measure the value of that third term with a ratio calculated from a value of normalization, expressed from the mean value of N/K. We can consider a fraction α/β, where α is the numerator calculated from the N mean value, and β is the denominator derived from the mean value of K. This fraction α/β varies, consequently, with any recorded group of reader and article values. (An alternative procedure can be to note α, the coefficient of increase in N, and β, the coefficient of increase in K, when Q varies by one unit when an additional query on the same search is recorded).
The value of this fraction brings a specific element of dynamic analysis. It expresses the degree of attention emerging in cliques of the cognitive community’s documentary practice and makes it possible to measure the “stability” or “disruption” of the behaviors of users on items of a search session, when the quantities N and K increase or decrease between searches when N and K values are computed on the whole set of a group of searches for the purpose of detecting cliques in the community of searches on the same keyword. Therefore, attention contributes to measuring changes in the dynamics of the search of documents that are met on routes of search.
The fraction α/β thus provides a dynamic index of the variations recorded in the practices and controversies of various cliques in scientific communities, revealing quantitatively how “strong” or “weak” they could be. This approach toward sensitiveness to frequency may also indirectly help detect differences between cliques in communities approaching the same concept by homonyms. (For the same new category of items, several communities could be neutral to a change in publishing orientation, and others could be reactive.)
(i) Entity alignment of cognitive communities in GRAPHYP modeling
Networking search sessions and the detection of cliques in cognitive communities in the SKG
We know that, with the added mix of users and items that it measures, the search experience profile tends to be “stable” when (α/β) approaches its mean value on the whole set of recorded corresponding search sessions, and “unstable” in any of the other cases, when the recorded value deviates from the mean value. The method is here related to the graph’s assortativity approaches described in Wolfram Assortativity (https://reference.wolfram.com/language/ref/GraphAssortativity.html accessed on 2 August 2022).
With the three above described parameters, two triplets can be shaped to represent a formal graph-based representation of paths between two limits fixed to the expression of the preferences of users. With the design of Figure A1 hereunder, we can position between these two limits the six non-contradictory solutions that combine values of parameters that can be connected between those two limits. It shapes the following bipartite crown graph with connected nodes, representing six typical networks of nodes; those subnetworks in GRAPHYP represent the modelizable cliques of any cognitive community in our conceptual framework.
Figure A1. Mapping search experience in GRAPHYP: a–f are the six typical modelizable cliques combining triplets of nodes that are included in a cognitive community [7].
Futureinternet 15 00147 g0a1
Each letter here materializes the head of a network of three nodes: a, b, c, d, e and f, which are all characterized by the combination of two other nodes (aef, bdf, etc.). Figure A1 shows a complete representation of which of the six typical positions of cliques contained in possible search experiences can be modeled between the two triplets of nodes designed in SKG GRAPHYP. It provides a tool for the classification of observed search sessions Q in a series of searches on a given keyword, according to the user and item choices.

References

  1. Fabre, R.; Azeroual, O.; Bellot, P.; Schöpfel, J.; Egret, D. Retrieving Adversarial Cliques in Cognitive Communities: A New Conceptual Framework for Scientific Knowledge Graphs. Future Internet 2022, 14, 262. [Google Scholar] [CrossRef]
  2. Davis, E. Benchmarks for Automated Commonsense Reasoning: A Survey. arXiv 2023, arXiv:2302.04752. [Google Scholar]
  3. Cheng, X.; Lin, X.; Shen, X.-L.; Zarifis, A.; Mou, J. The dark sides of AI. Electron. Mark. 2022, 32, 11–15. [Google Scholar] [CrossRef] [PubMed]
  4. Xu, Y.; Liu, X.; Cao, X.; Huang, C.; Liu, E.; Qian, S.; Liu, X.; Wu, Y.; Dong, F.; Qiu, C.-W.; et al. Artificial intelligence: A powerful paradigm for scientific research. Innovation 2021, 2, 100179. [Google Scholar] [CrossRef] [PubMed]
  5. Auer, S.; Oelen, A.; Haris, M.; Stocker, M.; D’Souza, J.; Farfar, K.E.; Vogt, L.; Prinz, M.; Wiens, V.; Jaradeh, M.Y. Improving Access to Scientific Literature with Knowledge Graphs. Bibl. Forsch. Und Prax. 2020, 44, 516–529. [Google Scholar] [CrossRef]
  6. Jaradeh, M.Y.; Oelen, A.; Farfar, K.E.; Prinz, M.; D’Souza, J.; Kismihók, G.; Stocker, M.; Auer, S. Open Research Knowledge Graph: Next Generation Infrastructure for Semantic Scholarly Knowledge. In Proceedings of the 10th International Conference on Knowledge Capture (K-CAP’19), Del Rey, CA, USA, 19–21 November 2019; Association for Computing Machinery: New York, NY, USA, 2019; pp. 243–246. [Google Scholar] [CrossRef]
  7. Fabre, R. A searchable space with routes for querying scientific information. In Proceedings of the 8th International Workshop on Bibliometric-Enhanced Information Retrieval (BIR 2019), Cologne, Germany, 14 April 2019; pp. 112–124. Available online: http://ceur-ws.org/Vol-2345/paper10.pdf (accessed on 2 August 2022).
  8. Sanderson, M.; Scholer, F.; Turpin, A. Relatively Relevant: Assessor Shift in Document Judgements. Australasian Document Computing Symposium. 10 December 2010. Available online: http://www.cs.rmit.edu.au/adcs2010/proceedings/pdf/paper%2015.pdf (accessed on 11 February 2023).
  9. Schweinsberg, M.; Feldman, M.; Staub, N.; Akker, O.R.V.D.; van Aert, R.C.; van Assen, M.A.; Liu, Y.; Althoff, T.; Heer, J.; Kale, A.; et al. Same data, different conclusions: Radical dispersion in empirical results when independent analysts operationalize and test the same hypothesis. Organ. Behav. Hum. Decis. Process. 2021, 165, 228–249. [Google Scholar] [CrossRef]
  10. Zhang, J.; Jie, L.; Rahman, A.; Xie, S.; Chang, Y.; Yu, P.S. Learning Entity Types from Query Logs via Graph-Based Modeling. In Proceedings of the 24th ACM International on Conference on Information and Knowledge Management (CIKM’15), Melbourne, Australia, 19–23 October 2015; Association for Computing Machinery: New York, NY, USA, 2015; pp. 603–612. [Google Scholar] [CrossRef]
  11. Goodfellow, I.; Pouget-Abadie, J.; Mirza, M.; Xu, B.; Warde-Farley, D.; Ozair, S.; Courville, A.; Bengio, Y. Generative adversarial networks. Commun. ACM 2020, 63, 139–144. [Google Scholar] [CrossRef]
  12. Lamers, W.S.; Boyack, K.; Larivière, V.; Sugimoto, C.R.; van Eck, N.J.; Waltman, L.; Murray, D. Meta-Research: Investigating disagreement in the scientific literature. eLife 2021, 10, e72737. [Google Scholar] [CrossRef]
  13. Walk, S.; Esín-Noboa, E.; Helic, D.; Strohmaier, M.; Musen, M.A. How Users Explore Ontologies on the Web: A Study of NCBO’s BioPortal Usage Logs. In Proceedings of the 26th International Conference on World Wide Web (WWW’17), Geneva, Switzerland, 3–7 April 2017; pp. 775–784. [Google Scholar] [CrossRef]
  14. Yuan, H.; Yu, H.; Gui, S.; Ji, S. Explainability in Graph Neural Networks: A Taxonomic Survey. IEEE transactions on pattern analysis and machine intelligence. arXiv 2020, arXiv:2012.15445. [Google Scholar]
  15. Velickovic, P. Message Passing All the Way Up. ICLR 2022 Workshop on Geometrical and Topological Representation Learning. March 2022. Available online: https://openreview.net/forum?id=Bc8GiEZkTe5 (accessed on 11 February 2023).
  16. Kairouz, P.; Liao, J.; Huang, C.; Vyas, M.; Welfert, M.; Sankar, L. Generating Fair Universal Representations Using Adversarial Models. IEEE Trans. Inf. Forensics Secur. 2022, 17, 1970–1985. [Google Scholar] [CrossRef]
  17. Borgelt, C.; Gebhardt, J.; Kruse, R. Possibilistic Graphical Models. In Computational Intelligence in Data Mining; International Centre for Mechanical Sciences; Della Riccia, G., Kruse, R., Lenz, H.J., Eds.; Springer: Vienna, Austria, 2000; Volume 408, pp. 51–67. [Google Scholar] [CrossRef] [Green Version]
  18. Causal Inference Interest Group at the Alan Turing Institute. Available online: https://www.turing.ac.uk/research/interest-groups/causal-inference (accessed on 10 March 2023).
  19. Weiss, K.; Khoshgoftaar, T.M.; Wang, D. A survey of transfer learning. J. Big Data 2016, 3, 9. [Google Scholar] [CrossRef] [Green Version]
  20. Afzal, Z.; Tsatsaronis, G.; Doornenbal, M.; Coupet, P.; Gregory, M. Learning Domain Labels Using Conceptual Fingerprints: An In-Use Case Study in the Neurology Domain. In Proceedings of the 20th International Conference on Knowledge Engineering and Knowledge Management—Volume 10024 (EKAW 2016), Bologna, Italy, 19–23 November 2016; Springer: Berlin/Heidelberg, Germany, 2016; pp. 731–745. [Google Scholar] [CrossRef]
  21. Faghri, F.; Nalls, M.A. Uncovering the complexities of biological structures with network-based learning: An application in SARS-CoV-2. Patterns 2021, 2, 100259. [Google Scholar] [CrossRef] [PubMed]
  22. Herbster, M.; Pasteris, S.; Vitale, F.; Pontil, M. A Gang of Adversarial Bandits. In Advances in Neural Information Processing Systems; Beygelzimer, A., Dauphin, Y., Vaughan, J.W., Eds.; Openreview: Camarillo, CA, USA, 2021; Available online: https://openreview.net/forum?id=S9NmGEMkn29 (accessed on 12 February 2023).
  23. Croft, W.B. The Importance of Interaction for Information Retrieval. In Proceedings of the 42nd International ACM SIGIR Conference on Research and Development in Information Retrieval (SIGIR’19), Paris, France, 21–25 July 2019; Association for Computing Machinery: New York, NY, USA, 2019; pp. 1–2. [Google Scholar] [CrossRef]
  24. Ghosh, S.; Rath, M.; Shah, C. Searching as Learning: Exploring Search Behavior and Learning Outcomes in Learning-related Tasks. In Proceedings of the 2018 Conference on Human Information Interaction & Retrieval (CHIIR’18), New Brunswick, NJ, USA, 11–15 March 2018; Association for Computing Machinery: New York, NY, USA, 2018; pp. 22–31. [Google Scholar] [CrossRef]
  25. Yang, Z.; Liu, N.; Hu, X.B.; Jin, F. Tutorial on Deep Learning Interpretation. In Proceedings of the 31st ACM International Conference on Information & Knowledge Management (CIKM’22), Atlanta, GA, USA, 17–21 October 2022; Association for Computing Machinery: New York, NY, USA, 2022; pp. 5156–5159. [Google Scholar] [CrossRef]
  26. Cooper, M.D. Usage patterns of a web-based library catalog. JASIST 2001, 52, 137–148. [Google Scholar] [CrossRef]
  27. Vellino, A. Usage-based vs. Citation-based Methods for Recommending Scholarly Research Articles. arXiv 2013, arXiv:1303.7149. [Google Scholar]
  28. Carlesi, C. Semantic Query Analysis from the Global Science Gateway. DANS 2018. [Google Scholar] [CrossRef]
  29. Lim, S.; Sim, H.; Gunasekaran, R.; Vazhkudai, S.S. Scientific User Behavior and Data-Sharing Trends in A Petascale File System. In Proceedings of the International Conference for High Performance Computing, Networking, Storage and Analysis (SC’17), Denver, CO, USA, 12–17 November 2017; Association for Computing Machinery: New York, NY, USA, 2017; pp. 1–12. [Google Scholar] [CrossRef]
  30. Samanta, D.; Dutta, S.; Galety, M.G.; Pramanik, S. A Novel Approach for Web Mining Taxonomy for High-Performance Computing. In Cyber Intelligence and Information Retrieval; Lecture Notes in Networks and Systems; Tavares, J.M.R.S., Dutta, P., Dutta, S., Samanta, D., Eds.; Springer: Singapore, 2022; Volume 291. [Google Scholar] [CrossRef]
  31. Silvestri, F. Mining Query Logs: Turning Search Usage Data into Knowledge; Now Foundations and Trends: Hanover, MA, USA, 2009; 176p. [Google Scholar]
  32. Gregory, K. A dataset describing data discovery and reuse practices in research. Sci. Data 2020, 7, 232. [Google Scholar] [CrossRef] [PubMed]
  33. Grace, L.K.J.; Maheswari, V.; Nagamalai, D. Web log data analysis and mining. In Communications in Computer and Information Science; Advanced Computing. CCSIT, 2011, Meghanathan, N., Kaushik, B., Nagamalai, D., Eds.; Springer: Berlin/Heidelberg, Germany, 2011; Volume 133, pp. 459–469. [Google Scholar] [CrossRef]
  34. Zhang, T.; Qiu, H.; Castellano, G.; Rifai, M.; Chen, C.S.; Pianese, F. System Log Parsing: A Survey. arXiv 2022, arXiv:2212.14277. [Google Scholar]
  35. Bronstein, M.M.; Bruna, J.; Cohen, T.; Velickovic, P. Geometric Deep Learning: Grids, Groups, Graphs, Geodesics, and Gauges. arXiv 2021, arXiv:2104.13478. [Google Scholar]
  36. Reilly, F.E. Charles Peirce’s Theory of Scientific Method; Fordham University Press: New York, NY, USA, 2019. [Google Scholar] [CrossRef]
  37. Jaradeh, M.Y.; Singh, K.; Stocker, M.; Both, A.; Auer, S. Information extraction pipelines for knowledge graphs. Knowl. Inf. Syst. 2023, 65, 1989–2016. [Google Scholar] [CrossRef]
  38. Sugimoto, C.R. Theories of Informetrics and Scholarly Communication; De Gruyter Saur: Berlin/Heidelberg, Germany; Boston, MA, USA, 2016. [Google Scholar] [CrossRef] [Green Version]
  39. Dellsen, F.; Baghramian, M. Disagreement in science: Introduction to the special issue. Synthese 2021, 198 (Suppl. S25), 6011–6021. [Google Scholar] [CrossRef]
  40. Velickovic, P.; Blundell, C. Neural algorithmic reasoning. Patterns 2021, 2, 100273. [Google Scholar] [CrossRef]
  41. Bounhas, M.; Mellouli, K.; Prade, H.; Serrurier, M. Possibilistic classifiers for numerical data. Soft Comput. 2013, 17, 733–751. [Google Scholar] [CrossRef] [Green Version]
  42. Restivo, A.; Brunner, N.; Rosset, D. Possibilistic Approach to Network Nonlocality. arXiv 2022, arXiv:2208.13526. [Google Scholar]
  43. Hernandez, P.; Garrigos, I.; Mazon, J.-N. Modeling Web Logs to Enhance the Analysis of Web Usage Data. In Proceedings of the Workshops on Database and Expert Systems Applications, Bilbao, Spain, 30 August–3 September 2010; pp. 297–301. [Google Scholar] [CrossRef]
  44. Castillo, C.; Davison, B.D. Adversarial Web Search. Now Found. Trends 2011. Available online: https://ieeexplore.ieee.org/document/8187234 (accessed on 15 February 2023).
  45. Zhang, Z.; Johnson, C.; Venkatasubramanian, N.; Ren, S. Process scenario discovery from event logs based on activity and timing information. J. Syst. Archit. 2022, 125, 102435. [Google Scholar] [CrossRef]
  46. Derrida, J. Introduction. In Edmund Husserl, L’Origine de La Géométrie; coll. Épiméthée; Traduction et Introduction par Jacques Derrida; PUF: Paris, France, 1962; pp. 3–17. Available online: https://www.puf.com/content/Lorigine_de_la_g%C3%A9om%C3%A9trie (accessed on 12 February 2023).
  47. Tian, L.; Zhou, X.; Wu, Y.; Zhou, W.; Zhang, J.; Zhang, T. Knowledge graph and knowledge reasoning: A systematic review. J. Electron. Sci. Technol. 2022, 20, 100159. [Google Scholar] [CrossRef]
  48. Szabo, G.; Fath, G. Evolutionary games on graphs. Phys. Rep. 2007, 446, 97–216. [Google Scholar] [CrossRef] [Green Version]
  49. Zenil, H.; Kiani, N.A.; Marabita, F.; Deng, Y.; Elias, S.; Schmidt, A.; Ball, G.; Tegnér, J. An Algorithmic Information Calculus for Causal Discovery and Reprogramming Systems. iScience 2019, 19, 1160–1172. [Google Scholar] [CrossRef] [PubMed] [Green Version]
  50. Knyazeva, E.N. The idea of the multiverse: An interdisciplinary perspective. Philos. Sci. Technol. 2022, 27, 2. [Google Scholar] [CrossRef]
  51. Wilkinson, T. Fine-Tuning the Multiverse. Think 2013, 12, 89–101. [Google Scholar] [CrossRef]
  52. Bell, S.J.; Kampman, O.P.; Dodge, J.; Lawrence, N.D. Modeling the Machine Learning Multiverse. arXiv 2022. preprint. [Google Scholar] [CrossRef]
  53. Leydesdorff, L.; Ivanova, I. The measurement of “interdisciplinarity” and “synergy” in scientific and extra-scientific collaborations. JASIST 2021, 72, 387–402. [Google Scholar] [CrossRef]
  54. Dafflon, J.; Da Costa, P.F.; Váša, F.; Monti, R.P.; Bzdok, D.; Hellyer, P.J.; Turkheimer, F.; Smallwood, J.; Jones, E.; Leech, R. A guided multiverse study of neuroimaging analyses. Nat. Commun. 2022, 13, 3758. [Google Scholar] [CrossRef] [PubMed]
  55. Ivanova, I. New Frontiers in the Theory of Meaning in Inter-Human Communications. Technol. Forecast. Soc. Chang. 2021, 167, 120672. [Google Scholar] [CrossRef]
  56. Maly, I.; Slavik, P. Towards Visual Analysis of Usability Test Logs Using Task Models. In Task Models and Diagrams for Users Interface Design; Lecture Notes in Computer Science TAMODIA 2006; Coninx, K., Luyten, K., Schneider, K.A., Eds.; Springer: Berlin/Heidelberg, Germany, 2007; Volume 4385, pp. 24–38. [Google Scholar] [CrossRef]
  57. Lin, Y.; Evans, J.A.; Wu, L. New directions in science emerge from disconnection and discord. J. Informetr. 2022, 16, 101234. [Google Scholar] [CrossRef]
  58. Sajeeda, A.; Hossain, B.M. Exploring generative adversarial networks and adversarial training. Int. J. Cogn. Comput. Eng. 2022, 3, 78–89. [Google Scholar] [CrossRef]
  59. Vivek, R.; Mirje, P.; Sushmitha, N. Recommendations for web service composition by mining usage logs. arXiv 2016, arXiv:1604.03212. [Google Scholar]
  60. Menezes, T.; Nonnecke, B. UX-Log: Understanding Website Usability through Recreating Users’ Experiences in Logfiles. Int. J. Virtual Worlds Hum. Comput. Interact. 2014, 2368, 6103. [Google Scholar] [CrossRef] [Green Version]
  61. Hoxha, J.; Junghans, M.; Agarwal, S. Enabling Semantic Analysis of User Browsing Patterns in the Web of Data. In Proceedings of the IEEE International Conference on Web Intelligence and Intelligent Agent Technology (WI-IAT), Lyon, France, 17 April 2012; Volume 1, pp. 488–495. [Google Scholar]
  62. Fujita, S.; Dupret, G.; Baeza-Yates, R. Learning to Rank Query Recommendations by Semantic Similarities. arXiv 2012, arXiv:1204.2712. [Google Scholar]
  63. Fortuna, B.; Mladenic, D.; Grobelnik, M. User Modeling Combining Access Logs, Page Content and Semantics. arXiv 2011, arXiv:1103.5002. [Google Scholar]
  64. How Researchers Search and Access New Data for Research. Available online: https://darchive.mblwhoilibrary.org/handle/1912/26285 (accessed on 10 March 2023).
  65. Mapping research output to the Sustainable Development Goals. Available online: https://zenodo.org/record/3832090#.YzQvx3ZBxGM (accessed on 10 March 2023).
  66. Bramer, W.M.; Rethlefsen, M.L.; Kleijnen, J.; Franco, O.H.; Bramer, W.M.; Rethlefsen, M.L.; Kleijnen, J.; Franco, O.H. Optimal database combinations for literature searches in systematic reviews: A prospective exploratory study. Syst. Rev. 2017, 6, 245. [Google Scholar] [CrossRef]
  67. Kirrane, S.; Sabou, M.; Fernández, J.D.; Osborne, F.; Robin, C.; Buitelaar, P.; Motta, E.; Polleres, A. A decade of Semantic Web research through the lenses of a mixed methods approach. Semantic Web 2020, 11, 979–1005. [Google Scholar] [CrossRef]
  68. Nuti, S.V.; Wayda, B.; Ranasinghe, I.; Wang, S.; Dreyer, R.P.; Chen, S.I.; Murugiah, K. The Use of Google Trends in Health Care Research: A Systematic Review. PLoS ONE 2014, 9, e109583. [Google Scholar] [CrossRef] [PubMed] [Green Version]
  69. Breja, M.; Jain, S.K. A Survey on Non-Factoid Question Answering Systems; Taylor & Francis: Abingdon, UK, 2021; Available online: https://tandf.figshare.com/articles/dataset/A_survey_on_nonfactoid_question_answering_systems/14963799/1 (accessed on 11 March 2023).
  70. Lefebvre, M.; Renard, J. The Circulation of Scientific Articles in the Sphere of Web-Based Media: Citation Practices, Communities of Interests and Local Ties. PLoS ONE 2016, 11, e0158393. [Google Scholar] [CrossRef] [PubMed] [Green Version]
  71. Cabanac, G. Questioning Scientific Texts, Doctoral Thesis, Université de Toulouse. 2016. Available online: https://tel.archives-ouvertes.fr/tel-01413878/en (accessed on 30 March 2023).
  72. Fabre, F.; Schöpfel, J. L’hypertexte et les sciences (1991–2021): Des voies navigables pour les routes de connaissances. Hist. Rech. Contemp. 2021, 10. [Google Scholar] [CrossRef]
  73. Yu, C.; Wang, F.; Liu, Y.; An, L. Research on knowledge graph alignment model based on deep learning. Expert Syst. Appl. 2021, 186, 115768. [Google Scholar] [CrossRef]
  74. Yuan, H.; Yu, H.; Wang, J.; Li, K.; Ji, S. On Explainability of Graph Neural Networks via Subgraph Explorations. In International Conference on Machine Learning; PMLR: London, UK, 2021; Volume 139, pp. 12241–12252. Available online: http://proceedings.mlr.press/v139/yuan21c/yuan21c.pdf (accessed on 30 March 2023).
Scheme 1. The schematic structure of GRAPHYP. Identifying assessor shifts from logs of documentary tracks.
Futureinternet 15 00147 sch001
Figure 1. Retrieval grid of assessor shifts: (a) Circulation and exploration inside GRAPHYP from any node to the whole possible 72 positions within the Graph (6X12); (b) Complete local mapping of GRAPHYP’s grid.
Futureinternet 15 00147 g001
Figure 2. Example of the capture of three measured documentary tracks (A, B, C). The three parameters (N, α /   β ,   K ) are used to locate each ‘assessment track’ in the triplet space.
Futureinternet 15 00147 g002
Figure 3. α , β and α / β for 200 blocks of 10,000 sessions (2 million documents retrieved): variation above and under the mean value. α and β correspond, respectively, to the deviations from the average value, within a block of sessions, of the number of readers and the number of documents.
Futureinternet 15 00147 g003
Figure 4. Visualization of the roads for the first 10,000 consulted URLs. Each node (blue points) corresponds to a URL (a web page associated with a paper) for sessions in which multiple pages were viewed. An edge connects two nodes when the user has successively consulted the corresponding pages. Edges are represented either with blue lines (low frequency) or red lines (high frequency).
Futureinternet 15 00147 g004
Disclaimer/Publisher’s Note: The statements, opinions and data contained in all publications are solely those of the individual author(s) and contributor(s) and not of MDPI and/or the editor(s). MDPI and/or the editor(s) disclaim responsibility for any injury to people or property resulting from any ideas, methods, instructions or products referred to in the content.

