Article

An Interactive Method for Detection of Process Activity Executions from IoT Data †

Institute of Computer Science, University of St. Gallen, 9000 St. Gallen, Switzerland
*
Author to whom correspondence should be addressed.
This paper is an extended version of our paper “Method to Identify Process Activities by Visualizing Sensor Events” published in the Business Process Management 2022 Workshop proceedings.
Future Internet 2023, 15(2), 77; https://doi.org/10.3390/fi15020077
Submission received: 23 January 2023 / Revised: 13 February 2023 / Accepted: 13 February 2023 / Published: 16 February 2023
(This article belongs to the Special Issue IoT-Based BPM for Smart Environments)

Abstract

:
The increasing number of IoT devices equipped with sensors and actuators pervading every domain of everyday life allows for improved automated monitoring and analysis of processes executed in IoT-enabled environments. While sophisticated analysis methods exist to detect specific types of activities from low-level IoT data, a general approach for detecting activity executions that are part of more complex business processes does not exist. Moreover, dedicated information systems to orchestrate or monitor process executions are not available in typical IoT environments. As a consequence, the large corpus of existing process analysis and mining techniques to check and improve process executions cannot be applied. In this work, we develop an interactive method guiding the analysis of low-level IoT data with the goal of detecting higher-level process activity executions. The method is derived following the exploratory data analysis of an IoT data set from a smart factory. We propose analysis steps, sensor-actuator-activity patterns, and the novel concept of activity signatures that are applicable in many IoT domains. The method shows to be valuable for the early stages of IoT data analyses to build a ground truth based on domain knowledge and decisions of the process analyst, which can be used for automated activity detection in later stages.

1. Introduction

The Internet of Things (IoT) is experiencing increasing adoption in almost every domain of everyday life. Smart, interconnected devices consisting of a multitude of sensors and actuators are able to sense and interact with the physical world and other smart devices. On the one hand, these smart devices are more and more involved in the automation and execution of business processes. On the other hand, they act as interfaces with the physical world to provide real-time data about the execution of processes and activities as well as their surroundings. For this reason, the IoT is receiving increasing attention as an enabler of smart business process management (BPM) [1].
In many IoT domains (e.g., smart homes, smart healthcare and smart manufacturing) processes and routines describing repetitive sequences of activities and interactions among humans, computers and smart devices to achieve a common goal are omnipresent. However, the explicit notion of a process as a first-class citizen is rarely found in IoT. Existing solutions and related research are usually concerned with the tracking of specific types of activities and ad hoc interactions based on events from specialized sensors and analysis algorithms, but not with the overall processes these activities are part of. On the other hand, BPM systems are rarely used in IoT contexts to orchestrate, or at least to monitor, the execution of processes [2].
The goal of this work is to bridge this gap between event-based and process-based systems [1] and to derive a method to detect process activity executions from IoT data without relying on the existence of a BPM system for monitoring. By making process activities monitorable from IoT data, we are able to then apply the rich corpus of existing process mining techniques to discover (new) processes, check conformance of process executions, and optimize processes [1,3]. The following research question guides the development of the data analysis method: Which steps need to be taken to manually analyze IoT data for process activity executions? In this work, we focus on the interactive analysis of IoT data performed manually in an early stage by a data analyst. While several unsupervised machine learning approaches have produced unsatisfying results due to the complexity of IoT data and missing domain knowledge to build a ground truth [4], we propose a general, structured method to support the analyst with detecting and deriving knowledge about activity executions step-by-step from IoT data. This knowledge can then be used as ground truth for supervised learning and application to large data sets.
This work is structured as follows: Section 2 introduces the relevant background, the goal of our work and a scenario from smart manufacturing. Section 3 discusses related work. Section 4 develops the method for detecting activity executions from IoT data. Section 5 describes the application of the method in a proof of concept evaluation. Section 6 discusses the method. Section 7 concludes the paper and shows starting points for future work.
This paper is an extended version of the work presented in [5]. It was modified and extended as follows. The paper focuses on the research question related to the development of the analysis method. The background section provides a detailed discussion of process-awareness of IoT data and IoT-awareness of process data (Section 2.1). The smart manufacturing scenario and example processes are explained in more detail (Section 2.2). Related work is updated and extended (Section 3). The method for activity detection is revised, extended and derived more profoundly (Section 4). Several examples from the scenario are used to illustrate and back up the individual steps. The method now also includes a classification of sensor and actuator patterns related to activity detection (Section 4.4.1). It also discusses the discovery of processes and the existence of ambiguities. The tooling infrastructure and data pipeline are described briefly (Section 4.8). The analysis is based on a new data set from our smart factory, which is made publicly available [6]. A proof of concept evaluation is added describing the application of the method by a domain expert to label an unknown IoT data set (Section 5). The discussion section provides a broader discussion of the research question, the developed method, its applicability and limitations (Section 6).

2. Background and Motivation

This work is located at the intersection of Business Process Management (BPM) and the Internet of Things (IoT) as well as Cyber–Physical Systems (CPS). We start by providing a conceptual model regarding the interplay of these three fields and then describe a running example from the smart manufacturing domain. Thereby, we introduce our smart factory model as a small-scale representative of a CPS [2] and two typical manufacturing processes.

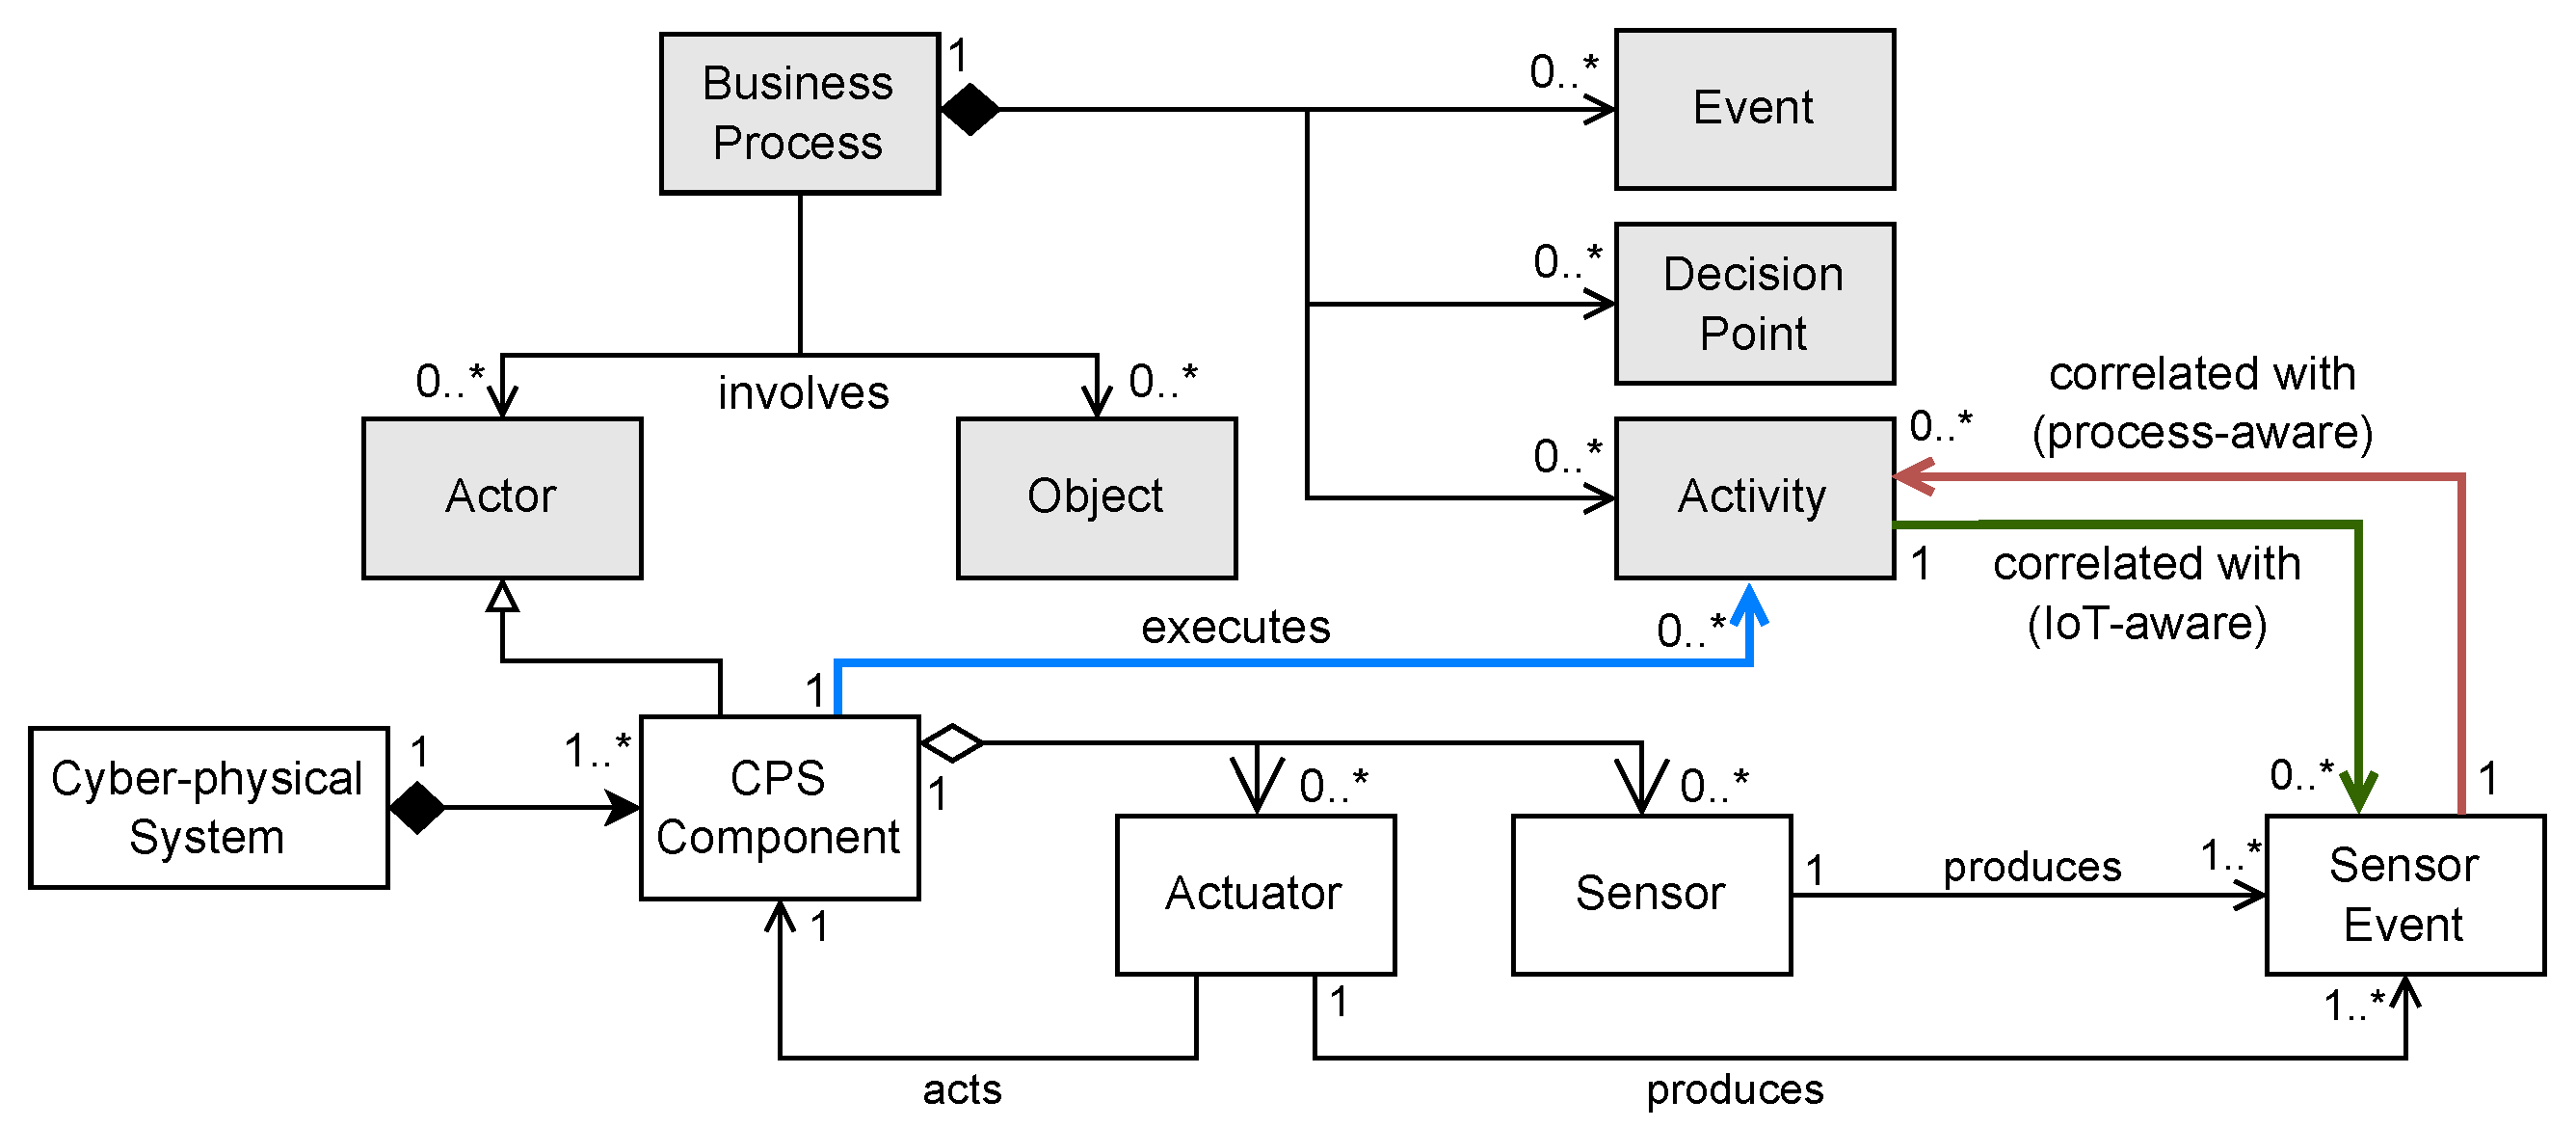
2.1. BPM Meets CPS and IoT

BPM is considered to be “the art and science of overseeing how work is performed in an organization to ensure consistent outcomes and to take advantage of improvement opportunities” [3]. A business process in this context can be seen as a chain of events, activities, and decisions that describe how work should be performed (cf. Figure 1) [3]. In our work, we focus on activities representing units of work performed by actors. Traditionally, these actors can be human actors, organizations, or software systems [3]. As shown in Figure 1, we propose that also components of Cyber–Physical Systems can be active participants involved in the execution of activities.
Cyber–Physical Systems (CPS) are “integrations of computation with physical processes” [7]. Computers embedded into physical objects and devices monitor and control processes with bi-directional feedback loops between the physical and digital worlds. Closely related to CPS is the concept of Internet of Things (IoT) [8] representing “a world-wide network of interconnected objects“ [9]. We will use the term CPS in this paper to address aspects regarding process automation and control. IoT will be used to talk about interaction and data acquisition (IoT data) from individual components.
Being parts of CPS components, sensors and actuators are the basic building blocks for interactions with the physical world. Sensors provide data about physical entities and their surroundings. Actuators are capable of modifying the state of physical entities [10]. Actuators can also provide data about their state or the physical entity they are manipulating. Thus, we regard both, sensors and actuators, as producers of sensor events (cf. Figure 1).
The focus of this work is on investigating the correlation between these sensor events (IoT data) and the execution of process activity executions, and vice versa. Linking IoT data to process executions in CPS promises many benefits [1] including, e.g., the improved monitoring of process activity executions by providing additional context data [11,12], or the real-time decision making in processes based on sensor data [13]. In this work, we distinguish between the linking of IoT data with processes (Process-Awareness of IoT Data) and the linking of process data with IoT (IoT-Awareness of Process Data) [14]. Usually, a data set containing one of the two types of data is given as the basis for analysis and the other type needs to be derived or linked.

2.1.1. Process-Awareness of IoT Data

Given a set of IoT data from sensors and actuators of CPS components, we define process-awareness of IoT data as the amount of information related to the execution of processes and activities that is contained within the data set (cf. Figure 1).
Full process-awareness is given if each sensor event is fully contextualized in the process execution, i.e., it can be clearly and directly associated with the execution of a specific instance of an activity within a specific process instance. No process-awareness is given if only the raw sensor readings are available without any process-related information.
The goal of this work is to increase the level of process-awareness in a given IoT data set with no process-awareness to full process-awareness based on a set of semi-automated steps and assumptions.
Note that as partially shown in Figure 1 the relation between a sensor reading and an activity execution is not always a clear 1:1 relation. This increases the complexity of determining the relationships automatically. A sensor event may also be associated with:
  • More than one activity (e.g., in case of batch processing);
  • No activity (e.g., in case of context data [12]);
  • An activity only indirectly (e.g., as an effect of activity execution).

2.1.2. IoT-Awareness of Process Data

Given an event log of the process (activity) executions from a BPM system [3], we define IoT-awareness of process data as the amount of information related to the sensor events of the CPS that is contained in the process event log (cf. Figure 1), also known as IoT-enriched event log [14]).
Full IoT-awareness is given if each process or activity execution-related event in the event log is linked to a set of relevant actuator and sensor events influencing or influenced by the execution of the corresponding activity. No IoT-awareness is given if there is no relation to IoT data contained in the event log.
Note that sensor events may also be associated with more than one event in the event log or with no event (e.g., context data on the level of an entire trace [12,14]).
Once we were successful in reaching full process-awareness of IoT data as discussed in the previous section, we can automatically generate an IoT-enriched event log based on the SensorStream format [14] that has full IoT-awareness and that can then be exploited for improved process monitoring and mining.

2.2. Smart Manufacturing Running Example

Smart manufacturing integrates manufacturing assets with sensors, computing platforms, communication, control, and simulation using concepts of CPS [15,16]. Manufacturing processes are highly automated and modern production machines provide vast amounts of sensor data. However, process-awareness of this data might vary as there is usually no BPM system in place to orchestrate or monitor executions [17]. Sensor and process-related data might come from different systems (e.g., IoT applications, manufacturing execution systems (MES), programmable logic controllers (PLC)) at different levels of granularity [18]. Moreover, legacy machines and human shop floor workers might only provide limited amounts of sensor data to allow for monitoring of activity executions.
In this work, we will base our investigations on examples from the domain of discrete smart manufacturing [19,20]. Here, we find a sophisticated set of sensors and actuators producing low-level–raw–IoT data that can be analyzed for generic patterns and other aspects that may indicate the execution of process activities. Higher level, process-related data from machines and control systems will only be used to validate the correctness of identified patterns in raw IoT data and of analysis steps. The patterns and analysis method can then be transferred to other smart spaces (e.g., smart homes, smart offices, and smart hospitals) that also emit low-level IoT data, but only very limited process-related data. In these smart spaces, there are usually no central BPM systems or other information systems for automated activity monitoring in place and processes are only partially automated [21].

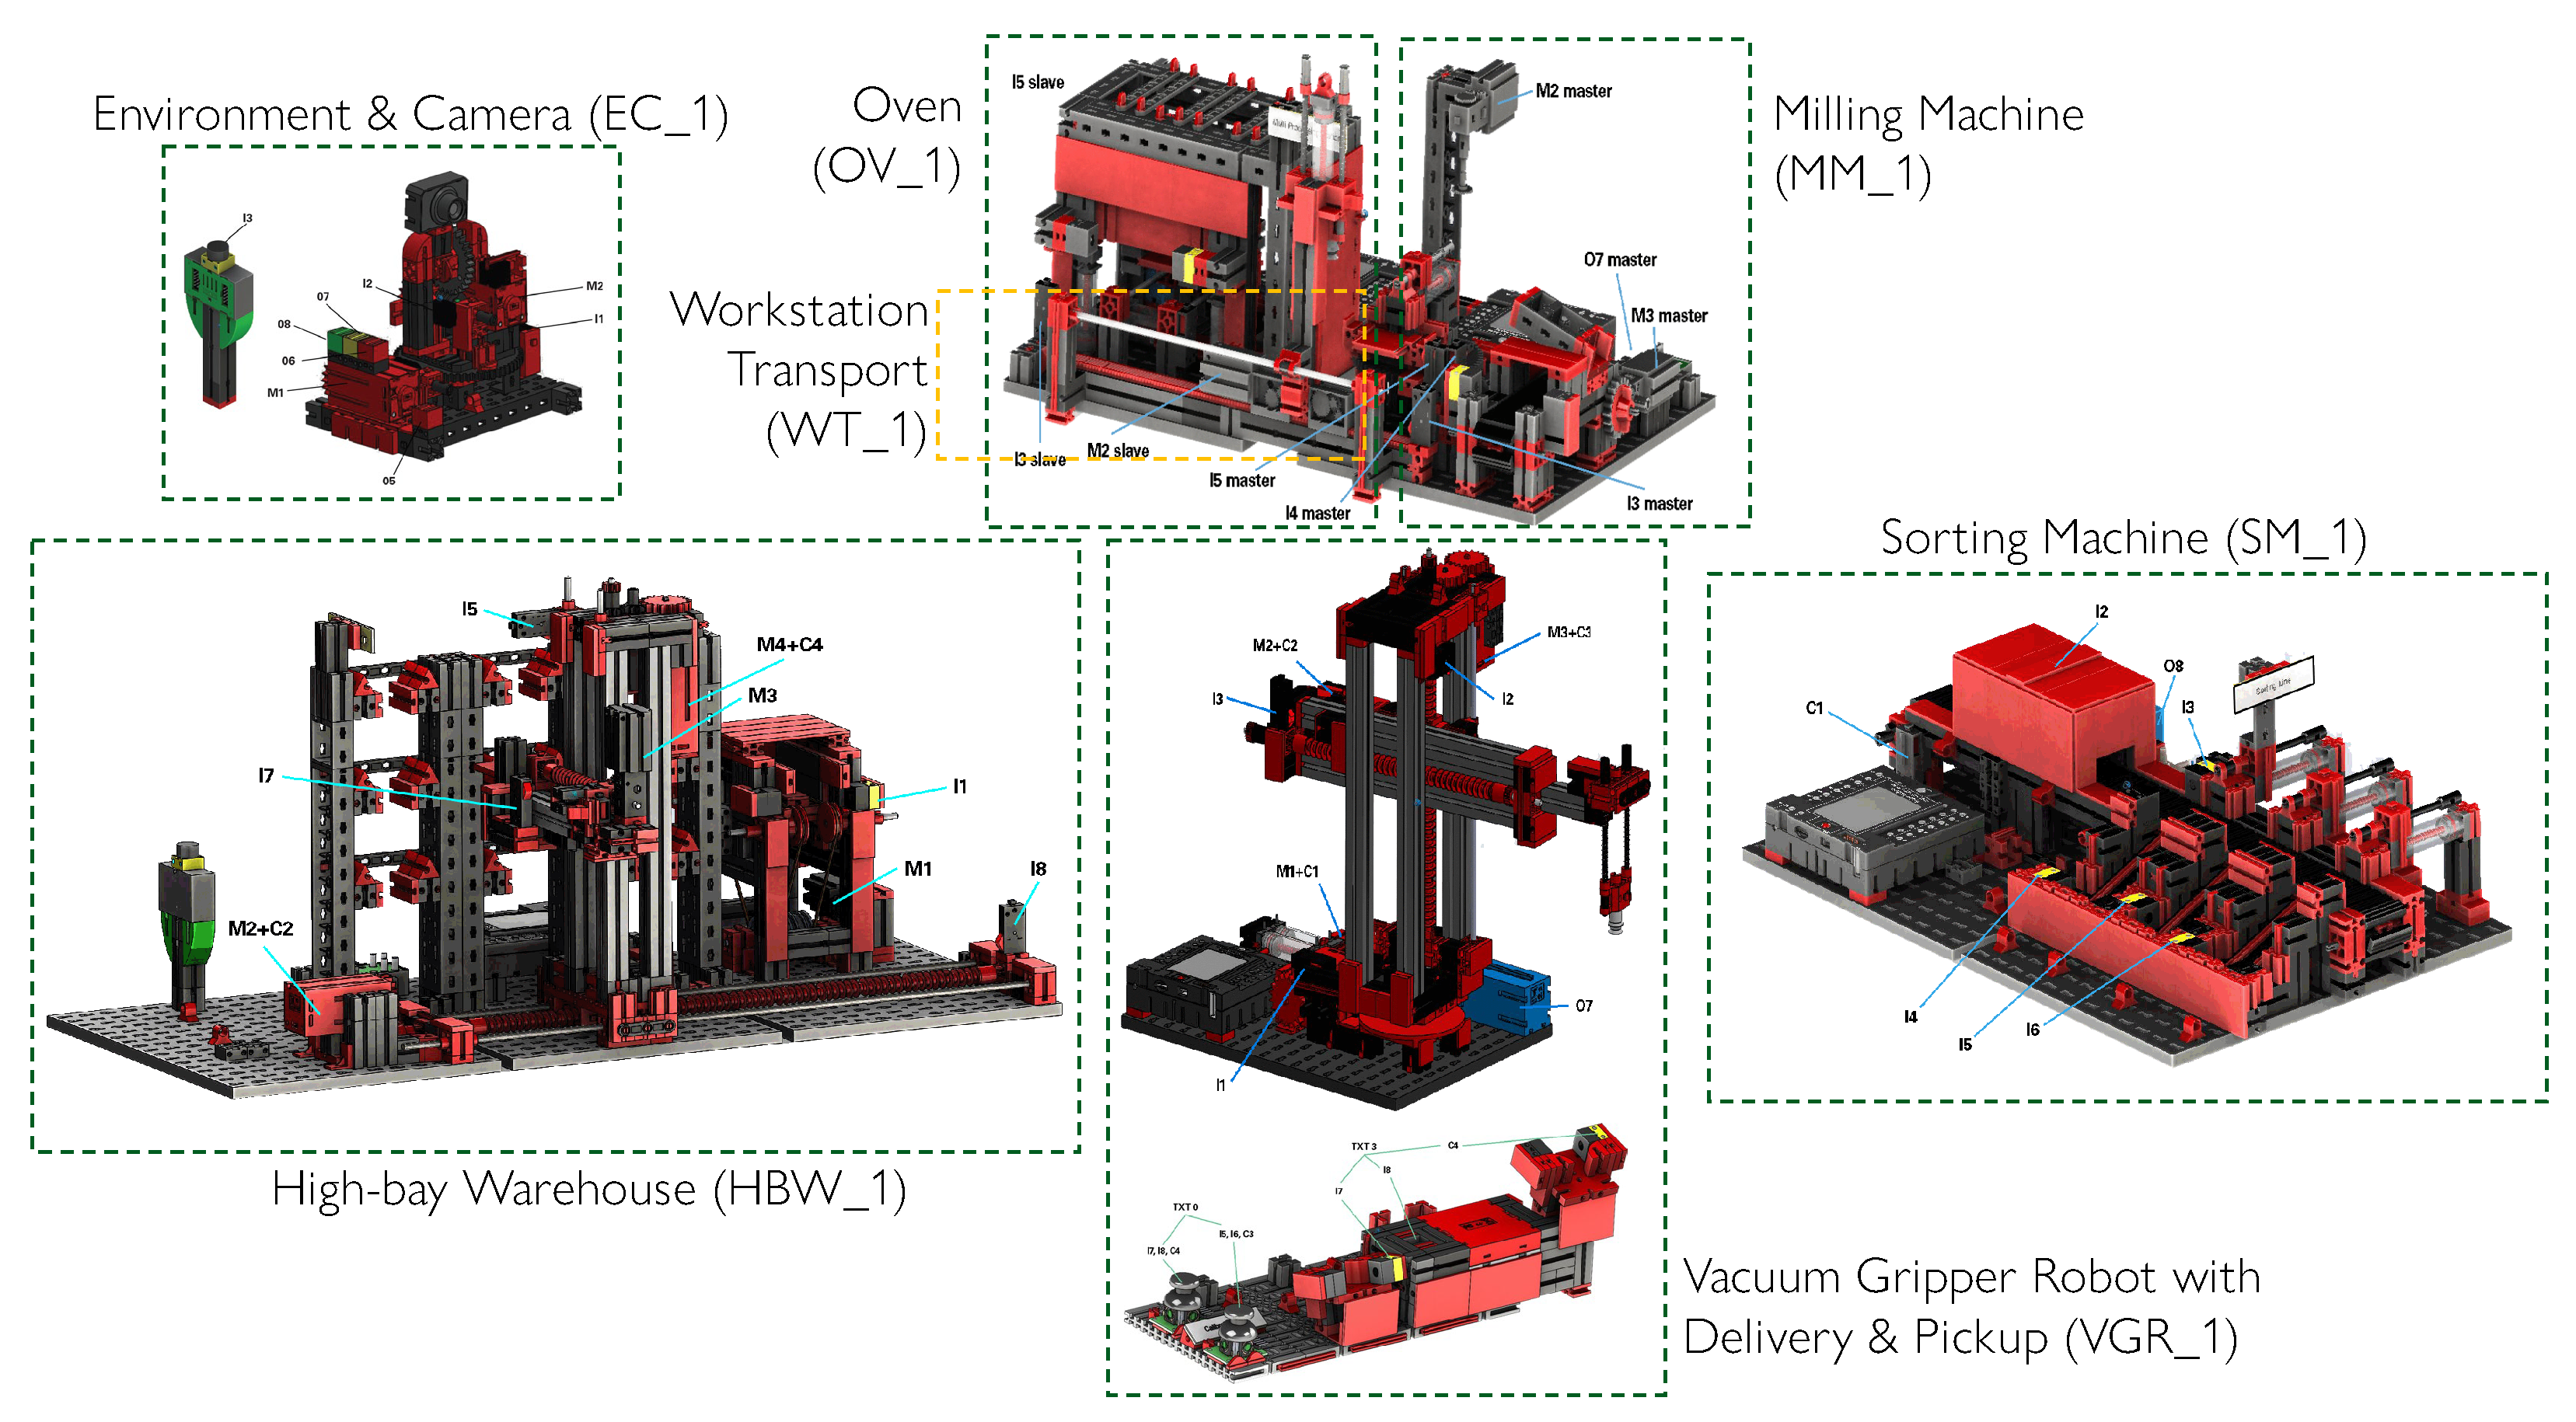
2.2.1. Smart Factory Model

We base the running examples on a smart factory model that serves as a typical representative of a CPS [2]. It includes different CPS components (here, production stations), each equipped with a number of sensors and actuators that allow us to demonstrate our approach in a sophisticated IoT environment. The smart factory model simulates a complete production line consisting of the production stations, sensors and actuators depicted in Figure 2. In general, we find the following types of sensors and actuators (cf. Table 1 for a generic and Table 2 for a concrete example) as part of the following CPS components.
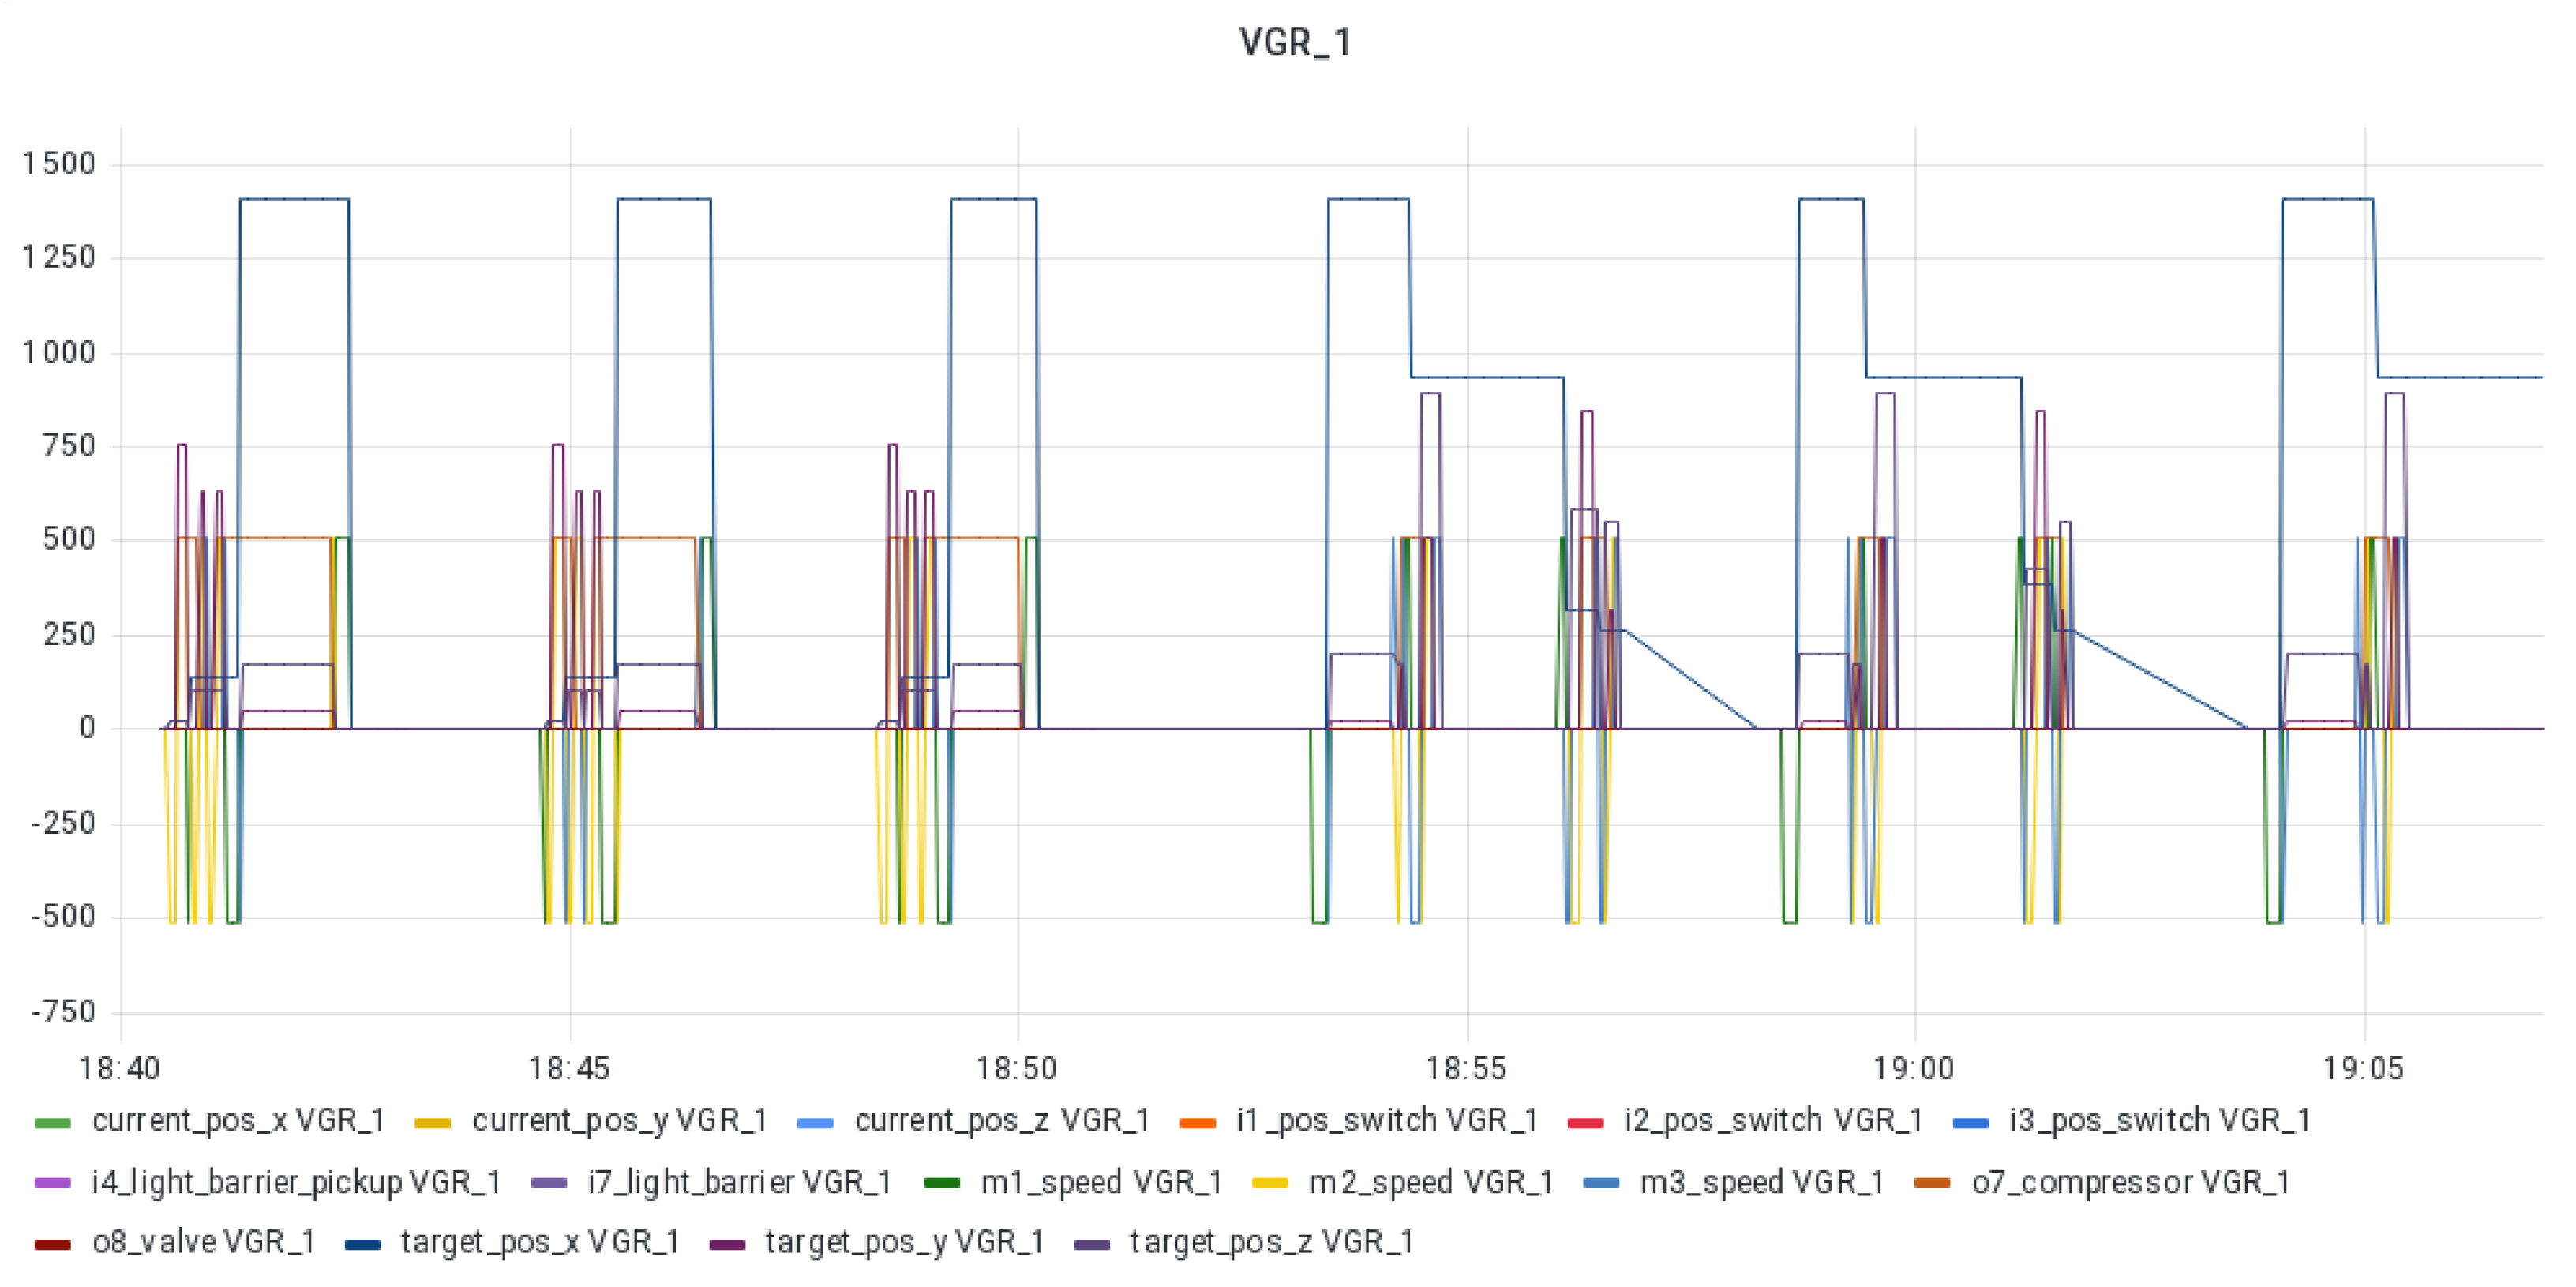
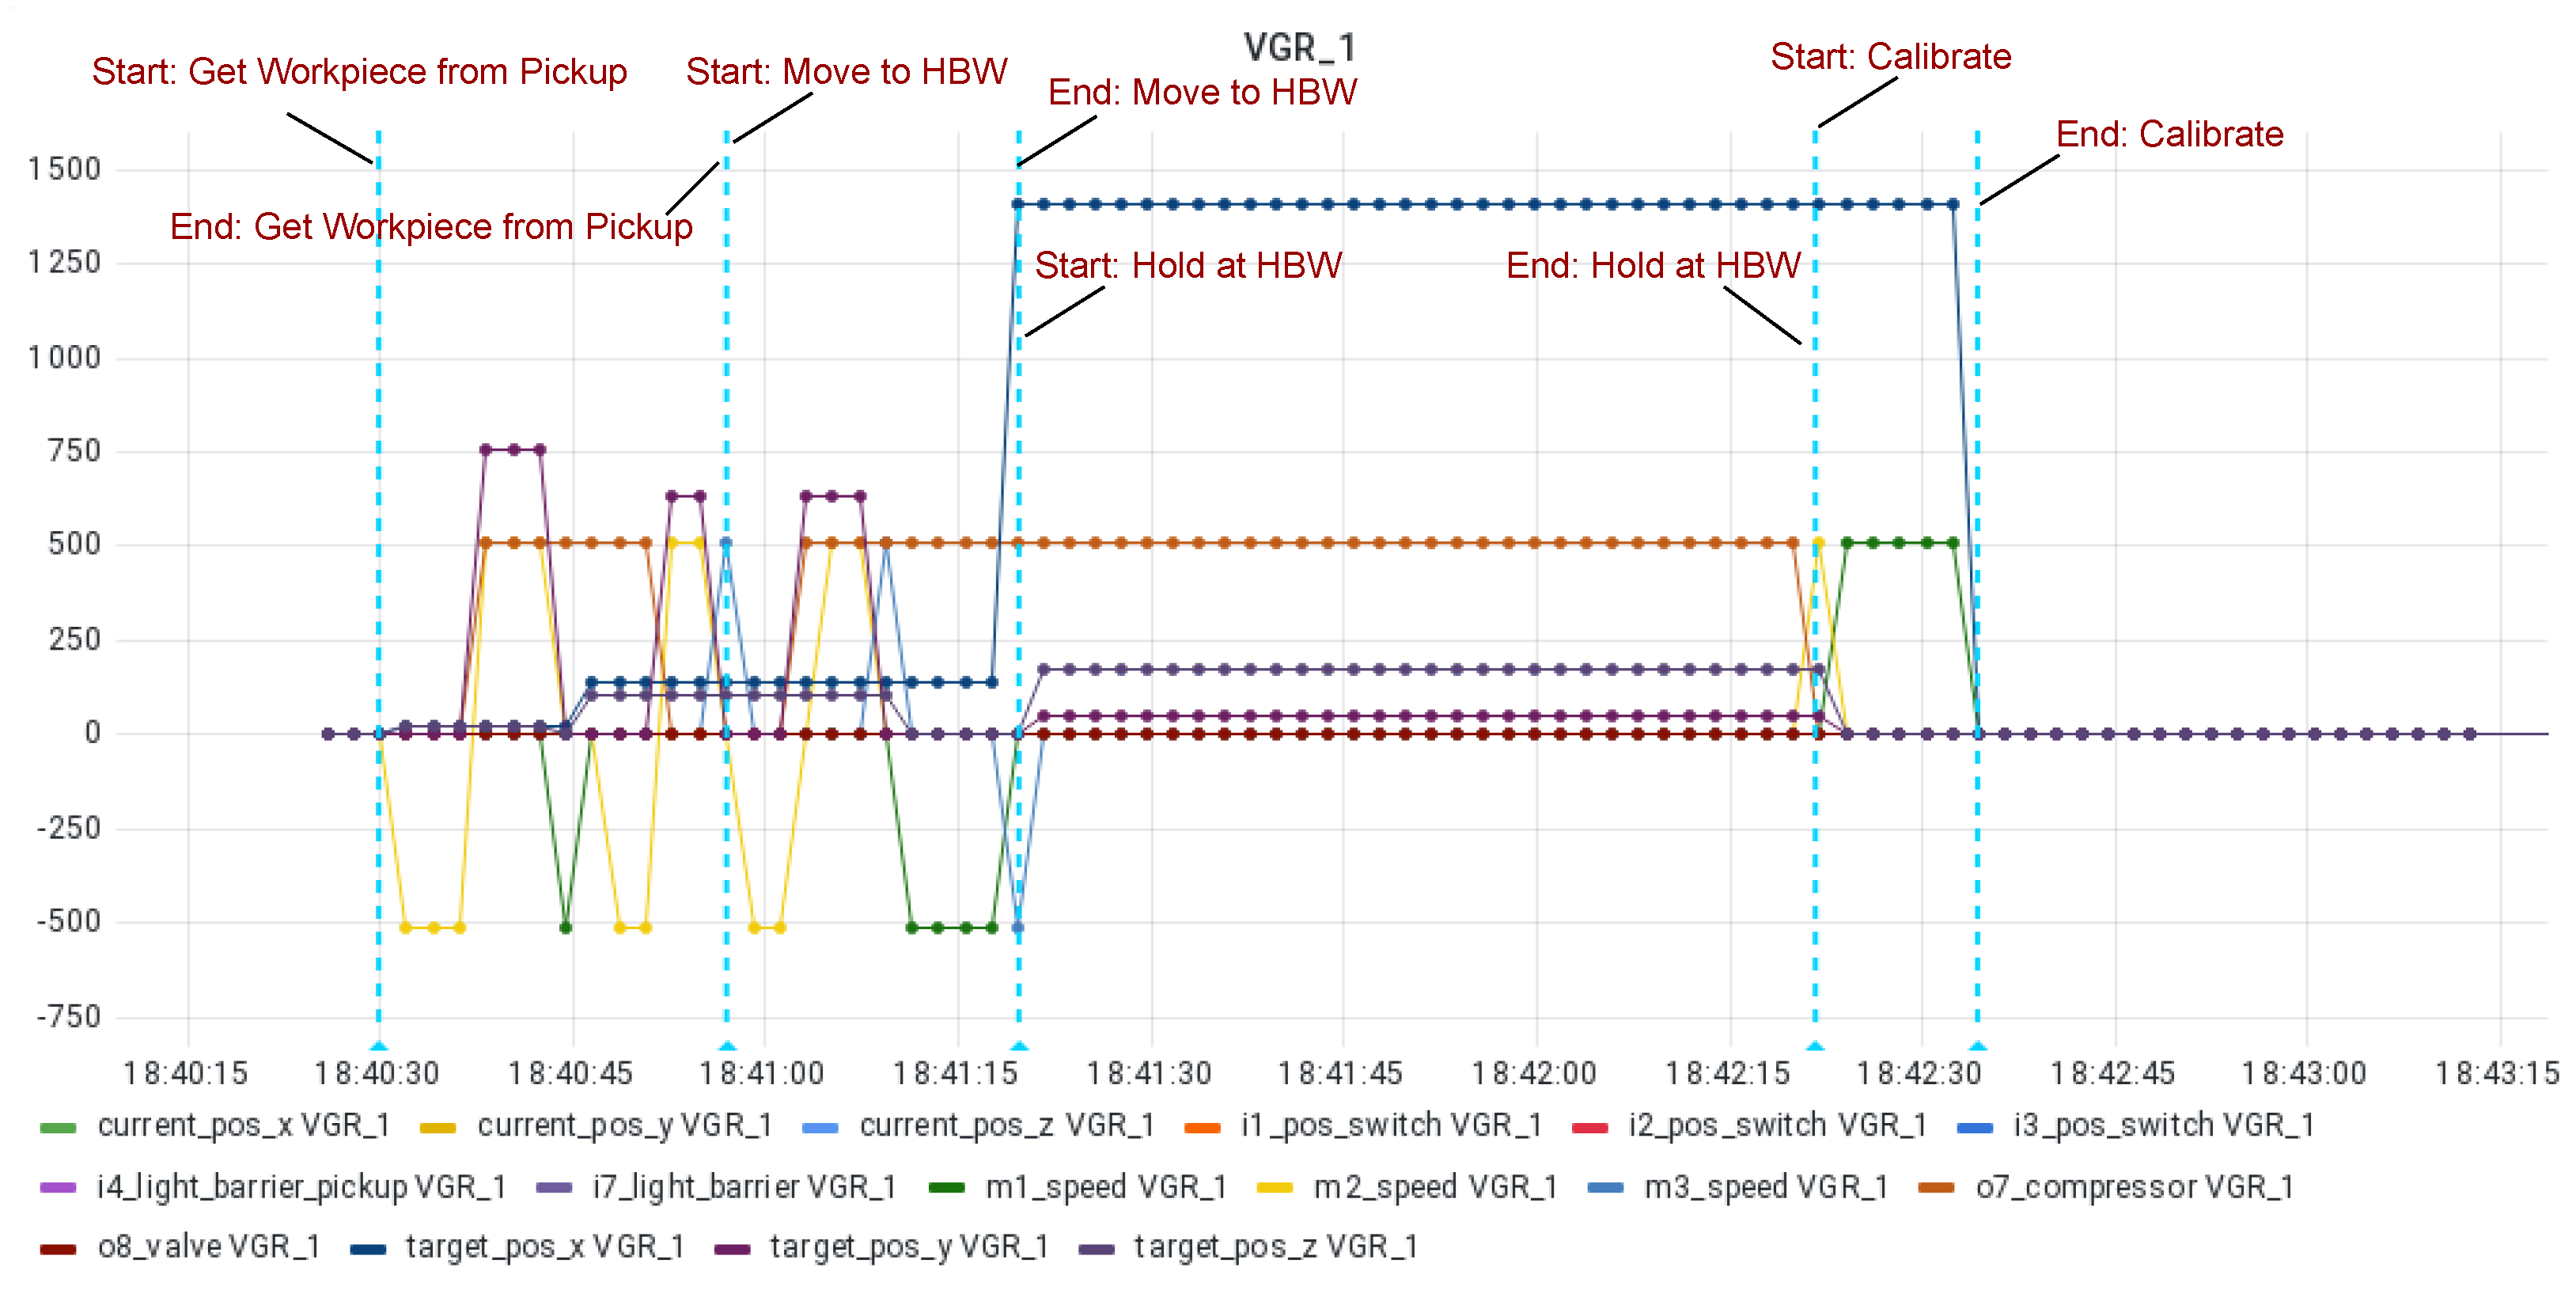
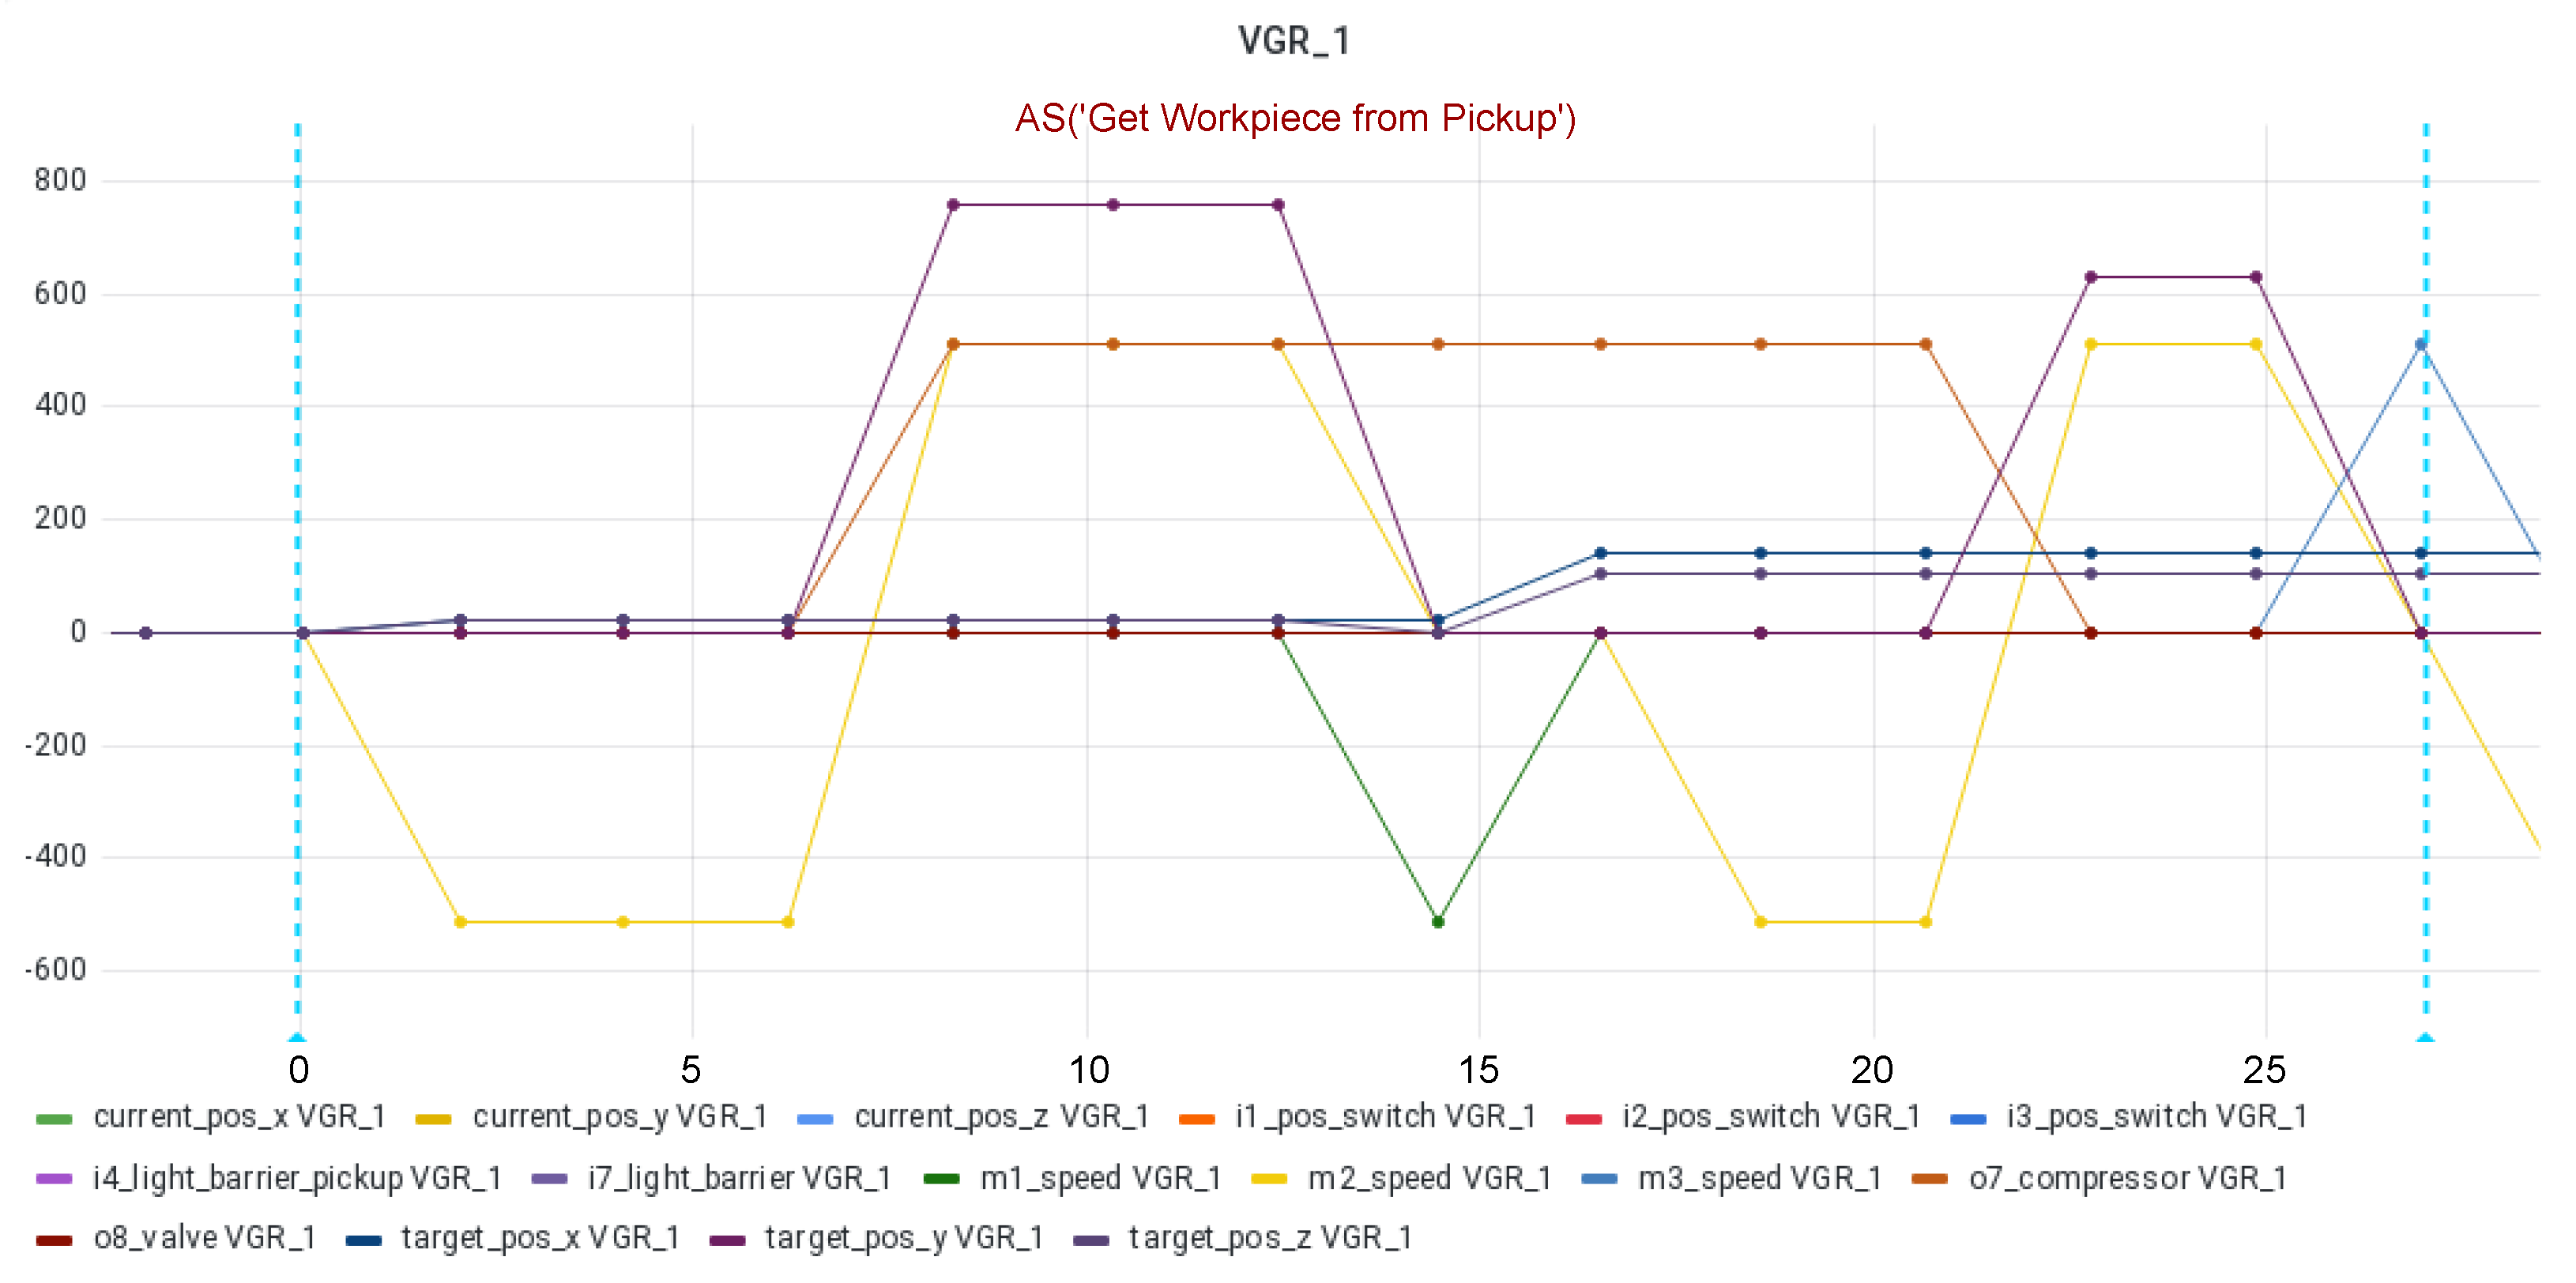
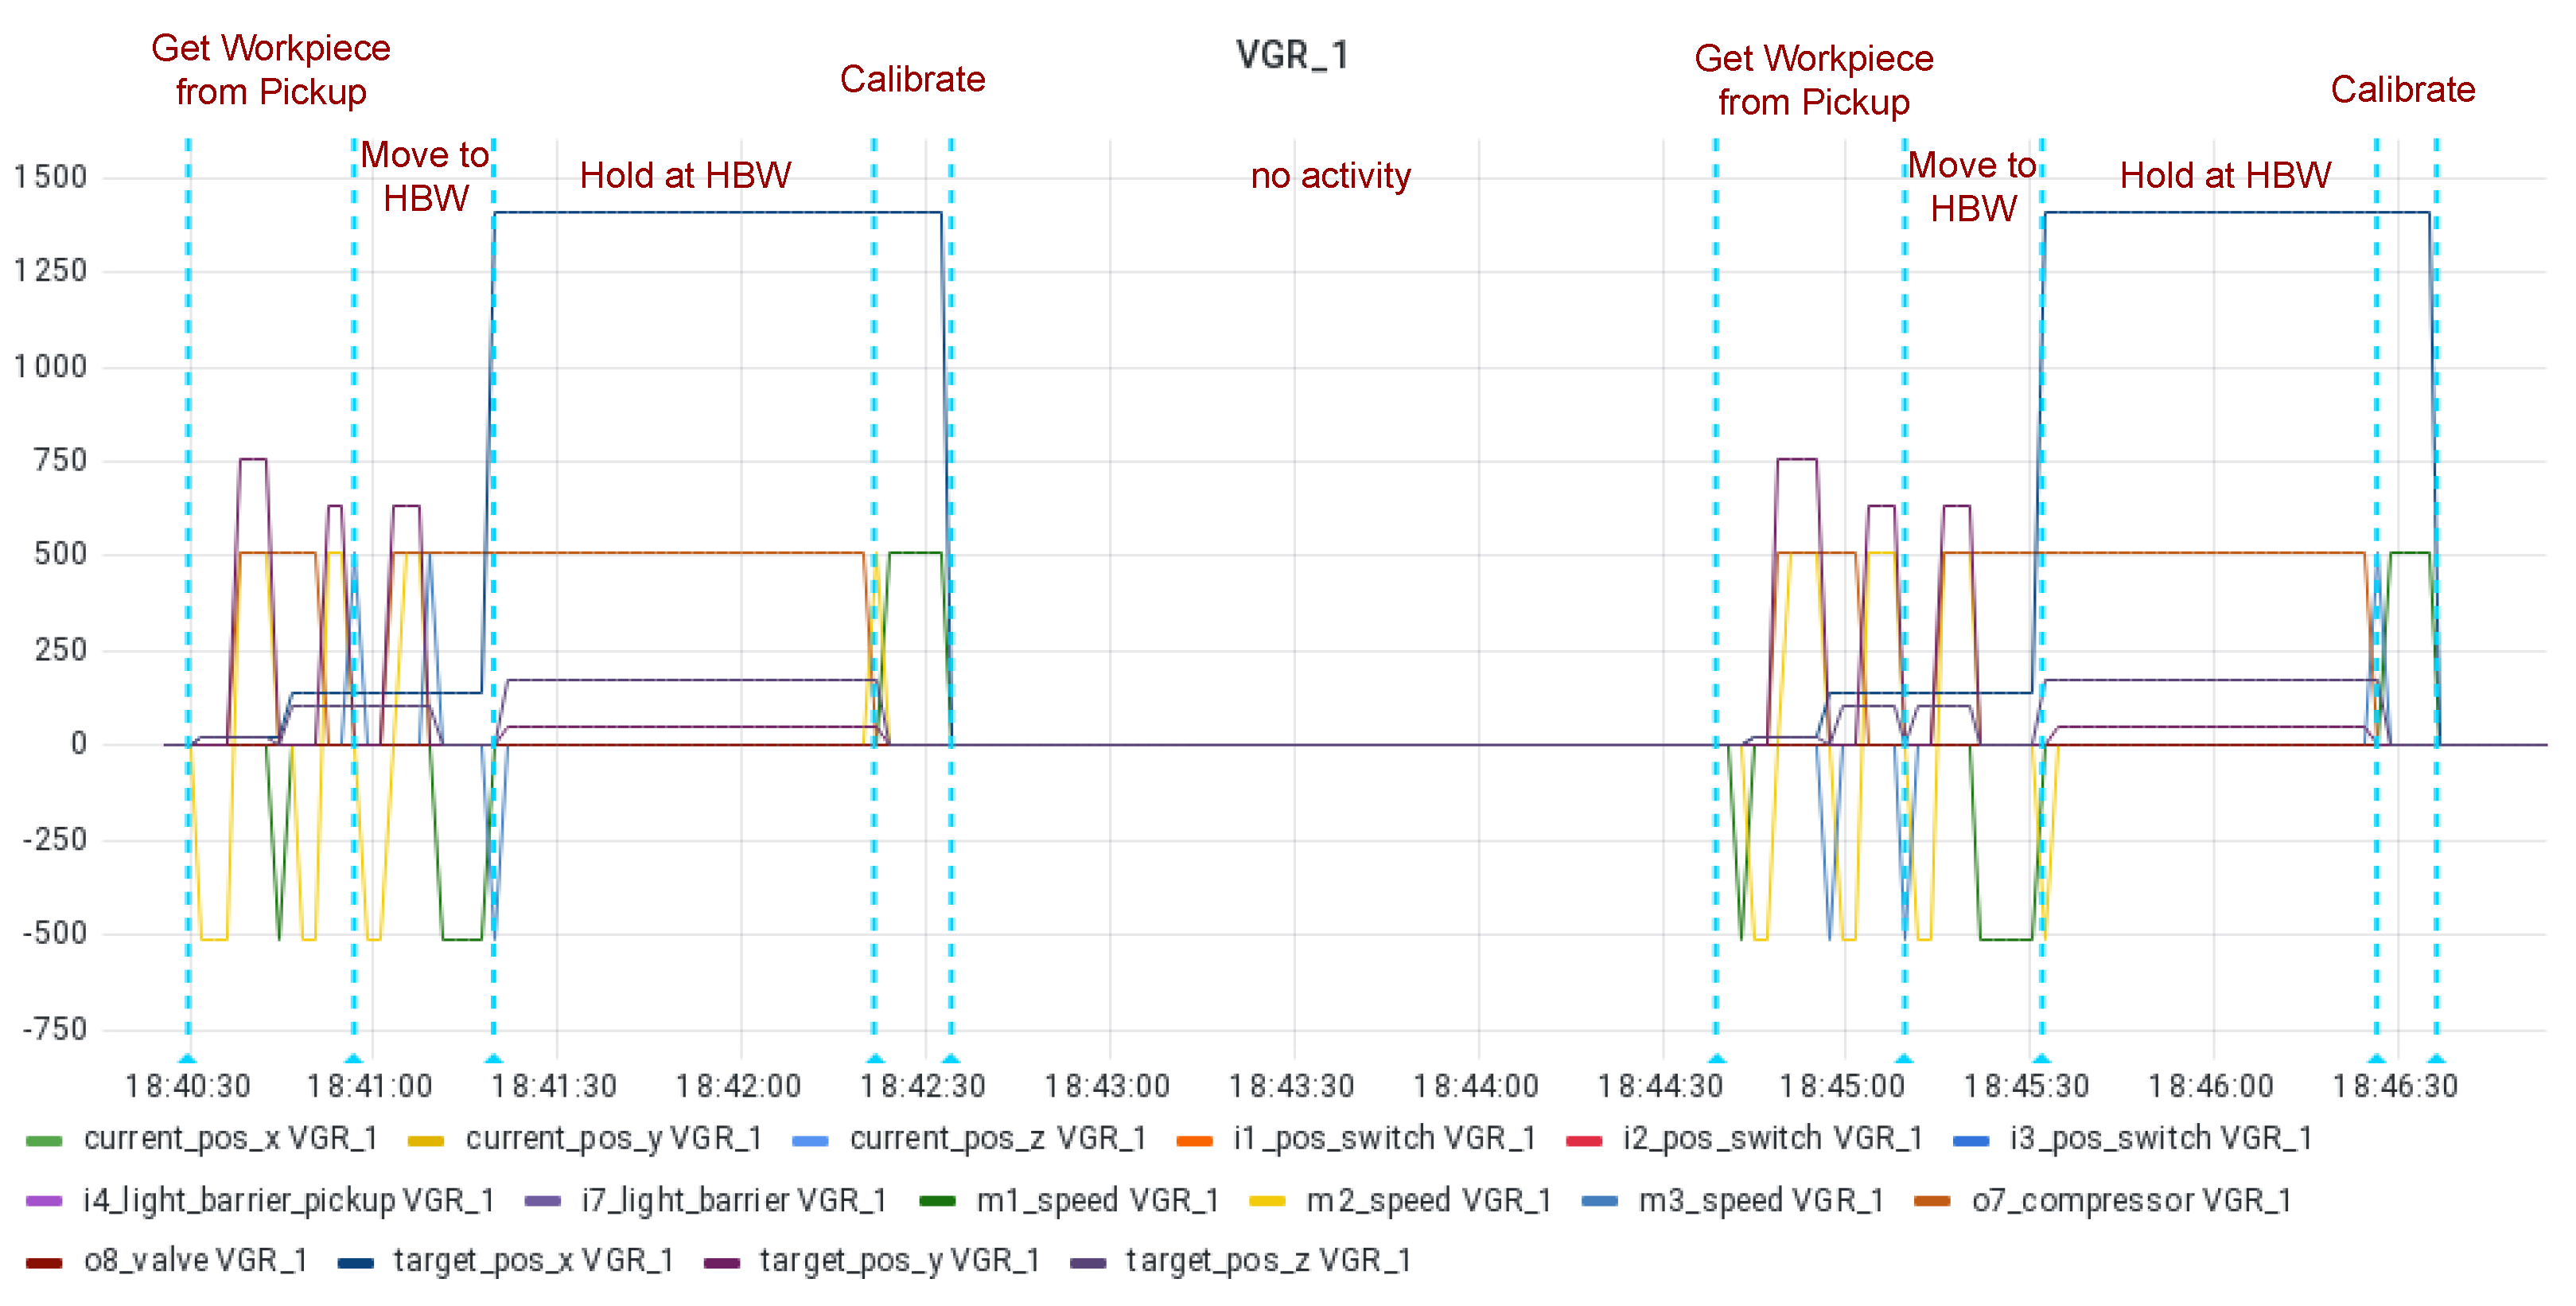
  • VGR_1: The vacuum gripper robot with delivery and pickup station includes the central transportation robot and a station for delivery and pickup of new or produced workpieces. The vacuum gripper emits its current position as triple current_pos_{x,y,z} and its target position as triple target_pos_{x,y,z} of continuous values.
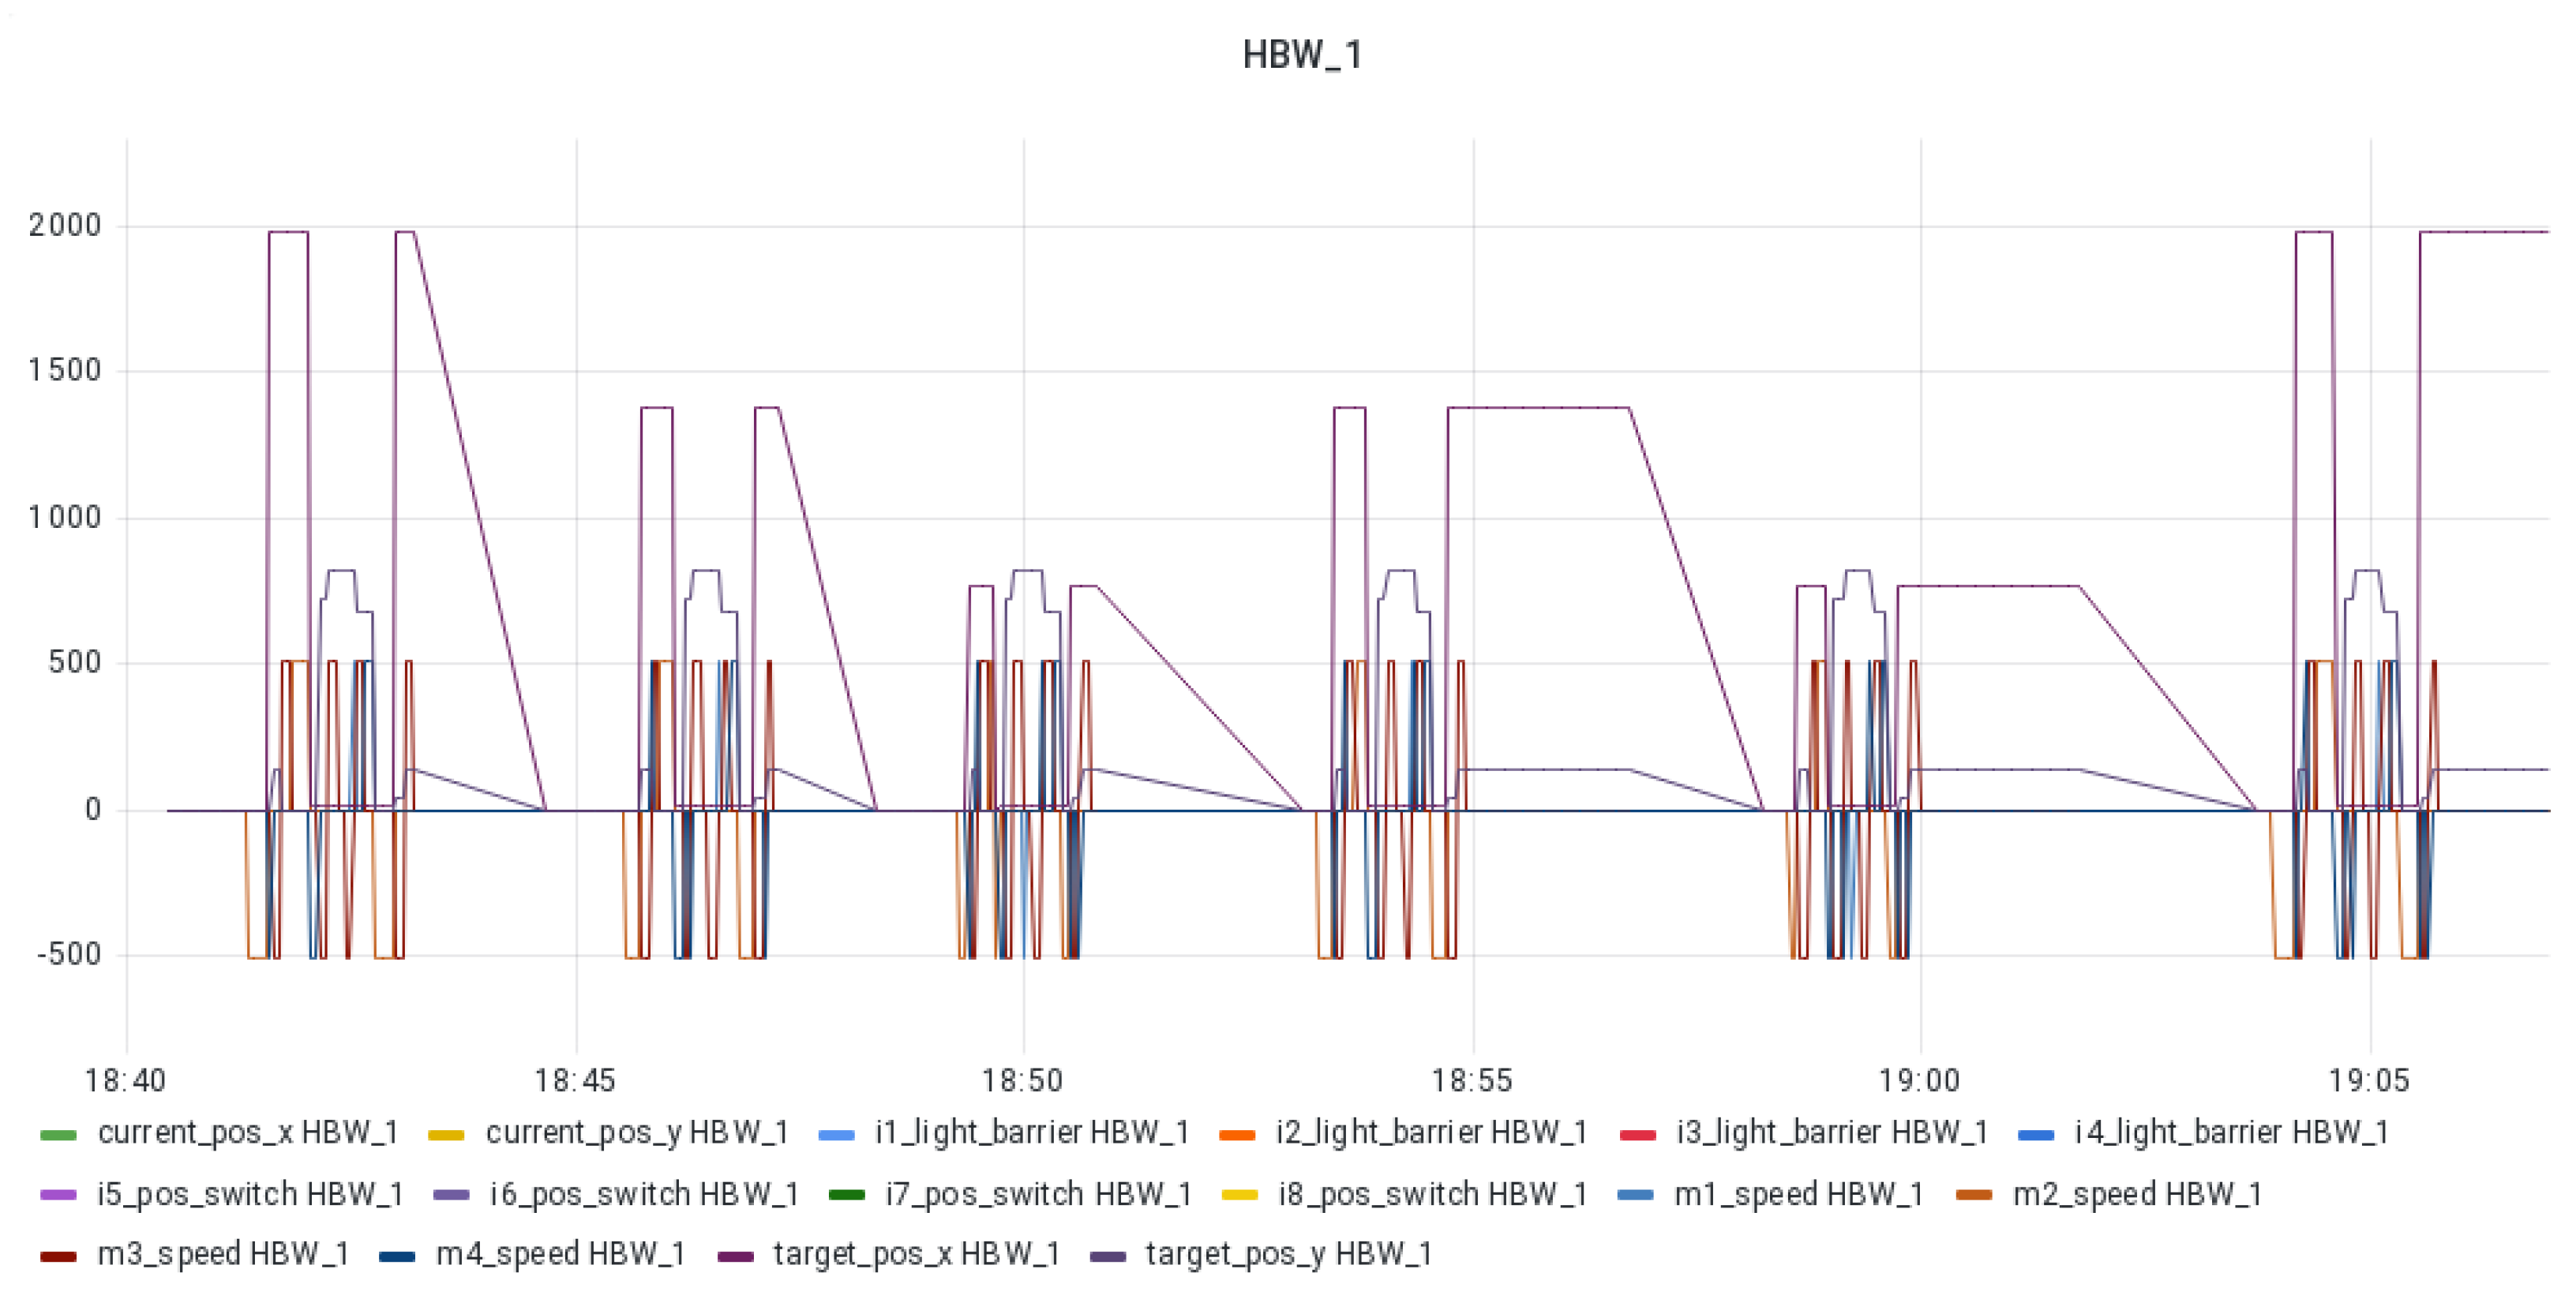
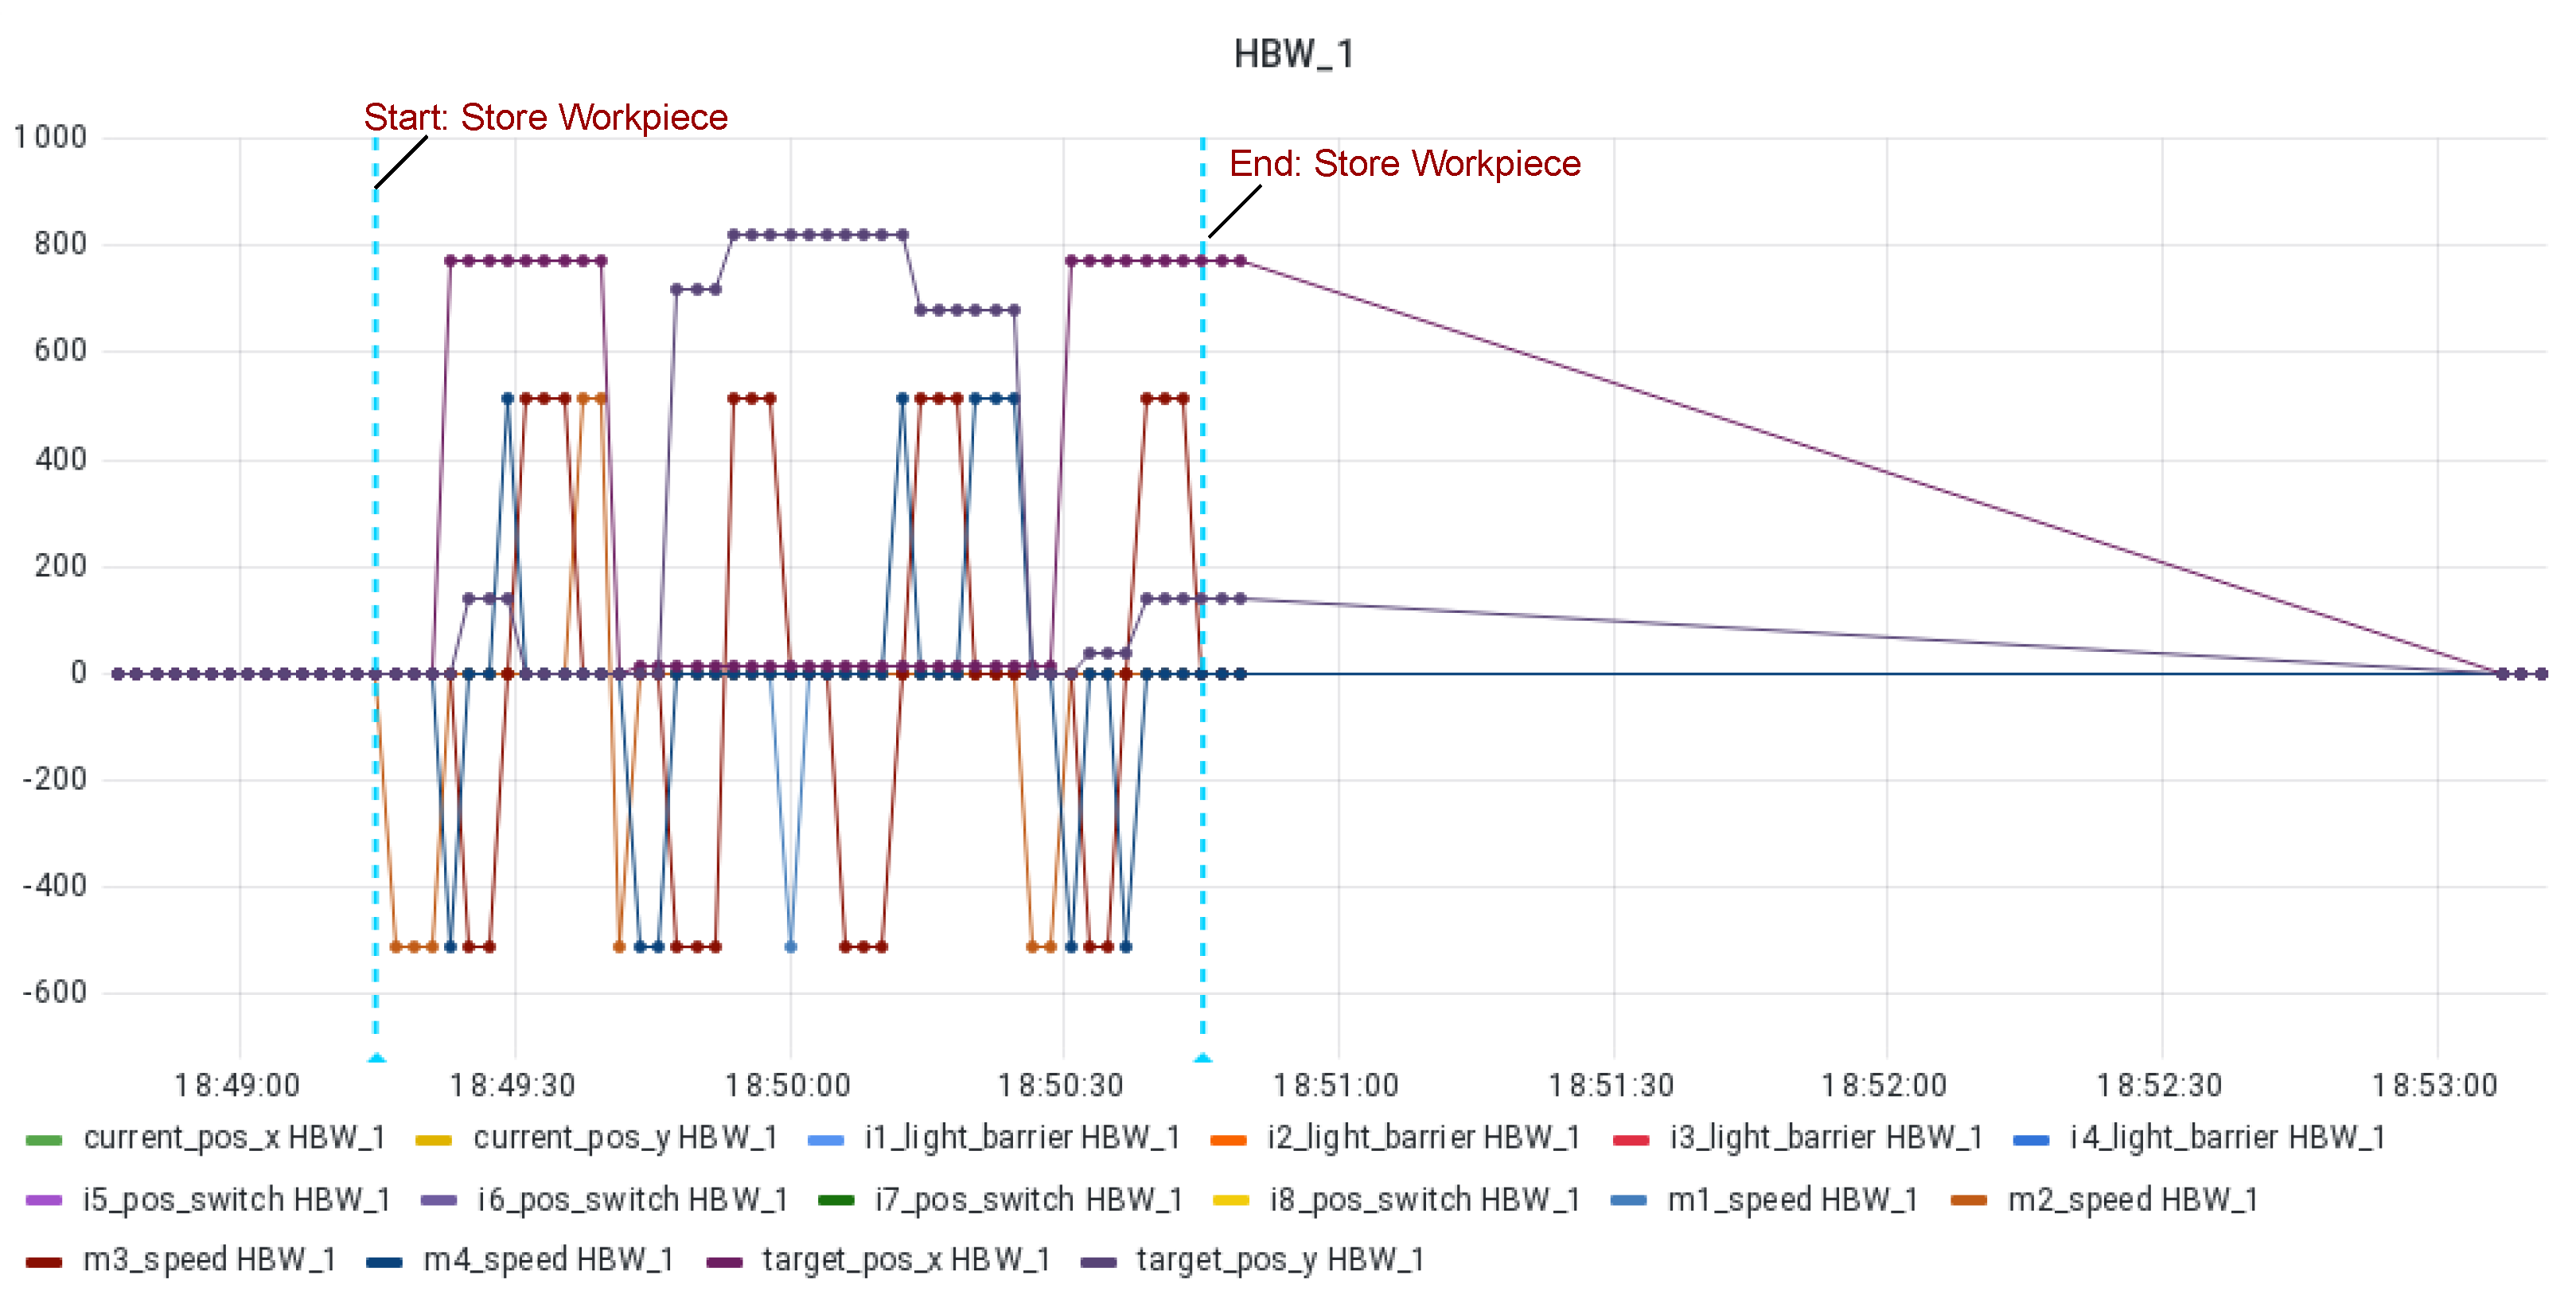
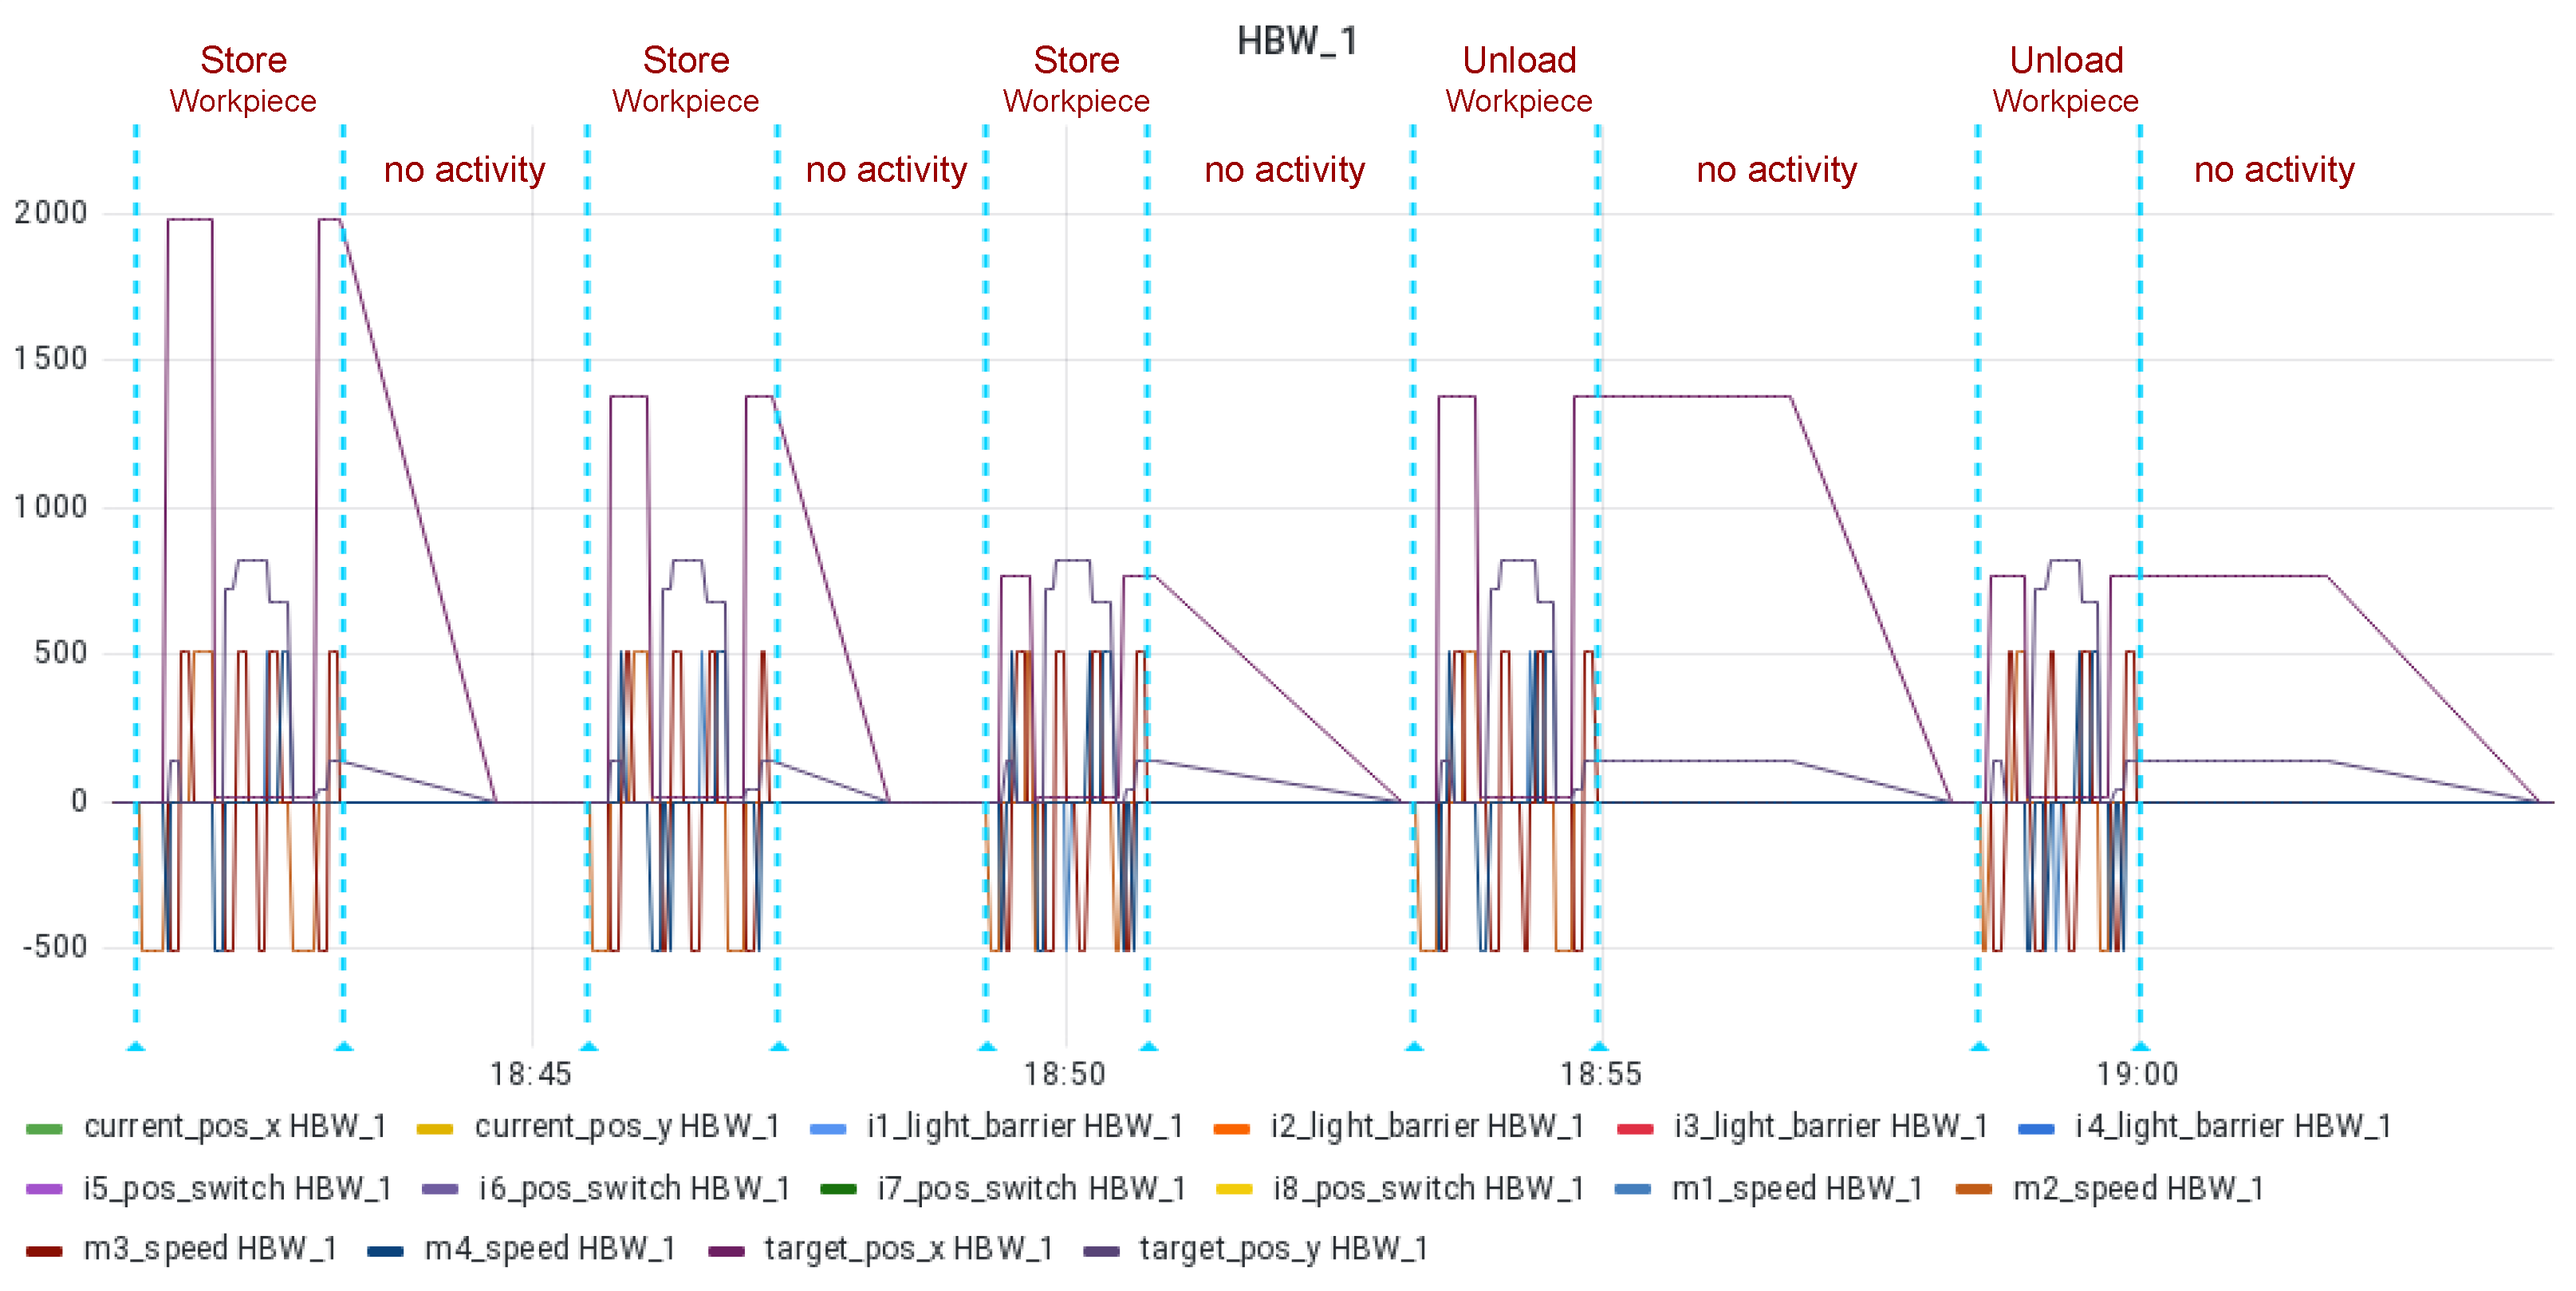
  • HBW_1: The high-bay warehouse allows for storage and retrieval of workpieces in containers in a 3 × 3 matrix. Its loading robot emits its current position as a tuple current_pos_{x,y} and its target position as a tuple target_pos_{x,y} of continuous values.
  • OV_1: The oven allows for simulating the baking of a workpiece. It features a door that can be opened and closed, and a sled to move the workpiece in and out of the oven.
  • MM_1: The milling machine allows for simulating the milling of a workpiece. It features a turntable to move the workpiece inside and outside of the milling area.
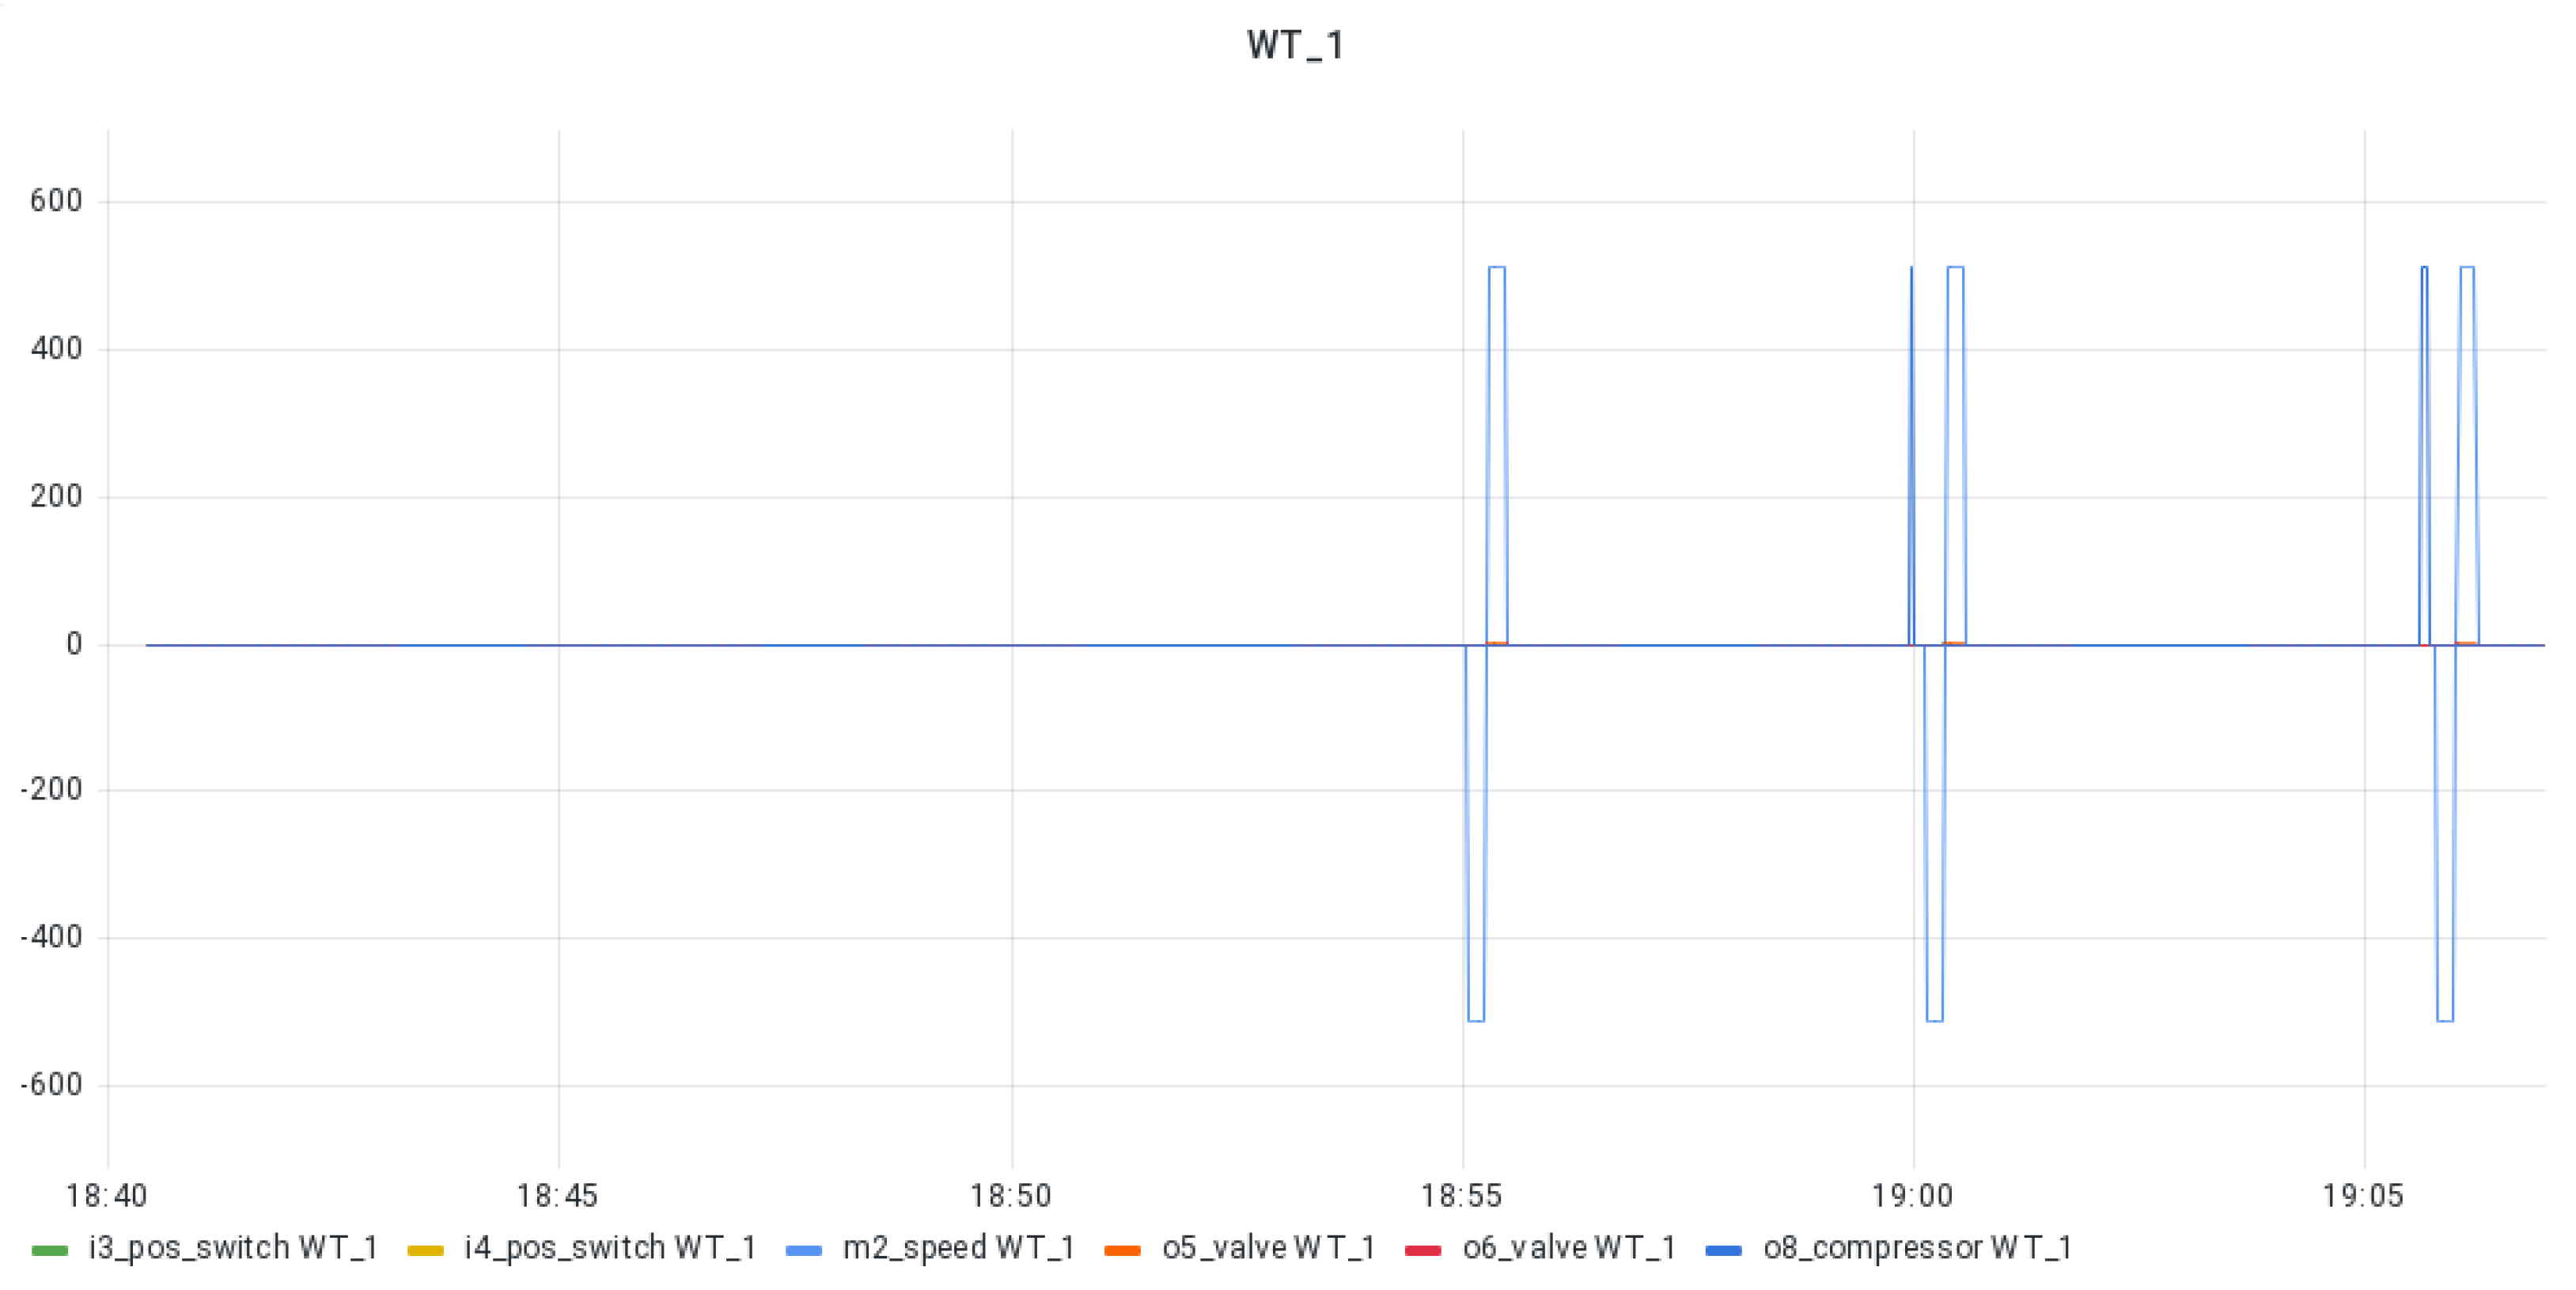
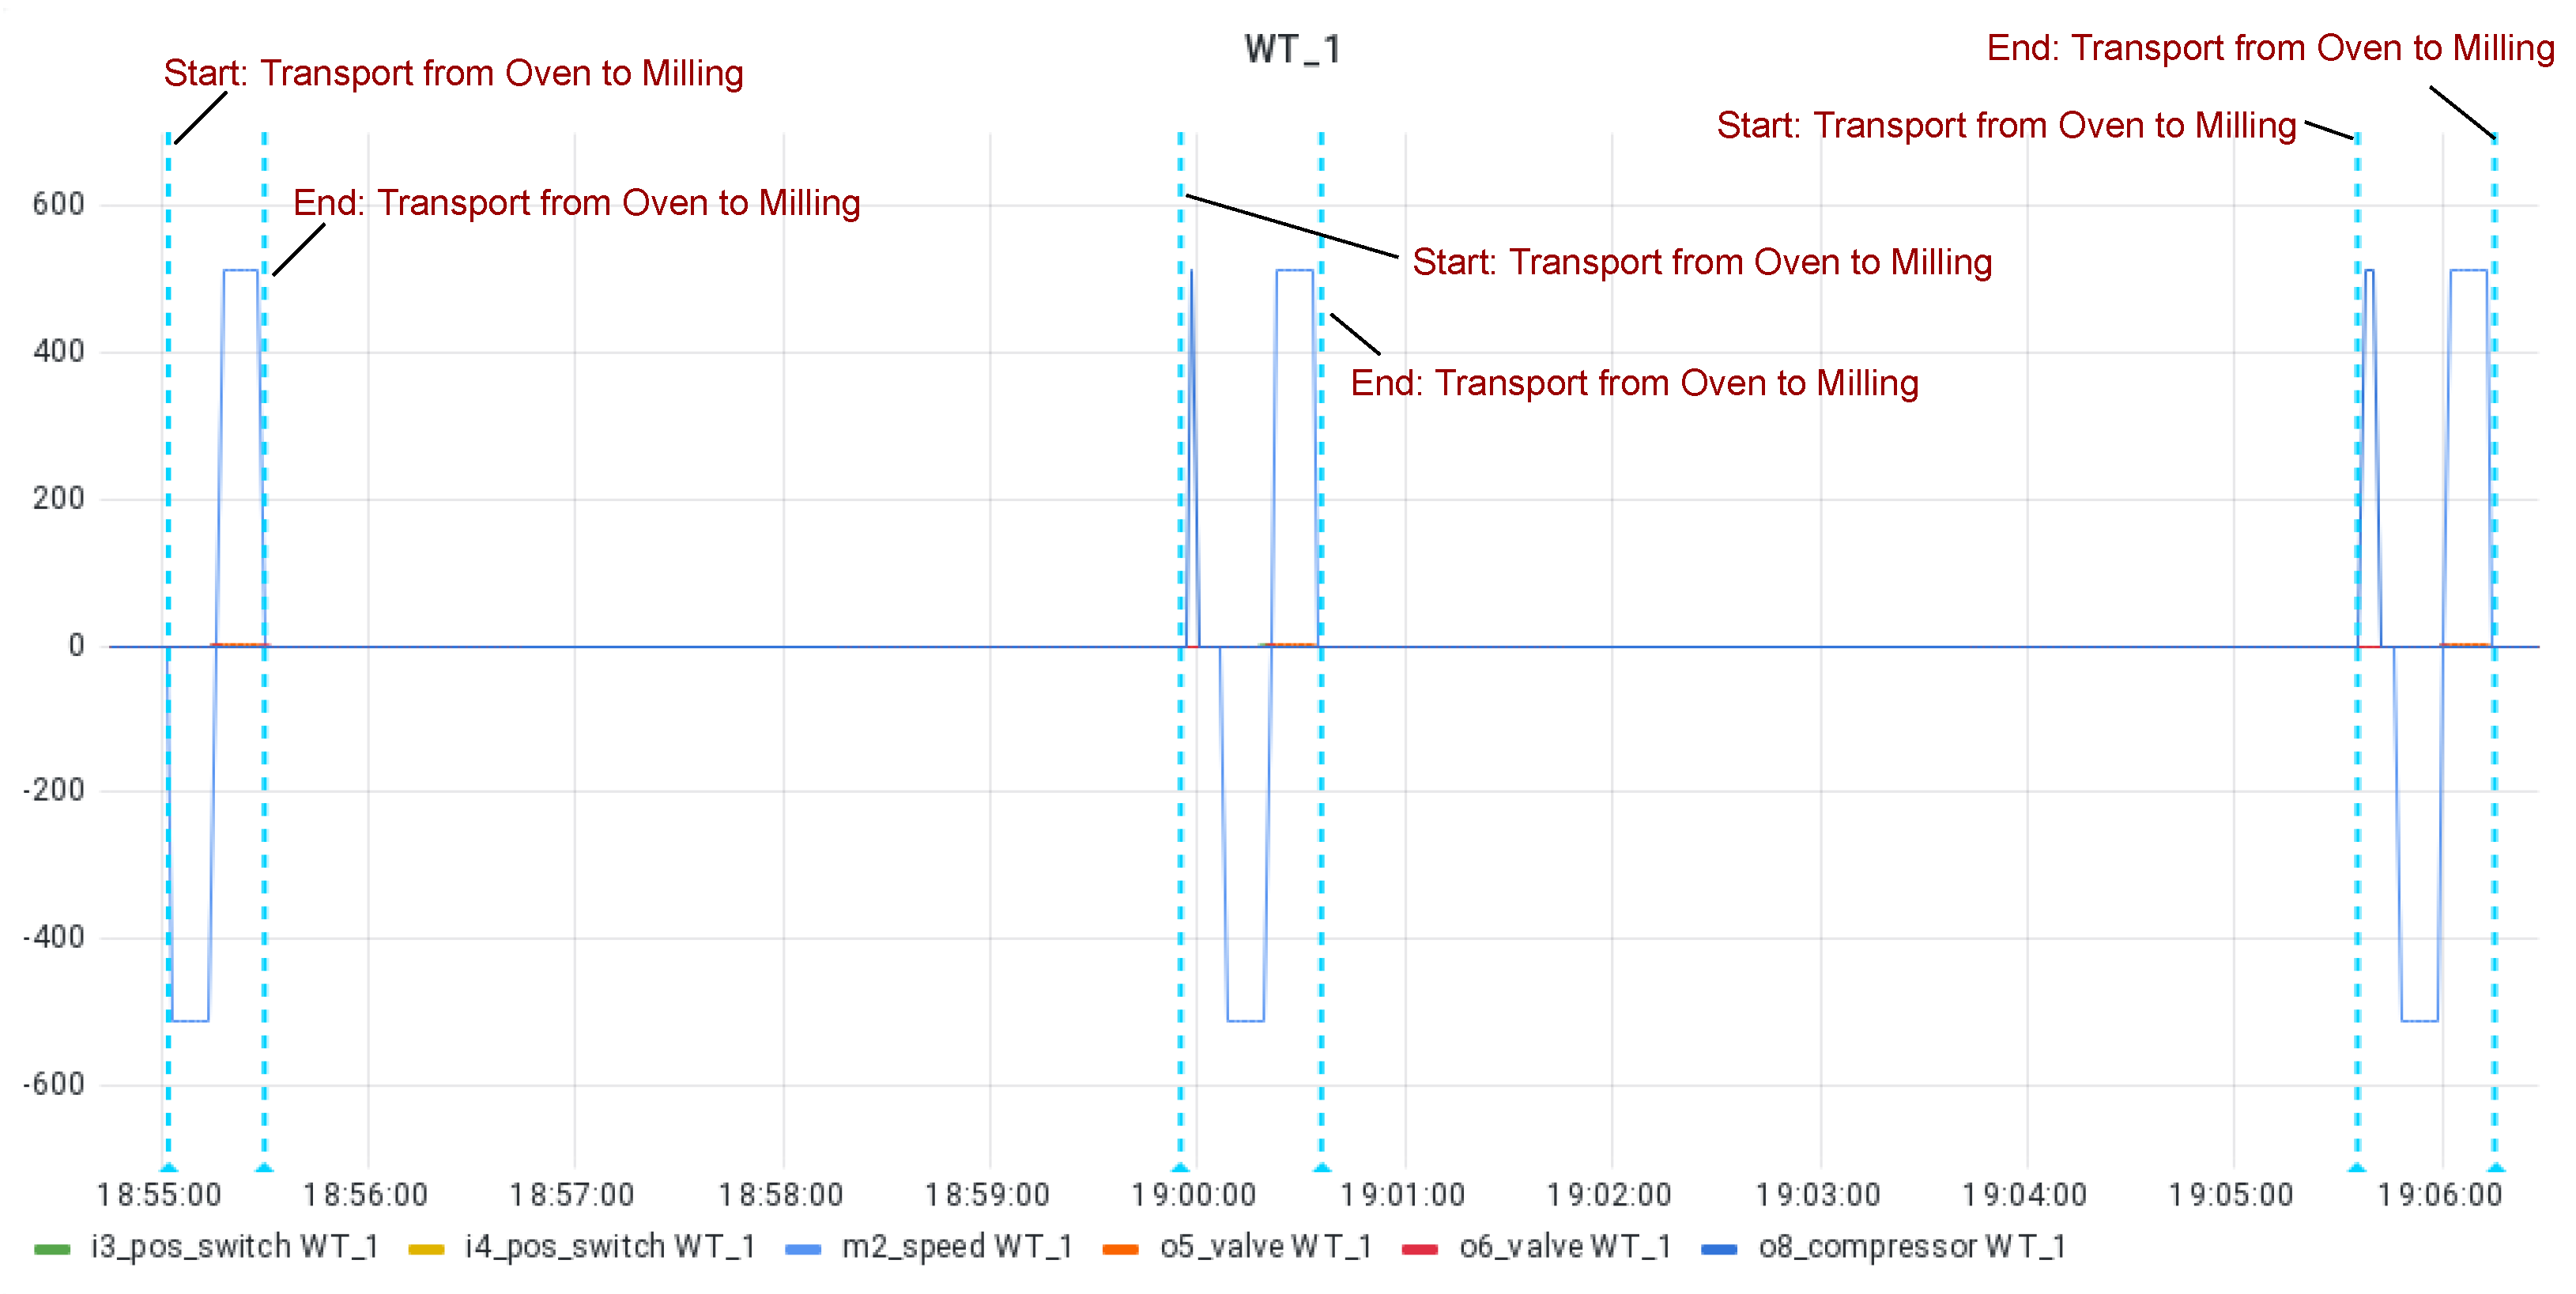
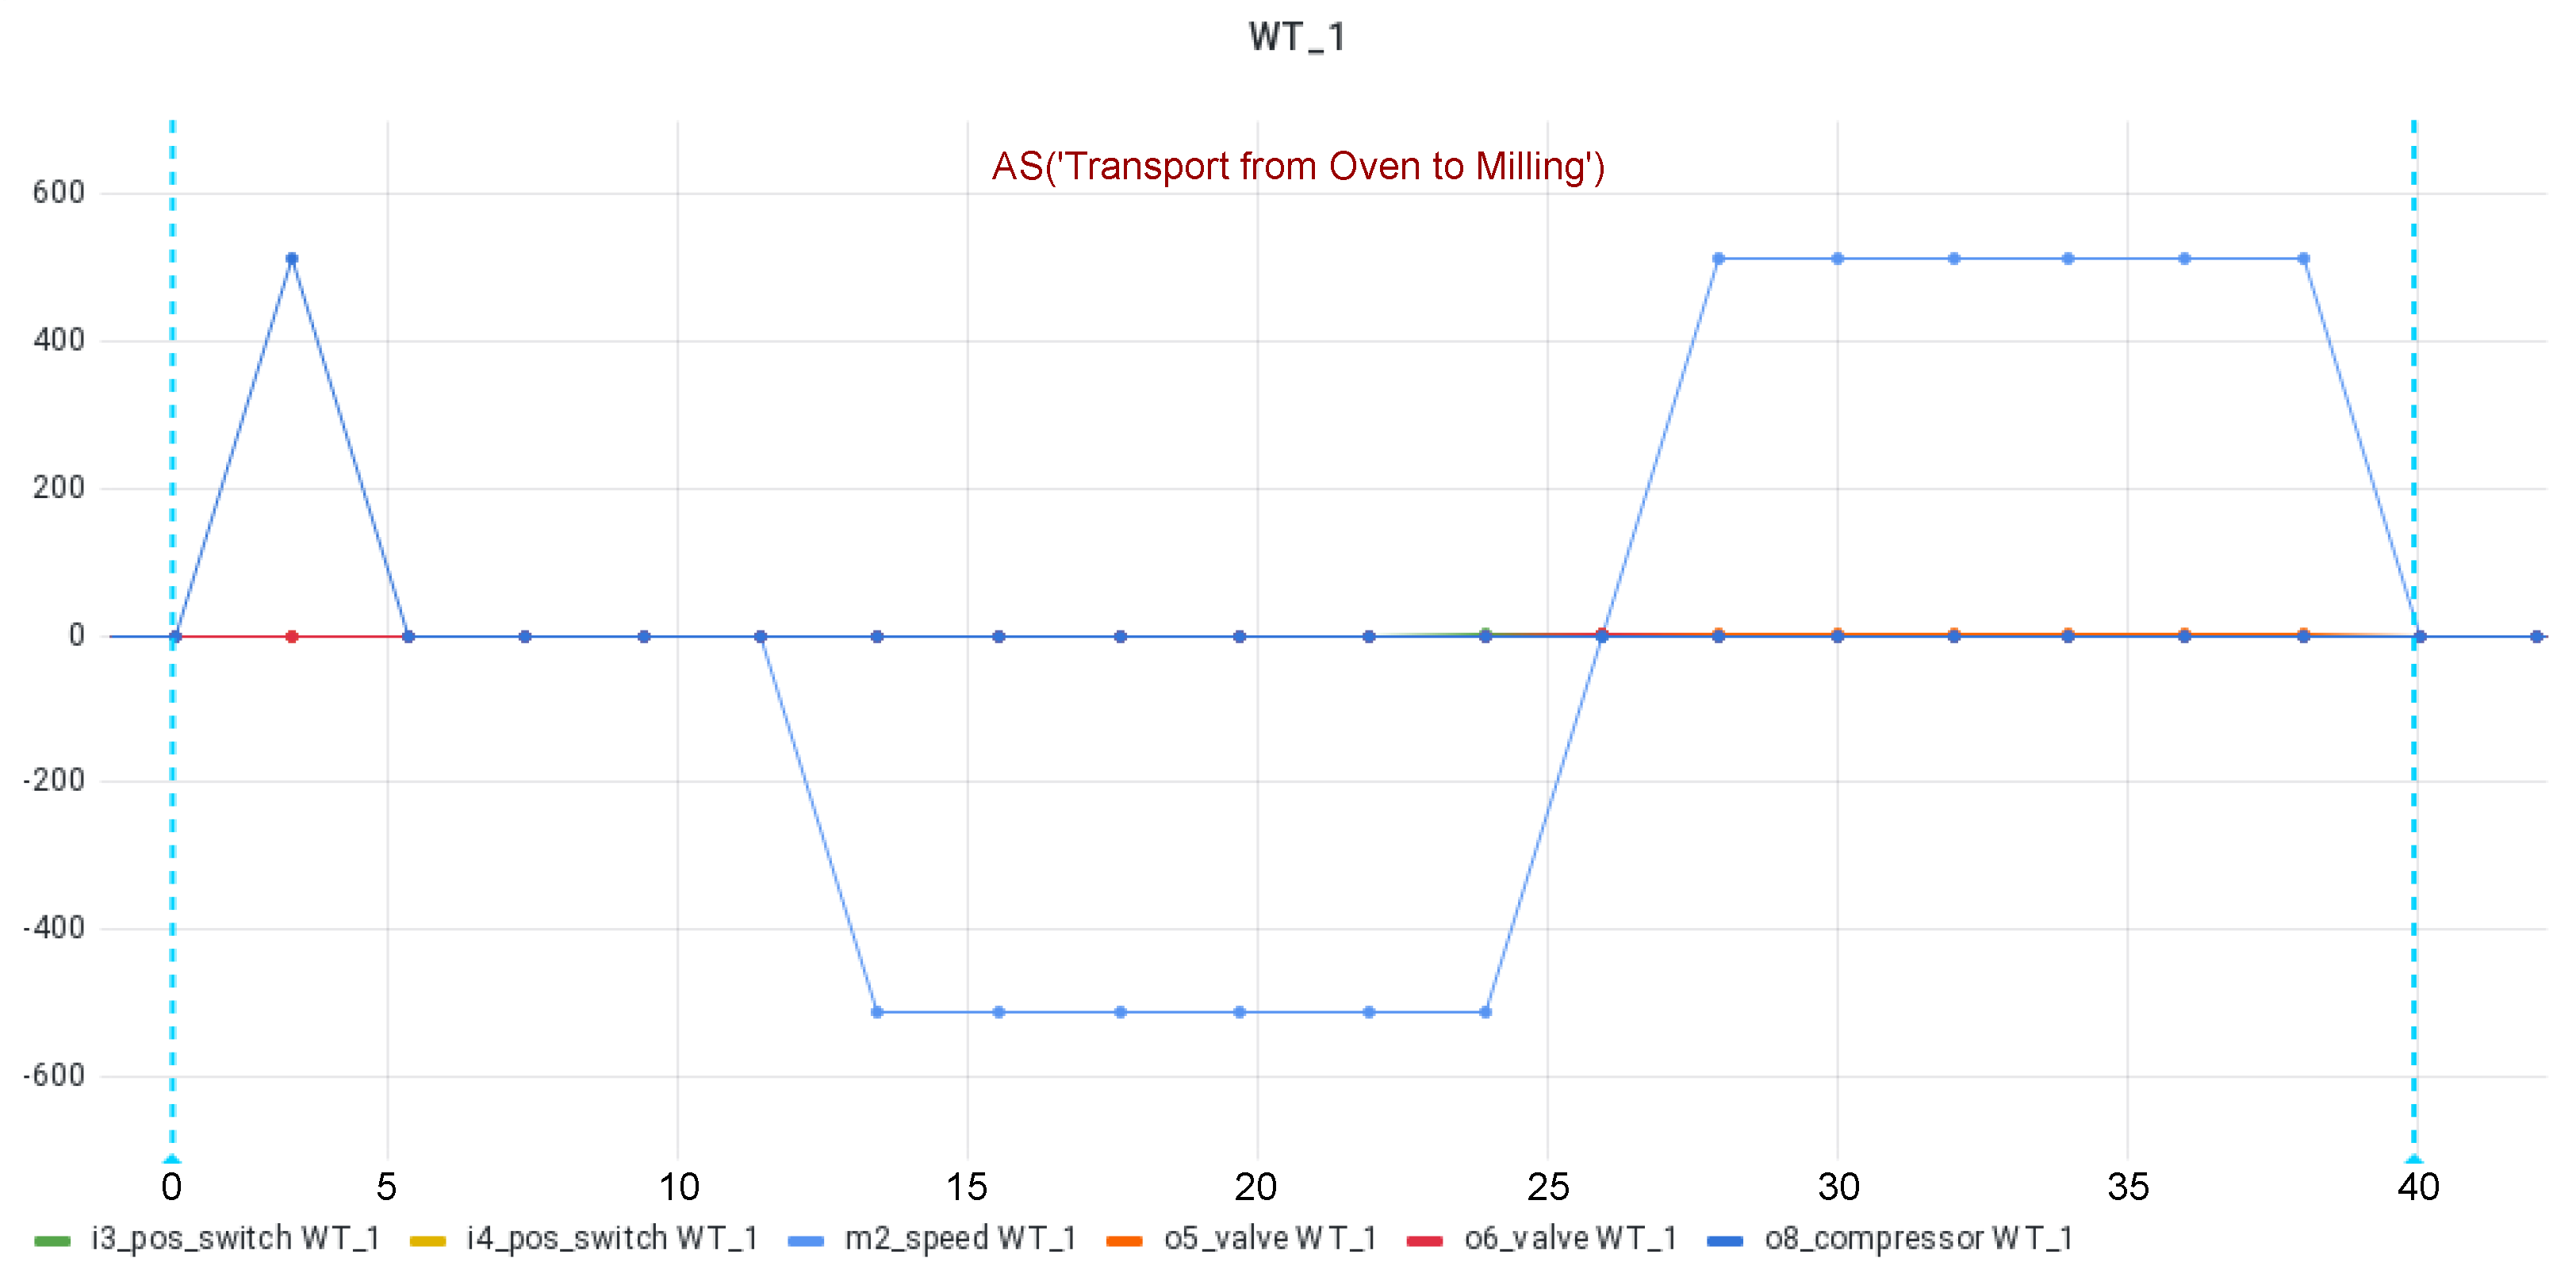
  • WT_1: The workstation transport component features a vacuum gripper to transport a workpiece between the oven and milling machine along a slide.
  • SM_1: The sorting machine uses a color sensor to determine the color of a workpiece. It then uses compressors to push the workpiece into one of three ejection bays according to the color.
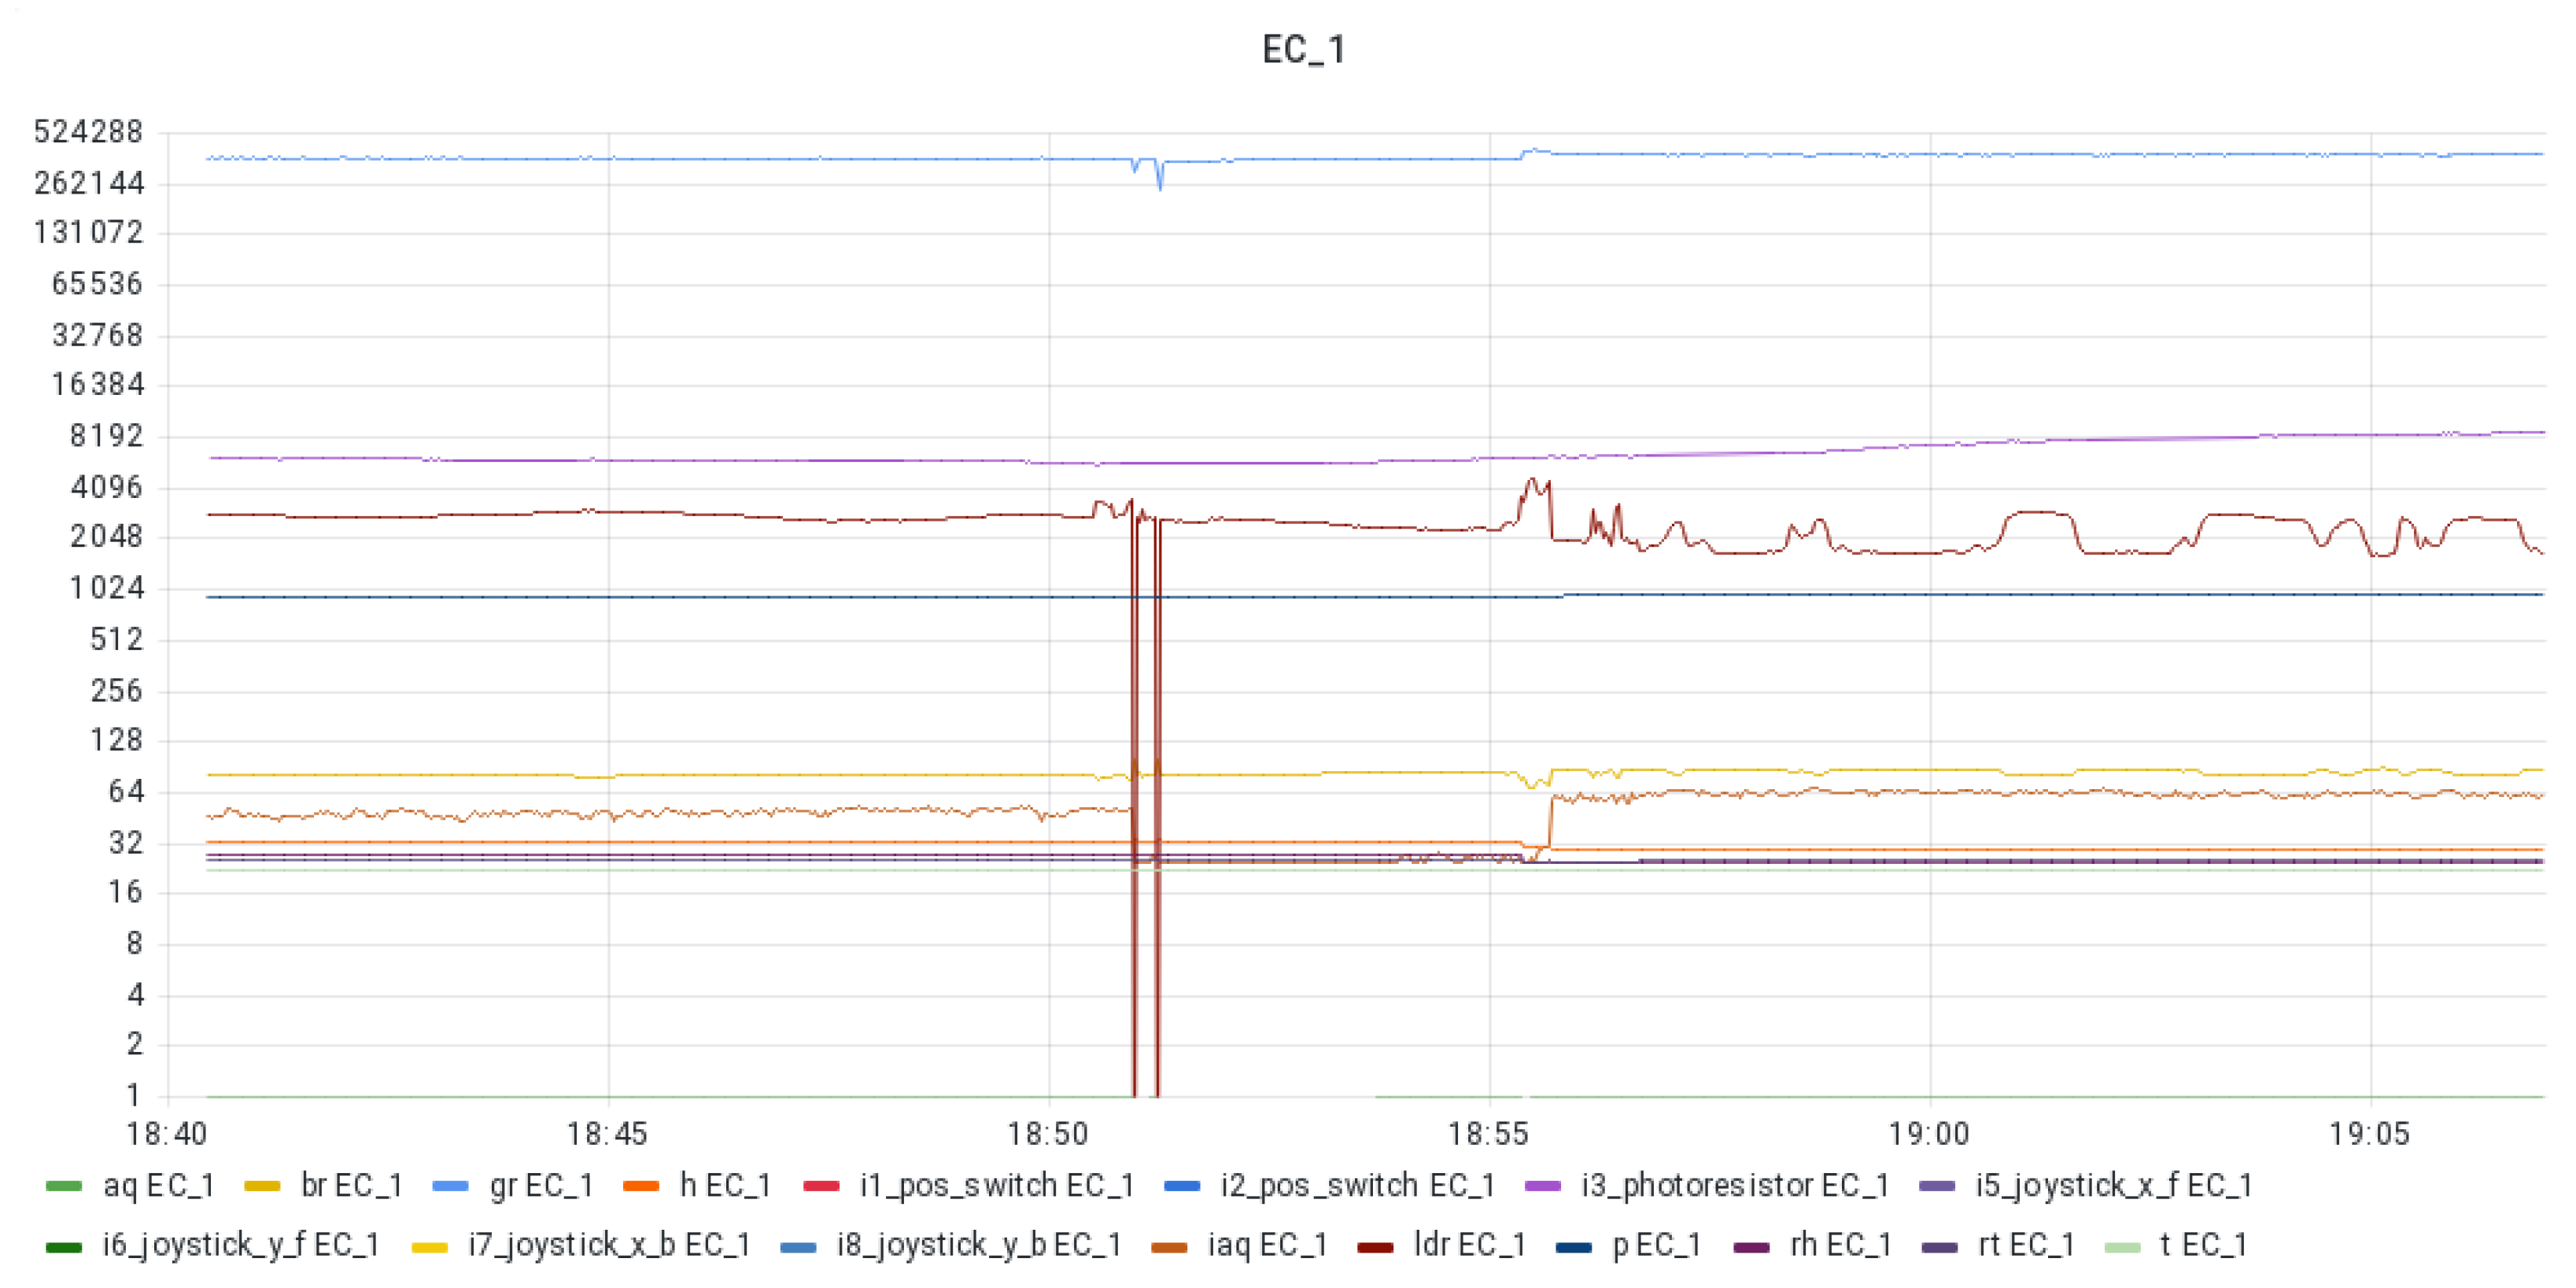
  • EC_1: The environment and camera station features an RGB camera and a comprehensive environment sensor. The environment sensor provides continuous measurements of air quality (aq), gas resistance (gr), humidity (h), indexed air quality (iaq), relative humidity (rh), pressure (p), temperature (t), relative temperature (rt), brightness (b), and light-dependent resistance (ldr). This station also includes two joysticks for calibration of the smart factory.
The design of the physical smart factory simulation model and the separation of CPS components according to the descriptions above are based on the configuration provided in [22]. All sensors and actuators of one CPS component are controlled by one embedded controller, which serves as a physical (bounded) context for one CPS component.

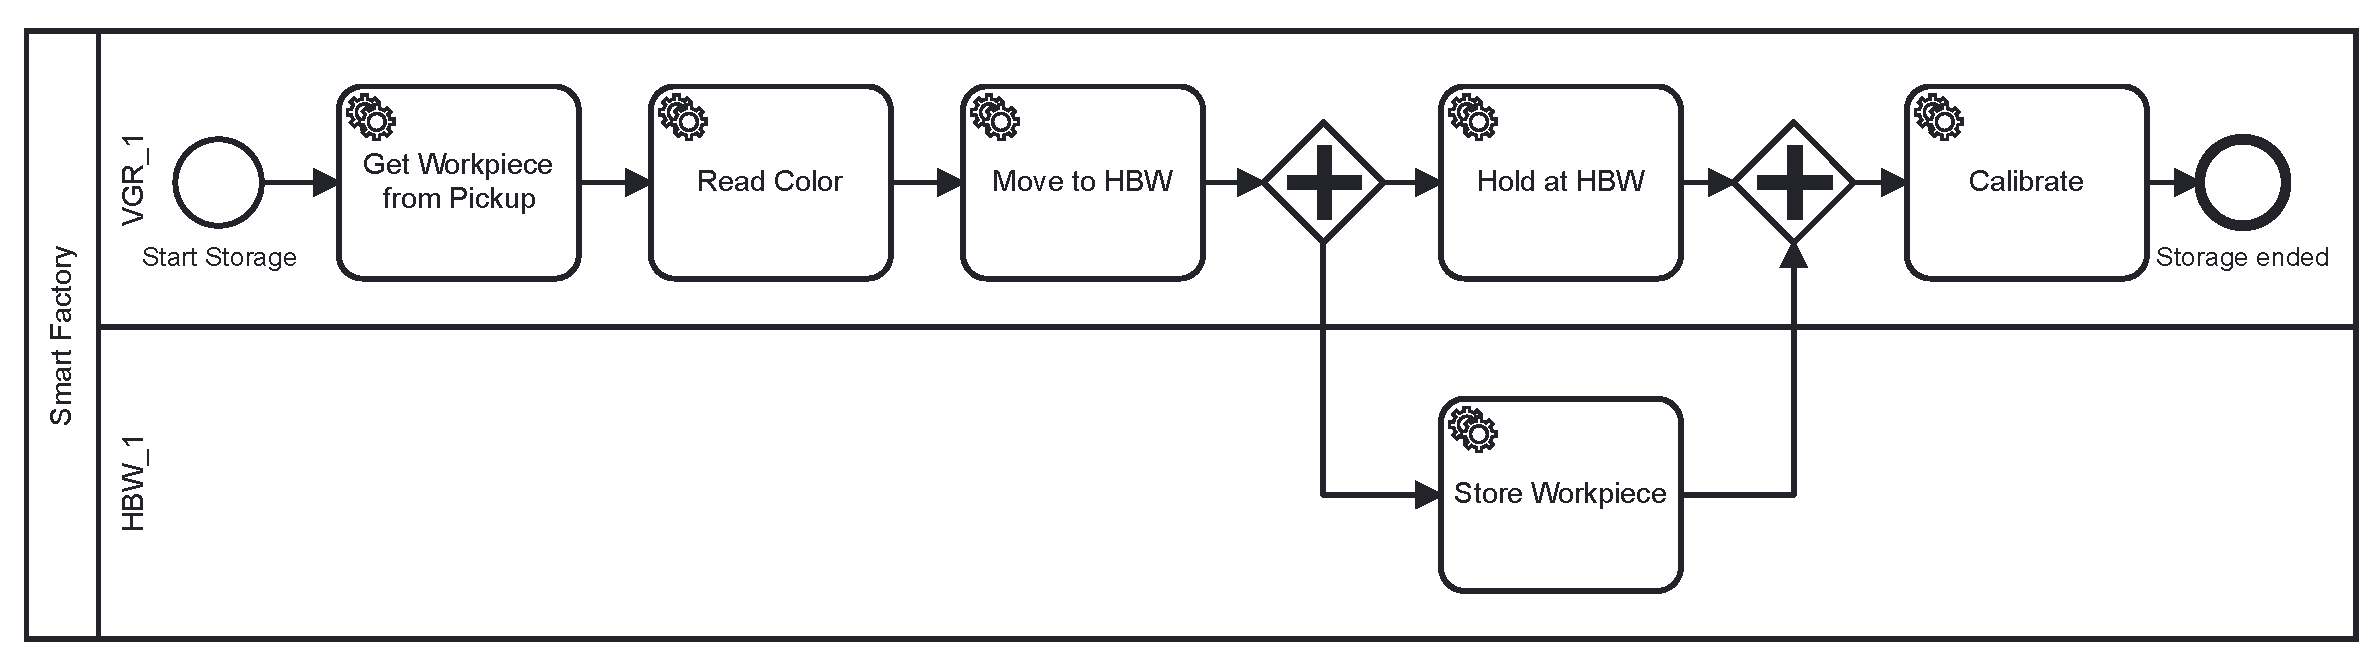
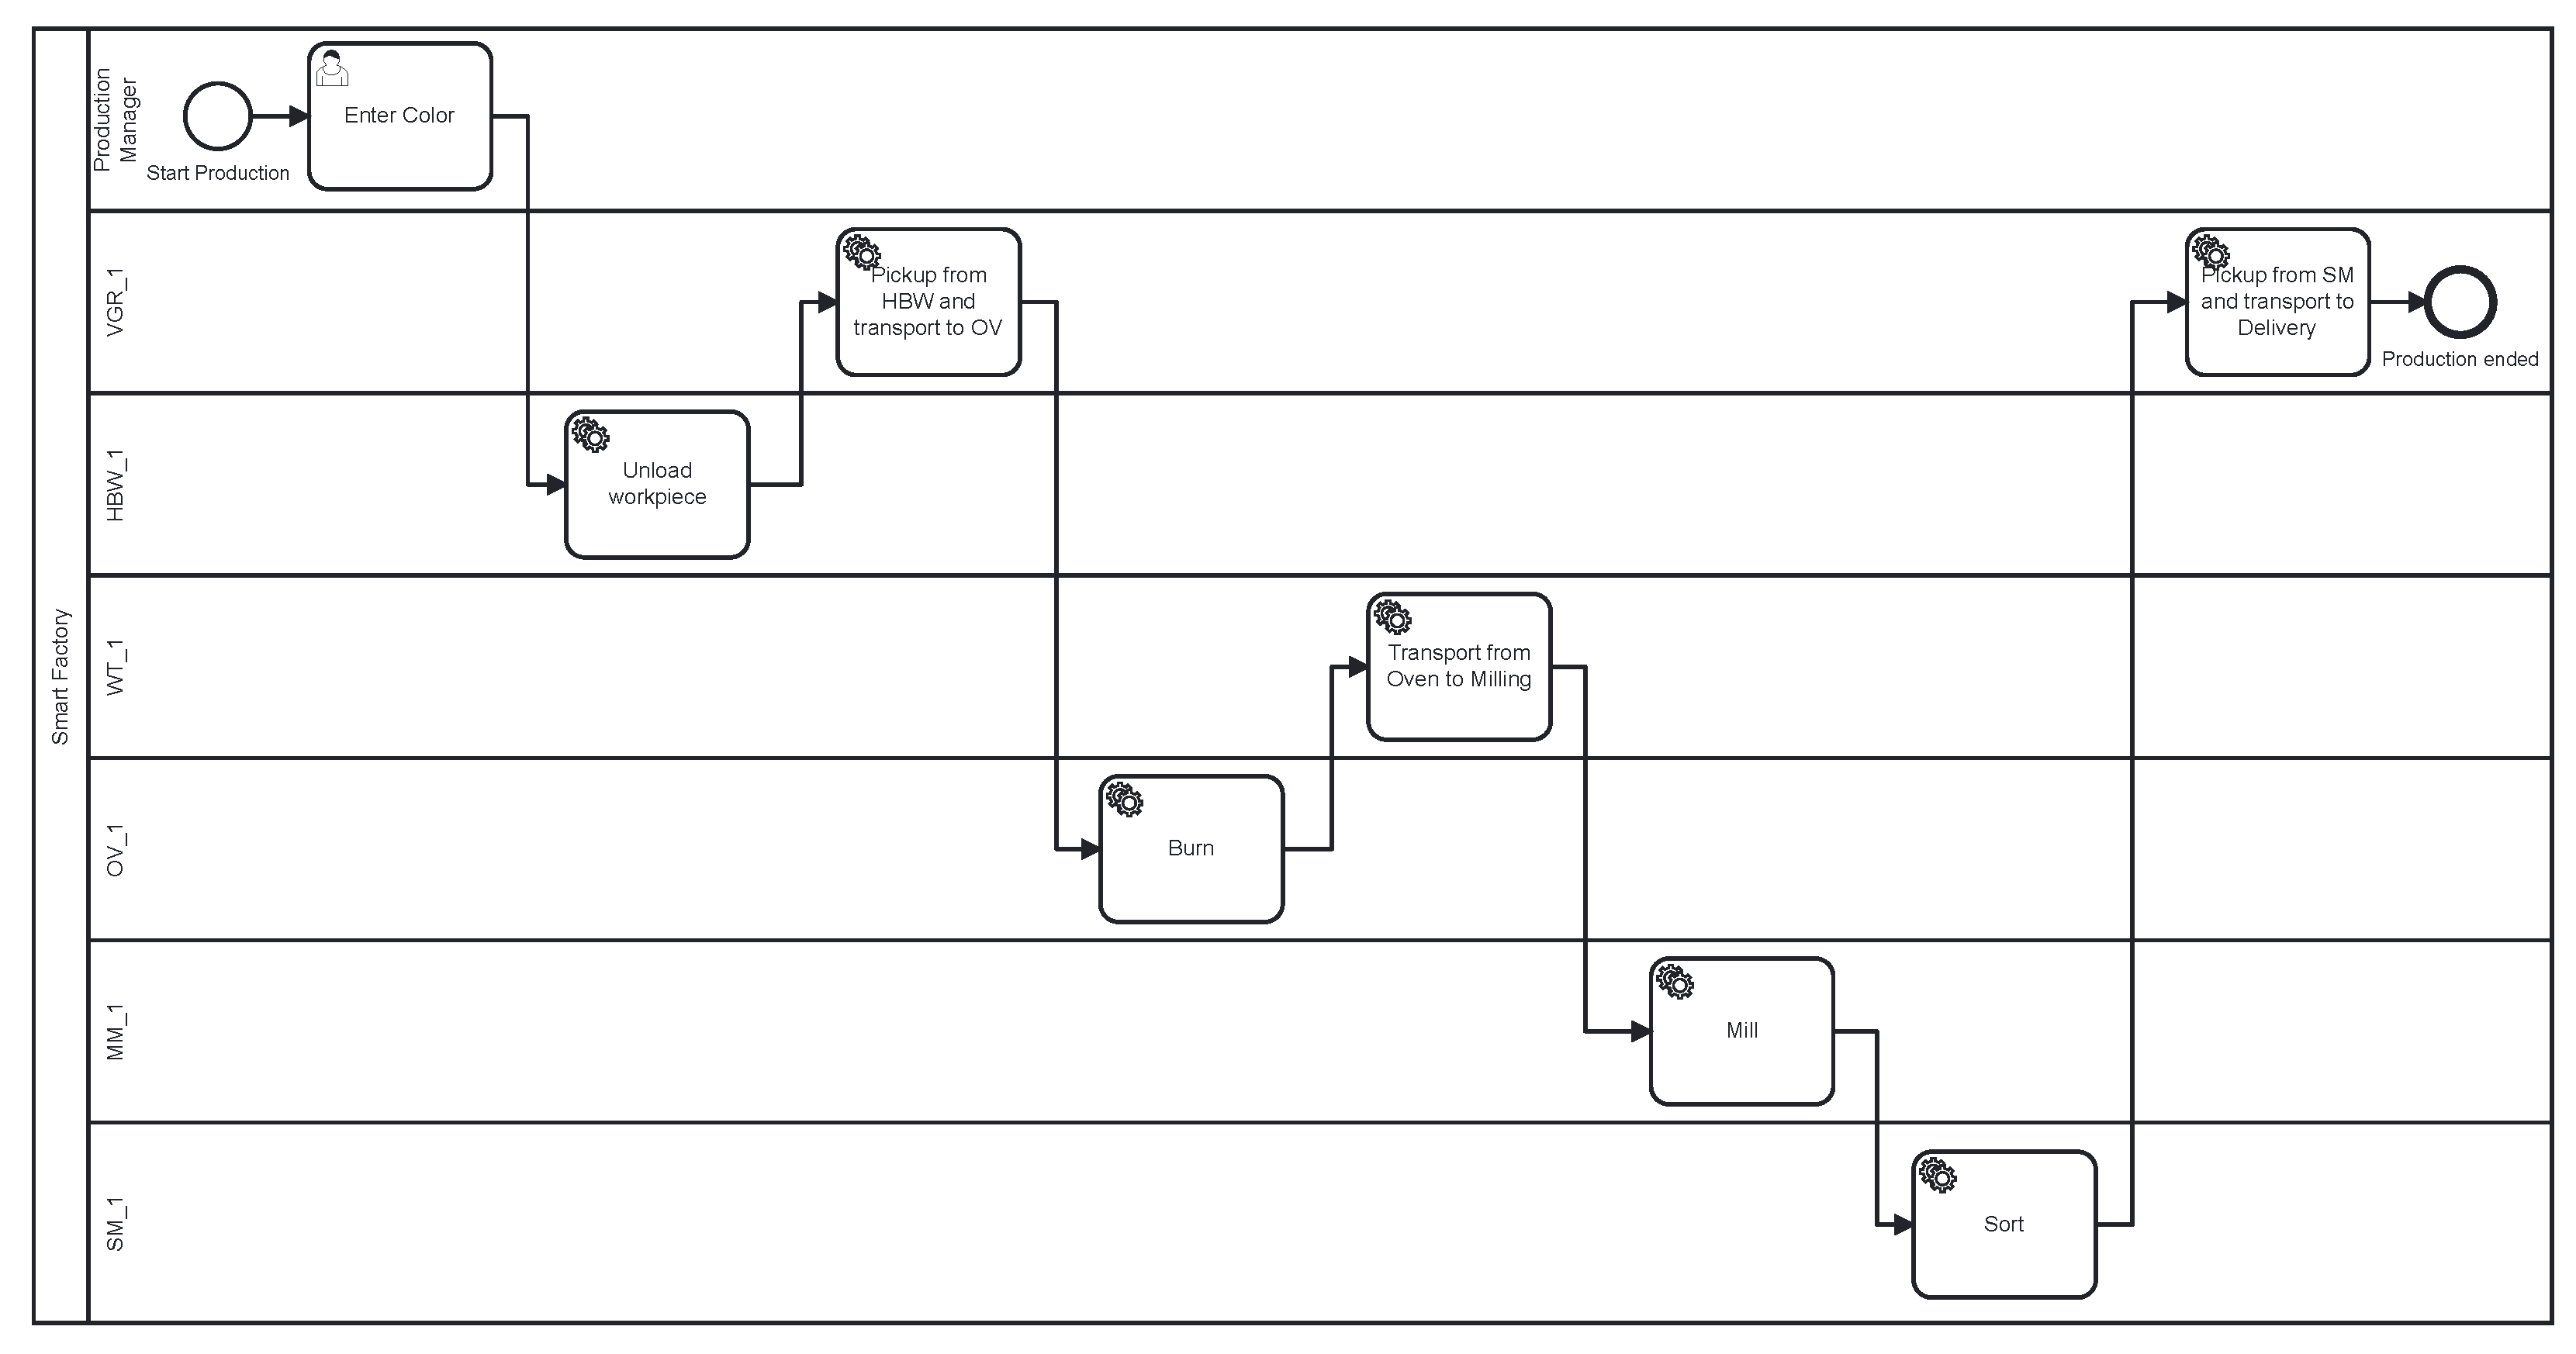
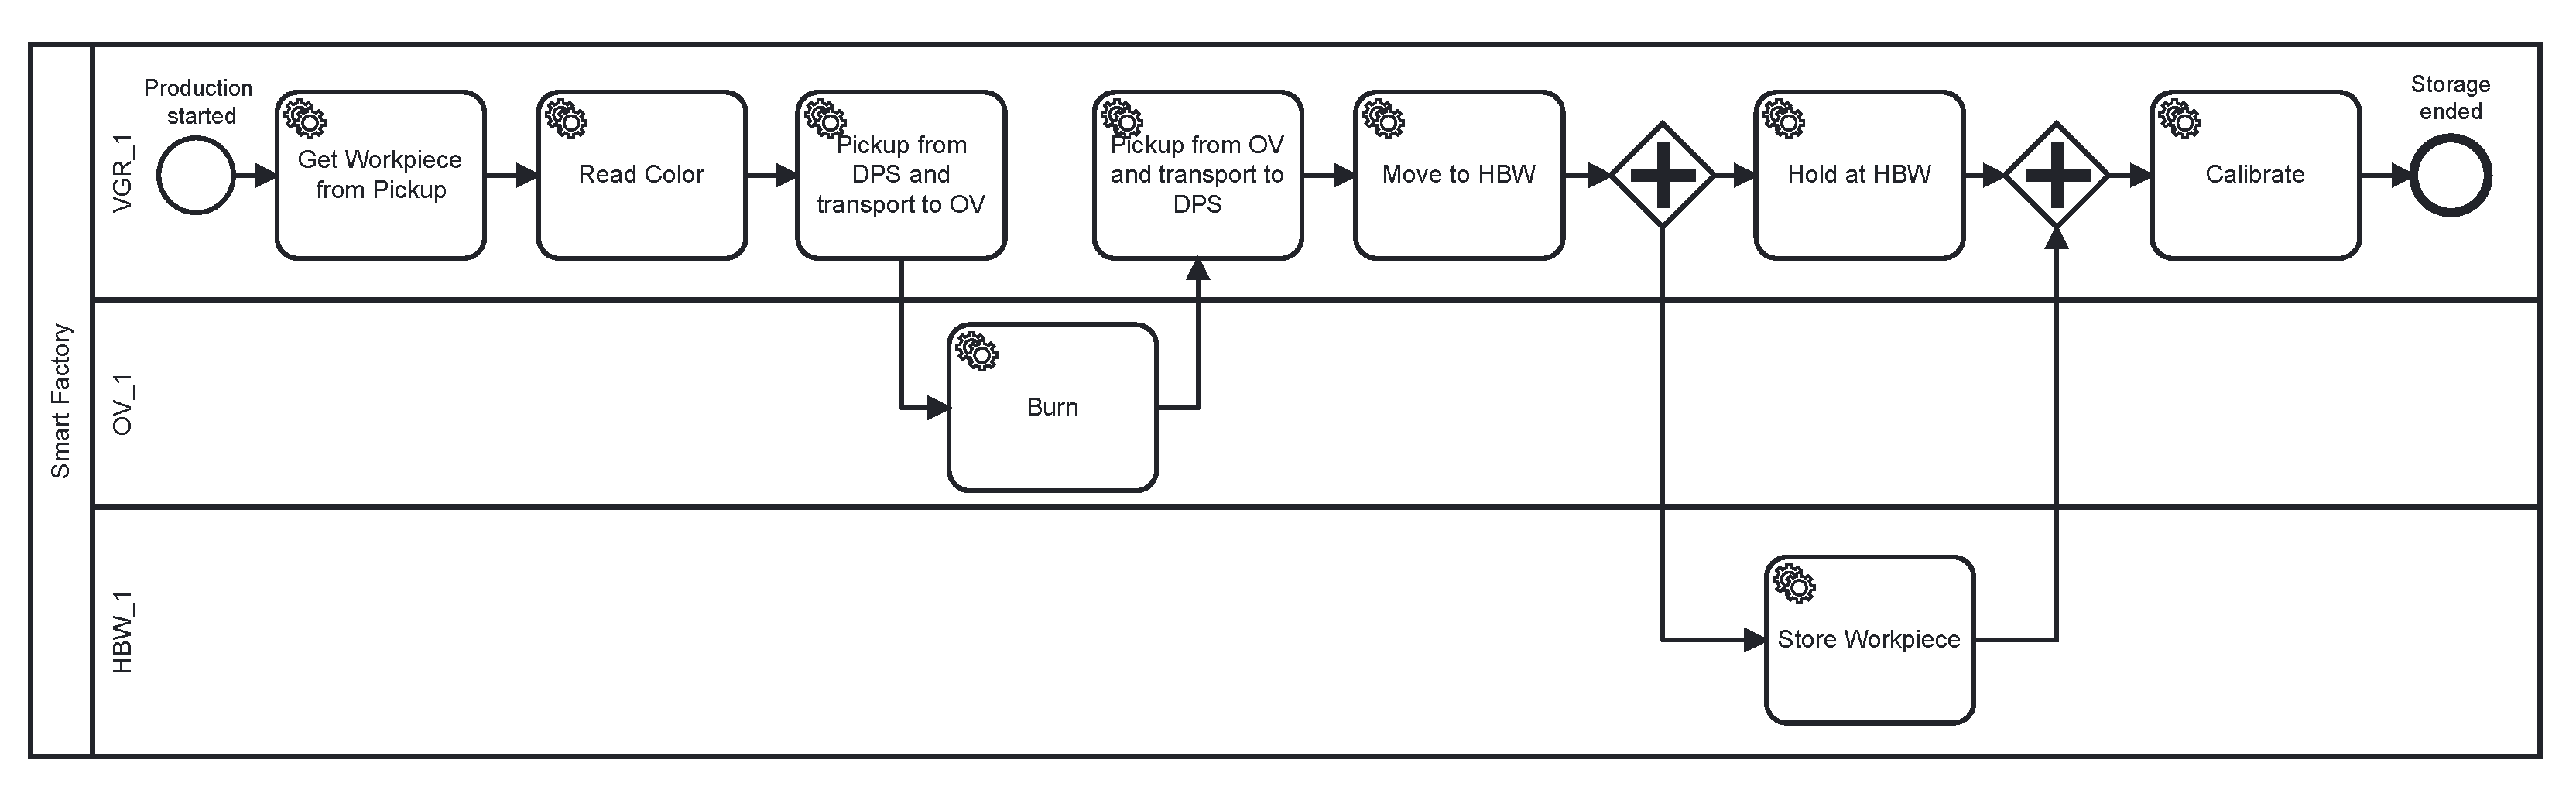
2.2.2. Example Processes

We will use the following two example manufacturing processes in our smart factory to illustrate the new concepts. Note that depending on the goal and use case of the data analyst, these processes can already be known from domain knowledge or be discovered from the detection of activity executions. In the latter case, there is no prior process knowledge (unsupervised setting) and the analyst attempts to detect and label activities from the raw IoT data and their knowledge about the CPS components. If processes are known, the analyst attempts to identify known activities and sequences of activities from the raw IoT data (supervised setting).
Storage Process: This process starts with a new raw workpiece in the delivery and pickup area of the VGR_1 station. The vacuum gripper robot picks up the workpiece and moves it to the station’s color sensor. Then, the workpiece color is determined. Then, the vacuum gripper robot picks up the workpiece and moves it to the HBW_1 station. Then, the vacuum gripper robot holds the workpiece until the high-bay warehouse retrieves an empty container to store the new workpiece. Then, the vacuum gripper robot moves to its initial position. We use the business process modeling standard BPMN 2.0 [23] to provide an abstract representation of this process in the form of a graphical process model. This process model is shown in Figure 3.
Production Process: This process starts with a human entering the color of a workpiece that should be produced. Then, the HBW_1 station unloads a corresponding workpiece from the warehouse. Then, the vacuum gripper robot of the VGR_1 station picks up the workpiece and moves it to the OV_1 station. Then, the workpiece is burnt in the oven. Then, the WT_1 station moves the workpiece to the MM_1 station. Then, the workpiece is milled. Then, the workpiece is sorted in the SM_1 station according to its color. Then, the vacuum gripper robot of the VGR_1 station picks up the workpiece (now: product) and moves it to the pickup and delivery area. The corresponding process model in BPMN 2.0 is shown in Figure 4.

2.2.3. IoT Data from Example Processes

We have recorded the raw IoT data from all sensors and actuators of all CPS components in the smart factory during the sequential execution of three instances of the storage process followed by three instances of the production process. Figure 5 shows the corresponding plot of all sensor and actuator values over time. Thereby, each graph of a different color represents the measurements (values on the y-axis on a log scale) from one sensor or actuator over time (x-axis on a linear scale). The sensors and actuators correspond to the descriptions in Section 2.2.1. Each graph represents a time series of measurements that contain a timestamp and a value for a sensor or actuator. This type of data set and plot serves as a starting point for the data analysis in our work. The data set used in this work is publicly available [6]. It contains the measurements for all 7 CPS components with 53 sensors and 24 actuators at a frequency of 1 measurement per CPS component per second over a duration of 27 min.

2.3. Goal

The goal of this work is to address the research question (cf. Section 1) regarding the steps of analyzing IoT data to derive a method for the detection of process activity executions (i.e., to increase the process-awareness of IoT data). The method shall be generic and applicable to other IoT domains (e.g., smart homes, smart offices, smart hospitals) featuring mostly low-level sensors and actuators as data sources [10].
The method shall support the data analyst in analyzing IoT data for process activity executions. It shall provide a guideline regarding the step-by-step analysis and common patterns to look for in the IoT data. We focus on deriving an interactive method for the data analyst as we argue and will show in the course of the paper, that full automation is only partially (i.e., within certain steps) possible to achieve. Once IoT data sets have been successfully analyzed and activities labeled, a knowledge base of known activities in the specific domain can be built. This can then be used as ground truth to find similar activities in unknown data sets and, thus, to increase the level of automation.

3. Related Work

Relevant related work can be classified into approaches discussing aspects of integrating IoT technology with BPM along the BPM lifecycle and into approaches that specifically address process event extraction and abstraction from IoT data to facilitate process mining.

3.1. BPM Meets IoT

The introduction of IoT technology into the BPM domain has been vibrantly discussed in recent years. Related work addresses a broad range of aspects to augment the modeling [24,25,26,27], execution [17,28,29,30], monitoring [14,31,32,33], and mining [2,4,11] of business processes with data and concepts from the IoT and CPS. Our work can be considered as a pre-processing stage of process mining where process-awareness of IoT data is increased and subsequently used for event extraction, event abstraction and event correlation [34].
The BPM–IoT Manifesto discusses the benefits and challenges of bringing the worlds of BPM and IoT together [1]. Sensors and actuators are new sources of real-time data that provide opportunities to develop advanced monitoring approaches, e.g., for condition monitoring, predictive maintenance [35] or verification of process outcomes [36]. With our work we aim at contributing a solution to the challenge Bridging the Gap Between Event-Based and Process-Based Systems as we raise the abstraction from IoT sensor and actuator events to the level of business processes. From these insights, we may then also contribute to the challenge Detecting New Processes from Data.
The IoT introduces new data sources for monitoring activities, behavior and daily routines, e.g., using multi-modal motion and vision sensors to detect objects or humans [37]. Many approaches specialize in the detection of specific activities from one or more sensors [38,39]. The automated correlation of detected activities with each other in the form of daily routines and habits [40,41] as well as business processes [4] for process mining [42] is also receiving increasing attention. We aim at providing a general method for correlating data from arbitrary types of IoT sensors and actuators with the execution of arbitrary types of process activities executed in the physical world.

3.2. Process Event Extraction and Abstraction from IoT Data

Process event extraction comprises the identification of event data relevant for process mining and its extraction from different data sources, e.g., databases and information systems [34,43]. Recent research is also considering the IoT as new source for event data [12,44,45,46,47]. In our work, we focus on low-level IoT sensors and actuators serving as the only sources that provide data about the processes and activities being executed in the corresponding smart space.
Event abstraction aims at bridging the gap in the level of detail at which data is recorded and at which it is analyzed [1,34,48]. Especially IoT sensors are capable of producing data at a very fine-grained level [49], which may not be suitable for process mining. Related work proposes to use, e.g., Complex Event Processing (CEP) [2,50], clustering [51], supervised machine learning [4,51,52] or combinations together with expert knowledge [53] to bridge this abstraction gap [54]. To enable process mining, the resulting coarse-grained events then need to be matched to the activities in a process model and correlated with the process instances through event-to-activity mappings [50,55,56].
In [46], the authors present a framework for deriving process event logs from sensor data including the aggregations needed for event abstraction, activity discovery, and event correlation. The lack of process-related information in IoT data often leads to uncertainties when being correlated with specific activities and cases as data patterns can often be associated with multiple candidates [46]. Senderovich et al. propose a knowledge-driven approach applying interaction mining to transform historical sensor data into process event logs [57]. Mannhardt et al. discuss a supervised method for event abstraction based on activity patterns, which are derived from low-level events using domain knowledge and then aligned with process cases into an event log [58].
In summary, most approaches assume certain amounts of process-related knowledge when discovering activities and processes from sensor data to generate IoT-enriched event logs [14,33,59]. In many cases, existing activity labels have to be connected to the raw events [34,47,60]. Related approaches are often not applicable to IoT data sets in more unsupervised settings when almost no process knowledge and limited domain and topology knowledge are given. The goal of our work is to support the process analyst with analyzing unknown IoT data sets for activity and process executions in an early analysis stage. In providing the process analyst with a guideline in the form of a structured interactive analysis method, we rely on domain knowledge for the activities of event extraction, event abstraction and event correlation. Once an initial set of IoT data from a specific IoT domain was analyzed and labeled by the process analyst, the knowledge about IoT data–activity–process correlations can be used as input for more sophisticated supervised learning techniques to automatically analyze larger data sets [37,53,57,58].

4. Method to Identify Activity Executions

In this section, we investigate the research question: Which steps need to be taken to manually analyze IoT data for process activity executions? To develop these steps into a systematic method for activity identification, we will first conduct an exploratory data analysis [61] of the given data set (cf. Section 2.2.3) from different angles based on the visual information seeking paradigm: “Overview first, zoom and filter, then details-on-demand” [62]. From these insights, we will then derive a generic method for the interactive process activity identification from IoT data.

4.1. Assumptions

One of the main motivations and assumptions for our work is that a central BPM system to execute and/or monitor the execution of processes is not available in many IoT environments and thus, the raw IoT data from sensors and actuators is the only data source. Regarding domain knowledge, we assume that the data analyst is at least familiar with the CPS, its components and characteristics of sensors and actuators (e.g., as given in Section 2.2.1).
Two additional basic assumptions in this work are that (1) CPS components are capable of only sequential executions of activities (i.e., at most one activity at a time for a CPS component), and (2) that the execution of one activity is limited to one CPS component (i.e., an activity does not involve more than one CPS component). The latter assumption is consistent with the general definition of a processing activity being regarded as an atomic unit of work, which cannot be further decomposed and is executed by one actor [3]. The first assumption is reasonable for discrete manufacturing [19] and other smart spaces where CPS components have limited multi-tasking capabilities. We will discuss the effects of relaxing these assumptions on the developed method in Section 6.

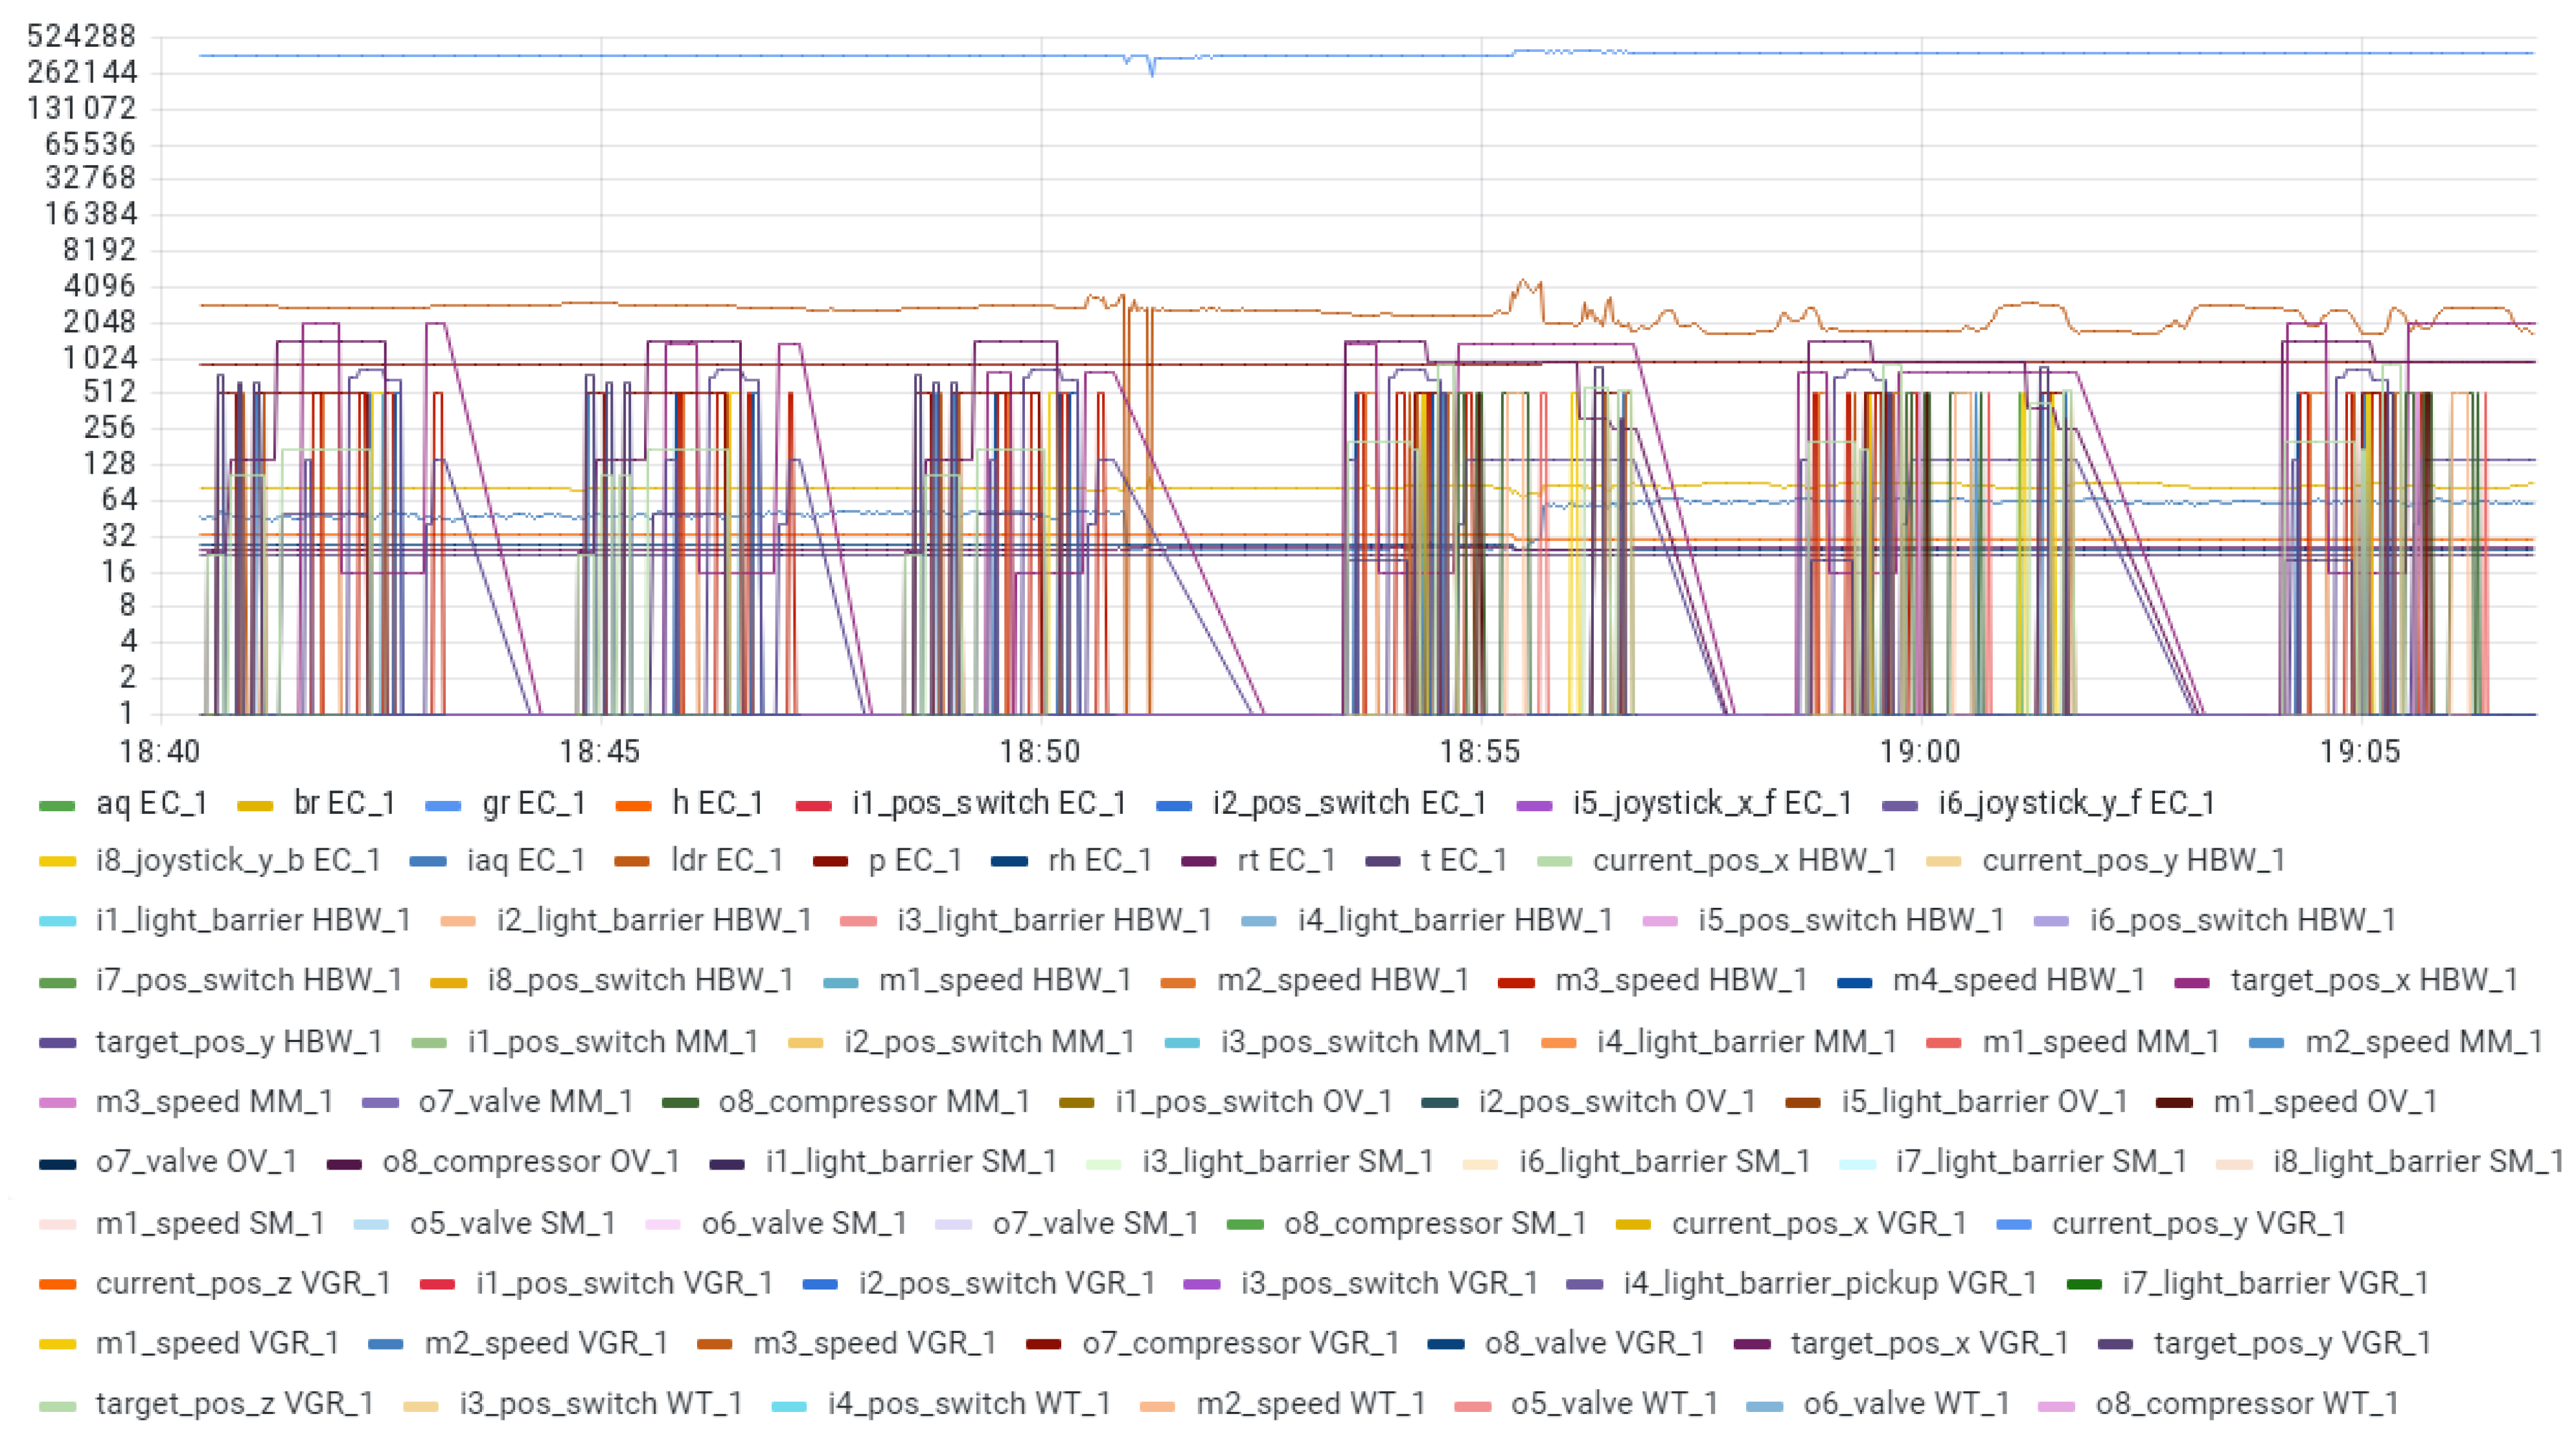
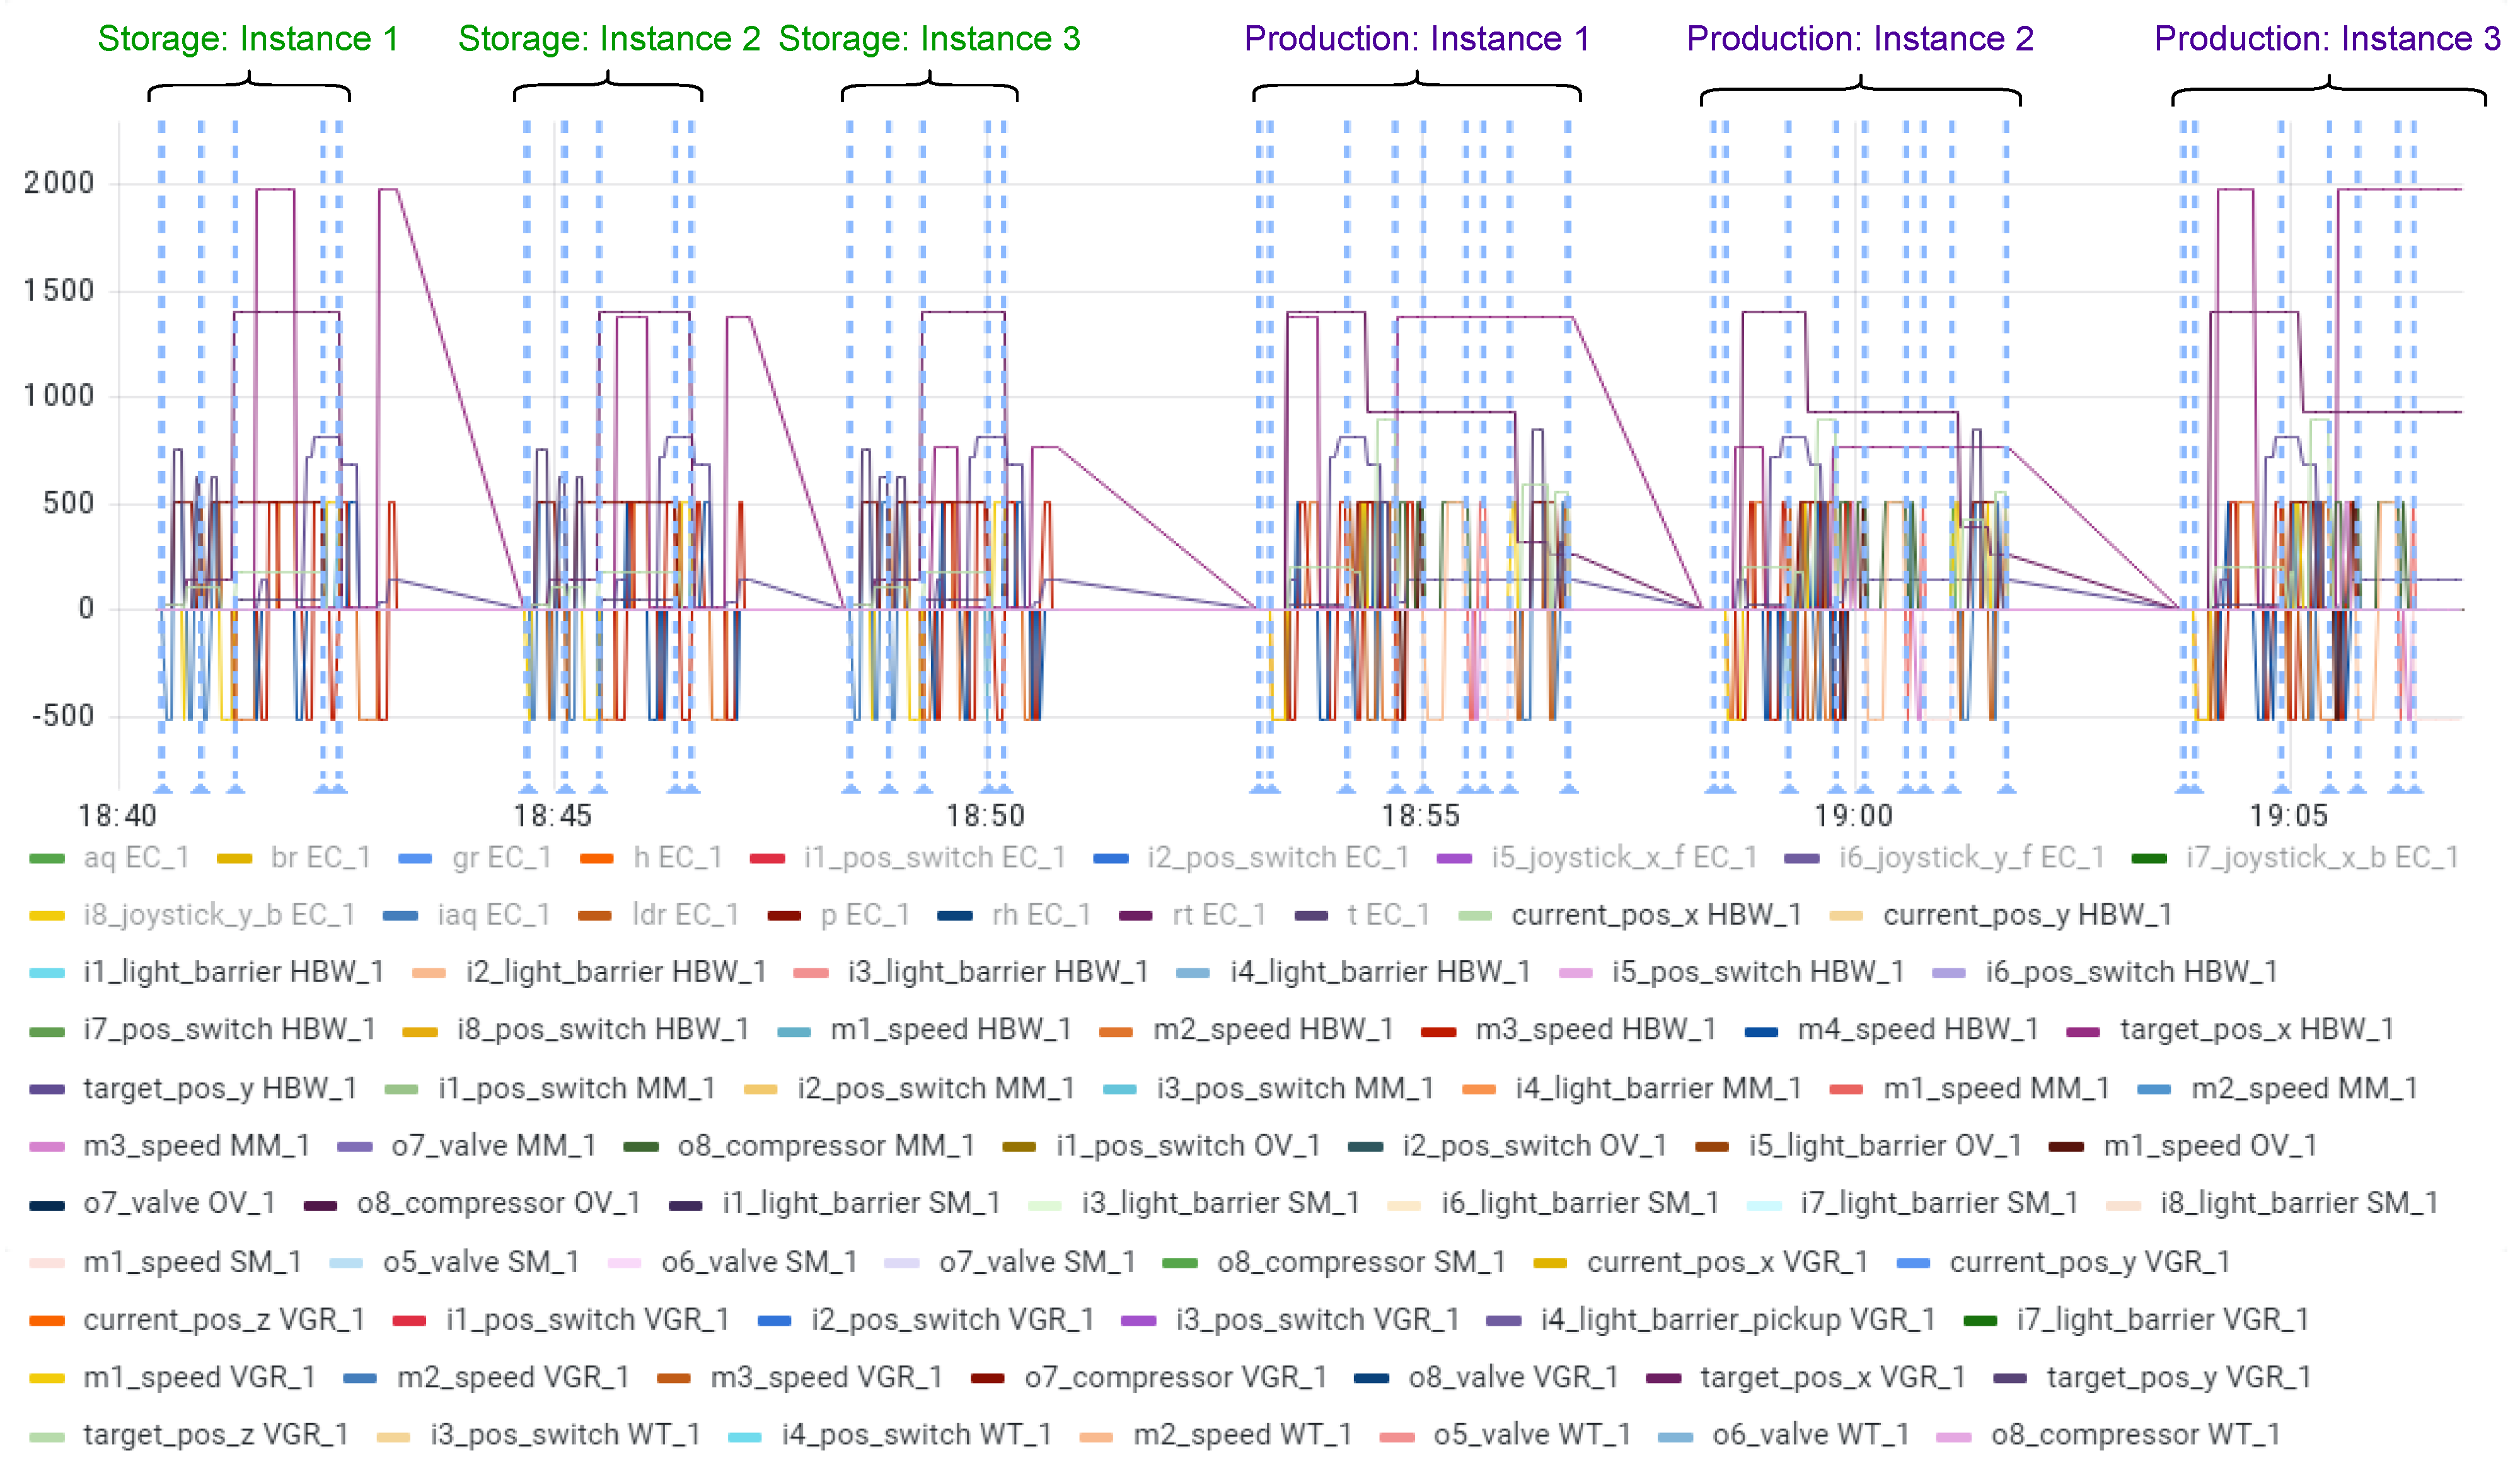
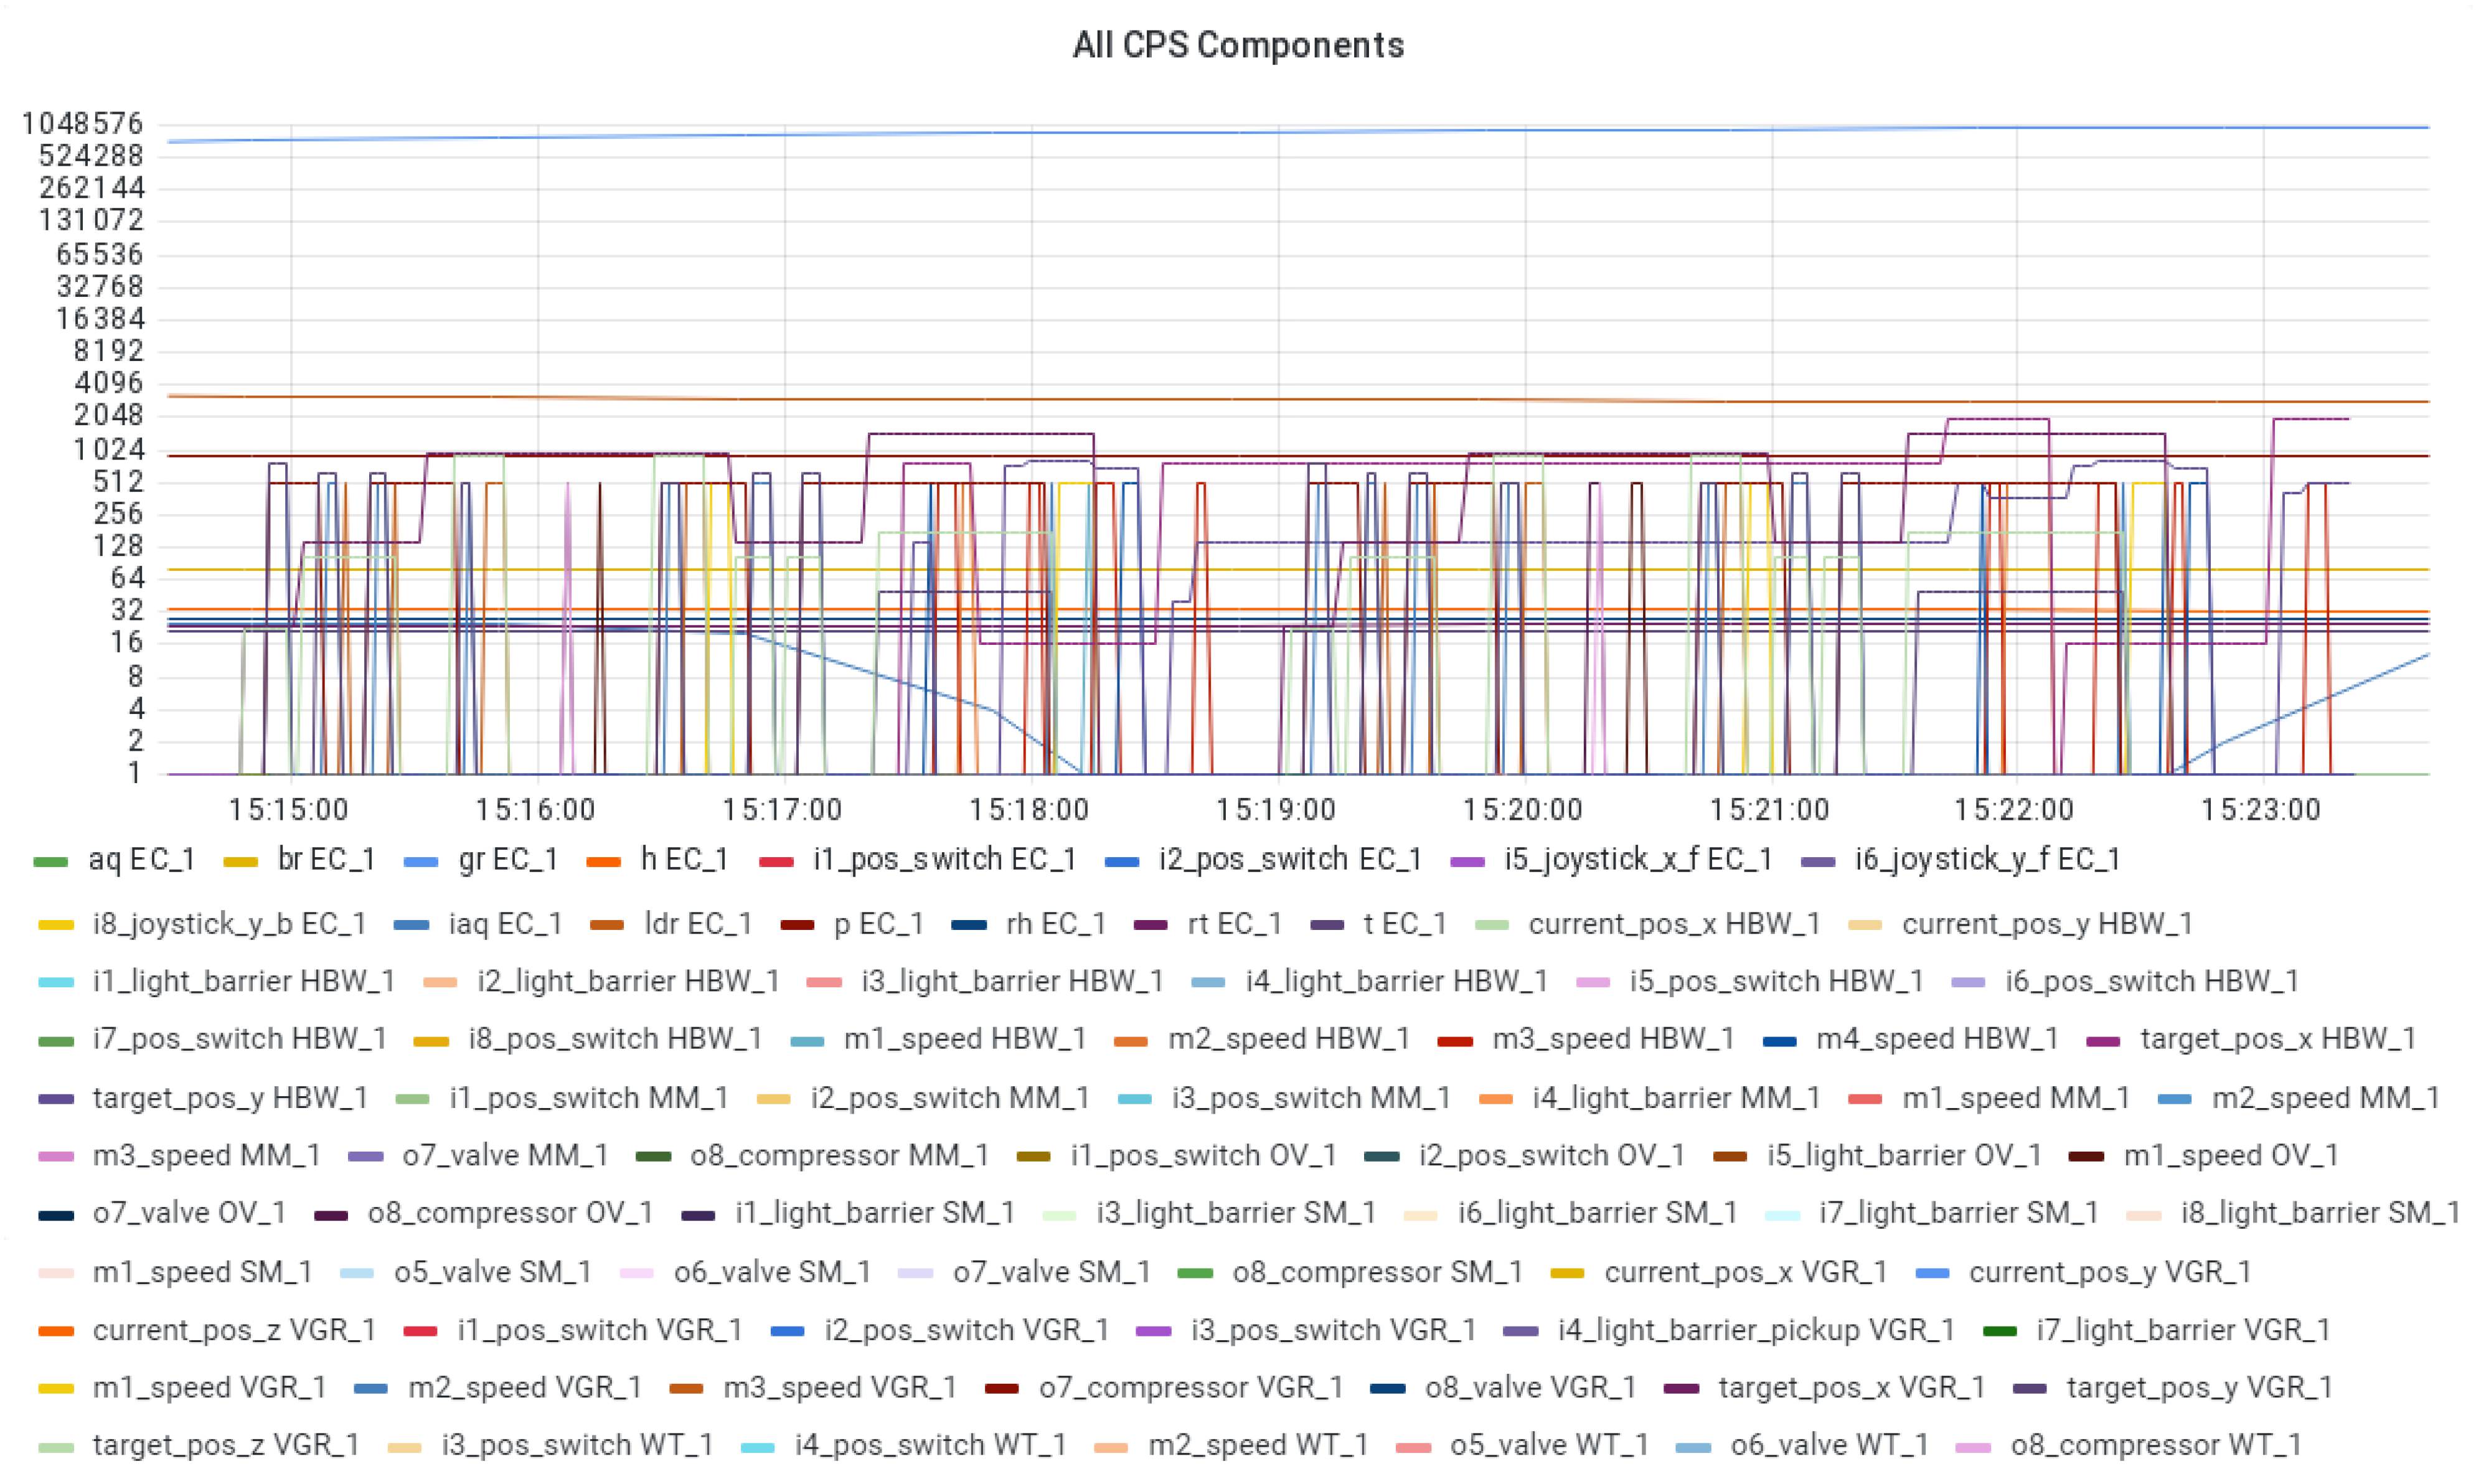
4.2. Overview First: Visualize the Entire IoT Data Set

The first natural step is to get an overview of the entire data set that should be analyzed. Thus, finding an appropriate visualization for the type of data is the first challenge. Since activity executions can be associated with a specific time frame (i.e., they have a duration) and IoT data is available as time series [49], line graphs plotted for each sensor and actuator over time provide a suitable visualization to get an overview of the data (cf. Figure 5).
The line graph plots of all the 77 sensors and actuators from our data sets result in a rather complex visualization. Filtering and zooming are necessary actions to derive specific correlations among sensors and actuators that may indicate the execution of process activities. However, in the figure, we are already able to see some first recurring patterns that are worth to be further investigated. On the one hand, there are time frames with high frequencies of sensor and actuator changes, which might be an indication of activity execution, and there are time frames with almost no changes, which might be an indication of inactivity. On the other hand, CPS components are active at different times or the entire time, which might be an indication of their relevance and the type of activity being executed. We use these two criteria—CPS components and time frames—as the basis for filtering in the next step.

4.3. Zoom and Filter: Identify and Filter by Relevant CPS Components and Time Frames

To reduce the complexity of the initial visualization, we propose to filter the data first by each CPS component to determine their relevance for the entire process execution. Then the data set has to be segmented into time frames per component to identify phases that should be analyzed further. As stated in Section 4.1, some of our basic assumptions are that the execution of an activity is limited to one CPS component and that a CPS component does not execute multiple activities in parallel. With these assumptions, we are able to determine the relevance of a CPS component for the process execution as stated below. It is up to the analyst to decide the granularity level of the time-based segmentation of the data set. Recommendations here are to segment the data by periods of activity and inactivity per component according to the following definitions. This step does not need to completely rely on the domain expert but can be partially inferred automatically by analyzing the sensor/actuator changes following the activity/inactivity patterns.
  • If a CPS component does not exhibit significant changes in the values of its sensors or actuators for the time frame in question, it is considered not relevant for the identification of activity executions.
  • If a CPS component exhibits significant changes in the values of its sensors or actuators for the time frame in question, it might be considered relevant for the identification of activity executions.
Example 1. 
Figure 6 shows the sensor and actuator values of the given data set filtered by the workstation transport (WT_1) component. Here we see that changes in the component’s sensors and actuators only occur in the second part of the time frame (18:53–19:07). Thus, this component seems to be irrelevant for the first part of the process execution and relevant for the second part. Here we could divide the identified relevant time frame further into parts of activity and inactivity to make the segmentation more fine-grained. Given domain knowledge about the existing processes in the CPS (here: smart factory), we can additionally already derive that the activity executions in the first part of the data set might belong to the Storage Process since the WT_1 station is not involved here (cf. Section 2.2.2). Similarly, we can derive that the second part belongs to the Production Process with the involvement of the WT_1 station. Note that this is only possible in the example data set because there are only sequential process executions without overlap and a clear distinction between the first three instances (storage process, Section 2.2.2) and the second three instances (production process, Section 2.2.2).
Example 2. 
Figure 7 shows the sensor and actuator values of the given data set filtered by the high-bay warehouse (HBW_1) component. Here we see significant changes in its sensors and actuators during the entire time frame. Thus, the component might be relevant for the entire process execution. As the patterns look very similar and the HBW_1 component is part of both example processes, either to store a new workpiece (Storage Process) or to unload a workpiece (Production Process, cf. Section 2.2.2), we cannot make any statements about the types of processes the individual activities belong to.
Example 3. 
Figure 8 shows the sensor and actuator values of the given data set filtered by the vacuum gripper robot (VGR_1) component. Being the central entity responsible for transportation, we see changes in this component’s sensors and actuators and with that its relevance along the entire timeline. From the figure, we can also observe that patterns between the first part of the data set and the second part differ slightly, which might be an indication that they belong to different types of activities.
Example 4. 
Figure 9 shows the sensor and actuator values (on a log scale) of the given data set filtered by the environment and camera (EC_1) component. Here we see continuous readings from all the sensors (e.g., gas resistance, temperature, humidity, pressure, brightness) during the entire time frame. At this point, the data analyst has to decide about the relevance of the individual sensors and the entire component. In our example manufacturing processes, the EC_1 component might provide useful context data [12], but the component has no relevance for activity detection.
Table 3 summarizes the relevance determined for all the CPS components of the smart factory and the corresponding time frames referring to the absolute time stamps displayed in the visualizations of the given IoT data set. For the exemplary sequential process executions (cf. Section 2.2.2), this table can be used to determine which details to investigate in the next step, namely all components and time frames considered to be relevant. Additionally, the table can be helpful to provide context and correlations among components, e.g., to determine which type of process and activity might be executed in the specific parts based on domain knowledge. In the two smart factory processes (cf. Section 2.2.2), we know for example that the oven is capable of executing only one type of activity (Burn) as part of the production process. Thus, we may already infer that the second part of the data set may refer to the production process and the burn activity being executed due to the OV_1 component being only relevant in this part. If this knowledge is not available, the time frame segmentation in the example would have been more fine-grained and aligned with the relevance of the individual CPS components.

4.4. Then Details-on-Demand: Determine Start and End Patterns and Activity Signatures

Each component and time frame determined to be relevant is then investigated in more detail. The plots for each component are analyzed with the goal of finding and annotating specific patterns related to one or more sensors and actuators that might indicate either the start time of an activity or the end time of an activity. Once the start and end events for an activity are identified, the process analyst provides a suitable label for the activity.
Example 5. 
Figure 10 shows the details for the relevant time frames of the WT_1 (workstation transport) component including annotations for the start and end of activities. Given all sensors and actuators have been inactive, a change in the speed value of one of its motors from 0 to −512 (for moving backward) or to 512 (for moving forwards), depending on the initial position of the transport gripper, signifies the start of an activity. In our context, this refers to the activity Transport from Oven to Milling, which needs to be provided as a label by the process analyst. Similarly, the end of an activity is indicated by a change in the last active motor’s speed value to 0 followed by a longer period of inactivity.
Example 6. 
Figure 11 shows the details for one relevant time frame of the HBW_1 (high-bay warehouse) component including annotations for the start and end of activities. Again, the change in the speed value of one of the motors from 0 to −512 indicates the start of an activity, namely the Store Workpiece activity as labeled by the process analyst. The end of the activity is indicated by a position switch being pressed (i.e., its value changes from 0 to 1) as an effect of moving the loading robot. The remaining active sensor values refer to the target positions of the warehouse robot, which will only change with the start of a new activity in the HBW_1 component. The irrelevance of these sensors at this point is part of the analyst’s domain knowledge.
Example 7. 
Figure 12 shows the details for one relevant time frame of the VGR_1 (vacuum gripper robot) component including annotations for the start and end of activities based on sensors and actuators changes as well as more specific attributes. This central transportation component is relevant in many parts of the process execution. Here we see that refinements of detected activities might be necessary as a seemingly coherent activity that is preceded and succeeded by periods of inactivity can actually represent a sequence of several shorter activities. As the vacuum gripper robot is constantly moving and with this, its motors and compressors as well as switches are constantly active or triggered, and different types of sensors/actuators need to be taken into consideration to identify activity borders. In the case of this robot being responsible for the execution of transportation activities from one station to another, the change of the target position values provides good hints for the start and end of this type of activity in general. The change of one or more of the target coordinates usually indicates that one target was reached, and with that, the associated activity ended (e.g., in combination with the status of motor movements), and the movement to a new target is started as part of a new activity. However, we may also see movements to more than one target as part of one activity. The device-specific attribute target position is an indicator for activity borders, which is usually part of the data analyst’s domain knowledge. Additionally, for the vacuum gripper robot, we can consider the status of its compressor as an indicator for the start/end of activities. The compressor’s status (on/off) is related to the picking up/dropping of workpieces, which may mark the start or end of an activity. In general, the analyst also has to decide about the correct levels of granularity of a detected activity, i.e., if it should be subdivided or merged with others [48].

4.4.1. Activity Start and End Patterns

From the examples and further observations in the given data set, we can derive the following general conceptual patterns regarding the changes in sensor and actuator values (with x and y being arbitrary values) that may be indications for the start or end of an activity (cf. Table 4). These patterns have shown to be valid more generally in CPS [2,63]. Note that these patterns only refer to single sensors and actuators. In complex CPS that execute more complex processes, these patterns might be combined to composite patterns based on logical conjunctions, aggregations or temporal dependencies between atomic patterns as described in [63] to detect the start or end of an activity.
Additionally, we have observed that periods of inactivity followed by one or multiple sensors or actuators becoming active are good indications for the start of an activity and, vice versa, the change from activity to inactivity might indicate the end of activity execution. This holds at least for CPS components that are not operating at high loads (e.g., the oven, sorting machine, and milling machine in our setup). Other components (e.g., the vacuum gripper robot) that are constantly involved in different activity executions require refinements of activities detected solely based on a switch of sensors/actuators from inactive to active. Here, additional component-specific attributes have to be taken into consideration.
Regarding sensor characteristics, changes within discrete or even binary states of sensor and actuator values (cf. Table 1) are more likely to indicate activity boundaries than within continuous sensors. Continuous sensors or actuators require additional domain knowledge and discretization into intervals to derive activity executions. Although in our examples we have classified the environmental sensors as irrelevant, changes in their continuous values following specific patterns (e.g., sudden changes or slow increase/decrease) might generally also be effects of the activity execution by a different component (e.g., an increase of the environment temperature as a result of starting to burn a workpiece in the oven). We assume these indirect patterns and cross-component dependencies to be part of the domain knowledge of the analyst. However, here we also see a large potential for automating the detection of sensor/actuator correlations across CPS components as part of future work.
While the focus of our analysis is on low-level IoT data coming from individual sensors and actuators, CPS components might also emit higher-level sensor data (e.g., discrete state changes within a machine), which should be prioritized when identifying activity executions. This information is either part of the analyst’s domain knowledge or can be provided as part of the sensor/actuator characteristics of a CPS component (e.g., in the form of an ontology [64]).
Note that in this work, the patterns and sensor–actuator–activity correlations proposed are just indications helping the process analyst to identify potential activity executions from raw IoT data. It is the main responsibility of the process analyst to make ultimate decisions about the start and end of activities.
As described above, it is also within the responsibility of the analyst to provide a suitable activity label based on domain knowledge, or at least a generic label that allows for distinguishing different activities. Thus, far, our approach is limited to detecting start and end patterns including the associated timestamps for activities, and the CPS component that executed the activity. The specific type of detected activity (i.e., a suitable label) can only be inferred from this information or additional domain knowledge as done in the examples above.

4.4.2. Activity Signatures

Once the time-related borders of activity A were clearly identified, we derive its activity signature A S ( A ) . We define the activity signature A S ( A ) of activity A as: the sequence of all sensor and actuator data represented as time series for the particular CPS component within the identified activity boundaries relative to its start time t A s (with t A s = 0 ) and its end time t A e relative to t A s . This sequence of sensor and actuator data is associated with a unique activity label L A [5]. Following the idea of the digital twin being a digital representation of a physical component or object [65,66], we regard a processing activity as an abstract digital concept and its activity signature belonging to the activity’s physical twin. The activity signature represents the physical manifestation of the execution of the corresponding process activity in the sensors and actuators of the IoT environment [36].
Figure 13 shows the activity signature for the Transport from Oven to Milling activity (cf. Figure 10) executed by the WT_1 component (relative time in seconds on x-axis, values of sensors and actuators on y-axis). Figure 14 shows the more complex activity signature for the Get Workpiece from Pickup activity (cf. Figure 12) executed by the VGR_1 component.

4.5. Find and Label Similar Activities

Using the activity signatures of detected activities, we are now able to analyze unknown (i.e., unlabeled) parts of the given IoT data set for the occurrence of activities with similar signatures. In the context of this work, we assume that the process analyst performs a visual search for similarities with known activities. This step has a high potential for automation and we will investigate different means for detecting similarities in time series data (e.g., using dynamic time warping and supervised machine learning) as part of future work [67]. Identified similar activities have to be labeled. Segments of no activity execution also need to be labeled as such, so they can be found in other parts of the data set and each segment (i.e., time frame) receives a label.
The term similarity does not refer to an exact match of a known activity signature (i.e., sequence of sensor and actuator values) in unknown parts of the IoT data set, but rather a match of patterns and values within specific ranges. These variations in activity signatures might be introduced by different factors, e.g., different parameters for activity executions or imprecision that results from interactions with the physical world. Thus, when moving from the manual detection of similarities to an automated approach, a similarity measure and a threshold have to be introduced in order to find similar activities.
Figure 15 shows an example of similar activities found in the given IoT data set for the VGR_1 component. Here we can observe very close matches between the signatures of identified activities. Figure 16 shows an example of similar activities found in the given IoT data set for the HBW_1 component. Here we see some larger differences between signatures of the same activities. Taking the Store Workpiece activity as an example, one influencing parameter is the position of the container in the warehouse that should be used for storage. This position influences the duration but not the type of the unload and store procedures and with that, e.g., the number of motor movements.
Figure 16 also shows an important limitation of only analyzing the raw IoT data for activity executions. All the activities identified here have very similar signatures although they can be distinguished into two different types that belong to different processes in our smart factory example (cf. Section 2.2.2). The first three activities Store Workpiece refer to the storage of a new workpiece in an empty container (cf. Storage Process in Section 2.2.2). The following two activities Unload Workpiece refer to the unloading of an existing workpiece from a container (Production Process). Both types of activities are implemented via the same activations of sensors and actuators and the smart factory configuration currently does not feature sensors to determine the load within a container. This leads to an ambiguity regarding the detected activity [46] that could either be resolved through additional sensors or through the consideration of the activity context (e.g., the preceding and succeeding activities [2]).

4.6. Visualize All Activities and Find Repeated Sequences
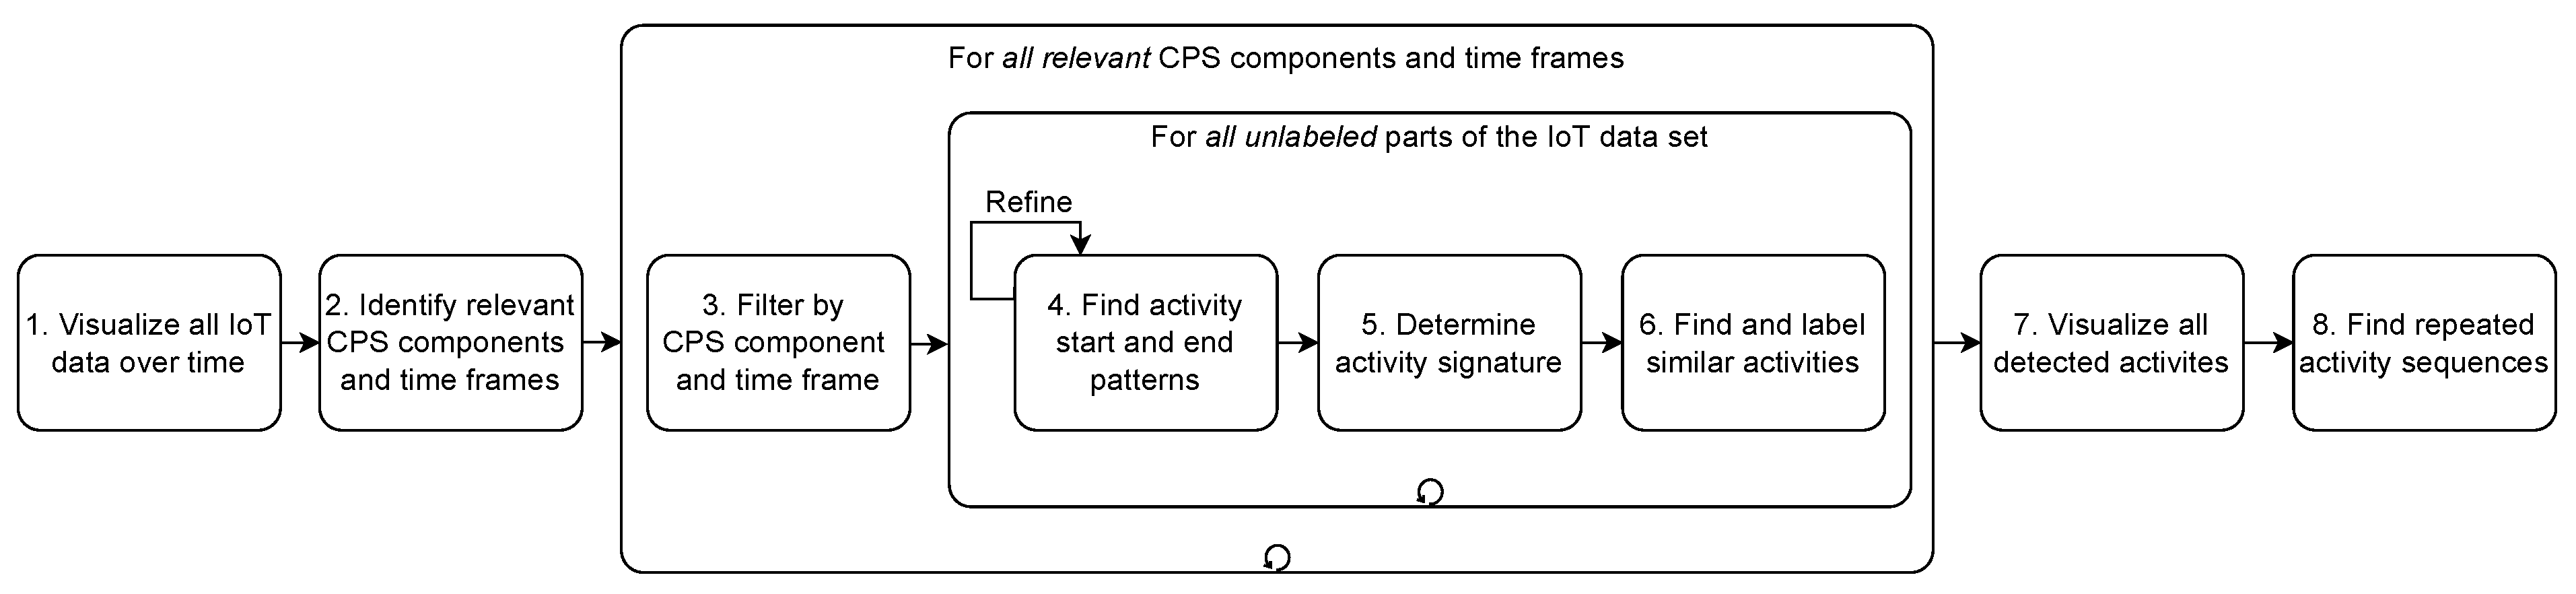
After labeling the given IoT data set with the start and end of identified activities based on the similarity search of activity signatures, it may also be possible to discover entire processes based on the appearance of repeated activity sequences.
Figure 17 shows the visualization of all detected activities in the given IoT data set. From a visual analysis of similarities and repetitions across activities, we are able to identify two different types of three repeated sequences of activity executions. These repeated sequences may be candidates for executed process instances, but can also be part of one or more loops executed within one or more process instances. In addition, the detected activities may belong to one or more process instances being executed in parallel. Moreover, in the example, we assume that the given IoT data set starts with the first activity of a new process instance, which may not always be the case and there is first a need for orientation, especially when moving into online data analysis settings [68]. Here we need to again rely on the process analyst and domain knowledge to label the processes.
In Figure 17, we can see that the first three executions of process instances belong to the Storage Process (cf. Section 2.2.2) and the second three executions belong to the Production Process. This can be derived from the involved CPS components (cf. Table 3) and knowledge about the processes in the smart factory (cf. Section 2.2.2). Once executed processes were identified in the IoT data set, we can extend the definition of activity signature (cf. Section 4.4.2) to the level of process signature considering the time series of sensor and actuator values over the entire time of the process execution.
To automate this step of finding potential processes in the labeled data set, the start and end of an activity can also be written as events into a process event log, which can be used for process discovery (e.g., in the form of a process map) using traditional process mining techniques [3].

4.7. Method

From the previous elaborations in Section 4 we derive the method depicted in Figure 18, which describes the general process of analyzing raw IoT data for activity executions. We derive this method as a sequence of the essential steps taken by the process analyst to analyze a given IoT data set following the visual information-seeking mantra as described in Section 4.2Section 4.6.
  • Step 1: Visualize all IoT data over time to get on overview of the data set, the involved CPS components and their sensors and actuators (cf. Section 4.2).
  • Step 2: Identify relevant CPS components and time frames to determine the parts of the IoT data set that need to be further analyzed (cf. Section 4.3).
  • Step 3: Filter by CPS component and time frame to reduce the amount of data to analyze at a time (cf. Section 4.3).
  • Step 4: Find activity start and end patterns to detect the points in time in the IoT data where an activity started and ended (cf. Section 4.4.1). This step may need to be repeated to refine the detected activities according to the required level of granularity [48].
  • Step 5: Determine activity signature to make a detected activity identifiable in other parts of the IoT data set (cf. Section 4.4.2).
  • Step 6: Find and label similar activities to provide labels for unknown parts of the IoT data set (cf. Section 4.5).
  • Steps 4–6 have to be repeated for all unlabeled parts of the IoT data set for the current CPS component.
  • Steps 3–6 have to be repeated for all relevant CPS components and time frames (cf. Step 2) of the IoT data set.
  • Step 7: Visualize all detected activities to get an overview of all identified activity executions in the IoT data set (cf. Section 4.6).
  • Step 8: Find repeated activity sequences to identify candidates for processes (cf. Section 4.6).

4.8. Tooling and Data Pipeline

In our prototypical implementation, we use the system architecture described in [17] to execute processes in the smart factory simulation model (cf. Section 2.2.1). Events from sensors and actuators are published from the smart factory as messages in JSON format [5] with a customizable frequency via the MQTT (https://mqtt.org/, accessed on 22 January 2023) protocol (one topic per CPS component). The sensor events contained in these messages are written as measurements of a time series into an InfluxDB (https://www.influxdata.com/, accessed on 22 January 2023) database (one bucket per CPS component). Finally, Grafana (https://grafana.com/, accessed on 22 January 2023) is used to create the interactive visualizations and activity annotations in the form of dashboards (per CPS component and for the entire CPS) from the database.

5. Proof of Concept Evaluation

To validate the proposed method we conducted a proof of concept evaluation, which consisted of the manual activity detection and annotation of a new, unknown IoT data set from the smart factory model following the steps illustrated in Section 4. Figure 19 shows the visualization of the IoT data sets.

5.1. Setup

One of the authors acted as the process analyst performing the annotation. We remark that the analyst did not know the process in advance, so as not to influence the annotation operations. However, the analyst has knowledge about the individual CPS components as described in Section 2.2.1 and basic knowledge about processes and types of activities that can be executed in the smart factory. The analyst was asked to follow the developed method as described in Section 4 and analyze the data step-by-step. The analyst was also given the additional general recommendations regarding the determination of a component’s relevance (Section 4.3) and the general set of sensor/actuator patterns to look for when determining the start and end of an activity (Section 4.4.1). We deem conducting the evaluation with an internal participant acceptable, since the method assumes the analyst to be familiar with the CPS, its components and characteristics of sensors and actuators, and proficient with the developed method. Nevertheless, we regard a structured user-study as an interesting follow-up work to further validate our findings.
The resulting annotation of the IoT data set was then compared with the actual process event log constituting the ground truth. This log was automatically recorded during the execution of the process by a BPM system [17] and not disclosed to the analyst. Figure 20 shows the underlying model of the executed processes used to generate the data set.

5.2. Results

Table 5 summarizes the relevance determined by the analyst for all the CPS components of the smart factory (cf. Step 2, Section 4). Seven relevant time frames were identified from the IoT data set based on the visualization of changes in sensor and actuator values within the individual CPS components. The corresponding start and end time stamps (absolute time stamps) are reported in the table. The analyst determined that the vacuum gripper robot (VGR_1) was relevant in parts 1, 3, 5, and 7, the high-bay warehouse (HBW_1) in parts 3 and 7, and the oven (OV_1) in parts 2 and 6. Other components were considered not relevant in any time frame due to the absence of changes (MM_1, WT_1, SM_1) or insignificance of changes (EC_1) in the corresponding data.
Figure 21 illustrates the result of the manual annotation done by the analyst (activity boundaries in green), complemented with the annotation directly derived from the process event log created by the BPM system (activity boundaries in red). The figure also shows suggested abbreviated labels for the activities (in green suggested by the analyst, in red suggested by the BPM system, and in black where the analyst and BPM system match) and distinction into process instances.
The identification of the type of activity by the analyst almost completely matches the ground truth. For the second activity executed, the process analyst was uncertain about the semantics of this activity. A sequence of movements of the vacuum gripper including dropping and picking up the workpiece again was observable in the data. However, no other component was active in between. Here the actual intention is that the color of the workpiece is determined with the help of the color sensor at the delivery and pickup station connected with the VGR_1 component. This activity does only refer to reading a specific sensor, which is constantly emitting data. Thus, this explicit sensor data retrieval cannot be observed in the IoT data.
Additionally, we see deviations in the timestamps related to the start and end of activities generated by the BPM system and identified by the process analyst. The process analyst focuses on sensor/actuator patterns as the only indicators for activity boundaries. However, the actual implementation and execution of the specific activity by the BPM system refers to a call to a web service [17]. This invocation might involve additional computations, requests to the other applications, or other forms of communication, which might introduce delay. Thus, there may be mismatches emerging between the recorded start/end of an activity and its manifestation in the IoT data. Examples here are the implementation of (1) the Burn activity, which includes a short period of waiting before moving the workpiece into the oven, and (2) the Store Workpiece activity, which is considered to have ended once the container has been loaded into the warehouse, although the loading crane is moving to its initial position afterward.
Based on the similarities of identified activity sequences, the process analyst was able to successfully identify the execution of two process instances belonging to the same process. From these instances, the analyst was able to recreate the process model accordingly, which—apart from the uncertain second activity—corresponds to the model used for execution (cf. Figure 20). Therefore, we conclude that the detection of activities and the whole process following the developed method was achieved successfully.

5.3. Observations

During analysis, the process analyst took note of some relevant observations to document difficulties and challenges:
  • The relevance of CPS components and time frames was easy to determine given knowledge about the characteristics of sensors and actuators (cf. Section 4.3). However, determining the size of a time frame based on a component being active/inactive may already result in a very fine-grained segmentation of the data set.
  • Activities executed by CPS components that involve only a small number of sensors and actuators and that only offer one or two different activity types (e.g., the oven) were easy to identify. Here the analyst was able to identify the start and end based on simple change patterns (cf. Section 4.4.1) within the values of a sensor or actuator with high accuracy compared to the ground truth. This is the case, for example, for the Burn activity by OV_1. However, as mentioned in Section 5.2 there might be deviations in the precision of identified time stamps due to the implementation of an activity not directly manifesting itself in the IoT data.
  • Activities executed by CPS components that involve multiple sensors and actuators and depending on domain knowledge regarding the change patterns (e.g., referring to the target position of the vacuum gripper robot) were more difficult to identify. Here it was not always obvious which combinations of change patterns among one or multiple sensors and actuators indicate the start or end, and which activity was identified. Moreover, finding the right level of granularity of the detected activities was non-trivial. For example, although correctly identified, it was not immediately obvious that the activities Move to HBW and Hold at HBW executed by VGR_1 are indeed two in sequence instead of one single activity.
  • Finding similar activities visually based on the same signatures in the IoT data was easy to achieve.
  • Distinguishing activities with very similar signatures from each other was only possible by taking the process context (i.e., preceding and succeeding activities) into account. This was the case, for example, for activities Pickup from DPS and transport to OV and Pickup from OV and transport to DPS.
  • The detection of activities contributes to incrementally developing process knowledge in the analyst’s mental model, which in turn facilitates further detection and disambiguation of other activities from the data set. For example, it was possible to distinguish between Pickup from DPS and transport to OV and Pickup from OV and transport to DPS because in a previous iteration of the method loops, the Burn activity was detected, signaling that OV_1 was active in the time frame between these two activities and the workpiece must have been transported to the oven.
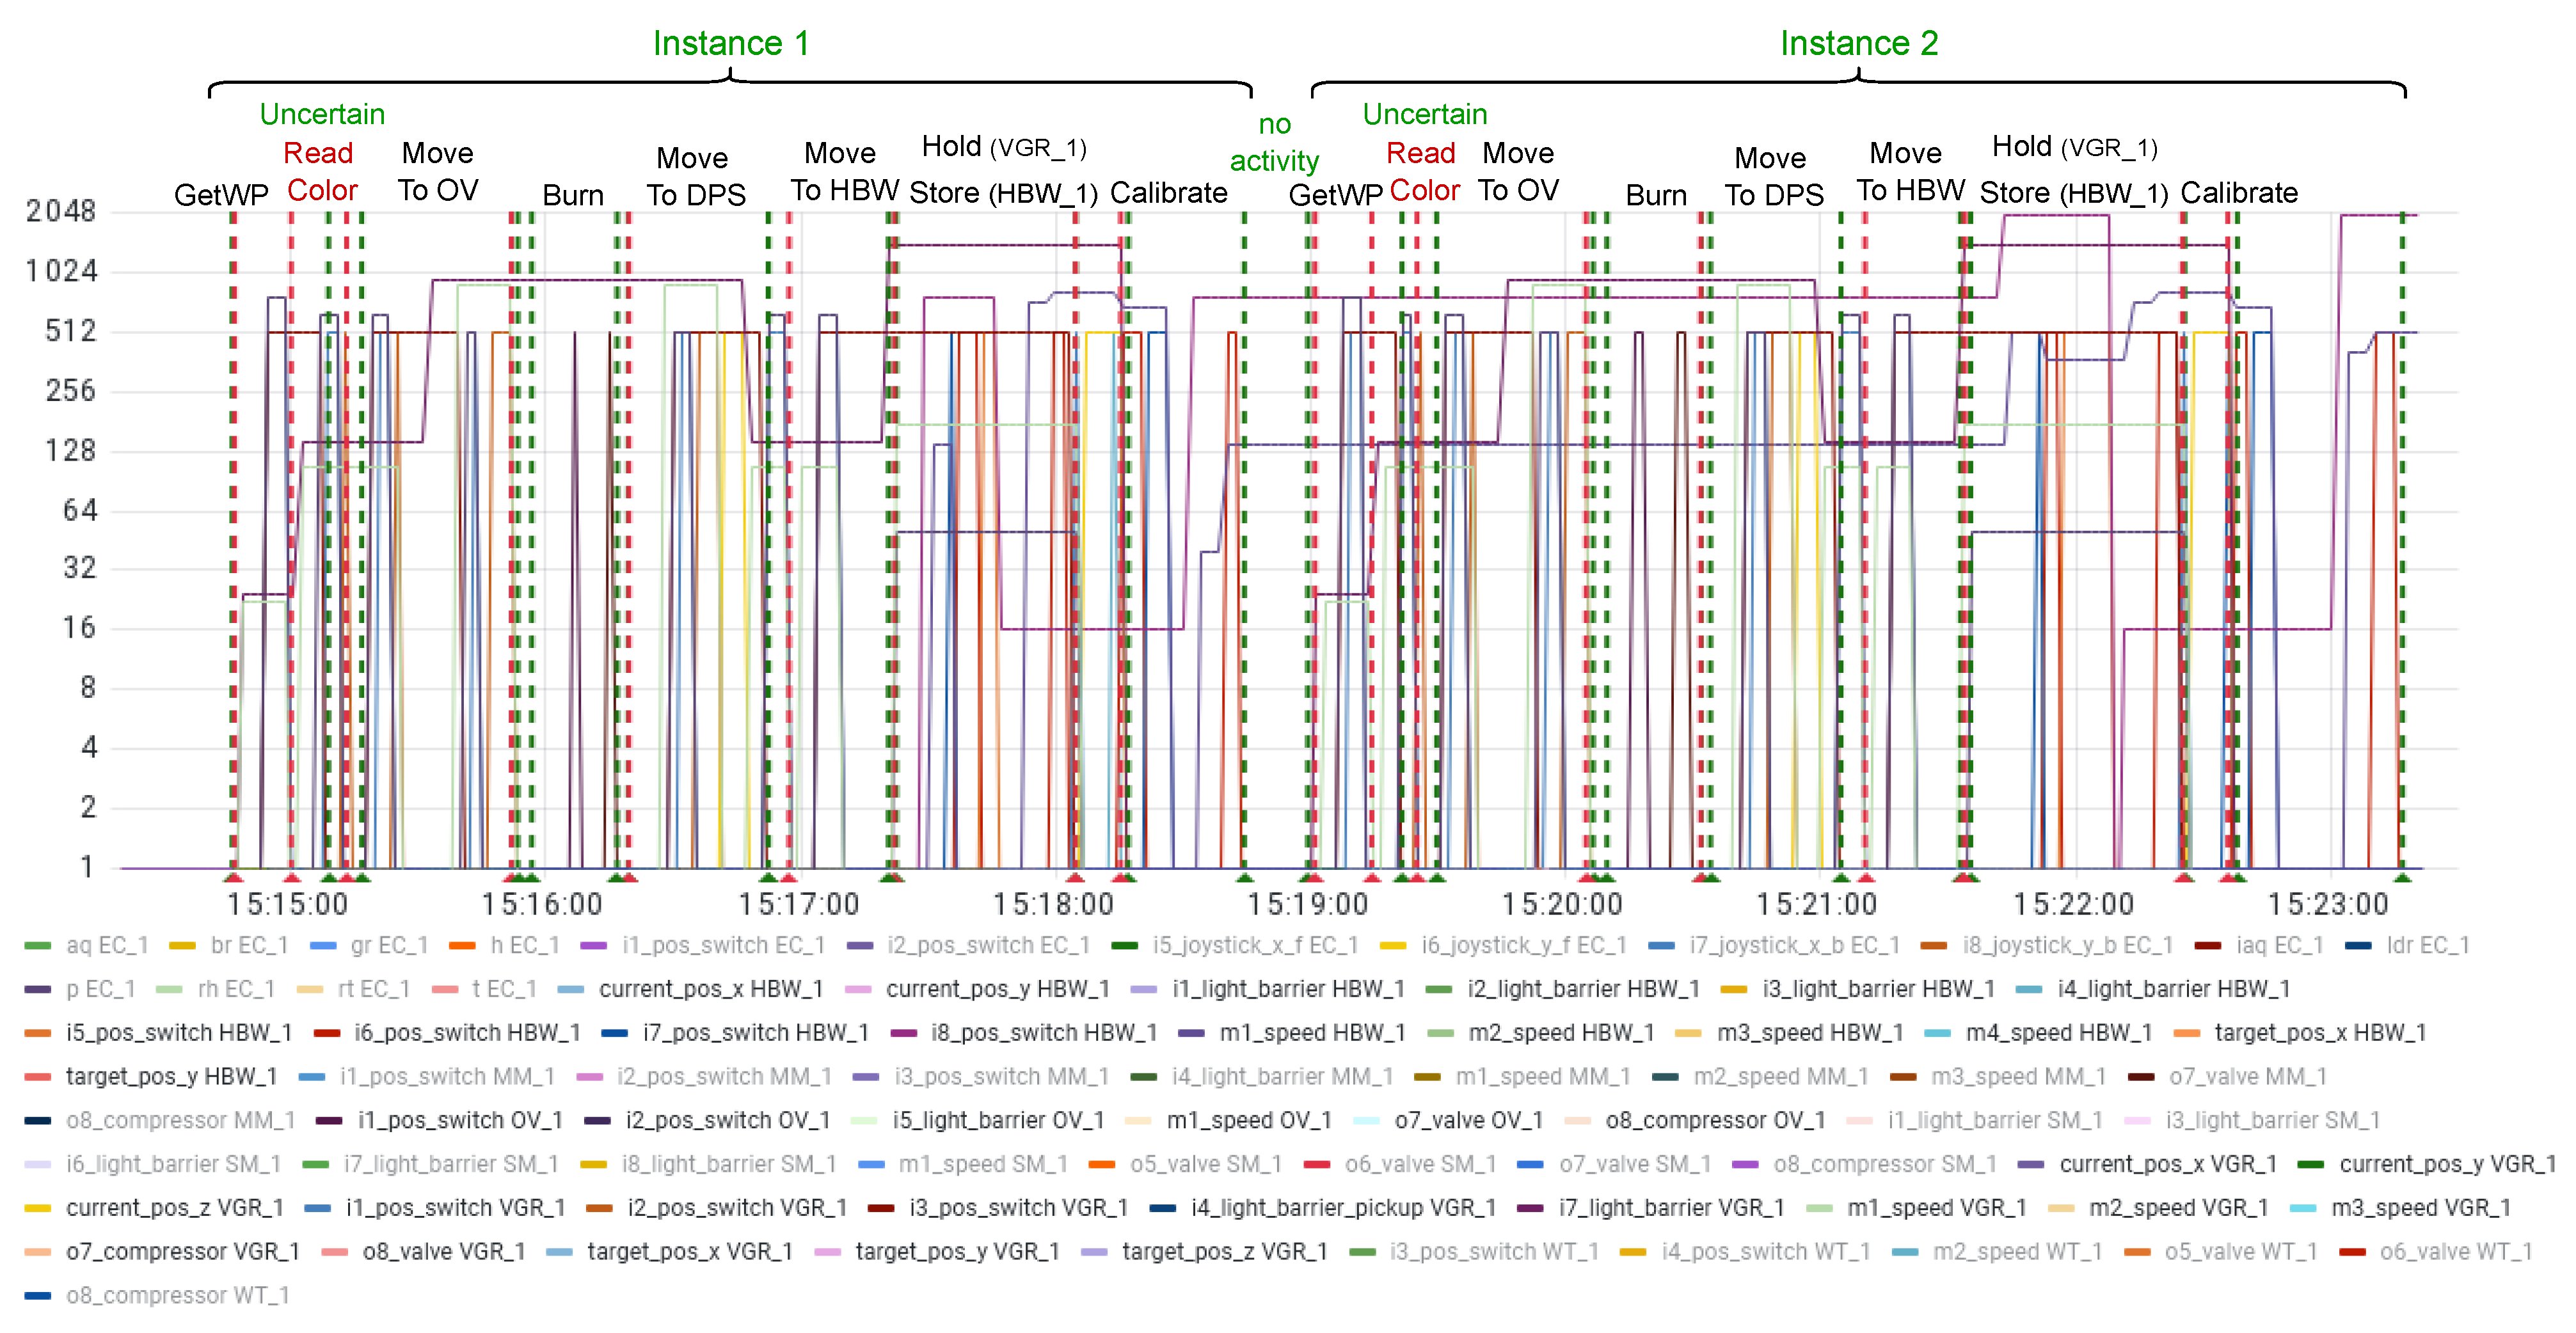
  • The execution of a process activity may not manifest itself directly in the IoT data. For example, the process activity Read Color only retrieves the current value of the color sensor. Thus, there may not be an explicit change in the sensor data visible and the execution not be detectable.
  • Based on the identified repeated sequences of activity executions and underlying assumptions (cf. Section 4.1), the analyst was able to recreate (discover) the process models for two different instances of the process (cf. Section 2.2.2).

5.4. Conclusions from Evaluation

The evaluation indicates that the proposed method is a viable approach for the detection of process activity executions and the discovery of process models from IoT data given basic knowledge about the domain and characteristics of the sensors and actuators. We noticed that changes within sensors and actuators can be linked to the execution of activities in the physical world. However, in our setup, the ground truth refers to the event log created by a BPM system that executed the activities. These activities are implemented via software in the form of web services [17], which may include additional computations and logic that cannot be observed in the IoT data and thus, may lead to a mismatch in the IoT data observations and events recorded by the BPM system [36].
It is relatively simple to determine the relevance of CPS components and time frames for the analysis of the data set and to identify similar activities based on the same signatures. Difficulties might emerge in finding the exact indicators for the start and end of activities and the right level of granularity of activities, especially in the case of several sensors and actuators involved. Nevertheless, as we observed during the evaluation, potential imprecision and ambiguities might be mitigated by considering the steps of the method not in a strict sequence. Indeed, we noticed that looking at both the process context and the already identified activities from other components (including the corresponding time stamps) helps to disambiguate specific uncertain parts of the data set. We also noticed that through annotation, the analyst incrementally acquires process knowledge, which then applies to facilitate further annotation steps. For instance, after having identified the Burn activity by the oven, it was possible for the analyst to annotate the subsequent activity at the vacuum gripper robot as Pickup from OV and transport to DPS.
The method does not enforce a particular order to follow for the selection of the relevant components to analyze (Step 4). However, the evaluation results suggest that it might be beneficial to start with CPS components with fewer sensors and actuators and exhibiting fewer change patterns. We observed that detecting activities for these components is easier and facilitates detecting activities for other components exhibiting more complex patterns, as these detected activities contribute to an incremental development of process knowledge and context to exploit in subsequent iterations of the method.

6. Discussion

Complementary to the discussion of the evaluation results and observations in Section 5, we elaborate on the potential for automation of the method’s steps, the applicability of the method in other IoT domains as well as its limitations in this section. A discussion of the research question and outcomes summarizes our findings.

6.1. Manual Annotations vs. Automated Labeling

The focus of our work is on providing an interactive method for the process analyst to conduct an initial analysis of unknown data sets from IoT for activity executions. In our elaborations, we have seen that expert knowledge and manual steps and decisions are vital in the early stages of data analysis. In Table 6, we summarize the role of the process analyst, domain knowledge, and the potential for automation in each step of the method (cf. Section 4).

6.2. Applicability of the Method in Other IoT Domains

We have derived the method for activity detection from IoT data based on the comprehensive, exploratory analysis of a data set from the domain of smart manufacturing. As seen in the example setup (cf. Section 2.2.1), CPS in this domain usually contain a rich set of sensors and actuators that generate low-level (raw) IoT data. This environment provides a suitable basis for deriving sensor/actuator patterns and an analysis method that is applicable more generally, which was the goal of our work. The patterns and their composition presented in Section 4.4.1 refer to sensors and actuators in general, which are not specific to the domain of smart manufacturing but can be found in every IoT domain [10]. The derived method addresses the analysis of data from sensors and actuators independent of a specific domain. Hence, we expect the method to be applicable in other IoT domains.
While the low-level IoT data in smart manufacturing is usually complemented by higher-level status and process information coming from the PLCs and MES that may help with the detection of automated process activities (cf. Section 2.2), other IoT domains (e.g., smart homes, smart offices, smart healthcare) only feature a smaller set of sensors and actuators that produce low-level IoT data. We expect that the proposed method and sensor/actuator patterns may prove to be even more valuable in these IoT domains relying only on a limited amount of sensors and actuators to enable the monitoring of activity executions. The application of the proposed method for activity detection in various case studies in other smart spaces remains subject to future work.

6.3. Assumptions and Limitations

With the proposed method we put focus on the detection of the sequence of activity executions, which are part of the control flow perspective. Other elements of a business process in this regard (e.g., decision points, events) or of other perspectives cannot be derived. However, we are also able to identify the resource (i.e., CPS component) that is responsible for the execution of an activity and its duration.
Formal Domain Knowledge: The proposed method relies on domain knowledge driving most of the steps. Here, we do not make any assumptions about such knowledge being formally encoded in some data structures but assume it resides in the mental model of the analyst. Clearly, this puts the burden of identifying concepts and relations solely on the analyst, which makes the method fully dependent on the analyst’s cognitive capabilities. This limitation could be mitigated by integrating a formal representation of the domain knowledge, e.g., in the form of an ontology, coupled with automated reasoning capabilities for knowledge inference and with the potential for automatic identification of patterns. With this integration, the analyst could receive guidance in several steps of the method, with benefits in particular in the case of complex CPS requiring the analysis of large volumes of data. We will move in this direction with future work.
Parallel Activity Executions: Some of the basic assumptions in our work are that the execution of an activity is limited to one CPS component at a time and that one CPS component does not execute multiple activities in parallel (cf. Section 4.1). These assumptions are reasonable in discrete manufacturing and many other IoT domains that show a lower degree of automation and less complex activities than, for example, in high-throughput manufacturing settings. This allows us to reliably define the scope of one executed activity based on IoT data and relate it to the corresponding CPS component. With these assumptions, our method can also be applied in the case of parallel activity executions by different CPS components. However, the correlation with the corresponding process instance(s) becomes more difficult and requires additional process knowledge and context. Relaxing the assumptions would require adjustments to the proposed method. In case a CPS component executes more than one activity at a time, we may observe an overlay of activity signatures (in case the activities are independent of each other regarding sensor/actuators), completely different activity signatures (in case they are dependent) or the same activity signature (e.g., in case of batch production). To distinguish these activities from each other requires additional information (e.g., case or object identifiers), process knowledge and context. In turn, the execution of one activity by multiple involved CPS components would lead to activity signatures that span across components (e.g., the lifting of a heavy workpiece by two robots). For the proposed method this means that Step 4 (cf. Section 4) needs to be extended to not only consider the currently selected CPS component but also other relevant CPS components to identify the start and end of an activity. These types of correlations among CPS components have to be derived either as part of the domain knowledge or calculated (e.g., using clustering techniques).
Data Set: The data set used in the running examples to develop the method contains data from simplified models of real production machines (CPS components) [6]. The number of sensors and actuators being active in the execution of activities per component is limited to a maximum of 16, often less than only three or four sensors/actuators are relevant for activity signatures. This rather low number of sensors and actuators emitting data at a relatively low frequency (once per second) makes the interactive, visual analysis feasible for the process analyst. As such it is representative of use cases and settings in other IoT domains where the number of available sensors and actuators and the frequency of emitted data is in similar ranges. Industry-grade production machines and more complex CPS (e.g., smart cars) produce several magnitudes more of low-level IoT data from sensors and actuators [49,69]. A visual analysis of this data would require multiple pre-processing steps to reach an amount of data and level of granularity suitable for our proposed method to be applied. This is closely linked to the decision about a suitable granularity level of activities that should be detected and the subsequent analysis steps. In our work, we assume that after the successful analysis and labeling of a given IoT data set, we can derive an event log from the activity annotations that is suitable for process mining tasks [3]. Thus, the subsequent analysis would focus on rather high-level, coarse-grained activities in the context of business processes rather than on low-level control processes in CPS [17,70].

6.4. Summary of Discussions

To summarize the discussions, we explicitly address the research question introduced in Section 1 that guided the development of the data analysis method to increase the process awareness of IoT data by identifying activity executions (cf. Section 2.1). The research question asks for necessary steps to analyze a given IoT data set with the goal of finding a sequence of process activity executions. Following the visual information-seeking mantra, we have derived a general 8-step analysis method from a given, comprehensive IoT data set (cf. Section 4). In essence, the CPS components have to be evaluated regarding their relevance in the process executions, and then specific patterns indicating the start and end of activity have to be found within the sensors and actuator values (represented as time series) of the relevant CPS components. From the evaluation of applying the developed method to an unknown data set, we have learned that the steps of the method should guide the data analysis, but do not represent a strict sequence that should be followed. Cross-references with already identified activities in other CPS components and iterations in the detection of activity boundaries help with the disambiguation of activities and specification of activity start and end more precisely. During the analysis, the process analyst gains additional process knowledge and develops an increasing understanding of the executed processes, which helps in refining the detected activities.
The developed method is useful for activity detection in IoT domains that feature a manageable amount of sensors and actuators emitting low-level IoT data at a frequency that is reasonable for a data analyst to perform a visual analysis (cf. Section 6.2 and Section 6.3). In deriving the analysis method, we explicitly focused on the post-mortem analysis of IoT data for building a knowledge base regarding the activity–IoT data correlations. In the initial phases of data analysis, many steps rely on domain expertise and manual decisions regarding the relevance of components, correlations and domain-specific patterns among sensors and actuators as well as granularity and labels of activities (cf. Table 6). Once a sufficient part of the data set was labeled with identified activity executions, this knowledge can be used as ground truth to increase the levels of (supervised) automation for all steps significantly. The newly introduced concept of activity signatures that contain the sequence of sensor/actuator values as time series within the boundaries of an identified, labeled activity facilitates this automation. Using the derived patterns and correlations that are part of the knowledge base, we are also able to move into the detection of activity executions at runtime, which will be part of our future work.

7. Conclusions and Future Work

In this work, we investigated the aspect of deriving process-related knowledge from a given IoT data set consisting of sensor and actuator readings. Based on the assumption that no central BPM system is available to orchestrate or monitor the execution of processes in typical IoT environments, we focus on the manual detection of the sequence of executed activities in an IoT data set by a process analyst. Following the well-known visual information seeking mantra [62] in conducting an exploratory analysis of a data set from the domain of smart manufacturing, we developed a structured interactive method that is generally applicable to analyze unknown IoT data sets containing time series of sensor/actuator readings. As part of the method, we provide guidelines for determining the relevance of CPS components regarding activity executions, for finding typical patterns in sensors and actuators that may indicate the start or end of activity, and the novel concept of activity signatures to identify similar activities. In a proof of concept evaluation, we were able to show that the developed method is suitable to guide the process analyst in activity identification and in building an increasing understanding of the correlations among activities and processes from low-level IoT data in an iterative manner. The method is very useful in the early stages of analyzing unknown IoT data assuming only knowledge about the characteristics of sensors, actuators and the corresponding CPS is given. Following the method, the process analyst is able to identify and label activity executions in the data set to build a ground truth for the automatic detection of activity executions in the same IoT environment in later stages and large data sets. Once a given data set from an IoT domain was labeled with start and end events representing the boundaries of process activities following the proposed method, traditional process mining techniques can be applied to analyze the process executions.
In future work, we will investigate the applicability of the developed method in case studies and user studies within other typical IoT domains (e.g., smart healthcare). We will also focus on increasing the automation levels of specific steps, especially the search for similarities of unknown parts in an IoT data set with identified activities (e.g., using dynamic time warping, case-based reasoning, rule mining, and other supervised machine learning techniques). While the method presented in this work addresses the post-mortem analysis of a given, unknown IoT data set, we will increasingly move towards an online analysis of low-level IoT data streams for activity detection using the derived sensor-actuator-activity patterns in CEP with the goal of enabling online conformance checking [2].

Author Contributions

Conceptualization: R.S., M.F. and B.W.; methodology: R.S.; software: R.S.; validation: R.S., M.F. and B.W.; resources: R.S.; data curation: R.S.; writing—original draft preparation: R.S. and M.F.; writing—review and editing: M.F. and B.W.; visualization: R.S. All authors have read and agreed to the published version of the manuscript.

Funding

This work has received funding from the Swiss National Science Foundation under Grant No. IZSTZ0_208497 (ProAmbitIon project).

Data Availability Statement

The data set of the running example is publicly available [6].

Conflicts of Interest

The authors declare no conflict of interest.

Abbreviations

The following abbreviations are used in this manuscript:
ASActivity Signature
BPMBusiness Process Management
BPMNBusiness Process Model and Notation
CEPComplex Event Processing
CPSCyber–Physical Systems
IoTInternet of Things
JSONJavaScript Object Notation
MESManufacturing Execution Systems
MQTTMessage Queuing Telemetry Transport
PLCProgrammable Logic Controllers
RGBRed Green Blue

References

  1. Janiesch, C.; Koschmider, A.; Mecella, M.; Weber, B.; Burattin, A.; Di Ciccio, C.; Fortino, G.; Gal, A.; Kannengiesser, U.; Leotta, F.; et al. The Internet of Things meets business process management: A manifesto. IEEE Syst. Man. Cybern. Mag. 2020, 6, 34–44. [Google Scholar] [CrossRef]
  2. Seiger, R.; Zerbato, F.; Burattin, A.; García-Bañuelos, L.; Weber, B. Towards iot-driven process event log generation for conformance checking in smart factories. In Proceedings of the 2020 IEEE 24th International Enterprise Distributed Object Computing Workshop (EDOCW), Eindhoven, The Netherlands, 5 October 2020; pp. 20–26. [Google Scholar]
  3. Dumas, M.; La Rosa, M.; Mendling, J.; Reijers, H.A. Fundamentals of Business Process Management; Springer: Berlin/Heidelberg, Germany, 2018. [Google Scholar]
  4. Janssen, D.; Mannhardt, F.; Koschmider, A.; van Zelst, S.J. Process Model Discovery from Sensor Event Data. In Proceedings of the Process Mining Workshops, Padua, Italy, 5–8 October 2020; pp. 69–81. [Google Scholar]
  5. Weyers, F.; Seiger, R.; Weber, B. Method to Identify Process Activities by Visualizing Sensor Events. In Proceedings of the Business Process Management Workshops, Münster, Germany, 11–16 September 2022. [Google Scholar]
  6. Seiger, R. Data Set from Fischertechnik Smart Factory Model at University of St. Gallen [Data Set]. 2022. Available online: https://doi.org/10.5281/zenodo.7440490 (accessed on 22 January 2023).
  7. Lee, E.A. Cyber Physical Systems: Design Challenges. In Proceedings of the 2008 11th IEEE International Symposium on Object and Component-Oriented Real-Time Distributed Computing (ISORC), Orlando, FL, USA, 5–7 May 2008; pp. 363–369. [Google Scholar]
  8. Ashton, K. That ‘internet of things’ thing. RFID J. 2009, 22, 97–114. [Google Scholar]
  9. Atzori, L.; Iera, A.; Morabito, G. The Internet of Things: A survey. Comput. Netw. 2010, 54, 2787–2805. [Google Scholar] [CrossRef]
  10. Bauer, M.; Bui, N.; Loof, J.D.; Magerkurth, C.; Nettsträter, A.; Stefa, J.; Walewski, J.W. IoT reference model. In Enabling Things to Talk: Designing IoT Solutions with the IoT Architectural Reference Model; Springer: Berlin/Heidelberg, Germany, 2013; pp. 113–162. [Google Scholar]
  11. Rinderle-Ma, S.; Mangler, J. Process Automation and Process Mining in Manufacturing. In Proceedings of the Business Process Management; Polyvyanyy, A., Wynn, M.T., Van Looy, A., Reichert, M., Eds.; Springer International Publishing: Cham, Switzerland, 2021; pp. 3–14. [Google Scholar]
  12. Bertrand, Y.; De Weerdt, J.; Serral, E. A Bridging Model for Process Mining and IoT. In Proceedings of the Process Mining Workshops; Munoz-Gama, J., Lu, X., Eds.; Springer International Publishing: Cham, Switzerland, 2022; pp. 98–110. [Google Scholar]
  13. Gallik, F.; Kirikkayis, Y.; Reichert, M. Modeling, Executing and Monitoring IoT-Aware Processes with BPM Technology. In Proceedings of the 2022 International Conference on Service Science (ICSS), Zhuhai, China, 13–15 May 2022; pp. 96–103. [Google Scholar]
  14. Grüger, J.; Malburg, L.; Mangler, J.; Bertrand, Y.; Rinderle-Ma, S.; Bergmann, R.; Asensio, E.S. SensorStream: An XES Extension for Enriching Event Logs with IoT-Sensor Data. arXiv 2022, arXiv:2206.11392. [Google Scholar] [CrossRef]
  15. Kusiak, A. Smart manufacturing. Int. J. Prod. Res. 2018, 56, 508–517. [Google Scholar] [CrossRef]
  16. Yang, H.; Kumara, S.; Bukkapatnam, S.T.; Tsung, F. The internet of things for smart manufacturing: A review. IISE Trans. 2019, 51, 1190–1216. [Google Scholar] [CrossRef]
  17. Seiger, R.; Malburg, L.; Weber, B.; Bergmann, R. Integrating process management and event processing in smart factories: A systems architecture and use cases. J. Manuf. Syst. 2022, 63, 575–592. [Google Scholar] [CrossRef]
  18. Monostori, L. Cyber-physical production systems: Roots, expectations and R&D challenges. Procedia Cirp 2014, 17, 9–13. [Google Scholar]
  19. Traganos, K.; Grefen, P.; Vanderfeesten, I.; Erasmus, J.; Boultadakis, G.; Bouklis, P. The HORSE framework: A reference architecture for cyber-physical systems in hybrid smart manufacturing. J. Manuf. Syst. 2021, 61, 461–494. [Google Scholar] [CrossRef]
  20. Lenz, J.; Pelosi, V.; Taisch, M.; MacDonald, E.; Wuest, T. Data-driven context awareness of smart products in discrete smart manufacturing systems. Procedia Manuf. 2020, 52, 38–43. [Google Scholar] [CrossRef]
  21. Leotta, F.; Mecella, M.; Mendling, J. Applying Process Mining to Smart Spaces: Perspectives and Research Challenges. In Proceedings of the Advanced Information Systems Engineering Workshops; Persson, A., Stirna, J., Eds.; Springer International Publishing: Cham, Switzerland, 2015; pp. 298–304. [Google Scholar]
  22. Fischertechnik. Didactic Material Training Factory Industry 4.0 Englisch: Activity Booklet; Fischertechnik: Waldachtal, Germany, 2019. [Google Scholar]
  23. OMG. Business Process Model and Notation (BPMN), Version 2.0; OMG: Needham, MA, USA, 2011. [Google Scholar]
  24. Chang, C.; Srirama, S.N.; Buyya, R. Mobile Cloud Business Process Management System for the Internet of Things: A Survey. ACM Comput. Surv. 2016, 49, 70. [Google Scholar] [CrossRef] [Green Version]
  25. Torres, V.; Serral, E.; Valderas, P.; Pelechano, V.; Grefen, P. Modeling of iot devices in business processes: A systematic mapping study. In Proceedings of the 2020 IEEE 22nd Conference on Business Informatics (CBI), Antwerp, Belgium, 22–24 June 2020; Volume 1, pp. 221–230. [Google Scholar]
  26. Hasić, F.; Serral, E.; Snoeck, M. Comparing BPMN to BPMN + DMN for IoT Process Modelling: A Case-Based Inquiry. In Proceedings of the SAC’20: 35th Annual ACM Symposium on Applied Computing, Brno, Czech Republic, 30 March–3 April 2020; pp. 53–60. [Google Scholar]
  27. Valderas, P.; Torres, V.; Serral, E. Modelling and executing IoT-enhanced business processes through BPMN and microservices. Syst. Softw. 2022, 184, 111139. [Google Scholar] [CrossRef]
  28. Hasić, F.; Asensio, E.S. Executing IoT Processes in BPMN 2.0: Current Support and Remaining Challenges. In Proceedings of the 2019 13th International Conference on Research Challenges in Information Science (RCIS), Brussels, Belgium, 29–31 May 2019; pp. 1–6. [Google Scholar]
  29. Marrella, A.; Mecella, M.; Sardina, S. Intelligent Process Adaptation in the SmartPM System. ACM Trans. Intell. Syst. Technol. 2016, 8, 25. [Google Scholar] [CrossRef] [Green Version]
  30. Schönig, S.; Ackermann, L.; Jablonski, S.; Ermer, A. IoT meets BPM: A bidirectional communication architecture for IoT-aware process execution. Softw. Syst. Model. 2020, 19, 1443–1459. [Google Scholar] [CrossRef] [Green Version]
  31. Valderas, P.; Torres, V.; Serral, E. Towards an Interdisciplinary Development of IoT-Enhanced Business Processes. Bus. Inf. Syst. Eng. 2022, 65, 25–48. [Google Scholar] [CrossRef]
  32. Kirikkayis, Y.; Gallik, F.; Reichert, M. Modeling, Executing and Monitoring IoT-Driven Business Rules with BPMN and DMN: Current Support and Challenges. In Proceedings of the Enterprise Design, Operations, and Computing; Almeida, J.P.A., Karastoyanova, D., Guizzardi, G., Montali, M., Maggi, F.M., Fonseca, C.M., Eds.; Springer International Publishing: Cham, Switzerland, 2022; pp. 111–127. [Google Scholar]
  33. Wei, J.; Ouyang, C.; ter Hofstede, A.H.M.; Moreira, C. Amoretto: A Method for Deriving IoT-enriched Event Logs. arXiv 2022, arXiv:2212.02071. [Google Scholar] [CrossRef]
  34. Diba, K.; Batoulis, K.; Weidlich, M.; Weske, M. Extraction, correlation, and abstraction of event data for process mining. Wiley Interdiscip. Rev. Data Min. Knowl. Discov. 2020, 10, e1346. [Google Scholar] [CrossRef]
  35. Hoppenstedt, B.; Pryss, R.; Stelzer, B.; Meyer-Brötz, F.; Kammerer, K.; Treß, A.; Reichert, M. Techniques and emerging trends for state of the art equipment maintenance systems—a bibliometric analysis. Appl. Sci. 2018, 8, 916. [Google Scholar] [CrossRef] [Green Version]
  36. Seiger, R.; Huber, S.; Heisig, P.; Aßmann, U. Toward a framework for self-adaptive workflows in cyber-physical systems. Softw. Syst. Model. 2019, 18, 1117–1134. [Google Scholar] [CrossRef]
  37. Rebmann, A.; Emrich, A.; Fettke, P. Enabling the Discovery of Manual Processes Using a Multi-modal Activity Recognition Approach. In Proceedings of the Business Process Management Workshops, Vienna, Austria, 1–6 September 2019; Volume 362, pp. 130–141. [Google Scholar]
  38. Cornacchia, M.; Ozcan, K.; Zheng, Y.; Velipasalar, S. A Survey on Activity Detection and Classification Using Wearable Sensors. IEEE Sens. J. 2017, 17, 386–403. [Google Scholar] [CrossRef]
  39. Garcia-Ceja, E.; Brena, R.F. Activity Recognition Using Community Data to Complement Small Amounts of Labeled Instances. Sensors 2016, 16, 877. [Google Scholar] [CrossRef] [PubMed] [Green Version]
  40. Esposito, L.; Leotta, F.; Mecella, M.; Veneruso, S. Unsupervised Segmentation of Smart Home Logs for Human Habit Discovery. In Proceedings of the 2022 18th International Conference on Intelligent Environments (IE), Biarritz, France, 20–23 June 2022; pp. 1–8. [Google Scholar]
  41. Di Federico, G.; Nikolajsen, E.R.; Azam, M.; Burattin, A. Linac: A Smart Environment Simulator of Human Activities. In Proceedings of the International Conference on Process Mining, Eindhoven, The Netherlands, 31 October–4 November 2021; pp. 60–72. [Google Scholar]
  42. Mannhardt, F.; Bovo, R.; Oliveira, M.F.; Julier, S. A Taxonomy for Combining Activity Recognition and Process Discovery in Industrial Environments. In Proceedings of the Intelligent Data Engineering and Automated Learning (IDEAL 2018), Madrid, Spain, 21–23 November 2018; Volume 11315, pp. 84–93. [Google Scholar]
  43. Jans, M.; Soffer, P.; Jouck, T. Building a valuable event log for process mining: An experimental exploration of a guided process. Ent. Inf. Syst. 2019, 13, 601–630. [Google Scholar] [CrossRef]
  44. Bertrand, Y.; Van den Abbeele, B.; Veneruso, S.; Leotta, F.; Mecella, M.; Serral Asensio, E. A Survey on the Application of Process Mining on Smart Spaces Data; Lecture Notes in Business Information Processing; Springer: Berlin/Heidelberg, Germany, 2022. [Google Scholar]
  45. Stertz, F.; Rinderle-Ma, S.; Mangler, J. Analyzing Process Concept Drifts Based on Sensor Event Streams During Runtime. In Proceedings of the Business Process Management; Fahland, D., Ghidini, C., Becker, J., Dumas, M., Eds.; Springer International Publishing: Cham, Switzerland, 2020; pp. 202–219. [Google Scholar]
  46. Koschmider, A.; Janssen, D.; Mannhardt, F. Framework for Process Discovery from Sensor Data. In Proceedings of the 10th International Workshop on Enterprise Modeling and Information Systems Architectures, Kiel, Germany, 14–15 May 2020; pp. 32–38. [Google Scholar]
  47. Ehrendorfer, M.; Fassmann, J.A.; Mangler, J.; Rinderle-Ma, S. Conformance checking and classification of manufacturing log data. In Proceedings of the 2019 IEEE 21st Conference on Business Informatics (CBI), Moscow, Russia, 15–17 July 2019; Volume 1, pp. 569–577. [Google Scholar]
  48. Beerepoot, I.; Di Ciccio, C.; Reijers, H.A.; Rinderle-Ma, S.; Bandara, W.; Burattin, A.; Calvanese, D.; Chen, T.; Cohen, I.; Depaire, B.; et al. The biggest business process management problems to solve before we die. Comput. Ind. 2023, 146, 103837. [Google Scholar] [CrossRef]
  49. Kammerer, K.; Pryss, R.; Hoppenstedt, B.; Sommer, K.; Reichert, M. Process-driven and flow-based processing of industrial sensor data. Sensors 2020, 20, 5245. [Google Scholar] [CrossRef]
  50. Soffer, P.; Hinze, A.; Koschmider, A.; Ziekow, H.; Di Ciccio, C.; Koldehofe, B.; Kopp, O.; Jacobsen, A.; Sürmeli, J.; Song, W. From event streams to process models and back: Challenges and opportunities. Inf. Syst. 2019, 81, 181–200. [Google Scholar] [CrossRef] [Green Version]
  51. Folino, F.; Guarascio, M.; Pontieri, L. Mining predictive process models out of low-level multidimensional logs. In Proceedings of the Advanced Information Systems Engineering: 26th International Conference, CAiSE 2014, Thessaloniki, Greece, 16–20 June 2014; pp. 533–547. [Google Scholar]
  52. Tax, N.; Sidorova, N.; Haakma, R.; van der Aalst, W.M. Event abstraction for process mining using supervised learning techniques. In Proceedings of the SAI Intelligent Systems Conference, London, UK, 21–22 September 2016; pp. 251–269. [Google Scholar]
  53. Wanner, J.; Herm, L.V.; Janiesch, C. Countering the Fear of Black-boxed AI in Maintenance: Towards a Smart Colleague. In Proceedings of the 2019 Pre-ICIS SIGDSA Symposium, Munich, Germany, 14–15 December 2019. [Google Scholar]
  54. van Zelst, S.J.; Mannhardt, F.; de Leoni, M.; Koschmider, A. Event abstraction in process mining: Literature review and taxonomy. Granul. Comput. 2021, 6, 719–736. [Google Scholar] [CrossRef]
  55. Baier, T.; Mendling, J.; Weske, M. Bridging abstraction layers in process mining. Inf. Syst. 2014, 46, 123–139. [Google Scholar] [CrossRef] [Green Version]
  56. Van Der Aa, H.; Leopold, H.; Reijers, H.A. Efficient process conformance checking on the basis of uncertain event-to-activity mappings. IEEE Trans. Knowl. Data Eng. 2019, 32, 927–940. [Google Scholar] [CrossRef]
  57. Senderovich, A.; Rogge-Solti, A.; Gal, A.; Mendling, J.; Mandelbaum, A. The ROAD from Sensor Data to Process Instances via Interaction Mining. In Proceedings of the International Conference on Advanced Information Systems Engineering (CAiSE), Stockholm, Sweden, 13–17 June 2016; Volume 9097, pp. 257–273. [Google Scholar]
  58. Mannhardt, F.; de Leoni, M.; Reijers, H.A.; van der Aalst, W.M.P.; Toussaint, P.J. From Low-Level Events to Activities—A Pattern-Based Approach. In Proceedings of the International Conference on Business Process Management (BPM), Rio de Janeiro, Brazil, 18–22 September 2016; Volume 9850, pp. 125–141. [Google Scholar]
  59. Mottola, L.; Picco, G.P.; Oppermann, F.J.; Eriksson, J.; Finne, N.; Fuchs, H.; Gaglione, A.; Karnouskos, S.; Montero, P.M.; Oertel, N.; et al. makeSense: Simplifying the Integration of Wireless Sensor Networks into Business Processes. IEEE Trans. Softw. Eng. 2019, 45, 576–596. [Google Scholar] [CrossRef] [Green Version]
  60. Mangler, J.; Pauker, F.; Rinderle-Ma, S.; Ehrendorfer, M. centurio.work—Industry 4.0 Integration Assessment and Evolution. In Proceedings of the 17th Int’l Conference on Business Process Management, Vienna, Austria, 1–6 September 2019; pp. 106–117.
  61. Tukey, J.W. Exploratory Data Analysis; Addison-Wesley Series in Behavioral Science; Quantitative Methods: Reading, MA, USA, 1977; Volume 2. [Google Scholar]
  62. Shneiderman, B. The eyes have it: A task by data type taxonomy for information visualizations. In The Craft of Information Visualization; Elsevier: Amsterdam, The Netherlands, 2003; pp. 364–371. [Google Scholar]
  63. Barricelli, B.R.; Valtolina, S. A visual language and interactive system for end-user development of internet of things ecosystems. J. Vis. Lang. Comput. 2017, 40, 1–19. [Google Scholar] [CrossRef]
  64. Klein, P.; Malburg, L.; Bergmann, R. FTOnto: A Domain Ontology for a Fischertechnik Simulation Production Factory by Reusing Existing Ontologies. In Proceedings of the Conference “Lernen, Wissen, Daten, Analysen” (LWDA), Berlin, Germany, 30 September–2 October 2019; pp. 253–264. [Google Scholar]
  65. Sjarov, M.; Lechler, T.; Fuchs, J.; Brossog, M.; Selmaier, A.; Faltus, F.; Donhauser, T.; Franke, J. The Digital Twin Concept in Industry—A Review and Systematization. In Proceedings of the 2020 25th IEEE International Conference on Emerging Technologies and Factory Automation (ETFA), Vienna, Austria, 8–11 September 2020; Volume 1, pp. 1789–1796. [Google Scholar]
  66. Kirchhof, J.C.; Michael, J.; Rumpe, B.; Varga, S.; Wortmann, A. Model-Driven Digital Twin Construction: Synthesizing the Integration of Cyber-Physical Systems with Their Information Systems. In Proceedings of the MODELS ’20: 23rd ACM/IEEE International Conference on Model Driven Engineering Languages and Systems, Virtual Event, Canada, 16–23 October 2020; pp. 90–101. [Google Scholar]
  67. Serrà, J.; Arcos, J.L. An empirical evaluation of similarity measures for time series classification. Knowl.-Based Syst. 2014, 67, 305–314. [Google Scholar] [CrossRef] [Green Version]
  68. Lee, W.L.J.; Burattin, A.; Munoz-Gama, J.; Sepúlveda, M. Orientation and conformance: A HMM-based approach to online conformance checking. Inf. Syst. 2021, 102, 101674. [Google Scholar] [CrossRef]
  69. Pauker, F.; Mangler, J.; Rinderle-Ma, S.; Pollak, C. centurio.work—Modular Secure Manufacturing Orchestration. In Proceedings of the BPM Industry Track, Sydney, Australia, 9–14 September 2018; pp. 164–171.
  70. Furrer, F.J. Cyber-Physical Systems. In Safety and Security of Cyber-Physical Systems: Engineering Dependable Software Using Principle-Based Development; Springer Fachmedien Wiesbaden: Wiesbaden, Germany, 2022; pp. 9–76. [Google Scholar]
Figure 1. UML class diagram of BPM–CPS concepts serving as basis for our work (adapted from [5]).
Futureinternet 15 00077 g001
Figure 2. Components and layout of the smart factory model, partially adapted from [22] with permission.
Futureinternet 15 00077 g002
Figure 3. Storage process model in BPMN 2.0.
Futureinternet 15 00077 g003
Figure 4. Production process model in BPMN 2.0.
Futureinternet 15 00077 g004
Figure 5. Plotof IoT data containing all sensors and actuators of all CPS components over time.
Futureinternet 15 00077 g005
Figure 6. IoT data filtered by the WT_1 (Workstation Transport) component.
Futureinternet 15 00077 g006
Figure 7. IoT data filtered by the HBW_1 (High-bay Warehouse) component.
Futureinternet 15 00077 g007
Figure 8. IoT data filtered by the VGR_1 (Vacuum Gripper Robot) component.
Futureinternet 15 00077 g008
Figure 9. IoT data filtered by the EC_1 (Environment and Camera) component.
Futureinternet 15 00077 g009
Figure 10. Details of the IoT data filtered by the WT_1 component with manual annotations.
Futureinternet 15 00077 g010
Figure 11. Details of a part of IoT data filtered by the HBW_1 component with annotations.
Futureinternet 15 00077 g011
Figure 12. First part of IoT data filtered by the VGR_1 component with manual annotations.
Futureinternet 15 00077 g012
Figure 13. Activity Signature for Transport from Oven to Milling executed by WT_1.
Futureinternet 15 00077 g013
Figure 14. Activity Signature for Get Workpiece from Pickup executed by VGR_1.
Futureinternet 15 00077 g014
Figure 15. Similar activities found for VGR_1 component.
Futureinternet 15 00077 g015
Figure 16. Similar activities found for HBW_1 component.
Futureinternet 15 00077 g016
Figure 17. All data (except irrelevant EC1 component) with activity and process annotations.
Futureinternet 15 00077 g017
Figure 18. Derived method for detecting activity executions from IoT data.
Futureinternet 15 00077 g018
Figure 19. Plot of IoT data set used in evaluation.
Futureinternet 15 00077 g019
Figure 20. Process model (in BPMN 2.0) used for evaluation.
Futureinternet 15 00077 g020
Figure 21. Evaluation IoT data set labeled by the analyst (green), BPM system (red) or both (black).
Futureinternet 15 00077 g021
Table 1. Sensors and actuators of CPS components in the smart factory simulation model.
TypeNameDeviceMeasurementRange
Sensori{x}_pos_switchposition switchbinary{0, 1}
Sensori{x}_light_barrierlight barrierbinary{0, 1}
Sensori{x}_color_sensorcolor sensordiscrete{blue, white, red}
Actuatoro{x}_valvevalvebinary{0, 1}
Actuatoro{x}_compressorcompressordiscrete[0 .. 512]
Actuatorm{x}_speedmotordiscrete[−512 .. 512]
Table 2. Sensors and actuators of the WT_1 (Workstation Transport) component.
TypeNameDeviceMeasurementRange
Sensori3_pos_switchposition switchbinary{0, 1}
Sensori4_pos_switchposition switchbinary{0, 1}
Actuatoro5_valvevalvebinary{0, 1}
Actuatoro6_valvevalvebinary{0, 1}
Actuatoro8_compressorcompressordiscrete[0 .. 512]
Actuatorm2_speedmotordiscrete[−512 .. 512]
Table 3. Relevance of CPS components for the different (time-related) parts of the data set.
CPS ComponentRelevance Part 1 (18:40–18:53)Relevance Part 2 (18:53–19:07)
VGR_1XX
HBW_1XX
OV_1X
MM_1X
WT_1X
SM_1X
EC_1
Table 4. Change patterns of single sensors and actuators and possible interpretations.
DeviceChange PatternInterpretationExample
Sensor0 → xStart or Endlight barrier interrupted
Sensorx → 0Start or Endposition switch released
Sensorx → yDomain Knowledgecolor changed
Actuator0 → xStartmotor started
Actuatorx → 0Endcompressor off
Actuatorx → yDomain Knowledgeposition reached
Table 5. Relevance of CPS components for the given IoT data set.
CPSPart 1Part 2Part 3Part 4Part 5Part 6Part 7
Component(15:14:46–15:15:53)(15:15:53–15:16:25)(15:16:25–15:18:46)(15:18:46–15:19:00)(15:19:00–15:20:04)(15:20:04–15:20:38)(15:20:38–15:23:18)
VGR_1XXXX
HBW_1XX
OV_1XX
MM_1
WT_1
SM_1
EC_1
Table 6. Manual steps in the method and automation potential.
StepAnalyst DecisionDomain
Knowledge
Automation Potential
1: Visualize all IoT data over timenot necessary (only to support the analyst)
2: Identify relevant CPS components and time framesrelevance of CPS componentscharacteristics of CPS components, sensors and actuators; process knowledgehigh: detect areas of sensor/actuator changes
limitations: irrelevant CPS components with sensor/actuator changes
3: Filter by CPS component and time framefull automation
4: Find activity start and
end patterns
start and end pattern of activities; level of granularity; activity labelcharacteristics of CPS components, sensors and actuators; process knowledgelow: find general patterns (cf. Table 4), calculate sensor/actuator dependencies for new patterns
limitations: interpretation of calculated dependencies, domain-specific patterns, unknown level of activity granularity and activity labels, insufficient IoT data
5: Determine activity signaturefull automation
6: Find and label similar activitiessimilarity thresholdprocess knowledgevery high: find similarities in time series data
limitations: varying similarity thresholds, ambiguities of activity labels
7: Visualize all detected activitiesnot necessary (only to support the analyst)
8: Find repeated activity sequencesloops; start and end of one process instance; activity–instance correlationprocess knowledgehigh: find repeated sequences
limitation: activity–instance correlation
Disclaimer/Publisher’s Note: The statements, opinions and data contained in all publications are solely those of the individual author(s) and contributor(s) and not of MDPI and/or the editor(s). MDPI and/or the editor(s) disclaim responsibility for any injury to people or property resulting from any ideas, methods, instructions or products referred to in the content.

