1. Introduction
Microservice architectures, i.e., applications structured as a collection of small and autonomous but collaborating services [
1], are a popular style for building cloud-native applications. Companies such as Amazon, Netflix, Deutsche Telekom, LinkedIn, SoundCloud, Uber, and Verizon have been quick in adopting this architectural style [
2]. As a result, it has become, in many ways, the de facto architectural style for the design and deployment of modern large-scale web applications. Containerization and orchestration solutions such as Docker (
https://www.docker.com/ (accessed on 1 December 2022)), Kubernetes (
https://kubernetes.io/ (accessed on 1 December 2022)), and Nomad (
https://www.nomadproject.io/ (accessed on 1 December 2022)) are the foundational technologies for automatically deploying, scaling, and managing microservice applications on the cloud. Empowered by adopting these solutions, the application infrastructure usually ends up spanning multiple hardware devices across physical locations and potentially across multiple cloud service providers and is managed independently from the application itself.
In this environment, there is an imperative need to possess the ability to observe both how microservices as complex distributed systems behave and how they interact with their underlying infrastructure [
3]. Observability, a measure of how well a system’s internal state can be inferred by its external outputs, is a concept coming from dynamical systems that has been widely adopted in microservice architectures for this purpose [
4]. Achieving observability is challenging on multiple levels [
5]. It requires being able to monitor applications across heterogeneous infrastructures, using different, use-case-specific metrics, and producing vast amounts of data while requiring an all-in-one solution for the stakeholders to use.
Towards this goal, a number of distributed tracing solutions such as OpenTelemetry (
https://opentelemetry.io/ (accessed on 1 December 2022)), Jaeger (
https://www.jaegertracing.io/ (accessed on 1 December 2022)), Zipkin (
https://zipkin.io/ (accessed on 1 December 2022)), and, indirectly, Istio (
https://istio.io/ (accessed on 1 December 2022)) are employed. However, networking-based solutions lack the necessary granularity and insights into the application-level interactions, as they treat the applications’ internal workings as a black box.
Automatic platform monitoring (APM) solutions are deployed instead of or on top of distributed tracing solutions as non-invasive platforms for collecting metrics without interrupting the application flow. APM solutions, including those offered by companies such as Datadog (
https://www.datadoghq.com/ (accessed on 1 December 2022)), DynaTrace (
https://www.dynatrace.com/ (accessed on 1 December 2022)), New Relic (
https://newrelic.com/ (accessed on 1 December 2022)), and Splunk (
https://www.splunk.com/ (accessed on 1 December 2022)), have become very popular with microservice architectures as a result.
A relatively unexplored possibility offered by these solutions is the ability to provide application stakeholders with very fine-grained cost data at the level of microservices and their corresponding deployments. Having access to both low-level system data and being able to correlate them with application-level macro-metrics such as transactions per minute is ideal for breaking down the operational expenses of each individual microservice. Doing so provides the means to achieve two goals. First, it is necessary for identifying and resolving issues with inefficiencies in the selection of infrastructure through over-provisioning or overtly costly services with respect to their criticality in the overall architecture. Second, it is also essential towards establishing an efficient price model for the microservices themselves when and where these are exposed to third parties. It is our position in this work that building on existing APM solutions offers the necessary information that prior works such as CostHat [
6] assumed to be available for cost-profiling microservice applications.
Unfortunately, however, many of the existing solutions for this purpose are either closed-source (such as the ones mentioned above) or cloud service provider-specific. Closed-source solutions are also frequently offered as a service with a free tier for, e.g., the first 100 GB of data. In practice, these free tiers are not suitable for production-strength systems and make sense only for evaluation purposes. While powerful in their own rights, such solutions very quickly become costly for their adopters. Cloud provider-specific solutions, on the other hand, such as the combination of AWS X-Ray (
https://aws.amazon.com/xray/ (accessed on 1 December 2022)) with CloudWatch (
https://aws.amazon.com/cloudwatch/ (accessed on 1 December 2022)), the Application Insights overview extension of Azure Monitor (
https://azure.microsoft.com/en-us/products/monitor/ (accessed on 1 December 2022)), or Google Cloud Platform’s Operations Suite (
https://cloud.google.com/products/operations (accessed on 1 December 2022)) (formerly known as Stackdriver), provide end-to-end views of requests as they are resolved through applications and can be easily leveraged for analyzing microservice applications. They are, however, specific to each cloud service provider, and they tend to organize information around the cloud services used rather than the application itself. Furthermore, they charge users similarly to any other cloud service.
Thankfully, a number of open-source alternatives do provide APM capabilities. A well-known package is OpenTelemetry, already mentioned above, a Cloud Native Computing Foundation (CNCF) project specific to tracing that works together with external storage backends such as Prometheus (
https://prometheus.io/ (accessed on 1 December 2022)) or Jaeger and which can receive input from multiple APM solutions. Another very popular solution is the Elasticsearch, Logstash and Kibana (ELK) stack, jointly offered in an observability package known as the Elastic Stack (
https://www.elastic.co/elastic-stack/ (accessed on 1 December 2022)). The stack is widely known for its proven capability to handle large amounts of data and is used by many companies for both its search engine functionality and its APM capabilities. Elastic has some premium functionality that is offered as a service in the cloud, but the core remains open-source.
None of these open-source solutions, however, offer the ability to monitor the cost of cloud-native applications out-of-the-box. Being open source, though, presents an opportunity to be exploited towards extending them in this direction. The main goal of this work, therefore, is to investigate to what extent it is possible to perform cost profiling for cloud-native applications realized as microservice architectures using existing APM solutions. For this purpose, we conduct an exploratory case study together with an industrial partner using a data analytics platform designed and implemented as microservices as the system of study. We design and implement, in turn, a cost-profiling tool for microservice applications running on Kubernetes clusters based on the requirements of the case but with generalizability to any other microservices and cloud-native applications in mind and deploy it at a target system for evaluation purposes. From there, we present the findings of this process, and we discuss how we can proceed next. The contribution of this work is therefore twofold: first, we propose a complete cost-profiling solution suitable for Kubernetes-based microservice applications that is able to provide insights to incurred expenses at different levels of granularity; second, we show how the proposed tool can be used in practice to optimize the operational expenses of a running system in production.
The rest of this paper is structured as follows:
Section 2 presents the design of the case study and the elicited requirements for a solution.
Section 3 presents the design of the cost-profiling tool based on these requirements, and
Section 4 presents its assessment based on empirical data from the case.
Section 5 discusses our findings and outlines items for future work. Finally,
Section 6 summarizes related works, and
Section 7 concludes this work.
2. Case Study
In this work, we are interested in testing the hypothesis that APM can be used for cost profiling while extracting insights into how this information can be used in practice to optimize the operating expenses of microservice applications. As such, we opt to conduct an
exploratory case study following the guidelines of Runeson and Höst [
7]. More specifically, we focus on the case of a specific platform developed by the company that two of the authors work in currently being used for one of their projects. In order to test the hypothesis, we use design science in its framing for empirical software engineering [
8] to guide us through the development of a cost-profiling tool to be used for the case. The tool, in turn, will be used to check whether we can provide cost optimizations by using its provided insights. In the following, we discuss the design of the study, provide more information on the case, and elicit requirements for the cost-profiling tool that we will discuss further in the following section.
2.1. Study Design
We aim to investigate to what extent it is possible to perform cost profiling for microservice applications using APM data and tooling. To this effect, we decompose this objective into the following research questions:
- 1.
What APM metrics can be used for cost-profiling purposes?
- 2.
How can the cost of microservice deployments be calculated at different levels of granularity based on these metrics?
- 3.
To what extent can this information be used to reduce the cost footprint of microservice applications?
To answer these questions, we choose to design and develop a cost-profiling tool (CPT) based on one of the existing open-source APM solutions. The decision to build on top of an existing solution allows us to focus on answering the defined questions instead of engineering yet another APM tool. In order to be able to realistically evaluate our solution, we embed the development of the CPT in an exploratory case study together with the industrial partner represented by two of the authors of this work (Researchable B.V. (Website:
https://researchable.nl (accessed on 1 December 2022))) Using a case study allows us to assess our proposed solution across the following dimensions using data from an actual production-level system:
Ease of Use: how easy it is for potential adopters to set up and use the CPT;
Accuracy: how close the cost reported by the CPT is to the actual cost of the target application;
Impact: to what extent the CPT can be used to reduce the cost of the target application.
2.2. Case Description
Researchable is a company based in Groningen, the Netherlands, that aims to help others to innovate through data with software development, data engineering, and data science. Researchable is involved in various projects in which data are integrated from various sources and shared with clients. Such sources could include phones, smartwatches, sensors, or other smart devices. The company has developed a large scalable data platform for this purpose in which all stakeholders can safely manage, analyze and access data through a central infrastructure. New insights are gained by combining different sources of data; therefore, various integrations with existing sensors, fitness apps, smartwatches, and external systems have been made.
The platform was designed and implemented as a microservice architecture, as shown in
Figure 1, consisting of multiple services organized and named based on their purpose:
Base services such as base-platform, base-platform-worker, base-platform-fast-worker, and base-frontend that make up the core of the platform functionality;
SVC services that are invoked by user actions (svc-questionnaires, svc-questionnaires-worker, etc.); and
Auxiliary services necessary for supporting base and SVC services in, e.g., managing network traffic.
For the purposes of this case study, we will focus on the base services since they are the most critical services of the platform.
The platform was deployed on a managed Kubernetes service offered by Digital-Ocean (
https://www.digitalocean.com (accessed on 1 December 2022)) in two separate clusters: one for the “live” production version and an “acceptance” environment to verify and test changes in before they were released to the live version. Shared (i.e., not dedicated) VMs were used for service deployments in both clusters. The horizontal pod autoscaler (HPA) offered by the managed Kubernetes service was not used, meaning that the number of assigned pods per service deployment was fixed for the platform.
Table 1 summarizes the assigned resources for the deployment of the base-platform* services in terms of the guaranteed resources (requests) and the maximum amount of resources (limits). Since the platform is memory-intensive, these resources are defined only in terms of memory in the table.
The existing observability stack for the platform consisted of various tools from different vendors that were priced using different models and that needed to be integrated in different ways with the application logic of the platform. For managing logs, Researchable uses Papertrail (
https://www.papertrail.com/ (accessed on 1 December 2022)). To capture errors in running applications, Researchable uses AppSignal (
https://www.appsignal.com/ (accessed on 1 December 2022)), an APM solution that supports Ruby, Elixer and Node JS agents. This tool is primarily used to troubleshoot distributed requests as they propagate through different microservices. UptimeRobot (
https://uptimerobot.com/ (accessed on 1 December 2022)) is used to keep track of the information necessary for fulfilling the service-level agreements of the platform, and Squadcast (
https://www.squadcast.com/ (accessed on 1 December 2022)) is used for streamlining event processing. The presence of four different solutions coming from four different vendors poses by itself a challenge. Integration between them is not tight, and the cumulative cost of using them increases quickly with their usage. Furthermore, it is non-trivial and time-consuming to isolate the information necessary for optimizing the cost footprint of the platform. As such, in the following, we discuss the requirements for an end-to-end solution that can offer both the APM capabilities to replace these services and the envisioned CPT functionality.
2.3. Requirements
Eliciting requirements for the CPT solution involved the interviewing of the key personnel at Researchable responsible for the development and operation of the data platform. The resulting requirements can be classified in three distinct categories: functional, non-functional, and technical.
Table 2 summarizes the desirable requirements per category. These requirements are used in the following to decide on an open-source APM stack to adopt and for the design of our CPT solution.
3. Design and Implementation
Following the elicitation of requirements from the case under study, in this section, we discuss the design and implementation of our cost-profiling tool as an open-source project. We start by justifying our technology selection before moving on to the introduction of our proposed architecture, the details of the cost monitoring mechanisms, and the presentation of the end result.
3.1. APM Stack Selection
Looking into the requirements discussed in the previous section and the existing solutions discussed in the introductory section, we were able to select a suitable APM stack to use for the basis of our proposal by the process of elimination. More specifically, cloud=service-provider-specific tools such as AWS X-ray were very quickly deemed not applicable because they both do not offer a complete observability proposition (Requirement NFR3), are not platform-agnostic (Requirement NFR2), and they are not open-source (Requirement NFR6). Closed-source solutions such as NewRelic, Datadog, Splunk, and Dynatrace were similarly eliminated for the latter reason. Open-source APM solutions such as OpenZipkin and OpenTelemetry, on the other hand, do not have (sufficient) integration options for metrics and/or logs (Requirement NFR1). The most attractive APM stack for our purposes, therefore, was the Elastic Stack.
Figure 2 provides an overview of the Elastic Stack architecture. As can be seen in the figure, Elastic Stack combines multiple open-source software tools to offer a complete monitoring solution. The search and analytics engine Elasticsearch is at the heart of the stack. It allows for data ingestion and the indexing of diverse types of both structured and unstructured data and offers simple APIs for integration with other systems. Logstash provides the functionality to keep track of application and APM logs. Kibana wraps around the Elasticsearch API to offer a user-friendly UI for managing the Elastic Stack and visualizing Elasticsearch data. The Observability overview page within Kibana contains a wide variety of analytics charts, including the ability to visualize APM data, logs, infrastructure metrics, and uptime data.
Two sources of data are used for APM purposes. The first is Elastic Beats, which are lightweight shippers of monitoring data to Elasticsearch, that is, agents to be deployed on hosts one wishes to monitor. There are several Beats available that handle different types of data: Filebeat (logs), Metricbeat (metrics), Packetbeat (network packets), Winlogbeat (Windows event logs), Auditbeat (audit data), Heartbeat (uptime monitoring), and Functionbeat (a serverless shipper). All these beats are auto-instrumented and come with a self-discovery feature that automatically detects new containers deployed in the same cluster.
The second is the Elastic APM Server, which allows the monitoring of software services and applications by integrating performance data on incoming requests, database queries, cache calls, and more. Deploying an Elastic agent inside target application containers allows for capturing distributed traces across application deployments. Similarly to Beats, these agents are also auto-instrumented and support self-discovery. OpenTelemetry agents can be used instead if necessary, e.g., in case the microservice is developed in a language not supported by Elastic APM. The Elastic APM server receives data coming from the agents and inserts them into one or more Elasticsearch indices, also allowing for aggregation operation directly on these data.
3.2. System Architecture
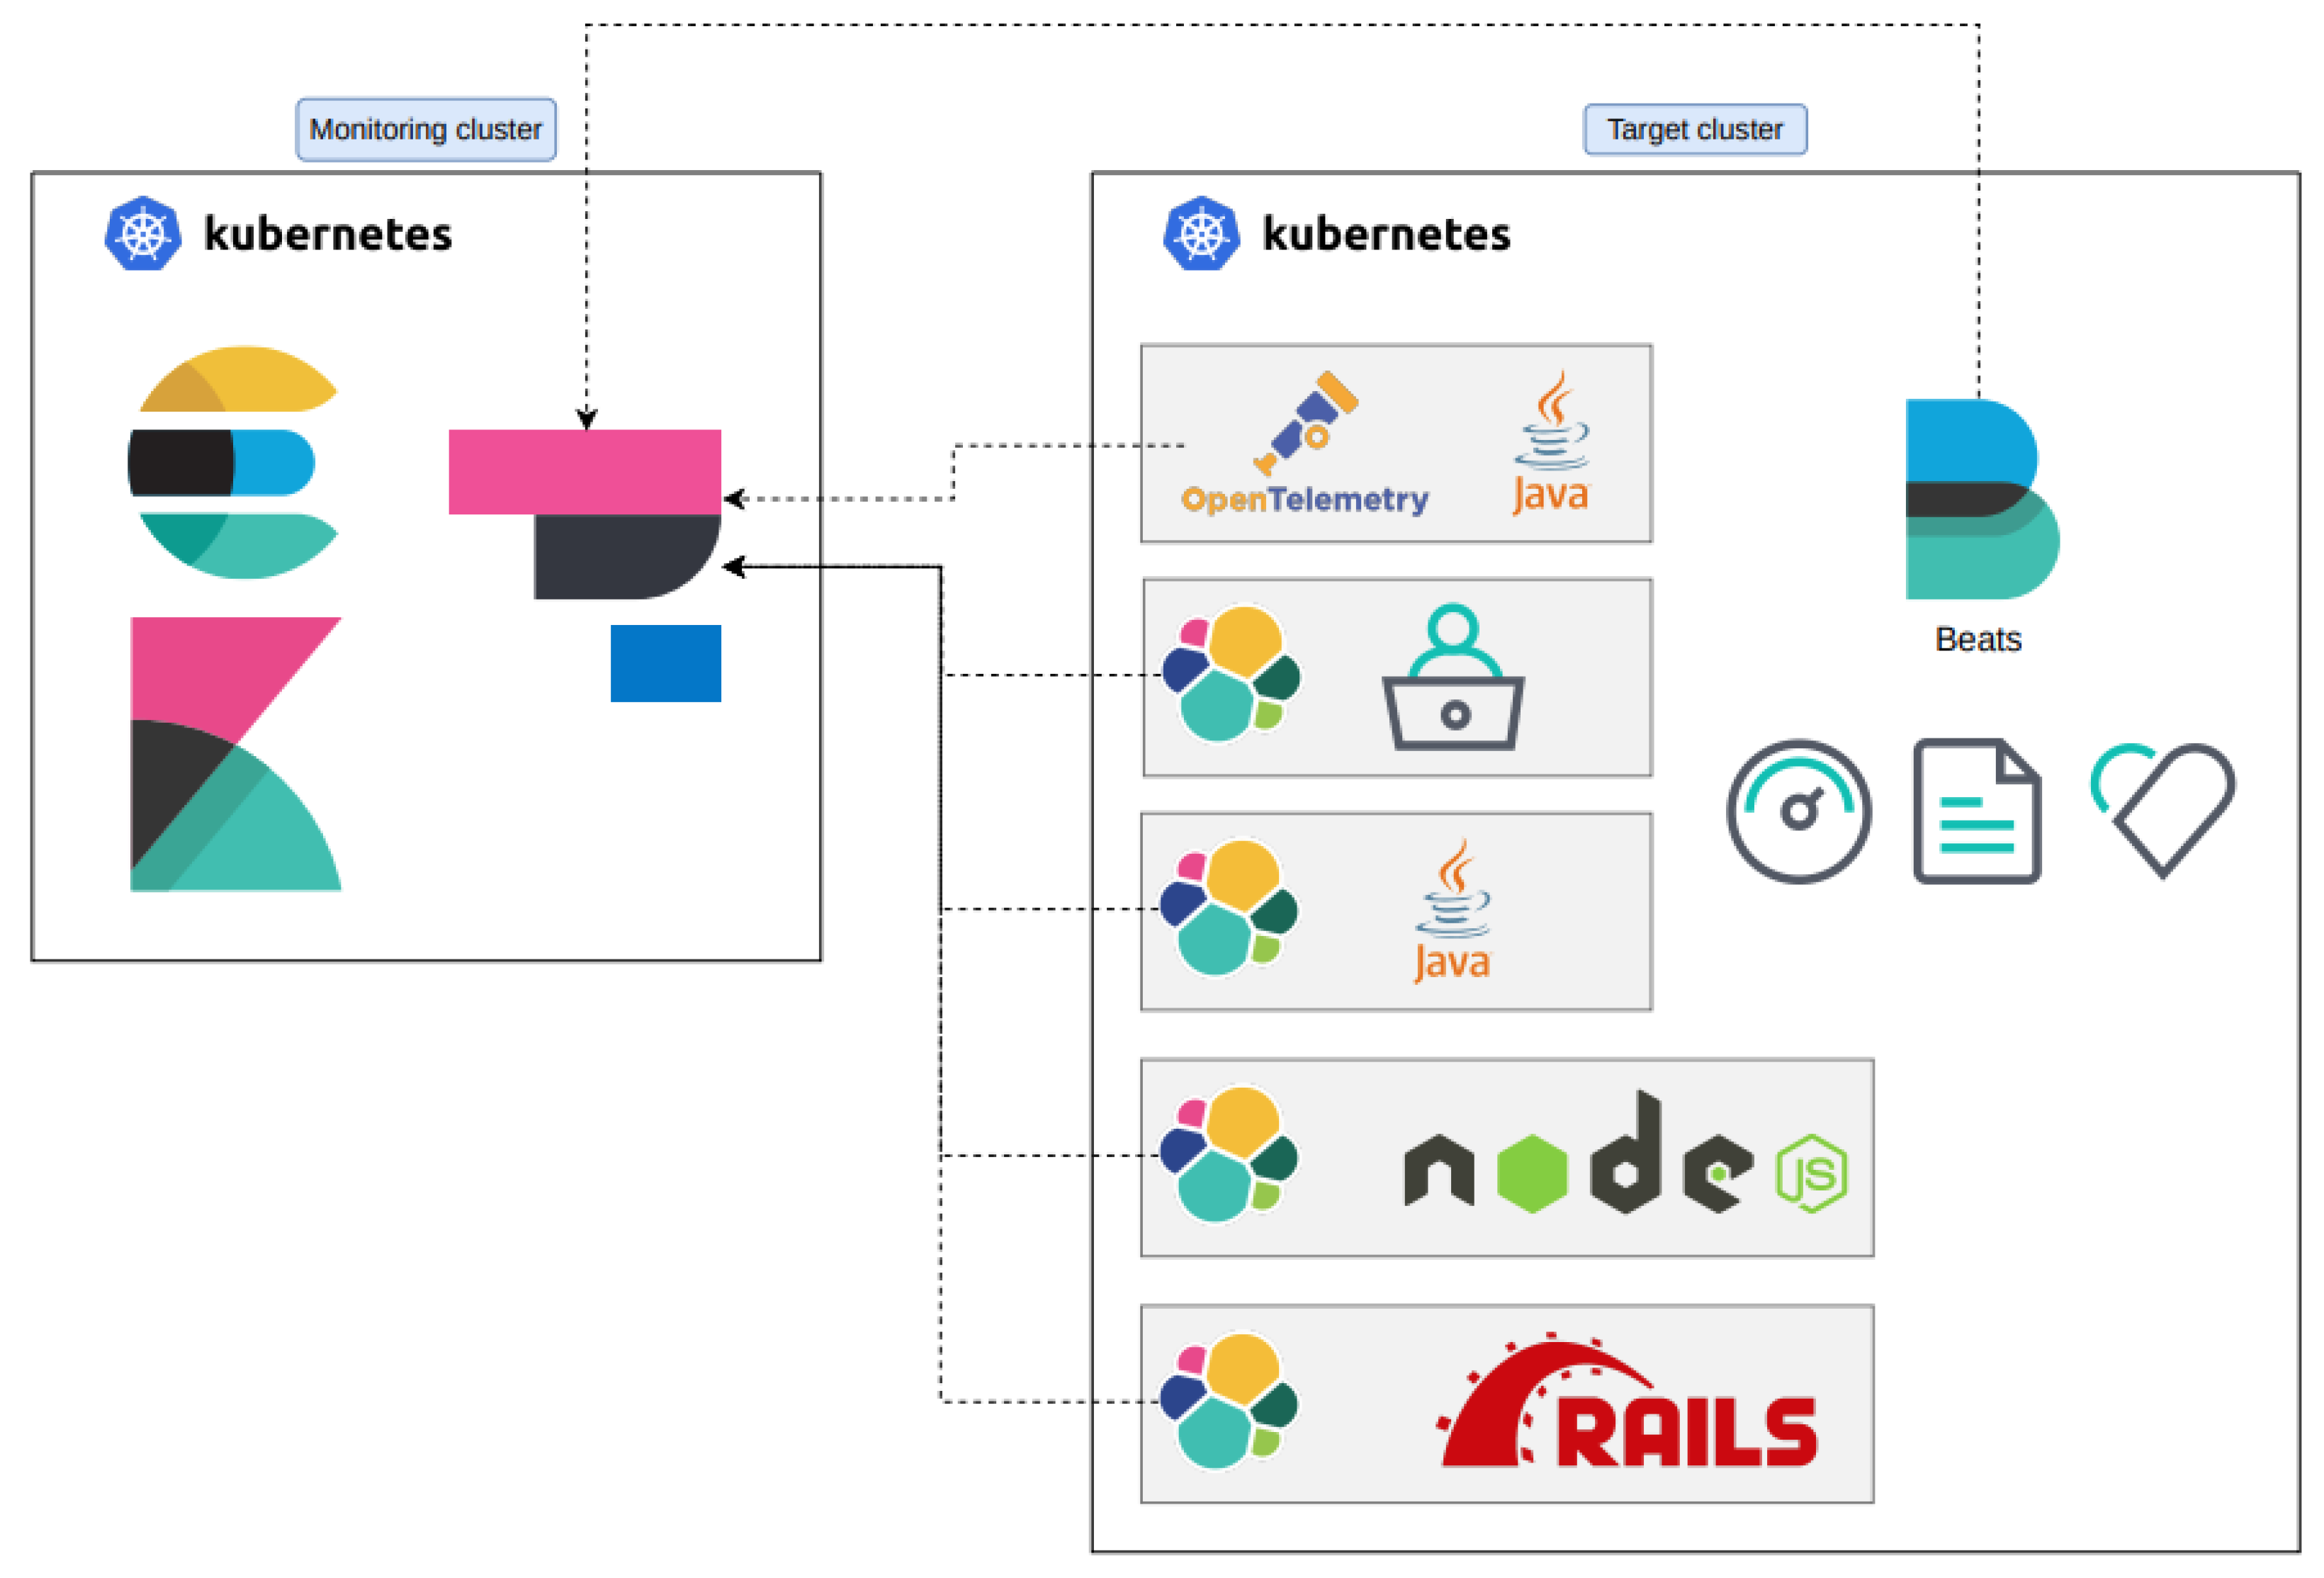
Following the selection of the underlying APM stack, we can now discuss the architecture of our proposed solution, as summarized by
Figure 3. The architecture itself is separated into two parts: one part is responsible for gathering data from the target application, i.e., the microservices and the infrastructure they live on, and one part is responsible for collecting, aggregating, storing, and visualizing the data through appropriate user interfaces. Both parts were designed to be deployed in Kubernetes clusters that are, in principle, distinct from each other, referred to as the target and monitoring cluster in
Figure 3, respectively. For the purposes of this case study, we used the managed Kubernetes cluster service offered by DigitalOcean to deploy our implementation of the monitoring cluster components, matching the availability zone for the target cluster in order to avoid data transfer cost issues. There are, however, no assumptions about the capabilities offered by the specific Kubernetes solution offered by DigitalOcean, and as per NFR
2, any Kubernetes cluster hosted at any provider would do instead. To fulfill one of the ISO-27001 requirements, we used, for example, DigitalOcean’s Object storage service to hold (Monitoring) cluster snapshots for backup purposes (Requirement NFR
2), but a similar solution could be recreated at any major cloud service provider.
Following the Elastic Stack architecture summarized in
Figure 2, the Monitoring cluster in
Figure 3 consists of the Kibana, Elasticsearch, and Elastic APM components. The Elasticsearch cluster consists of at least three nodes, as is the best practice for ensuring fault tolerance and high availability (NFR
5). Kibana was deployed as two instances (a main and a backup) due to its criticality during error discovery while other systems experience downtime and for load=balancing purposes. The Elastic APM server was deployed as a single-instance component. The system itself is able to handle large volumes of incoming data, and even if it fails, un-ingested data can still be added to the Elasticsearch index; it is therefore not critical to operate it in a redundant mode. For the purposes of balancing the load of all incoming data to the Monitoring cluster, we followed the common practice of using the Nginx Ingress controller (
https://docs.nginx.com/nginx-ingress-controller/ (accessed on 1 December 2022)) with at least two replicas of the ingress Nginx controller.
On the Target (application) cluster side, on the other hand, the only requirement is to install the necessary agents for data collection inside the microservice application itself. This means that no extra privileges are required to use the stack apart from having control over the deployed microservices. For the APM part, we used both Elastic and OpenTelemetry agents. From the available Beats, the one that we mainly depended on was the Metricbeat whose Kubernetes provider captures multiple fields (
https://www.elastic.co/guide/en/beats/metricbeat/current/exported-fields-kubernetes.html (accessed on 1 December 2022)).
3.3. Cost Calculation
The cost for provisioning the complete target cluster can be collected directly from the cloud service provider, either by extracting it from the monthly billing information or directly from an API on the provider side. However, we also know that this information is too coarse-grained to be of actual use in optimizing the cost of the application. Ideally, we want to be able to assign cost down to the level of pods, the smallest unit in Kubernetes clusters, per service deployment and then calculate the cost per (micro)service by summing these individual costs.
Establishing this level of granularity starts with a simple observation: there is a direct relationship between the resources a service has been allocated and the cost we assign to it. Intuitively, the more resources from a cluster node the pods for a service are allocated, and the more expensive the node is, the more expensive the service is in turn. Conversely, since the cost per node is linear with its provisioning time, then the cost of each service pod is the proportion of the node cost defined by the utilization of the node attributed to the service’s pods. We therefore need to connect utilization metrics at the system and pod level to cost metrics. Doing so at the system level, through, e.g., directly monitoring CPU utilization on the node, both generates too many data to retain and does not guarantee the correlation between consumed resources and deployed services in all cases.
Instead, we used the Metricbeat data for this purpose; of particular interest are the following fields:
-kubernetes.pod.name: the (unique) name auto-generated by Kubernetes for each pod;
-kubernetes.pod.cpu.usage.pct: the CPU usage as a percentage of the total node CPU;
-kubernetes.pod.memory.usage.pct: the memory usage as a percentage of the total node memory;
-kubernetes.node.name: The node on which the pod is running;
-kubernetes.deployment.name: The deployment of which the pod is part of;
-kubernetes.node.labels.node_kubernetes_io/instance-type: A label that is assigned to the Kubernetes node by DigitalOcean. It contains the machine type of the underlying infrastructure and is necessary because, in contrast to the hyperscalers, DigitalOcean does not define a machine.type as part of the metadata for their VMs.
-orchestrator.cluster.name: Metadata to distinguish data coming from environments (e.g., development and production) or projects belonging to different clients.
The raw Metricbeat data were first temporarily stored in the default Metricbeat Elasticsearch index. Even with the default reporting period of 10 s, retaining Metricbeat data for a long time quickly becomes very storage-intensive. Instead, we used what in Elastic terms is called a transform action, which allowed us to convert existing indices into new, summarized ones that (eventually) could be used instead of the original ones so that the latter can be discarded. To this effect, we configured Elasticsearch to aggregate the data points that were collected for the fields we defined above every 10 s to a single point per minute, the average value, into a new index. This affects mostly the kubernetes.pod.cpu.usage.pct and kubernetes.pod.memory.usage.pct, since these are the ones that are actually the most volatile over time. While this data compression creates a drop in the accuracy of the metrics, it also results into a reduction of the necessary storage capacity by a factor of 6, which, as we will discuss in the following, is a significant factor.
The next step in the process uses another transform, in this case an enrichment, to add to the document produced by the previous step containing the aggregated metrics per pod with the cost information at the node level. To achieve this goal, the API of the cloud service provider (in this case, DigitalOcean) is used to retrieve the appropriate data. The result of this step is a document containing both utilization metrics per pod and the billing data per month and hour at the level of the node in which the pod is deployed. Listing 1 shows a fragment of such a document.
| Listing 1. Example of the pricing information attached to a metrics document. |
| { |
| "_index": "cloud-billing", |
| "_id": "digitalocean-s-1vcpu-1gb", |
| … |
| "_source": { |
| "@timestamp": "2022-04-24T00:00:10.351Z", |
| "provider": "digitalocean", |
| "instance_type": "s-1vcpu-1gb", |
| "price_monthly": 5, |
| "price_hourly": 0.00744, |
| "metadata": { |
| "memory": 1024, |
| "vcpus": 1, |
| "disk": 25, |
| "transfer": 1, |
| "regions": [ |
| "ams3", |
| … |
| ] |
| } |
| }, |
| … |
| } |
The next and final step of the process used an ingest pipeline to correlate the utilization and cost data and calculate the cost per pod. It achieves this by first calculating the relative utilization of the pod (per minute) with respect to the total available in the node by averaging the CPU and memory utilization metric values, both ranging in the domain. It then calculates the node cost per minute of provisioning the node by dividing the price_hourly field in the listing above with the 60 minutes of an hour. The per-minute pod cost is then the product of these two values. The resulting document then persists into a separate index, cost-profile, which is used for visualization purposes. Listing 2 shows an example of the resulting document where both utilization and cost-related data are available for the respective pod. A similar process is applied to further enrich this document with an average number of transactions per minute and the average transaction duration for the deployment that this pod belongs to.
3.4. Deployment
CPT is available as an open-source project in a public Git repository (
https://gitlab.com/sjoukedv/cost-profiling-microservices-applications (accessed on 1 December 2022)). To facilitate the deployment of our tool, we use a combination of Terraform (
https://www.terraform.io/ (accessed on 1 December 2022)) and Helm (
https://helm.sh/ (accessed on 1 December 2022)), providing the necessary artifacts in the repository and documenting the sequence of commands necessary. The Terraform configuration files are defined for deploying the monitoring cluster at DigitalOcean; however, they can be easily modified to work with other cloud providers by simply modifying a few variables in them. Helm charts are then used to package and template the monitoring cluster accordingly. For the target cluster, the only configuration action necessary is deploying and configuring the necessary Beats and APM agents from the Elastic Stack. We rely on the standard documentation at Elastic for this purpose with links from our documentation to the necessary information.
| Listing 2. Example of the cost profile index for each pod. |
| { |
| "_index": "cost-profile.pod.metrics", |
| "_id": "AGJzc2JTEYrNN1z4wJks92YhL72LvwAA", |
| ... |
| "_source": { |
| "@timestamp": "2022-04-29T12:16:00.000Z", |
| "orchestrator": { |
| "cluster": { |
| "name": "Data Platform Dev" |
| } |
| }, |
| "cost_data": { |
| "price_monthly": 40, |
| "instance_type": "s-4vcpu-8gb", |
| "price_hourly": 0.05952 |
| } |
| "kubernetes": { |
| "node": { |
| "name": "service-coq8p", |
| "labels": { |
| "node_kubernetes_io/instance-type": "s-4vcpu-8gb" |
| } |
| }, |
| "pod": { |
| "memory": { |
| "usage": { |
| "node": { |
| "pct": { |
| "avg": 0.0030000000000000005 |
| } |
| } |
| } |
| }, |
| "name": "base-frontend-84899f8fb5-mcpl2", |
| "cpu": { |
| "usage": { |
| "node": { |
| "pct": { |
| "avg": 0 |
| } |
| } |
| } |
| } |
| }, |
| "deployment": { |
| "name": "base-frontend" |
| } |
| }, |
| }, |
| } |
| } |
Figure 4 shows a small part of the result of a successful deployment of the tool for the data platform under consideration after having collected data for a few days and visualized them in its dashboard. The dashboard builds on the capabilities offered by Kibana and extends the default APM-oriented view offered out-of-the-box by the Elastic Stack. Different graphs are provided for different pieces of information. For example, in the bottom part of the figure, the relative node utilization is plotted as a series of stacked bar plots. The aggregated utilization per node for both memory and CPU is shown in the middle of the figure. Cost-profiling-related information is visualized in the top half of the dashboard, including the total cost of the target application both per hour and cumulatively over time. The graphs plot the costs per (microservice) deployment both independently for each deployment and as stacked bars to indicate the overall cost. Each of these graphs is interactive, allowing for filtering and zooming in to each of the data series plotted (e.g., microservice deployment). The visualized data can also be dynamically subsetted to specific time intervals for more targeted analysis of the visualizations, and any graph can be removed or moved around on demand. The tool repository has more information on the capabilities of the dashboard as part of its documentation.
5. Discussion
Based on the findings of the previous sections, we can now answer the research questions defined in
Section 2:
- 1.
With respect to the question “What APM metrics can be used for cost-profiling purposes?”, we look at how provisioning resources for the deployment of a service contributes to the price of the underlying infrastructure. Allocated CPU and memory appear to be the highest contributors to this cost and, by extension, to the application cost. In this work, we calculated utilization as an equally weighted sum of both these metrics, but in the future, we can use differential weighting to reflect, e.g., memory-intensive services.
- 2.
In order to answer “How can the cost of microservice deployments be calculated at different levels of granularity based on these metrics?”, we transformed the raw metrics as collected through the APM agents into monetary cost per metric. Using this per-metric cost instead of the one provided by the cloud service provider’s billing information both provides more fine-grained information and allows us to customize the interval of observation without losing too much definition.
- 3.
Finally, we showed that for the question “To what extent can this information be used to reduce the cost footprint of microservice applications?”, it is possible to make application deployment configuration changes based on insights gained through our cost-profiling tool. It is also possible to indirectly identify architectural changes to be performed.
At the same time, the shortcomings of our proposal are also clear. First, using our CPT solution requires going over a significant learning curve. Assigning one or more developers to this task and potentially adopting the Elastic Stack as an observability solution that goes beyond cost profiling so as to foster familiarity with this environment would help in this direction. Second, as with all APM solutions, the amount of data generated can very quickly be overwhelming, resulting in the cost profiler incurring its own burden in terms of operational expenses. Even with the compression of the metrics through aggregation, for example, we very quickly ended up requiring dozens of gigabytes in storage for a few days’ worth of data. Removing/archiving data older than a week was a pragmatic decision taken towards keeping the situation under control, but if a larger application was under observation, then we might have reduced this down further to the span of days. We also had the advantage of being able to deploy the monitoring cluster for the data platform in the same availability zone as the target one. If this is not possible or desirable, e.g., when deploying one monitoring cluster for multiple target clusters across regions, then ingress/egress for data transfer between the clusters can incur significant additional costs.
In terms of the cost model being used, our choice for calculating utilization only based on CPU and memory ignores the impact that network bandwidth and storage allocation can have on operational expenses. The presented case study was not affected by this limitation due to a number of attenuating circumstances. DigitalOcean’s Managed Kubernetes service limits the bandwidth of the underlying nodes’ infrastructure. The free bandwidth limit differs per type of node, e.g., large computing nodes have higher bandwidth. In this case study, the platform was memory-expensive, so the traffic did not exceed the limit that comes with the larger nodes. We were, therefore, never near the point where allocated network bandwidth would become a factor in the cost of the platform. Storage is similarly not an issue since the selected VMs come with enough storage for the needs of the platform; had we needed to move to storage-intensive VMs, then utilization could not have ignored allocated storage. In future work, we need to investigate how to incorporate these factors too in the calculation of utilization to cover the general case.
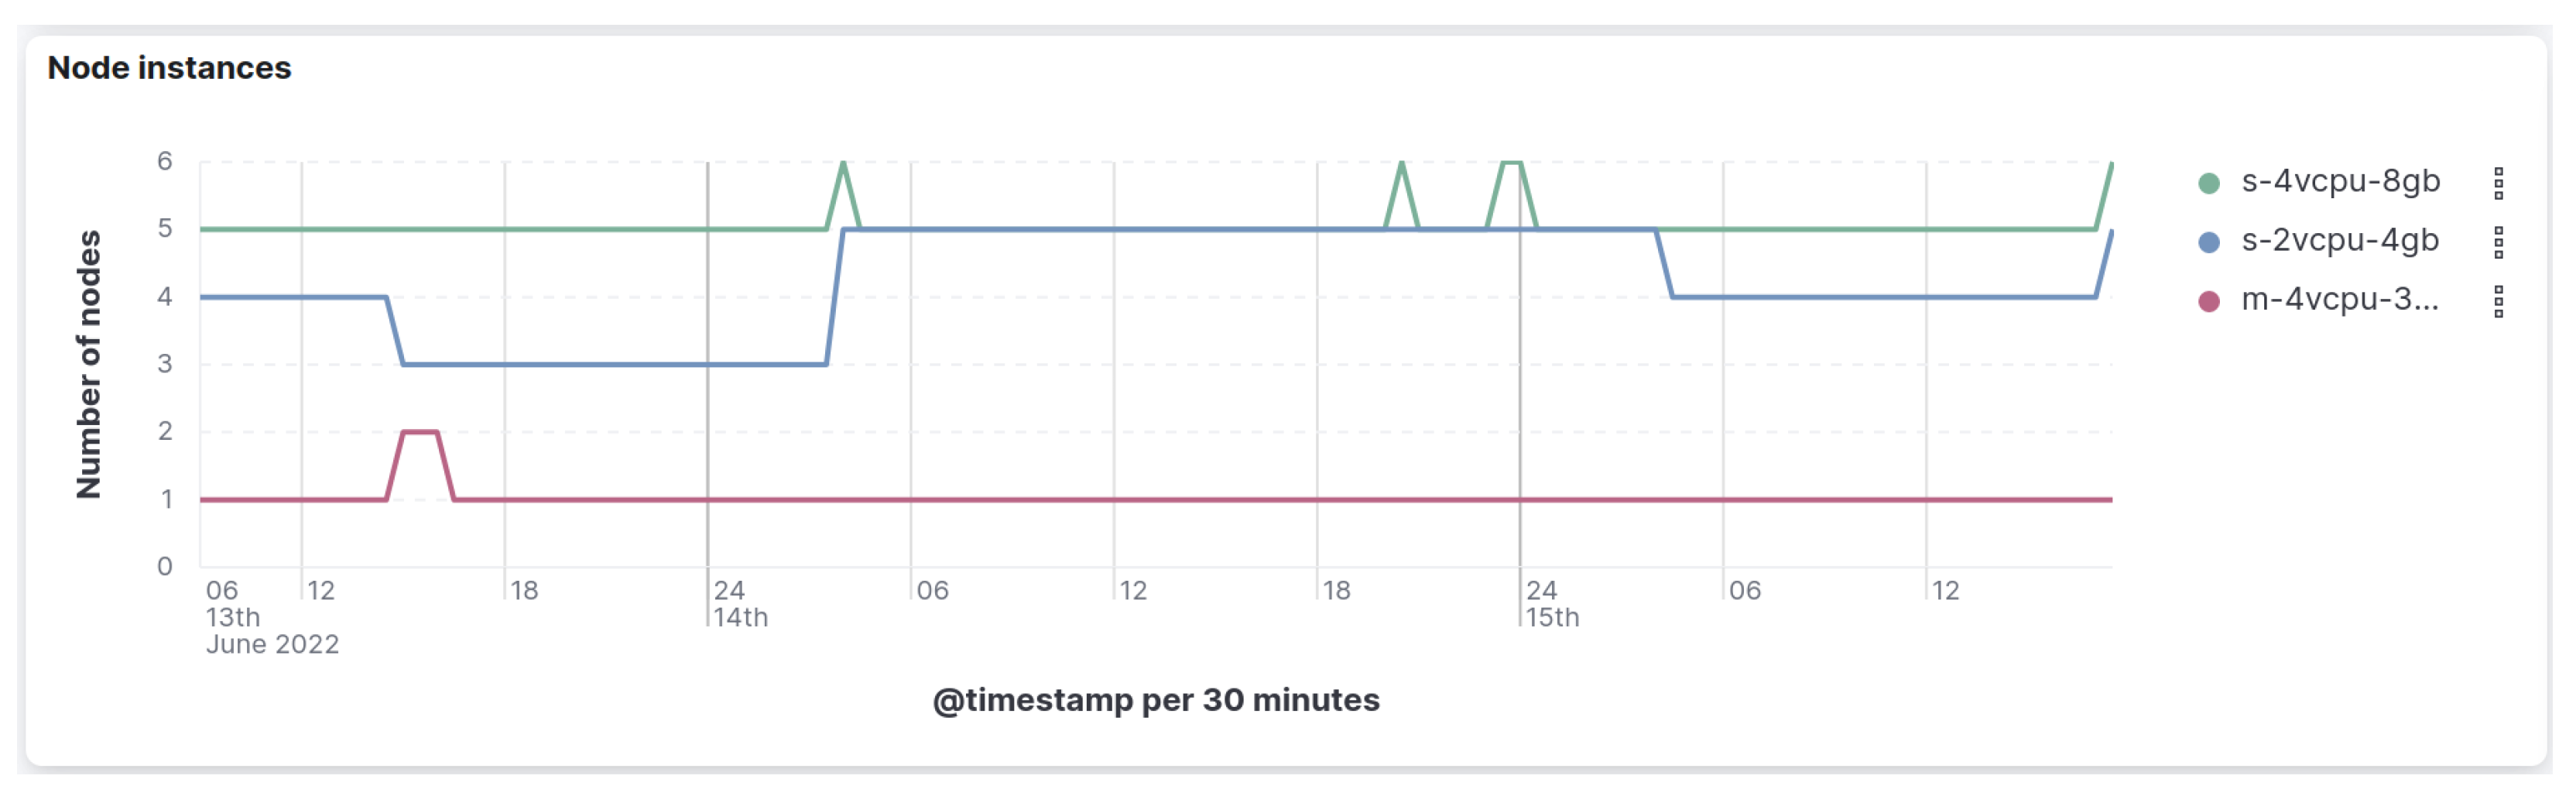
Furthermore, as we have fine-grained metrics about resource utilization together with metadata to which ReplicaSet (
https://kubernetes.io/docs/concepts/workloads/controllers/replicaset/ (accessed on 1 December 2022)), a container, belongs, it becomes possible to determine which horizontally, and often statically, scaled service is wasting resources. Waste here is effectively the amount of over-provisioned resources at each unit of time, accumulating through the operation of an application in the absence of perfect auto-scaling. The cause of the waste for the case study in this work is the excessive number of replicas of the same service with respect to the load for that moment in time. A fixed number of replicas does not match the dynamic traffic pattern (e.g., the difference between during and outside of office hours), which leads to unnecessary waste. The key takeaway here is to use (vertical) pod auto-scaling to match the number of instances with the current load, which, in terms, also scales the cluster itself. Failing that, as in our case, the presented solution can be used to indirectly identify the pods producing the most waste through their utilization metrics and adjust their allocated resources accordingly. Incorporating into the CPT appropriate views and mechanisms to offer relevant suggestions is the next step in its development.
Finally, an obvious limitation of CPT stems from the scoping of this work to Kubernetes-based microservice applications, as discussed back in the introductory section. This choice allowed us to bring the complexity of the task at hand at a manageable level and was justified by the requirements imposed by the case we executed at Researchable for the purposes of this study. Nevertheless, it is quite restrictive in the sense that cloud-native applications are increasingly being developed as combinations of containerized components deployed in Kubernetes clusters with components running in serverless services, together with the necessary orchestration of said components. While expanding CPT to support this wider toolkit of application development is future work; the effort required to achieve this goal is not significant since Elastic Stack already offers beats (monitoring agents) for functions (
https://www.elastic.co/beats/functionbeat accessed on 1 December 2022)) and integrations with cloud providers such as AWS (
https://www.elastic.co/guide/en/observability/current/aws-metrics.html (accessed on 1 December 2022)). The majority of the effort will, therefore, be made toward developing an appropriate cost model for these cases.
On a relevant note, an interesting extension of the current proposal to be pursued in the future is the incorporation of
environmental footprint profiling running in parallel to the cost one. For that, we first need a model estimating the emissions equivalent of operating the clusters’ nodes over the period of interest. For this purpose, the model used for example by the Cloud Carbon Footprint (
https://www.cloudcarbonfootprint.org/ (accessed on 1 December 2022)) open-source tool can be adopted and adapted accordingly. Then, similarly to what we presented previously concerning operational expenses, the footprint per microservice deployment can be calculated by distributing the overall footprint per node to each microservice through its proportional utilization of the allocated resources. By these means, it would be possible to gain fine-granular insights into which parts of an application generate the most emissions and refactor the application accordingly.
6. Related Works
Beyond the earlier works on cloud monitoring surveyed at [
9,
10,
11,
12], there are not many approaches in the academic literature that are explicitly aimed at monitoring microservices, specifically their cost. There are a few exceptions worth mentioning, though. Leitner et al. [
6] presented CostHat, a graph-based model of the end-to-end operational costs of microservice applications deployed either on VMs or as serverless functions. The model is able to calculate the cost per application and microservice based on its incoming workload and can be used to perform what-if analysis for changes in the application. In order to do so, however, it requires, among other things, the costs per request and deployment for each microservice. In this respect, our tool can be used both in conjunction with CostHat and as an alternative to it. Kuhlenkamp and Klems present in [
13] Costradamus, a cost-profiling system for services (including microservices) implemented in the serverless model. It relies on having access to logs, data from invocation responses, or the modeling of the responses and incorporates the notion of waste, albeit in a manner that is, by now, fairly obsolete (as the difference between metered and billed function call duration).
Cost monitoring is also often present as a critical component in solutions aiming to address different problems. For example, these can be dealing with resource management of microservice architectures at scale, such as the work by Maghalhaes et al. [
14] or Carrusca et al. [
15]. The efficient automated scaling of microservices, for example [
16], includes, by necessity, cost monitoring. Other works aim to optimize the deployment of microservices across service providers [
17] or the cloud-edge continuum [
18]. A related problem requiring cost monitoring is that of the optimization of (micro)service orchestration, as discussed, for example by the Ananke system [
19,
20] and the work by Alexander et al. [
21]. None of the above approaches, however, provide application developers with the tools to understand how the cost of deploying and operating their application and infrastructure breaks down to the individual microservices involved.
In addition to the commercial and closed-source solutions for microservice application observability discussed in the introduction, there are also a series of industrial solutions specifically aimed at cost profiling. These include, among others, Infracost (
https://www.infracost.io/ (accessed on 1 December 2022)) and C-Facts (
https://www.c-facts.com/ (accessed on 1 December 2022)). Infracost provides tools for the cost analysis of infrastructure as code (IaC) artifacts such as Terraform. The drawback is that they can only show costs related to infrastructure usage in, e.g., units, but they cannot show information about the effectiveness of the underlying infrastructure or the allocation of the infrastructure with respect to the microservice architecture. C-Facts offers a centralized solution for the monitoring and analysis of operational expenses across cloud providers with an all-in-one dashboard for their visualization. However, it relies on the ingestion of data by their own system, creating effectively a vendor lock-in, in contrast to our solution.
In terms of open-source projects, the closest to our proposal is OpenCost (
https://www.opencost.io/ (accessed on 1 December 2022)), itself an evolution of the Kubecost project (
https://www.kubecost.com/ (accessed on 1 December 2022)). OpenCost is a vendor-neutral cost-monitoring tool for Kubernetes clusters built on top of Prometheus with integrations to the billing systems of the three hyperscalers. Beyond being currently limited, however, to these providers and on-premises Kubernetes deployments, it also comes without a dashboard for the visualization of the data.
The above approaches determine the cost profile but do not, in principle, recommend changes to the configuration, despite offering some optimization capabilities. A solution that is also capable of automatically tuning resources is Goldilocks (
https://goldilocks.docs.fairwinds.com/ (accessed on 1 December 2022)). One of the motivations to move to platforms such as Kubernetes and a cloud-native containerized approach is the horizontal scalability of services. Waste happens in both the horizontal direction by using too many containers of a service and in the vertical directon by allocating too many resources for a single container which are not fully utilized. Goldilocks builds on top of the vertical pod autoscaler (VPA) of the Kubernetes ecosystem. Furthermore, a platform such as Spot (
https://spot.io/ (accessed on 1 December 2022)) offers a solution that includes cost optimization based on the monitoring of accrued costs. The drawback of this approach, however, is the associated cost, which is claimed to be covered by cost savings, and the limitation of supported cloud providers.


