Article

Medical Internet-of-Things Based Breast Cancer Diagnosis Using Hyperparameter-Optimized Neural Networks

by
Roseline Oluwaseun Ogundokun
1,
Sanjay Misra
2,
Mychal Douglas
3,
Robertas Damaševičius
4,* and
Rytis Maskeliūnas
1
1
Department of Multimedia Engineering, Kaunas University of Technology, 51368 Kaunas, Lithuania
2
Department of Computer Science and Communication, Østfold University College, Halden 1757, Norway
3
Department of Computer Science, Landmark University, Omu Aran 251103, Nigeria
4
Department of Applied Informatics, Vytautas Magnus University, Kaunas 44404, Lithuania
*
Author to whom correspondence should be addressed.
Future Internet 2022, 14(5), 153; https://doi.org/10.3390/fi14050153
Submission received: 24 April 2022 / Revised: 16 May 2022 / Accepted: 16 May 2022 / Published: 18 May 2022

Abstract

:
In today’s healthcare setting, the accurate and timely diagnosis of breast cancer is critical for recovery and treatment in the early stages. In recent years, the Internet of Things (IoT) has experienced a transformation that allows the analysis of real-time and historical data using artificial intelligence (AI) and machine learning (ML) approaches. Medical IoT combines medical devices and AI applications with healthcare infrastructure to support medical diagnostics. The current state-of-the-art approach fails to diagnose breast cancer in its initial period, resulting in the death of most women. As a result, medical professionals and researchers are faced with a tremendous problem in early breast cancer detection. We propose a medical IoT-based diagnostic system that competently identifies malignant and benign people in an IoT environment to resolve the difficulty of identifying early-stage breast cancer. The artificial neural network (ANN) and convolutional neural network (CNN) with hyperparameter optimization are used for malignant vs. benign classification, while the Support Vector Machine (SVM) and Multilayer Perceptron (MLP) were utilized as baseline classifiers for comparison. Hyperparameters are important for machine learning algorithms since they directly control the behaviors of training algorithms and have a significant effect on the performance of machine learning models. We employ a particle swarm optimization (PSO) feature selection approach to select more satisfactory features from the breast cancer dataset to enhance the classification performance using MLP and SVM, while grid-based search was used to find the best combination of the hyperparameters of the CNN and ANN models. The Wisconsin Diagnostic Breast Cancer (WDBC) dataset was used to test the proposed approach. The proposed model got a classification accuracy of 98.5% using CNN, and 99.2% using ANN.

1. Introduction

Breast cancer is among the most common women’s cancers worldwide. Cancer is a disease caused by abnormal cells in the human body that could be transmitted to other regions of the body instead of only the region that is infected [1]. It is the leading source of death globally, with a predictable 8.2 million fatalities [2]. Cancer cases are expected to upsurge from 14 to 22 million over the next two decades, then continue to increase year after year. As cancer spreads from its initial location to other parts of the body, the death rate has increased [3,4]. Several studies [5,6] have predicted a discriminative prognosis based on location. The prognosis and prediction of breast cancer are greatly aided by potential biomarkers [7]. Advanced biomedical imaging methods such as magnetic resonance imaging (MRI) [8] and thermal imaging [9] can be used for the diagnosis of breast cancer aided by deep learning models [10], however, the approach is costly and requires special medical imaging equipment and expert knowledge to interpret the result, which are not available in many rural areas of developing countries.
Compared to medical professionals, machine learning (ML) offers substantial benefits, especially for human disease diagnostics [11,12]. ML is thought to be the best cancer detection tool because it eliminates manual labor and helps clinicians categorize texts and images. It also shows how patients’ emotions affect their well-being [13]. Digital sensors can now be used to track a patient’s well-being by detecting heart rate, mobility, distance variance, and skin tone [14].
Currently, the Industrial Internet of Things (IIoT) is among the fastest developing networks capable of collecting and exchanging enormous amounts of data using sensors in the healthcare setting [15]. In the therapeutic field, IoT is considered an expert application and is sometimes called medical IoT, or Internet of Health Things (IoHT) [16], or Internet of Medical Things (IoMT) [17,18]. IoMT refers to a networked infrastructure of medical applications, devices, health systems, and services. It is used to examine sensor nodes that get data from the patient’s body using intelligent portable gadgets to assess their physical properties [19]. IoMT enables wireless and remote devices to communicate securely over the Internet, while integration with AI methods allow for rapid and flexible medical data analysis and diagnostics. When delivering data through the cloud, IoT devices handle several unknown elements such as network structure, energy transfer, and computing capacity [20]. Both caregivers or health care providers and patients have successfully adapted remote patient monitoring, disease detection, and efficient treatment via telehealth services. All these devices and services lead to the transformation of healthcare to Healthcare Industry 4.0 [21].
Compared to existing methodologies, the methods and techniques used in this proposed study are more favorable, since they improve and optimize the selection of pertinent characteristics that detect the tumor at its early stages utilizing ML techniques.
This work makes the following innovations and contributions:
  • A novel framework for the optimization of hyperparameters of the convolutional neural network (CNN) and artificial neural network (ANN) models for achieving optimal classification results.
  • An experimental comparison of SVM and MLP classifiers that have been trained and evaluated utilizing particle swarm optimization (PSO) for feature selection.
  • The suggested approach can be easily integrated into the medical IoT-based healthcare system and used to effectively diagnose breast cancer.
The remainder of this work is divided into the following sections: Section 2 presents the IoMT-based framework for breast cancer diagnostics, explains our methodology, including the neural network models and tuning of their hyperparameters, and discusses the performance evaluation measures. The results of breast cancer diagnostic implementation with comparative analysis with state-of-the-art are discussed in Section 3. Section 4 concludes and provides recommendations for future studies.

2. Related Works

Deep learning (DL) is an ML initiative that can be used for automated training and selection from characteristics of breast cancer datasets [22]. Wisconsin Prognostic Breast Cancer Chemotherapy (WPBCC) and WDBC standards have been used in many studies over the years [23]. Many studies have been done on the diagnosis of breast cancer, and ML has been used to apply a variety of classification approaches, including Naive Bayes (NB), Decision Tree (DT), Logistic regression (LR), Random Forest (RF), Support Vector Machine (SVM), and others. Feature selection approaches, including filter, wrapper, and embedding methods, have been used similarly to improve predicted accuracy by appointing the best features. Chougrad et al. [24] suggested a network strategy to improve breast cancer survival at the initial stage. Researchers have used a deep convolutional approach and computer-assisted diagnostics to recognize early-stage breast cancer [25]. Ambrane et al. [26] identified methodological and objective predictive factors in breast cancer categorization. For the prediction of breast cancer, two types of classifiers were developed, K-Nearest-Neighbor (kNN) and NB, and calculated based on the prognostic factor. Dasgupta et al. [27] developed four methods to identify cancer types and select characteristics. For the breast cancer dataset, ML techniques such as NB, neural network (NN), DT, and LR were used for feature selection and breast cancer prediction. Gupta and Kaushik [28] used 3 classification techniques for cancer: SVM, NB and DT. In addition to dimensionality reduction, feature selection was used to decrease the fitness problem. For parameter selection, Yue et al. [29] adopted ML algorithms such as kNN, ANN, and SVM. For parameter optimization in kernel functions, a novel PSO method was used for the SVM. Using feature selection and an SVM classifier, Omondiagbe et al. [30] suggested a fusion technique for the detection of breast cancer. Linear discriminant analysis (LDA) was used to reduce dimensionality. Li and Chen [31] investigated the link between breast cancer and certain characteristics that could help minimize mortality. Two data sets and five classification methods were used to test the proposed model. Hajiabadi et al. [32] used an artificial neural network (ANN) as an objective function for the detection of breast cancer. The author used a mixture of three loss functions: cross-entropy, Hinge, and correntropy, to analyze the data set at varying noise levels, enhance generalization, and detect loss functions. Shravya et al. [33] recommended a breast cancer study employing classification approaches such as LR, SVM and kNN classifiers, with SVM proving to be the best classifier. These characteristics were removed from the breast cancer prediction. Using ML technology, Chaurasia [34] investigated and concentrated on breast cancer risk variables and created prognosis methods to estimate survival of breast cancer patients. To categorize normal and pathological cells, three models were used: Nave Bayes (NB), RBF network, and J48. Aavula and Bhramaramba [35] presented a technique to detect breast cancer, patient survival, and recurrence. In the investigation of prognostic factors for the assessment of risk and recurrence, an innovative method was used, an extensive breast cancer diagnosis framework was used. To improve prognostic factors, they used representative feature subset selection (RFSS) with SVM. Nandagopal et al. [36] used LR and maximum likelihood estimation (MLE) combined with fuzzy logic to select and categorization of benign and malignant stages of breast cancer, the author. Abdar et al. [37] created a two-layer nested ensemble classifier. The model was evaluated by employing K-fold cross-validation. Stacking and voting ensemble voting were used. The performance of the NB method for breast cancer detection increased with this model. For detecting breast cancer, Wang [38] combined microwave breast imaging with X-ray mammography. Microwave biosensors were developed to detect breast cancer. To discriminate between normal and diseased tissues, a low dielectric characteristic was used. Mansour [39] proposed a computer-aided system for breast cancer detection using an adaptive learning-based Gaussian aggregate model (GMM), and AlexNet-DNN-based feature extraction in combination with principal component analysis (PCA) and LDA. The proposed technique scored 96.70% for the AlexNet-FC7 model. Ragab et al. [40], for the identification and categorization of breast cancer using ultrasound pictures, researchers developed a novel ensemble deep learning-enabled clinical decision support system. To detect the tumor-affected regions, the researchers devised an optimum multilevel thresholding-based picture segmentation technique. The researchers also created a feature extraction ensemble of three deep learning models and an effective ML classifier for the diagnosis of breast cancer.
Machine learning algorithms learn from data and alter their internal settings accordingly. These parameters are referred to as “model parameters” or “parameters” for short. Other factors, on the other hand, are not altered during the learning process but must be pre-configured before the learning process begins. Hyperparameters are a term used to describe such parameters. The model parameters describe how the input data is transformed into the intended output, whereas the hyperparameters describe how the model is organized. The choice and settings of a machine learning model’s hyperparameters can have a significant impact on its performance. The decision tree method, for example, contains a “tree depth” hyperparameter; a reasonable value for this hyperparameter can yield decent results, but a high number can reduce the algorithm’s performance. As a result, hyperparameters should be set with caution. For a given dataset, hyperparameters might be set using a variety of approaches. One option is to manually configure them and calculate the accuracy. Other hyperparameter values may then be evaluated, and the associated accuracy can be determined for each modification. Manually adjusting the hyperparameter values in such a trial-and-error manner is a time-consuming and inefficient approach. Another way to discover an acceptable hyperparameter configuration is to utilize the default values of hyperparameters provided by the software packages used in the implementation, which are in turn based on literature and experience recommendations. While default settings may work well for a particular dataset, this does not always imply that they provide the highest accuracy.
The significance of this work lies in the number of hyperparameter tuning methods that are compared, the DL algorithms that are evaluated, and, most importantly, the nature of the classification issue, which is the Breast Cancer analysis. A number of studies were reviewed that used ML or DL approaches to solve the BC classification problem in the IoMT or IoT environment, but none that we are aware of have used hyperparameter tuning algorithms to find the best hyperparameters that will lead to the best classification accuracy for the DL algorithm used in this study. This collection of hyperparameters is not the same for every classification issue and varies depending on the problem’s nature.
The main objective of this research is to develop an IoT-based diagnostic model built on an ML algorithm to accurately diagnose people with breast cancer and healthy people. For the categorization of breast cancer in malignant and benign individuals, the SVM and MLP ML diagnostic models were applied as baseline models for comparison. For the choice of features that increase the performance of the SVM and MLP classifiers, the PSO method was used. We chose PSO as a suitable feature selection in this work because of its global search capabilities, resilience to control parameters, and computing efficiency [41]. This proposed approach differs from previous studies by overcoming some paradigms related to feature selection in distinguishing the two groups of classes, which are benign and malignant cancer cells. This was done using PSO to choose the right features. The classification will also be performed using an IoT-based diagnostic system based on ML classifiers to improve the classification accuracy in determining whether a breast cancer case is benign or malignant. Current research has focused on hyperparameter optimization, not just using ML classifiers alone, as evidenced by the literature study [42]. Other studies focus on the tuning and optimization of hyperparameter values in order to improve the performance of models [43,44,45,46].
The related works are summarized in Table 1.

3. Materials and Methods

3.1. Dataset

Dr. William Wolberg of the University of Wisconsin generated the WDBC dataset, which is distributed at the UCI ML repository. We used it as a data set in this study to create an IoT-based ML model for the diagnosis of breast cancer. 569 participants are included in the dataset, with 32 characteristics and 30 real-value features. Malignant and benign samples are represented by two classes on the output label of the target. There are 357 benign and 212 malignant patients in the data set, which is a 569 × 32 feature matrix.

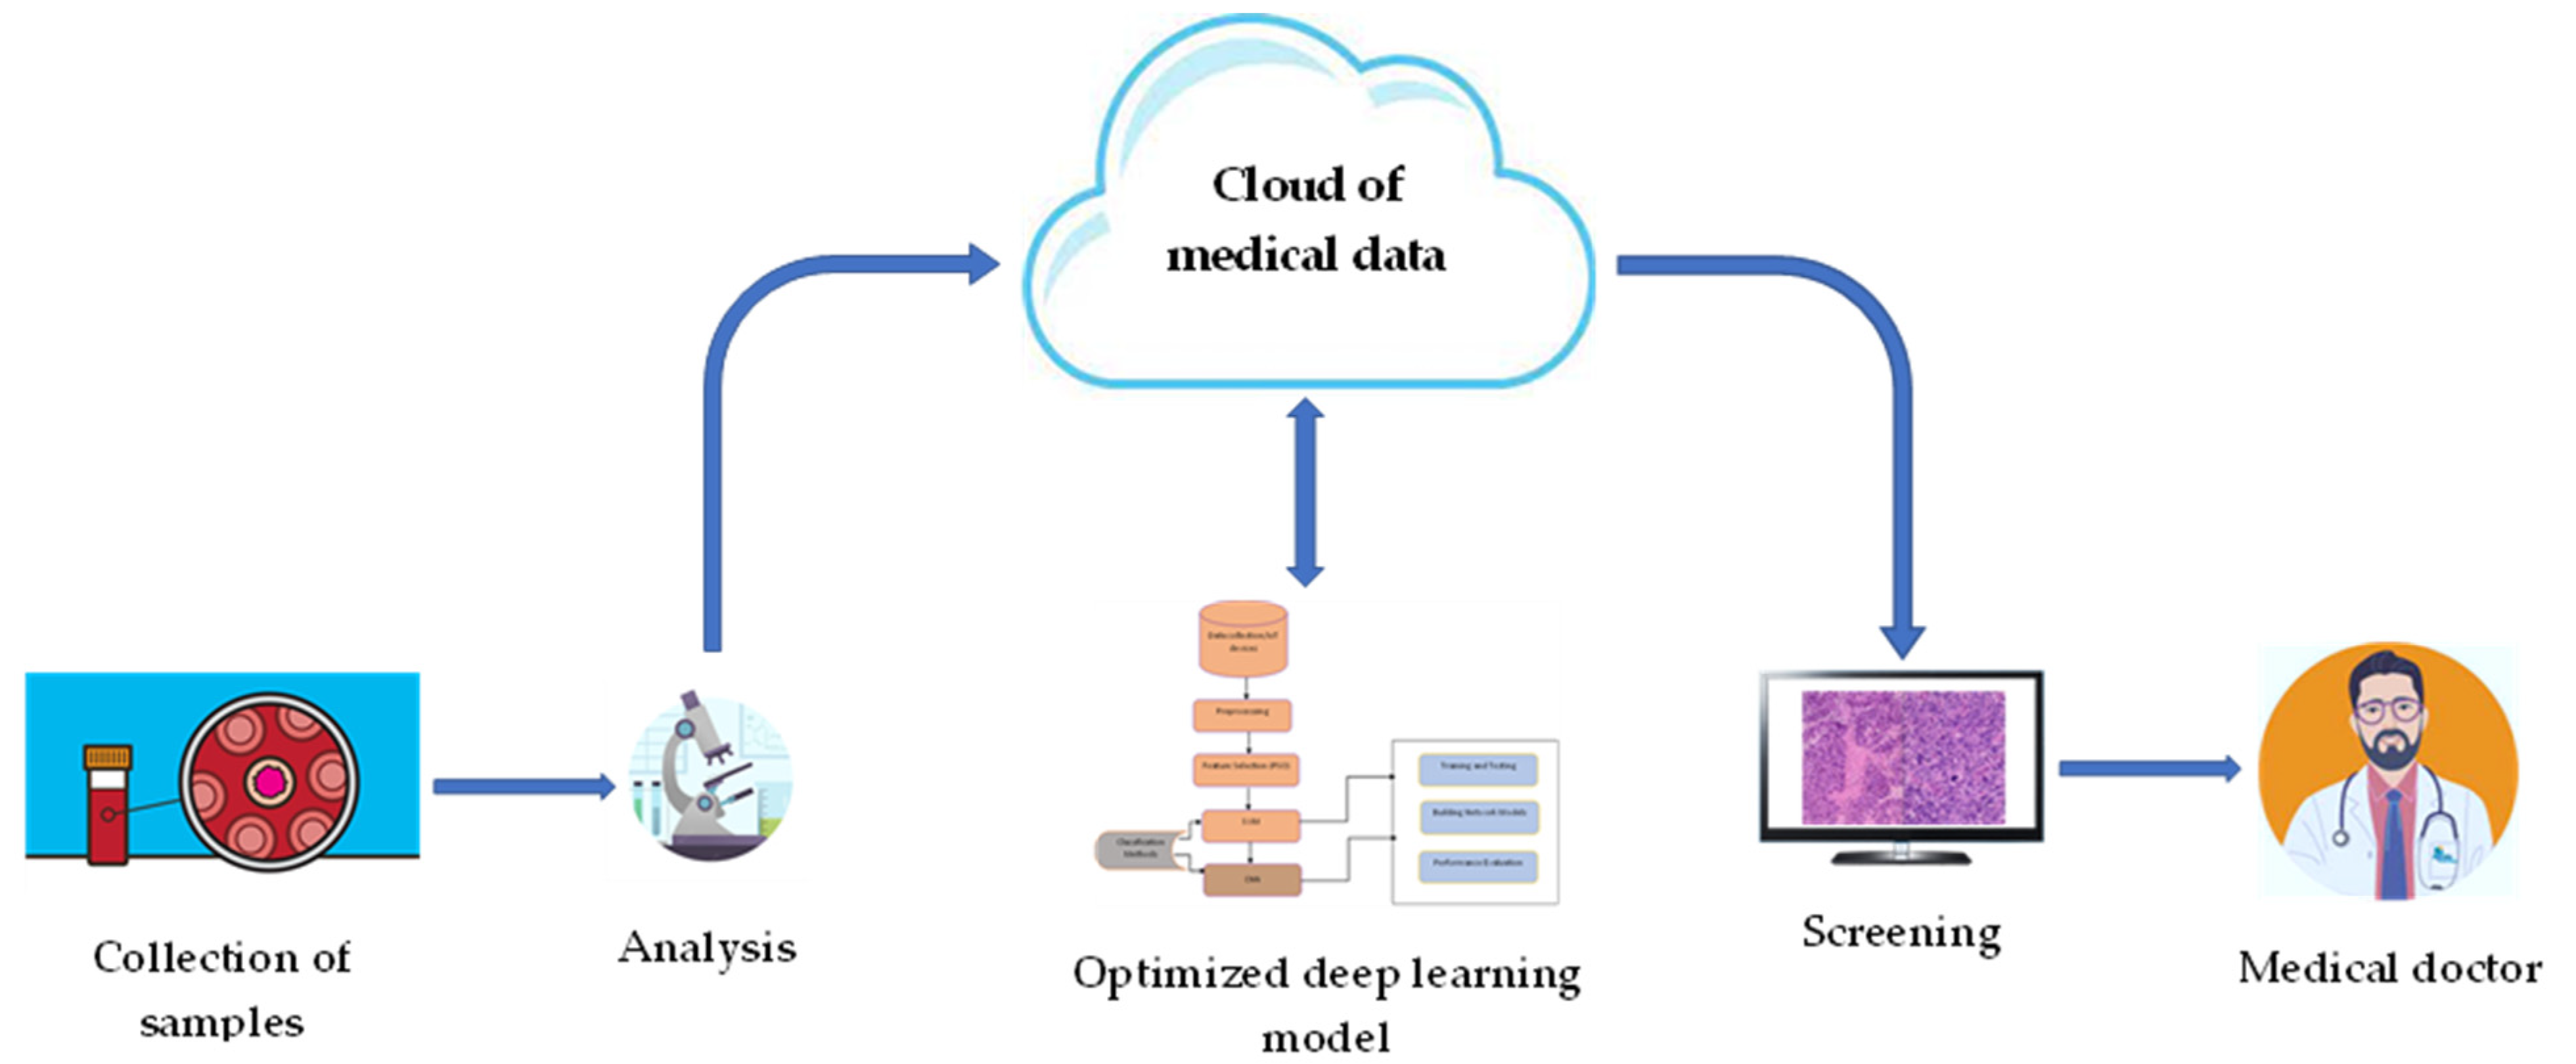
3.2. Overall IoMT-Based Framework

Figure 1 shows the framework of our introduced IoMT-based breast cancer diagnosis approach. It is divided into three major stages, which are as follows: First, histopathological breast samples are collected from patients and tested. The cell images obtained from a microscopy imaging device are forwarded to a cloud data server to provide additional options. Histopathological image samples, for example, including annotations, are recorded in the patient’s electronic health record (EHR) database. The acquired sample features are then analyzed using our custom-built and hyperparameter-optimized CNN classifier. Using cloud computing services for the classification of uploaded samples is preferred in our proposed framework to reduce the use of computational resources and file storage. Third, the results of the breast cancer detection are transferred to the therapist’s computer display or smartphone, where they are verified and finalized with medical recommendations.
The system framework, described in Figure 1, represents the classification for detection of breast cancer using IoT, using hyperparameter-optimized and trained models. Medical doctor can use computers, laptops, and mobile devices to access the platform. The MIoT system has a web interface that allows you to choose between two options: training or prediction. The user must supply the sample exam result dataset during the training stage. After that, feature extraction is performed, resulting in a feature vector. Classifiers are trained by using the feature vectors and then optimization of hyperparameters is performed. In the previously separated test set, trained models complete a classification step. The user can choose the optimal combination from the results of the experiments. The model is accessible via a medical cloud service that may be accessed from any Internet-connected device. The cloud-based e-Health care application server can efficiently detect and classify the malignancy of breast cells as data enters, using the proposed approach, and relay the results back to the local health care institution for appropriate medical action. The user can utilize an application programming interface (API) to perform a suggested diagnosis at the prediction stage and communicate the results to the medical doctor for a final clinical decision.

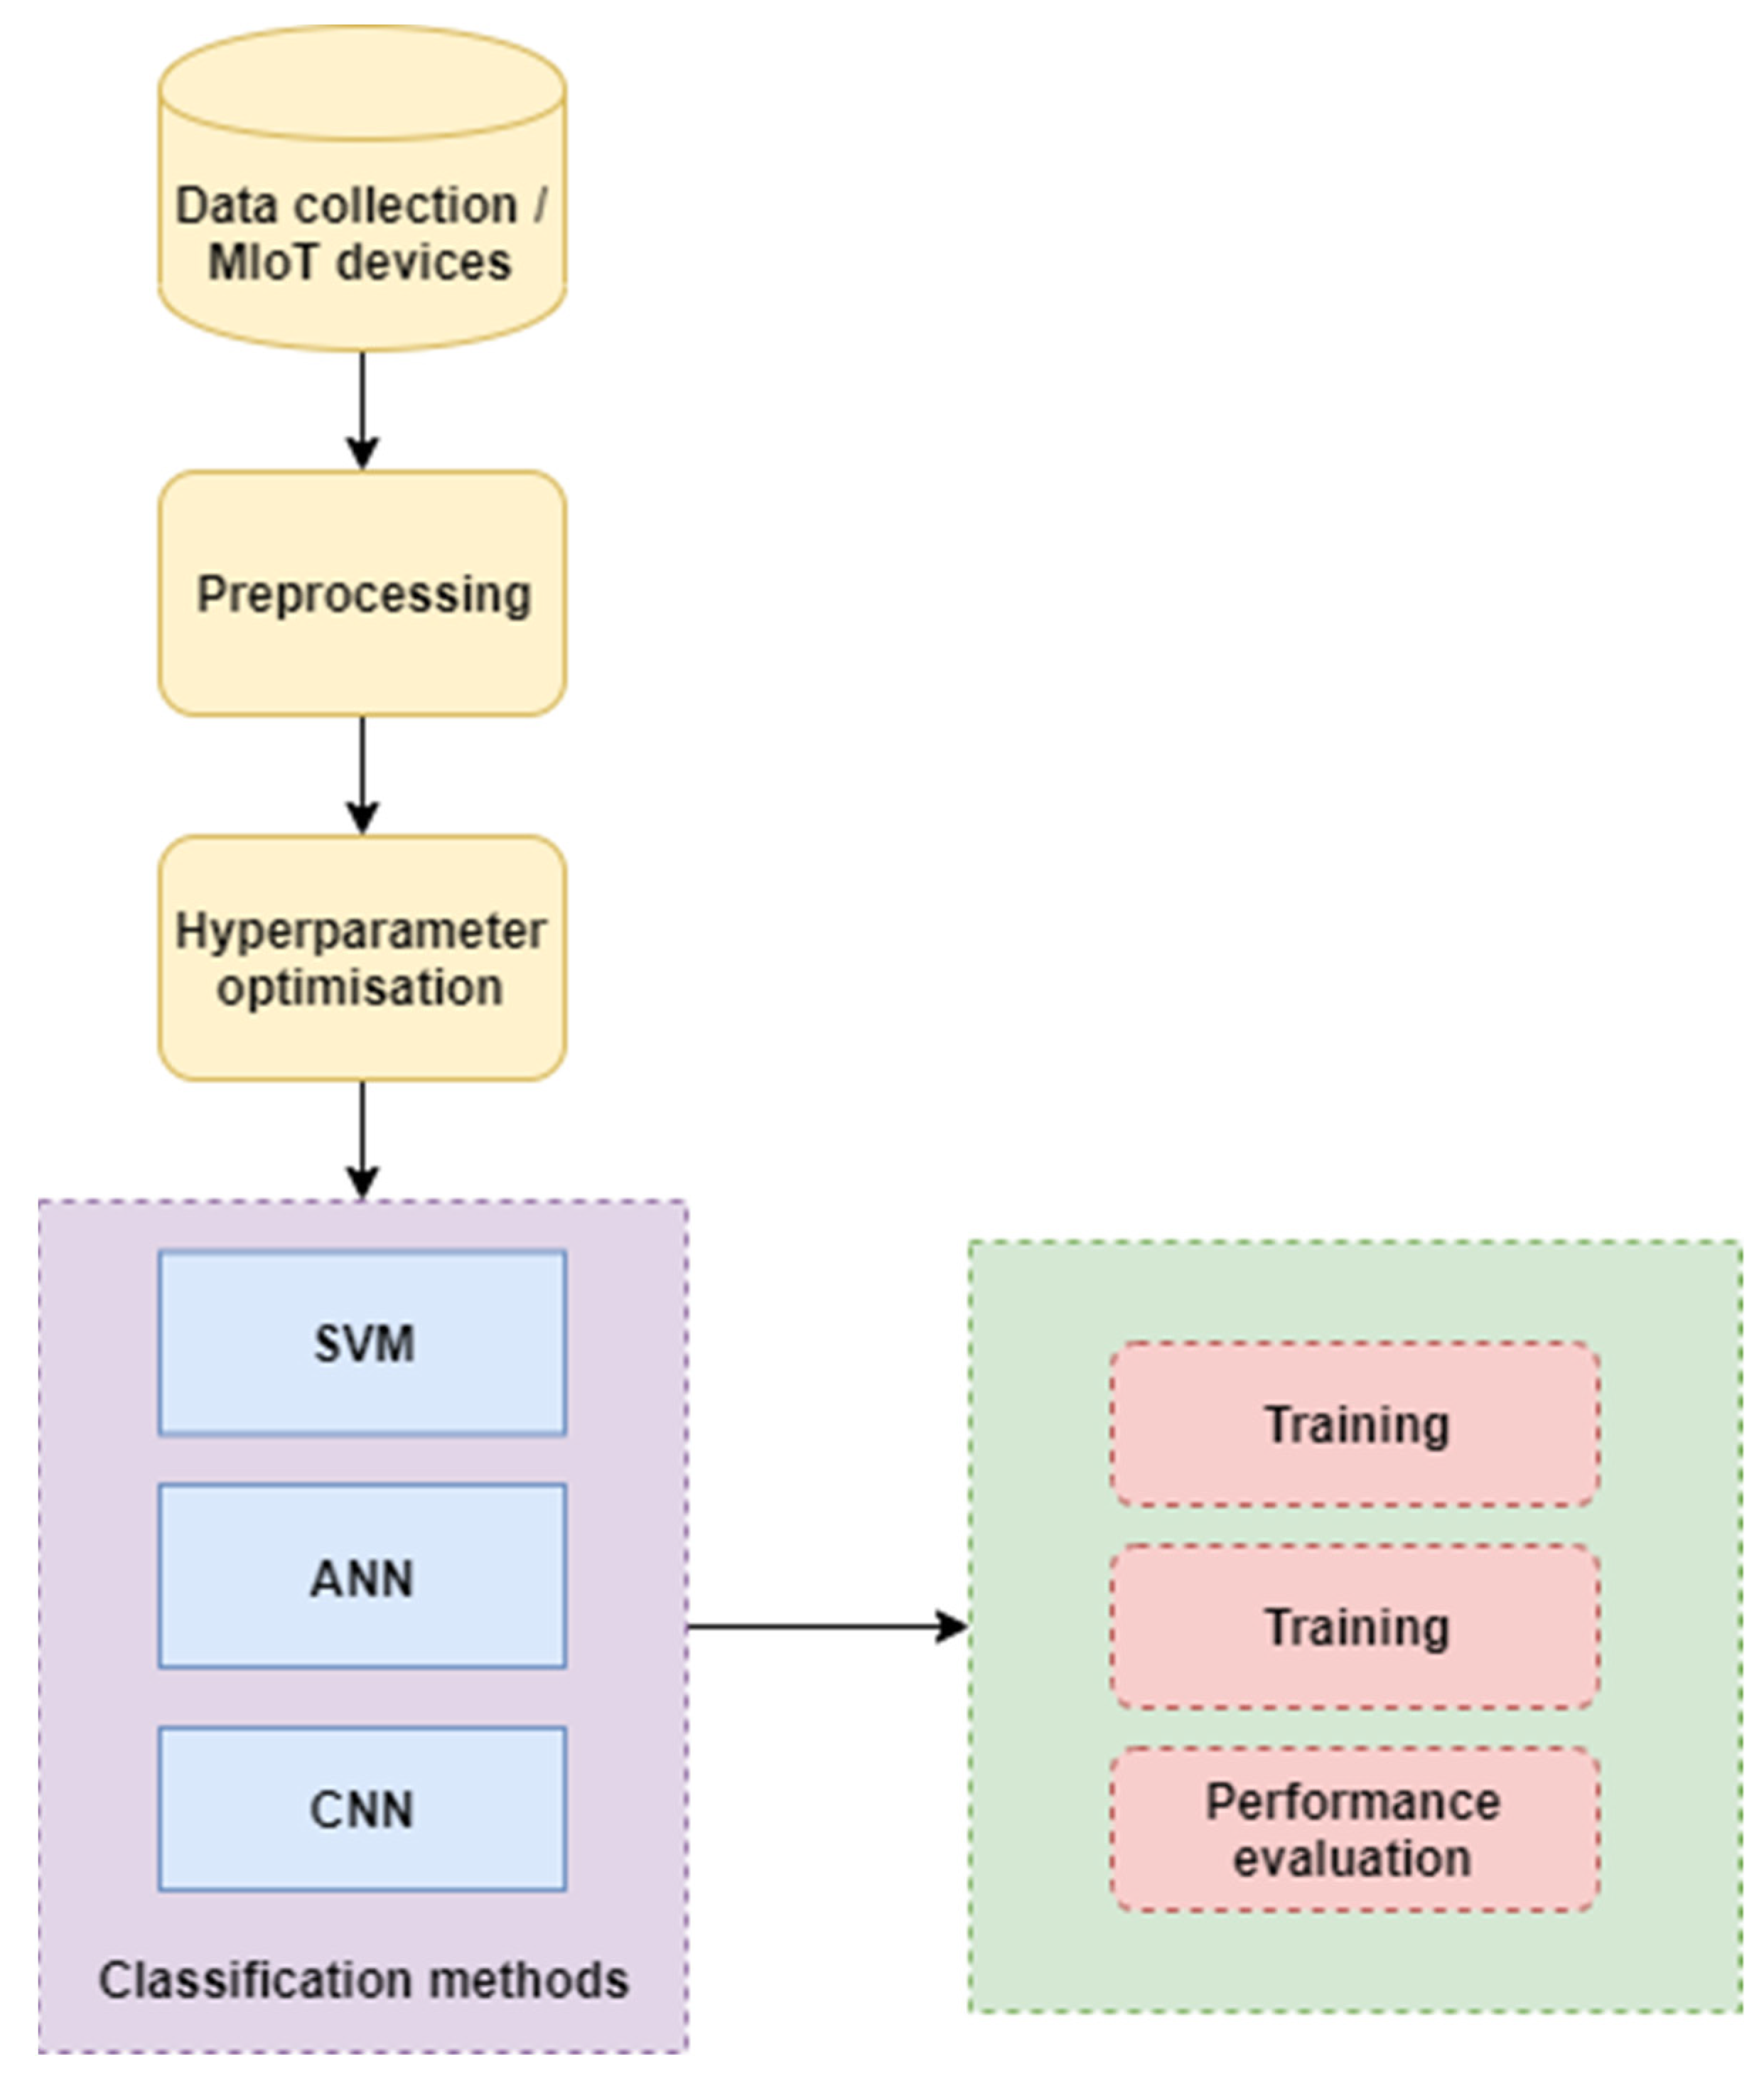
3.3. Proposed Methodology

Breast cancer is recognized to be one of the most common tumors in women that leads to invasive malignancies. The current state-of-the-art study focuses mainly on predicting gene expression patterns at an early stage for clinical diagnosis. Figure 2 shows the proposed architecture for diagnosing breast cancer.
SVM is one of several classification algorithms used in biomedical data analysis, particularly for gene classification [47], but also for the evaluation of motor tremor symptoms [48] and breast cancer diagnosis [49] as it creates a hyperplane in a multidimensional space. The proposed technique relied on feature selection algorithm, model hyperparameter optimization, and classification approaches that were used to diagnose cancer-related patterns. The prognosis of various forms of cancer has become an essential aspect of scientific area in recent years. ML approaches were used to create model tools that would detect important elements of the cancer pattern in various stages [50]. Medical IoT devices are used to monitor a variety of physiological indicators. With this medical IoT environment, breast cancer can be diagnosed quickly and accurately. Extensive experiments have been conducted, paving the way for the utilization of ML approaches to interpret real-time data [51].

3.4. Data Preprocessing

Data processing is required before using ML to solve categorization issues. It processed data [52], which decreased the classifier’s calculation time and improved the classifier’s classification performance. Detection of missing values, z score, and Min-Max normalization scheme are methods used for preparing data sets. Every feature has a mean of 0 and a variation of 1 in the standard scalar, therefore, all features have the same coefficient. The Min-Max scheme moves the data so that all values are between 0 and 1. The feature with an empty row value is removed from the dataset.

3.5. Artificial Neural Networks (ANNs)

ANN is a sequence of fully connected neuron layers that convert an input data x to a distribution of probability to predict the output class variable y . As a result, the ANN serves as a function that performs the mapping for the probability distribution p ( y | x ) for which the ANN was trained. This function is mapped by an ANN utilizing l hidden layers followed by an output layer. The weighted edges connect the nodes in each layer to all the nodes in the succeeding layer. These weights can be seen as a weight matrix. Each layer of the network also has a bias vector b . A non-linear function is used as part of the calculation in all hidden layers. Each neuron in the model has an activation function associated with it. This function sets the output value of each neuron in a range of −1 to 1, or of 0 to 1. In earlier publications, the activation function was often a softmax function.
softmax ( x i ) = e ( x i ) j e ( x i )
where x is a single value output.
However, rectified linear units can outperform uncorrected linear units in many ANN classification tasks. Dropout is a deep learning-specific regularization approach that is commonly utilized. In each repetition, it randomly disables certain neurons. It simply implies that neurons are “fallen out” at random. When certain neurons are turned off, we are training a separate model that only employs a subset of neurons in each iteration. As a result, neurons can learn characteristics individually, without relying on other neurons. The dropped neurons are deleted during the forward phase, and no weight update is applied to them during the backward propagation stage. Typically, dropout occurs in fully linked layers because they have the most parameters, and hence are more likely to co-adapt excessively, resulting in overfitting.

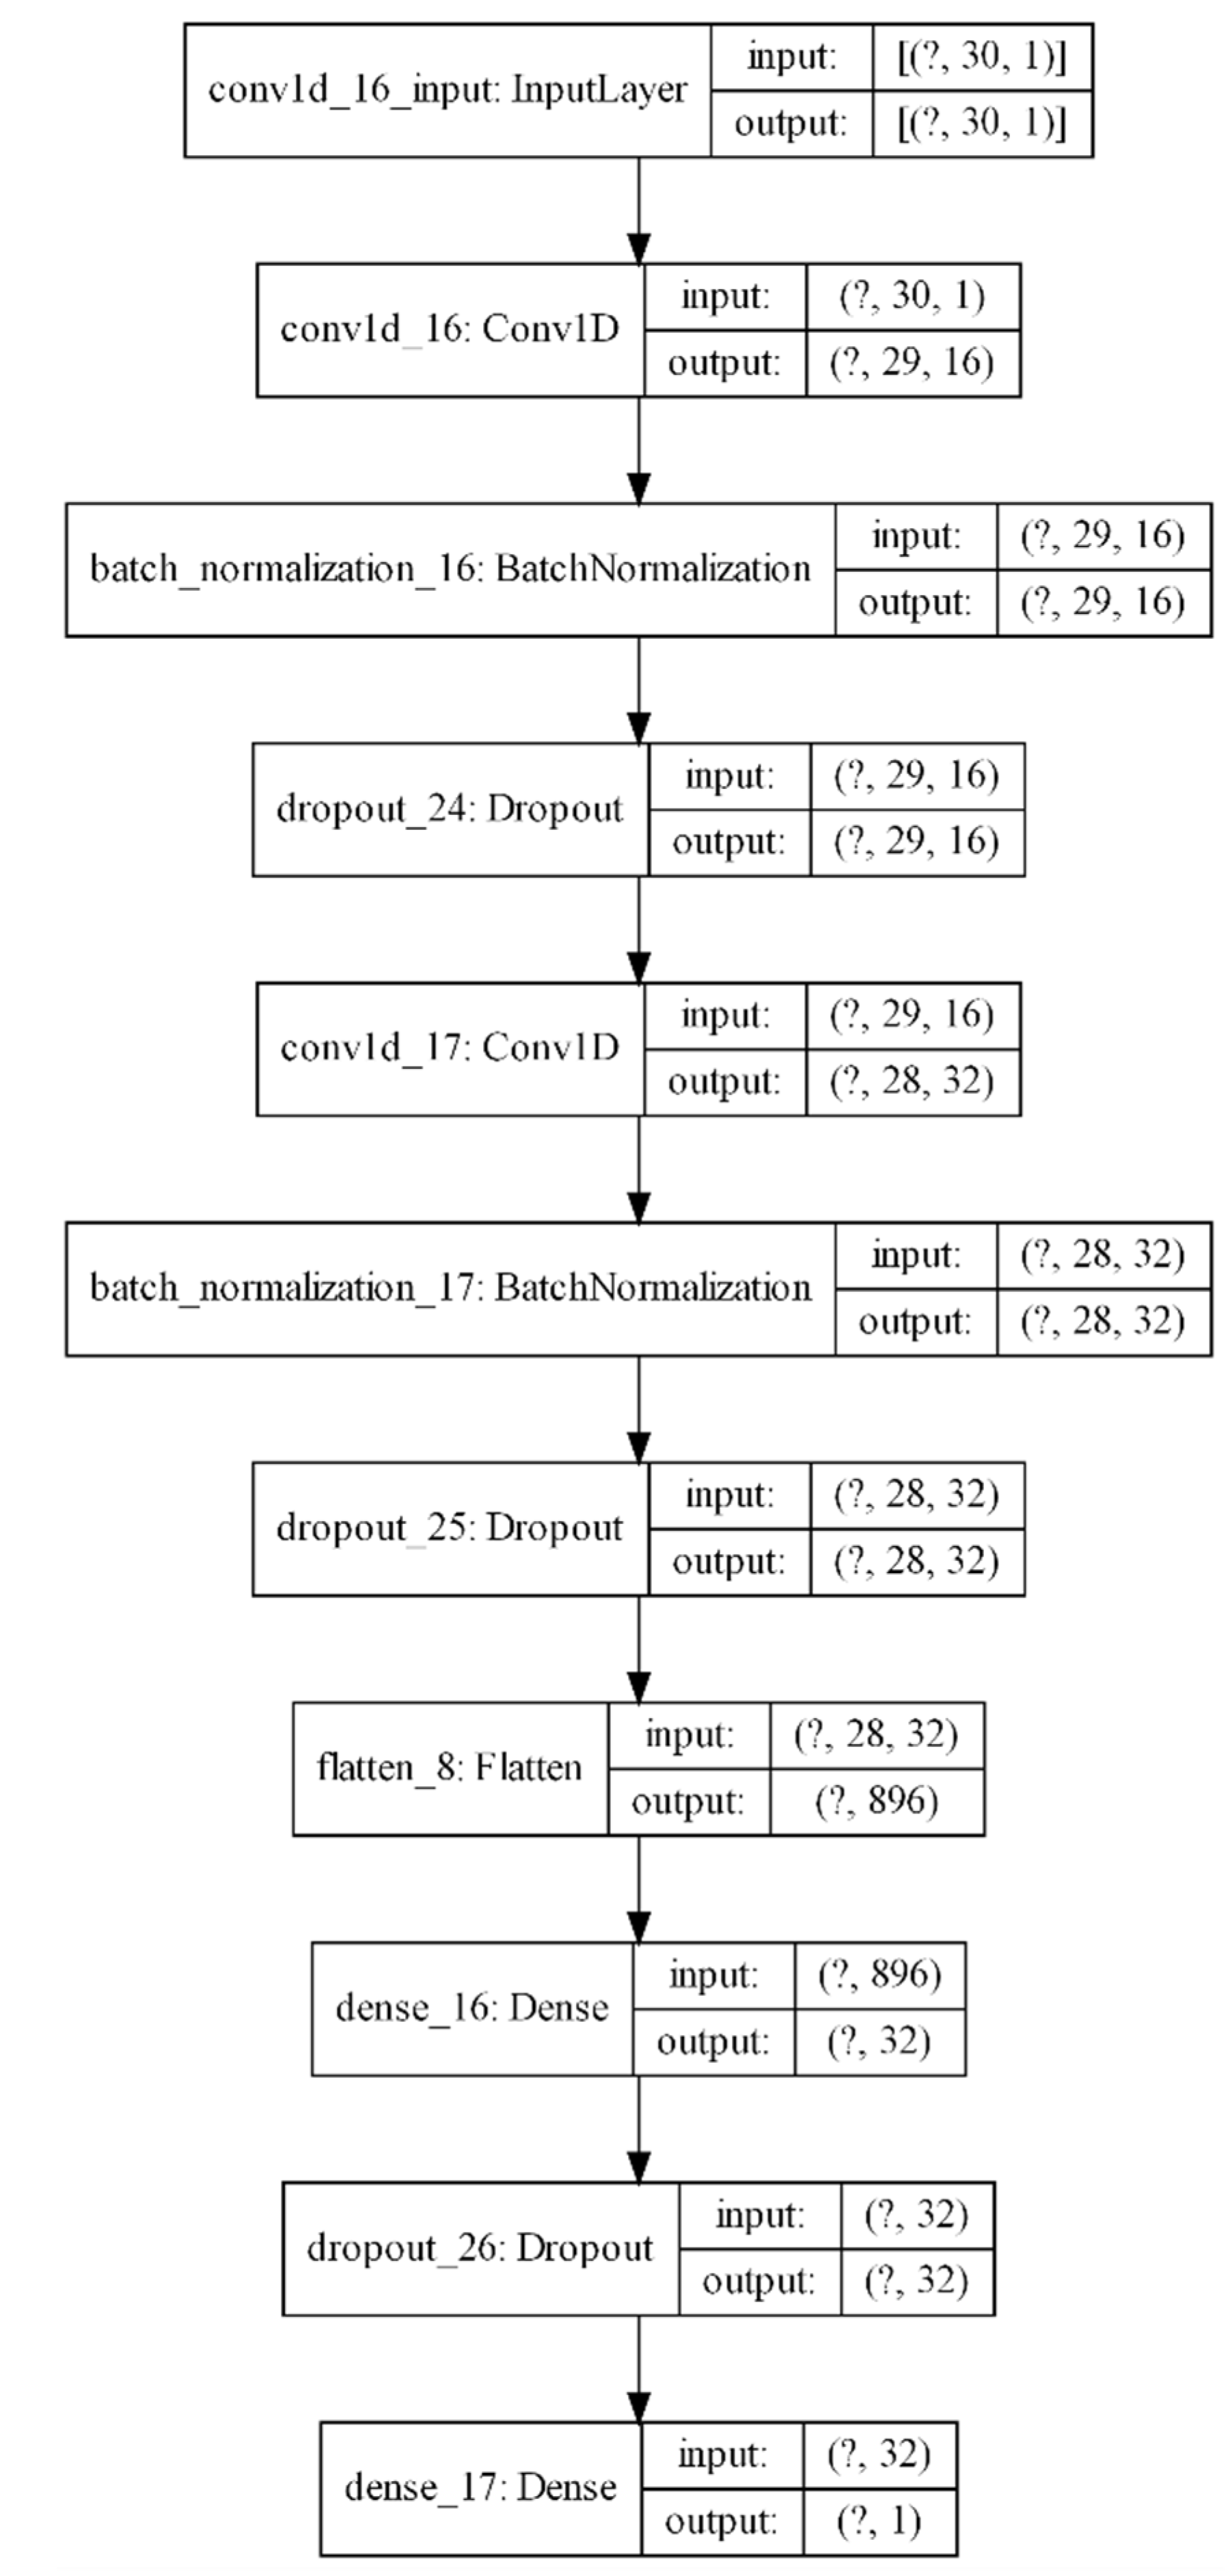
3.6. Convolutional Neural Networks (CNNs)

CNN is a form of deep neural network commonly used in image processing. Convolution is a computational process that aggregates two functions to obtain a function, which is expressed as the summation of the products of two functions after a function has been inverted and shifted. In CNN, a convolution is done on its input and an array of weights, called filters, is created to create an object map. The filter moves over the input and matrix multiplication is performed at each time step. This is done for each input parameter (entity), and the results are aggregated to create a new feature map. In the case of series or time series, dilating causal convolutions are often used. Causality indicates that the output of the filter is independent of future input time steps. The network may look back in time with fewer layers while retaining input scale (i.e., the number of time steps in the sequence) and computing efficiency by stacking dilated convolutions. Each new layer increases the dilation factor exponentially with the depth of the network. Epoch number is the number of iterations the neural network has processed the training data set. The more data that is exposed to the network, the better it learns to make predictions. On the other hand, overexposure can result in overfitting: The training error is small, but the error increases dramatically as new data are presented. This is avoided by “stopping early” training when the validation error no longer falls. Early breakpoints are used to shorten network learning time during optimization.
The CNN architecture (Figure 3) has one-dimensional convolution, batch normalization, and dropout layers. The final layer is a fully connected dense layer used for classification. The network weights are modified after each batch. A training epoch is finished after all batches have traveled through the network once. The loss function is used to evaluate how well the network matches the data and is minimized during training by calculating the best weights for neurons. The learning algorithm specifies how the weights of neurons are modified during the learning process. Adam is one of the learning algorithms. The learning rate is the allowable value of the change in the weight of neurons throughout each phase of the training phase. A high learning rate can lead to excessive weight updates, causing network performance to fluctuate throughout training epochs. A learning rate that is too slow may not converge or may become trapped in a poor solution. As a result, the learning rate should be calibrated. The batch size is the set of data that are processed by the neural network in a single phase. More memory may be needed during the training stage as the batch size increases.

3.7. Hyperparameter Optimization

Neural networks are dependent on various hyperparameters that are used to govern the structural organization and the learning procedure, which may be classified as structural and algorithmic hyperparameters [52].
Structural hyperparameters, which are represented by the number of network layers, the number of neurons in each layer, the degree of connection, the transfer function, etc., characterize the network structure and topology of the network. They have an impact on the network’s efficacy and computational complexity as they change its structure. Algorithmic parameters drive the learning process and include the size of the training set, the training algorithm, momentum, learning rate, etc. Hyper-parameters are not part of the neural network model and have no effect on its performance; nevertheless, they influence the speed and performance of the training stage.
Hyperparameter settings for ML models are a predefined set of decisions that have a direct influence on the training process and the prediction output, indicating how well a ML model performs. The process of teaching a model to discover patterns in the training data and predict the output of new data based on these patterns is known as model training. Model architecture, which depicts the model’s complexity, has a direct impact on the time it takes to train and test a model, in addition to hyperparameter choices. Because of their effects on model performance and the fact that the optimum set of values is unknown, the setting has emerged as an essential and difficult topic in the use of ML algorithms. There are various ways to tweak the hyperparameters in the literature.
The methods for optimizing these hyperparameters are described below.
  • The manual search determines the hyperparameter value based on the researcher’s intuition or expertise and can be employed when the researcher has a strong grasp of neural network topology and learning data. However, the criteria for setting hyperparameters are vague and necessitating several experimentations.
  • Grid-based search (GS) identifies the hyperparameter with the highest performance by calculating many values for each hyperparameter and combining them. GS is straightforward, easy to use, and requires minimal prior knowledge. With GS, all potential hyperparameter value combinations are explored to identify the ideal values based on the upper and lower limits of each hyperparameter and a predefined step size, which creates the hyperparameter value space. Because GS runs all potential combinations, it is considered comprehensive. The combination of required runs increases exponentially as the number increases, which is a weakness of GS. As a result, GS takes a long time and has a significant computational cost. Another disadvantage of utilizing GS is that, owing to the nature of some ML algorithms, such as ANN and CNN, rerunning algorithms with the same settings will get differing prediction results and thus different performance.
Designs of experiment (DOE) strategies are used to determine the best hyperparameter values for ML algorithms [53]. DOE assesses the impacts of several experimental elements at the same time, with each experiment consisting of a series of experimental runs at distinct hyperparameter values that should be assessed jointly. Following the completion of the trials, the experimental data are statistically analyzed to determine the influence of the hyperparameters on the classifiers’ performance. To put it another way, an empirical model is developed that links classification performance, such as prediction errors (as a response variable), to hyperparameters (as predictors of classifier performance).
Table 2 provides an overview of all hyperparameters that must be fine-tuned for the CNN model, while Table 3 shows the hyper-parameters of the ANN model to get optimal prediction results. Because testing all potential possibilities in a full factorial manner would be prohibitively costly, these hyperparameters are optimized using the Particle Swarm Optimization (PSO). PSO is a computer approach to solving problems that uses a population of possible solutions, referred to as particles, and moves them around in the search area using a simple mathematical formula based on their location and velocity. Each particle’s movement is impacted by its local best-known location, but it is also steered toward the search space’s best-known positions, which are updated when better places are discovered by other particles. The swarm is predicted to migrate to the best options because of this [54].
The most significant parameters of a neural network are initial learning rate (α0), learning rate decay factor (ϕ), number of hidden neurons (h), and regularization strength (λ). Because all designs achieved comparable identification accuracy, hyper-parameters are frequently more essential than network architecture because a given architecture provides dramatically varying recognition rates with various hyper-parameter combinations.
Finally, the best-performing model with the smallest loss value in the validation dataset is chosen. As the performance of the validation data set is factored into the model’s hyper-parameter optimization, the final performance of the model is evaluated using a hold-out test set. This method yields an unbiased evaluation of performance. Performance metrics are generated independently for each objective to determine which targets are precisely forecasted. Then, the network’s output is utilized to forecast breast cancer disease. The same performance measures as described above are used to assess these results.

3.8. Baseline Machine Learning Classifiers for Comparison

The primary idea behind ML models is that they should provide a framework that excels at feature selection, classification, and diagnosis. In ML approaches, classification is crucial. In this suggested method, two types of categorization examinations have been used. SVM and MLP are two of the classifiers, and they were created for classification testing along with ten cross-fold techniques.
The MLP is an ANN paradigm derived from ML that generates accurate results for diagnosis and health management. Before the classification model is created, the cancer data set instances are separated into two sets: training and testing. Two models are used to validate the data to improve accuracy and gene pattern recognition.
The SVM decision boundary is designed to reduce the generalization error. It is a comprehensive and adaptable ML model that can deal with linear and nonlinear classification, regression, and even outlier detection [55,56].
MLP uses backpropagation during training. Neural networks have been used successfully in various medical expert systems, such as for diagnosis of diabetes [57]. MLP differs from a linear perceptron by its numerous layers and non-linear activation.

3.9. Performance Evaluation Metric

Six evaluation measures were utilized to assess the prediction performance of the proposed classifiers based on the counts of True positive (TP): This means a person is classified as breast cancer; True Negative (TN): This means a healthy person is classified as healthy; False Positive (FP): This means a healthy person is classified as breast cancer; False Negative (FN): This means a breast cancer person is classified as being healthy.
  • Classification Accuracy: demonstrates the performance of the classification system.
    ACC = TN + TP TP + TN + FP + FN 100 %
  • Recall: The ratio of accurately predicted positive observations to all observed positive observations in the actual class.
    SEN = TP TP + FN 100 %
  • Specificity shows that a prediction is negative and the individual is healthy.
    SPE = TN TN + FP 100 %
  • F1-Score: This is the harmonic mean of precision and recall.
    F 1 score = 2   precision recall precision + recall 100 %
  • Precision refers to the accuracy with which the model makes a correct diagnosis.
    PRE = TP TP + FP 100 %
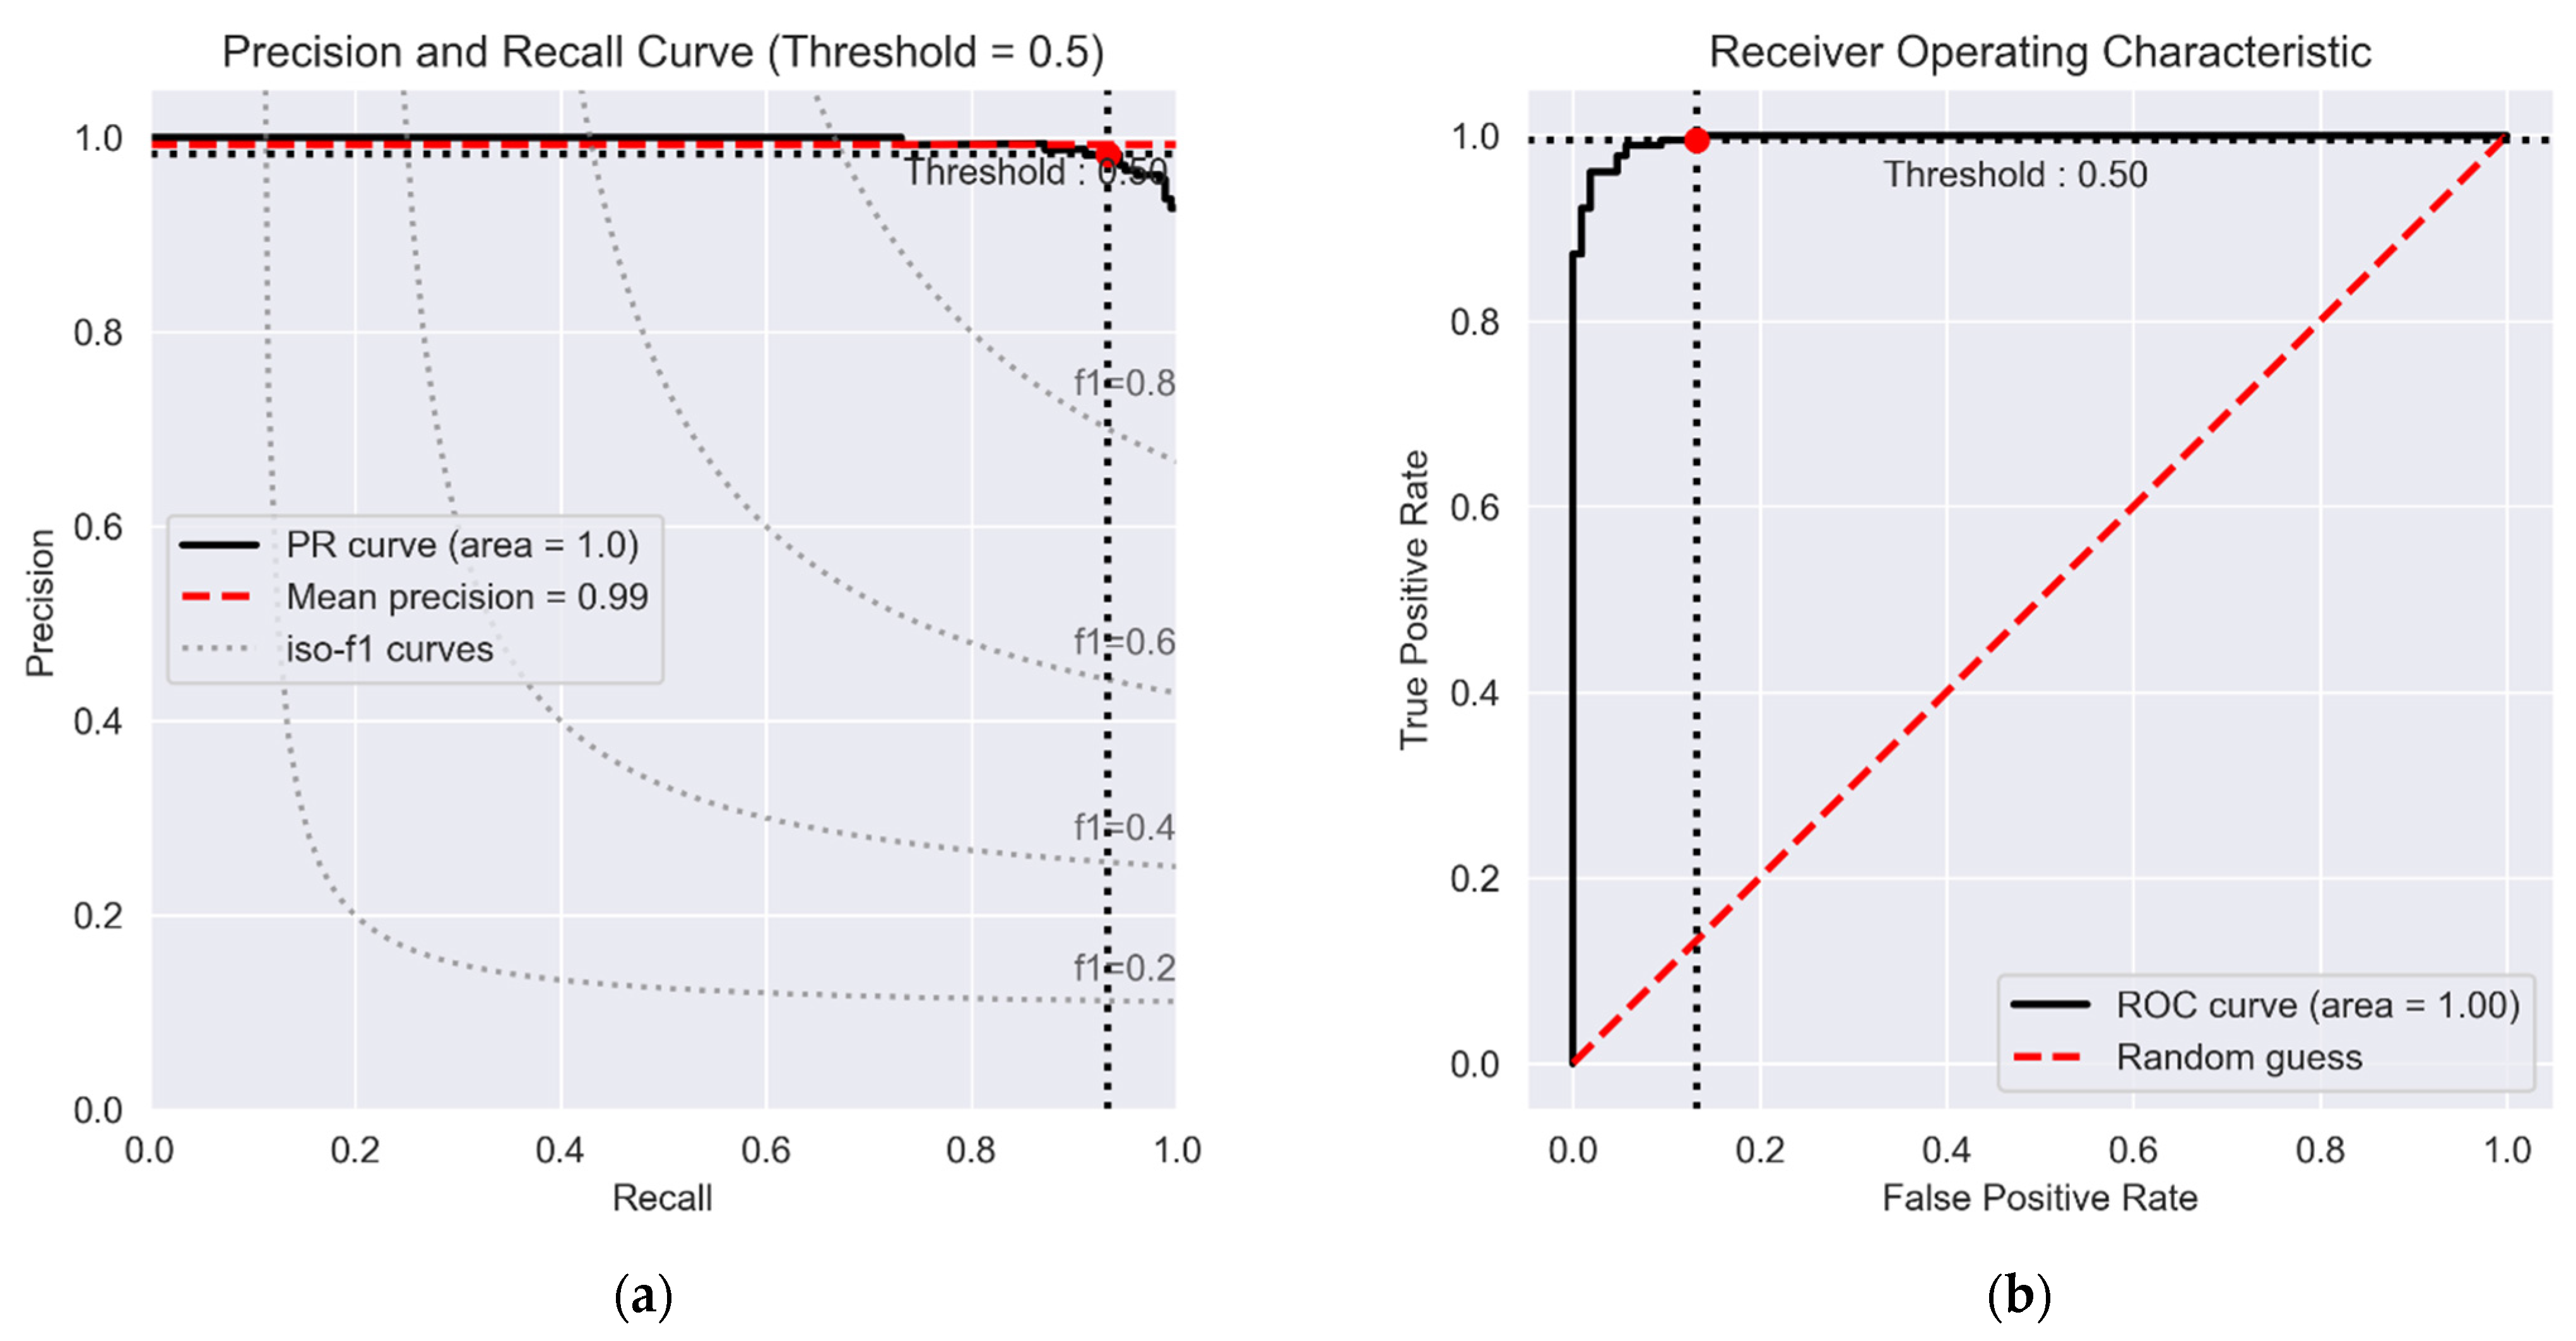
  • Receiver Operator Characteristics (ROC) is a curve that draws the TPs against the FPs at various threshold values for evaluation of binary classification results.
  • The precision-recall (PR) curve is used to assess binary classification algorithms’ performance. PR curves, like ROC curves, provide a graphical depiction of a classifier’s performance by calculating and plotting precision against recall for a single classifier over a range of thresholds rather than a single number.

4. Experimental Results and Analysis

4.1. Dataset and Experimental Settings

The SVM and MLP ML diagnostic system was used for the prediction of breast cancer. WDBC was utilized for the validation of the proposed classifiers. The data set is divided into 65% training and 35% testing and validation in these implementations. The data set has 569 instances with 32 features. The dataset has 357 benign and 212 malignant people. After that, we then perform feature scaling, which is an approach used to normalize the features of the data.
The PSO feature selection algorithm is used to select attributes to be used by the classifiers for the diagnosis of breast cancer. After selecting the attributes, the identification of breast cancer cases is done by ML classifiers. Our methodology was validated with the implementation of the SVM and MLP based approach. The hyperparameters of the SVM were optimized using the Nelder–Mead (downhill simplex) method [58].
To verify the performance of the models, various evaluation metrics, such as accuracy, sensitivity, specificity, recall, precision, and ROC are used. Additionally, all implementation outcomes are presented in tables and graphs for better understanding. All experiments are conducted using Python programming language running on Intel Pentium Core i3 CPU, 2.0 GHz processor speed, 4 GB RAM, and Windows 8 operating system.

4.2. Analysis of the Baseline Classifier Results

The performance of each classifier with the PSO feature selection algorithm has been measured and is detailed in Table 4 whereas Table 5 gives the performance of each classifier without the PSO feature selection algorithm. The result of the performance measurements shows that the proposed MLP classifier with PSO feature selection generates a greater accuracy result when likened to the other classifiers. When comparing the two proposed classifiers, it is discovered that the PSO + MLP classifier outperformed that of PSO + SVM for the diagnosis of breast cancer.
Figure 4 presents the precision of each classifier. Note that the classifier (PSO + MLP) performs the best with an accuracy of 97.2% in diagnosing breast cancer cells. Improvement in inaccuracy is a result of the introduction of the PSO algorithm, which optimizes the problem of classification accuracy by finding the best fit. PSO + MLP performs the best as well with a ROC curve value of 0.972. Therefore, it can be recommended that our proposed model based on the IoT PSO + MLP is used to recognize breast cancer.

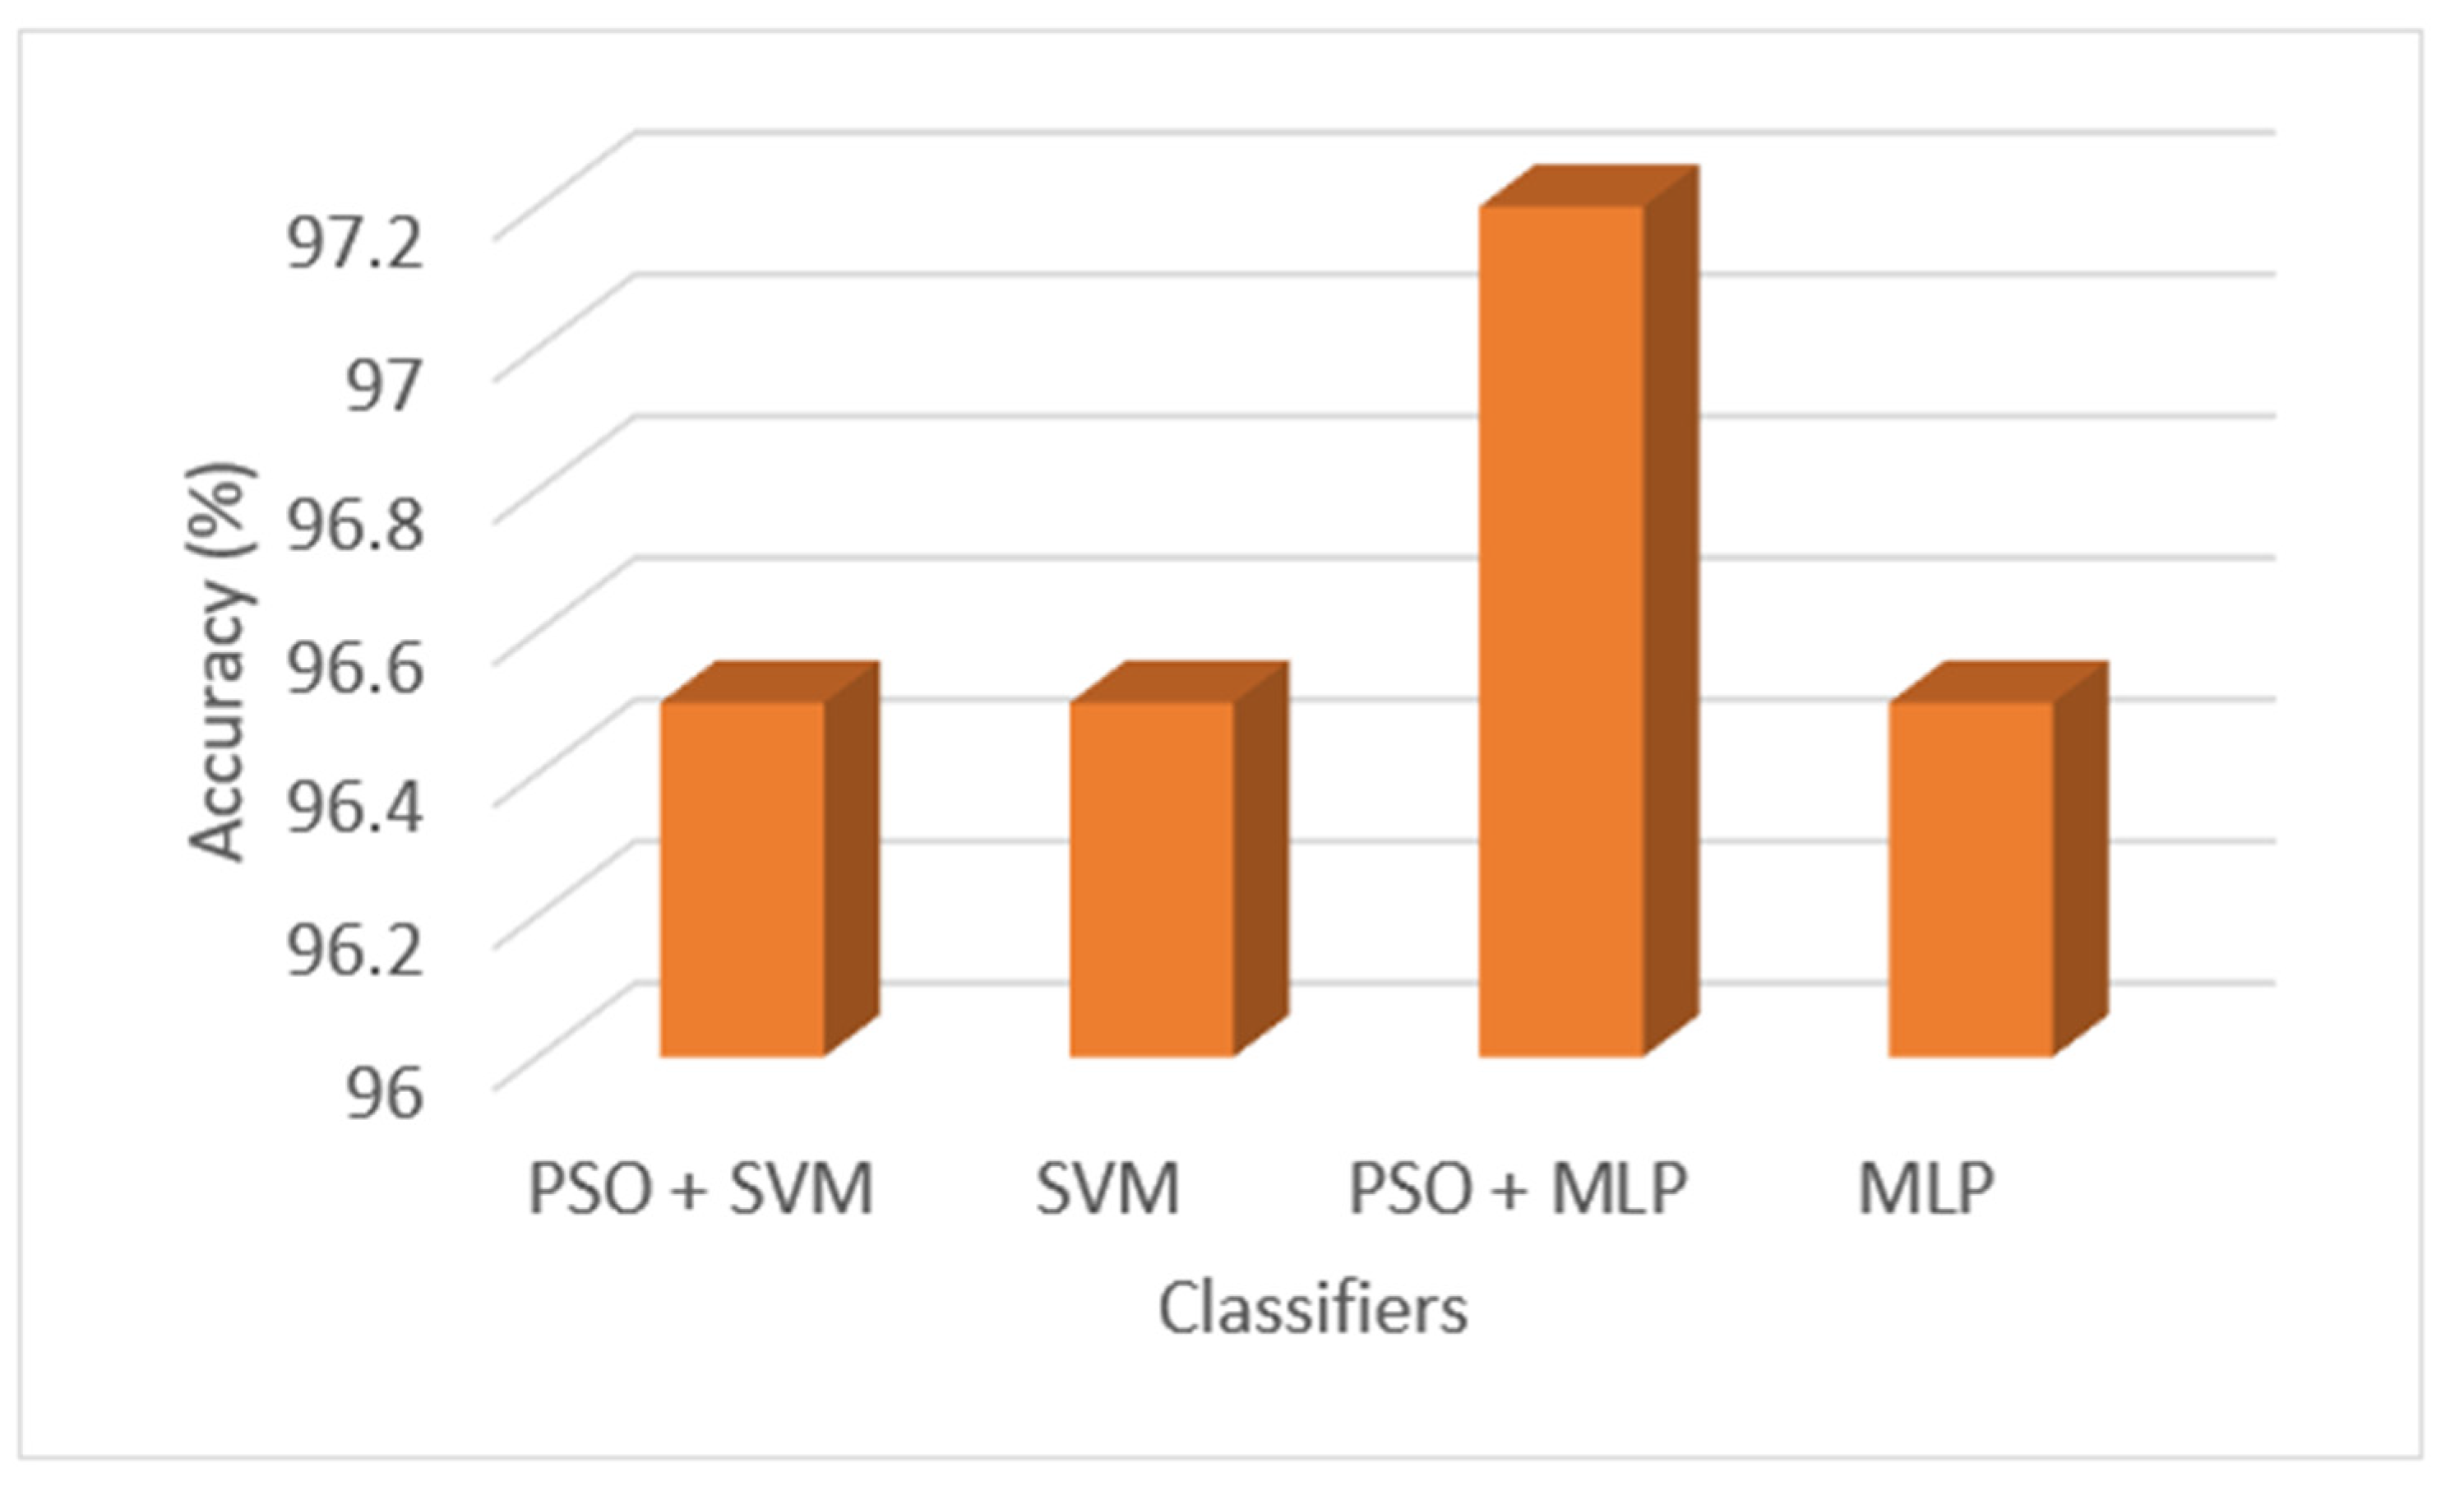
4.3. Optimization of Hyperparameters of the CNN and ANN Models

Hyperparameter tuning findings show that certain combination of parameters has more influence on model’s performance, while others have a modest impact. We have discovered that the width of the filter and the number of layers had a substantial influence on prediction performance. The results further demonstrated that for all filter widths, excellent performance may be attained. Furthermore, utilizing many layers resulted in somewhat higher performance than a single layer, since it allows for more complexity in the model, but it also resulted in a longer training period. The number of layers and the breadth of the filter had a corresponding effect on the training time but not on the classification performance. As a result, if the number of layers is fixed, a large filter width requires less training time than a smaller filter width, despite the fact that both options give equivalent prediction results.
The same is true for the number of filters employed: The more filters utilized, the longer the training time, with no apparent improvement to prediction performance. The number of filters has a considerable influence on the training time (bottom). The number of filters, along with the filter width and the number of layers and stacks, defines the number of trainable parameters. As a consequence, training time is reduced by using fewer filters for the same mix of filter width and layers. Adding more layers to the network increases the depth, and consequently the complexity, of the model. The number of layers influences training time but not performance. If the number of layers were fixed, a broad filter width would need fewer layers, and hence less training time than a smaller filter width, despite the fact that both would provide similar results.

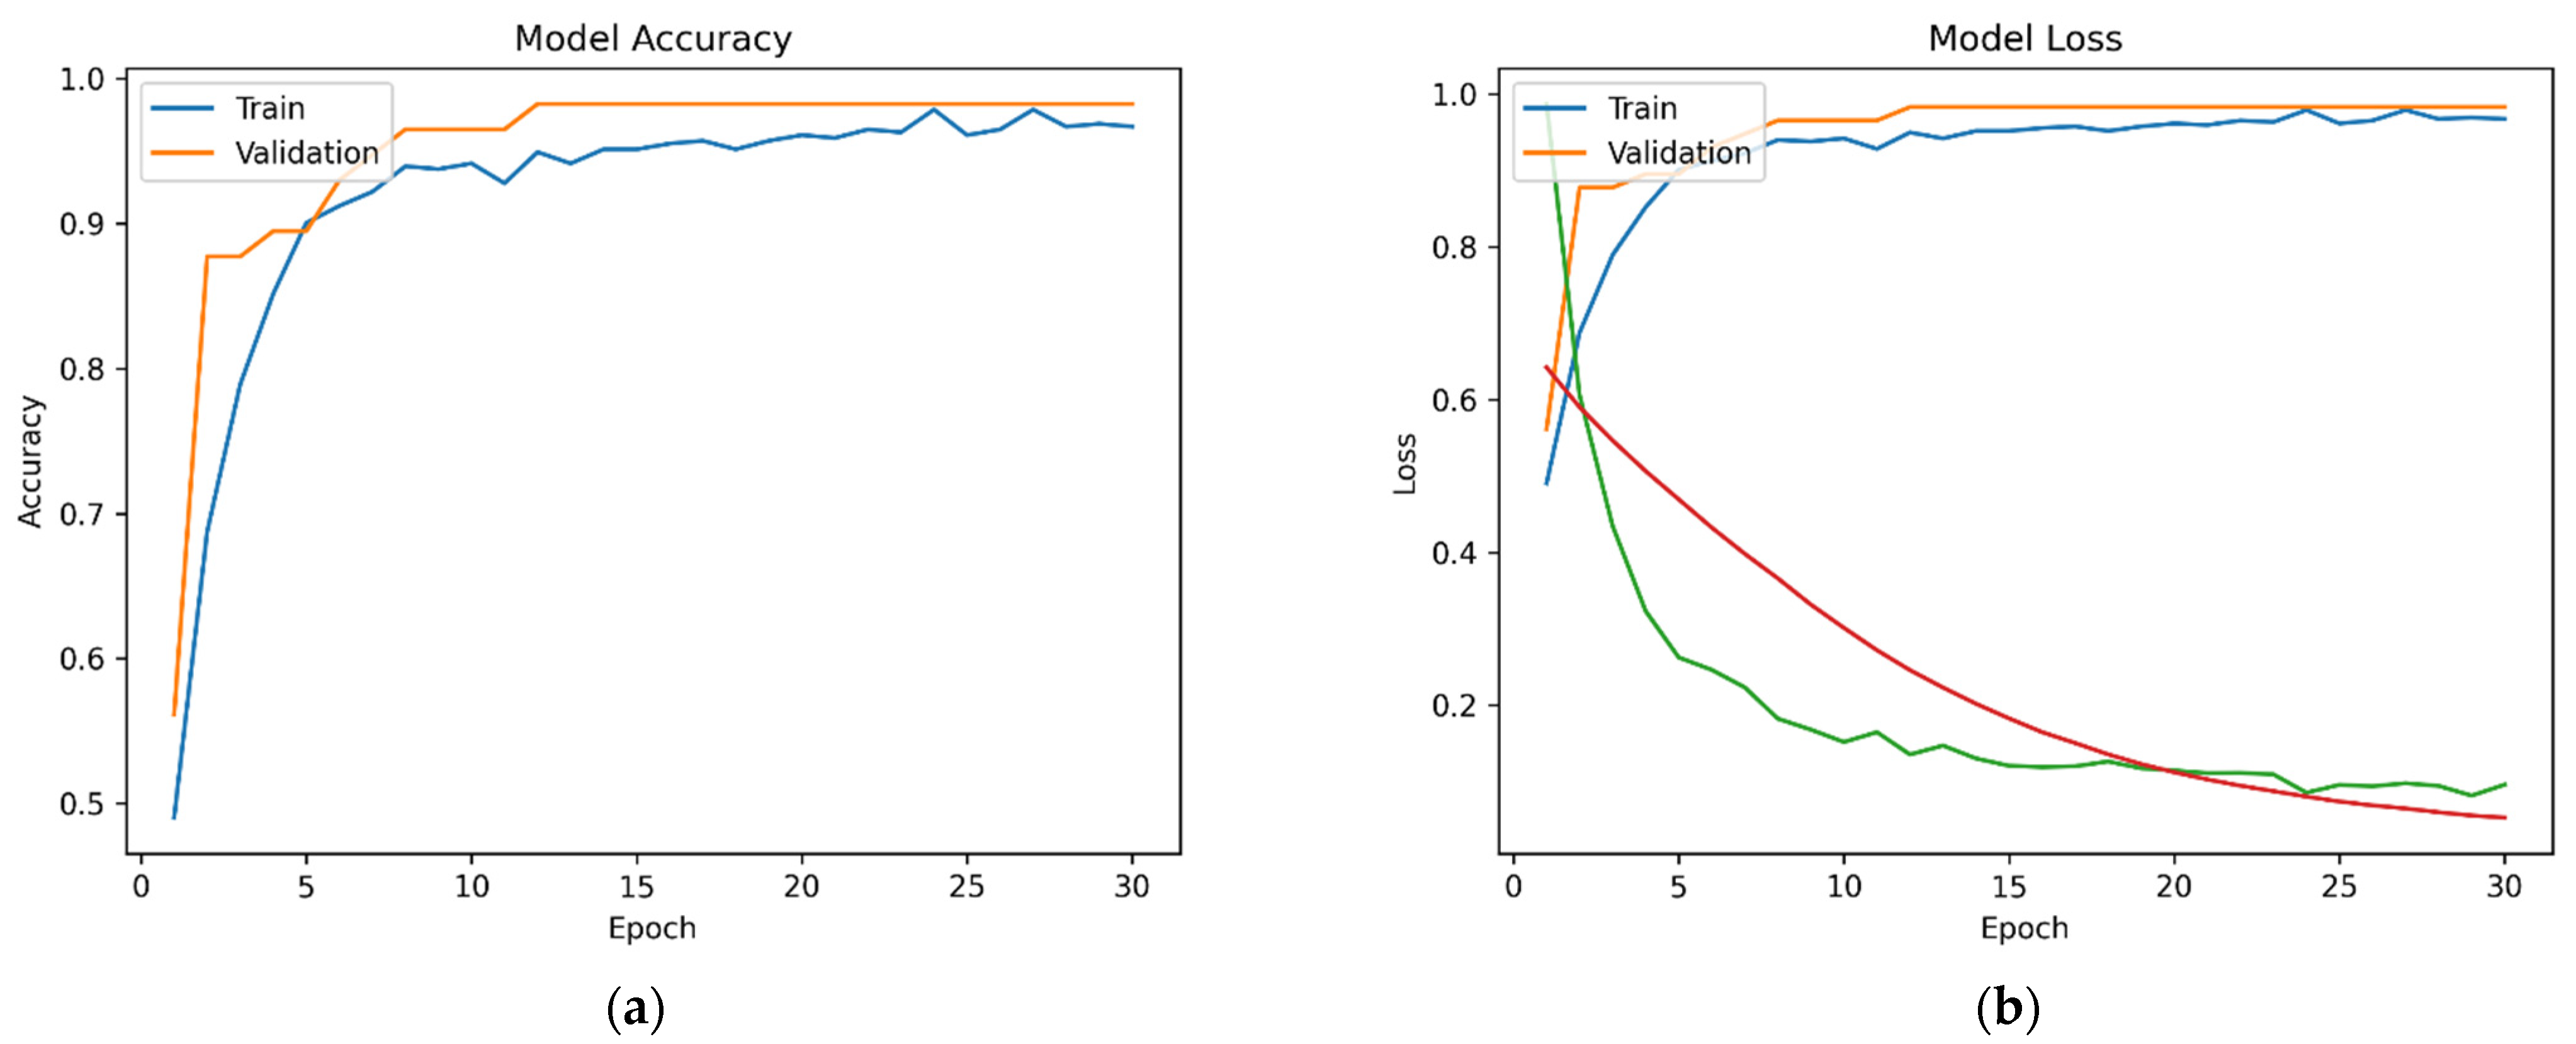
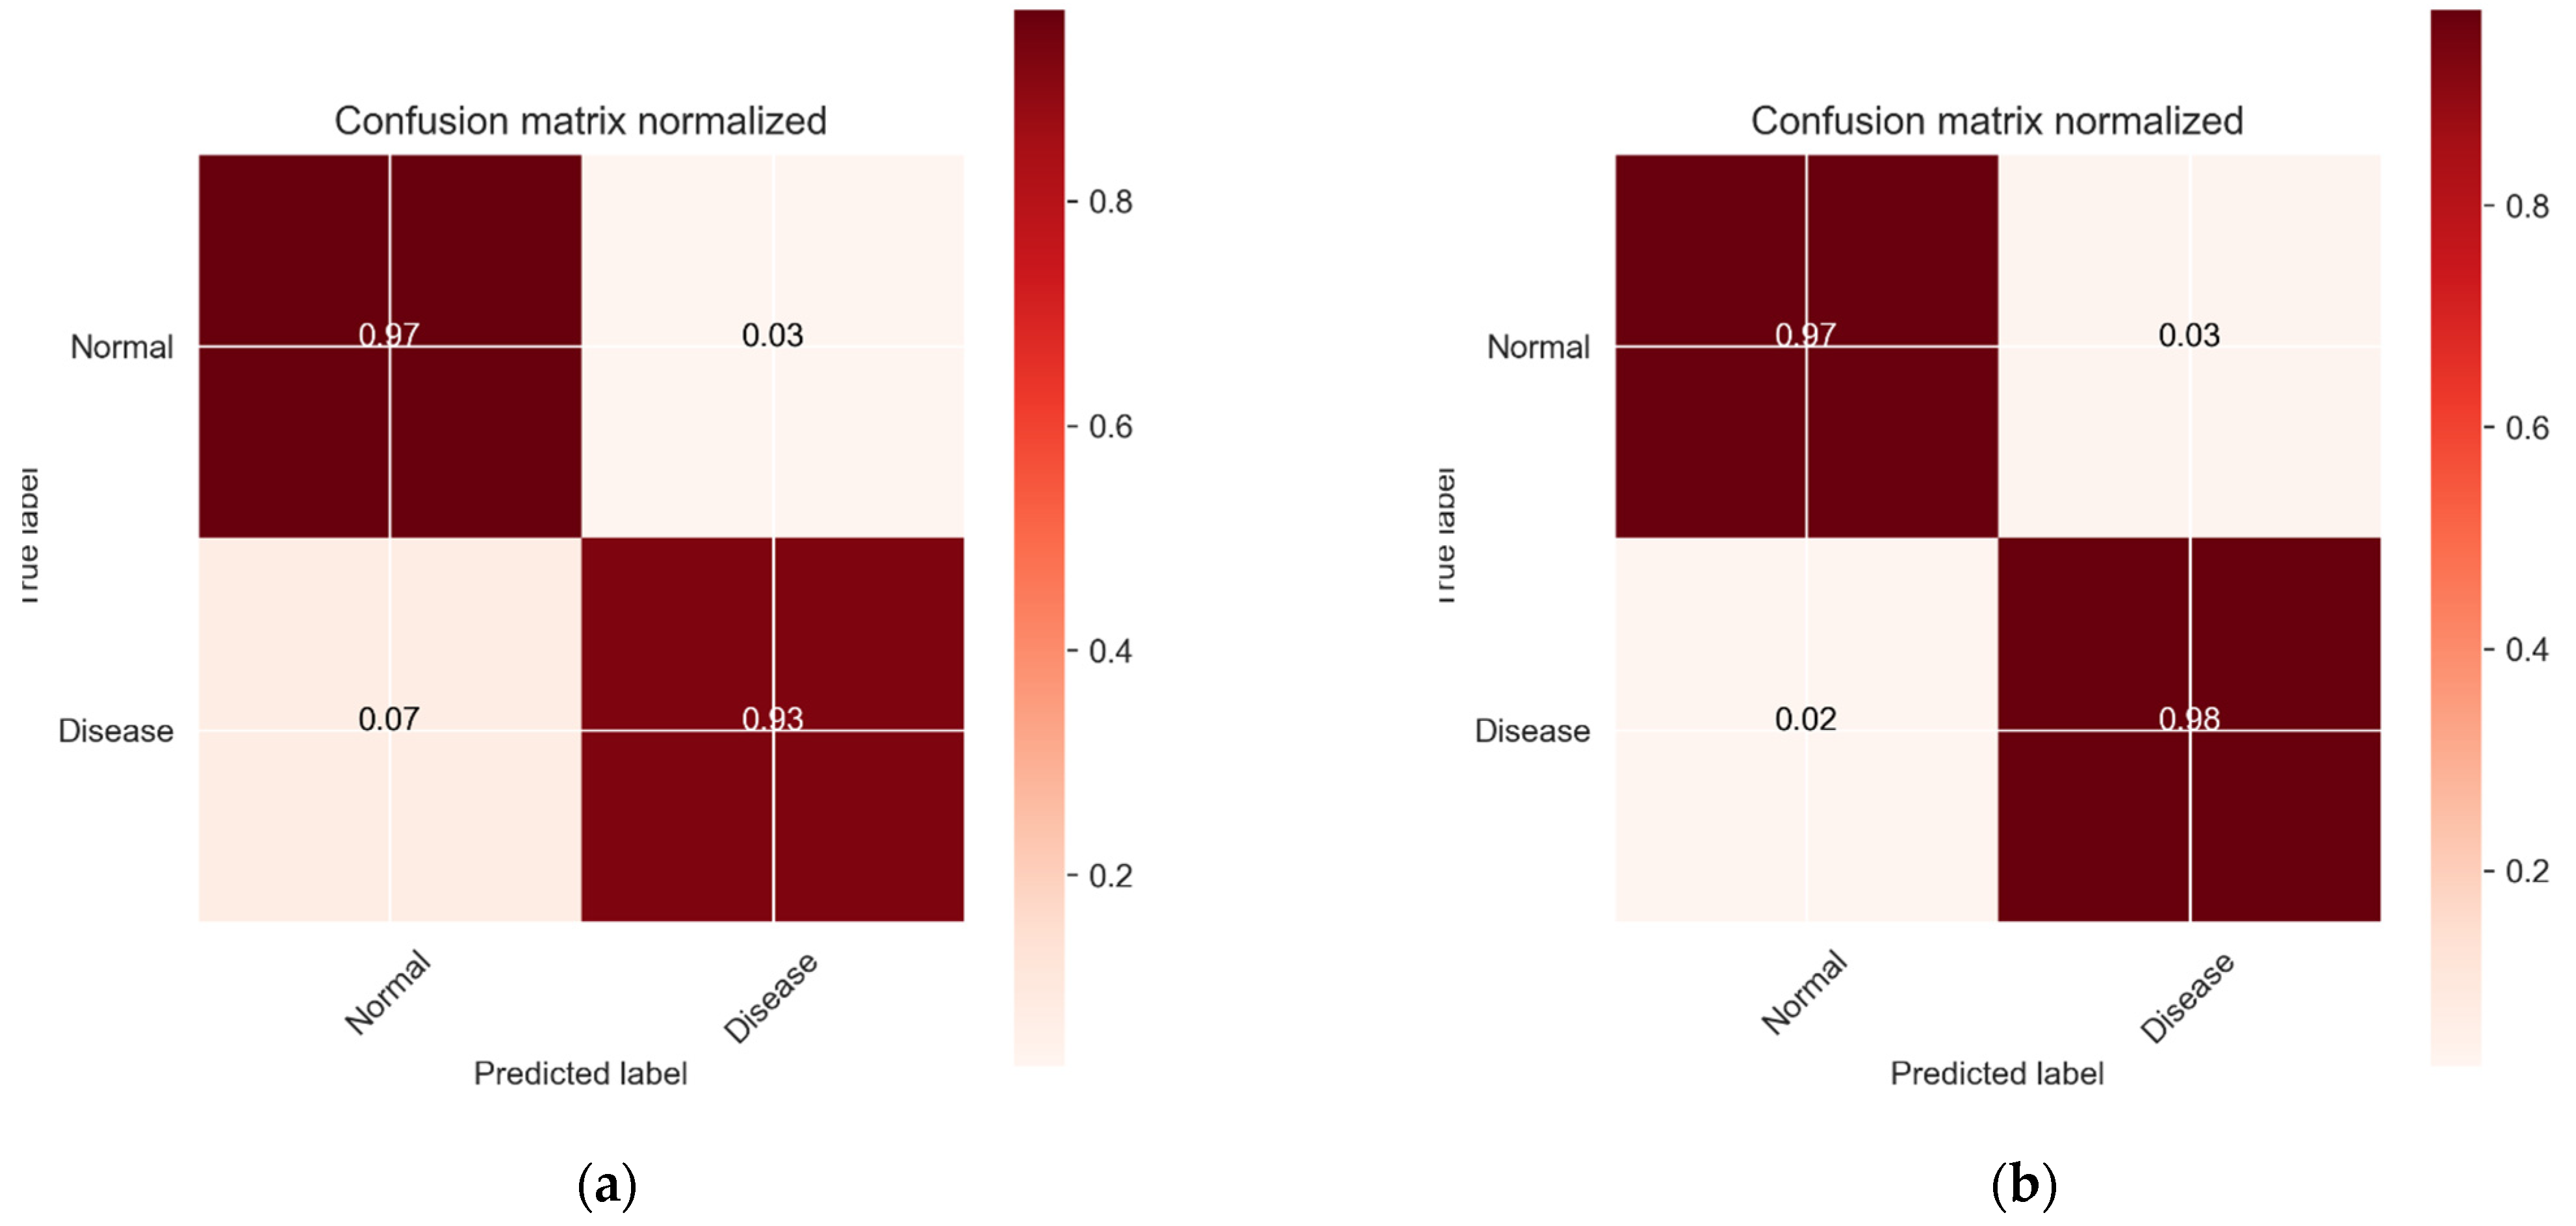
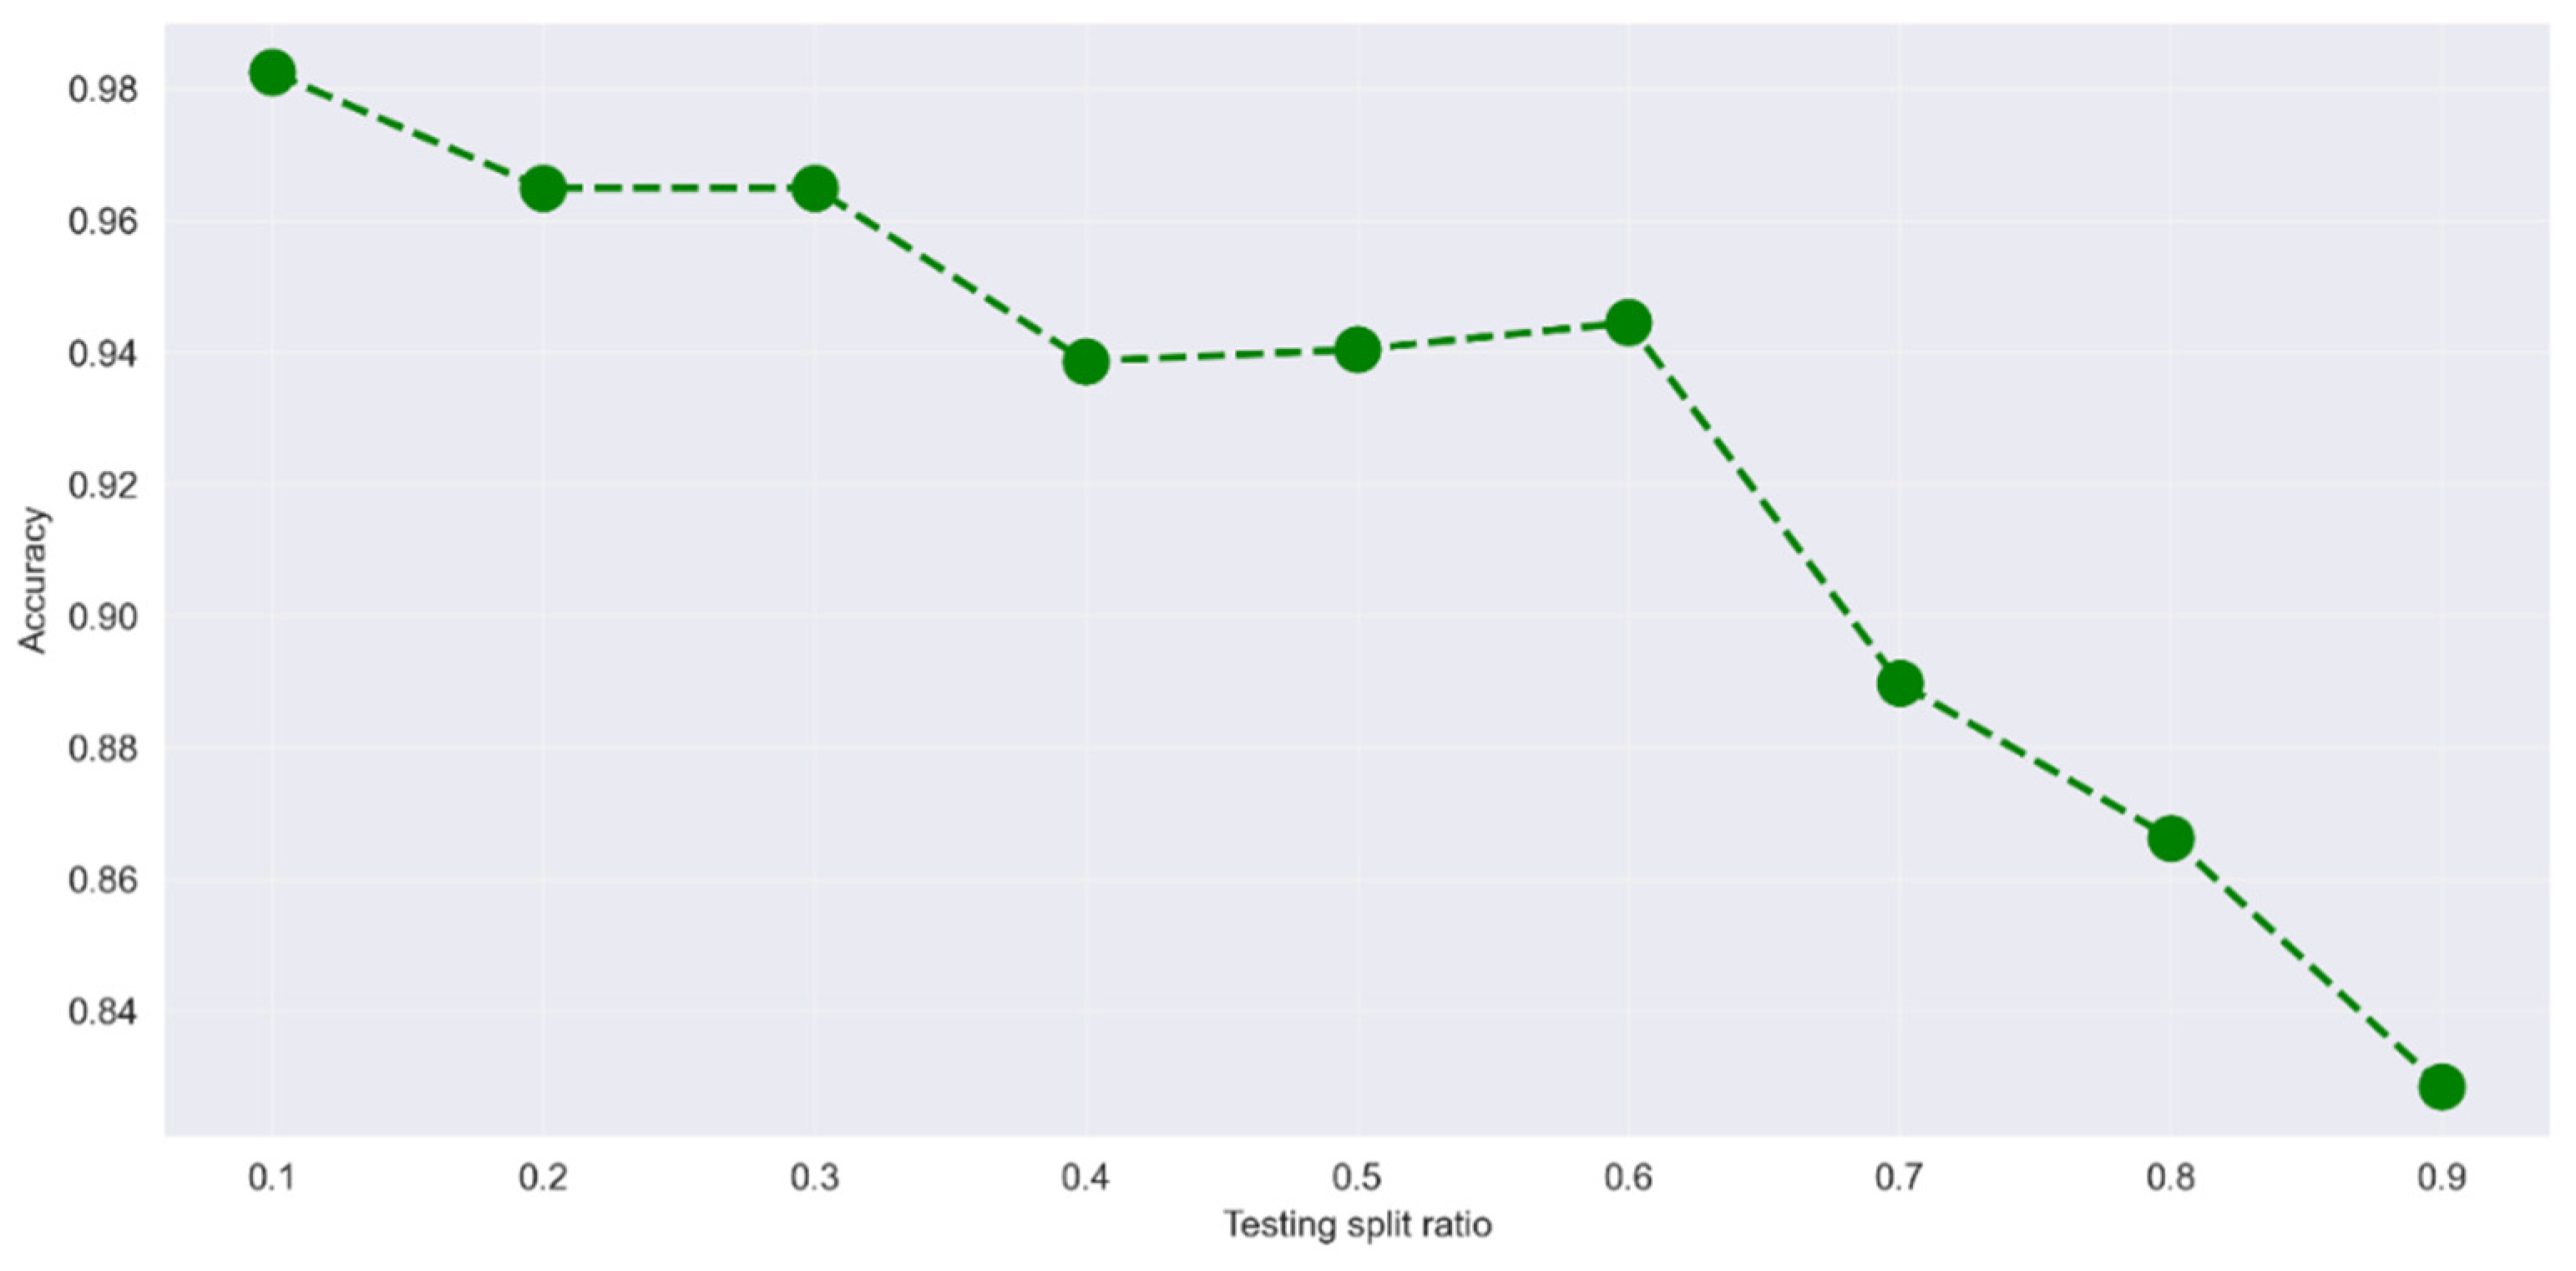
4.4. Results of Top-Performing CNN Model

The best-performing network model with the best combination of hyperparameter values was selected and tested on an independent test set. These findings demonstrated that the proposed CNN model is capable of accurately predicting breast cancer. As a result, the suggested convolutional neural networks are ideal for replacing time-consuming traditional ML models. The model training results are illustrated in Figure 5, which shoes the training accuracy and training loss values.
The Precision and Recall Curve and Receiver Operating Characteristic (ROC) are presented in Figure 6. The show that the best ANN model has achieved the mean precision of 0.99 and the AUC of 1.00.
The confusion matrices of the best CNN and ANN models are presented in Figure 7. The ANN achieved slightly better accuracy 99.2% vs. 98.5% of the CNN model. The difference was evaluated using a statistical Mann-Whitley test and was found to be significant at p = 0.018.
Finally, we explored the influence of the training/testing ratio on the accuracy of the classification. The results are presented in Figure 8. It is predictable that better accuracy was achieved with the larger number of data samples available for training. The highest accuracy of 0.98 for the CNN model was achieved, when 90% of the data was used for training and 10% for testing.

5. Discussion

The main disadvantage of deep learning models is the high computational resources required, such as GPUs and a large RAM size. During the training phase, the CNN classifier generates synthetic data, which results in a high storage capacity requirement. However, as shown in Figure 1, this high hardware resource requirement can be met by using cloud computing services in our proposed IoMT framework. Furthermore, in this study, all hyperparameter values of our CNN classifier and implemented deep network models were manually tuned. This manual tuning procedure is an iterative and time-consuming task that must be completed to achieve good classification results. For a large number of hyperparameters, the grid-based search is computationally expensive.
Deep networks had previously outperformed shallow strategies in a variety of ML situations, however, this is no longer the case. One such explanation might be a lack of parameter search. Another explanation might be the tiny size of the data. Deep networks are extremely sensitive to the size of the training set and require substantially larger training data sets to be properly established. Our results show that no single hyperparameter combination outperforms the others significantly. Because of changes in weight and bias initialization, training a model with the same hyperparameter values once more does not always result in the same classification accuracy. As a result, it is essential to repeat training several times before selecting the best performing network. However, deeper networks with more layers generally take longer to train.
The main advantage of the current study is the optimization of the hyperparameter values. Hyperparameter tuning is an important aspect of regulating a machine learning model’s behavior. Our estimated model parameters yield inferior outcomes if our hyperparameters are not appropriately tuned, since they do not minimize the loss function. Modern machine learning methods typically include many hyperparameters (from one to thousands), which are critical for model’s generalizability. This activity requires professional knowledge and expert experience. Moreover, the time requirements to perform search over full hyperparameter spaces are huge. The hyperparameter search usually only trains a limited number of candidate configurations with limited training time, and only the most promising candidates undergo full training. The question of how to build a new hyperparameter optimization strategy that incorporates all of the advantages of both automation and expert knowledge remains unsolved.
As a result, in our future studies, we will use more sophisticated neural architecture search methods [59] to automate the design of our developed CNN classifier. The security and privacy of patient data and breast cancer diagnosis results will also be considered in our proposed medical IoT-based system, which will be used for open communication and networked computing systems. However, the proposed IoMT system, which includes our developed CNN classifier, is still valid for achieving successful automated diagnosis of breast cancer.

6. Conclusions

Breast cancer is a common kind of cancer and the leading cause of death in women around the world. ML models are commonly used to analyze diagnostic variables of breast cancer survival in this study. We employed our two major algorithms, SVM and MLP, with the addition of a feature selection method PSO, on the Wisconsin Breast Cancer (WBC) dataset since our goal and difficulty in breast cancer classification is to construct precise and reliable classifiers. CNN models were used in this article to replace typical ML models to predict breast cancer illness. Using the PSO method, grid-based search and a small training dataset, an approach for optimizing the network’s hyperparameters was provided (WDBC dataset). Our results show that simple ANNs can still outperform CNNs on small datasets, although the difference is not large: the proposed model gained a classification accuracy of 98.5% using CNN and 99.2% using ANN. The precision-recall curve and receiver operating characteristics demonstrated that the best ANN model has achieved the mean precision of 0.99 and the AUC of 1.00. The ANN achieved a slightly better accuracy of 99.2% vs. 98.5% of the CNN model. The difference was evaluated using a statistical Mann-Whitley test and found to be significant at p = 0.018.
In healthcare research, particularly using ML methods and IoT, the feature selection procedure can produce dissimilar results according to a different dataset, location, and lifestyle of sick individuals. In this way, in this study, the performance of the breast cancer diagnostic model that can be used in clinical practice was determined. In general, the suggested model is effective in detecting benign and malignant class labels, as evidenced by the comparison of the two models.
In the future, the scope of this research will be broadened in the future by conducting trials with larger datasets, such as big data. This may be achieved by combining deep learning techniques with optimization approaches to improve feature selection and effectively identify breast cancer. Moreover, the system could be implemented with a text messaging-based communication framework [60] for the provision of telehealth services [61].

Author Contributions

Conceptualization, R.O.O. and M.D.; methodology, R.O.O. and M.D; software, S.M.; validation, R.M. and R.D.; investigation, S.M., RM. and R.D.; resources, R.O.O. and M.D.; data curation, M.D.; writing—original draft preparation, R.O.O.; writing—review and editing, S.M., R.M. and R.D.; visualization, M.D.; supervision, R.O.O. and S.M. All authors have read and agreed to the published version of the manuscript.

Funding

This research received no external funding.

Institutional Review Board Statement

Not applicable.

Informed Consent Statement

Not applicable.

Data Availability Statement

Data supporting reported results can be found in the Kaggle database and the link to the public archived dataset is Breast Cancer Wisconsin (Diagnostic) Data Set|Kaggle, available at https://www.kaggle.com/datasets/uciml/breast-cancer-wisconsin-data. (accessed on 20 January 2022).

Conflicts of Interest

The authors declare no conflict of interest.

Abbreviations

BCBreast Cancer
MLMachine Learning
DLDeep learning
GSGrid based search
DOEDesigns of Experiment
PSOParticle Swarm Optimization
IoTInternet of Things
AIArtificial Intelligence
ANNArtificial Neural Network
CNNConvolutional neural network
SVMSupport Vector Machine
MLPMultilayer perceptron
WDBCWisconsin Diagnostic Breast Cancer
IoMTInternet of Medical Things
NBNaïve Bayes
DTDecision Tree
RFRandom Forest
kNNK-Nearest Neighbor
LDALinear Discriminant Analysis
LRLogistic Regression
RFSSRepresentative Feature Subset Selection

References

  1. Anand, P.; Kunnumakara, A.B.; Sundaram, C.; Harikumar, K.B.; Tharakan, S.T.; Lai, O.S.; Sung, B.; Aggarwal, B.B. Cancer is a Preventable Disease that Requires Major Lifestyle Changes. Pharm. Res. 2008, 25, 2097–2116. [Google Scholar] [CrossRef] [PubMed]
  2. Wild, C.P.; Stewart, B.W.; Wild, C. World Cancer Report 2014; World Health Organization: Geneva, Switzerland, 2014. [Google Scholar]
  3. Siegel, R.; Ma, J.; Zou, Z.; Jemal, A. Cancer statistics, 2014. CA Cancer J. Clin. 2014, 64, 9–29. [Google Scholar] [CrossRef] [PubMed] [Green Version]
  4. De Martel, C.; Ferlay, J.; Franceschi, S.; Vignat, J.; Bray, F.; Forman, D.; Plummer, M. Global burden of cancers at-tributable to infections in 2008: A review and synthetic analysis. Lancet Oncol. 2012, 13, 607–615. [Google Scholar] [CrossRef]
  5. Kim, W.; Kim, K.S.; Lee, J.E.; Noh, D.Y.; Kim, S.W.; Jung, Y.S.; Park, M.Y.; Park, R.W. Development of novel breast cancer re-currence prediction model using support vector machine. J. Breast Cancer 2012, 15, 230–238. [Google Scholar] [CrossRef] [Green Version]
  6. Ahmad, L.G.; Eshlaghy, A.T.; Poorebrahimi, A.; Ebrahimi, M.; Razavi, A.R. Using three machine learning techniques for predicting breast cancer recurrence. J. Health Med. Inf. 2013, 4, 3. [Google Scholar]
  7. Kashyap, D.; Kaur, H. Cell-free miRNAs as non-invasive biomarkers in breast cancer: Significance in early diagnosis and metastasis prediction. Life Sci. 2020, 246, 117417. [Google Scholar] [CrossRef]
  8. Kadry, S.; Damasevicius, R.; Taniar, D.; Rajinikanth, V.; Lawal, I.A. Extraction of tumour in breast MRI using joint thresholding and segmentation—A study. In Proceedings of the 2021 IEEE 7th International Conference on Bio Signals, Images and Instrumentation, Chennai, India, 25–27 March 2021. ICBSII 2021. [Google Scholar] [CrossRef]
  9. Rajinikanth, V.; Kadry, S.; Taniar, D.; Damasevicius, R.; Rauf, H.T. Breast-cancer detection using thermal images with marine-predators-algorithm selected features. In Proceedings of the 2021 IEEE 7th International Conference on Bio Signals, Images and Instrumentation, Chennai, India, 25–27 March 2021. ICBSII 2021. [Google Scholar] [CrossRef]
  10. Maqsood, S.; Damaševičius, R.; Maskeliūnas, R. TTCNN: A Breast Cancer Detection and Classification towards Computer-Aided Diagnosis Using Digital Mammography in Early Stages. Appl. Sci. 2022, 12, 3273. [Google Scholar] [CrossRef]
  11. Azeez, N.A.; Towolawi, T.; Van der Vyver, C.; Misra, S.; Adewumi, A.; Damaševičius, R.; Ahuja, R. A fuzzy expert system for diagnosing and analyzing human diseases. In Advances in Intelligent Systems and Computing; Springer Nature: Berlin, Switzerland, 2019; pp. 474–484. [Google Scholar] [CrossRef]
  12. Lauraitis, A.; Maskeliūnas, R.; Damaševičius, R. ANN and Fuzzy Logic Based Model to Evaluate Huntington Disease Symptoms. J. Health Eng. 2018, 2018, 4581272. [Google Scholar] [CrossRef] [Green Version]
  13. Barracliffe, L.; Arandjelovic, O.; Humphris, G. A pilot study of breast cancer patients: Can machine learning predict healthcare professionals’ responses to patient emotions. In Proceedings of the International Conference on Bioinformatics and Computational Biology, Honolulu, HI, USA, 20–22 March 2017; pp. 20–22. [Google Scholar]
  14. Hassan, M.A.; Malik, A.S.; Fofi, D.; Karasfi, B.; Meriaudeau, F. Towards health monitoring using remote heart rate measurement using digital camera: A feasibility study. Measurement 2020, 149, 106804. [Google Scholar] [CrossRef]
  15. Al-Turjman, F.; Alturjman, S. Context-sensitive access in the industrial internet of things (IIoT) healthcare applications. IEEE Trans. Ind. Inform. 2018, 14, 2736–2744. [Google Scholar] [CrossRef]
  16. Dourado, C.M.J.M.; Da Silva, S.P.P.; Da Nobrega, R.V.M.; Filho, P.P.R.; Muhammad, K.; De Albuquerque, V.H.C. An Open IoHT-Based Deep Learning Framework for Online Medical Image Recognition. IEEE J. Sel. Areas Commun. 2020, 39, 541–548. [Google Scholar] [CrossRef]
  17. Parah, S.A.; Kaw, J.A.; Bellavista, P.; Loan, N.A.; Bhat, G.M.; Muhammad, K.; de Albuquerque, V.H.C. Efficient Security and Authentication for Edge-Based Internet of Medical Things. IEEE Internet Things J. 2020, 8, 15652–15662. [Google Scholar] [CrossRef]
  18. Dimitrov, D.V. Medical internet of things and big data in healthcare. Healthc. Inform. Res. 2016, 22, 156–163. [Google Scholar] [CrossRef] [PubMed]
  19. Deebak, B.D.; Al-Turjman, F.; Aloqaily, M.; Alfandi, O. An authentic-based privacy preservation protocol for smart e-healthcare systems in IoT. IEEE Access 2019, 7, 135632–135649. [Google Scholar] [CrossRef]
  20. Al-Turjman, F.; Zahmatkesh, H.; Mostarda, L. Quantifying uncertainty on the internet of medical things and big-data services using intelligence and deep learning. IEEE Access 2019, 7, 115749–115759. [Google Scholar] [CrossRef]
  21. Huang, C.; Zhang, G.; Chen, S.; Albuquerque, V. Healthcare Industry 4.0: A Novel Intelligent Multi-sampling Tensor Network for Detection and Classification of Oral Cancer. IEEE Trans. Ind. Inform. 2022, 1. [Google Scholar] [CrossRef]
  22. Alzubi, J.A.; Manikandan, R.; Alzubi, O.; Qiqieh, I.; Rahim, R.; Gupta, D.; Khanna, A. Hashed Needham Schroeder industrial IoT-based cost-optimized deep secured data transmission in the cloud. Measurement 2019, 150, 107077. [Google Scholar] [CrossRef]
  23. Sharma, A.; Kulshrestha, S.; Daniel, S. Machine learning approaches for breast cancer diagnosis and prognosis. In 2017 International Conference on Soft Computing and Its Engineering Applications (icSoftComp); IEEE: Piscataway, NI, USA, 2017; pp. 1–5. [Google Scholar]
  24. Chougrad, H.; Zouaki, H.; Alheyane, O. Deep convolutional neural networks for breast cancer screening. Comput. Methods Programs Biomed. 2018, 157, 19–30. [Google Scholar] [CrossRef]
  25. Zebari, D.A.; Ibrahim, D.A.; Zeebaree, D.Q.; Haron, H.; Salih, M.S.; Damaševičius, R.; Mohammed, M.A. Systematic review of computing approaches for breast cancer detection based computer aided diagnosis using mammo-gram images. Appl. Artif. Intell. 2021, 35, 2157–2203. [Google Scholar] [CrossRef]
  26. Amrane, M.; Oukid, S.; Gagaoua, I.; Ensari, T. Breast cancer classification using machine learning. In 2018 Electric Electronics, Computer Science, Biomedical Engineerings Meeting (EBBT); IEEE: Piscataway, NI, USA, 2018; pp. 1–4. [Google Scholar]
  27. Dasgupta, S.; Rajapakshe, K.; Zhu, B.; Nikolai, B.; Yi, P.; Putluri, N.; Choi, J.M.; Jung, S.Y.; Coarfa, C.; Westbrook, T.F.; et al. Metabolic enzyme PFKFB4 activates transcriptional coactivator SRC-3 to drive breast cancer. Nature 2018, 556, 249–254. [Google Scholar] [CrossRef]
  28. Gupta, A.; Kaushik, B.N. Feature selection from a biological database for breast cancer prediction and detection using a machine learning classifier. J. Artif. Intell. 2018, 57, 23–33. [Google Scholar] [CrossRef]
  29. Yue, W.; Wang, Z.; Chen, H.; Payne, A.; Liu, X. Machine learning with applications in breast cancer diagnosis and prognosis. Designs 2018, 2, 13. [Google Scholar] [CrossRef] [Green Version]
  30. Omondiagbe, D.A.; Veeramani, S.; Sidhu, A.S. Machine learning classification techniques for breast cancer diagnosis. In IOP Conference Series: Materials Science and Engineering; IOP Publishing: Bristol, UK, 2019; Volume 495, p. 012033. [Google Scholar]
  31. Li, Y.; Chen, Z. Performance evaluation of machine learning methods for breast cancer prediction. Appl Comput. Math 2018, 7, 212–216. [Google Scholar] [CrossRef]
  32. Hajiabadi, H.; Babaiyan, V.; Zabihzadeh, D.; Hajiabadi, M. Combination of loss functions for robust breast cancer prediction. Comput. Electr. Eng. 2020, 84, 106624. [Google Scholar] [CrossRef]
  33. Shravya, C.; Pravalika, K.; Subhani, S. Prediction of breast cancer using supervised machine learning techniques. Int. J. Innov. Technol. Explor. Eng. 2019, 8, 1106–1110. [Google Scholar]
  34. Chaurasia, V.; Pal, S.; Tiwari, B. Prediction of benign and malignant breast cancer using data mining techniques. J. Algorithms Comput. Technol. 2018, 12, 119–126. [Google Scholar] [CrossRef] [Green Version]
  35. Aavula, R.; Bhramaramba, R. XBPF: An extensible breast cancer prognosis framework for predicting susceptibility, recurrence, and survivability. Int. J. Eng. Adv. Technol 2019, 8, 2249–8958. [Google Scholar]
  36. Nandagopal, V.; Geeitha, S.; Kumar, K.V.; Anbarasi, J. Feasible analysis of gene expression–a computational-based classification for breast cancer. Measurement 2019, 140, 120–125. [Google Scholar] [CrossRef]
  37. Abdar, M.; Zomorodi-Moghadam, M.; Zhou, X.; Gururajan, R.; Tao, X.; Barua, P.D.; Gururajan, R. A new nested ensemble technique for automated diagnosis of breast cancer. Pattern Recognit. Lett. 2020, 132, 123–131. [Google Scholar] [CrossRef]
  38. Wang, L. Microwave Sensors for Breast Cancer Detection. Sensors 2018, 18, 655. [Google Scholar] [CrossRef] [Green Version]
  39. Mansour, R.F. A Robust Deep Neural Network Based Breast Cancer Detection and Classification. Int. J. Comput. Intell. Appl. 2020, 19, 2050007. [Google Scholar] [CrossRef]
  40. Ragab, M.; Albukhari, A.; Alyami, J.; Mansour, R.F. Ensemble Deep-Learning-Enabled Clinical Decision Support System for Breast Cancer Diagnosis and Classification on Ultrasound Images. Biology 2022, 11, 439. [Google Scholar] [CrossRef] [PubMed]
  41. Lee, K.Y.; Park, J.B. Application of particle swarm optimization to economic dispatch problem: Advantages and dis-advantages. In 2006 IEEE PES Power Systems Conference and Exposition; IEEE: Piscataway, NI, USA, 2006; pp. 188–192. [Google Scholar]
  42. Abu Khurma, R.; Aljarah, I.; Sharieh, A.; Elaziz, M.A.; Damaševičius, R.; Krilavičius, T. A review of the modification strategies of the nature inspired algorithms for feature selection problem. Mathematics 2022, 10, 464. [Google Scholar] [CrossRef]
  43. Cooney, C.; Korik, A.; Folli, R.; Coyle, D. Evaluation of hyperparameter optimization in machine and deep learning methods for decoding imagined speech eeg. Sensors 2020, 20, 4629. [Google Scholar] [CrossRef]
  44. Mostafa, S.S.; Mendonca, F.; Ravelo-Garcia, A.G.; Juliá-Serdá, G.G.; Morgado-Dias, F. Multi-objective hyperparameter optimization of convolutional neural network for obstructive sleep apnea detection. IEEE Access 2020, 8, 129586–129599. [Google Scholar] [CrossRef]
  45. Raji, I.D.; Bello-Salau, H.; Umoh, I.J.; Onumanyi, A.J.; Adegboye, M.A.; Salawudeen, A.T. Simple deterministic selection-based genetic algorithm for hyperparameter tuning of machine learning models. Appl. Sci. 2022, 12, 1186. [Google Scholar] [CrossRef]
  46. Yang, L.; Shami, A. On hyperparameter optimization of machine learning algorithms: Theory and practice. Neurocomputing 2020, 415, 295–316. [Google Scholar] [CrossRef]
  47. George, G.; Raj, V.C. Review on feature selection techniques and the impact of SVM for cancer classification using gene expression profile. arXiv 2011, arXiv:1109.1062. [Google Scholar]
  48. Maskeliunas, R.; Lauraitis, A.; Damasevicius, R.; Misra, S. Multi-class model MOV-OVR for automatic evaluation of tremor disorders in Huntington’s disease. In Communications in Computer and Information Science; Springer International Publishing: New York, NY, USA, 2021; pp. 3–14. [Google Scholar] [CrossRef]
  49. Akay, M.F. Support vector machines combined with feature selection for breast cancer diagnosis. Expert Syst. Appl. 2009, 36, 3240–3247. [Google Scholar] [CrossRef]
  50. Kourou, K.; Exarchos, T.P.; Exarchos, K.P.; Karamouzis, M.V.; Fotiadis, D.I. Machine learning applications in cancer prognosis and prediction. Comput. Struct. Biotechnol. J. 2015, 13, 8–17. [Google Scholar] [CrossRef] [Green Version]
  51. Memon, M.H.; Li, J.P.; Haq, A.U.; Zhou, W. Breast cancer detection in the IoT health environment using modified recursive feature selection. Wirel. Commun. Mob. Comput. 2019, 2019, 5176705. [Google Scholar] [CrossRef] [Green Version]
  52. Lattanzi, E.; Donati, M.; Freschi, V. Exploring Artificial Neural Networks Efficiency in Tiny Wearable Devices for Human Activity Recognition. Sensors 2022, 22, 2637. [Google Scholar] [CrossRef] [PubMed]
  53. Pontes, F.J.; Amorim, G.F.; Balestrassi, P.P.; Paiva, A.P.; Ferreira, J.R. Design of experiments and focused grid search for neural network parameter optimization. Neurocomputing 2016, 186, 22–34. [Google Scholar] [CrossRef]
  54. Kennedy, J.; Eberhart, R. Particle swarm optimization. In Proceedings of the ICNN’95-International Conference on Neural Networks, Perth, WA, Australia, 27 November–1 December 1995; Volume 4, pp. 1942–1948. [Google Scholar]
  55. Ogundokun, R.O.; Awotunde, J.B.; Sadiku, P.; Adeniyi, E.A.; Abiodun, M.; Dauda, O.I. An enhanced intrusion detec-tion system using particle swarm optimization feature extraction technique. Procedia Comput. Sci. 2021, 193, 504–512. [Google Scholar] [CrossRef]
  56. Ogundokun, R.O.; Misra, S.; Bajeh, A.O.; Okoro, U.O.; Ahuja, R. An Integrated IDS Using ICA-Based Feature Selection and SVM Classification Method. In Illumination of Artificial Intel-Ligence in Cybersecurity and Forensics; Springer: Cham, Switzerland, 2022; pp. 255–271. [Google Scholar]
  57. Alade, O.M.; Sowunmi, O.Y.; Misra, S.; Maskeliūnas, R.; Damaševičius, R. A neural network based expert system for the diagnosis of diabetes mellitus. In Advances in Intelligent Systems and Computing; Springer: Berlin, Switzerland, 2018; pp. 14–22. [Google Scholar]
  58. Damasevicius, R. Optimization of SVM parameters for recognition of regulatory DNA sequences. Top 2010, 18, 339–353. [Google Scholar] [CrossRef]
  59. Zhang, M.; Jing, W.; Lin, J.; Fang, N.; Wei, W.; Woźniak, M.; Damaševičius, R. NAS-HRIS: Automatic design and architecture search of neural network for semantic segmentation in remote sensing images. Sensors 2020, 20, 5292. [Google Scholar] [CrossRef]
  60. Omoregbe, N.A.I.; Ndaman, I.O.; Misra, S.; Abayomi-Alli, O.O.; Damaševičius, R. Text messaging-based medical diagnosis using natural language processing and fuzzy logic. J. Health Eng. 2020, 2020, 8839524. [Google Scholar] [CrossRef]
  61. Vanagas, G.; Engelbrecht, R.; Damaševičius, R.; Suomi, R.; Solanas, A. EHealth solutions for the integrated healthcare. J. Health Eng. 2018, 2018, 3846892. [Google Scholar] [CrossRef] [Green Version]
Figure 1. Schematic architectural diagram of the proposed medical IoT-based breast cancer diagnosis framework for automatic identification of breast cancer using the proposed hyperparameter optimized CNN classifier.
Futureinternet 14 00153 g001
Figure 2. Proposed breast cancer classification architecture.
Futureinternet 14 00153 g002
Figure 3. Architecture of the convolutional neural network model.
Futureinternet 14 00153 g003
Figure 4. Accuracy (%) vs. Classifier.
Futureinternet 14 00153 g004
Figure 5. Illustration of model training results: (a) model accuracy, and (b) model loss.
Futureinternet 14 00153 g005
Figure 6. The (a) Precision and Recall Curve and (b) Receiver Operating Characteristic (ROC) of the best performing model.
Futureinternet 14 00153 g006
Figure 7. Confusion matrix of best model after hyper-parameter optimization: (a) best CNN model, (b) best ANN model.
Futureinternet 14 00153 g007
Figure 8. Analysis of testing/training split ratio for the CNN model.
Futureinternet 14 00153 g008
Table 1. Summary of related works.
ReferenceMethods (Models)DatasetAccuracy
Chougrad et al. [24]VGG16, ResNet50, Inception v3MIAS98.23%
Amrane et al. [26]Naive Bayes (NB), k-nearest neighbor (KNN)Wisconsin Breast Cancer (WBC)97.5%
Hajiabadi et al. [32]Artificial Neural Network (ANN)WBC97%
Shravya et al. [33]Support Vector Machine (SVM)WBC92.78%
Chaurasia et al. [34]NBWBC97.36%
Aavula and Bhramaramba [35]SVM with representative feature subset selectionSEER98.90%
Abdar et al. [37]Nested ensemble classifiers with BayesNet and Naïve BayesWBC98.07%
Mansour [39]AlexNetBreakHis96.70%
Ragab et al. [40]Ensemble of deep learning models (SqueezeNet, VGG-16, VGG-19) with Cat Swarm Optimization and Multilayer PerceptronBreast Ultrasound Dataset97.09%
Table 2. Hyperparameters and their range for CNN models.
HyperparameterDescriptionRange
Activation FunctionNeuron’s activation functionReLU, SeLU, Sigmoid
Batch SizeGroup size of training data divisions8, 16, 32
EpochNumber of learning iterations20, 50, 100
Kernel CountKernel count of convolutional layer8, 16, 32
Kernel SizeKernel size of convolutional layer1, 2, 3
Layer DepthNumber of layers constituting entire
network
1, 2, 3
Learning RateWeight change updated during learning0.01, 0.001, 0.0001
Loss FunctionFunction to calculate errorBinary crossentropy, L2 loss
Neuron CountNeuron count in the final fully-connected layer8, 16, 32
StrideNumber of moving pixels of kernel during convolution1, 2, 3
Table 3. Hyperparameters and their range for ANN models.
HyperparameterDescriptionRange
Number of hidden layersNumber of inner layers between the input and output layers1, 2, 3
No. of hidden nodesNo. of neurons in the hidden layer1–10
No. of training
cycles
Number of the training iterations10–1000
Learning rateChange in weight updated during learning0.0001–0.1
Learning algorithmThe optimization algorithm that performs the learning process in a neural networkSDG, Adam, RMDprop
Activation
functions
Neuron’s activation functionTangent, Linear
Learning rate decayThe rate function of the decay of the
learning rate during learning iterations
Exponential, linear
Error function:The function which is minimized during training of the neural networkLog loss, mean square error
Epoch limitMaximum number of learning iterations20, 50, 100
Mini batch sizeGroup size submitted to model during
training
10, 20, 30
PatienceA delay to the trigger in terms of the
number of epochs on which we would like to see no improvement.
2, 5, 10
Table 4. Performance assessment for proposed classifiers with PSO.
MeasuresSVM (%)MLP (%)
Recall97.097.8
Specificity95.796.3
F1-score97.097.6
Precision97.097.8
Accuracy96.597.2
Table 5. Performance assessment for proposed classifiers without PSO.
MeasuresSVM (%)MLP (%)
Recall97.097.0
Specificity95.795.7
F1-score97.097.0
Precision97.097.0
Accuracy96.596.5
Publisher’s Note: MDPI stays neutral with regard to jurisdictional claims in published maps and institutional affiliations.

