Article

Neural Network-Based Price Tag Data Analysis

Faculty of Security, Tomsk State University of Control Systems and Radioelectronics, 40 Lenina Prospect, 634050 Tomsk, Russia
*
Author to whom correspondence should be addressed.
Future Internet 2022, 14(3), 88; https://doi.org/10.3390/fi14030088
Submission received: 1 January 2022 / Revised: 9 March 2022 / Accepted: 10 March 2022 / Published: 13 March 2022
(This article belongs to the Special Issue Advances Techniques in Computer Vision and Multimedia)

Abstract

:
This paper compares neural networks, specifically Unet, MobileNetV2, VGG16 and YOLOv4-tiny, for image segmentation as part of a study aimed at finding an optimal solution for price tag data analysis. The neural networks considered were trained on an individual dataset collected by the authors. Additionally, this paper covers the automatic image text recognition approach using EasyOCR API. Research revealed that the optimal network for segmentation is YOLOv4-tiny, featuring a cross validation accuracy of 96.92%. EasyOCR accuracy was also calculated and is 95.22%.

1. Introduction

Today people frequently face incorrect or irrelevant information on price tags in stores, with a large number of products resulting in a decrease in customer’s loyalty. This therefore leads to losses of profits and reputation.
In each store, the product information can be updated every 7 days, and depending on the quantity of products, the price tags verification can take various amounts of time but no less than several hours. Store employees usually do this before the store opens, but they cannot always accomplish this task on time. Additionally, checking can take place after the end of the shift, which leads to overtime work.
The most important information on price tags to keep track of is usually the price, product name and product specifications. This specific information is subject to the most frequent change and requires continuous verification. Pictures of price tags can also contain a lot of additional information that is not relevant to this study, such as a fragment of the shop counter, fragments of adjacent products and variable text falling outside the areas of interest, and segmentation can be used to get rid of this information. This approach allows us to leave only those parts of the image containing relevant text only.
In many countries, the information on price tags is a public offer, for instance, in Russia, the Philippines and China, which means that incorrect price tag data can result in the store receiving a penalty [1,2,3] or incurring reputational losses.
Electronic shelf labels are a potential solution to the price tag data verification problem, but at present they are widespread and most stores are still working with classic paper price tags. Checking price tags can be carried out both without using any special equipment, which takes a lot of time, and using, for example, portable data collection terminals (PDCT). Although modern technologies allow the time spent on this activity to be reduced, they do not completely eliminate the chance of errors occurring during price tag verification due to the fact that PDCTs scan barcodes only while the price tag data analysis is done by a store employee. Moreover, the use of special equipment often entails a huge equipment cost and the software to operate it.
While using PDCT, the employee needs to manually verify the data on the price tag and in the database, which can lead to human error. In our approach, all information on the price tag is analyzed, and the employee will immediately see the result of comparing the information on the price tag with the information in the database. In this way, the errors due to the human factor can be eliminated through the use of neural networks, making the data verification process fully automatic and thus minimizing the number of errors and handing the verification process over from costly PDCTs to more affordable mobile devices, as well as expediting the price tag data verification process.
The task of price tag verification is non-trivial, which complicates it’s solution in the conventional ways. To solve such problems, various algorithms and smart systems are used, for example, KNN [4] and NSGA-III [5]. However, in the modern world neural networks can be used to solve such problems, there are a lot of projects that use neural networks for different tasks: speaker verification [6], speech rehabilitation after speech organs surgical interventions [7], authorship identification [8], water level estimation in sewer pipes [9], determining the presence of lung cancer or diabetes in patients on the basis of symptoms [10,11], etc.

2. Related Works

During the analysis of existing scientific works related to the analysis of price tags, studies from several countries were found. M.N.A. Hussin et al. [12] proposed color detection, the use of HSV color space, and edge detection by finding the edge of the largest rectangle to detect different price tags. Their research showed that contour detection is exposed to white and black noise and that the accuracy of OCR drops significantly when there are two fonts in different sizes and the image is taken at a distance. A. Kovtunenko et al. [13] proposed price tag recognition methods using mathematical morphology and convolutional neural networks. The researchers’ algorithm is constructed in such a way that the first step is the detection of the supporting element (such as a barcode), and the other elements on the price tag (such as the product name and price) are detected with a convolutional neural network CRAFT. M. Yong-Qiang et al. [14] proposed the use of a multi-task CNN for the problem of locating decimal points.
At the moment, the following price tag data analysis solutions are available on the market:
  • Price tag scanning, OCR and data capturing by Klippa [15], a software that allows users to extract information from price tag images, which is targeted at the retail store customers. Its advantages are high recognition accuracy and the ability to use different output formats (JSON, CSV, XLSX, XML). The disadvantage is that it has a small number of supported languages.
  • Price tag recognition: a smartphone instead of a PDT by Neti [16] is a software designed to automatically compare prices with the price database. It targets store owners and employees. The advantages are user friendliness and high recognition accuracy. The disadvantage is the lack of product description recognition capability.
Based on existing research and due to relevance of the problem at hand, we decided to examine various approaches to segmentation for neural networks-based price tags data analysis.

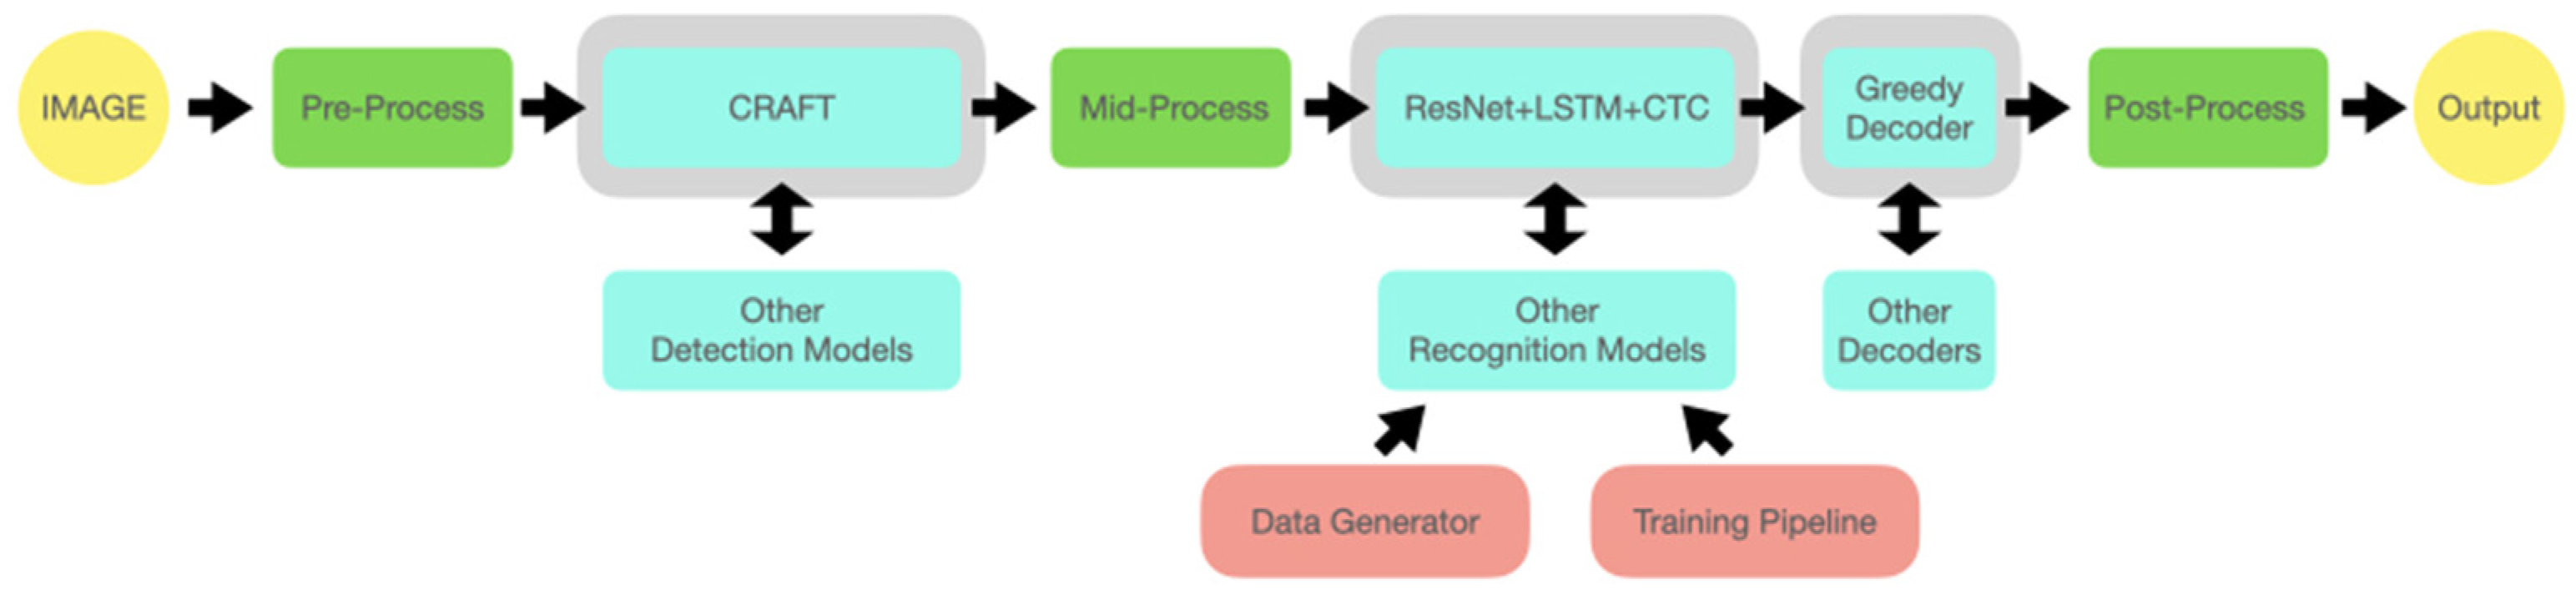
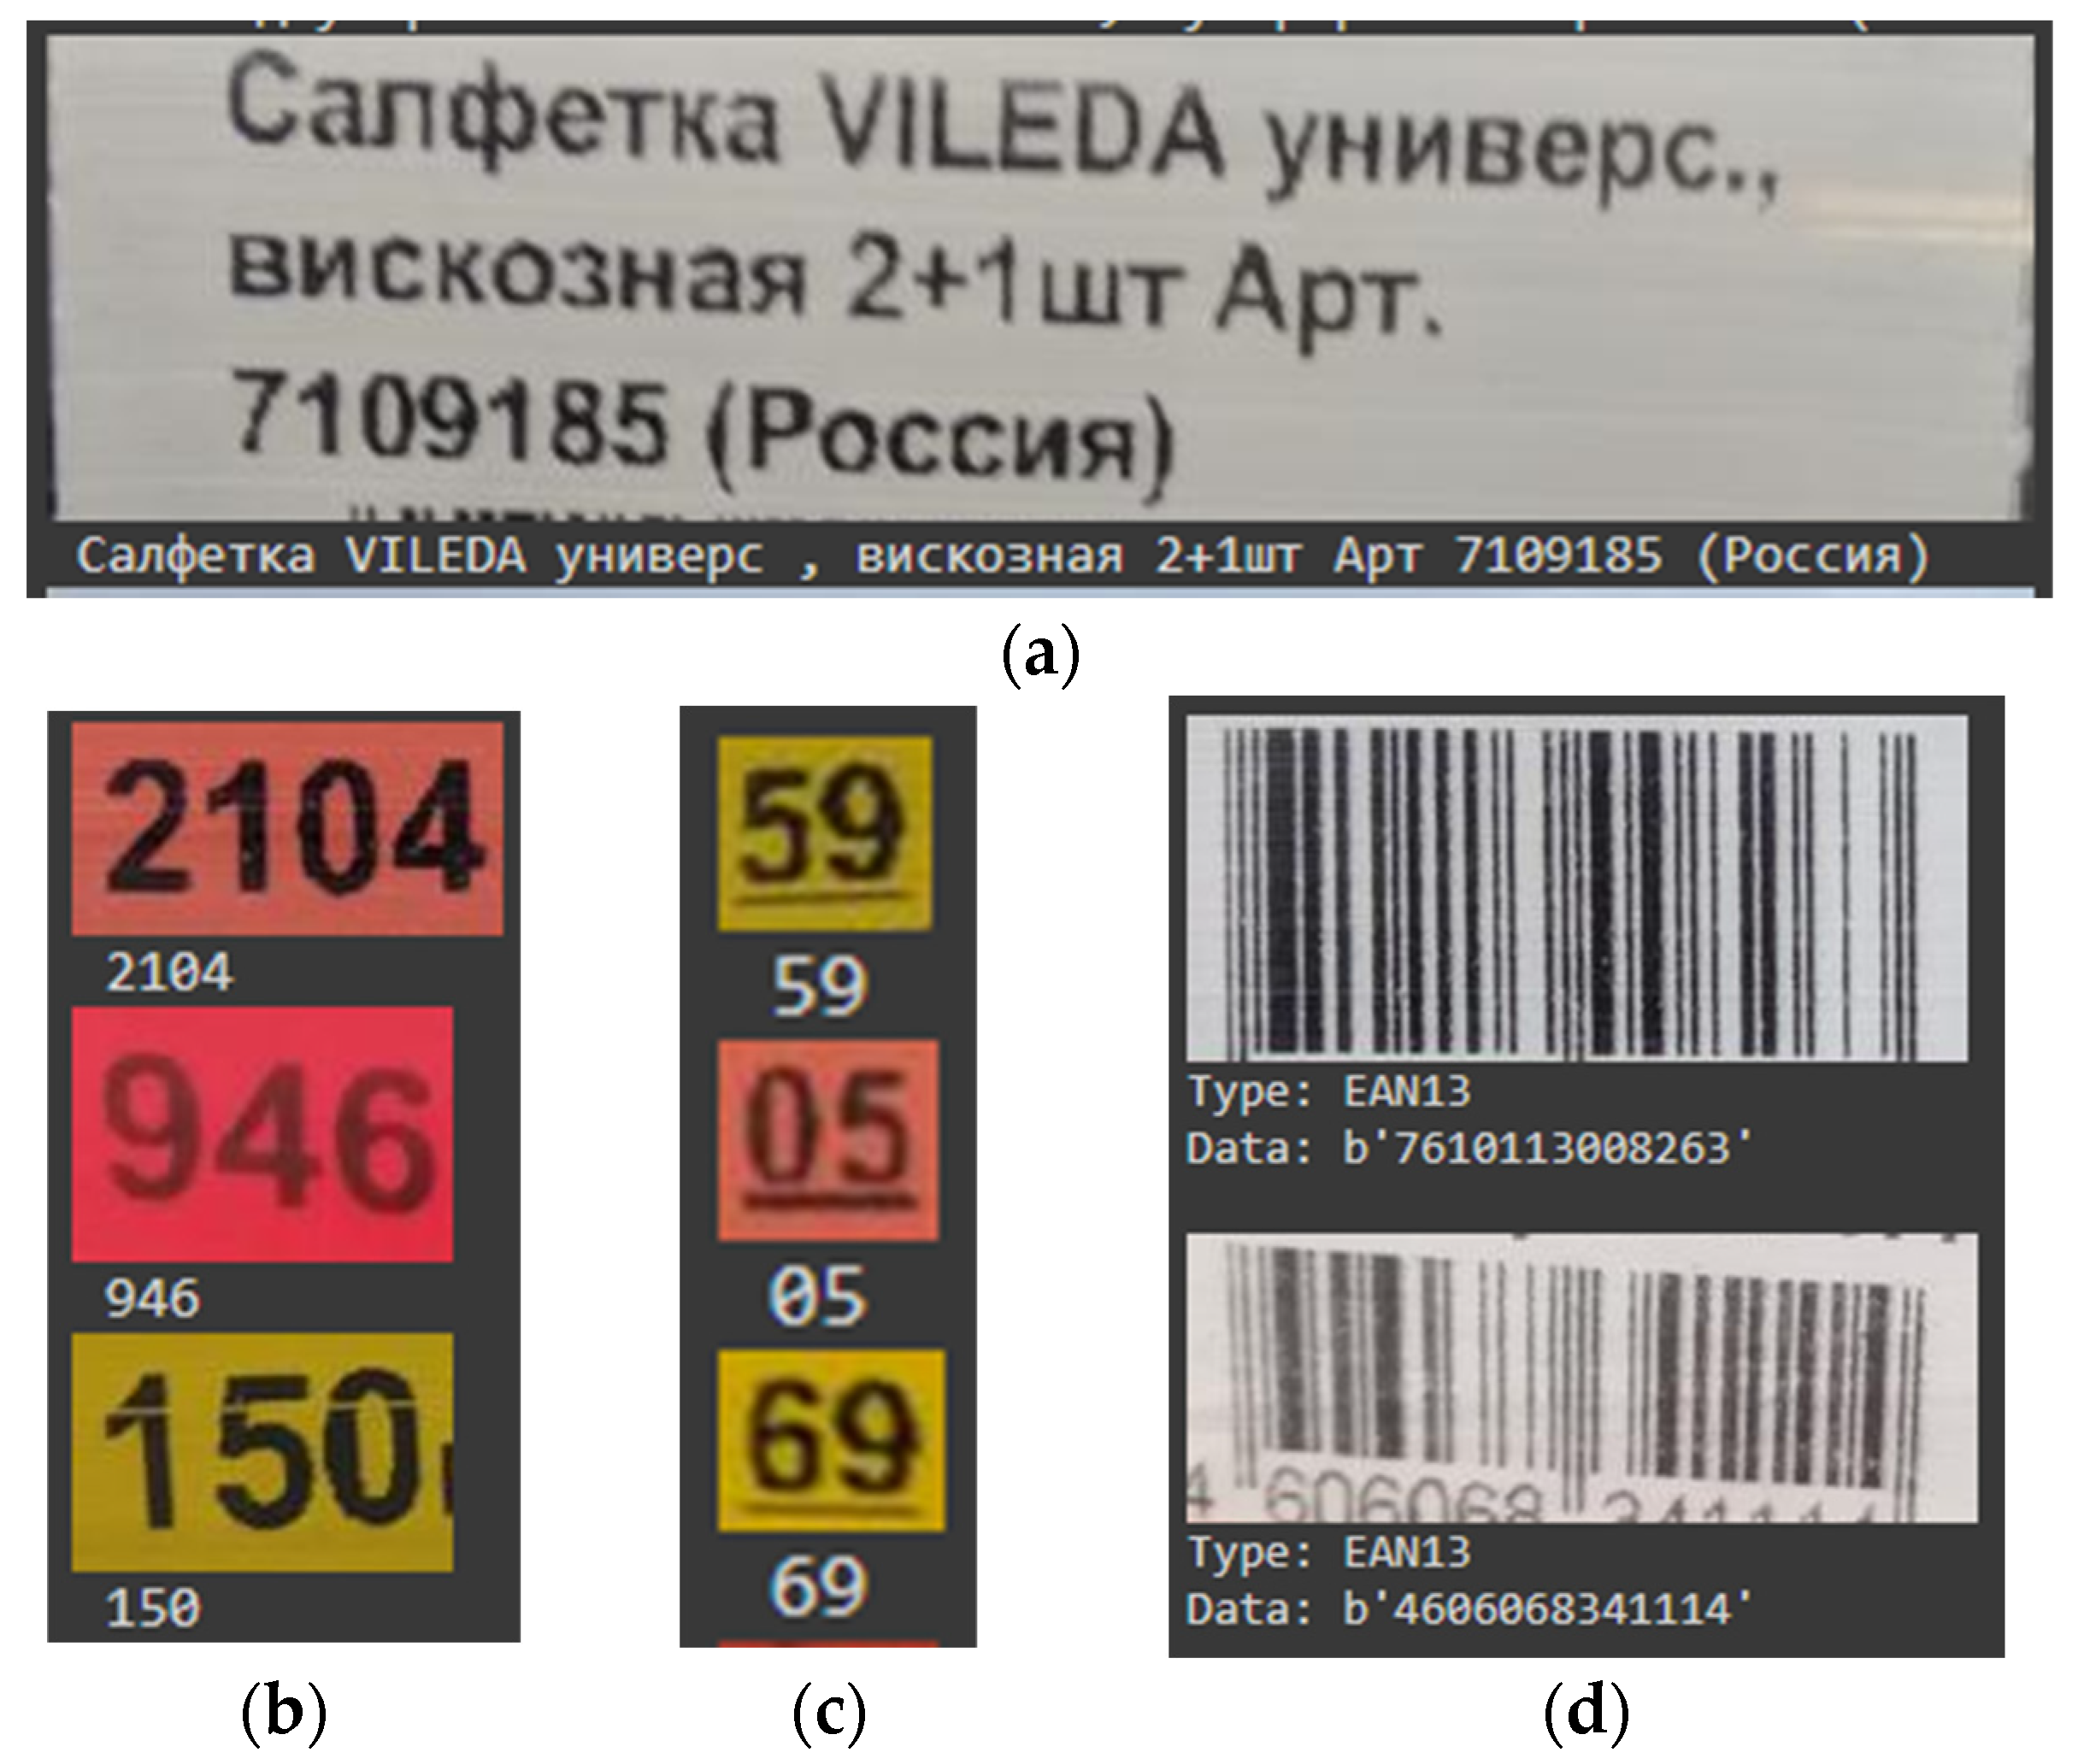
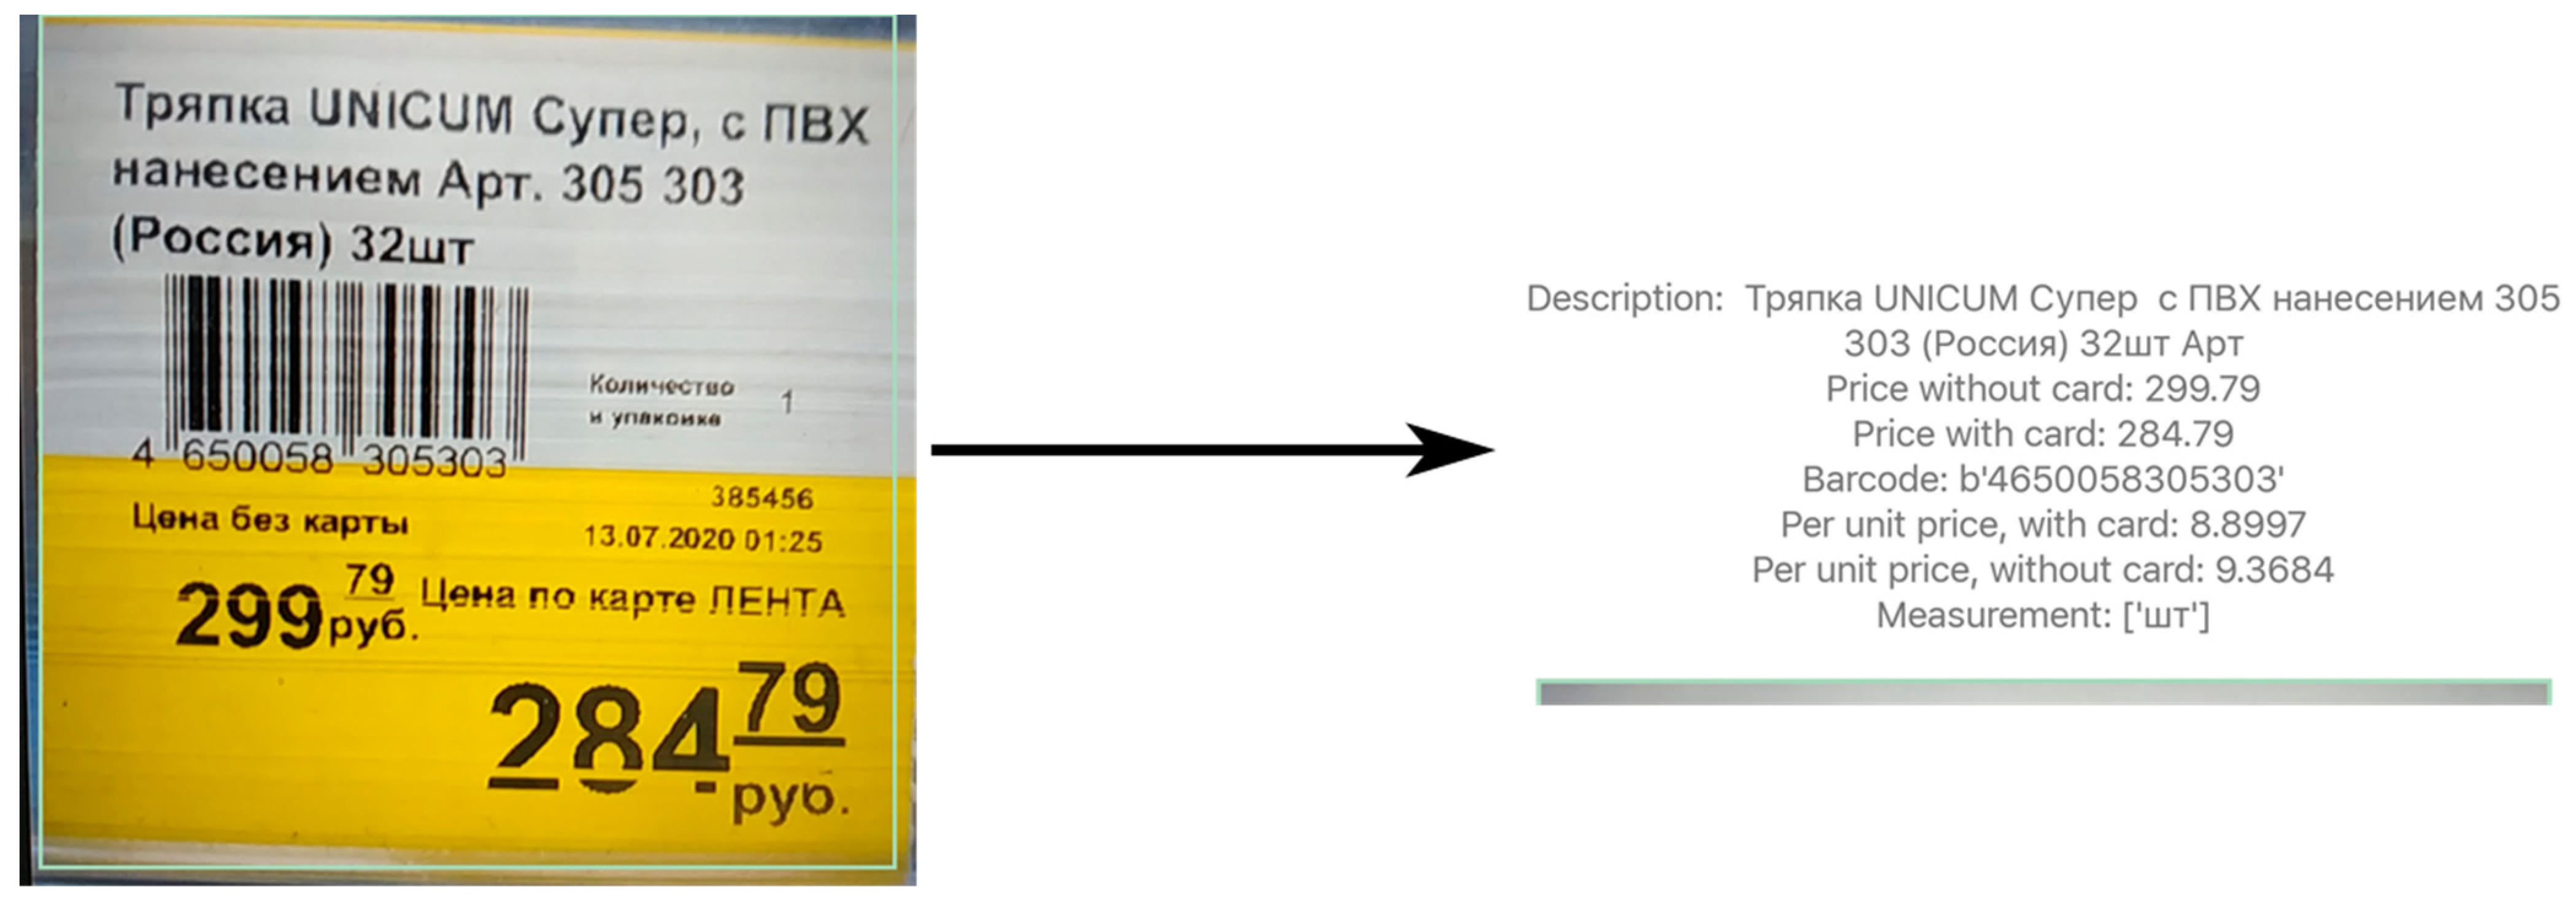
3. Materials and Methods

To achieve results in the analysis of information on the price tag, it is necessary to divide image processing into the following stages:
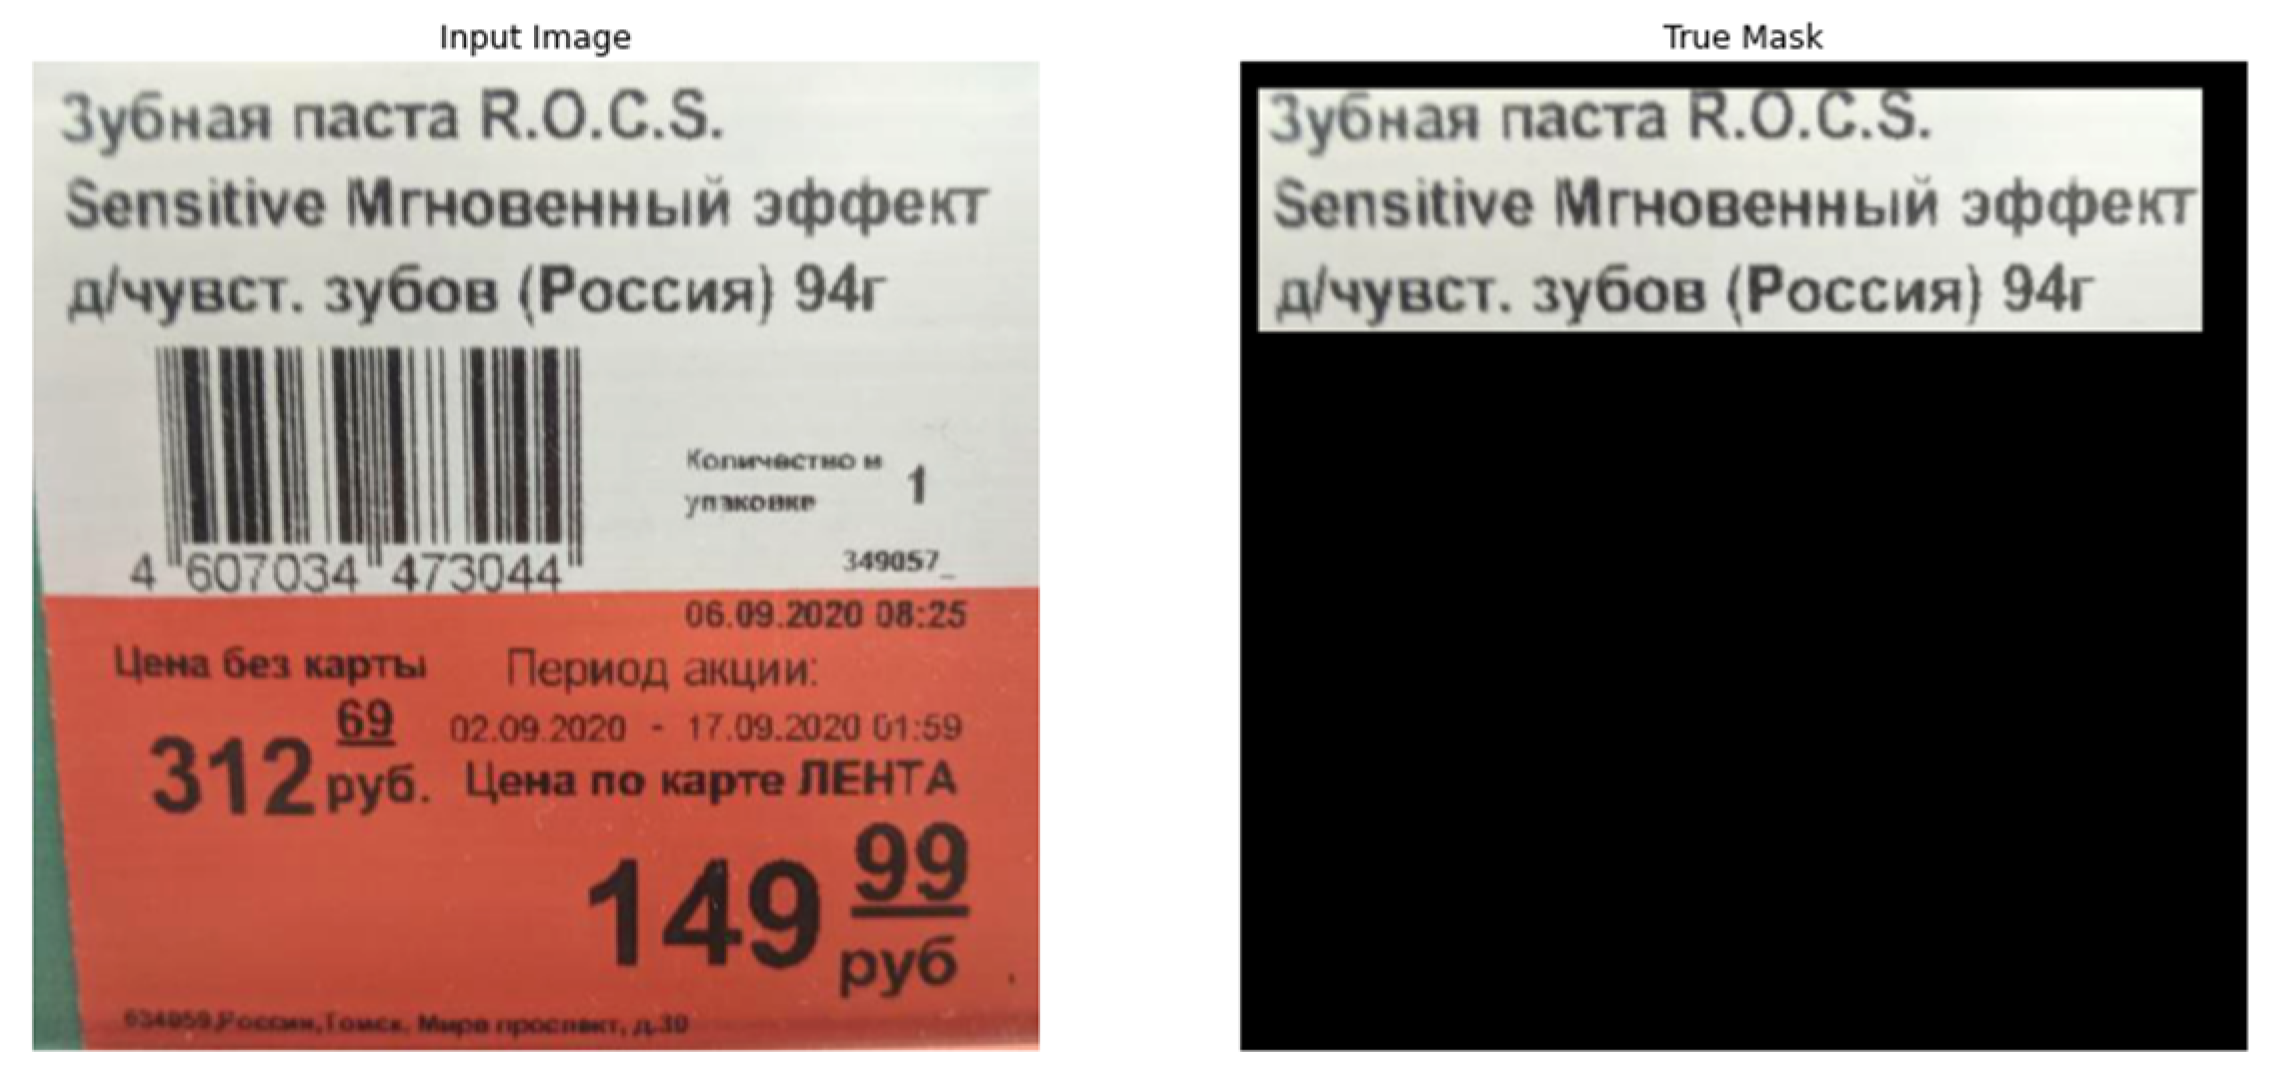
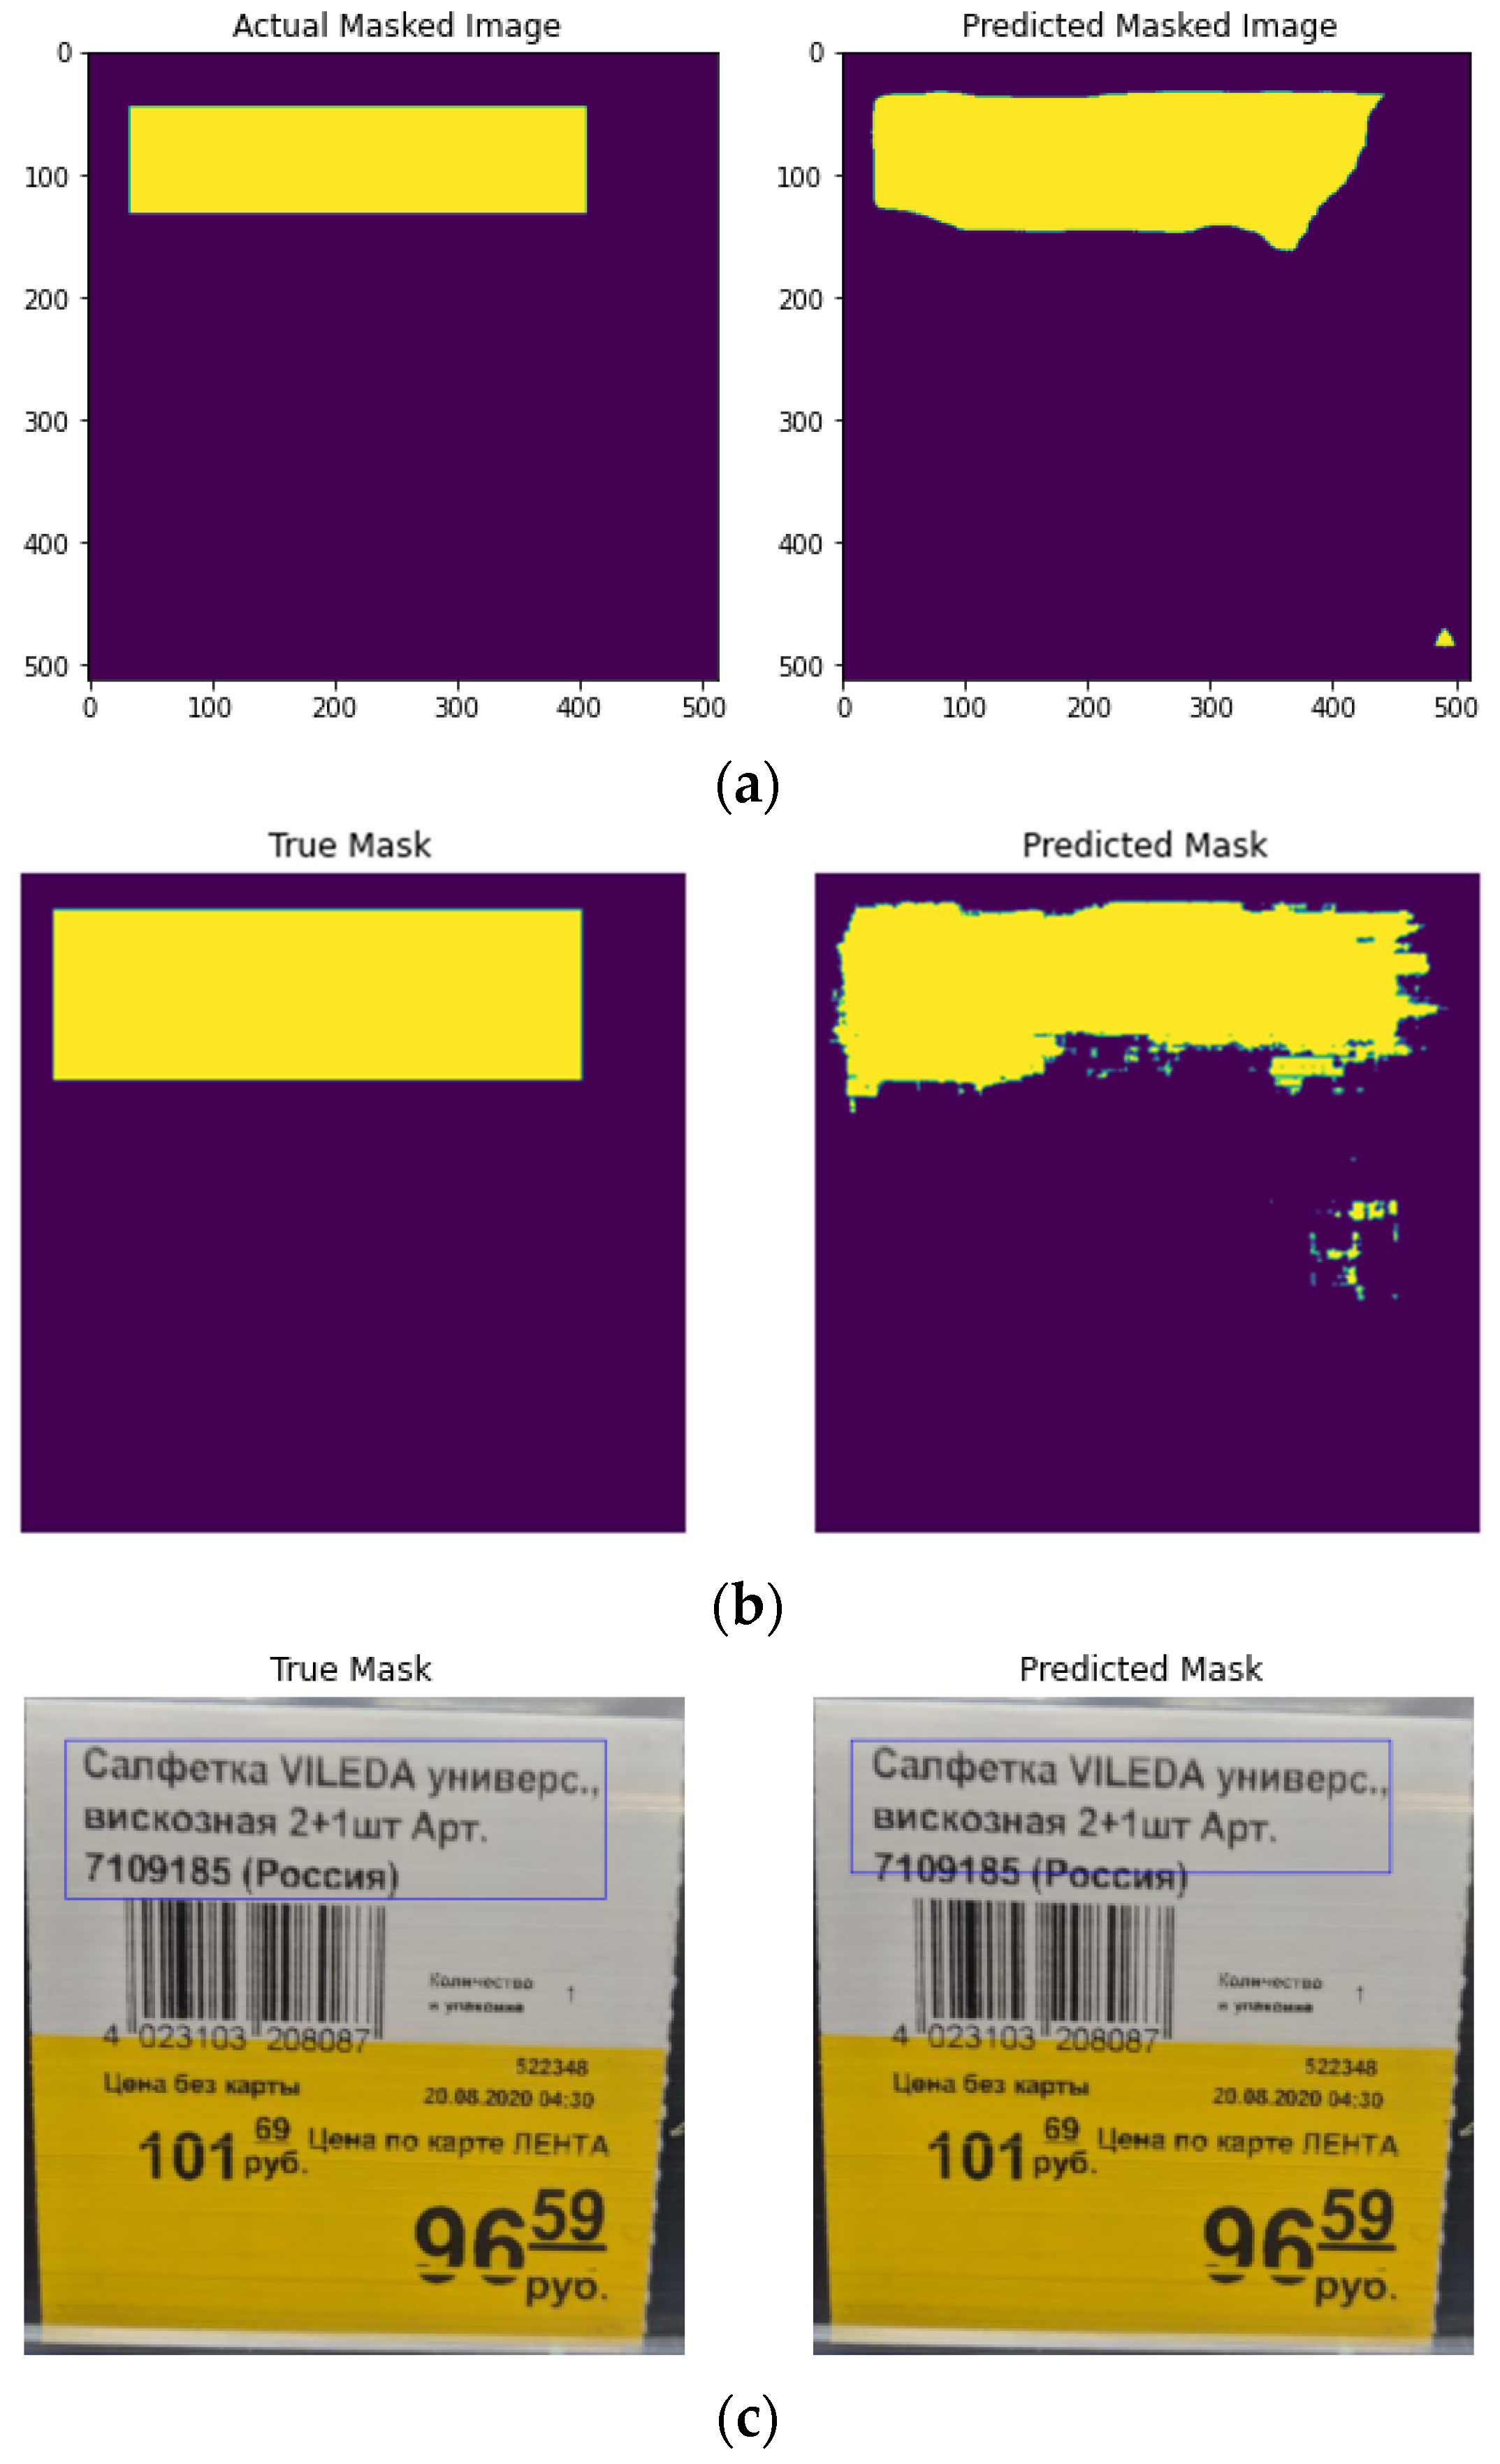
  • Segmenting images to highlight areas containing data of interest;
  • Selecting segment coordinates;
  • Cutting the segments out in accordance with the obtained coordinates;
  • Applying Optical Character Recognition (OCR) to the selected areas;
  • Searching for necessary information (quantity of products) within the product description.
The hardware and software used in this study:
  • LabelImg graphical image annotation tool;
  • Server CPU: Intel® Xeon® E7-4809 v4;
  • Server OS: Ubuntu Server.
A dataset consisting of “Lenta” retail chain price tag photographs was collected for the neural networks to be trained on. It consists of 80 photos of tags and 80 text files containing label coordinates (for YOLOv4-tiny); every image has a size of 512 × 512 pixels. For UNet, MobileNet and VGG16, the same photos were used along with the masks of segments. The training and validation parts of the dataset were split randomly at a ratio of 3:1. To train neural networks, each image was labeled with the following segments:
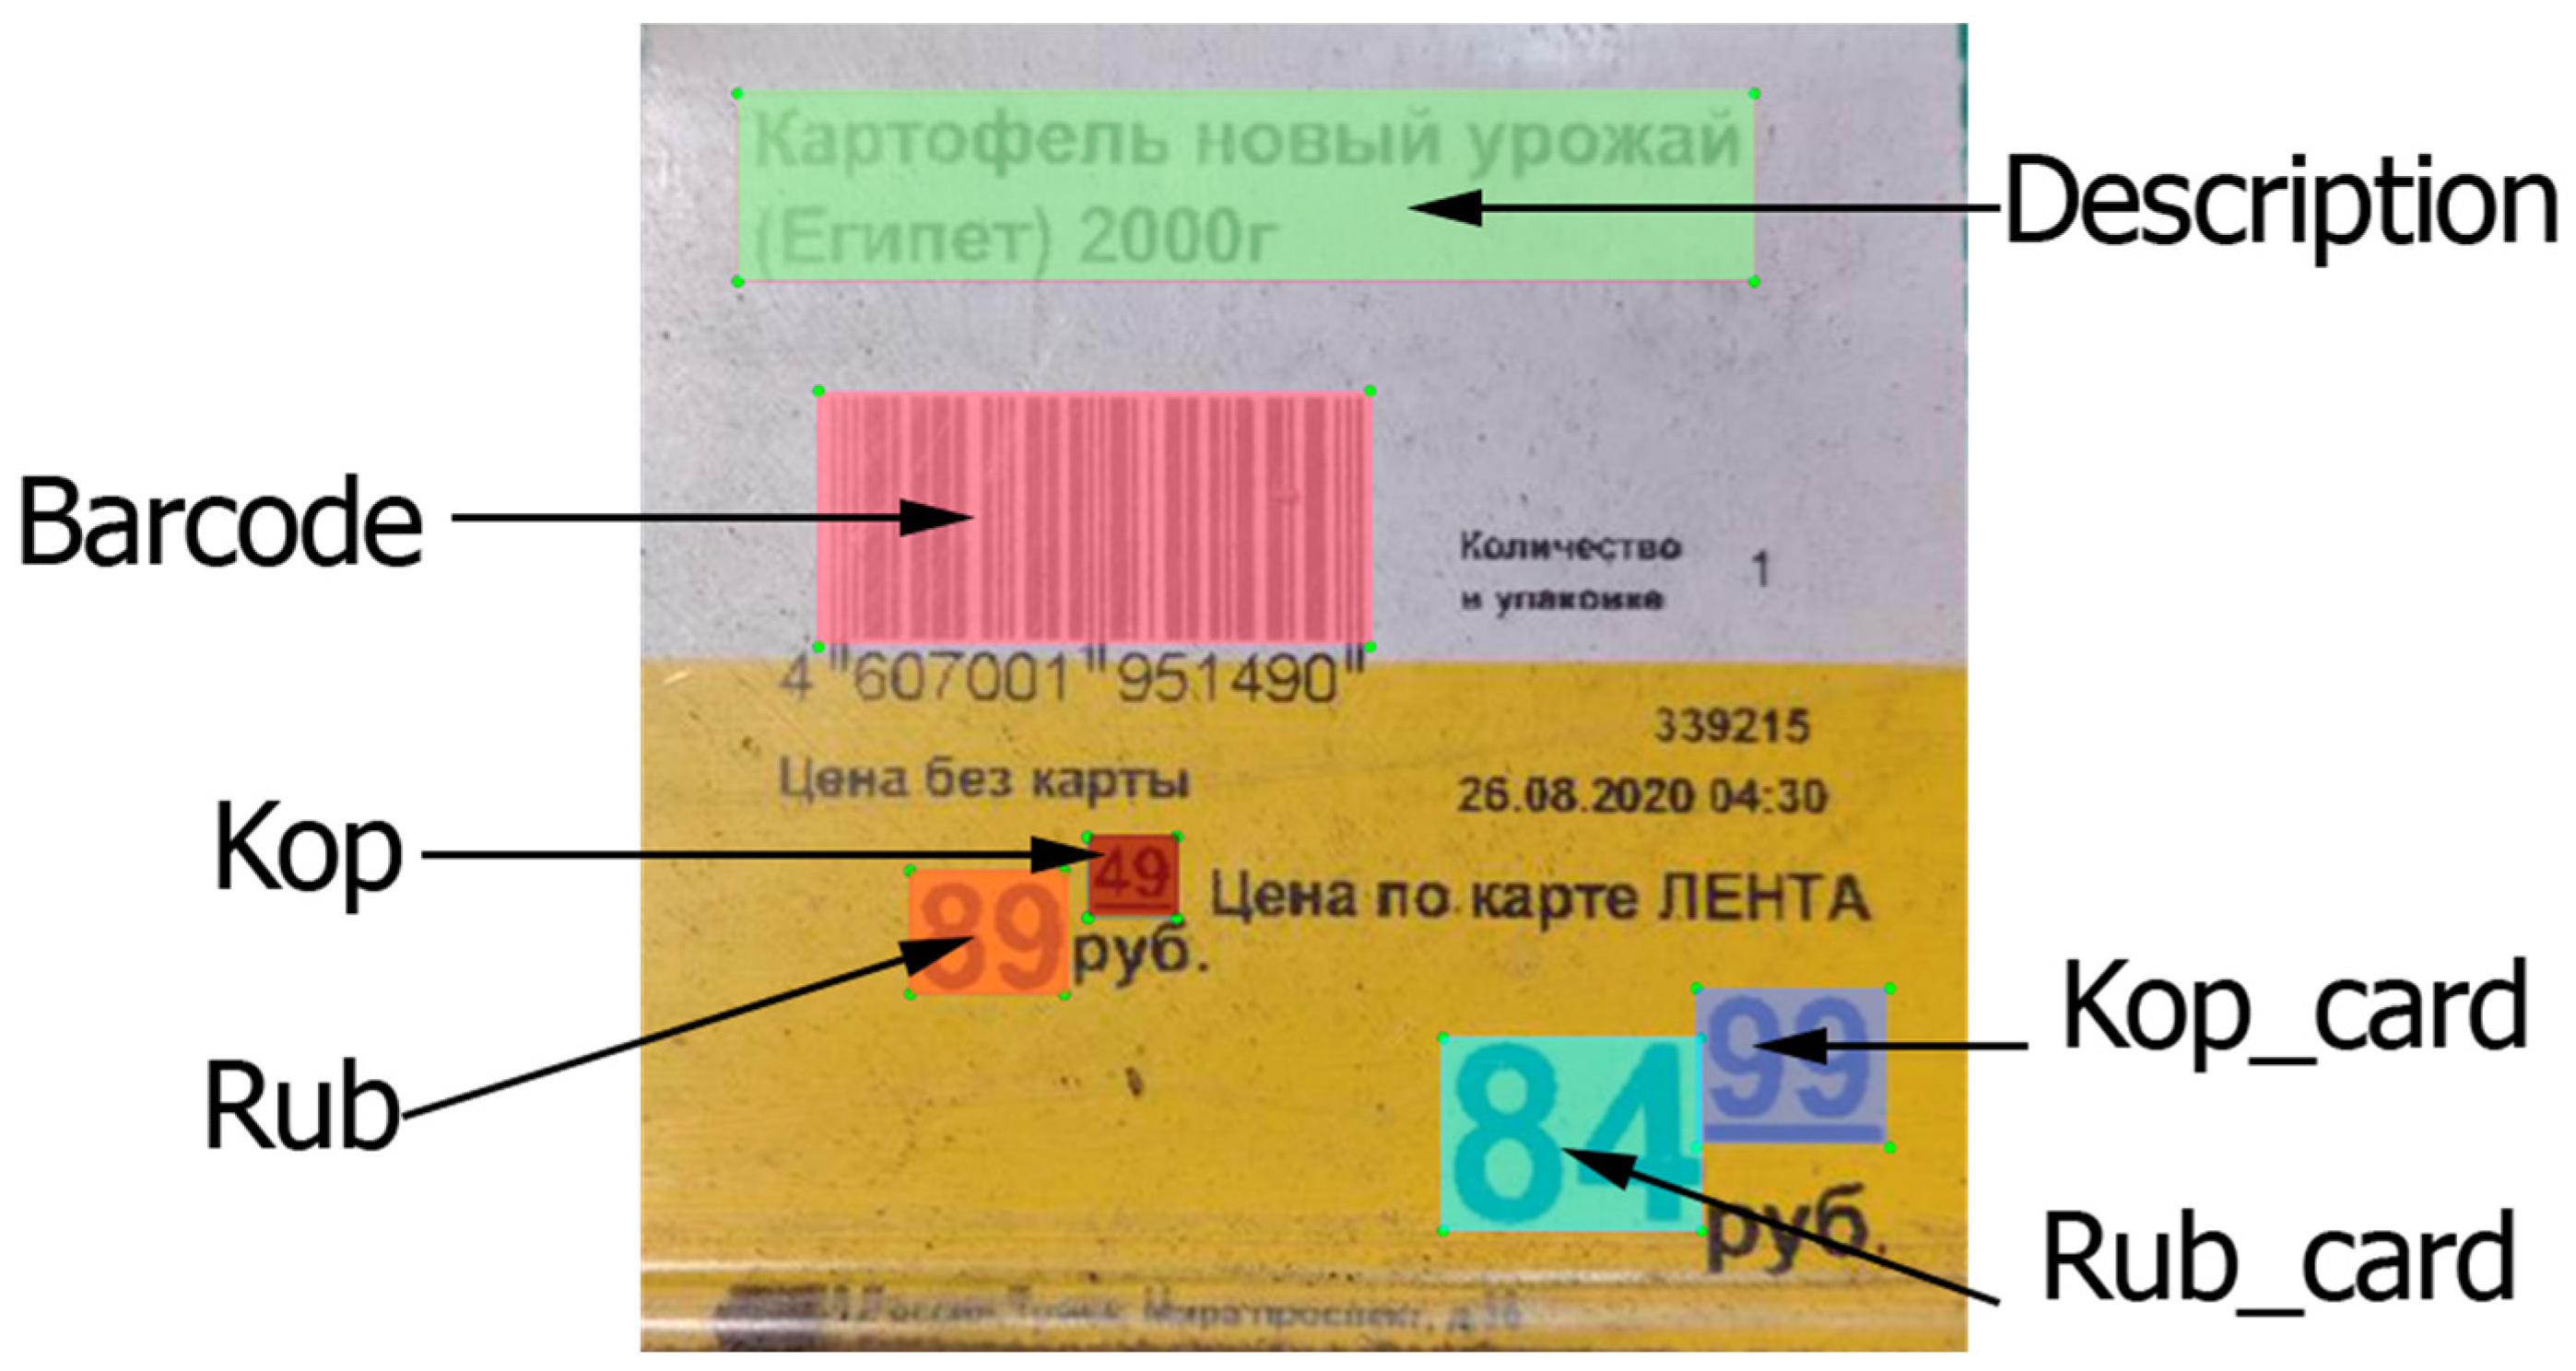
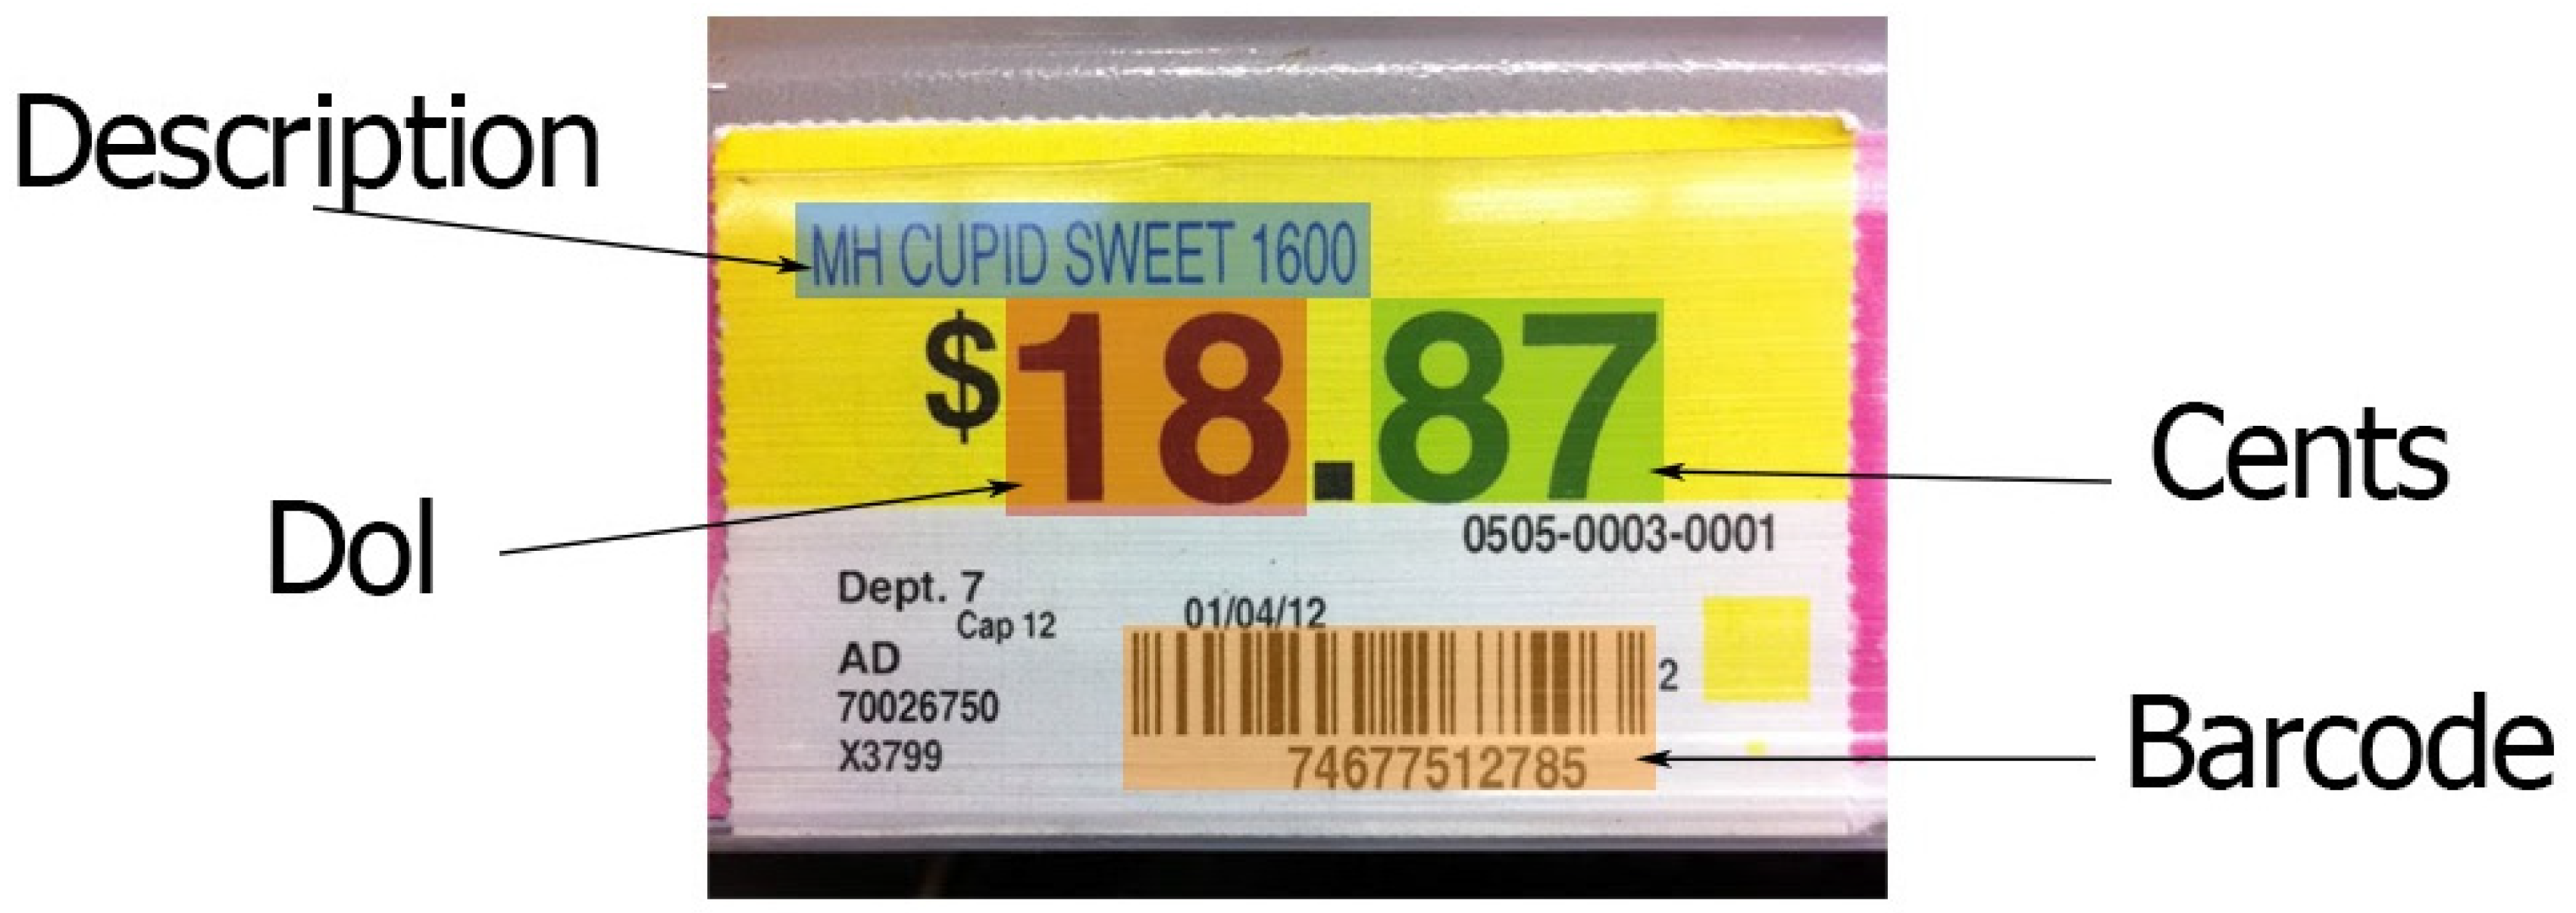
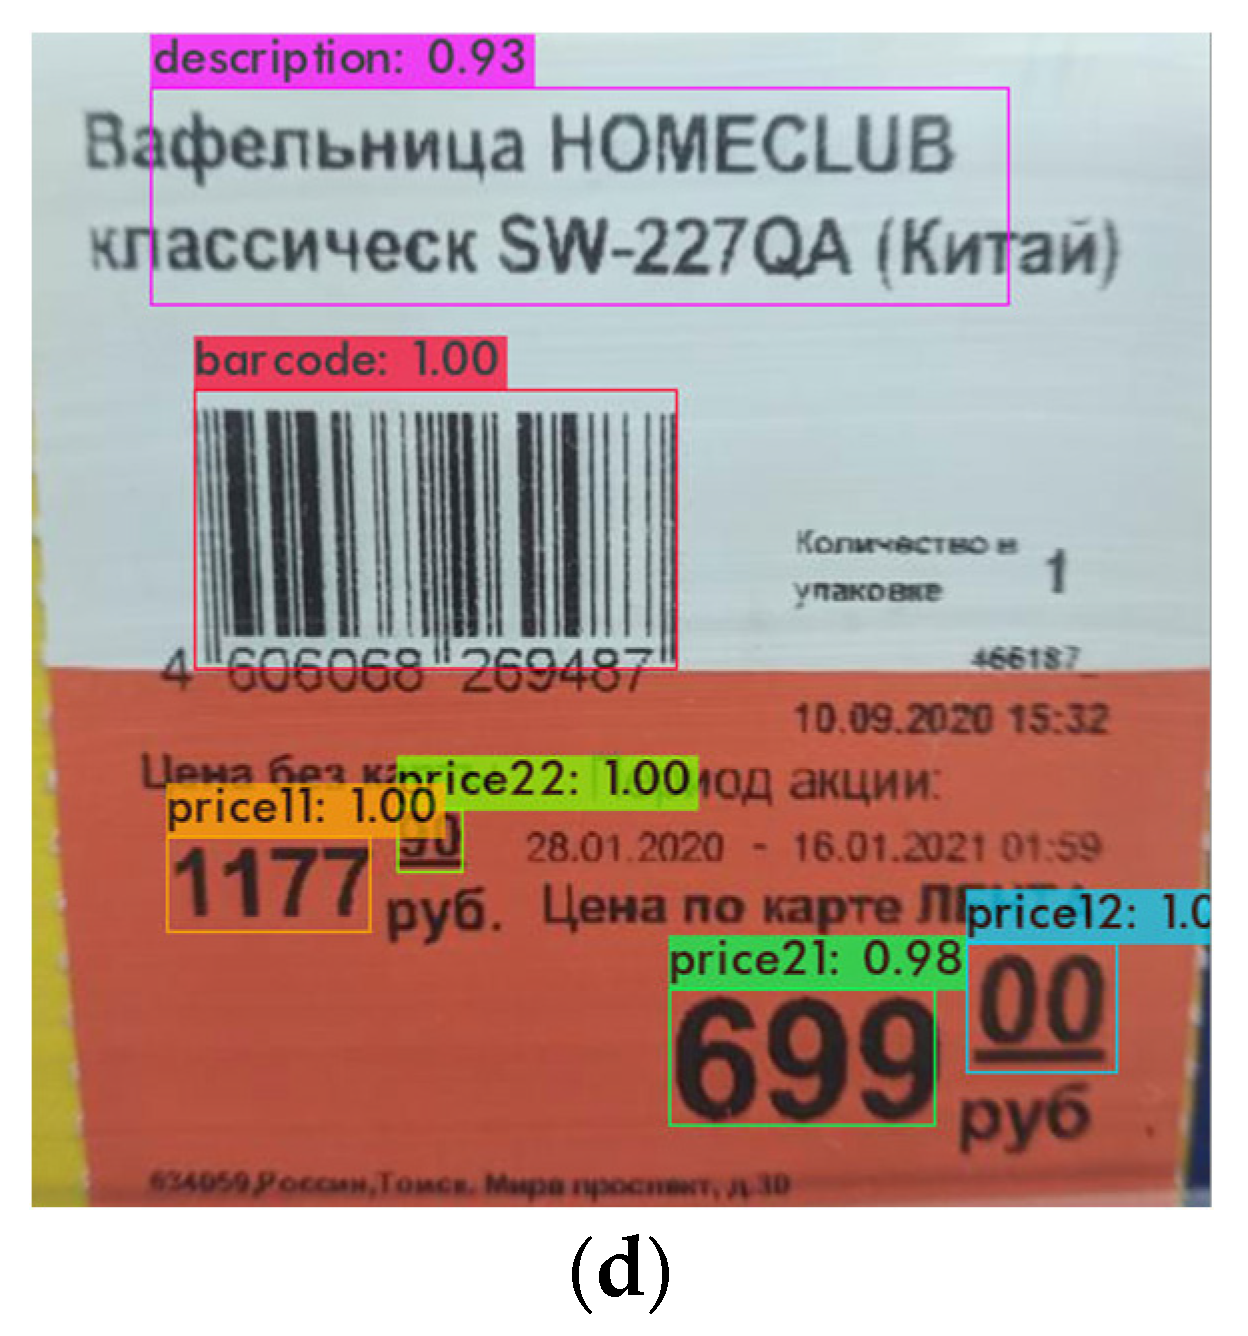
  • Description, which is a product name and description;
  • Barcode, which is an EAN-13 product barcode;
  • Rub, which is a product price in rubles;
  • Kop, which is a product price in kopecks;
  • Rub_card, which is a product price in rubles, including a discount for “Lenta” card holders;
  • Kop_card, which is a product price in kopecks, including a discount for “Lenta” card holders.
Example of labeling is shown in Figure 1.
The differences between the Russian price tags and the price tags in other countries are insignificant, because in many countries the price tags have a similar structure and each price tag has segments with a description of the product, a barcode and a price. Differences can be found in the location of the segments and in the number of segments with a price, for example, the price with a discount card and the price before and after the discount.
Figure 2 shows an example of the markup of a similarly structured price tag for the Walmart chain of stores. The Description and Barcode segments are present and differ only in location, while the Dol and Cents segments are analogous to the Rub and Kop segments, respectively.
There are many different architectures available to carry out the segmentation. In our research, we have chosen the following models: Unet, MobileNetV2, VGG16 and YOLOv4-tiny. The EasyOCR API was chosen for text recognition. Each of the selected models was trained featuring the following parameters:
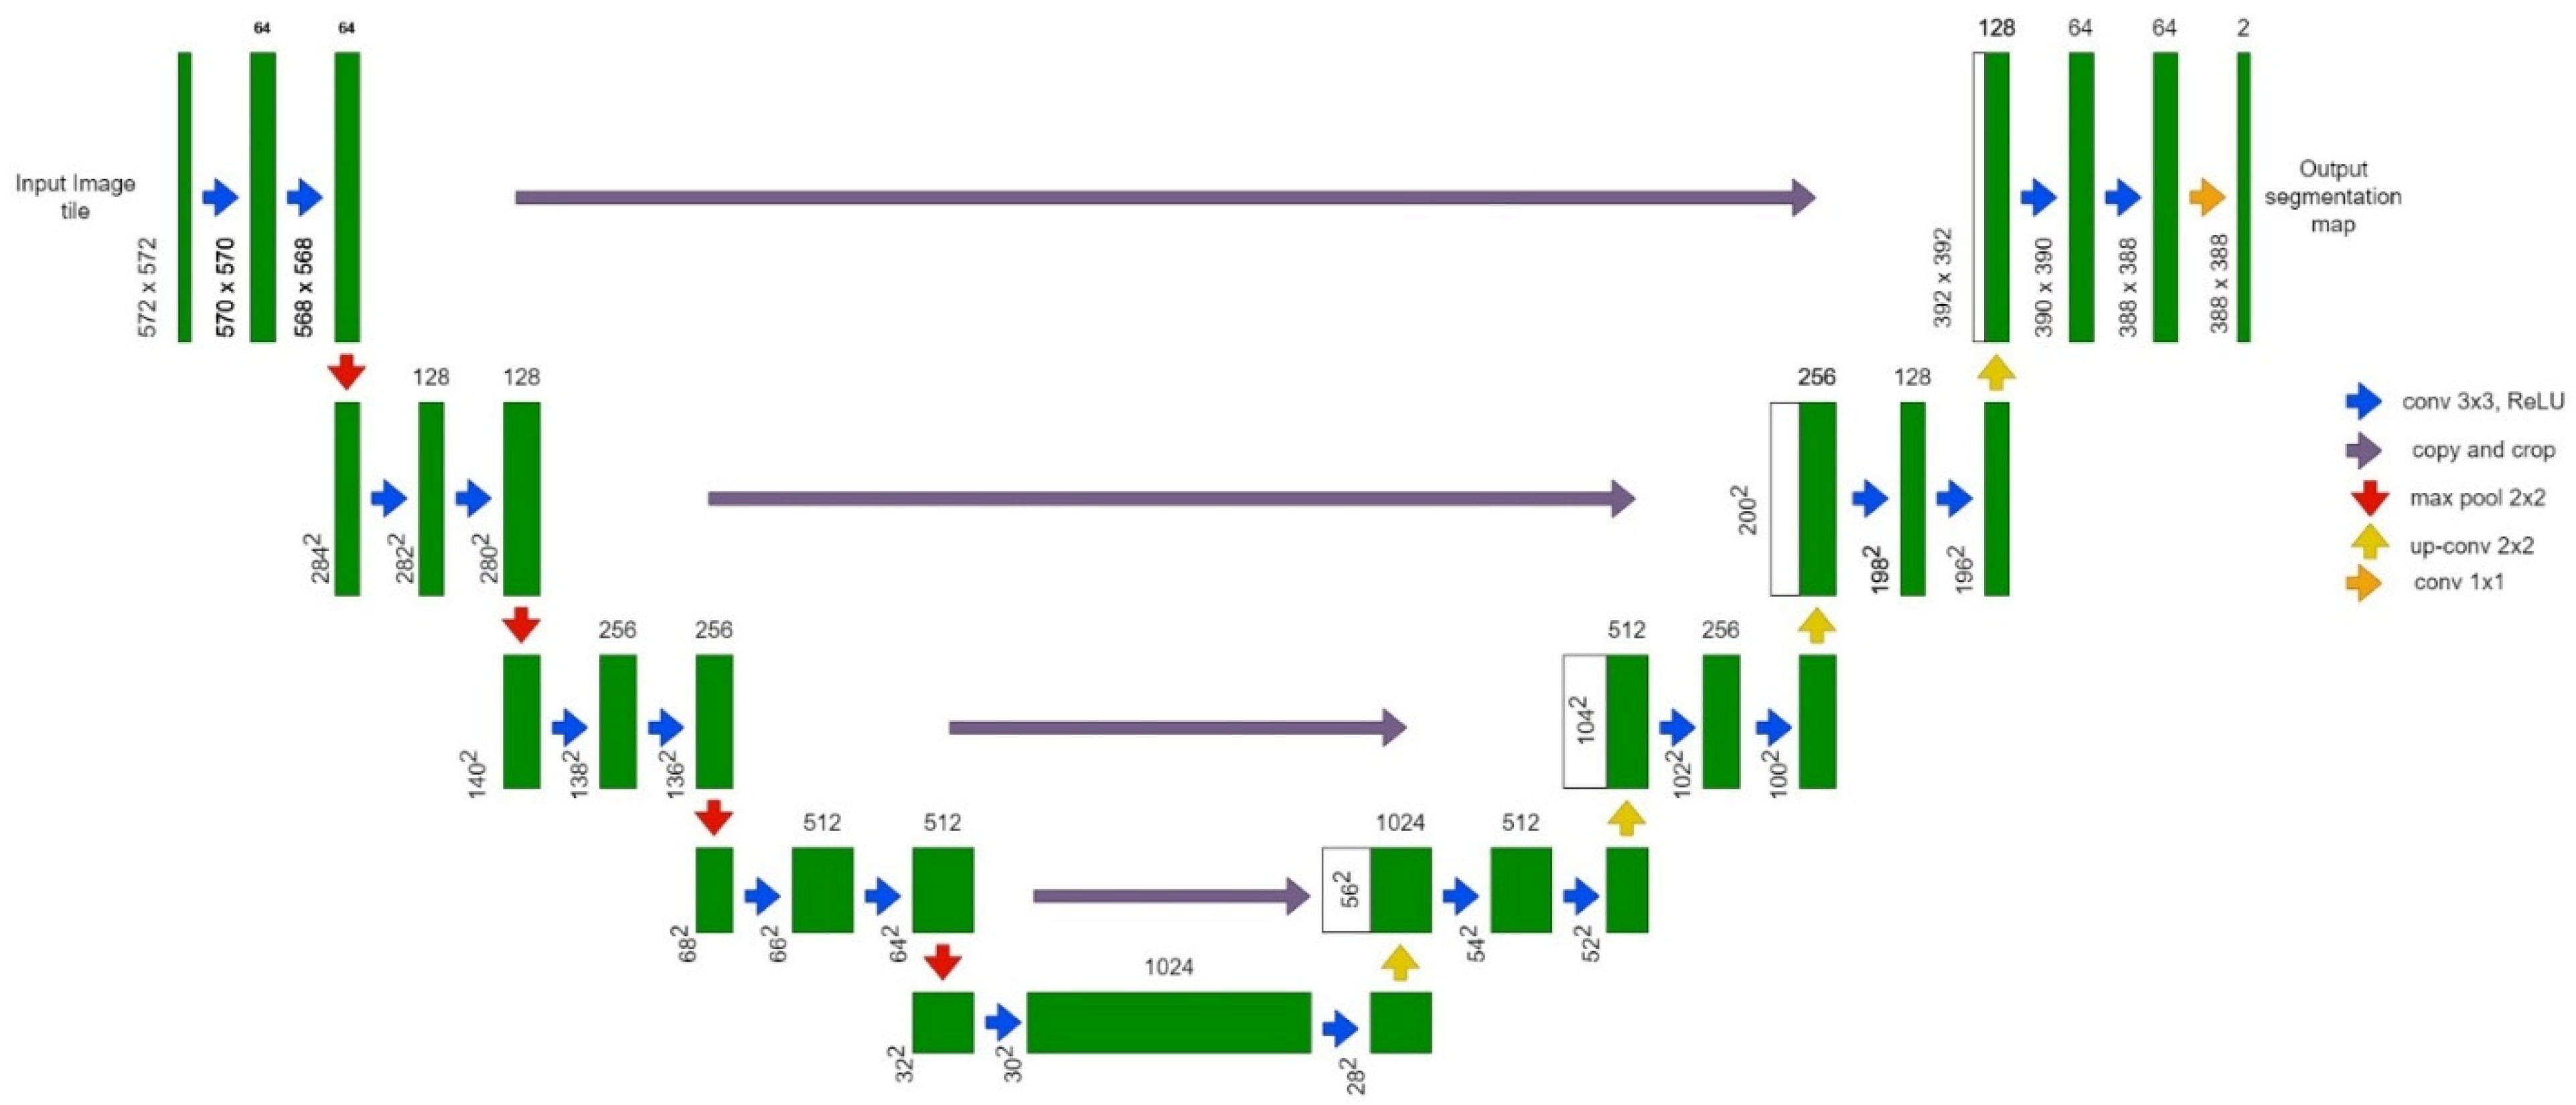
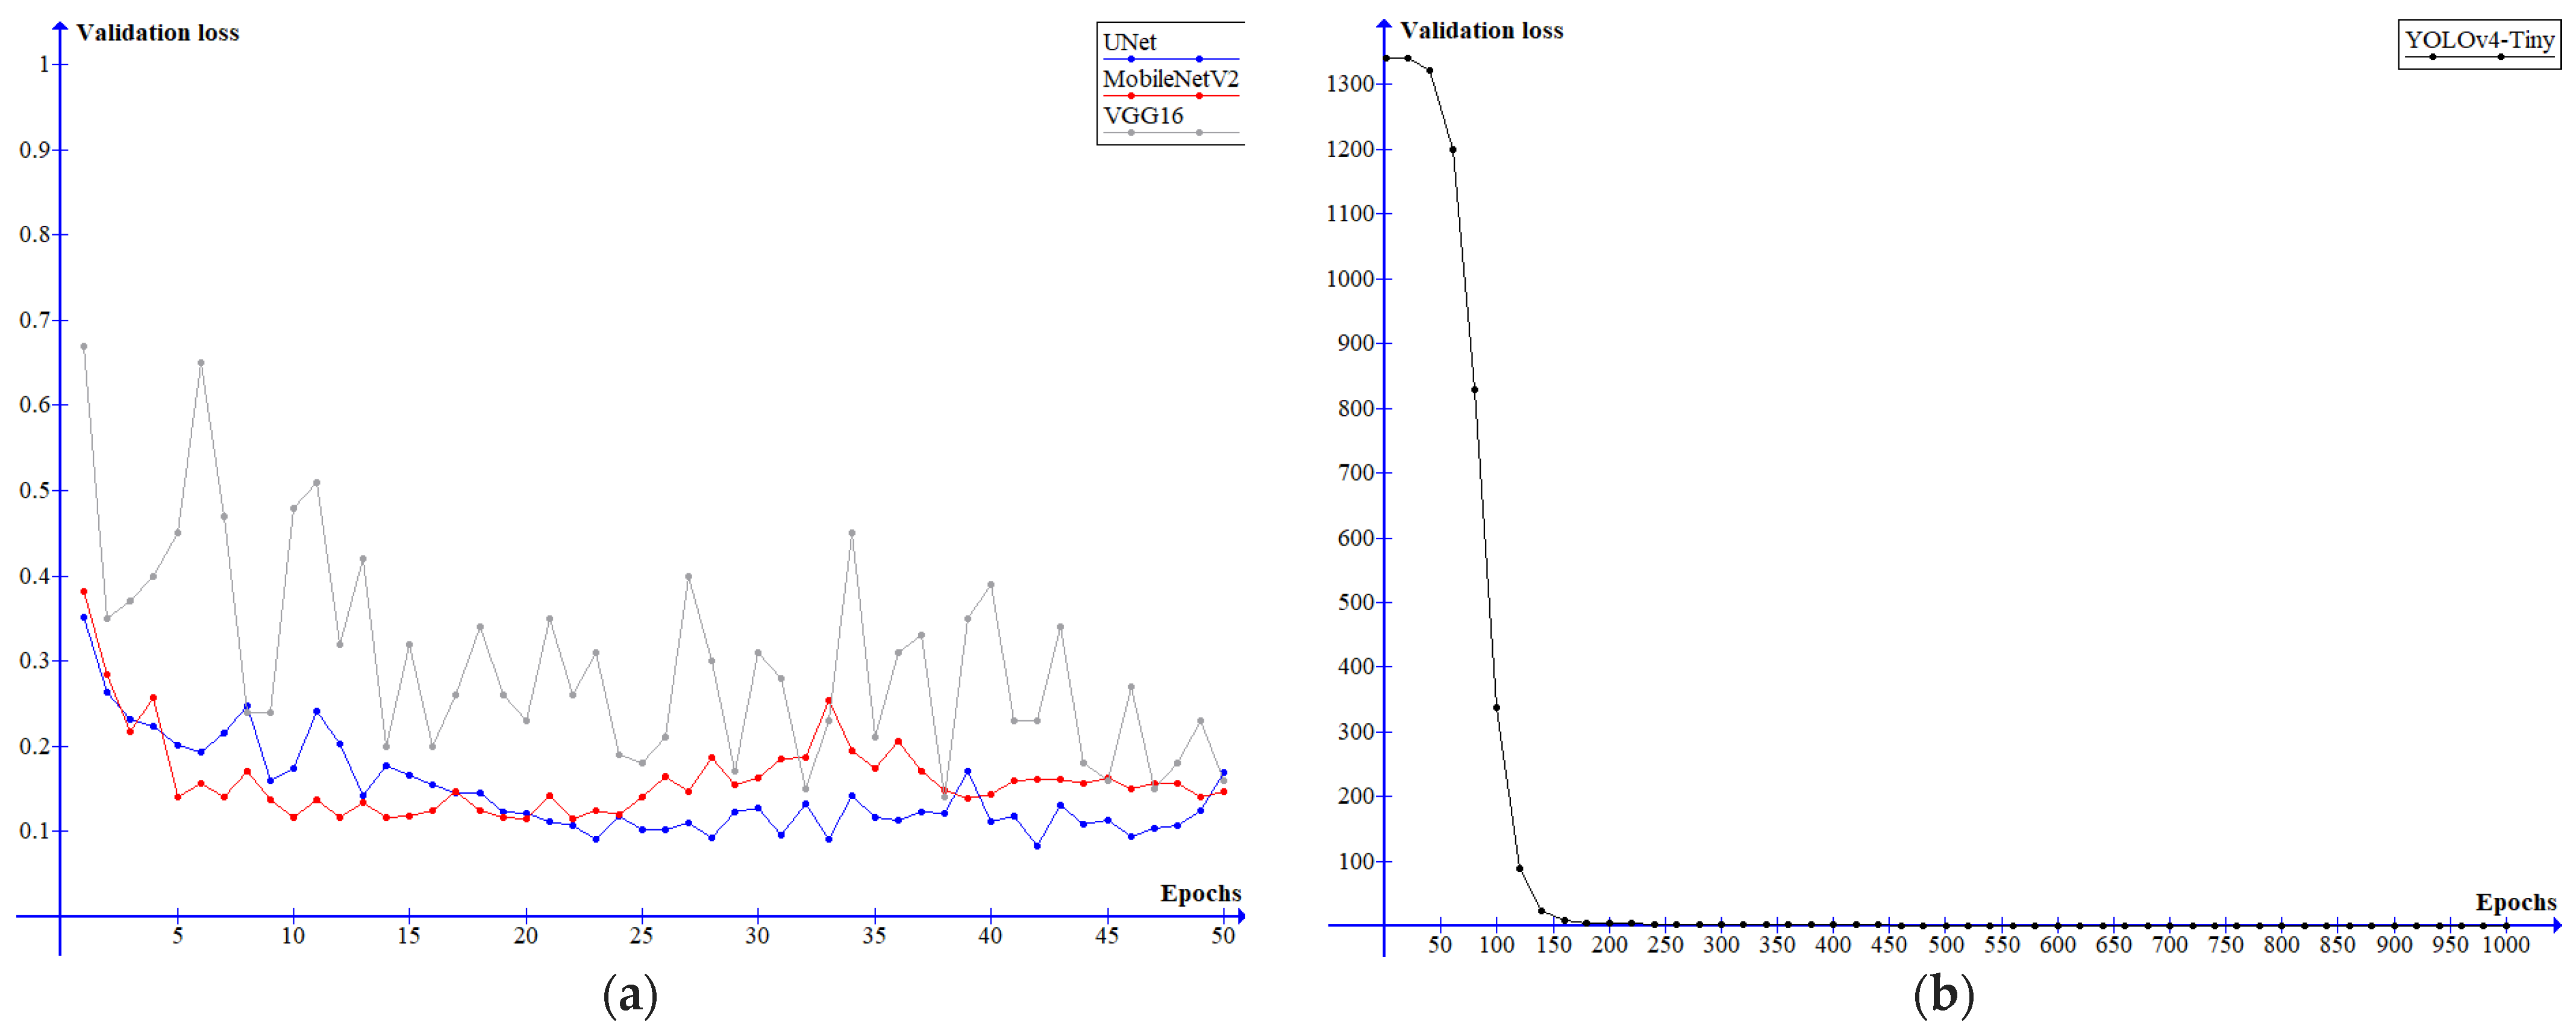
  • UNet: loss function—cross entropy; optimizer—Adam algorithm with learning rate lr = 0.0001; batch size—5; number of iterations per epoch—12.
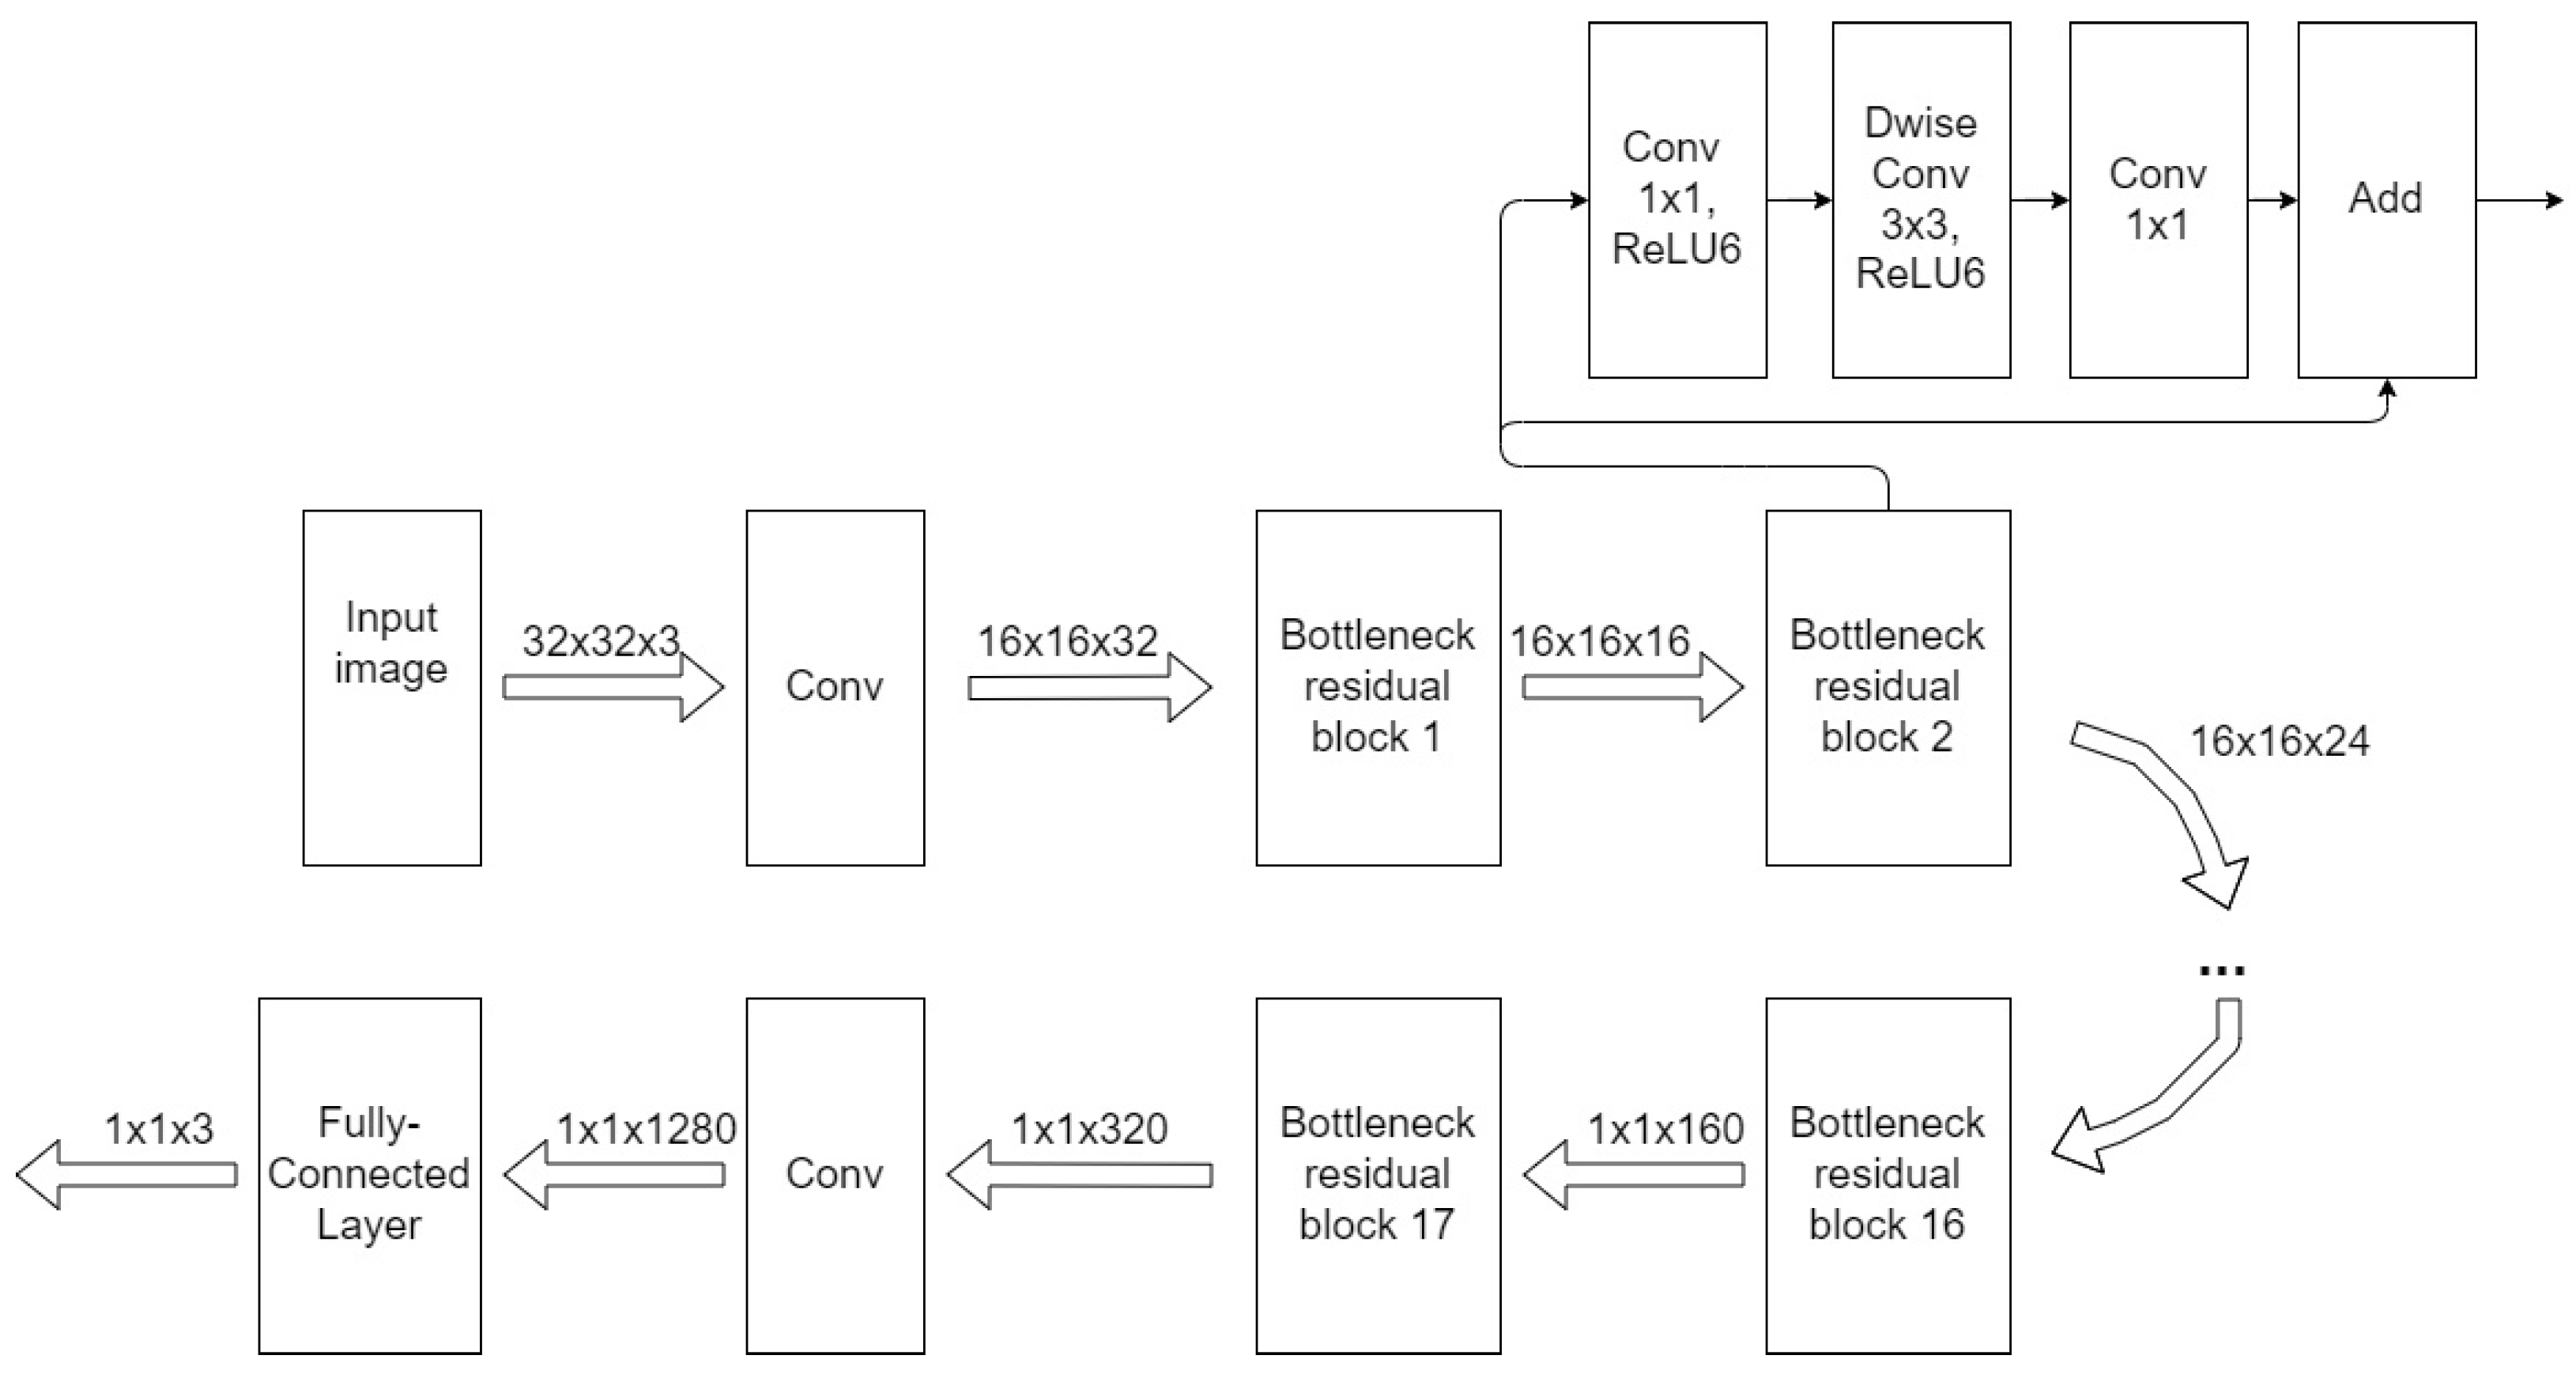
  • MobileNetV2: loss function—cross entropy; optimizer—Adam algorithm with learning rate lr = 0.0001; batch size—5; number of iterations per epoch—12.
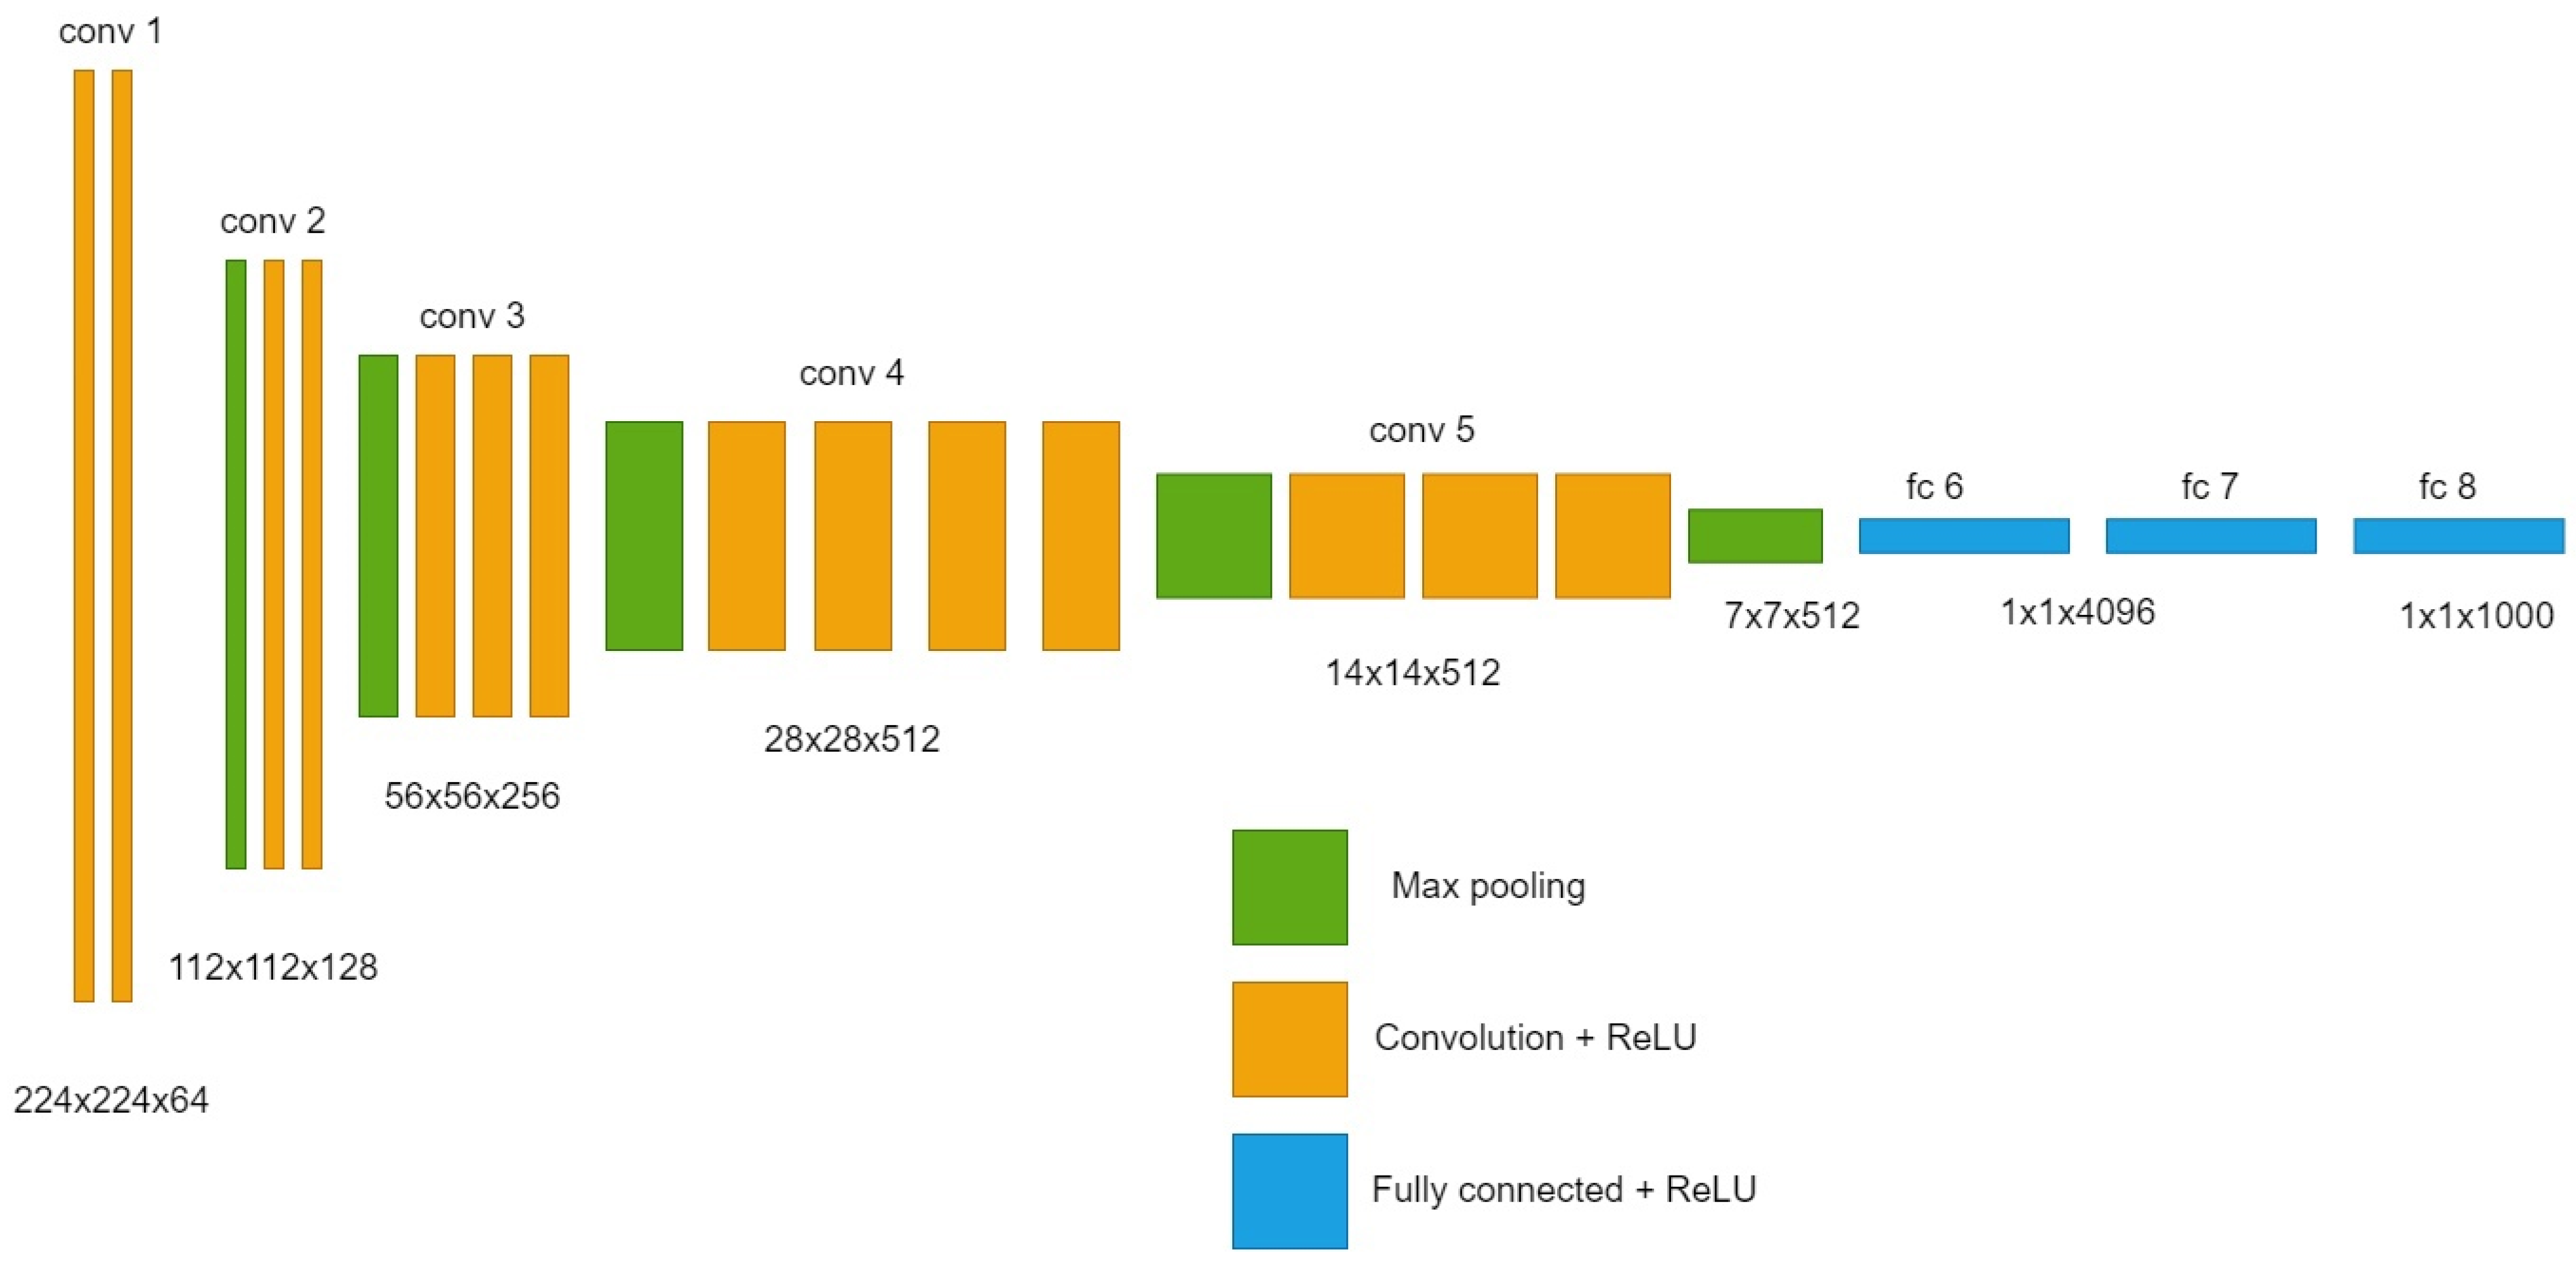
  • VGG16: loss function—mean squared error (MSE); Optimizer—Adagrad; batch size—5; number of iterations per epoch—12.
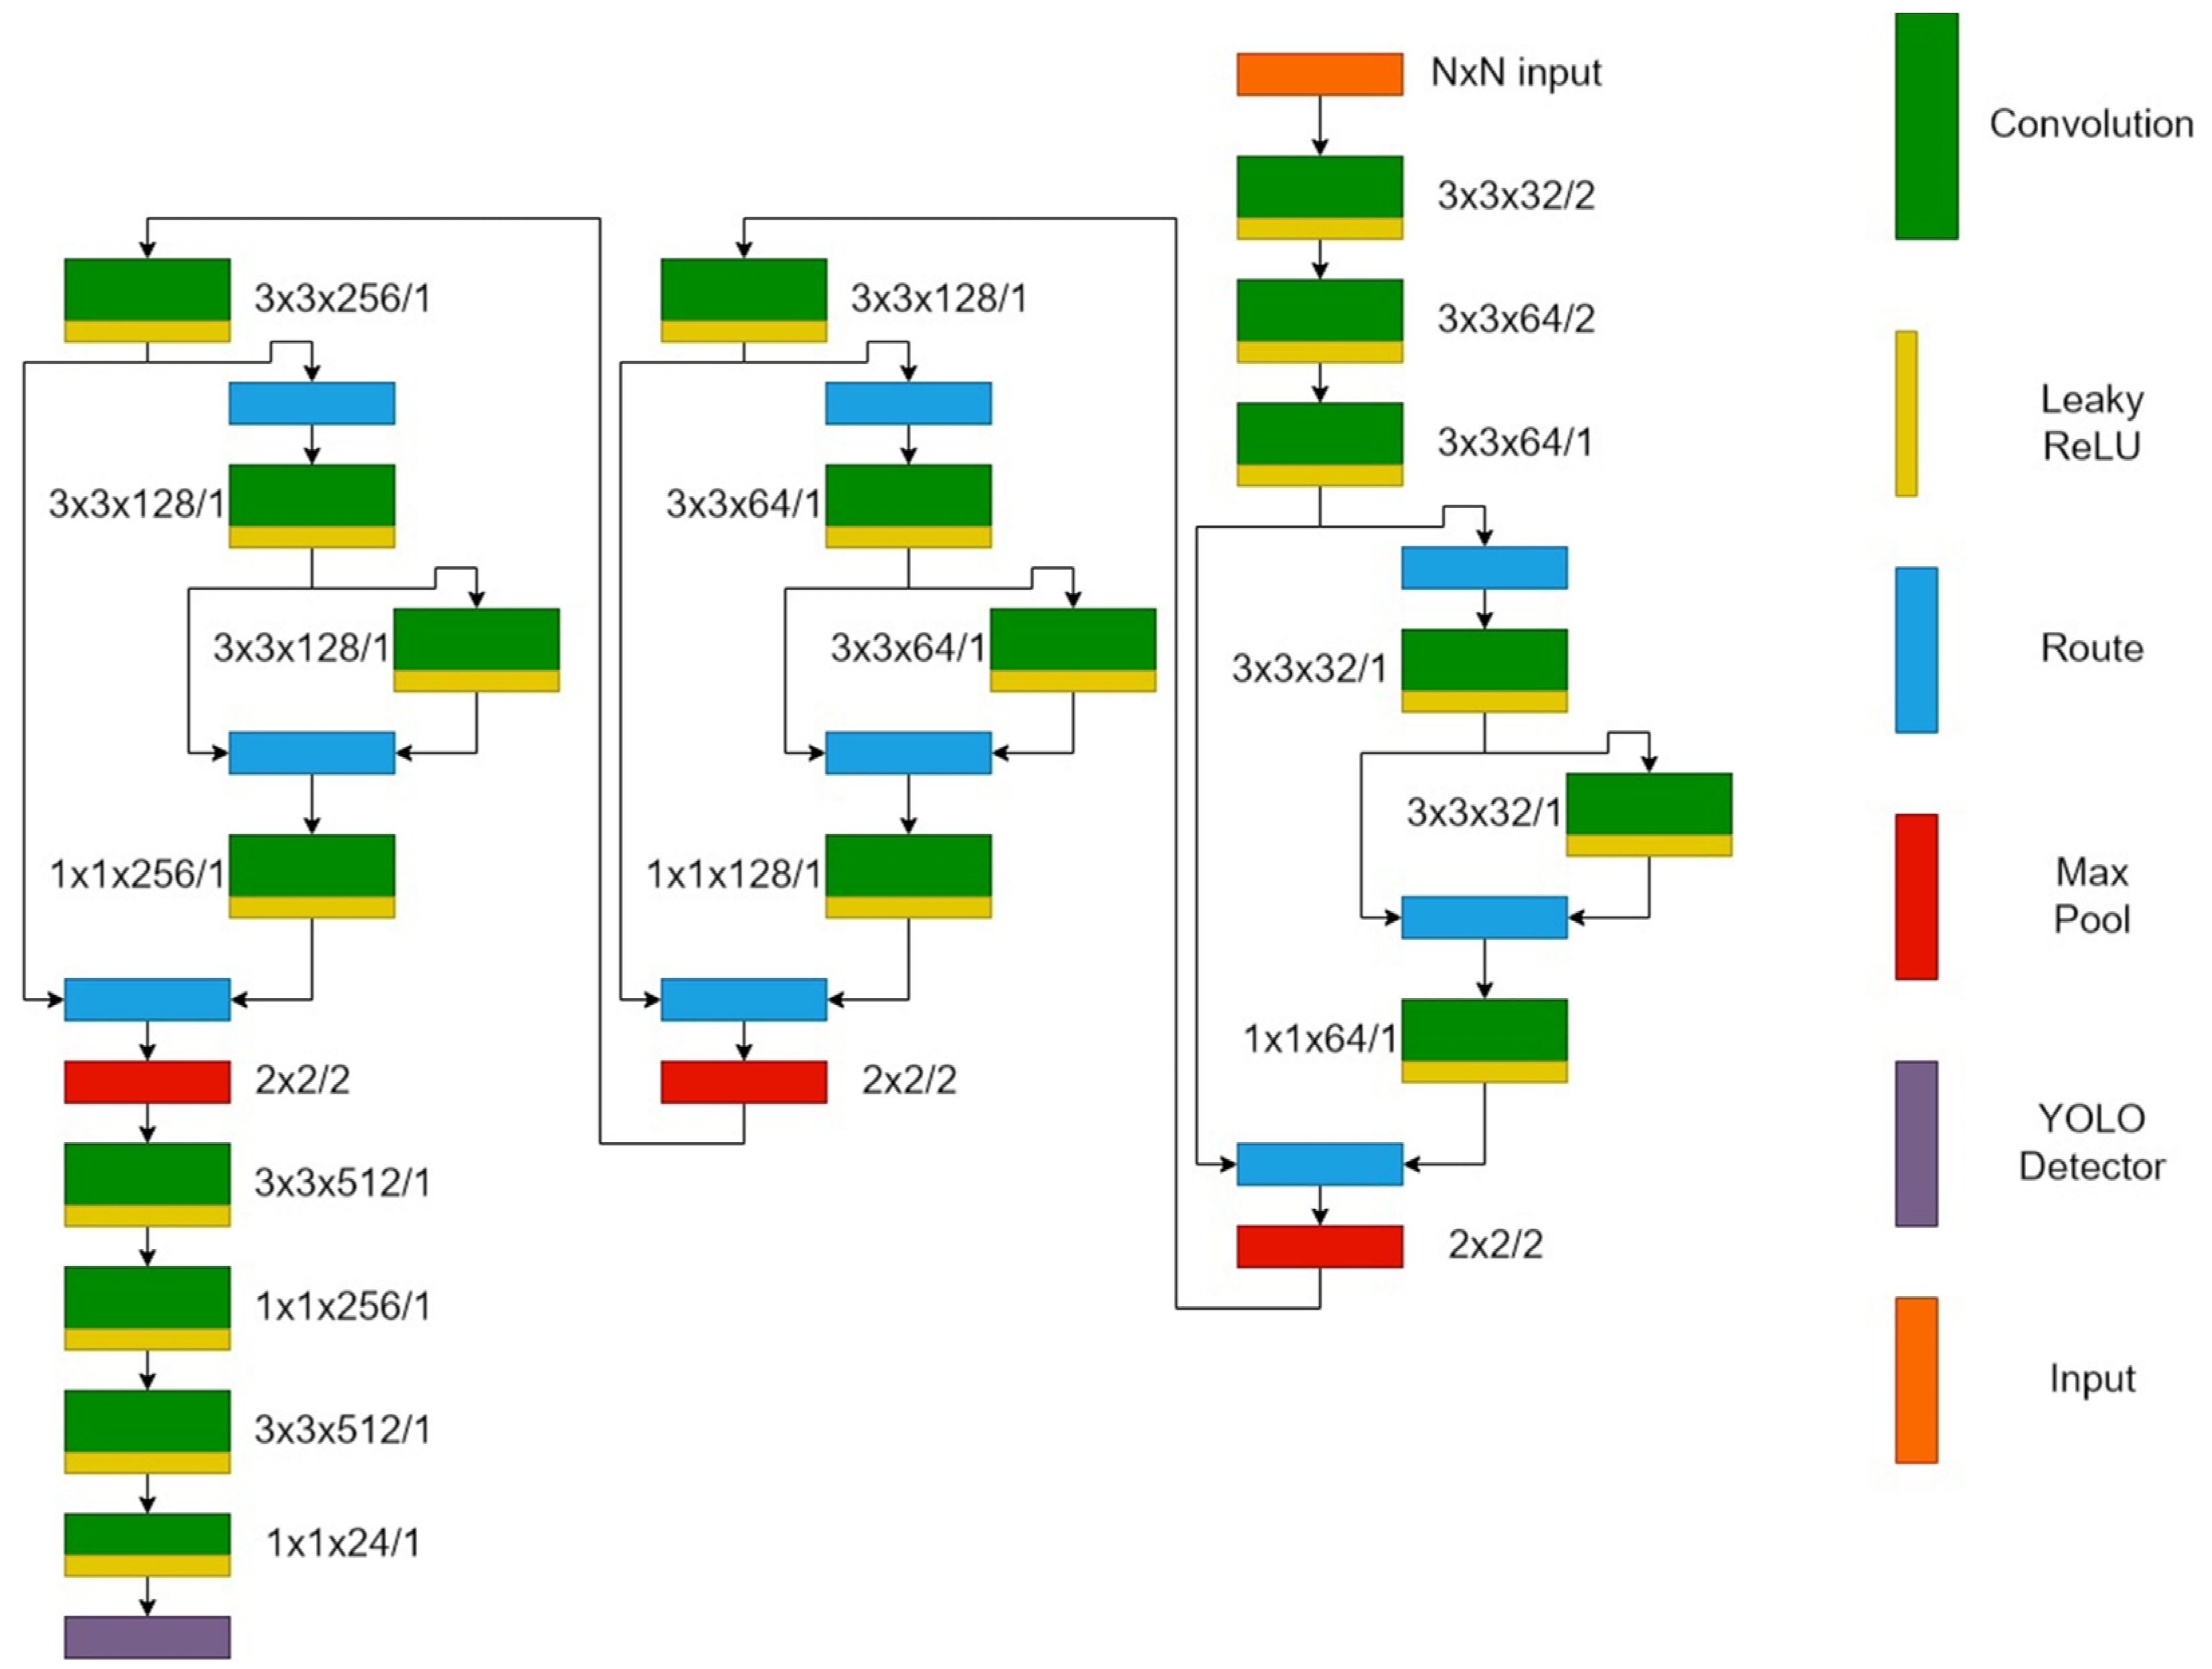
  • YOLOv4-tiny: loss function—complete intersection over Union (CIoU); optimizer—stochastic gradient descent (SGD); batch size—64; number of iterations per epoch—24.
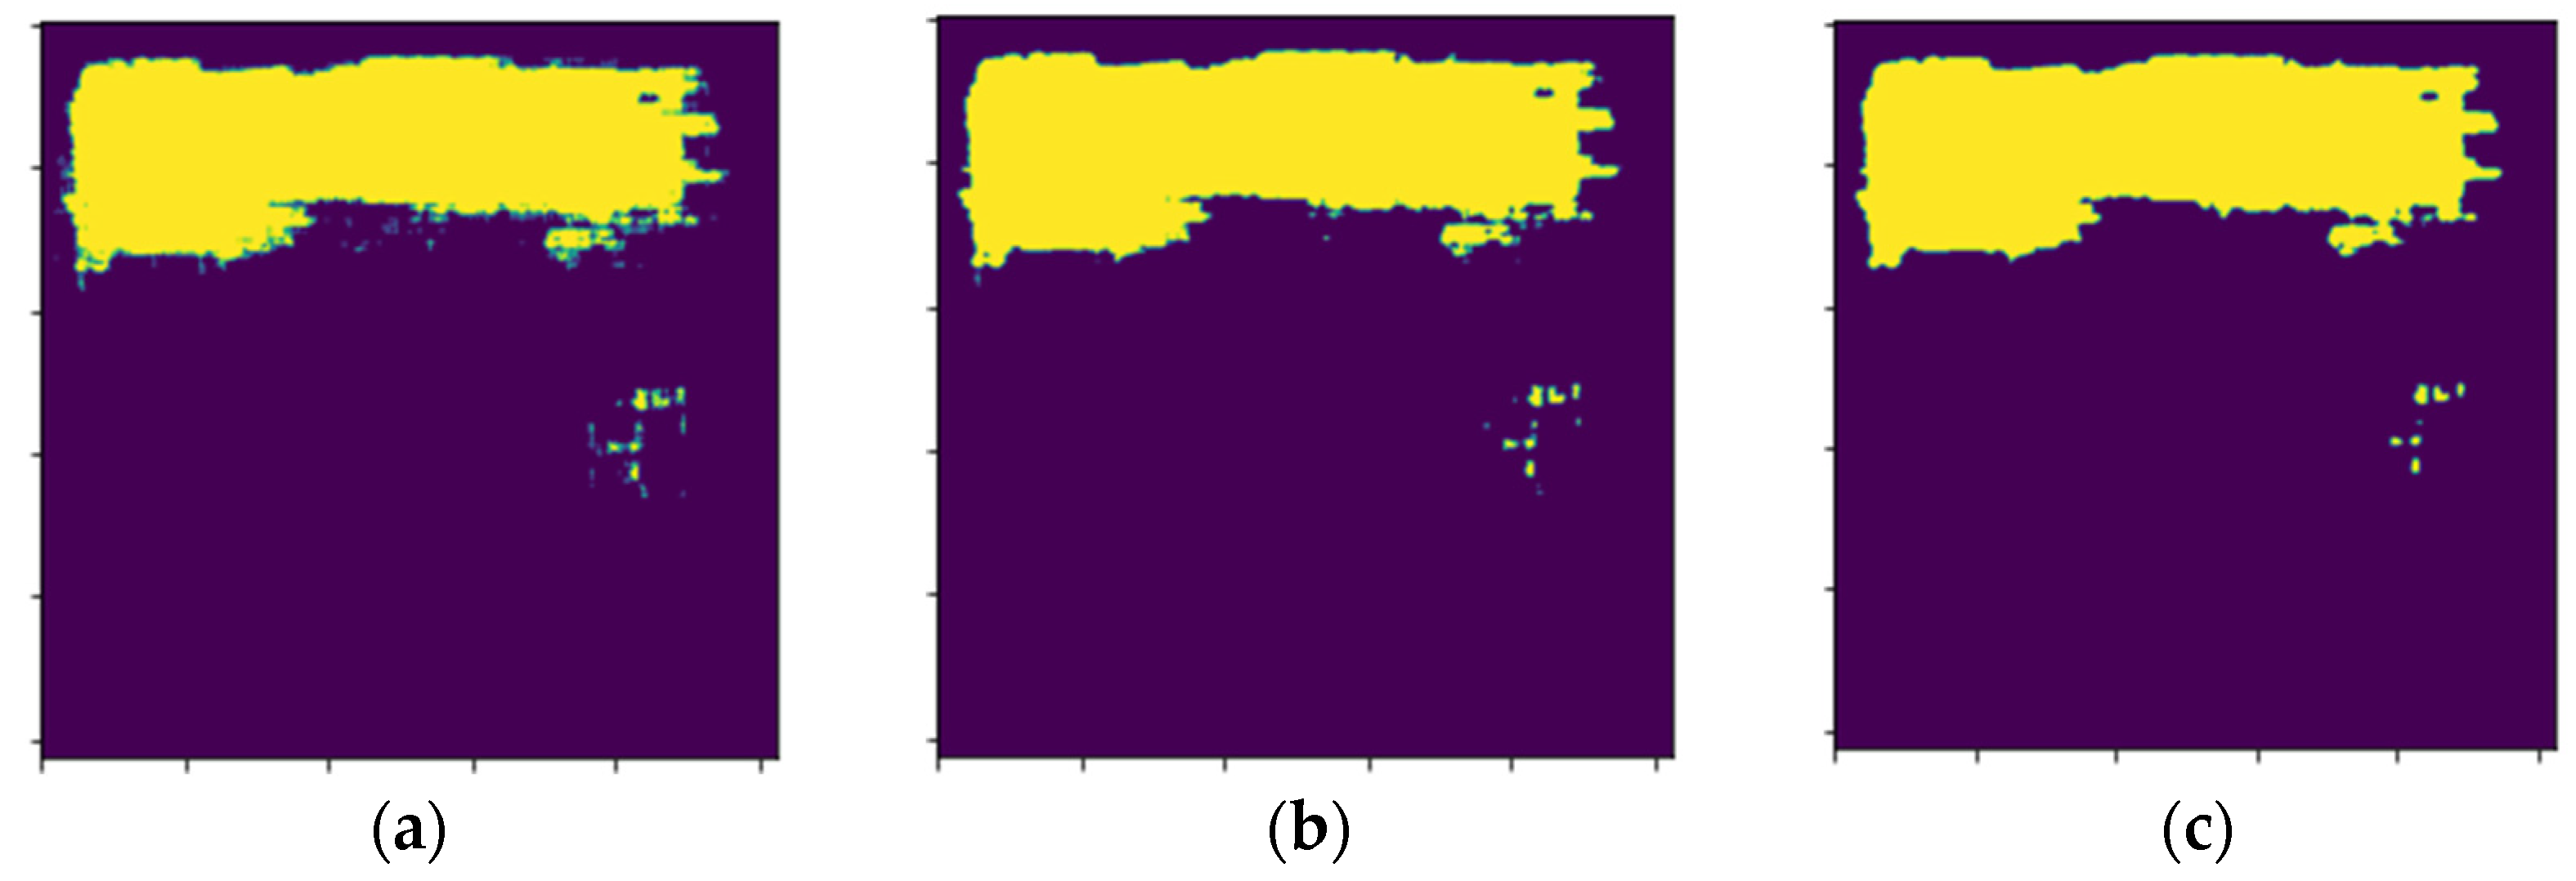
Since the loss functions of the Unet, MobileNetV2 and VGG16 architectures are characterized by a large gradient step, they were trained over 50 epochs. YOLOv4-tiny was trained on 1000 epochs, due to the small gradient step.
Since the training of neural networks is time-consuming and for UNet, MobileNetV2 and VGG16 networks it is necessary to highlight each segment on a separate image, these networks were trained on the product description segment only, since this segment is unstable and features the largest size. An example of the product description segment layout is shown in Figure 3.
The UNet model architecture is a set of 19 convolutional layers using bottleneck and sliding windows [17,18]. This network has proven to be a reliable and high-quality image segmentation solution. The complete Unet architecture is given in Figure 4.
The MobileNetV2 architecture is shown in Figure 5. A distinctive feature compared to Unet is the repetitive application of bottlenecks, which allow the accuracy of the final result to be improved [19,20]. Since this model does not employ the sliding window, shorter training and operation times are possible.
VGG16 is a convolutional neural network presented by K. Simonyan and A. Zisserman [21]. While training on the ImageNet dataset, this model achieved an accuracy rate of 97.2%, thus ranking among the top five solutions for ImageNet dataset. A distinctive feature compared to previous models is the rejection of bottlenecks, which can reduce the neural network training and operating time [22]. This architecture was originally designed for the classification problem, which may raise the question of objectivity in comparing it with other selected architectures. However, if the coordinates of the upper left-hand corner of the segment, as well as its width and height, are chosen as classes, the work will be reduced to a segmentation process, which confirms the objectivity of our comparison. The VGG16 architecture is shown in Figure 6.
YOLOv4-tiny is a high-speed, real-time image and video object recognition neural network. The architecture of this model is shown in Figure 7 and similarly features a set of convolutional layers. Its distinctive feature consists in obtaining the final results from several intermediate ones, thus significantly increasing the achieved accuracy [23]. Additionally, YOLOv4-tiny allows multiple objects to be displayed that belong to different classes, which can reduce the application of the neural network to just a single run. The segment detector was trained using Darknet repository [24,25].
The EasyOCR API by JaidenAI, whose architecture is shown in Figure 8, was used for text recognition from the segments obtained. The CRAFT text recognition model is used as the detector, and the ResNet neural network is used as the recognizer. The advantages of this API are that this product is an open source and supports a large number of languages, including Russian, English, German, Chinese, etc. Additionally, the EasyOCR output is a text string, which simplifies further text processing and analysis.
The major disadvantage of this API is the errors in the recognition of special characters such as “_”, “#”, “%”, brackets, etc.; however, this problem can be solved with additional training.
The Python pyzbar [26] library was used to recognize barcodes. This library is able to decode the barcode itself and define its type.

4. Results

Two metrics were chosen as performance indicators: accuracy and F1-score. The metric data calculation is represented in Equations (1)–(4).
A c c u r a c y = T P + T N T P + F P + F N + T N
P r e c i s i o n = T P T P + F P
R e c a l l = T P T P + F N
F 1 = 2 · P r e c i s i o n · R e c a l l P r e c i s i o n + R e c a l l
where TP is true positive results, FP is false positive results, TN is true negative results and FN is false negative results.
Accuracies achieved in the course of training are presented in Table 1. Additionally, this table presents the average time spent for each epoch.
Figure 9 shows a graphs of the change in the loss function during the neural network’s learning process.
The results for the trained networks are shown in Figure 10.
It is evident from Figure 9 that Unet and MobileNetV2 correctly determine the segment position, but when selecting it, they make mistakes, not highlighting parts from the required area and capturing irrelevant areas. The accuracy can be improved by using a median filter, which studies a region for each pixel, determines the most common value in that region, and replaces the pixel with that value.
Figure 11 shows the use of a median filter featuring various kernel sizes. The optimal kernel size is five, as it eliminates minor segmentation defects without capturing data falling outside the segment of interest.
However, even after the median filter is applied, there are still segmentation errors in the image that can prevent the segment from being properly cut out. This is due to the fact that corner coordinates are used in this procedure, which makes the segment much larger and results in the capture of unnecessary information.
Based on the above facts and the results presented in Table 1, it can be concluded that YOLOv4-tiny is the most advantageous architecture.
However, for the correct processing of data in the segments found, it is necessary to programmatically expand the areas obtained using the neural network. So, the Description area was increased to the width of the input image, which improved the accuracy. Additionally, since the Description area on the price tags under consideration is not surrounded by unnecessary information, this extension will not affect the subsequent character recognition in any way. Owing to this extension, the accuracy of YOLOv4-tiny can be considered close to 100%, and therefore the accuracy of the entire development will be equal to the accuracy of character recognition.
During research, a pre-trained EasyOCR model was used for the character recognition. In testing, we were able to achieve high accuracy for each of the segments. The model results are given in Figure 12.
To calculate the EasyOCR accuracy, the following metrics were used: MAPE [27] for numeric segments (Equation (5)), the ratio of correctly recognized characters to the total number of characters in text segments (Equation (6)), and the ratio of recognized barcodes to the total number of barcodes (Equation (7)). The final accuracy of neural networks is calculated as the arithmetic mean between all the previously named metrics (Equation (8)).
A c c 1 4 = i = 1 4 100 ( A i F i A i · 100 ) N
A c c 5 = m 1 / n 1 N · 100
A c c 6 = m 2 N · 100
A c c = 100 · j = 1 6 A c c j
where A is the actual numerical value, F is the recognized numerical value, N is the sample size, m 1 is the number of correctly recognized characters, n 1 is the total number of characters, m 2 is the number of recognized barcodes, i is the designation of the numerical segment (1—Rub, 2—Kop, 3—Rub_card, 4—Kop_card) and j is the experiment number.
The resulting neural network accuracy is presented in Table 2.
For comparison, the CRNN architecture [28], when training on the ICDAR 2013 dataset, achieves an accuracy of 86.7% and an accuracy of 89.4% when training on the ICDAR 2003 dataset. In both cases, learning without a dictionary is considered. At the same time, the Tesseract architecture, when trained on the original dataset compiled by the authors of the article “Image Processing Based Scene-Text Detection and Recognition with Tesseract” [29], it achieves an accuracy of 83%. Since both presented studies use data presented in the form of text that contains both words and numbers, it can be concluded that when tested on the dataset collected in this article, their results will be close to the presented accuracy.
For convenience of working with the solution presented herein, a client–server application for Android was developed (see Figure 13). The server is implemented on the basis of the Django framework, which provides a wide range of options for configuring and operating the server.
The Android application was developed to enable users to use their mobile devices for price tag data analysis. The mobile device needs to have a camera to take images, as well as the capability of sending the images to the server to be analyzed.
The results of the client-server application are shown in Figure 13.

5. Discussion

In this article, a study was conducted to determine the optimal neural networks that will automate price tag data verification using mobile devices. The neural networks’ (UNet, MobileNetV2, VGG16, YOLOv4-tiny) segmentation results were compared, and the results of the recognition of text located on the selected segments by EasyOCR were studied. Comparison of YOLOv4-tiny with SSD and the faster R-CNN showed the following results: SSD had an F1 score 0.67 and the faster R-CNN had an F1 score 0.66 according to article of AN Veeranampalayam Sivakumar [30], while our realization of YOLOv4-Tiny had an F1 score of 0.61. However, various studies show that YOLOv4-tiny can outperform SSD [31,32] and the faster R-CNN [24,33]. Additionally, YOLOv4-tiny has a higher FPS, which leads to faster performance [24,33]. Due to the fact that YOLOv4-tiny is a modified version of YOLOv3, its accuracy increased [34], and YOLOv3 already outperformed SSD and faster R-CNN [35]. A mobile client–server application for price tag data verification was also developed based on the study’s results.
The study identified an optimal neural network for the segmentation of price tag images, namely YOLOv4-tiny, featuring an accuracy of 96.92%. This model is superior to UNet in terms of accuracy by 4.7%, with Unet being ranked second in terms of its performance. However, since we applied the extension of the Description domain by software, the final accuracy of YOLOv4-tiny is considered to be close to 100%.
The final accuracy of this model is 95.22%, which exceeds the accuracy of other models by 20–22% [36]. At the same time, the model we used enables recognizing and subsequently analyzing text in 80 languages [37].
In the course of our research, we faced the problem of a small dataset caused by “manual” assembly of said dataset. However, we are currently working on a solution to this problem. It can be expanded by saving the images received by the server and the coordinates of the received segments if they are successfully found. In the future, this will enable additional training of neural networks and improvement in recognition accuracy. Additionally, we expect to study the binarization of the obtained segments, which can improve the text recognition accuracy.
Further work will aim to add the necessary functionalities for data comparison, i.e., interfacing with databases. Additionally, we expect to configure and use GPUs for computations performed by neural networks, thus significantly reducing the processing time of requests by the server.
Additionally, we are considering the possibility of transferring neural network computations to mobile devices to reduce the entire system cost of ownership.
As part of further evolution of our implementation, we plan to test it by integrating it into already existing product management software. This will enable the collection of field operation statistics as well as feedback from immediate users. Any shortcomings identified and the introduction of new functionalities will be managed based on the immediate user feedback.

6. Conclusions

The study identified that optimal neural network for tag analysis using segmentation is YOLOv4-tiny. The future plans for the project are dataset expansion, new functionality for working with databases, and transferring computations on mobile devices.

Author Contributions

Conceptualization, A.S.; methodology, E.K. and A.K.; software, P.L., S.L. and S.D.; validation, P.L. and E.K.; formal analysis, E.K.; investigation, S.D.; resources, S.L. and S.D.; data curation, P.L. and E.K.; writing—original draft preparation, P.L., S.L. and S.D.; writing—review and editing, P.L. and E.K.; visualization, S.L. and S.D.; supervision, A.K.; project administration, A.S.; funding acquisition, A.S. All authors have read and agreed to the published version of the manuscript.

Funding

This research was funded by the Ministry of Science and Higher Education of Russia, Government Order for 2020–2022, project No. FEWM-2020-0037 (TUSUR).

Institutional Review Board Statement

Not applicable.

Informed Consent Statement

Not applicable.

Data Availability Statement

The datasets generated from this study are available upon reasonable request.

Acknowledgments

The authors thank Kirill Plotnikov for translation and proofreading assistance.

Conflicts of Interest

The authors declare no conflict of interest.

References

  1. The consumer act of the Philippines. Available online: https://www.officialgazette.gov.ph/1992/04/13/republic-act-no-7394-s-1992/ (accessed on 11 March 2022).
  2. Administration Code of the Russian Federation. Available online: http://pravo.gov.ru/proxy/ips/?docbody&nd=102074277 (accessed on 11 March 2022).
  3. Consumer Rights Protection Law of the People’s Republic of China. Available online: http://www.npc.gov.cn/zgrdw/englishnpc/Law/2007-12/12/content_1383812.htm (accessed on 11 March 2022).
  4. Hassanat, A.B. Two-point-based binary search trees for accelerating big data classification using KNN. PLoS ONE 2018, 13, e0207772. [Google Scholar] [CrossRef] [Green Version]
  5. Mnasri, S.; Nasri, N.; van den Bossche, A.; Thierry, V.A.L. 3D indoor redeployment in IoT collection networks: A real prototyping using a hybrid PI-NSGA-III-VF. In Proceedings of the 2018 14th International Wireless Communications & Mobile Computing Conference (IWCMC), Limassol, Cyprus, 25–29 June 2018; pp. 780–785. [Google Scholar]
  6. Rakhmanenko, I.A.; Shelupanov, A.A.; Kostyuchenko, E.Y. Automatic text-independent speaker verification using convolutional deep belief network. Comput. Opt. 2020, 44, 596–605. [Google Scholar] [CrossRef]
  7. Kostyuchenko, E.; Novokhrestova, D.; Pekarskikh, S.; Shelupanov, A.; Nemirovich-Danchenko, M.; Choynzonov, E.; Balatskaya, L. Assessment of Syllable Intelligibility Based on Convolutional Neural Networks for Speech Rehabilitation after Speech Organs Surgical Interventions. In Proceedings of the International Conference on Speech and Computer, Istanbul, Turkey, 20–25 August 2019; Springer: Cham, Switzerland, 2019; pp. 359–369. [Google Scholar]
  8. Kurtukova, A.; Romanov, A.; Shelupanov, A. Source Code Authorship Identification Using Deep Neural Networks. Symmetry 2020, 12, 2044. [Google Scholar] [CrossRef]
  9. Haurum, J.B.; Bahnsen, C.H.; Pedersen, M.; Moeslund, T.B. Water level estimation in sewer pipes using deep convolutional neural networks. Water 2020, 12, 3412. [Google Scholar] [CrossRef]
  10. Kweik, O.M.A.; Hamid, M.A.A.; Sheqlieh, S.O.; Abu-Nasser, B.S.; Abu-Naser, S.S. Artificial Neural Network for Lung Cancer Detection. Int. J. Acad. Eng. Res. 2020, 4, 1–7. [Google Scholar]
  11. Harz, H.H.; Rafi, A.O.; Hijazi, M.O.; Abu-Naser, S.S. Artificial Neural Network for Predicting Diabetes Using JNN. Int. J. Acad. Eng. Res. 2020, 4, 14–22. [Google Scholar]
  12. Hussin, M.N.A.; Ahmad, A.H.; Razak, M.A. Price tag recognition using hsv color space. J. Telecommun. Electron. Comput. Eng. JTEC 2017, 9, 77–84. [Google Scholar]
  13. Kovtunenko, A.; Yakovleva, O.; Liubchenko, V.; Yanholenko, O. Research of the joint use of mathematical morphology and convolutional neural networks for the solution of the price tag recognition problem. Bull. Natl. Tech. Univ. KhPI Ser. Syst. Anal. Control Inf. Technol. 2020, 1, 24–31. [Google Scholar] [CrossRef]
  14. Mou, Y.-Q.; Fan, B.-J.; Sun, C.; Yan, R.; Guo, Y.-S. Towards accurate price tag recognition algorithm with multi-task RNN. Acta Autom. Sin. 2020, 48, 608–614. [Google Scholar]
  15. Klippa Price Tag Scanning, OCR & Data Capturing. Available online: https://www.klippa.com/en/ocr/financial-documents/price-tags/ (accessed on 20 December 2021).
  16. Neti Price Tag Recognition: A Smartphone Instead of a PDT. Available online: https://ml.i-neti.com/portfolio-item/raspoznavanie-tsennikov-zamenite-tsd-na-smartfon/ (accessed on 20 December 2021).
  17. Weng, Y.; Zhou, T.; Li, Y.; Qiu, X. Nas-unet: Neural architecture search for medical image segmentation. IEEE Access 2019, 7, 44247–44257. [Google Scholar] [CrossRef]
  18. Pravitasari, A.A.; Iriawan, N.; Almuhayar, M.; Azmi, T.; Fithriasari, K.; Purnami, S.W.; Ferriastuti, W. UNet-VGG16 with transfer learning for MRI-based brain tumor segmentation. Telkomnika 2020, 18, 1310–1318. [Google Scholar] [CrossRef]
  19. Seidaliyeva, U.; Akhmetov, D.; Ilipbayeva, L.; Matson, E.T. Real-Time and accurate drone detection in a video with a static background. Sensors 2020, 20, 3856. [Google Scholar] [CrossRef] [PubMed]
  20. Sandler, M.; Howard, A.; Zhu, M.; Zhmoginov, A.; Chen, L.C. Mobilenetv2: Inverted residuals and linear bottlenecks. In Proceedings of the IEEE Conference on Computer Vision and Pattern Recognition, Salt Lake City, UT, USA, 18–23 June 2018; pp. 4510–4520. [Google Scholar]
  21. Simonyan, K.; Zisserman, A. Very deep convolutional networks for large-scale image recognition. arXiv 2014, arXiv:1409.1556. [Google Scholar]
  22. Ferguson, M.; Ak, R.; Lee, Y.T.T.; Law, K.H. Automatic localization of casting defects with convolutional neural networks. In Proceedings of the 2017 IEEE International Conference on Big Data, Boston, MA, USA, 11–14 December 2017; pp. 1726–1735. [Google Scholar]
  23. Abdurahman, F.; Fante, K.A.; Aliy, M. Malaria parasite detection in thick blood smear microscopic images using modified YOLOV3 and YOLOV4 models. BMC Bioinform. 2021, 22, 112. [Google Scholar] [CrossRef]
  24. Bochkovskiy, A.; Wang, C.Y.; Liao, H.Y.M. Yolov4: Optimal speed and accuracy of object detection. arXiv 2020, arXiv:2004.10934. [Google Scholar]
  25. Wang, C.Y.; Bochkovskiy, A.; Liao, H.Y.M. Scaled-yolov4: Scaling cross stage partial network. In Proceedings of the IEEE/CVF Conference on Computer Vision and Pattern Recognition, Nashville, TN, USA, 20–25 June 2021; pp. 13029–13038. [Google Scholar]
  26. Pyzbar. Available online: https://github.com/NaturalHistoryMuseum/pyzbar (accessed on 20 December 2021).
  27. De Myttenaere, A.; Golden, B.; Le Grand, B.; Rossi, F. Mean absolute percentage error for regression models. Neurocomputing 2016, 192, 38–48. [Google Scholar] [CrossRef] [Green Version]
  28. Chen, Y.; Yang, J. Research on Scene Text Recognition Algorithm Basedon Improved CRNN. In Proceedings of the 2020 4th International Conference on Digital Signal Processing, Chengdu, China, 19–21 June 2020; pp. 107–111. [Google Scholar]
  29. Zacharias, E.; Teuchler, M.; Bernier, B. Image Processing Based Scene-Text Detection and Recognition with Tesseract. arXiv 2020, arXiv:2004.08079. [Google Scholar]
  30. Veeranampalayam Sivakumar, A.N.; Li, J.; Scott, S.; Psota, E.; JJhala, A.; Luck, J.D.; Shi, Y. Comparison of object detection and patch-based classification deep learning models on mid-to late-season weed detection in UAV imagery. Remote Sens. 2020, 12, 2136. [Google Scholar] [CrossRef]
  31. Magalhães, S.A.; Castro, L.; Moreira, G.; Dos Santos, F.N.; Cunha, M.; Dias, J.; Moreira, A.P. Evaluating the single-shot multibox detector and YOLO deep learning models for the detection of tomatoes in a greenhouse. Sensors 2021, 21, 3569. [Google Scholar] [CrossRef]
  32. da Silva, D.Q.; Dos Santos, F.N.; Sousa, A.J.; Filipe, V. Visible and Thermal Image-Based Trunk Detection with Deep Learning for Forestry Mobile Robotics. J. Imaging 2021, 7, 176. [Google Scholar] [CrossRef]
  33. Guo, C.; Lv, X.L.; Zhang, Y.; Zhang, M.L. Improved YOLOv4-tiny network for real-time electronic component detection. Sci. Rep. 2021, 11, 22744. [Google Scholar] [CrossRef]
  34. Ayoub, N.; Schneider-Kamp, P. Real-time on-board deep learning fault detection for autonomous uav inspections. Electronics 2021, 10, 1091. [Google Scholar] [CrossRef]
  35. Tan, L.; Huangfu, T.; Wu, L.; Chen, W. Comparison of YOLO v3, Faster R-CNN, and SSD for Real-Time Pill Identification. BMC Med. Inform. Decis. Mak. 2021, 21, 324. [Google Scholar] [CrossRef] [PubMed]
  36. Ramil Brick, E.; Caballero Alonso, V.; O’Brien, C.; Tong, S.; Tavernier, E.; Parekh, A.; Addlesee, A.; Lemon, O. Am I Allergic to This? Assisting Sight Impaired People in the Kitchen. In Proceedings of the 2021 International Conference on Multimodal Interaction, New York, NY, USA, 18–22 October 2021; pp. 92–102. [Google Scholar]
  37. EasyOCR. Available online: https://www.jaided.ai/easyocr/ (accessed on 20 December 2021).
Figure 1. Example of labeling.
Futureinternet 14 00088 g001
Figure 2. Walmart price tag labeling example.
Futureinternet 14 00088 g002
Figure 3. An example of the layout of the description segment.
Futureinternet 14 00088 g003
Figure 4. Unet architecture.
Futureinternet 14 00088 g004
Figure 5. MobileNetV2 architecture.
Futureinternet 14 00088 g005
Figure 6. VGG16 architecture.
Futureinternet 14 00088 g006
Figure 7. YOLOv4-tiny architecture.
Futureinternet 14 00088 g007
Figure 8. EasyOCR architecture.
Futureinternet 14 00088 g008
Figure 9. Change in the loss-function: (a) UNet, MobileNetV2, VGG16; (b) YOLOv4-tiny.
Futureinternet 14 00088 g009
Figure 10. Results of trained networks: (a) UNet; (b) MobileNetV2; (c) VGG16; (d) YOLOv4-tiny.
Futureinternet 14 00088 g010aFutureinternet 14 00088 g010b
Figure 11. (a) Median filter with core = 1; (b) median filter with core = 3; (c) median filter with core = 5.
Futureinternet 14 00088 g011
Figure 12. (a) Description segment recognition; (b) Rub segment recognition; (c) Kop segment recognition; (d) Barcode decoding using pyzbar library.
Futureinternet 14 00088 g012
Figure 13. Client–server application results.
Futureinternet 14 00088 g013
Table 1. Neural network learning results.
DatasetUNetMobileNetV2VGG16YOLOv4-Tiny
Cross validation accuracyTrain90.64%82.79%89.16%98.24%
Validation92.12%78.56%83.72%96.92%
F1 scoreTrain0.360.340.650.62
Validation0.380.320.580.61
Time per epochFull dataset16.74 s8.97 s11.95 s2.74 s
Table 2. Accuracy within a sample of 80 results.
DescriptionRubKopRub_CardKop_CardBarcodeTotal Accuracy
Accuracy93.34%100%90%100%100%88%95.22%
Publisher’s Note: MDPI stays neutral with regard to jurisdictional claims in published maps and institutional affiliations.

