
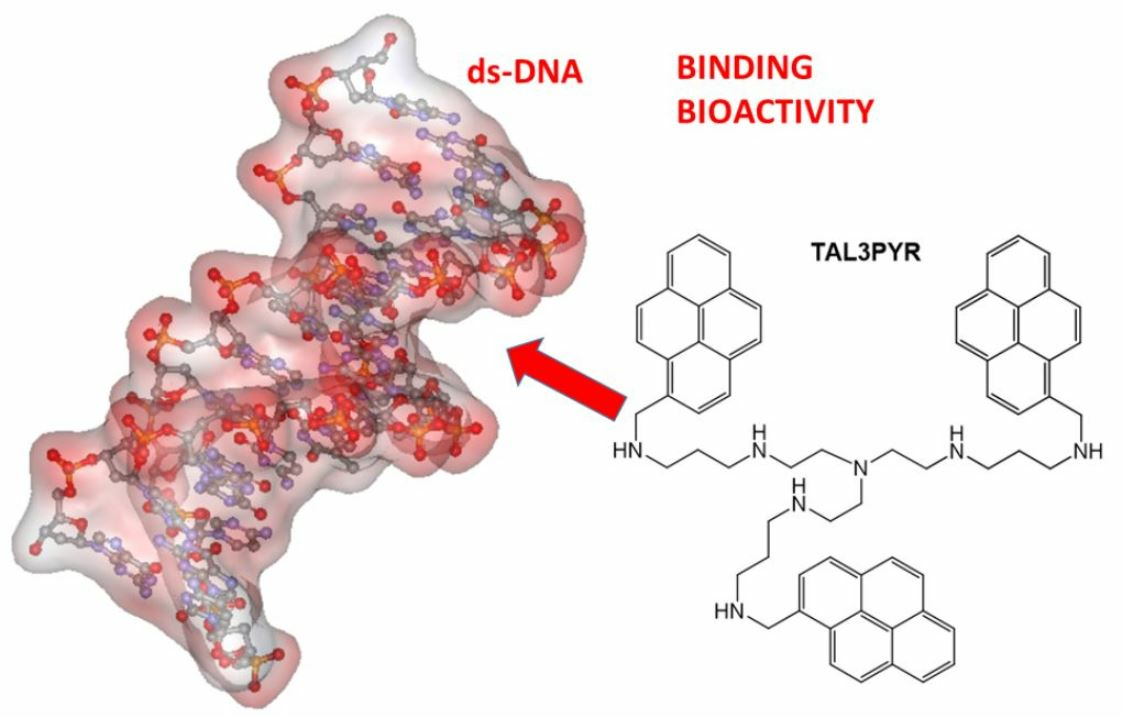
Novel Tripodal Polyamine Tris-Pyrene: DNA/RNA Binding and Photodynamic Antiproliferative Activity
 , ,
, ,  ,
,  , , , ,
Abstract
:
1. Introduction
2. Materials and Methods
2.1. General Synthesis
2.2. Materials and Methods, Spectroscopy, DNA/RNA Interactions
2.3. Biology
2.3.1. Cells
2.3.2. Cell Viability Assay
2.3.3. Live Cell Imaging by Confocal Microscopy
2.3.4. Detection of Total ROS
2.3.5. Plasmid Electrophoresis
2.3.6. Cell Cycle Analysis
2.3.7. Antiviral Activity of TAL3PYR
2.3.8. Statistical Analysis
3. Results
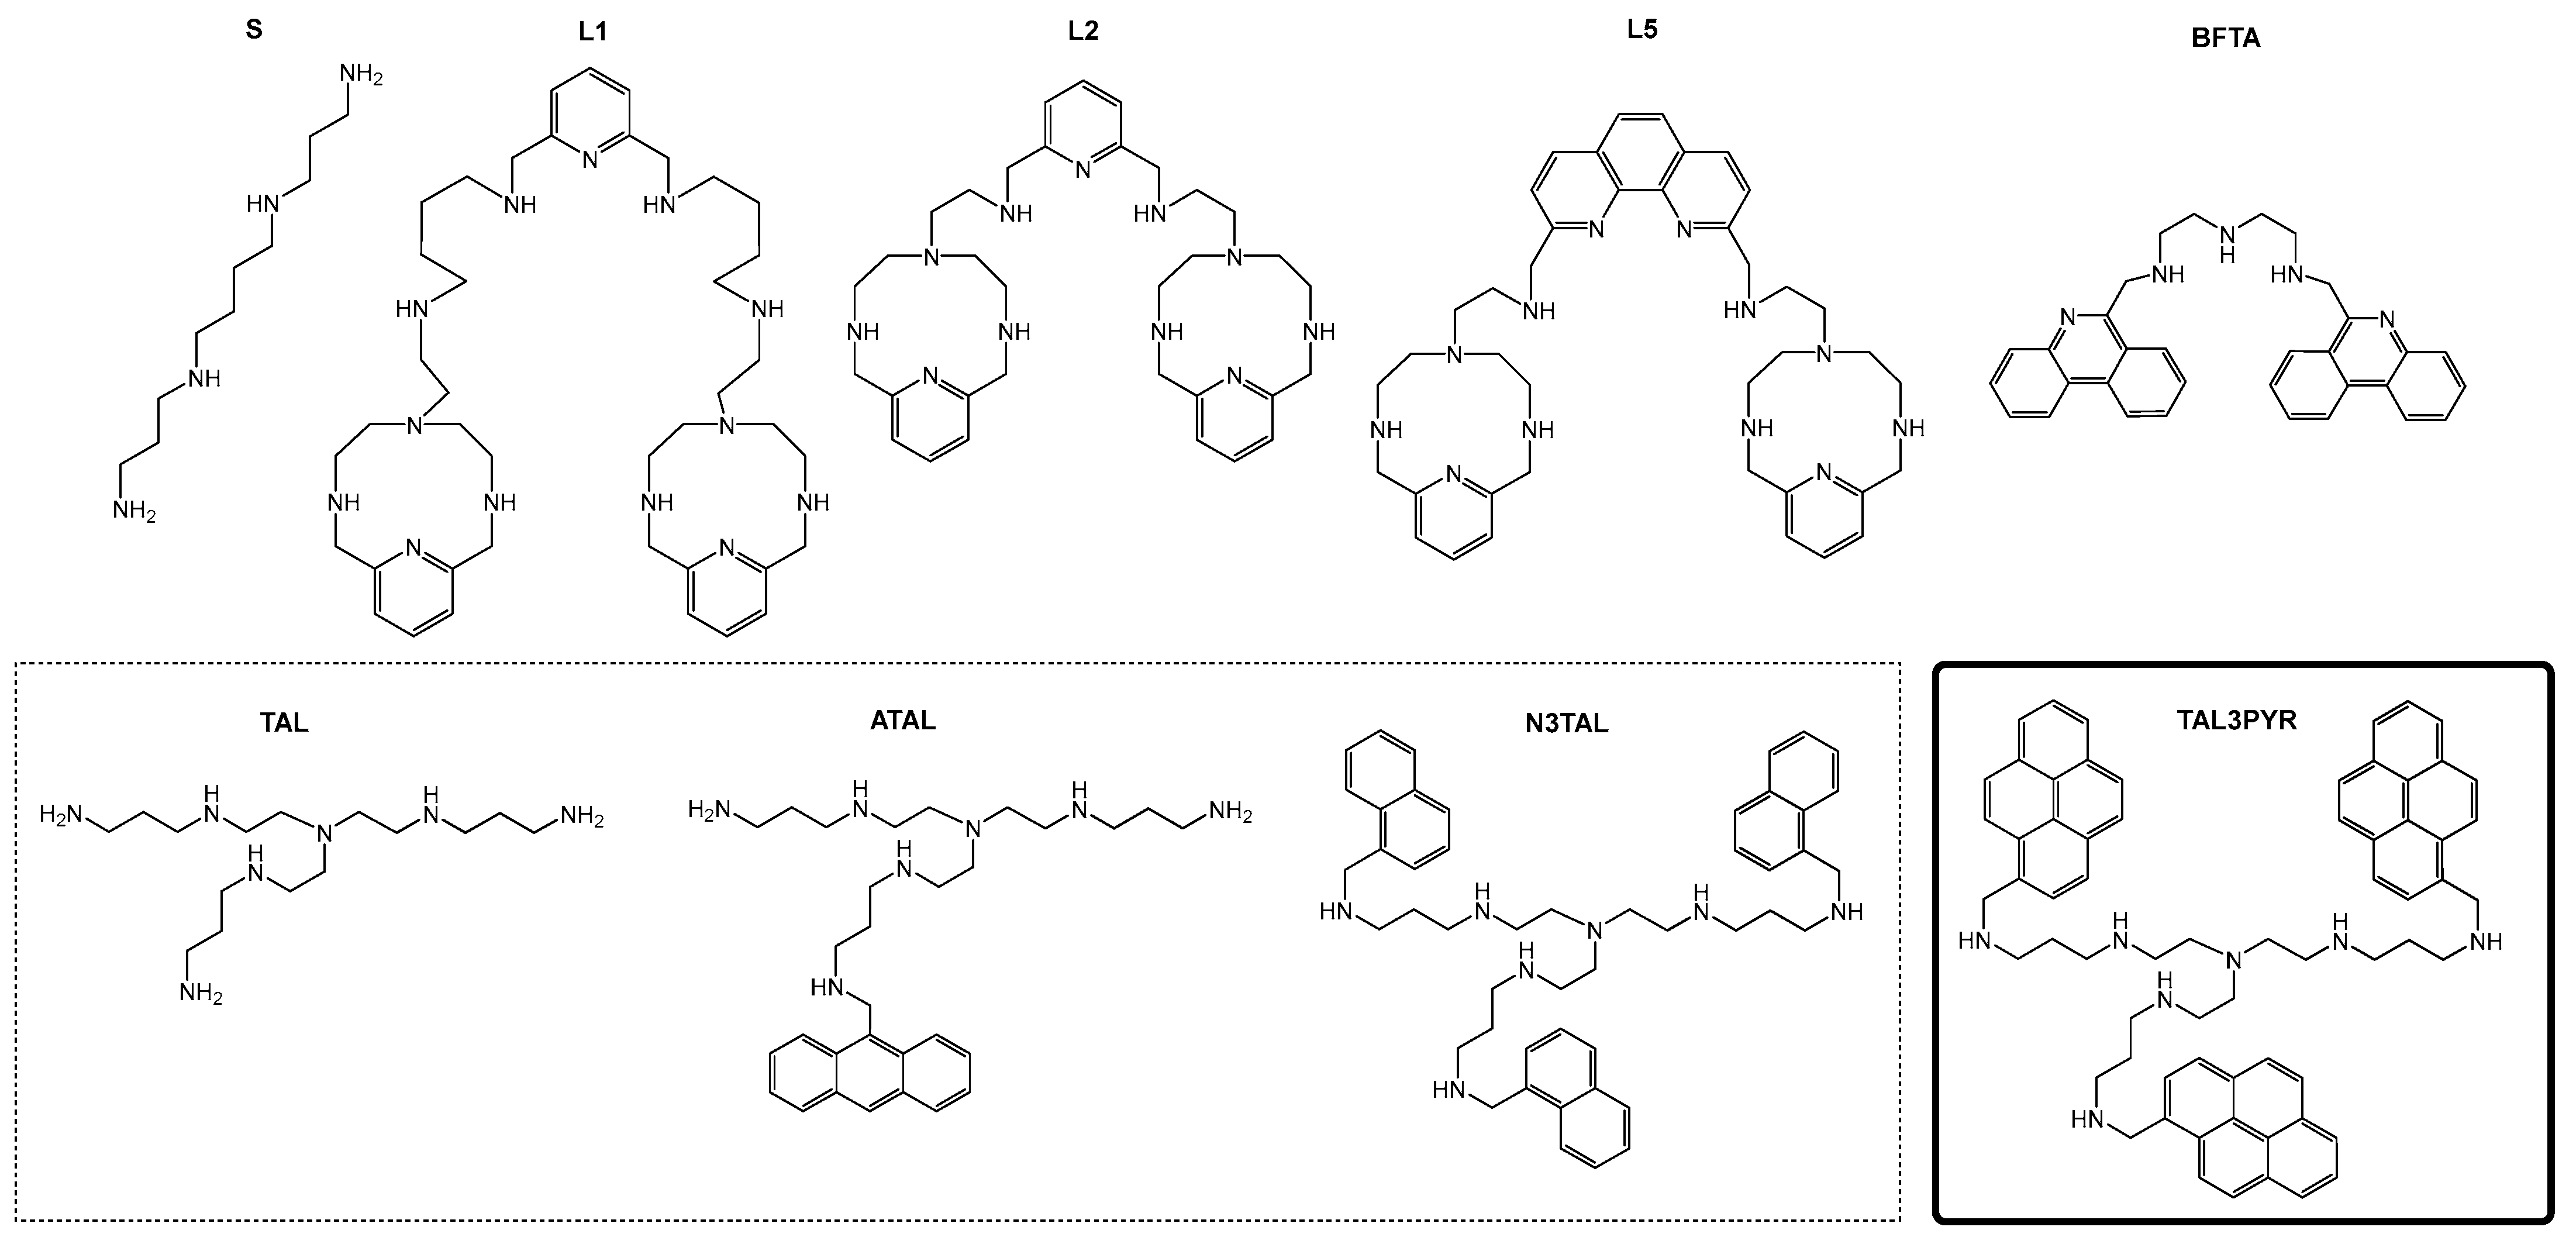
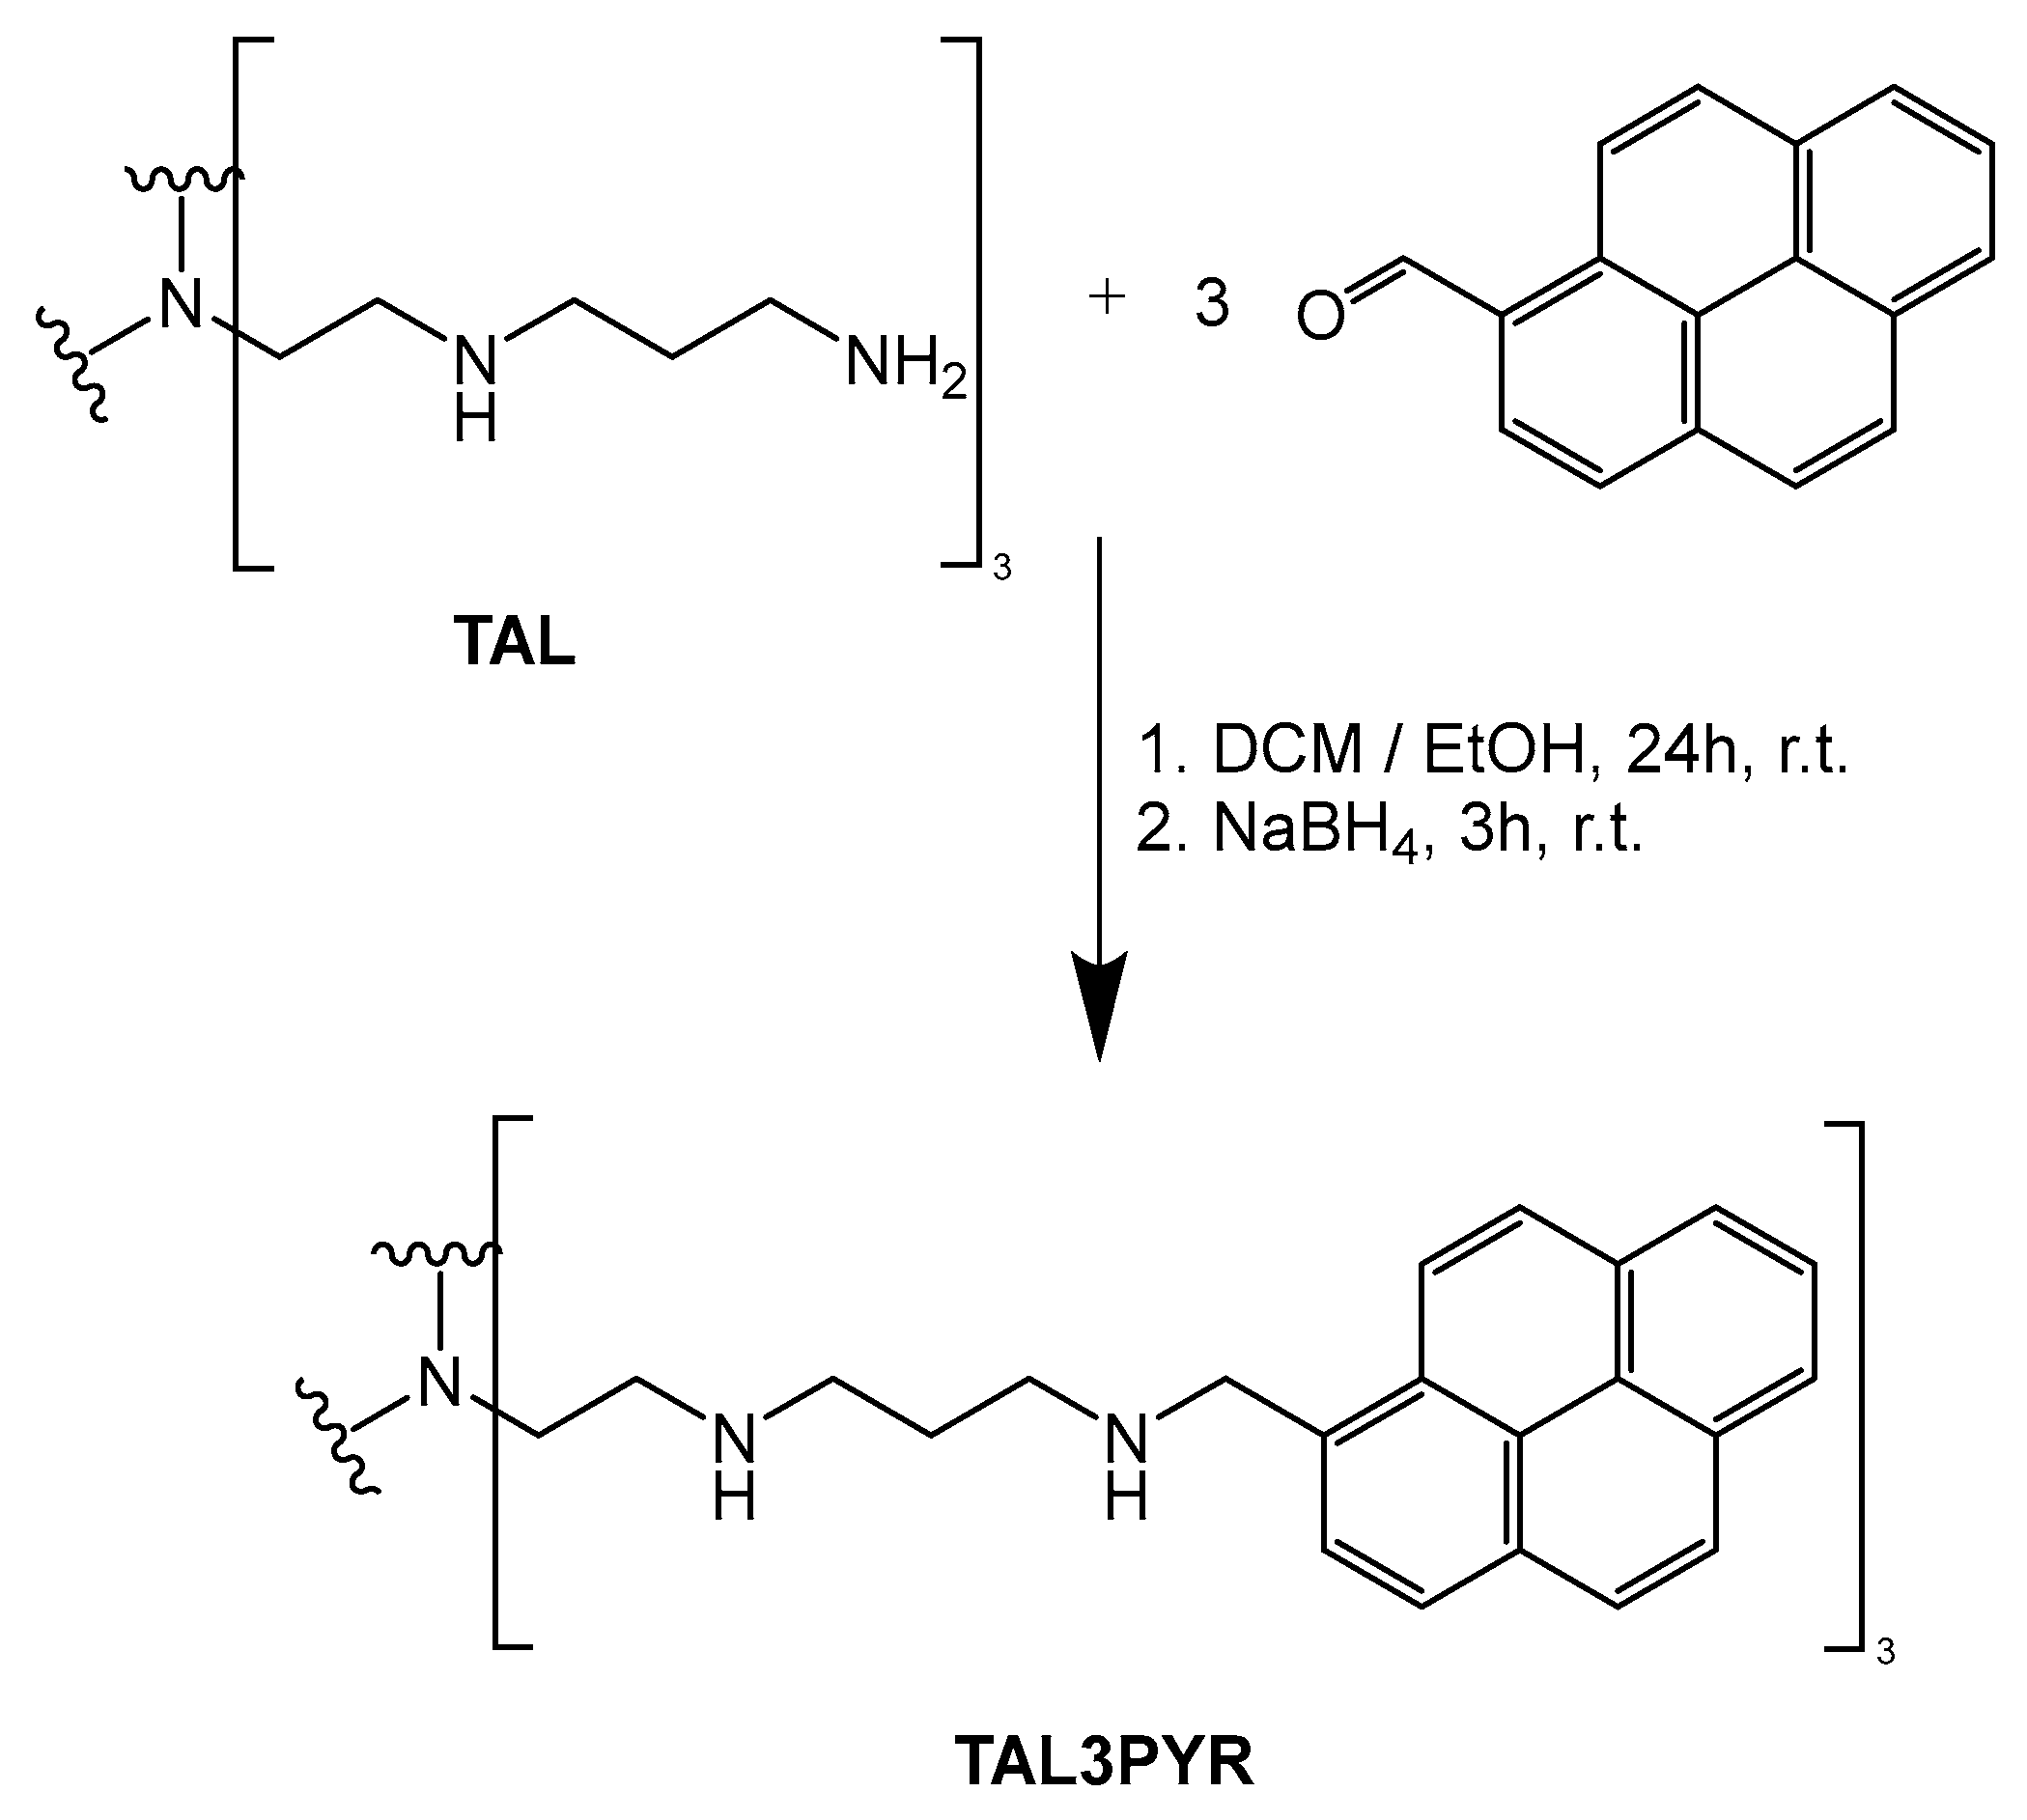
3.1. Synthesis
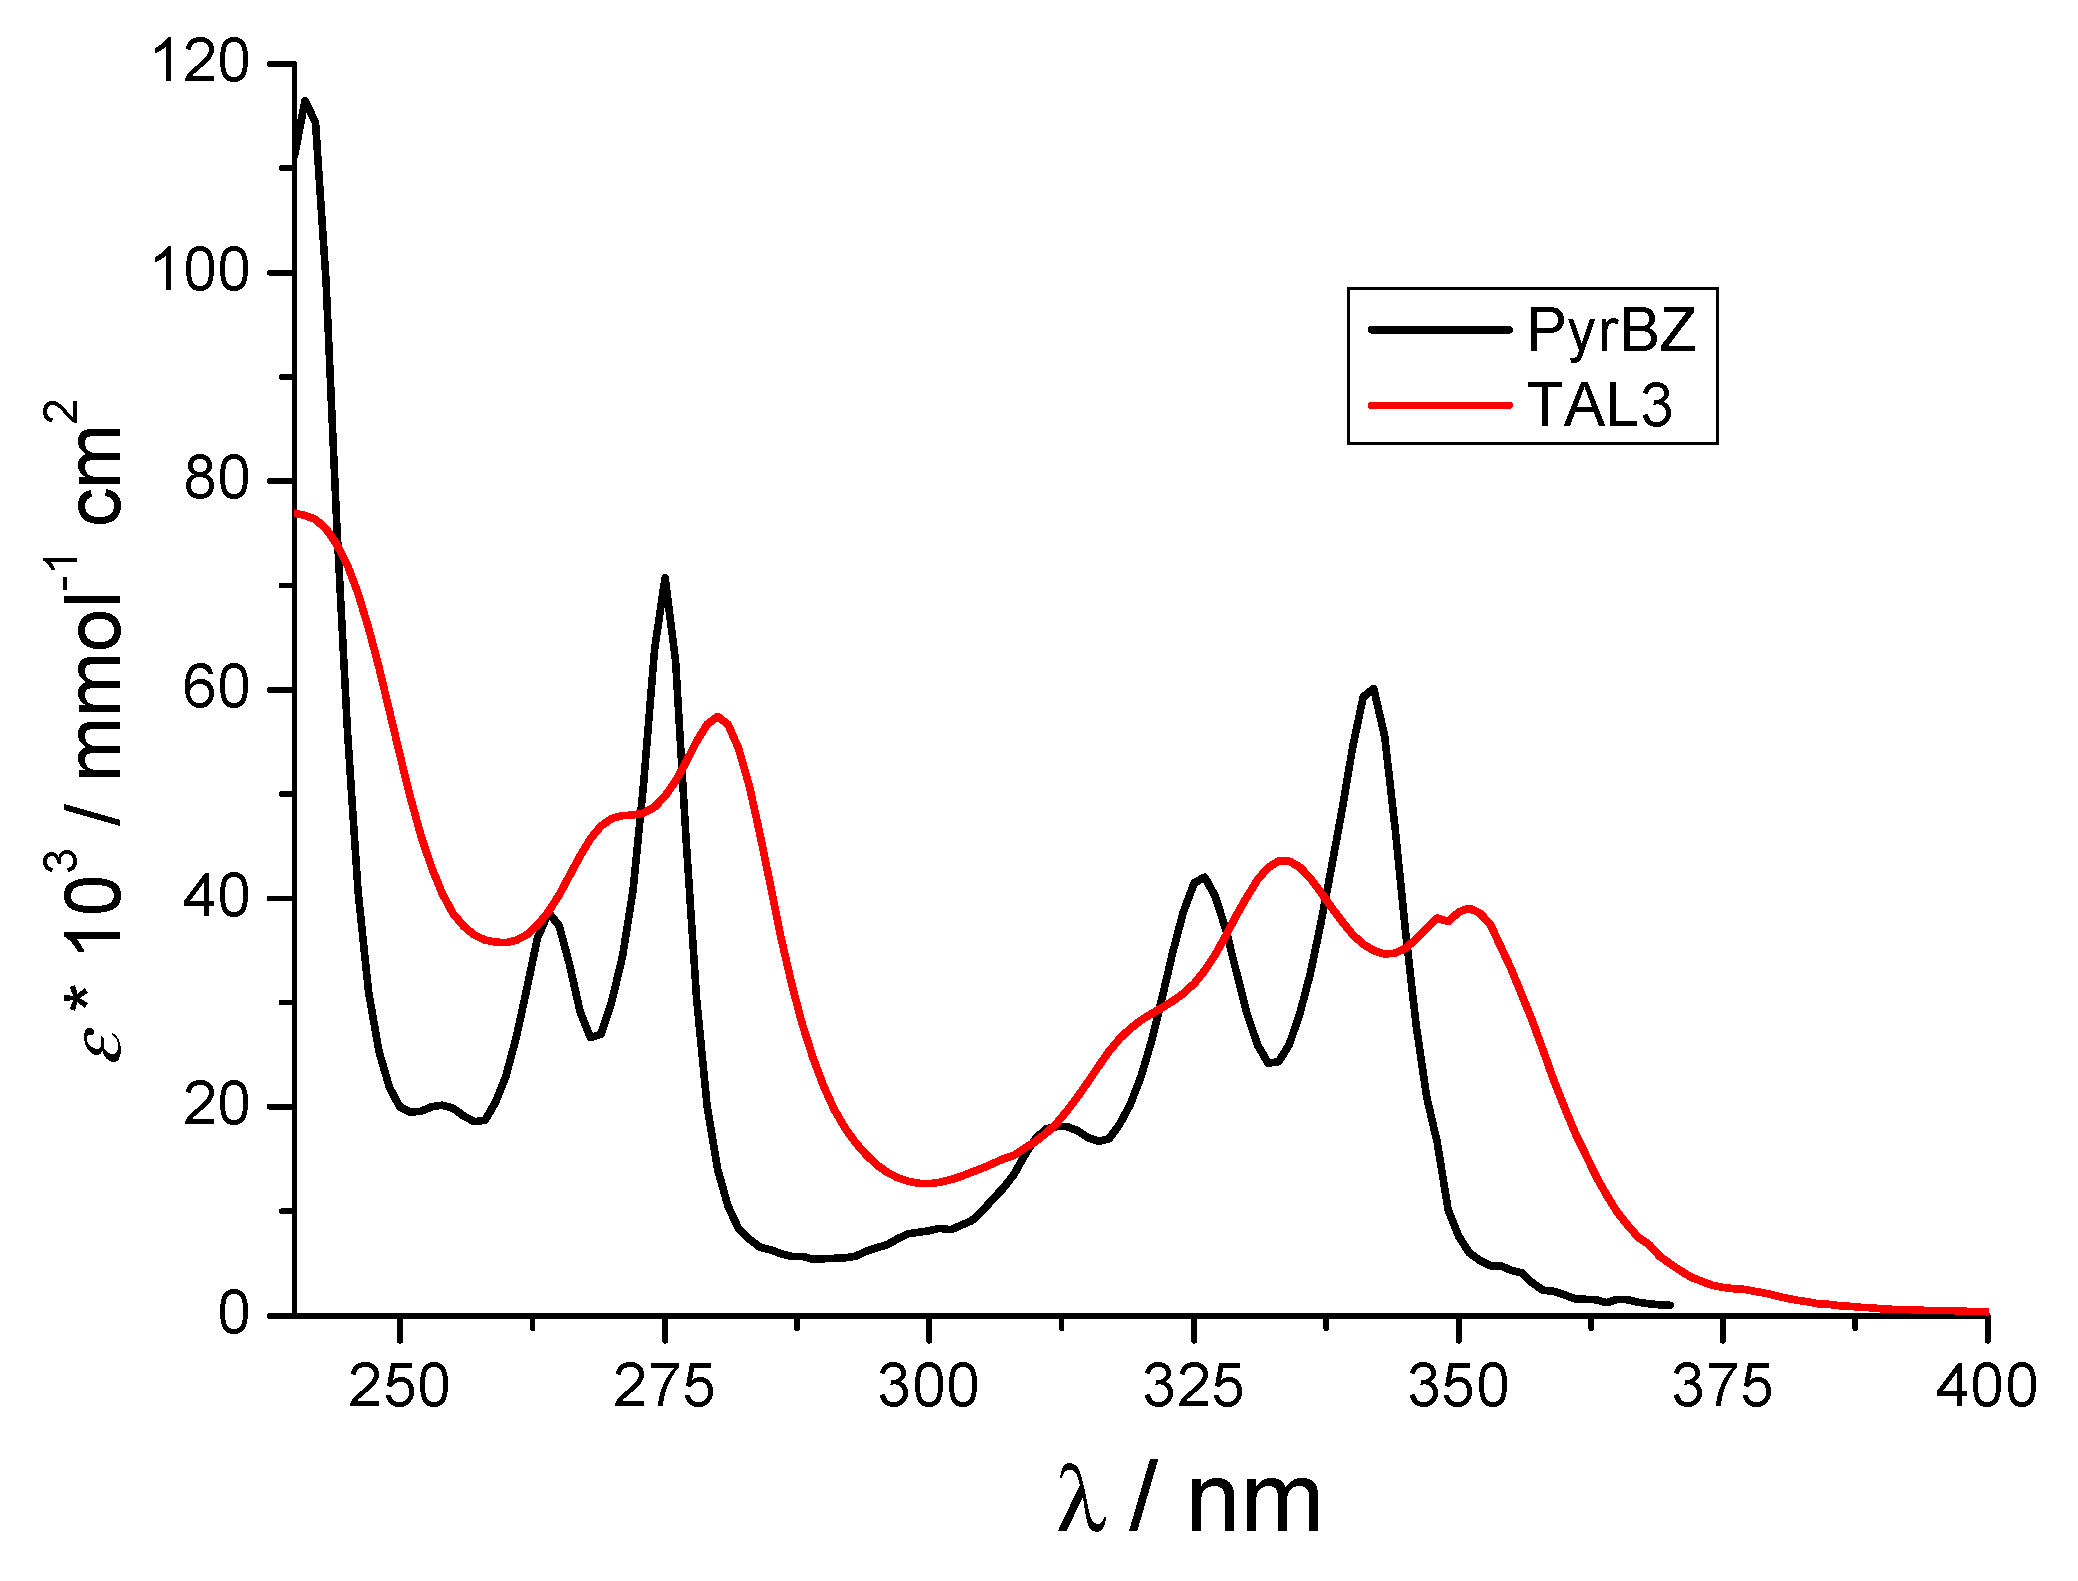
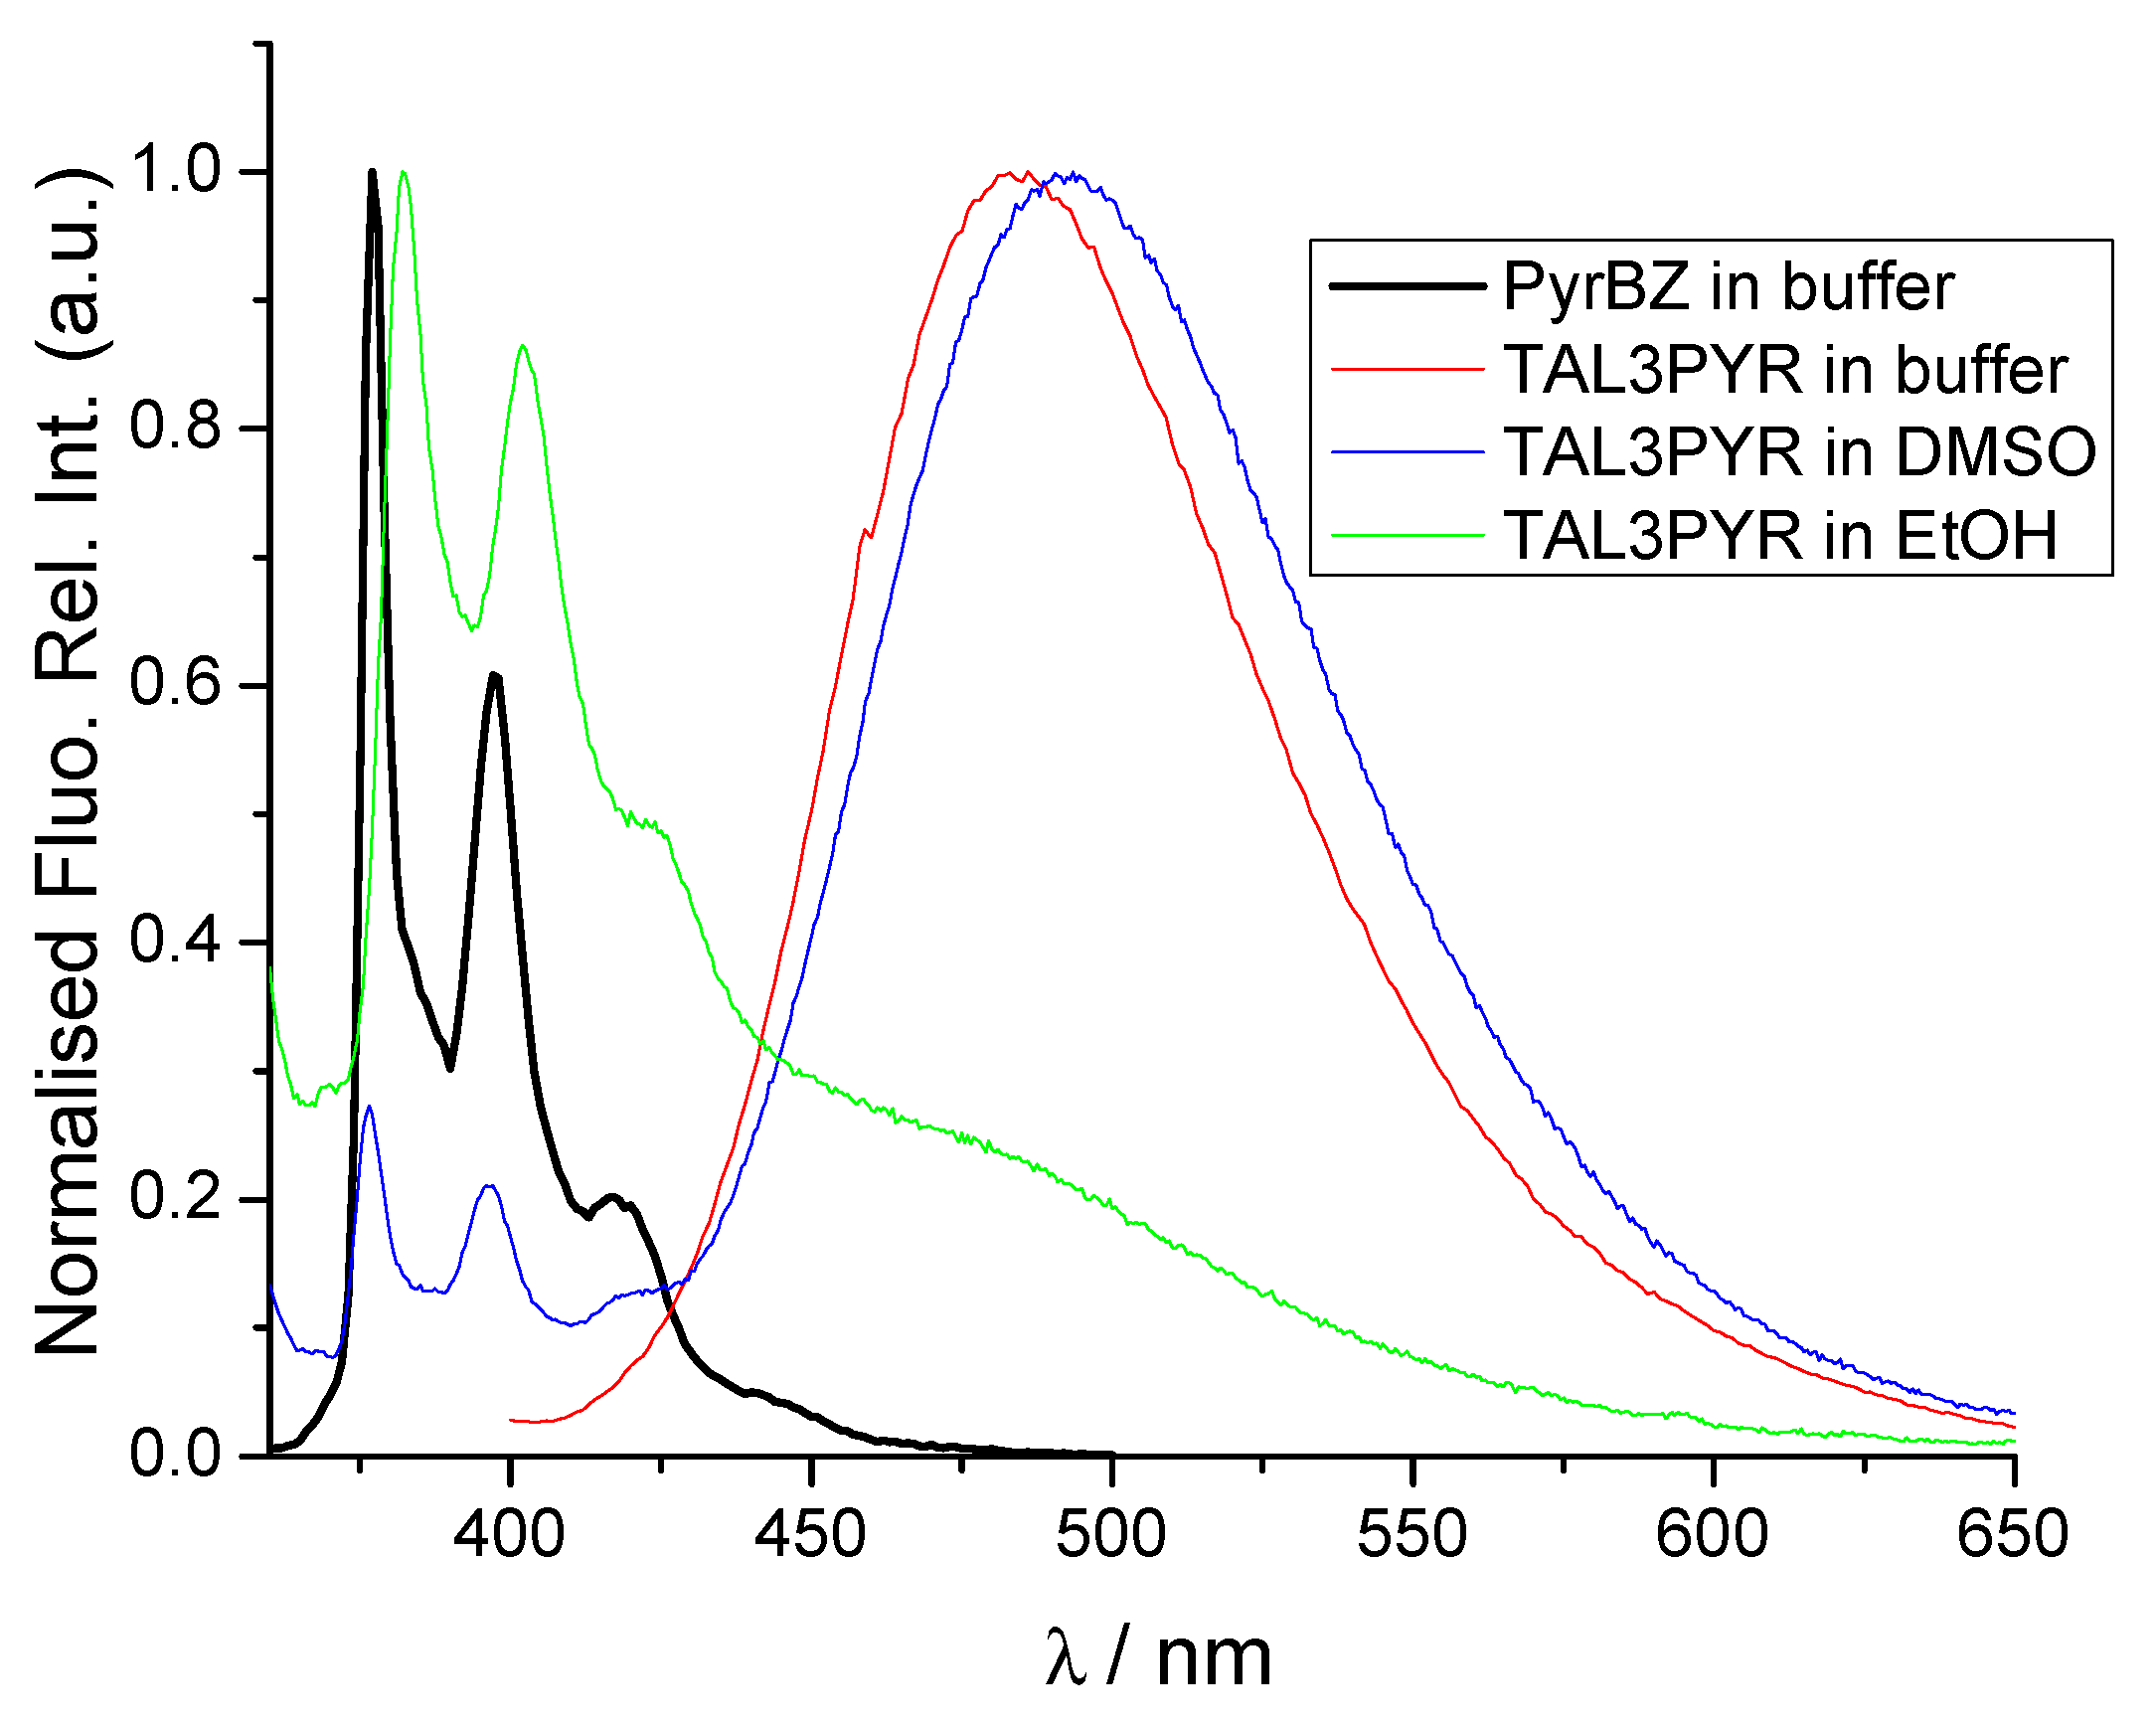
3.2. Physico-Chemical Properties of TAL3PYR in Aqueous Solutions at pH = 7.0
3.3. Study of Interactions of TAL3PYR with ds-DNA and ds-RNA
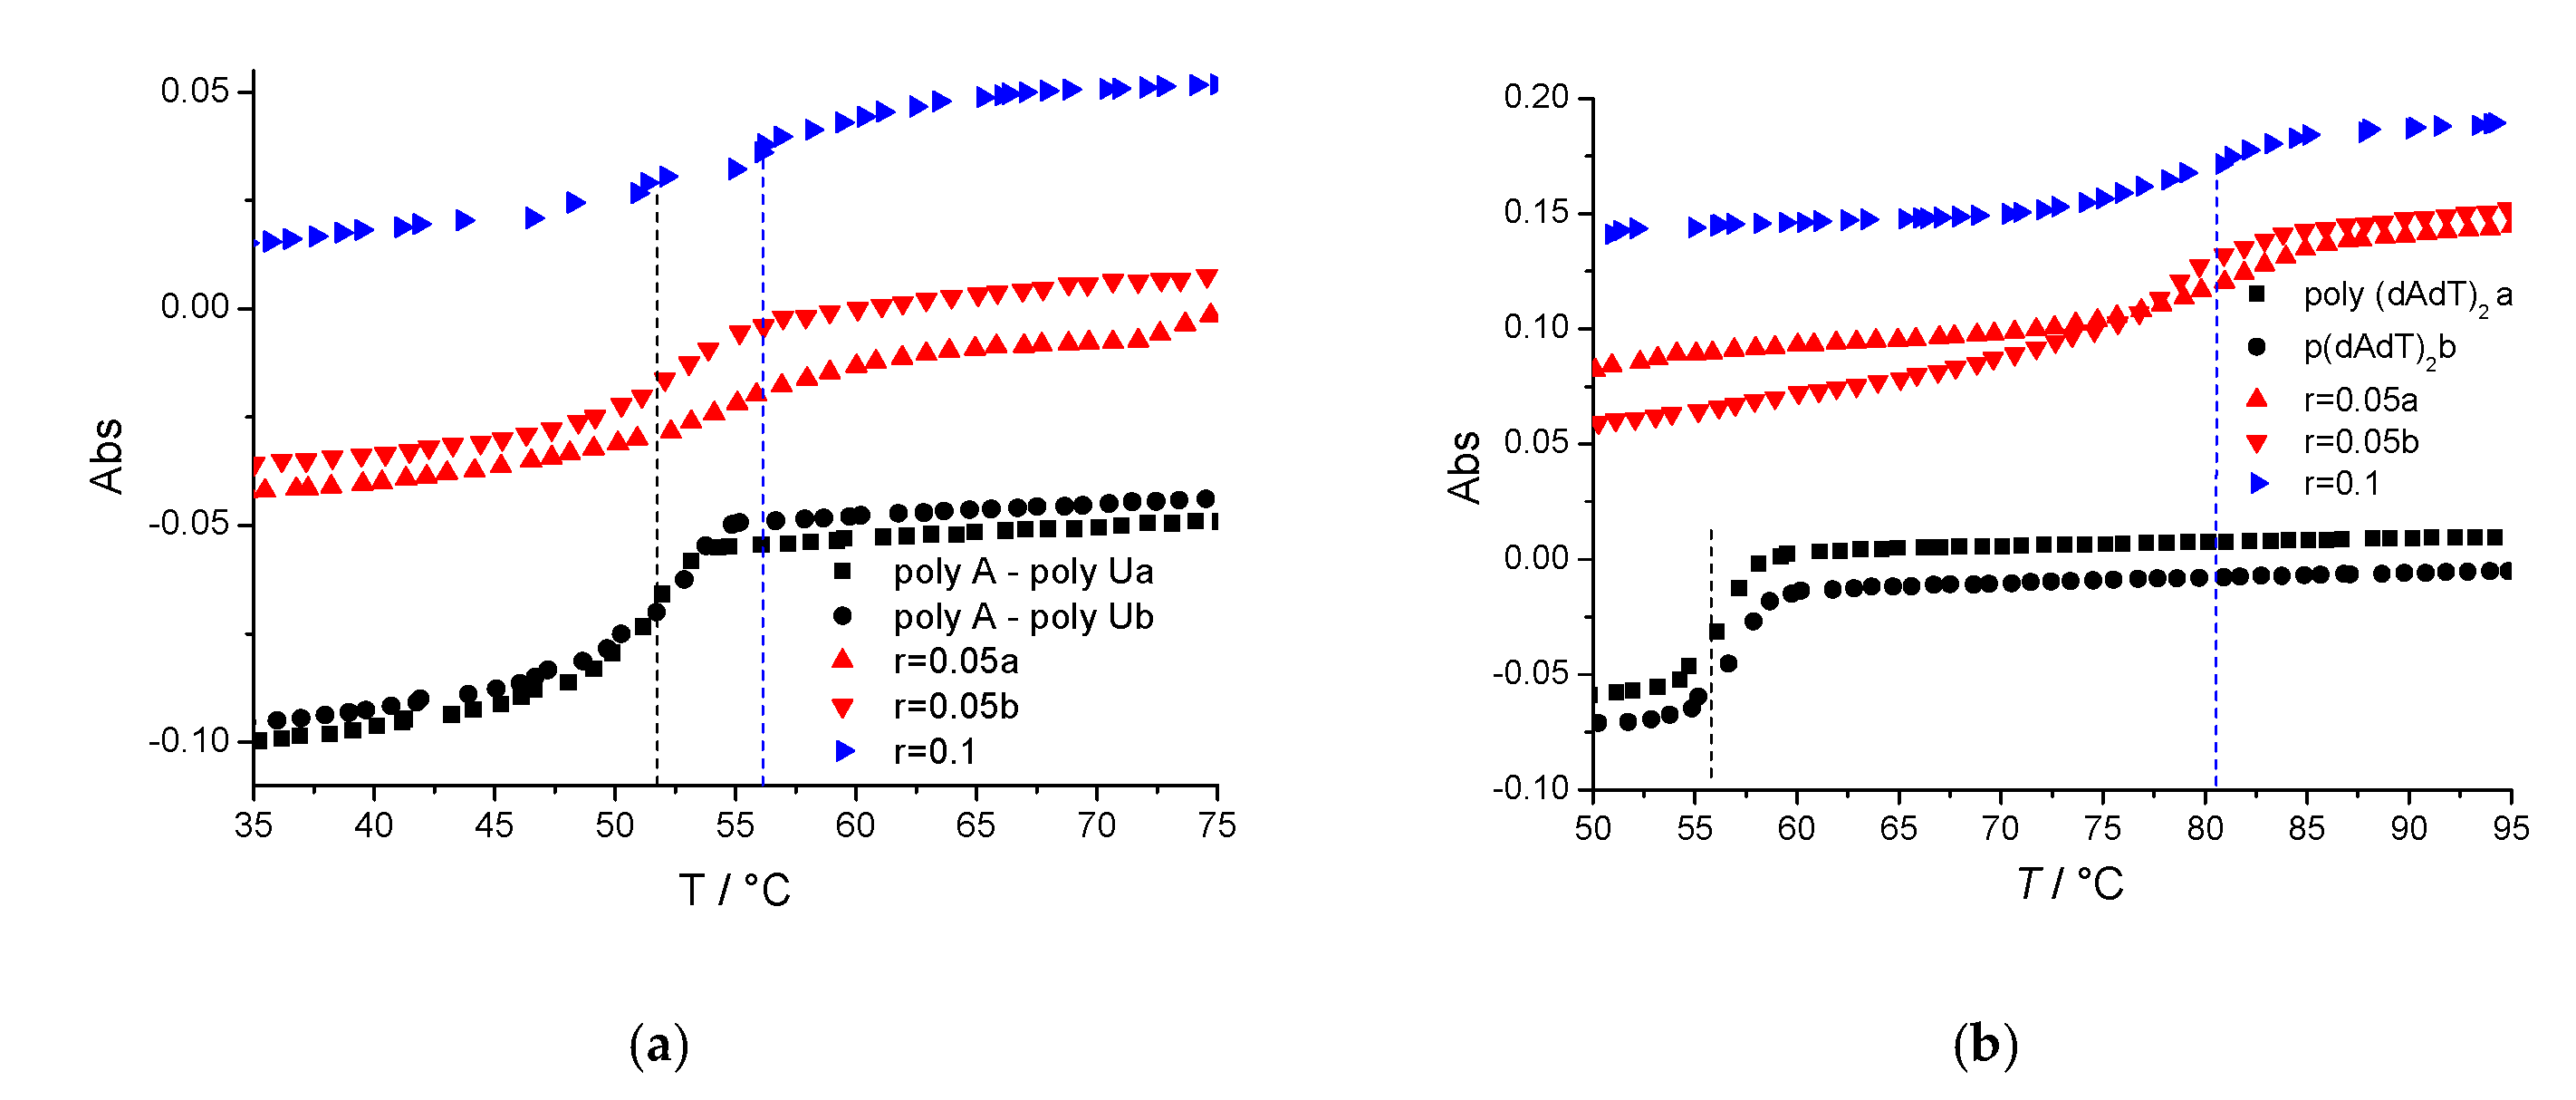
3.3.1. Thermal Denaturation Experiments
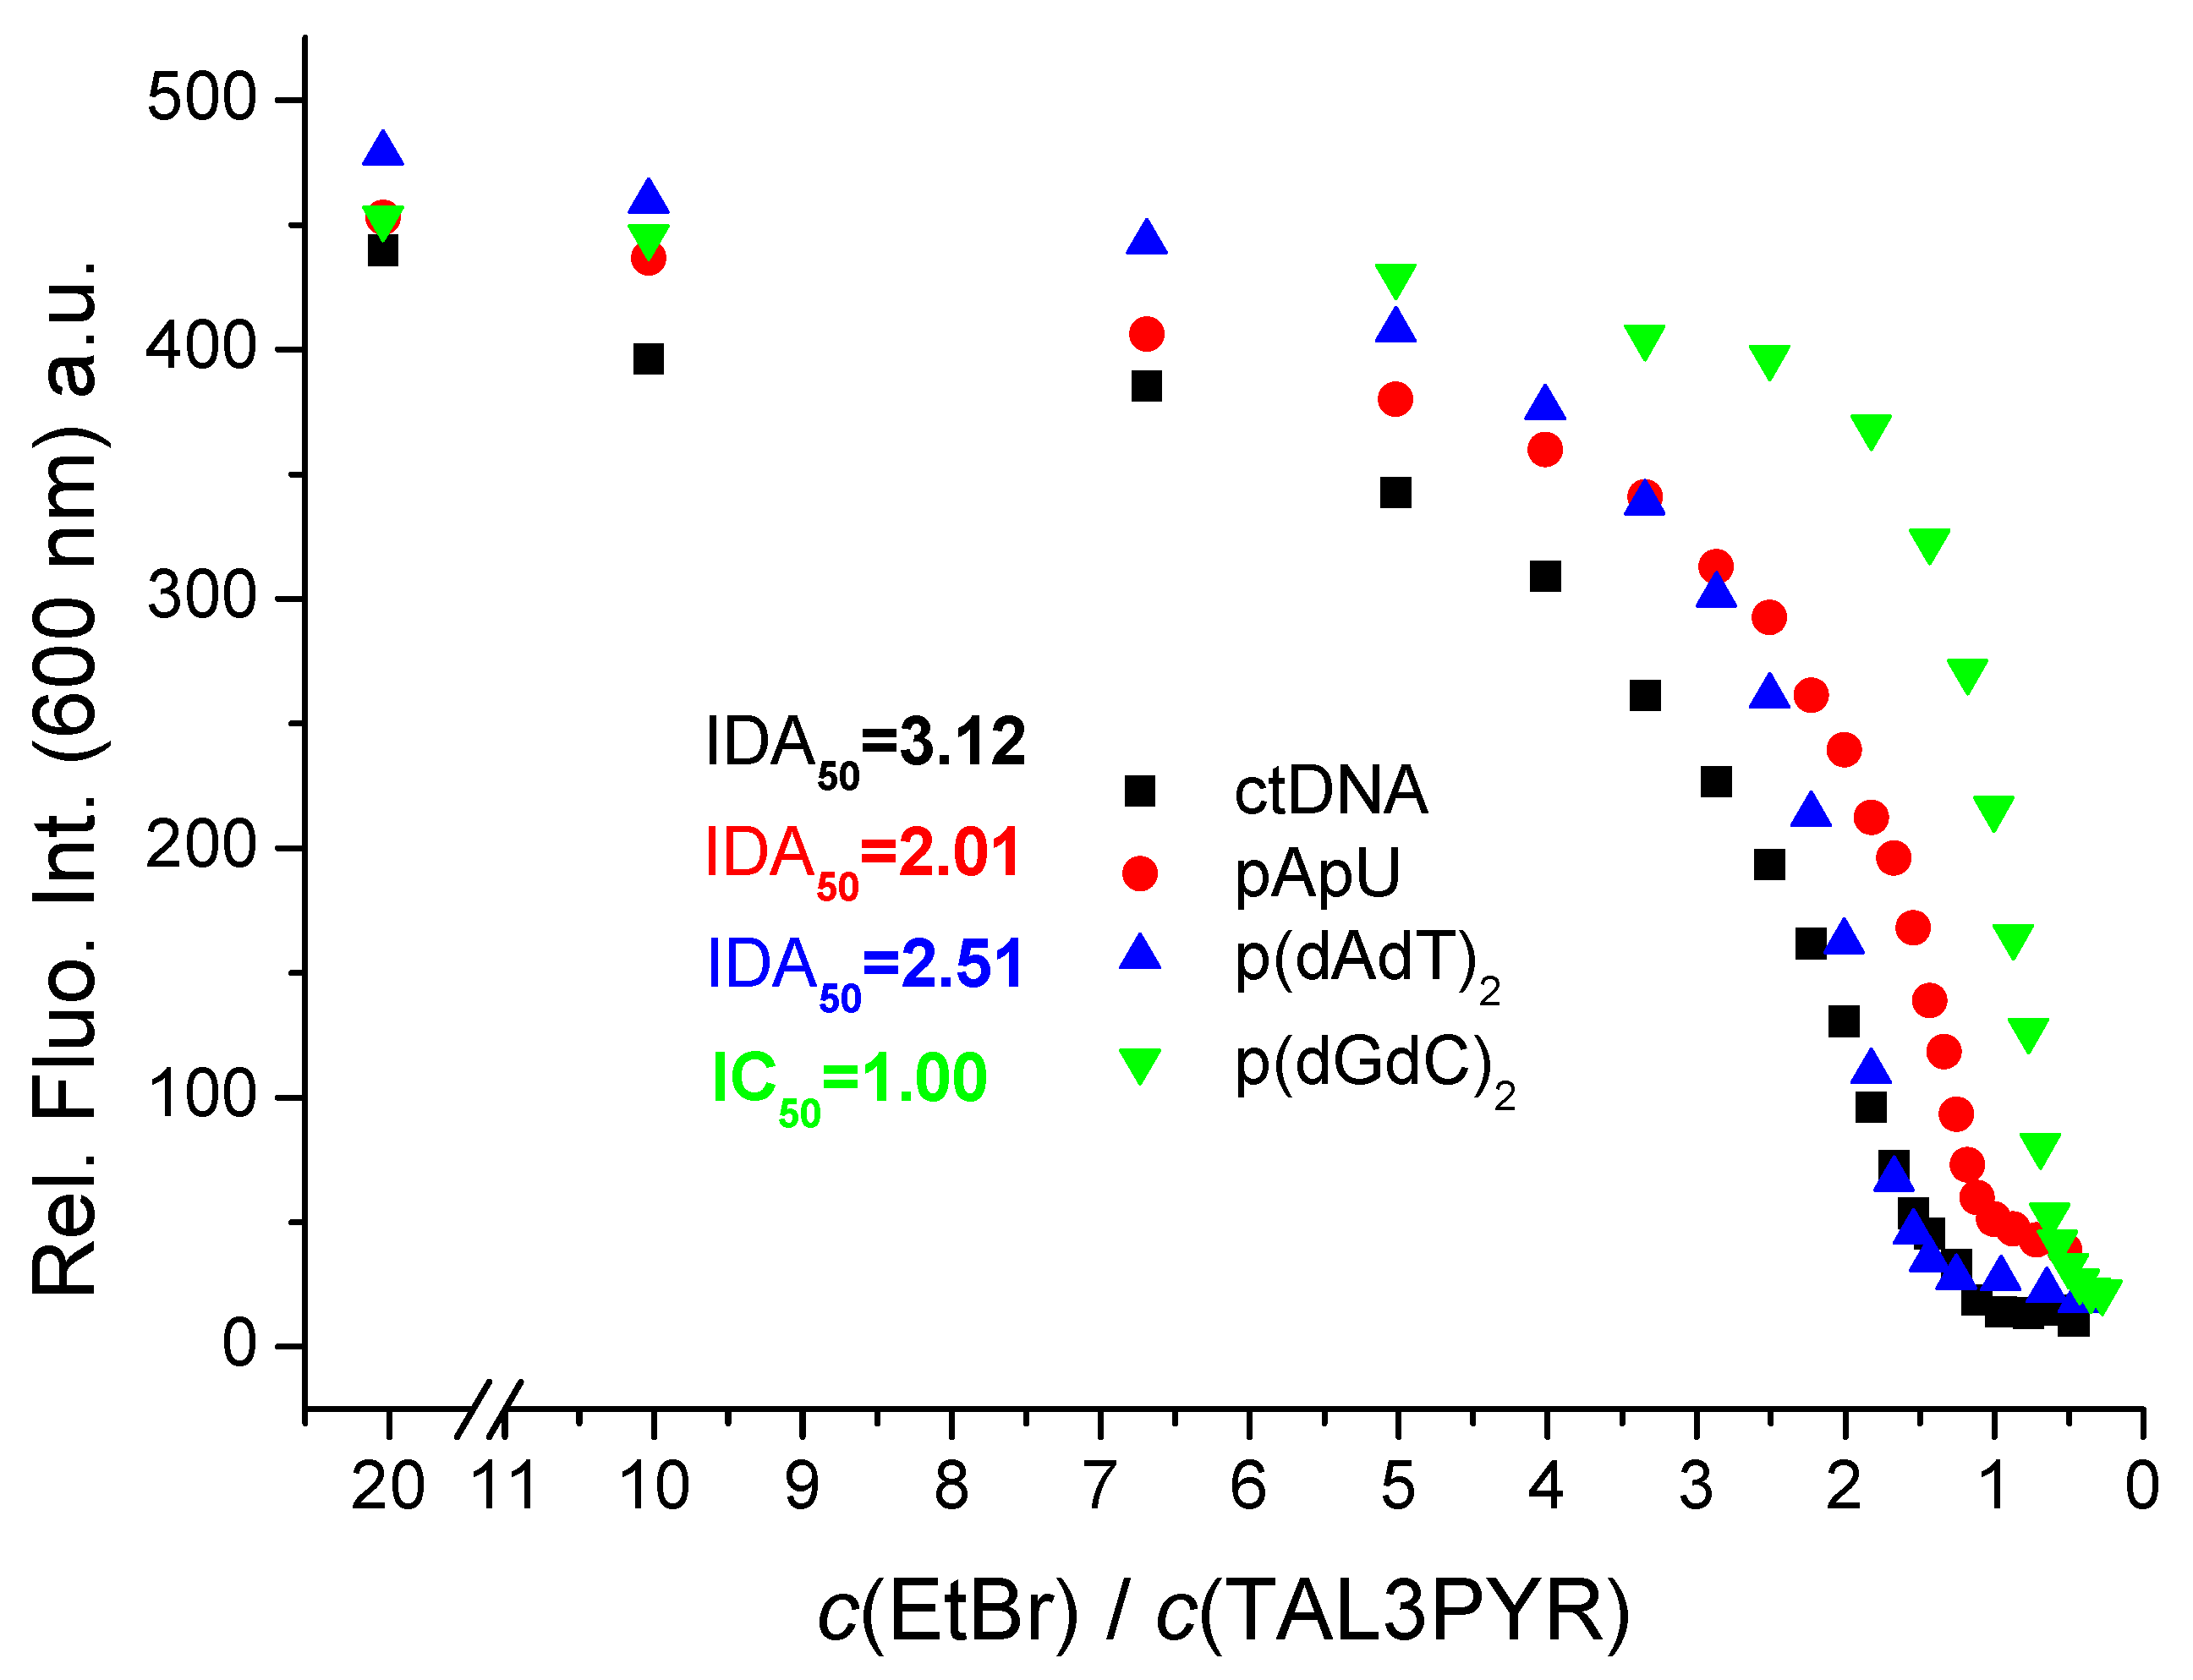
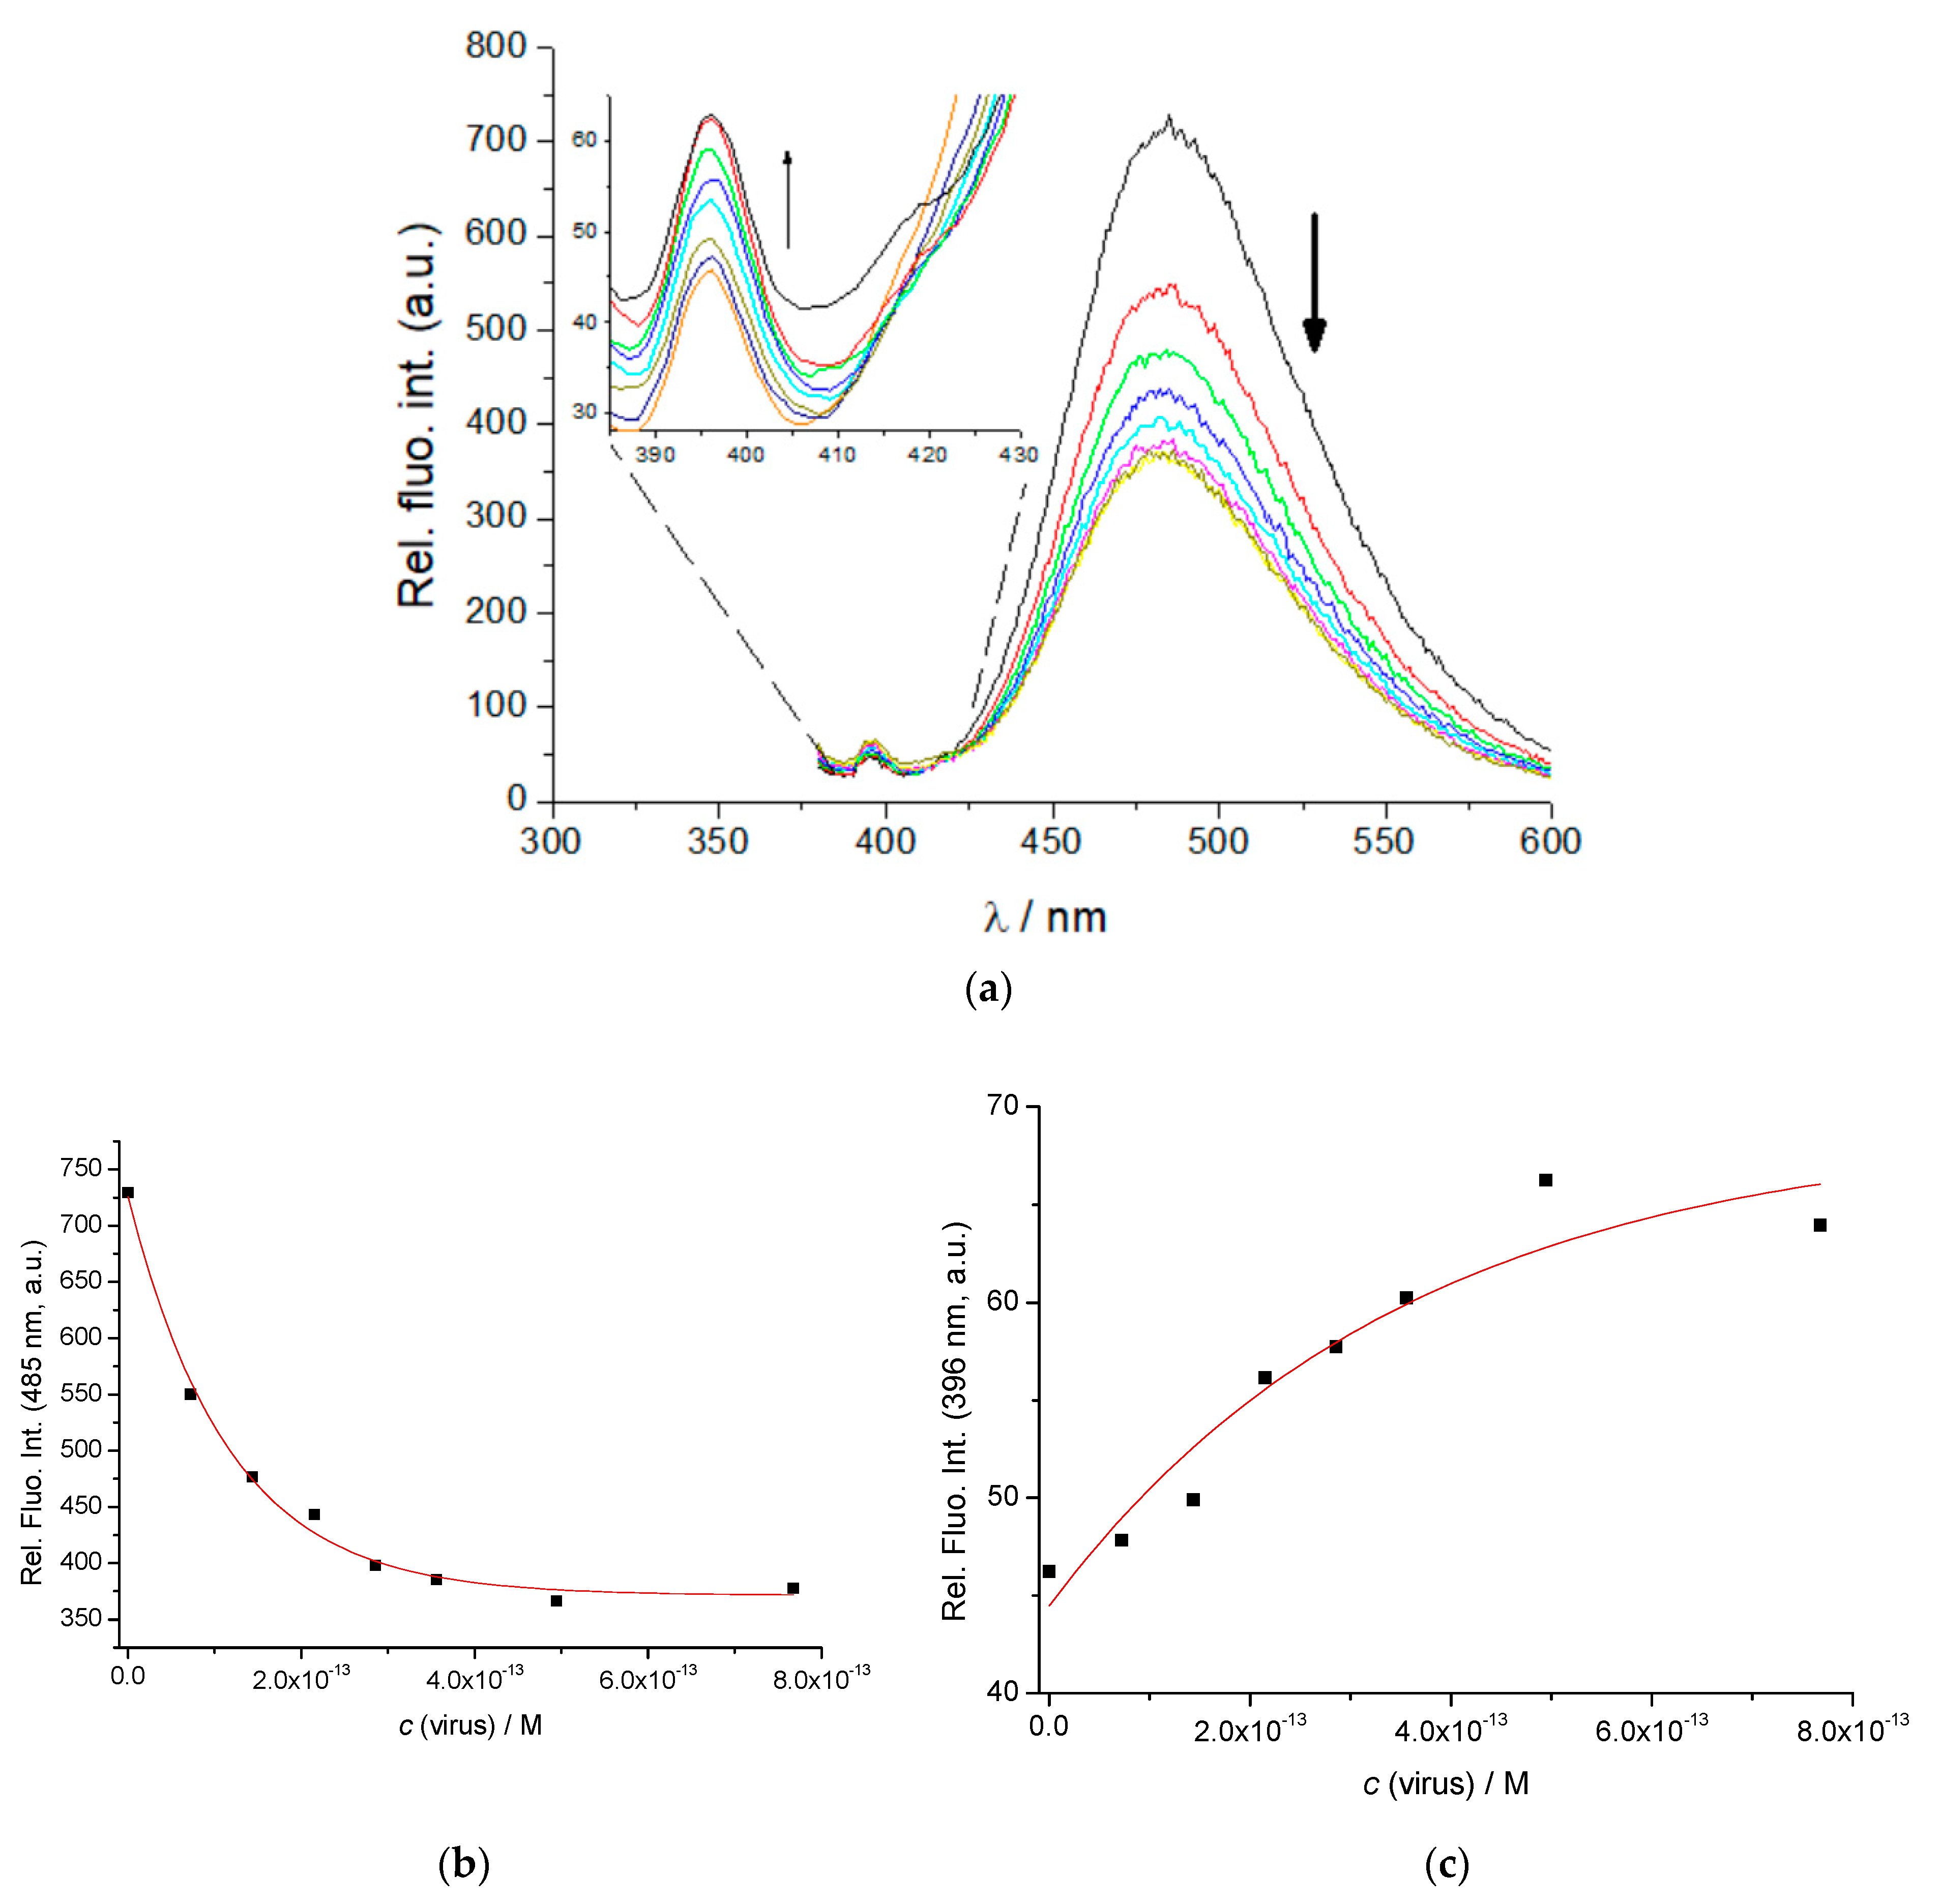
3.3.2. Spectrophotometric Titrations of Pyrene Analogues with DNA, RNA
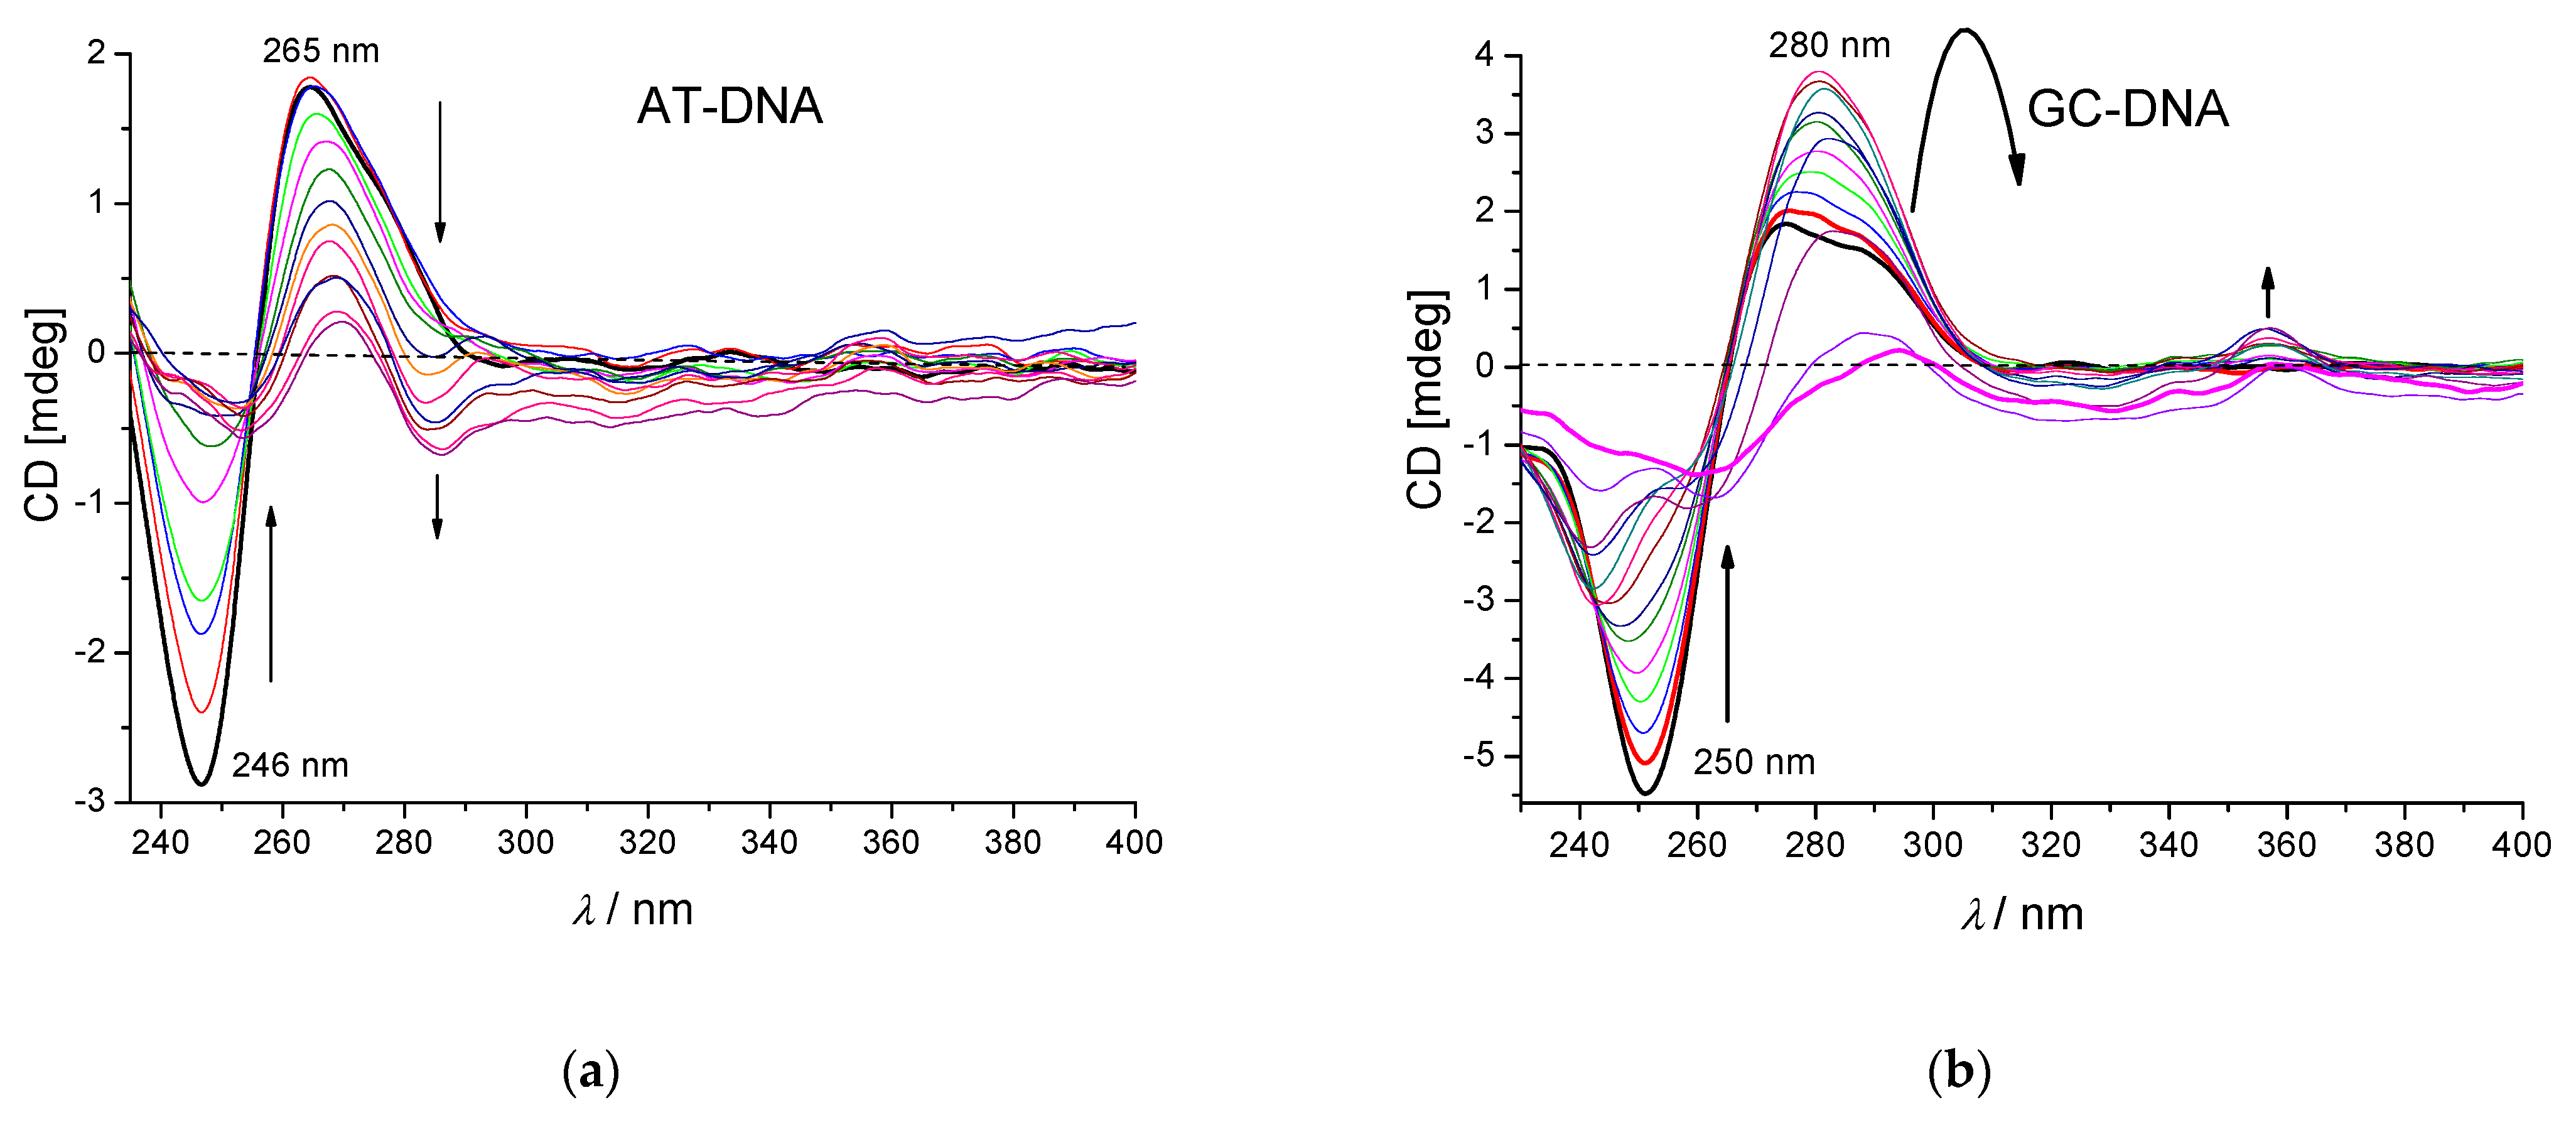
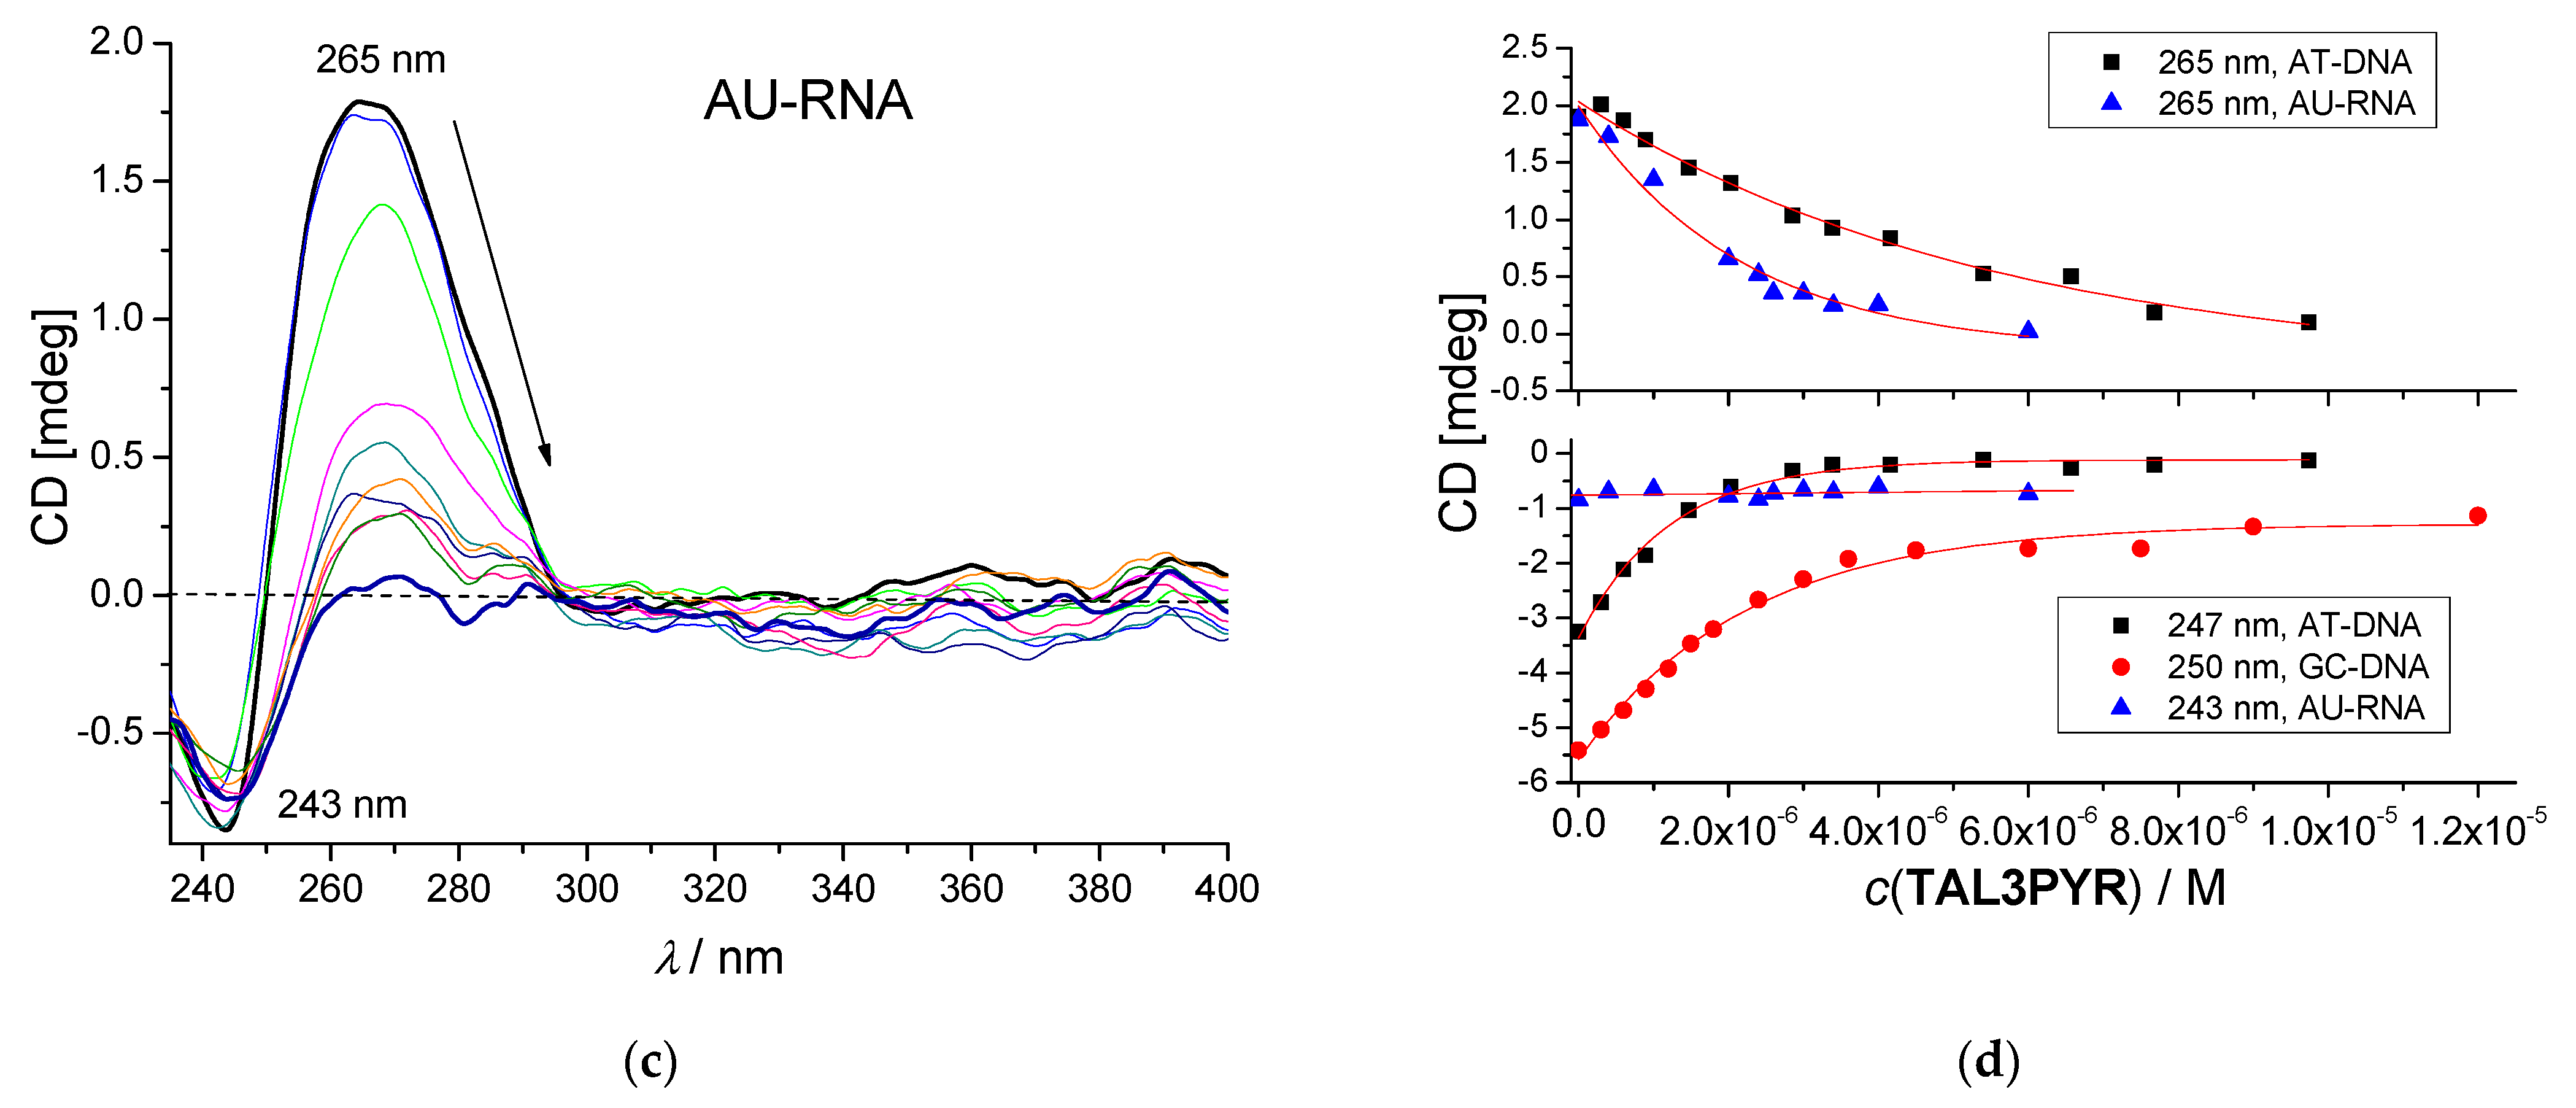
3.3.3. Circular Dichroism (CD) Experiments
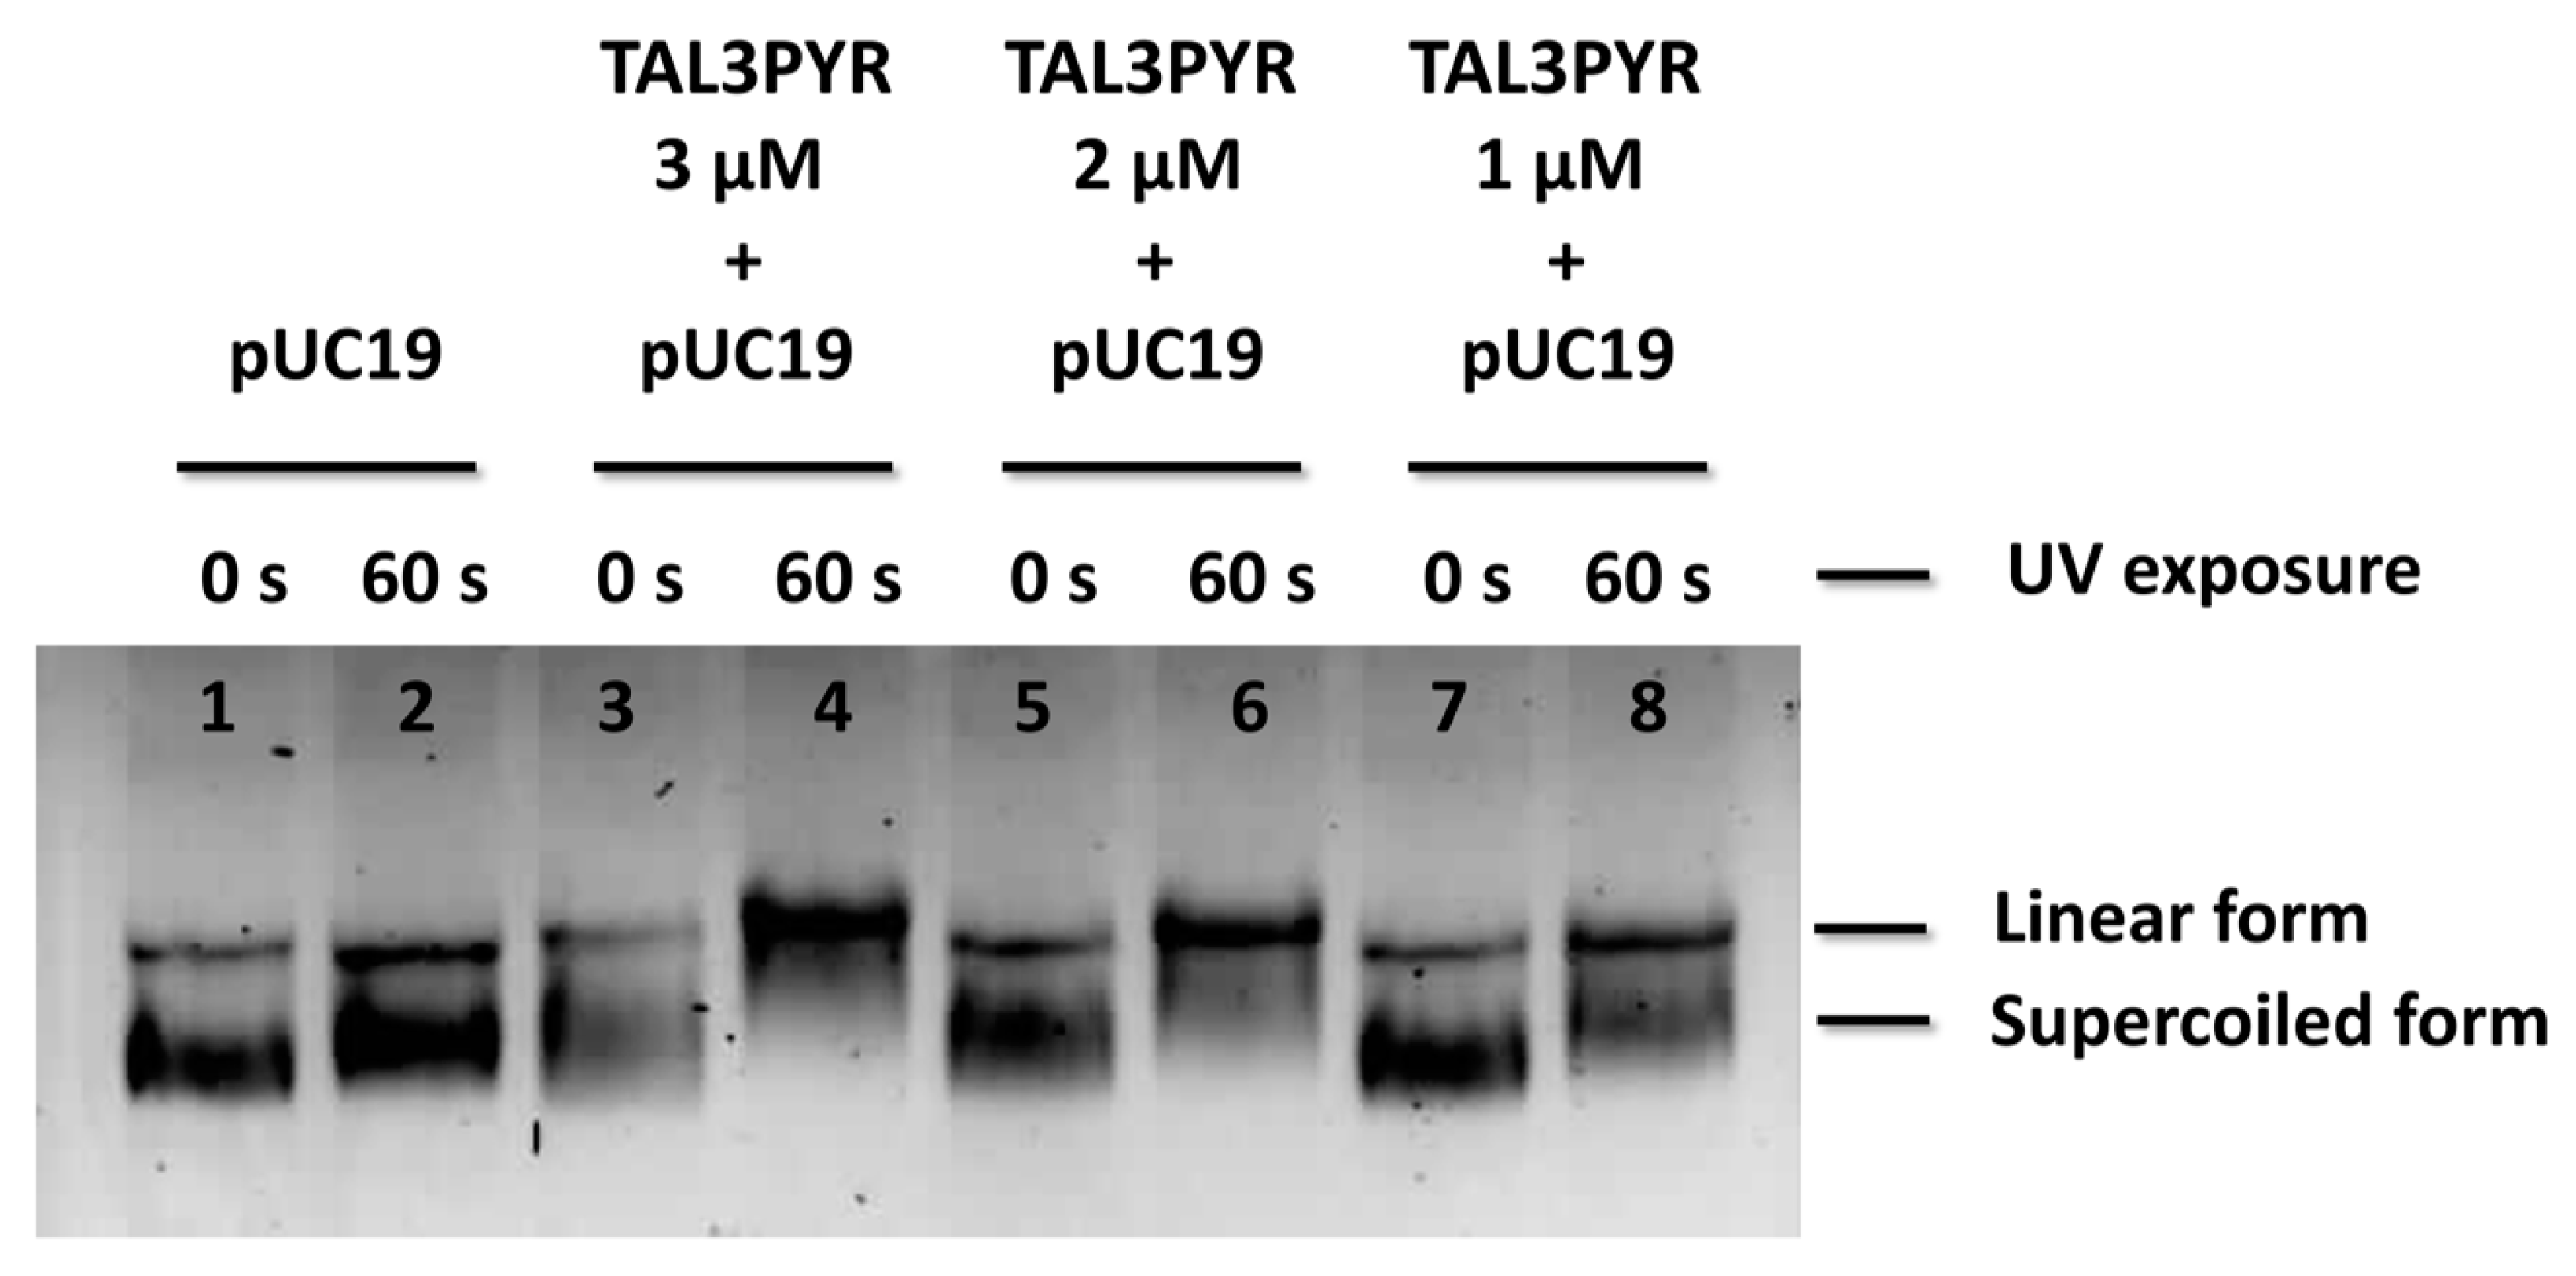
3.3.4. TAL3PYR Induces Plasmid DNA Cleavage
4. Biological Activity of TAL3PYR
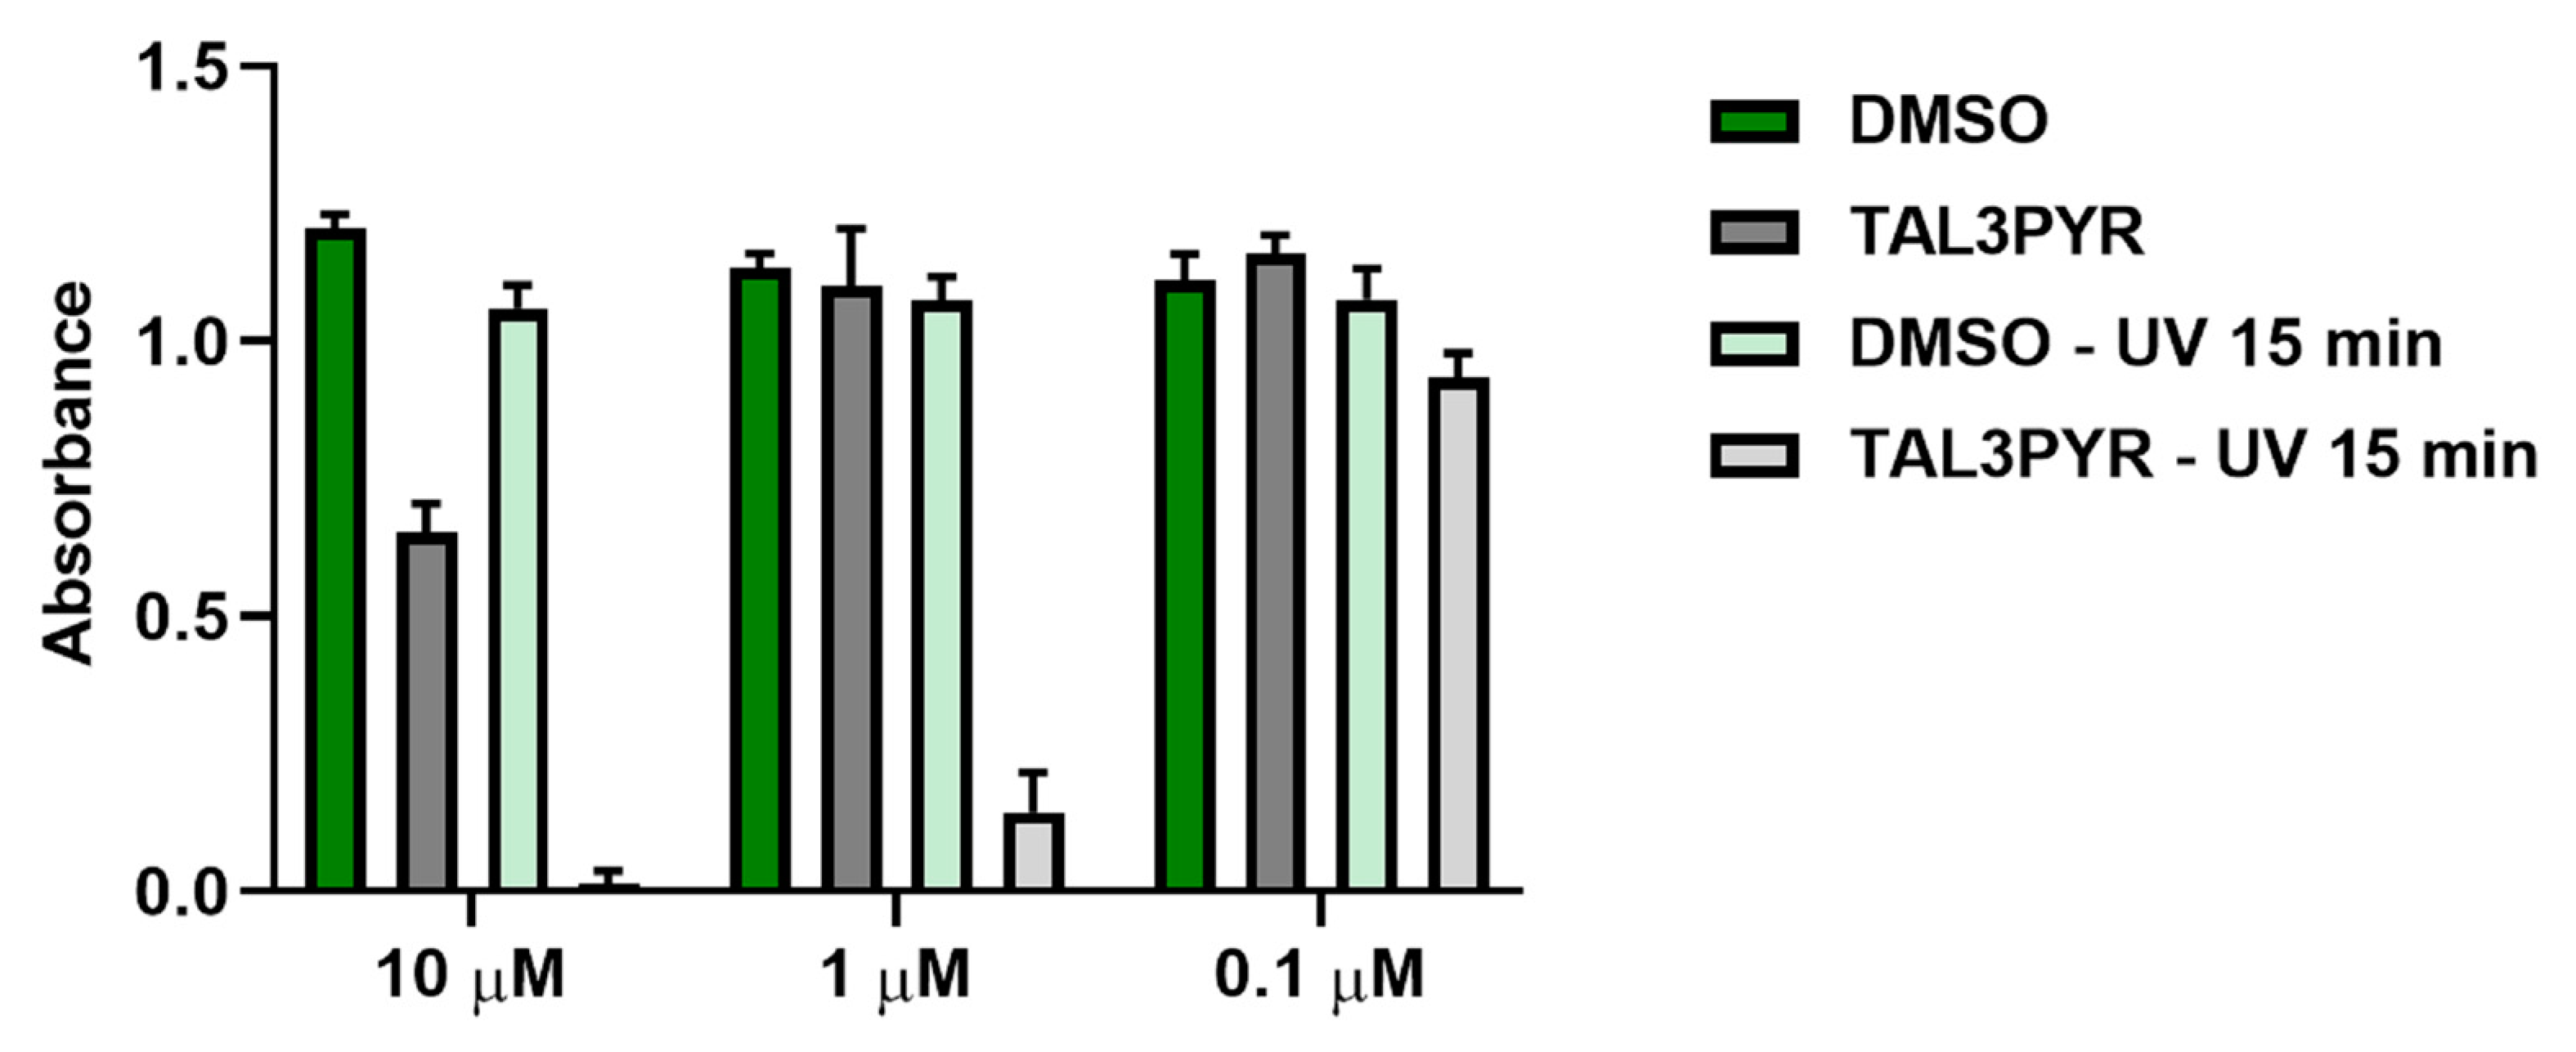
4.1. UV Light Irradiation Increases the Cell Toxicity of TAL3PYR
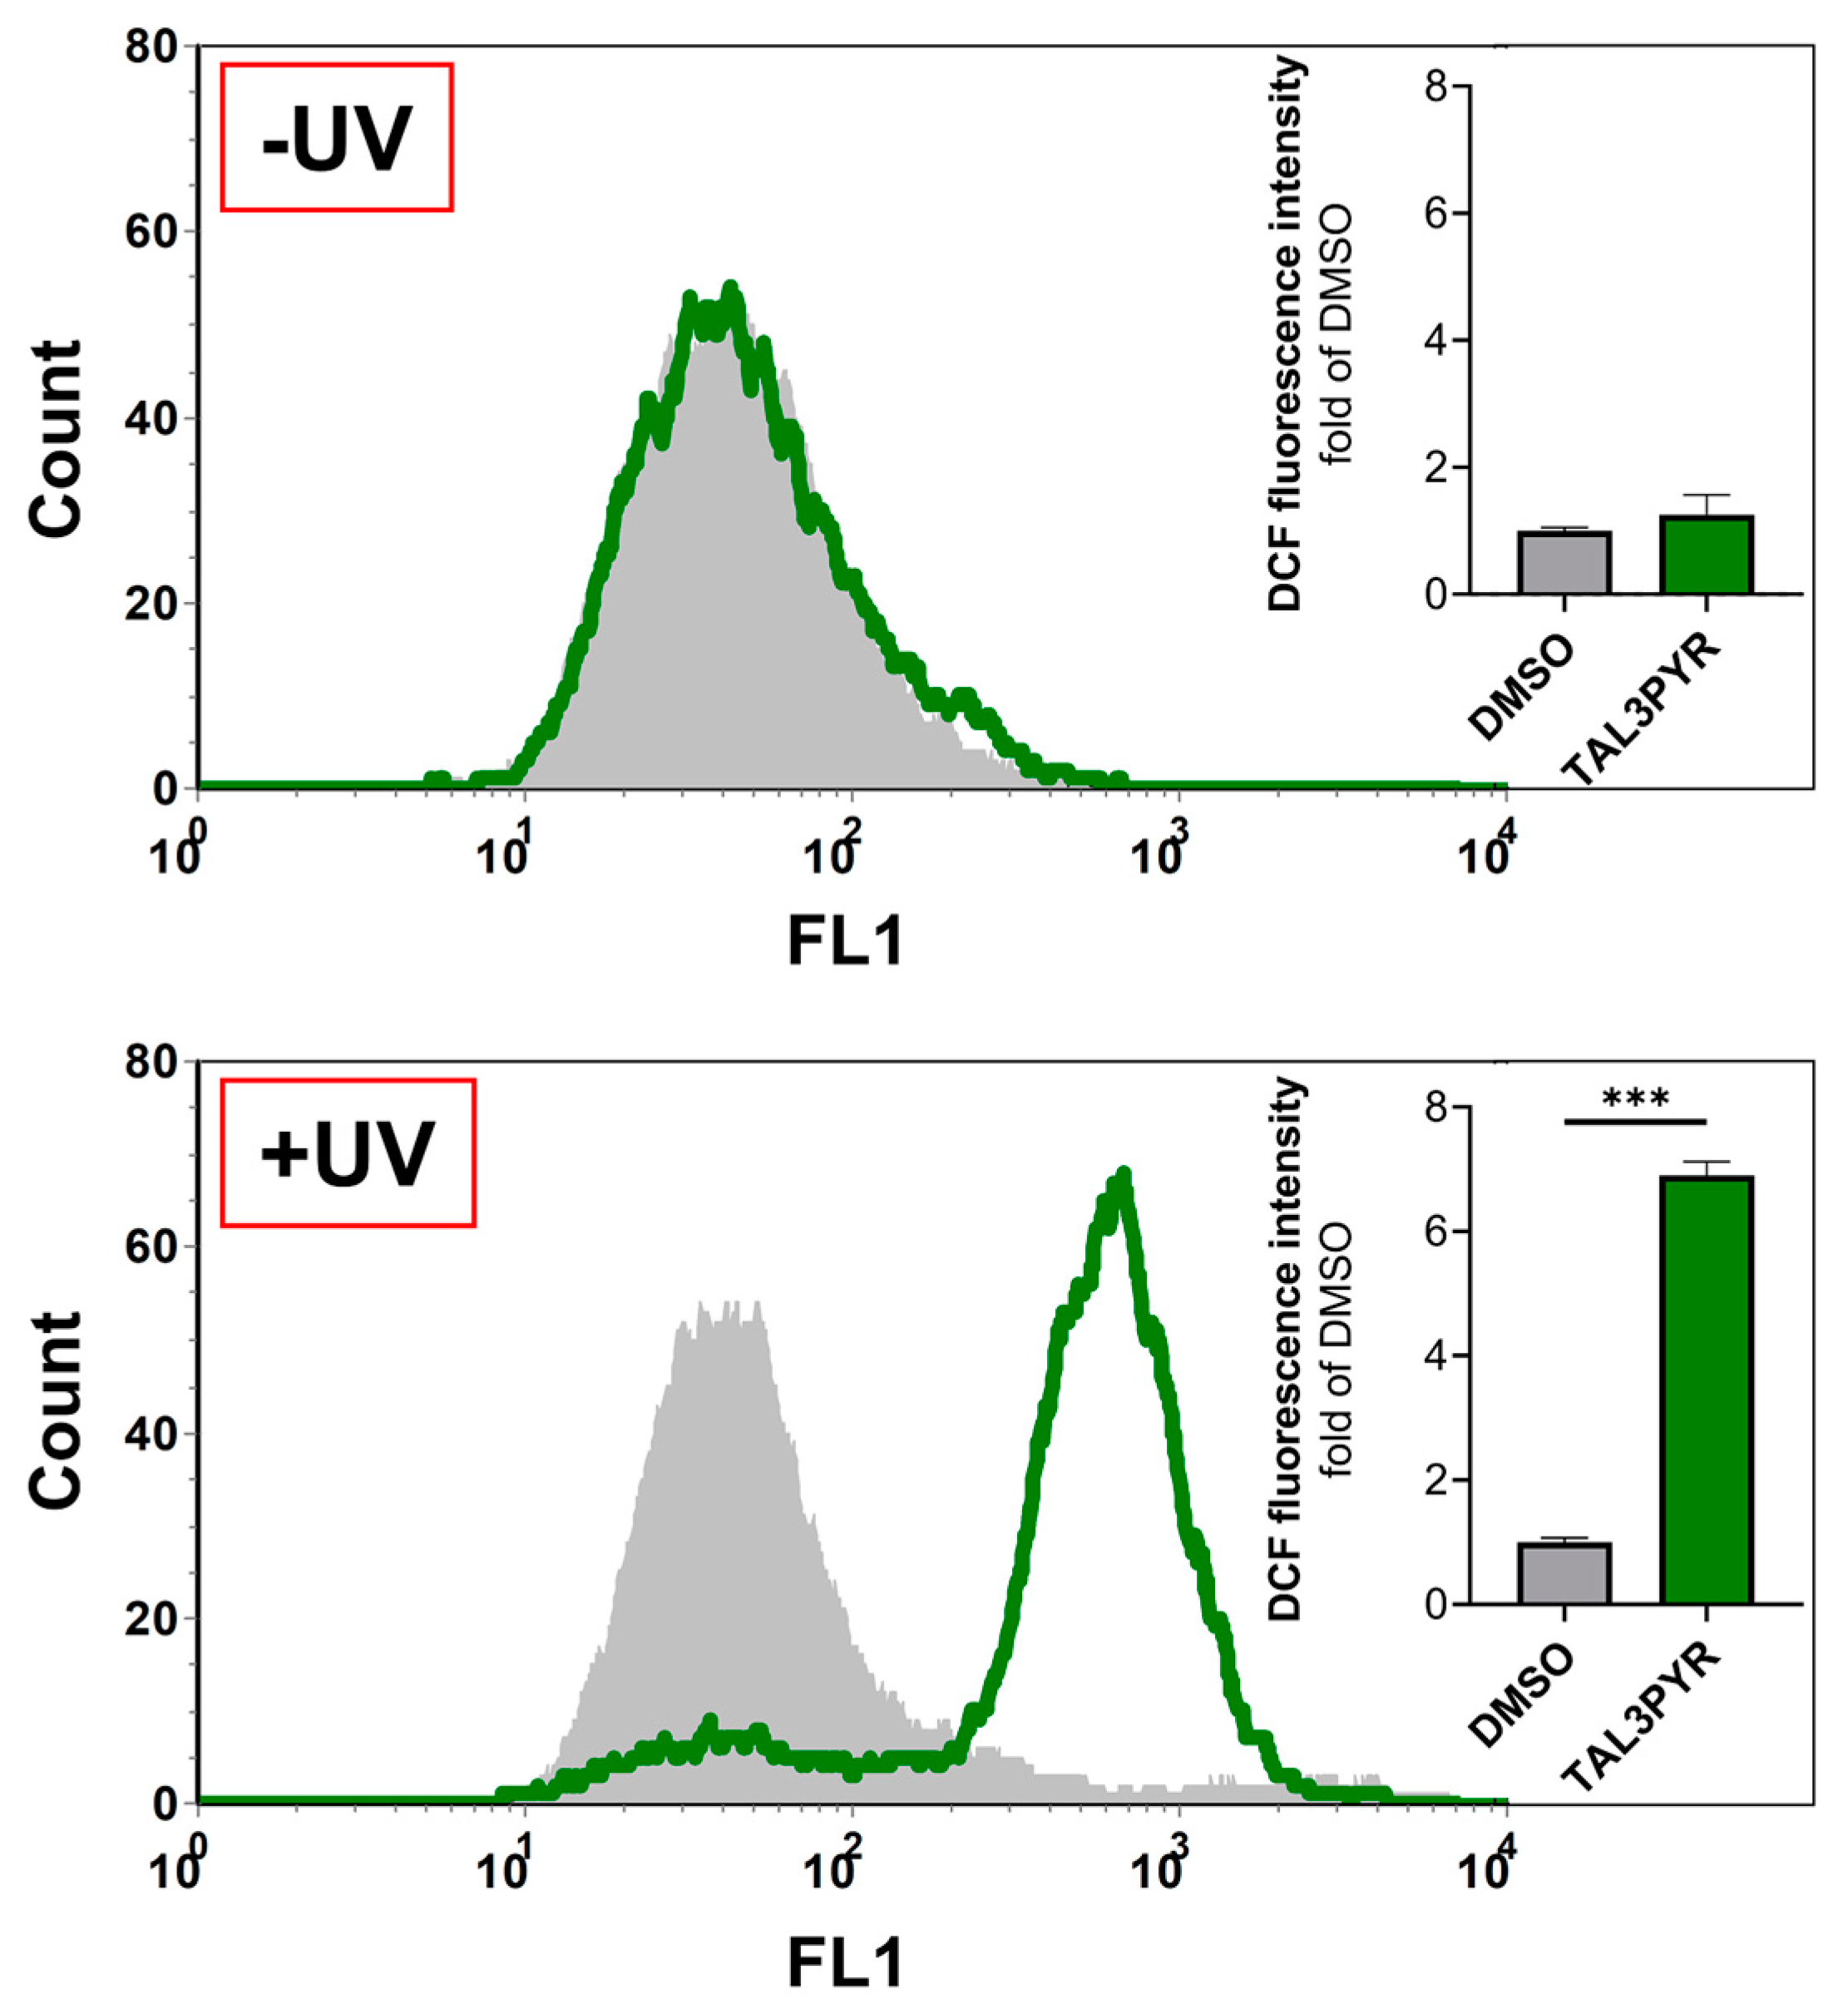
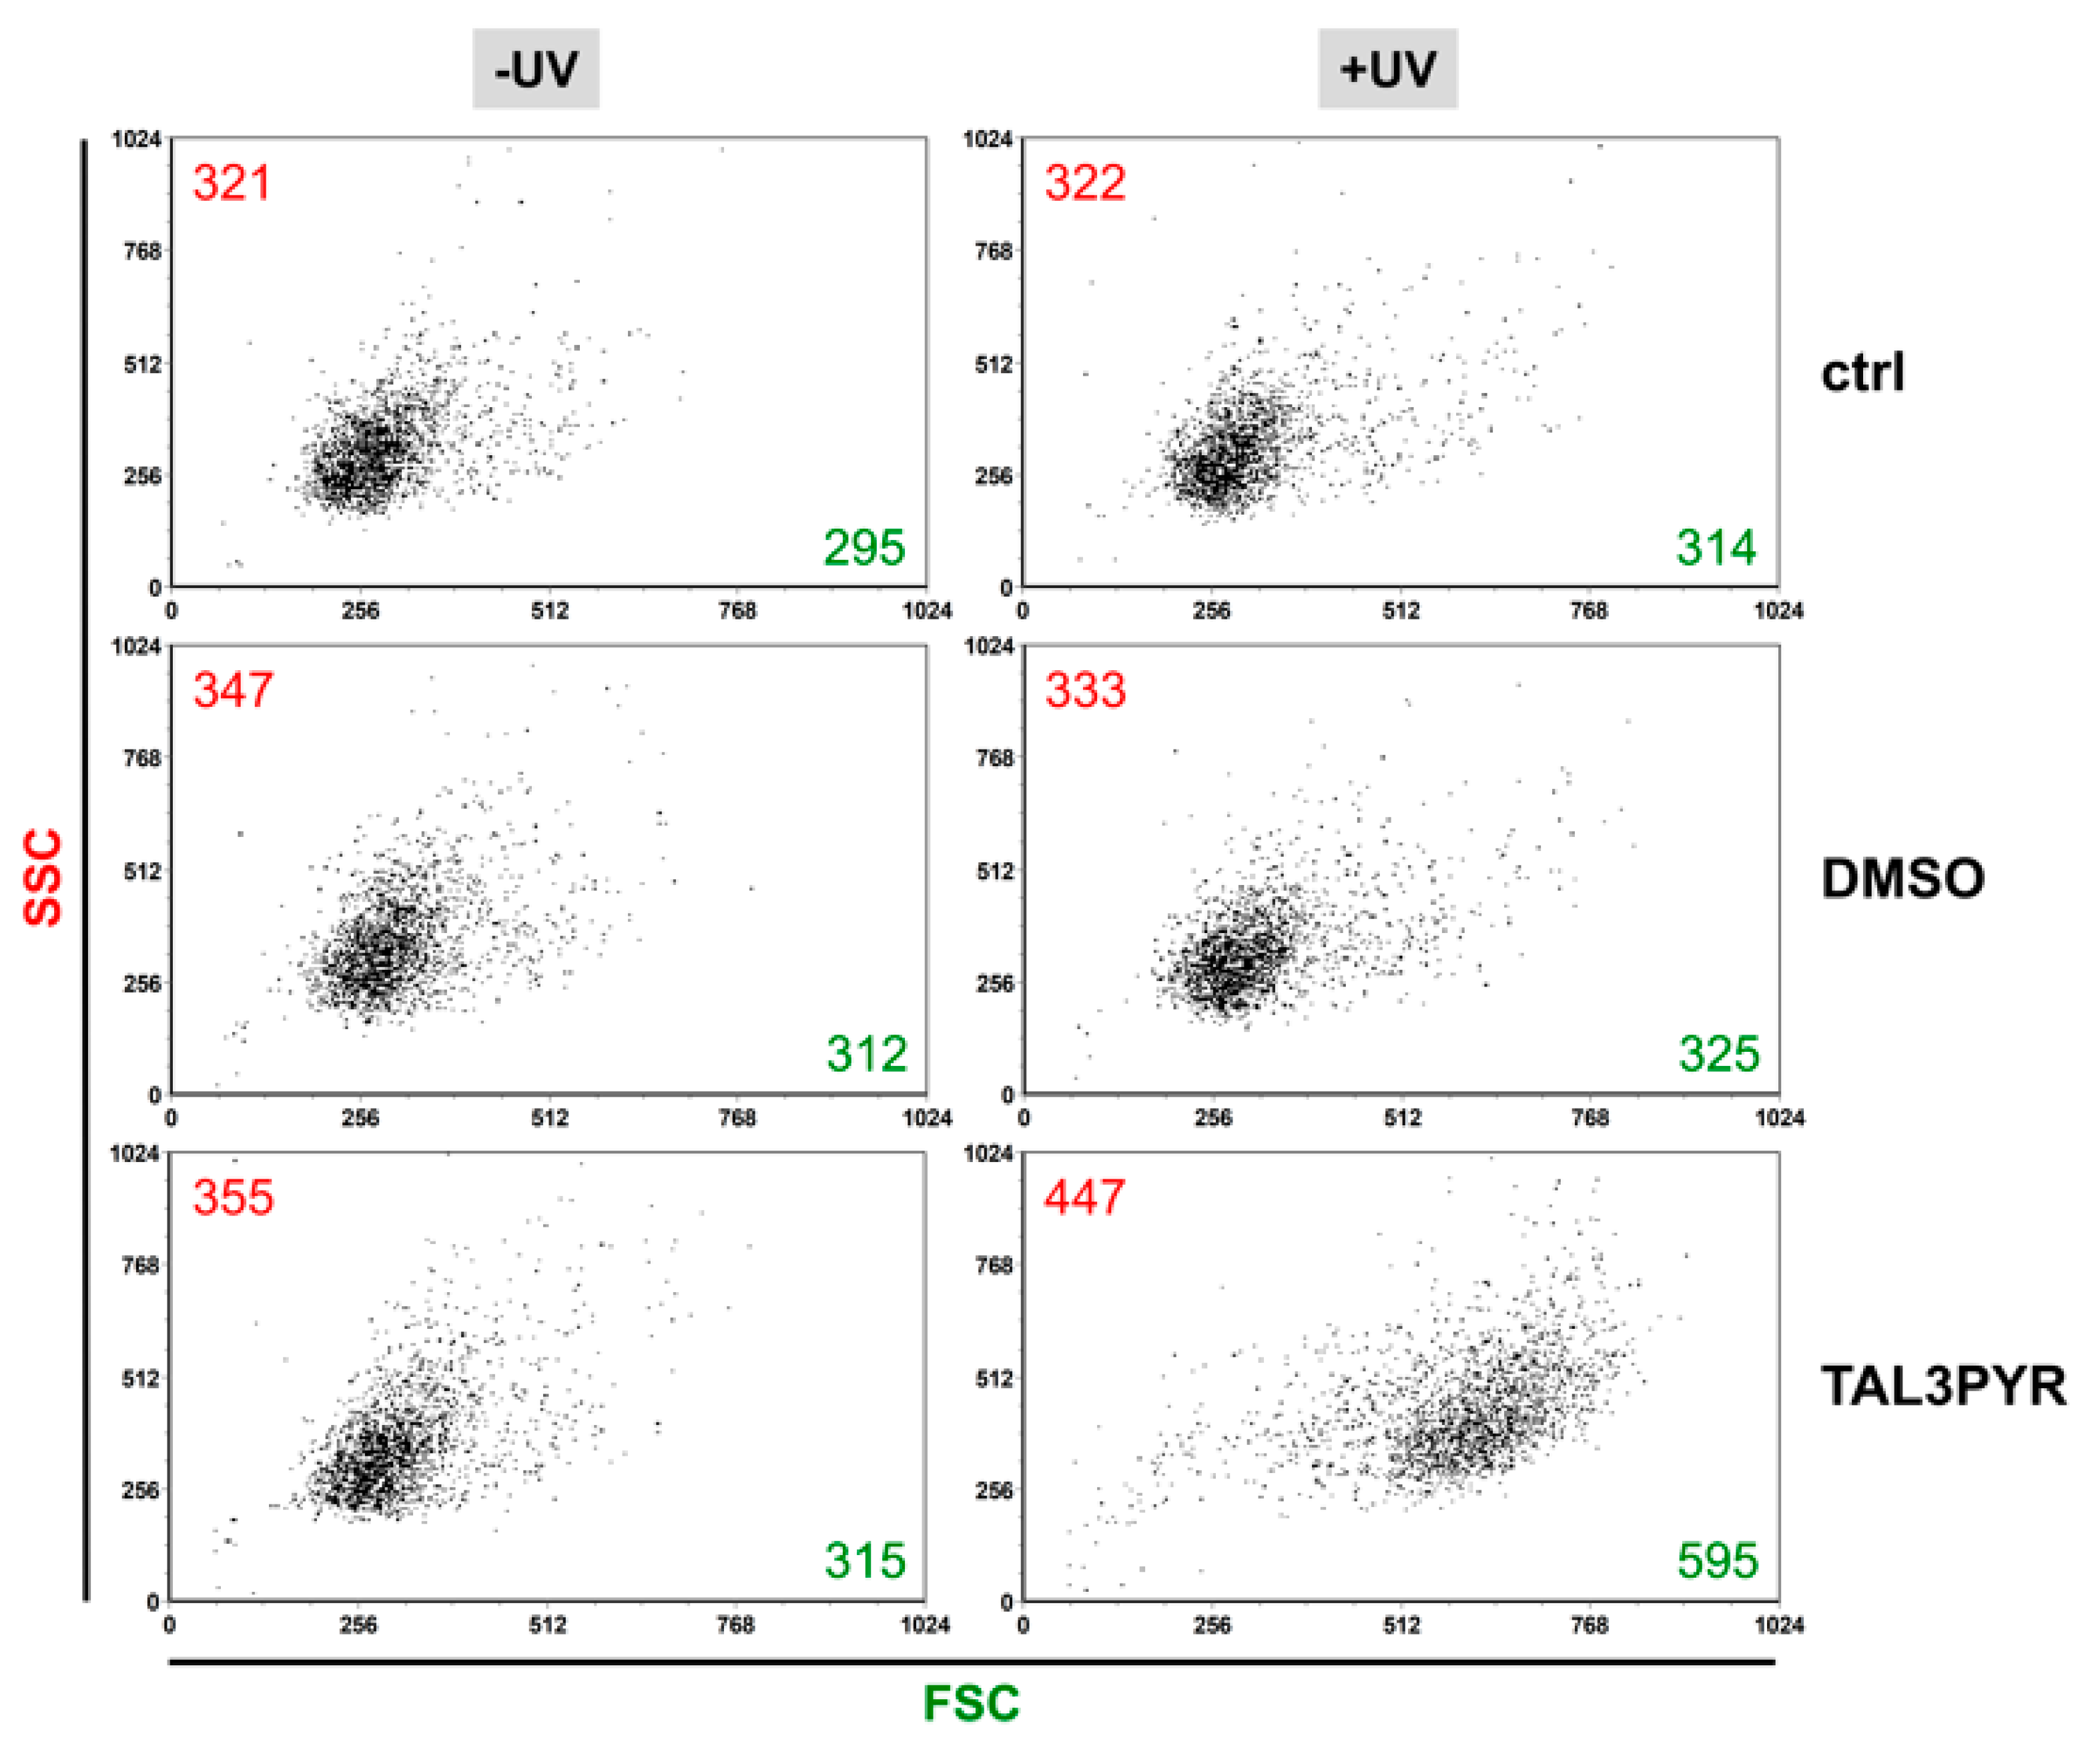
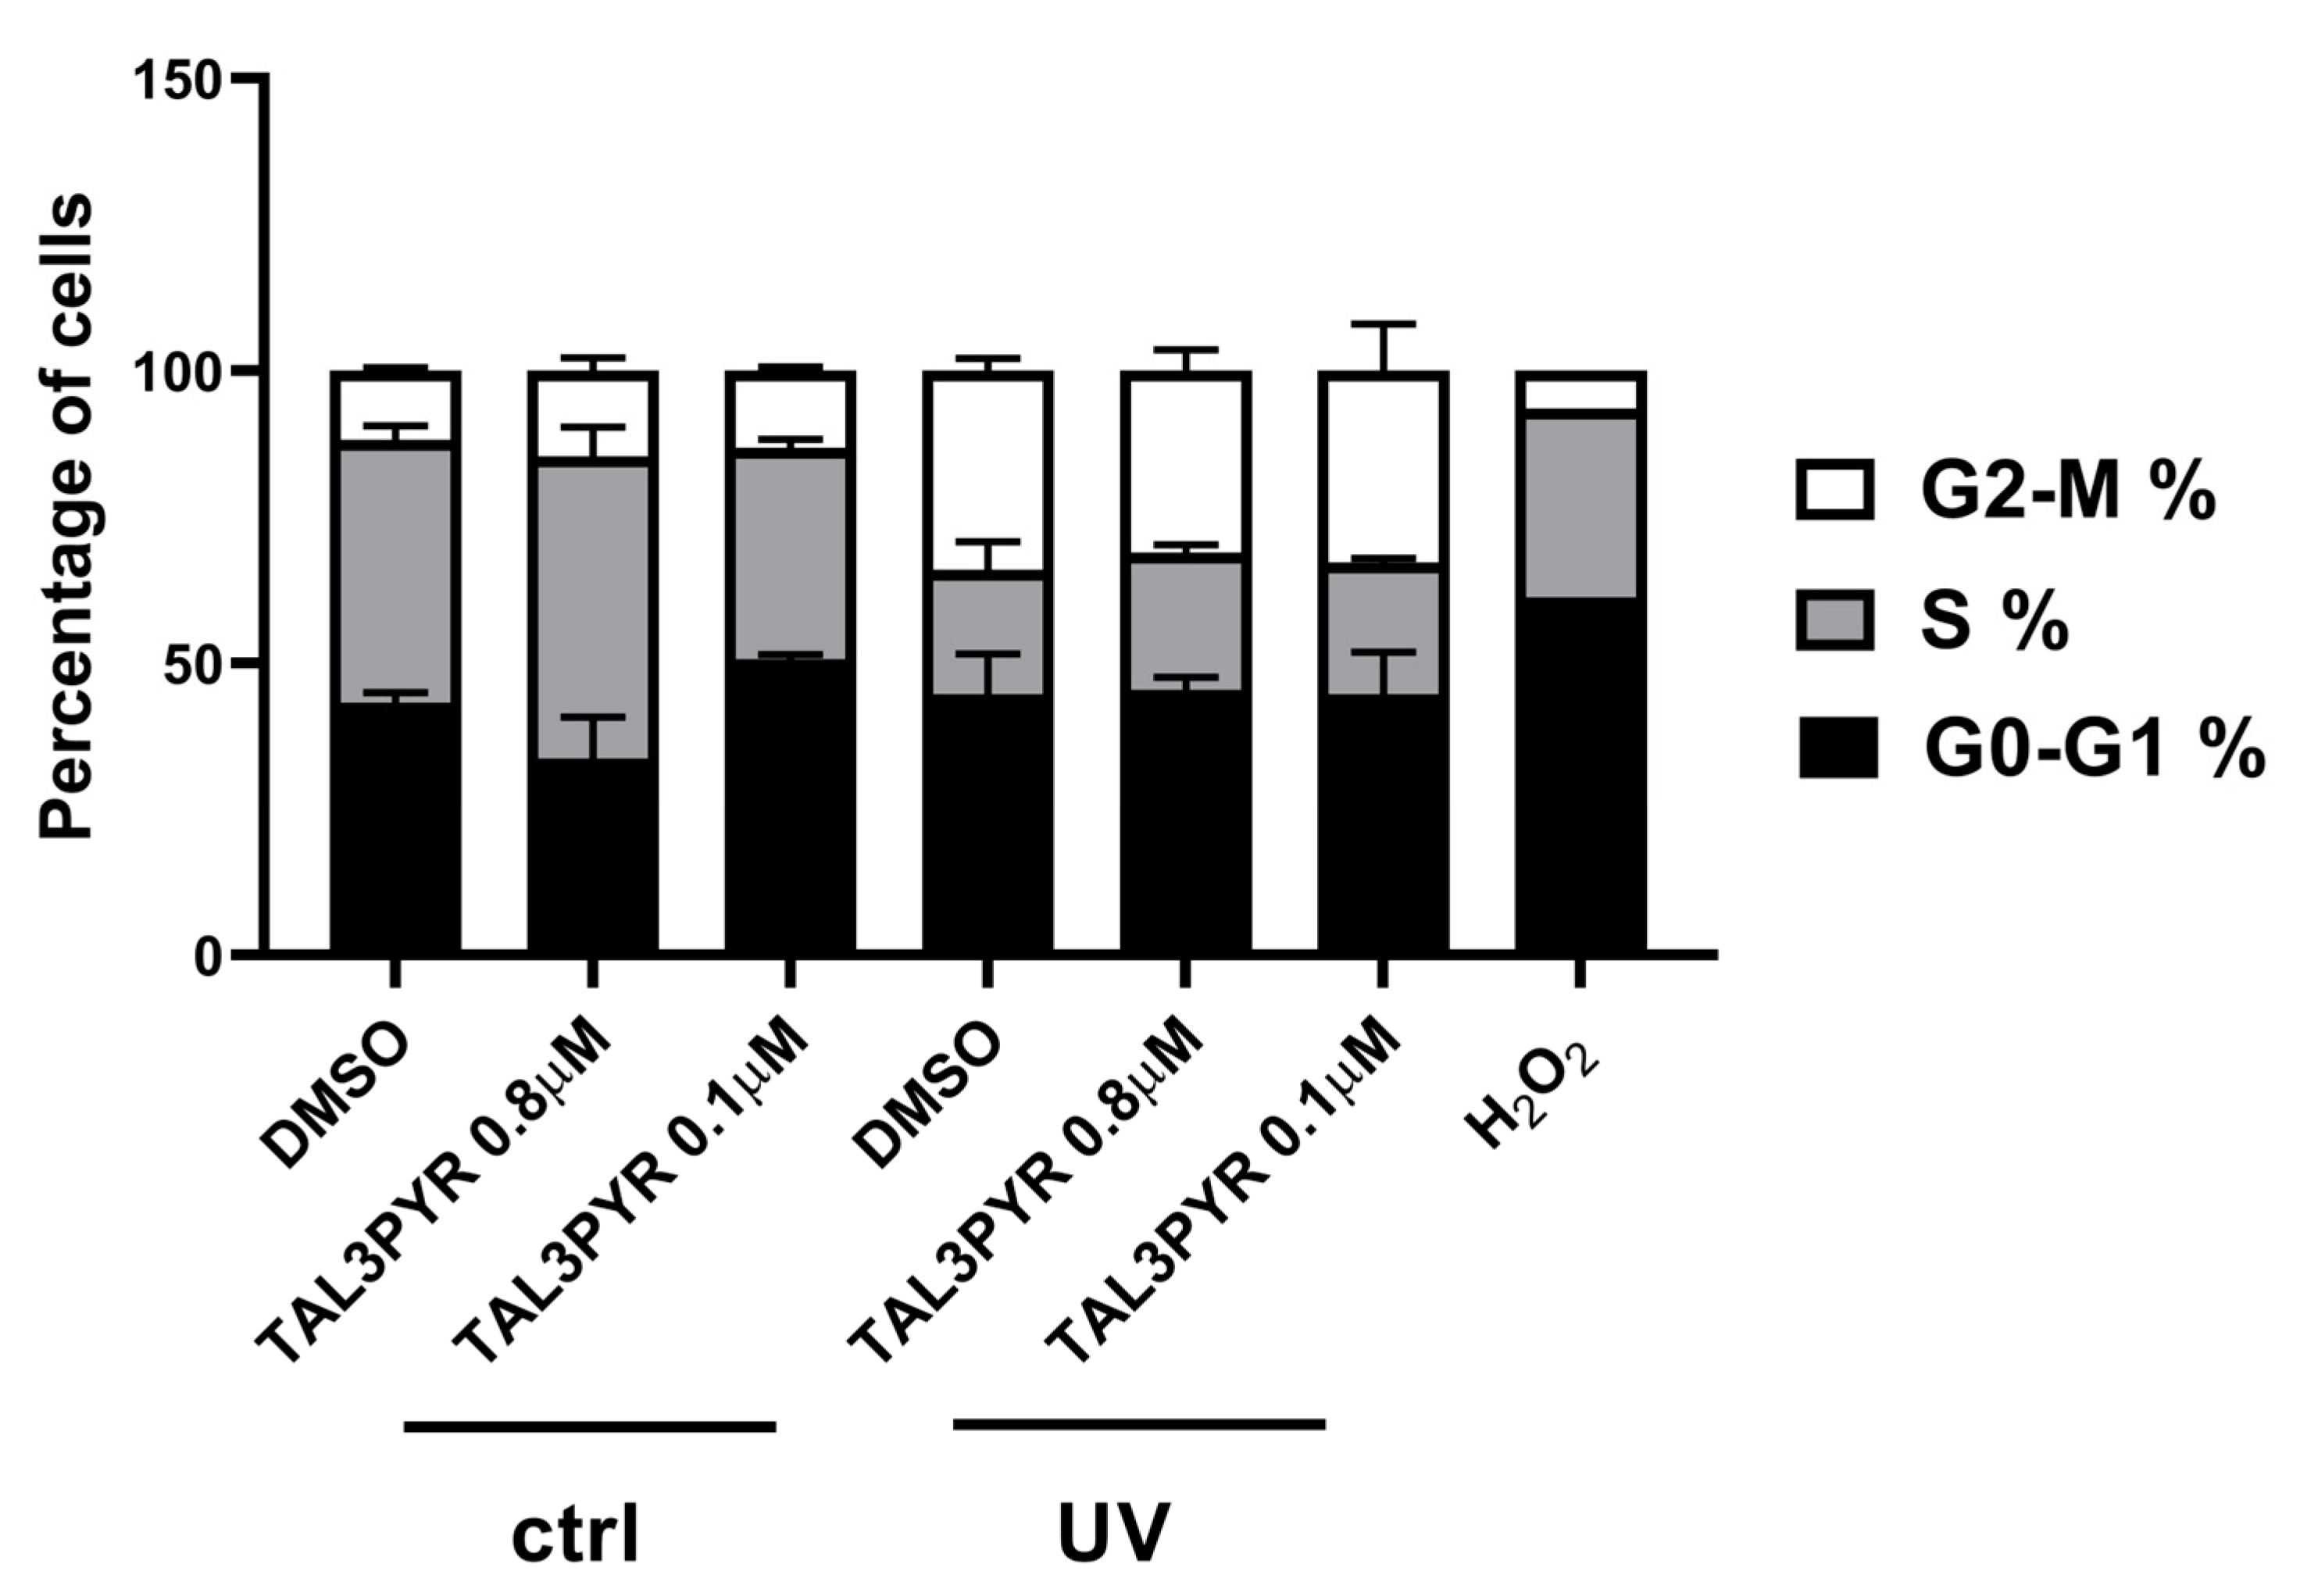
4.2. UV Irradiated TAL3PYR Induces Change in Cell Morphology, Induces ROS Production, and Causes Changes in the Cell Life Cycle
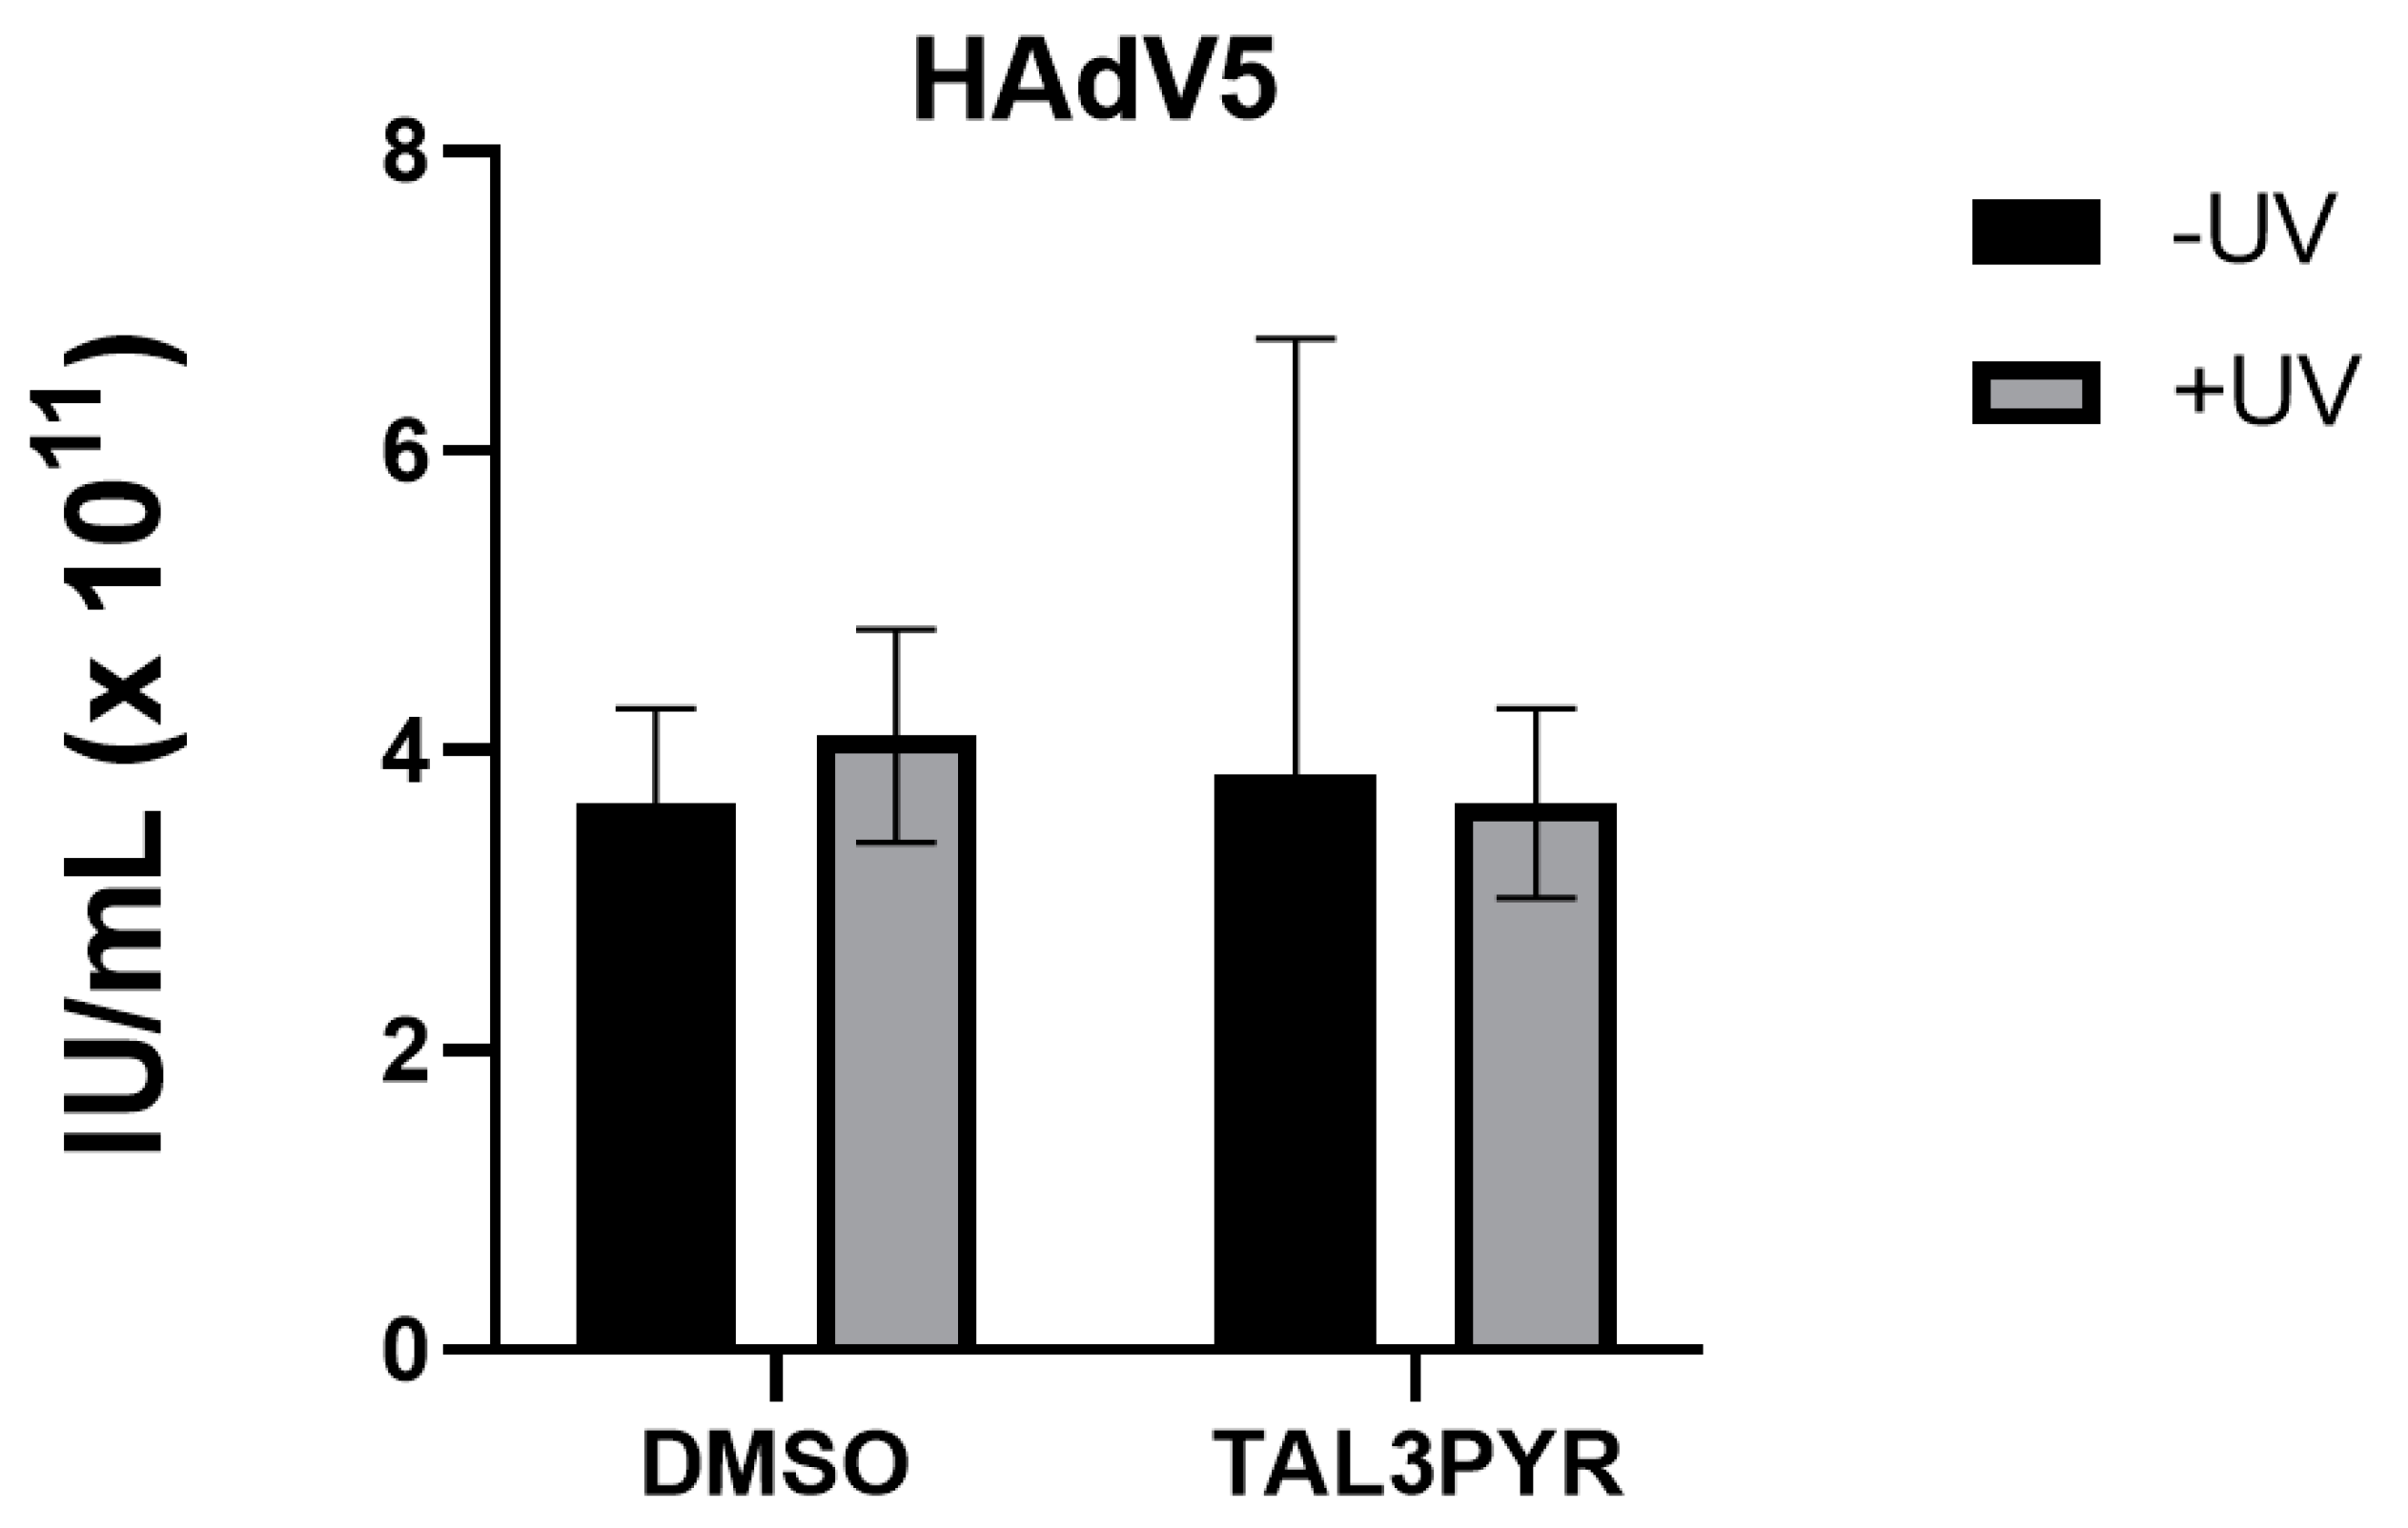
4.3. TAL3PYR Forms a Complex with HAdV5 but Shows No Antiviral Activity
5. Conclusions
Supplementary Materials
Author Contributions
Funding
Institutional Review Board Statement
Informed Consent Statement
Data Availability Statement
Conflicts of Interest
References
- Childs, A.C.; Mehta, D.J.; Gerner, E.W. Polyamine-dependent gene expression. Cell Mol. Life Sci. 2003, 60, 1394–1406. [Google Scholar] [CrossRef]
- Lindemose, S.; Nielsen, P.E.; Mollegaard, N.E. Polyamines preferentially interact with bent adenine tracts in double-stranded DNA. Nucleic Acids Res. 2005, 33, 1790–1803. [Google Scholar] [CrossRef] [PubMed]
- Thomas, T.; Thomas, T.J. Polyamines in cell growth and cell death: Molecular mechanisms and therapeutic applications. Cell Mol. Life Sci. 2001, 58, 244–258. [Google Scholar] [CrossRef]
- Igarashi, K.; Kashiwagi, K. Polyamines: Mysterious modulators of cellular functions. Biochem. Biophys. Res. Commun. 2000, 271, 559–564. [Google Scholar] [CrossRef]
- Gosule, L.C.; Schellman, J.A. DNA condensation with polyamines I. Spectroscopic studies. J. Mol. Biol. 1978, 121, 311–326. [Google Scholar] [CrossRef]
- Hou, M.-H.; Lin, S.-B.; Yuann, J.-M.P.; Lin, W.-C.; Wang, A.H.-J.; Kan, L. Effects of polyamines on the thermal stability and formation kinetics of DNA duplexes with abnormal structure. Nucleic Acids Res. 2001, 29, 5121–5128. [Google Scholar] [CrossRef] [PubMed]
- Garcia-Espana, E.; Piantanida, I.; Schneider, H.J. Nucleic Acids as Supramolecular Targets; Royal Society of Chemistry: London, UK, 2013; pp. 213–259. [Google Scholar]
- Inclán, M.; Albelda, M.T.; Frías, J.C.; Blasco, S.; Verdejo, B.; Serena, C.; Salat-Canela, C.; Díaz, M.L.; García-España, A.; García-España, E. Modulation of DNA binding by reversible metal-controlled molecular reorganizations of scorpiand-like ligands. J. Am. Chem. Soc. 2012, 134, 9644–9656. [Google Scholar] [CrossRef]
- Hirschman, S.; Leng, M.; Felsenfield, G. Interaction of spermine and DNA. Biopolymers 1967, 5, 227–233. [Google Scholar] [CrossRef] [PubMed]
- Morgan, J.E.; Blankenship, J.W.; Matthews, H.R. Association constants for the interaction of double-stranded and single-stranded DNA with spermine, spermidine, putrescine, diaminopropane, N1- and N8-acetylspermidine, and magnesium: Determination from analysis of the broadening of thermal denaturation curves. Arch. Biochem. Biophys. 1986, 246, 225–232. [Google Scholar]
- Patel, M.M.; Anchordoquy, T.J. Ability of spermine to differentiate between DNA sequences—Preferential stabilisation of A-tracts. Biophys. Chem. 2006, 122, 5–15. [Google Scholar] [CrossRef]
- Yuki, M.; Grukhin, V.; Lee, C.-S.; Haworth, I.S. Spermine binding to GCrich DNA: Experimental and theoretical studies. Arch. Biochem. Biophys. 1996, 325, 39–46. [Google Scholar] [CrossRef]
- Deng, H.; Bloomfield, V.A.; Benevides, J.M.; Thomas, G.J. Structural basis of polyamine–DNA recognition: Spermidine and spermine interactions with genomic B-DNAs of different GC content probed by Raman spectroscopy. Nucleic Acids Res. 2000, 28, 3379–3385. [Google Scholar] [CrossRef] [PubMed]
- Marquet, R.; Wyart, A.; Houssier, C. Influence of DNA length on spermine-induced condensation: Importance of the bending and stiffening of DNA. Biochim. Biophys. Acta 1987, 909, 165–172. [Google Scholar] [CrossRef] [PubMed]
- González-García, J.; Uzelac, L.; Kralj, M.; Llinares, J.M.; García-España, E.; Piantanida, I. The size of the aryl linker between two polyaza-cyclophane moieties controls the binding selectivity to ds-RNA vs. ds-DNA. Org. Biomol. Chem. 2013, 11, 2154–2161. [Google Scholar] [CrossRef] [PubMed]
- Sornosa-Ten, A.; Albelda, M.T.; Frías, J.C.; García-España, E.; Llinares, J.M.; Budimir, A.; Piantanida, I. Acid–base properties of functionalised tripodal polyamines and their interaction with nucleotides and nucleic acids. Org. Biomol. Chem. 2010, 8, 2567–2574. [Google Scholar] [CrossRef] [PubMed]
- Gonzalez, J.; Llinares, J.M.; Belda, R.; Pitarch, J.; Soriano, C.; Tejero, R.; Verdejo, B.; García-España, E. Tritopic phenanthroline and pyridine tail-tied aza-scorpiands. Org. Biomol. Chem. 2010, 8, 2367–2376. [Google Scholar] [CrossRef]
- Stojković, M.R.; Gonzalez-Garcia, J.; Šupljika, F.; Galiana-Rosello, C.; Guijarro, L.; Gazze, S.A.; Francis, L.W.; Piantanida, I.; Garcia-España, E. Specific and highly efficient condensation of GC and IC DNA by polyaza pyridinophane derivatives. Int. J. Biol. Macromol. 2018, 109, 143–151. [Google Scholar] [CrossRef]
- Malojčić, G.; Piantanida, I.; Marinić, M.; Žinić, M.; Marjanović, M.; Kralj, M.; Pavelić, K.; Schneider, H.-J. A novel bis-phenanthridine triamine with pH controlled binding to nucleotides and nucleic acids. Org. Biomol. Chem. 2005, 3, 4373–4381. [Google Scholar] [CrossRef]
- Albelda, M.T.; García-España, E.; Jiménez, H.R.; Llinares, J.M.; Soriano, C.; Sornosa-Ten, A.; Verdejo, B. Cu2+ and AMP complexation of enlarged tripodal polyamines. Dalton Trans. 2006, 37, 4474–4481. [Google Scholar] [CrossRef]
- Lakowicz, J.R. Principles of Fluorescence Spectroscopy, 3rd ed.; Springer: Boston, MA, USA, 2006. [Google Scholar]
- Kostenko, E.; Dobrikov, M.; Pyshnyi, D.; Petyuk, V.; Komarova, N.; Vlassov, V.; Zenkova, M. 5′-bis-pyrenylated oligonucleotides displaying excimer fluorescence provide sensitive probes of RNA sequence and structure. Nucleic Acids Res. 2001, 29, 3611–3620. [Google Scholar] [CrossRef]
- Østergaard, M.E.; Hrdlicka, P.J. Pyrene-functionalized oligonucleotides and locked nucleic acids (LNAs): Tools for fundamental research, diagnostics, and nanotechnology. Chem. Soc. Rev. 2011, 40, 5771–5788. [Google Scholar] [CrossRef]
- Mukherjee, S.; Das Sarma, J.; Shunmugam, R. pH-Sensitive Nanoaggregates for Site-Specific Drug-Delivery as Well as Cancer Cell Imaging. ACS Omega 2016, 1, 755–764. [Google Scholar] [CrossRef] [PubMed]
- Ban, Ž.; Žinić, B.; Matković, M.; Tomašić Paić, A.; Crnolatac, I.; Piantanida, I. Pyrrolocytosine-pyrene conjugates as fluorescent and CD probes for a fine sensing of ds- polynucleotide secondary structure and specific recognition of poly G. New J. Chem. 2019, 43, 8204–8214. [Google Scholar] [CrossRef]
- Astakhova, I.V.; Korshun, V.A.; Wengel, J. Highly Fluorescent Conjugated Pyrenes in Nucleic Acid Probes: (Phenylethynyl) pyrenecarbonyl-Functionalized Locked Nucleic Acids. Chem. Eur. J. 2008, 14, 11010–11026. [Google Scholar] [CrossRef] [PubMed]
- Banik, B.K.; Becker, F.F. Synthesis, electrophilic substitution and structure-activity relationship studies of polycyclicaromatic compounds towards the development of anticancer agents. Curr. Med. Chem. 2001, 12, 1513–1533. [Google Scholar] [CrossRef]
- Kanamori, T.; Matsuyama, A.; Naito, H.; Tsuga, Y.; Ozako, Y.; Ogura, S.; Okazaki, S.; Yuasa, H. Water-Soluble Glucosyl Pyrene Photosensitizers: An Intramolecularly Synthesized 2-C-Glucoside and an O-Glucoside. J. Org. Chem. 2018, 83, 13765–13775. [Google Scholar] [CrossRef] [PubMed]
- Yang, Y.; Wang, L.; Cao, H.Q.; Li, Q.; Li, Y.; Han, M.J.; Wang, H.; Li, J.B. Photodynamic Therapy with Liposomes Encapsulating Photosensitizers with Aggregation-Induced Emission. Nano Lett. 2019, 19, 1821–1826. [Google Scholar] [CrossRef]
- Dobos, A.; Steiger, W.; Theiner, D.; Gruber, P.; Lunzer, M.; Van Hoorick, J.; Van Vlierberghe, S.; Ovsianikov, A. Screening of two-photon activated photodynamic therapy sensitizers using a 3D osteosarcoma model. Analyst 2019, 144, 3056–3063. [Google Scholar] [CrossRef]
- Bolze, F.; Jenni, S.; Sour, A.; Heitz, V. Molecular photosensitisers for two-photon photodynamic therapy. Chem. Commun. 2017, 53, 12857–12877. [Google Scholar] [CrossRef]
- Sun, B.B.; Wang, L.; Li, Q.; He, P.P.; Liu, H.L.; Wang, H.; Yang, Y.; Li, J.B. Bis(pyrene)-Doped Cationic Dipeptide Nanoparticles for Two-Photon-Activated Photodynamic Therapy. Biomacromolecules 2017, 18, 3506–3513. [Google Scholar] [CrossRef]
- Cantor, C.R.; Schimmel, P.R. Biophysical Chemistry; WH Freeman and Co.: San Francisco, CA, USA, 1980; Volume 3, pp. 1109–1181. [Google Scholar]
- Parish, J.H. Principles of Nucleic Acid Structure: By W Saenger. pp 556. Springer-Verlag, New York. 1984. ISBN 3-540-90761-0. Biochem. Educ. 1985, 13, 92. [Google Scholar] [CrossRef]
- Demeunynck, M.; Bailly, C.; Wilson, W.D. Small Molecule DNA and RNA Binders: From Synthesis to Nucleic Acid Complexes; Wiley-VCH Verlag GmbH & Co. KGaA: Weinheim, Germany, 2004. [Google Scholar]
- Chaires, J.B.; Dattagupta, N.; Crothers, D.M. Studies on interaction of anthracycline antibiotics and deoxyribonucleic acid: Equilibrium binding studies on interaction of daunomycin with deoxyribonucleic acid. Biochemistry 1982, 21, 3933–3940. [Google Scholar] [CrossRef] [PubMed]
- Pal, M.K.; Ghosh, J.K. Spectroscopic Probe of the Competitive-Binding of Ethidium-Bromide and Neomycin to DNA. Spectrochim. Acta A 1995, 51, 489–498. [Google Scholar] [CrossRef]
- McGhee, J.D.; Von Hippel, P.H. Theoretical aspects of DNA-protein interactions: Co-operative and non-co-operative binding of large ligands to a one-dimensional homogeneous lattice. J. Mol. Biol. 1974, 86, 469–489. [Google Scholar] [CrossRef]
- Mergny, J.-L.; Lacroix, L. Analysis of Thermal Melting Curves. Oligonucleotides 2003, 13, 515–537. [Google Scholar] [CrossRef]
- Mosmann, T. Rapid colorimetric assay for cellular growth and survival: Application to proliferation and cytotoxicity assays. J. Immunol. Methods 1983, 65, 55–63. [Google Scholar] [CrossRef]
- Reed, L.J.; Muench, H. A simple method of estimating fifty percent endpoints. Am. J. Epidemiol. 1938, 27, 493–497. [Google Scholar] [CrossRef]
- Duhamel, J.; Winnik, M.A.; Baros, F.; Andre, J.C.; Martinho, J.M.G. Diffusion Effects on Pyrene Excimer Kinetics—Determination of the Excimer Formation Rate Coefficient Time-Dependence. J. Phys. Chem. 1992, 96, 9805–9810. [Google Scholar] [CrossRef]
- Duhamel, J. New Insights in the Study of Pyrene Excimer Fluorescence to Characterize Macromolecules and their Supramolecular Assemblies in Solution. Langmuir 2012, 28, 6527–6538. [Google Scholar] [CrossRef]
- Gröger, K.; Baretić, D.; Piantanida, I.; Marjanović, M.; Kralj, M.; Grabar, M.; Tomić, S.; Schmuck, C. Guanidiniocarbonyl-pyrrole-aryl conjugates as nucleic acid sensors: Switch of binding mode and spectroscopic responses by introducing additional binding sites into the linker. Org. Biomol. Chem. 2011, 9, 198–209. [Google Scholar] [CrossRef]
- Sedgwick, A.C.; Brewster, J.T.; Wu, T.H.; Feng, X.; Bull, S.D.; Qian, X.H.; Sessler, J.L.; James, T.D.; Anslyn, E.V.; Sun, X.L. Indicator displacement assays (IDAs): The past, present and future. Chem. Soc. Rev. 2021, 50, 9–38. [Google Scholar] [CrossRef]
- Palchaudhuri, R.; Hergenrother, P.U. DNA as a target for anticancer compounds: Methods to determine the mode of binding and the mechanism of action. Curr. Opin. Biotechnol. 2007, 18, 497–503. [Google Scholar] [CrossRef] [PubMed]
- Tse, W.C.; Boger, D.L. A fluorescent intercalator displacement (FID) assay for establishing DNA binding selectivity and affinity. Acc. Chem. Res. 2004, 37, 61–69. [Google Scholar] [CrossRef] [PubMed]
- Eriksson, M.; Nordén, B. Linear and Circular Dichroism of Drug-Nucleic Acid Complexes. Meth. Enzymol. 2001, 340, 68–98. [Google Scholar]
- Garbett, N.C.; Ragazzon, P.A.; Chaires, J.B. Circular dichroism to determine binding mode and affinity of ligand–DNA interactions. Nat. Prot. 2007, 2, 3166–3172. [Google Scholar] [CrossRef] [PubMed]
- Zeman, S.M.; Crothers, D.M. Simultaneous measurement of binding constants and unwinding angles by gel electrophoresis. Methods Enzymol. 2001, 340, 51–68. [Google Scholar] [CrossRef] [PubMed]
- Juan, C.A.; de la Lastra, J.M.P.; Plou, F.J.; Pérez-Lebeña, E. The Chemistry of Reactive Oxygen Species (ROS) Revisited: Outlining Their Role in Biological Macromolecules (DNA, Lipids and Proteins) and Induced Pathologies. Int. J. Mol. Sci. 2021, 22, 4642. [Google Scholar] [CrossRef]
- Ortolan, T.G.; Menck, C.F.M. UVB-Induced Cell Death Signaling Is Associated with G1-S Progression and Transcription Inhibition in Primary Human Fibroblasts. PLoS ONE 2013, 8, e76936. [Google Scholar] [CrossRef]
- Xie, D.; Sun, Y.; Wang, L.Z.; Li, X.L.; Zang, C.N.; Zhi, Y.L.; Sun, L.R. Ultraviolet light-emitting diode irradiation-induced cell death in HL-60 human leukemia cells in vitro. Mol. Med. Rep. 2016, 13, 2506–2510. [Google Scholar] [CrossRef]
- Park, W.H. Hydrogen peroxide inhibits the growth of lung cancer cells via the induction of cell death and G1-phase arrest. Oncol. Rep. 2018, 40, 1787–1794. [Google Scholar] [CrossRef]
- Stasiak, A.C.; Stehle, T. Human adenovirus binding to host cell receptors: A structural view. Med. Microbiol. Immun. 2020, 209, 325–333. [Google Scholar] [CrossRef] [PubMed]
- Sun, Y.; Shi, Z.; Lin, Y.; Zhang, M.; Liu, J.; Zhu, L.; Chen, Q.; Bi, J.; Li, S.; Ni, Z.; et al. Benzo(a)pyrene induces MUC5AC expression through the AhR/mitochondrial ROS/ERK pathway in airway epithelial cells. Ecotoxicol. Environ. Saf. 2021, 210, 111857. [Google Scholar] [CrossRef] [PubMed]
- Kang, R.-R.; Sun, Q.; Chen, K.-G.; Cao, Q.-T.; Liu, C.; Liu, K.; Ma, Z.; Deng, Y.; Liu, W.; Xu, B. Resveratrol prevents benzo(a)pyrene-induced disruption of mitochondrial homeostasis via the AMPK signaling pathway in primary cultured neurons. Environ. Pollut. 2020, 261, 114207. [Google Scholar] [CrossRef] [PubMed]


| Solvent | ε/M−1 cm−1 | aΦf | b λexc/nm | b λem/nm | /ns b | χ2 |
|---|---|---|---|---|---|---|
| EtOH (400 nm) | 0.71 ± 0.05 | 340 | 400 | 5.54 (62%) 22.29 (38%) | 1.094 | |
| EtOH (486 nm) | 340 | 486 | 4.22 (−B d) 44.76 (−B d) | 1.032 | ||
| DMSO | c | 340 | 486 | 41.00 (76%) 59.19 (24%) | 1.093 | |
| buffer | 3.88 ± 0.11× 10⁴ | 0.13 ± 0.05 | 340 | 486 | 3.84 (−B d) 21.00 (−B d) | 1.150 |
| PyrBZ buffer | 6.26 ± 0.12 × 10⁴ | 0.15 ± 0.02 | 340 | 400 | 2.5 (<1%) 100.3 (99.2%) | 1.060 |
| r | AT-DNA | pApU | |
|---|---|---|---|
| TAL3PYR | 0.05 | 22.8 | 1.7 |
| 0.1 | 24.7 | 3.7 |
| Compound | Method | AT-DNA | GC-DNA | AU-RNA | ct-DNA |
|---|---|---|---|---|---|
| TAL3PYR | CD titration | 6.4 | 6.4 | 6.5 | 6.0 (6) b |
| TAL3PYR | c IDA50% | 6.4 | 6.0 | 6.3 | 6.5 |
| d L1 | d ITC | d 7.0 | d 8.2 | d 7.1 | - |
| e BFTA | e Fluorimetric titration | - | - | e 5.0 | e 5.8 |
Disclaimer/Publisher’s Note: The statements, opinions and data contained in all publications are solely those of the individual author(s) and contributor(s) and not of MDPI and/or the editor(s). MDPI and/or the editor(s) disclaim responsibility for any injury to people or property resulting from any ideas, methods, instructions or products referred to in the content. |
© 2023 by the authors. Licensee MDPI, Basel, Switzerland. This article is an open access article distributed under the terms and conditions of the Creative Commons Attribution (CC BY) license (https://creativecommons.org/licenses/by/4.0/).
Share and Cite
Jurković, M.; Radić Stojković, M.; Božinović, K.; Nestić, D.; Majhen, D.; Delgado-Pinar, E.; Inclán, M.; García-España, E.; Piantanida, I. Novel Tripodal Polyamine Tris-Pyrene: DNA/RNA Binding and Photodynamic Antiproliferative Activity. Pharmaceutics 2023, 15, 2197. https://doi.org/10.3390/pharmaceutics15092197
Jurković M, Radić Stojković M, Božinović K, Nestić D, Majhen D, Delgado-Pinar E, Inclán M, García-España E, Piantanida I. Novel Tripodal Polyamine Tris-Pyrene: DNA/RNA Binding and Photodynamic Antiproliferative Activity. Pharmaceutics. 2023; 15(9):2197. https://doi.org/10.3390/pharmaceutics15092197
Chicago/Turabian StyleJurković, Marta, Marijana Radić Stojković, Ksenija Božinović, Davor Nestić, Dragomira Majhen, Estefanía Delgado-Pinar, Mario Inclán, Enrique García-España, and Ivo Piantanida. 2023. "Novel Tripodal Polyamine Tris-Pyrene: DNA/RNA Binding and Photodynamic Antiproliferative Activity" Pharmaceutics 15, no. 9: 2197. https://doi.org/10.3390/pharmaceutics15092197