
What We Learned about the Feasibility of Gene Electrotransfer for Vaccination on a Model of COVID-19 Vaccine

 , , , , ,
Abstract
:1. Introduction
2. Materials and Methods
2.1. Plasmids
2.2. Cell Lines
2.3. In Vitro GET
2.4. In Vitro Collection of Samples for mRNA and Protein Analysis
2.5. Animals
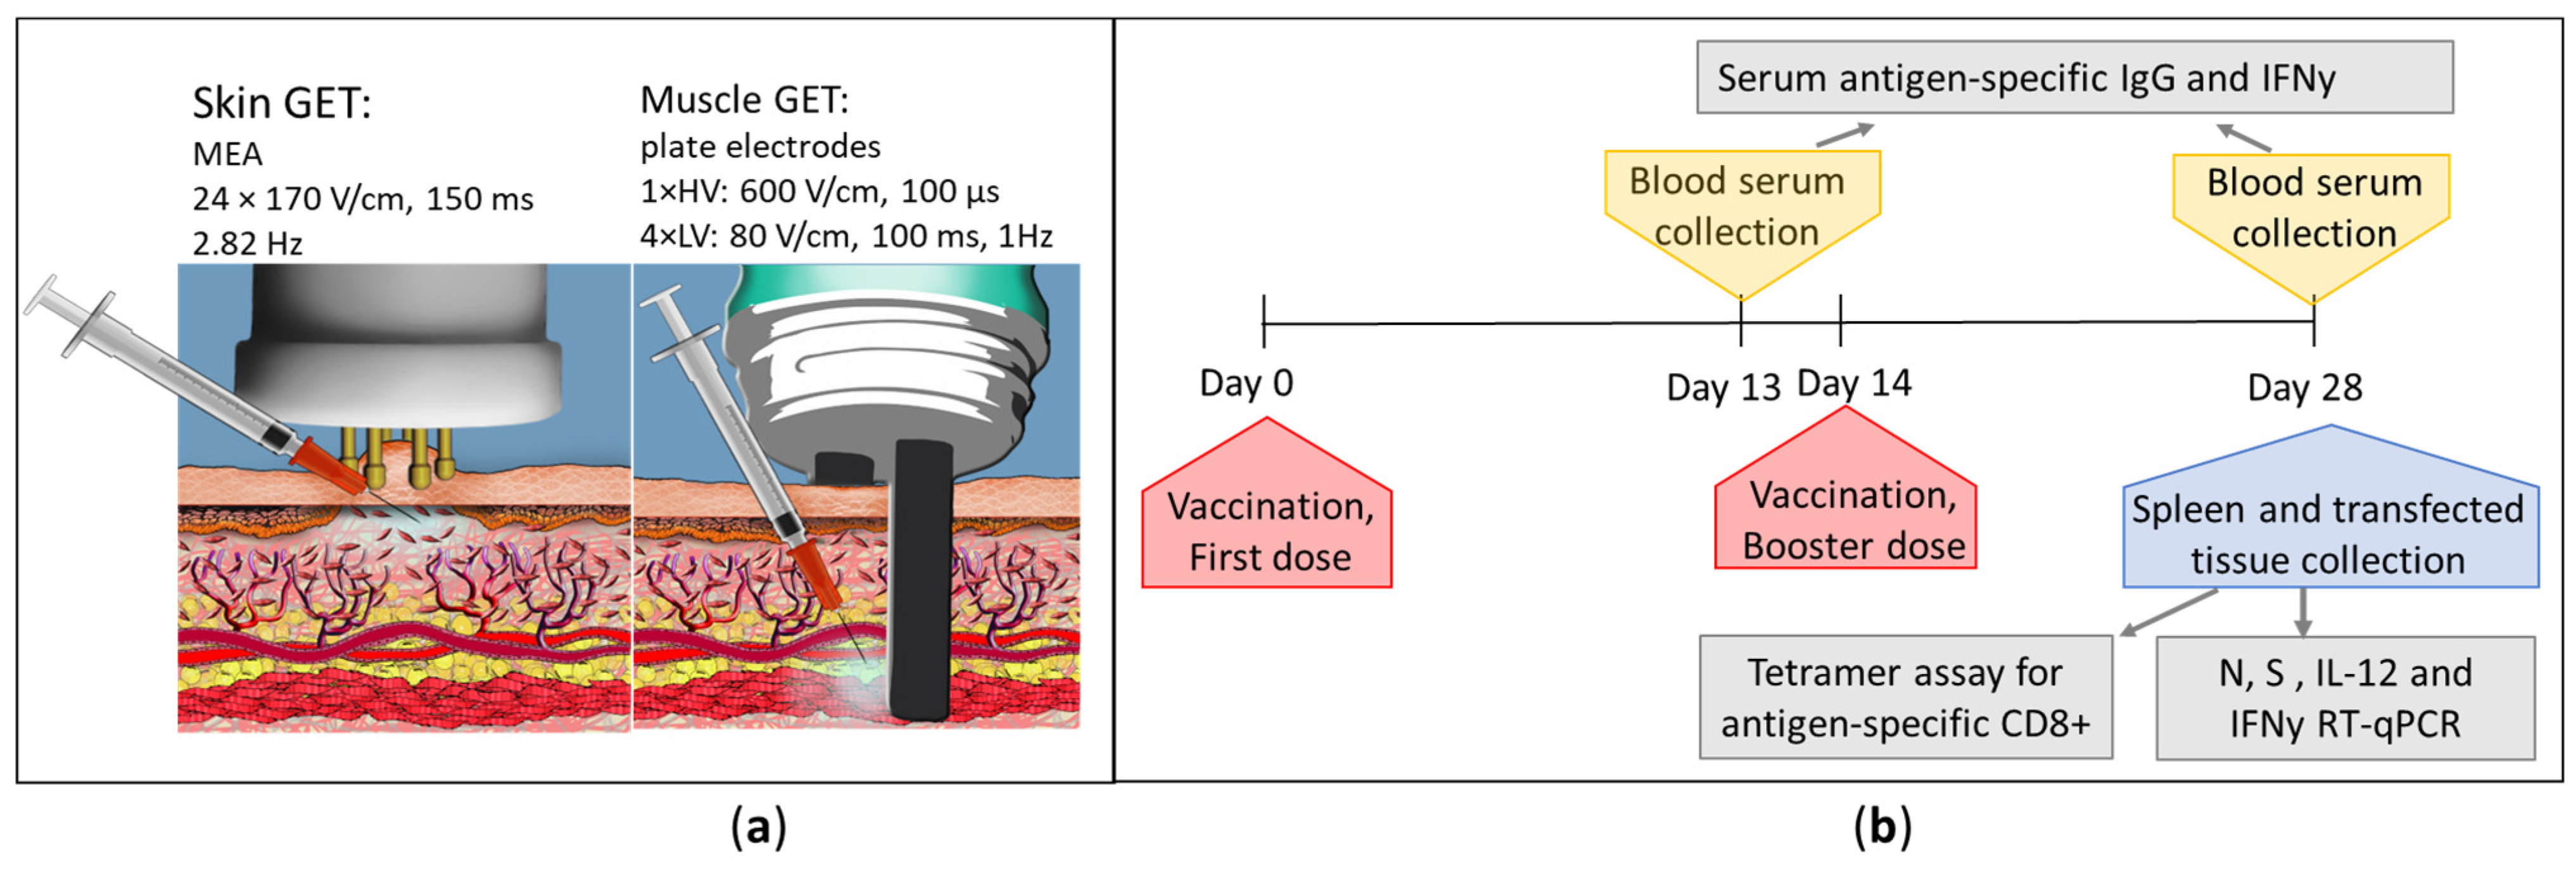
2.6. In Vivo GET
2.7. In Vivo Sample Collection
2.8. RNA Isolation and Reverse Transcription
2.9. qRT-PCR
2.10. ELISA
2.11. Histological Analysis
2.12. Tetramer Assay
2.13. Statistical Analysis
3. Results
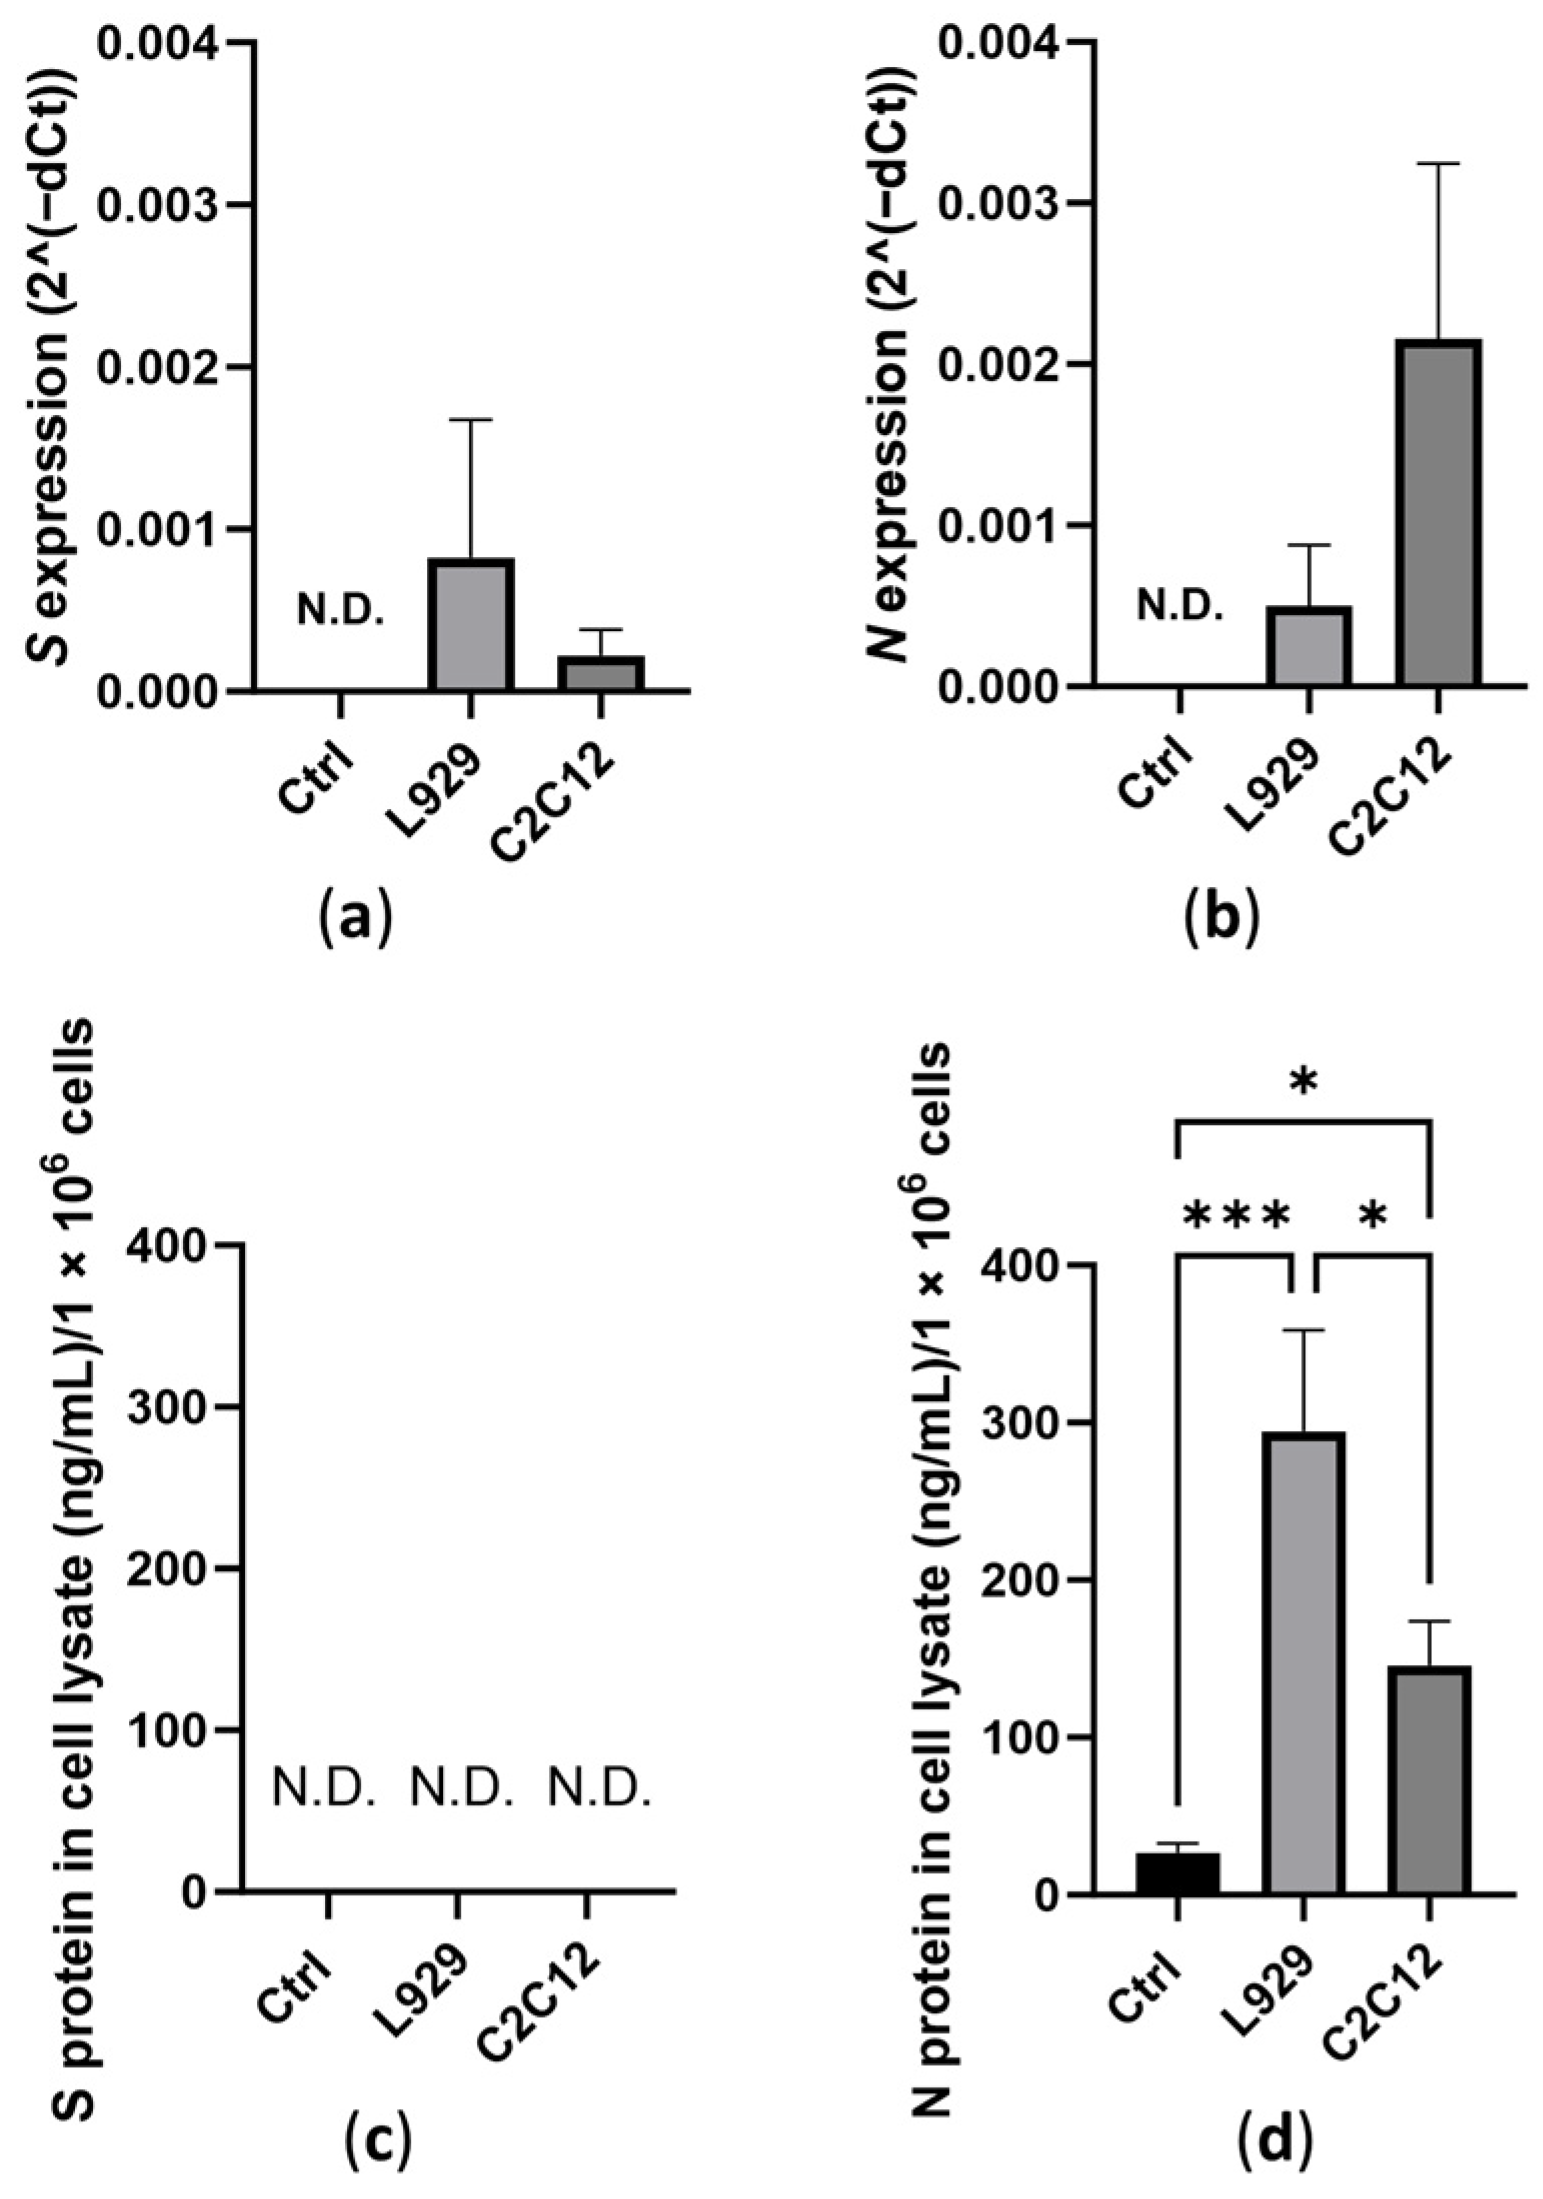
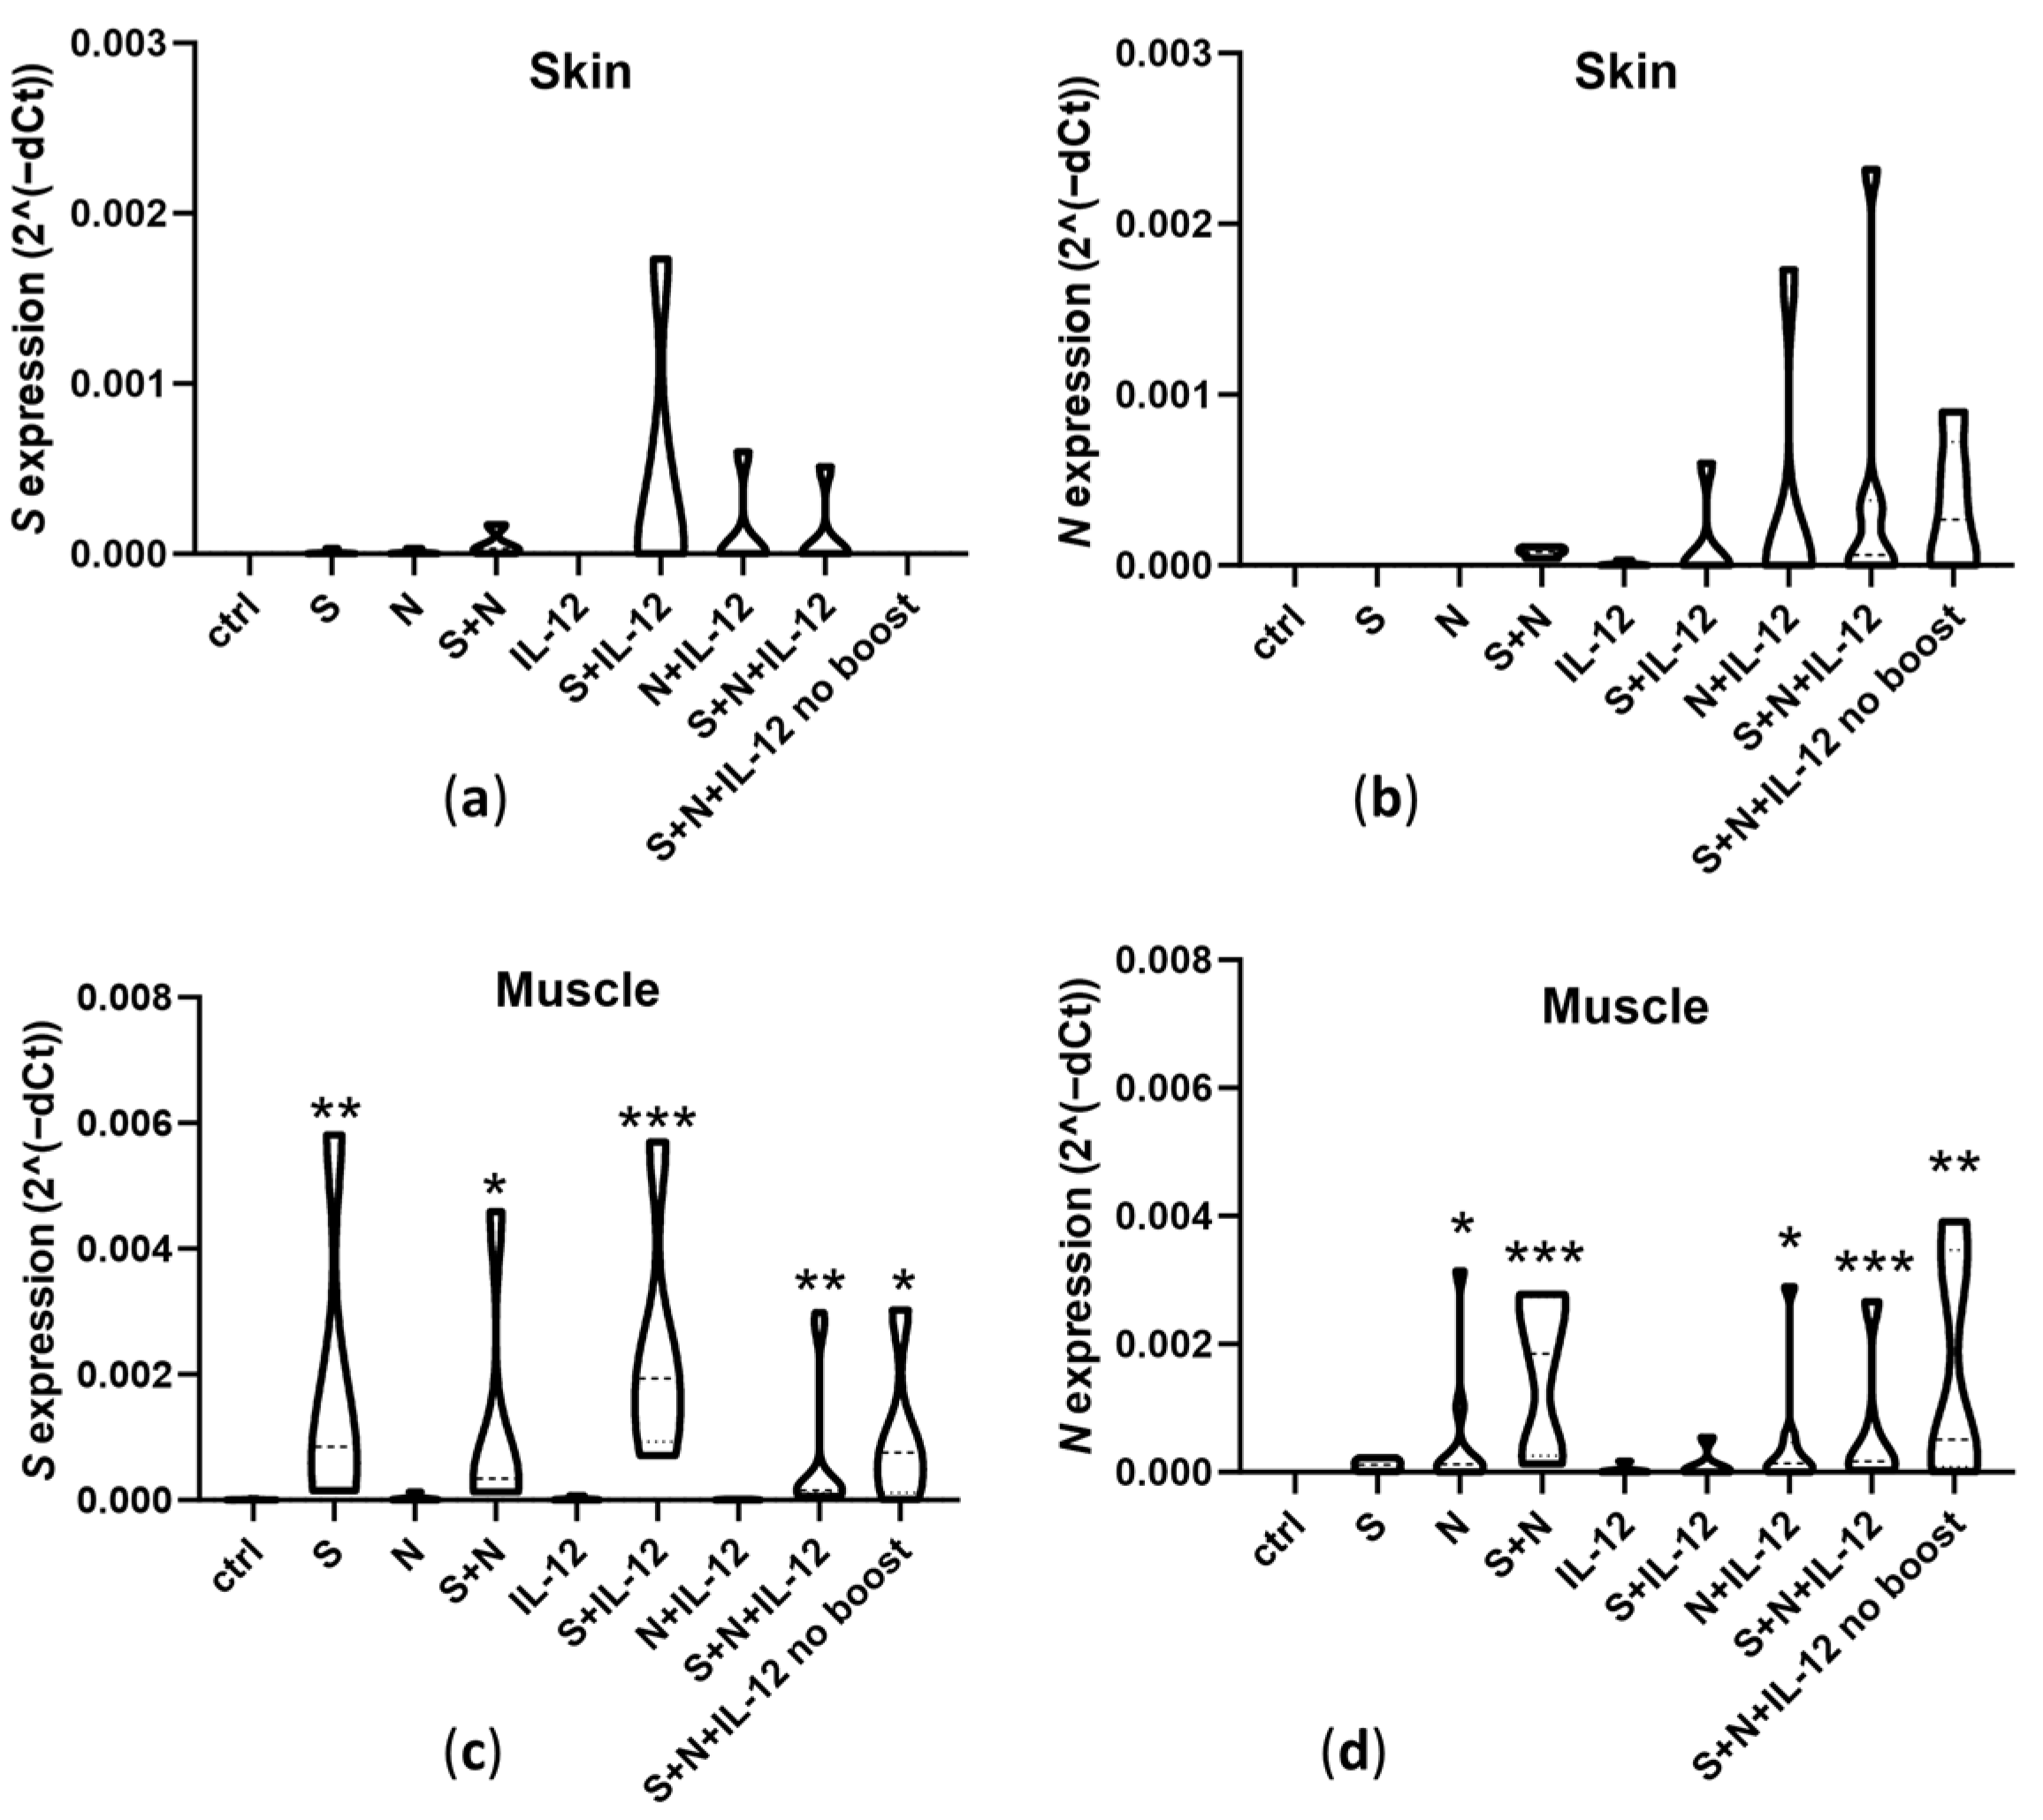
3.1. Expression of Transfected Antigens
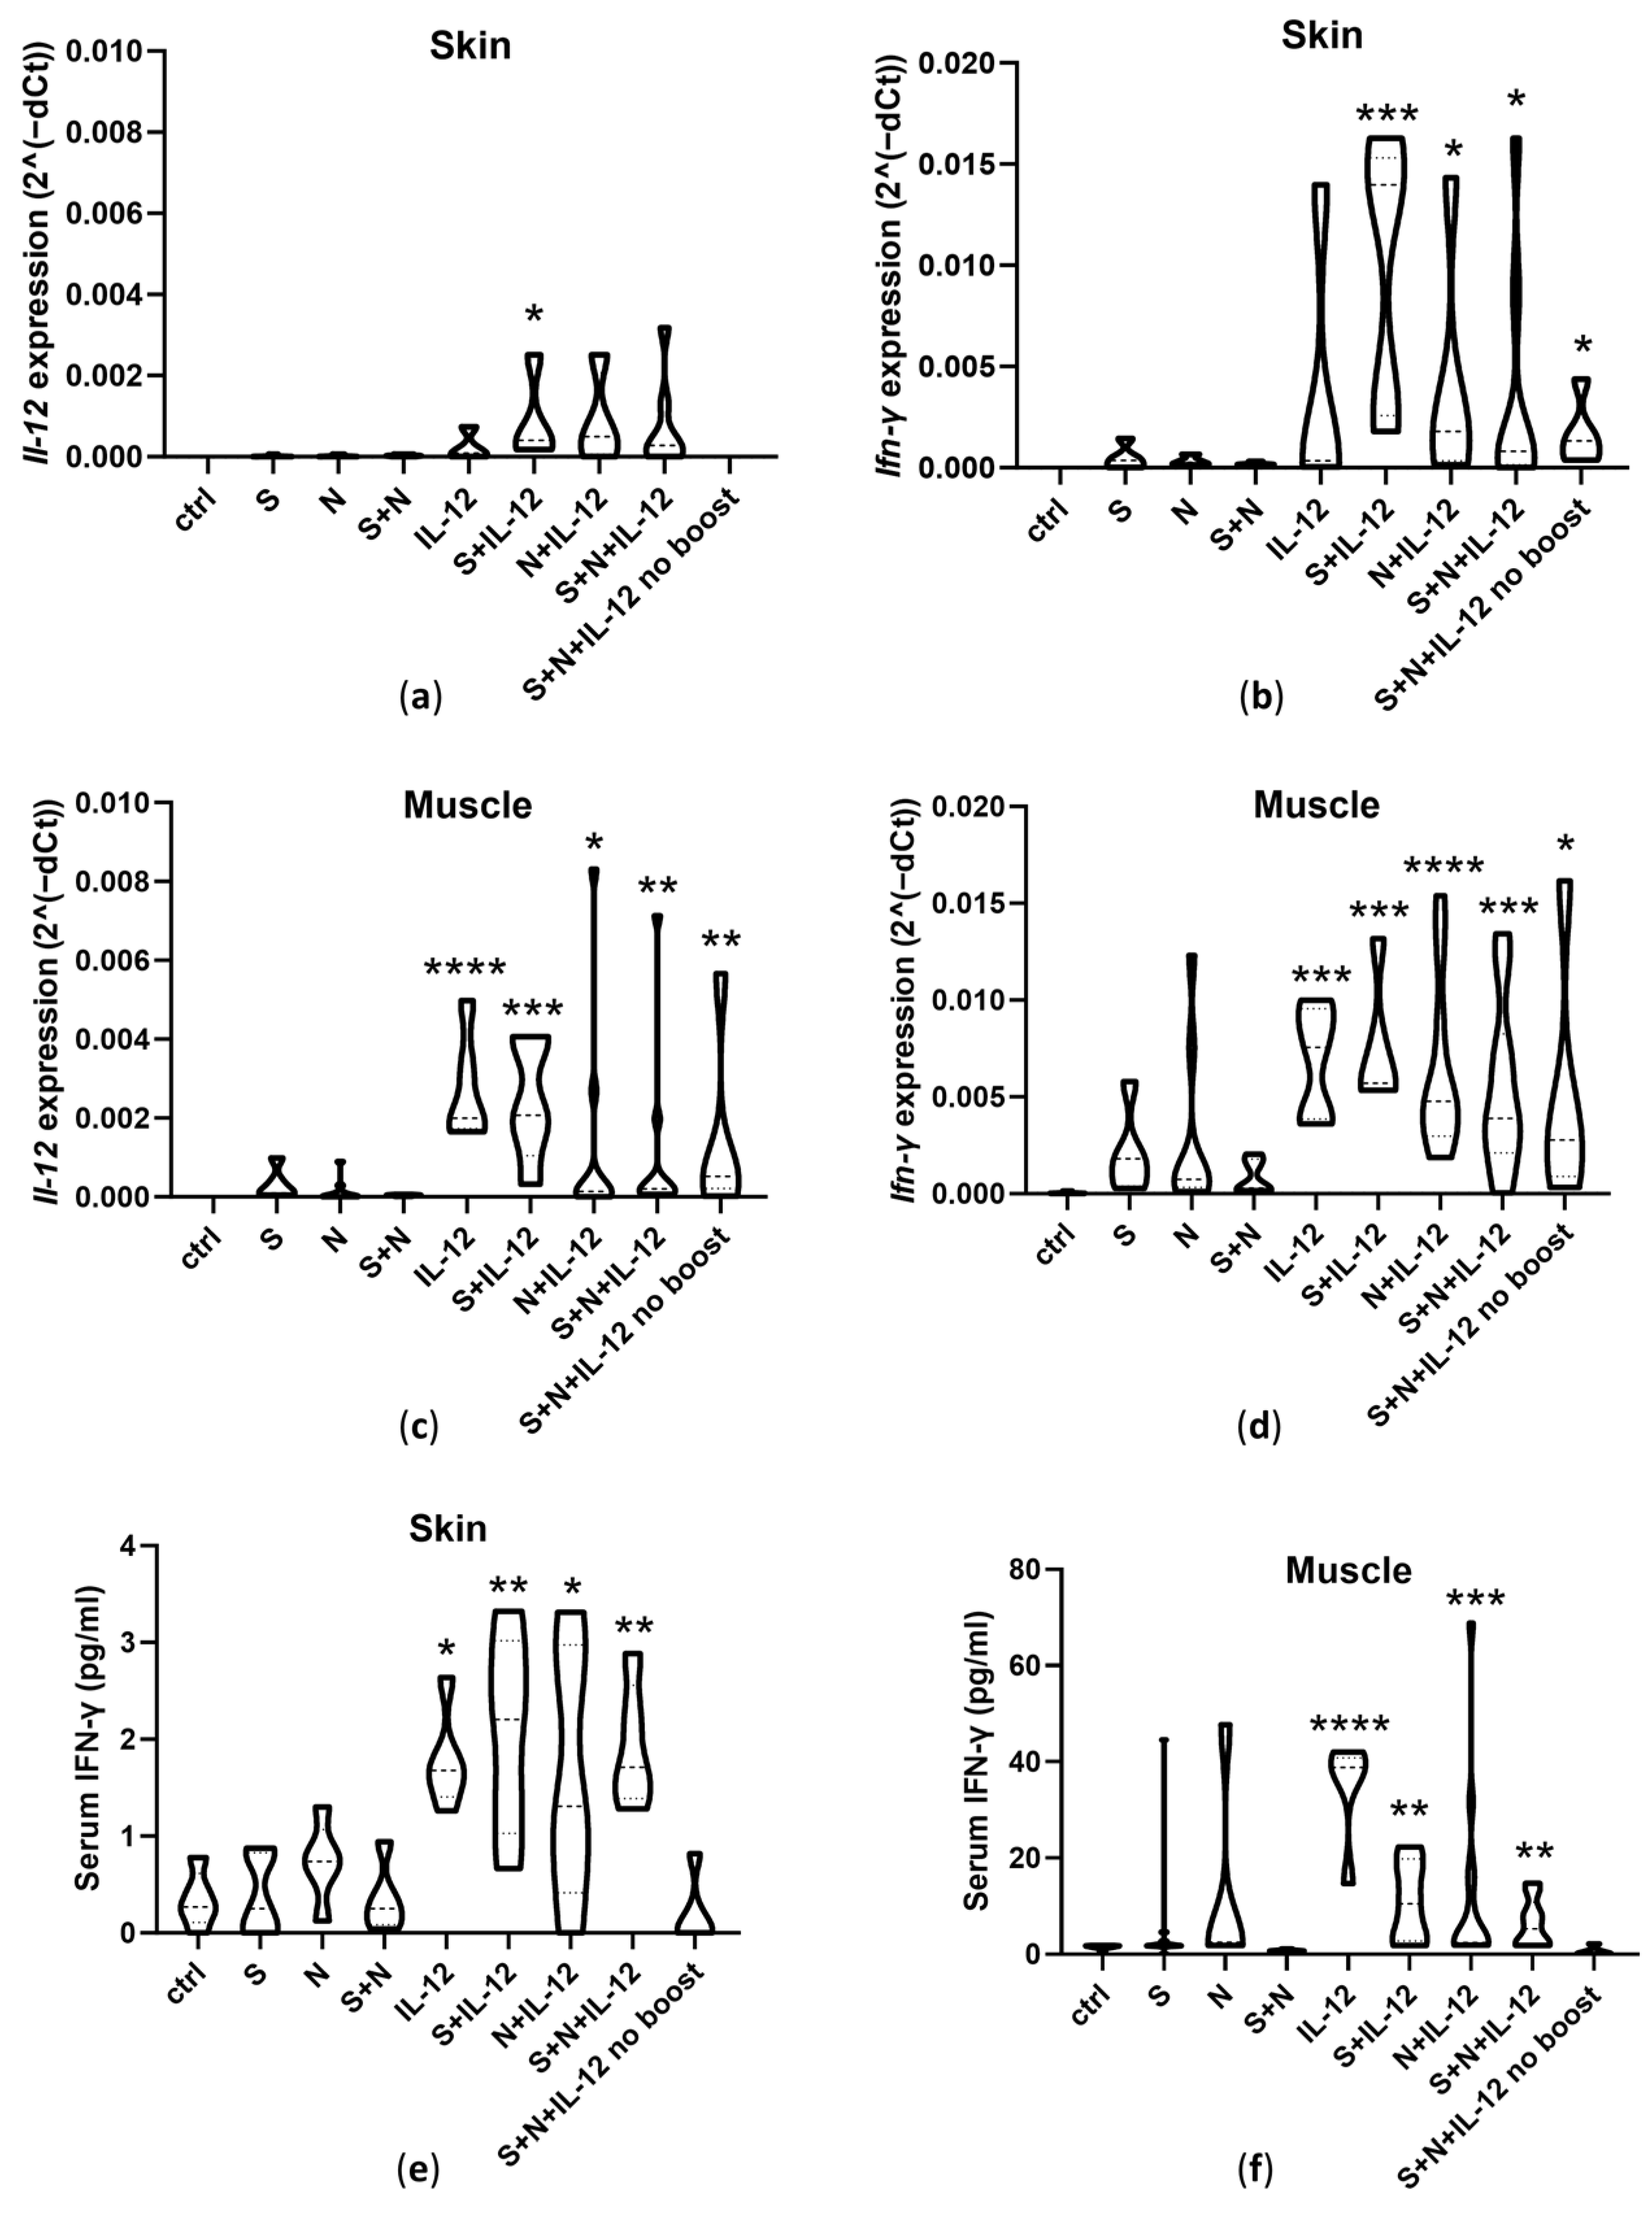
3.2. Expression of Il-12 and Ifn-γ and Serum IFN-γ Concentrations
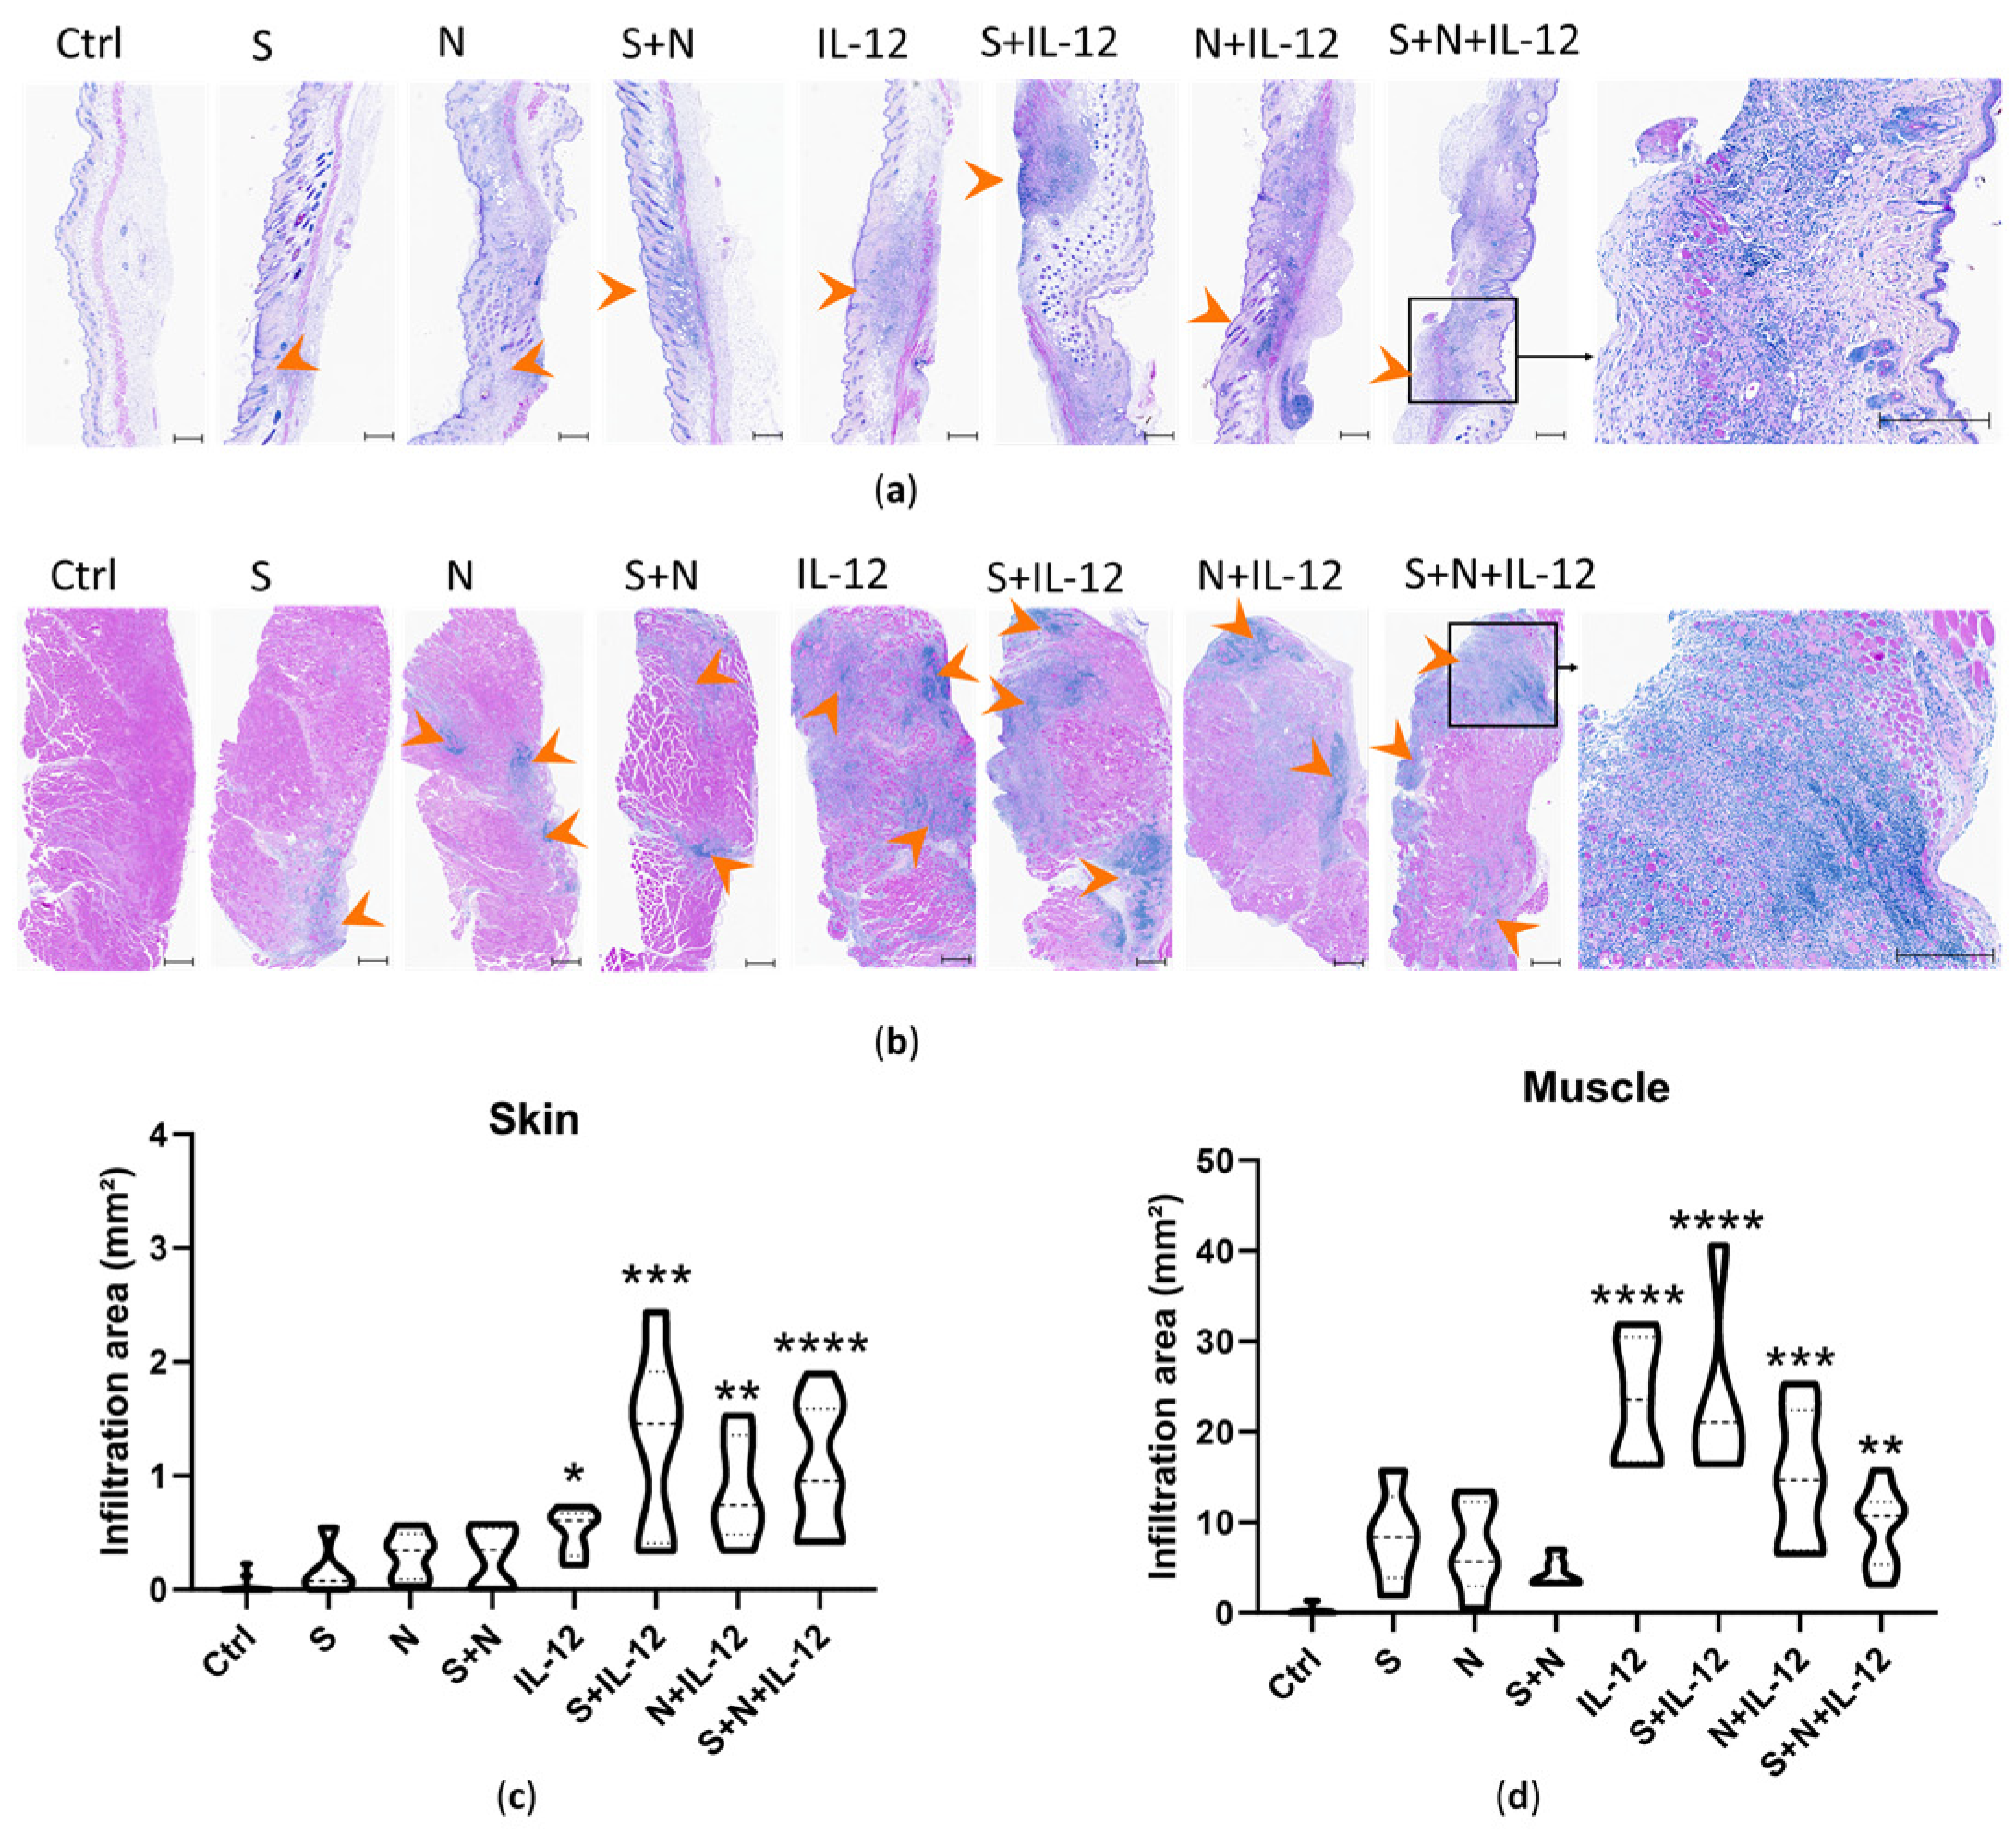
3.3. Histopathological Changes at the Vaccination Site and Mice Well-Being
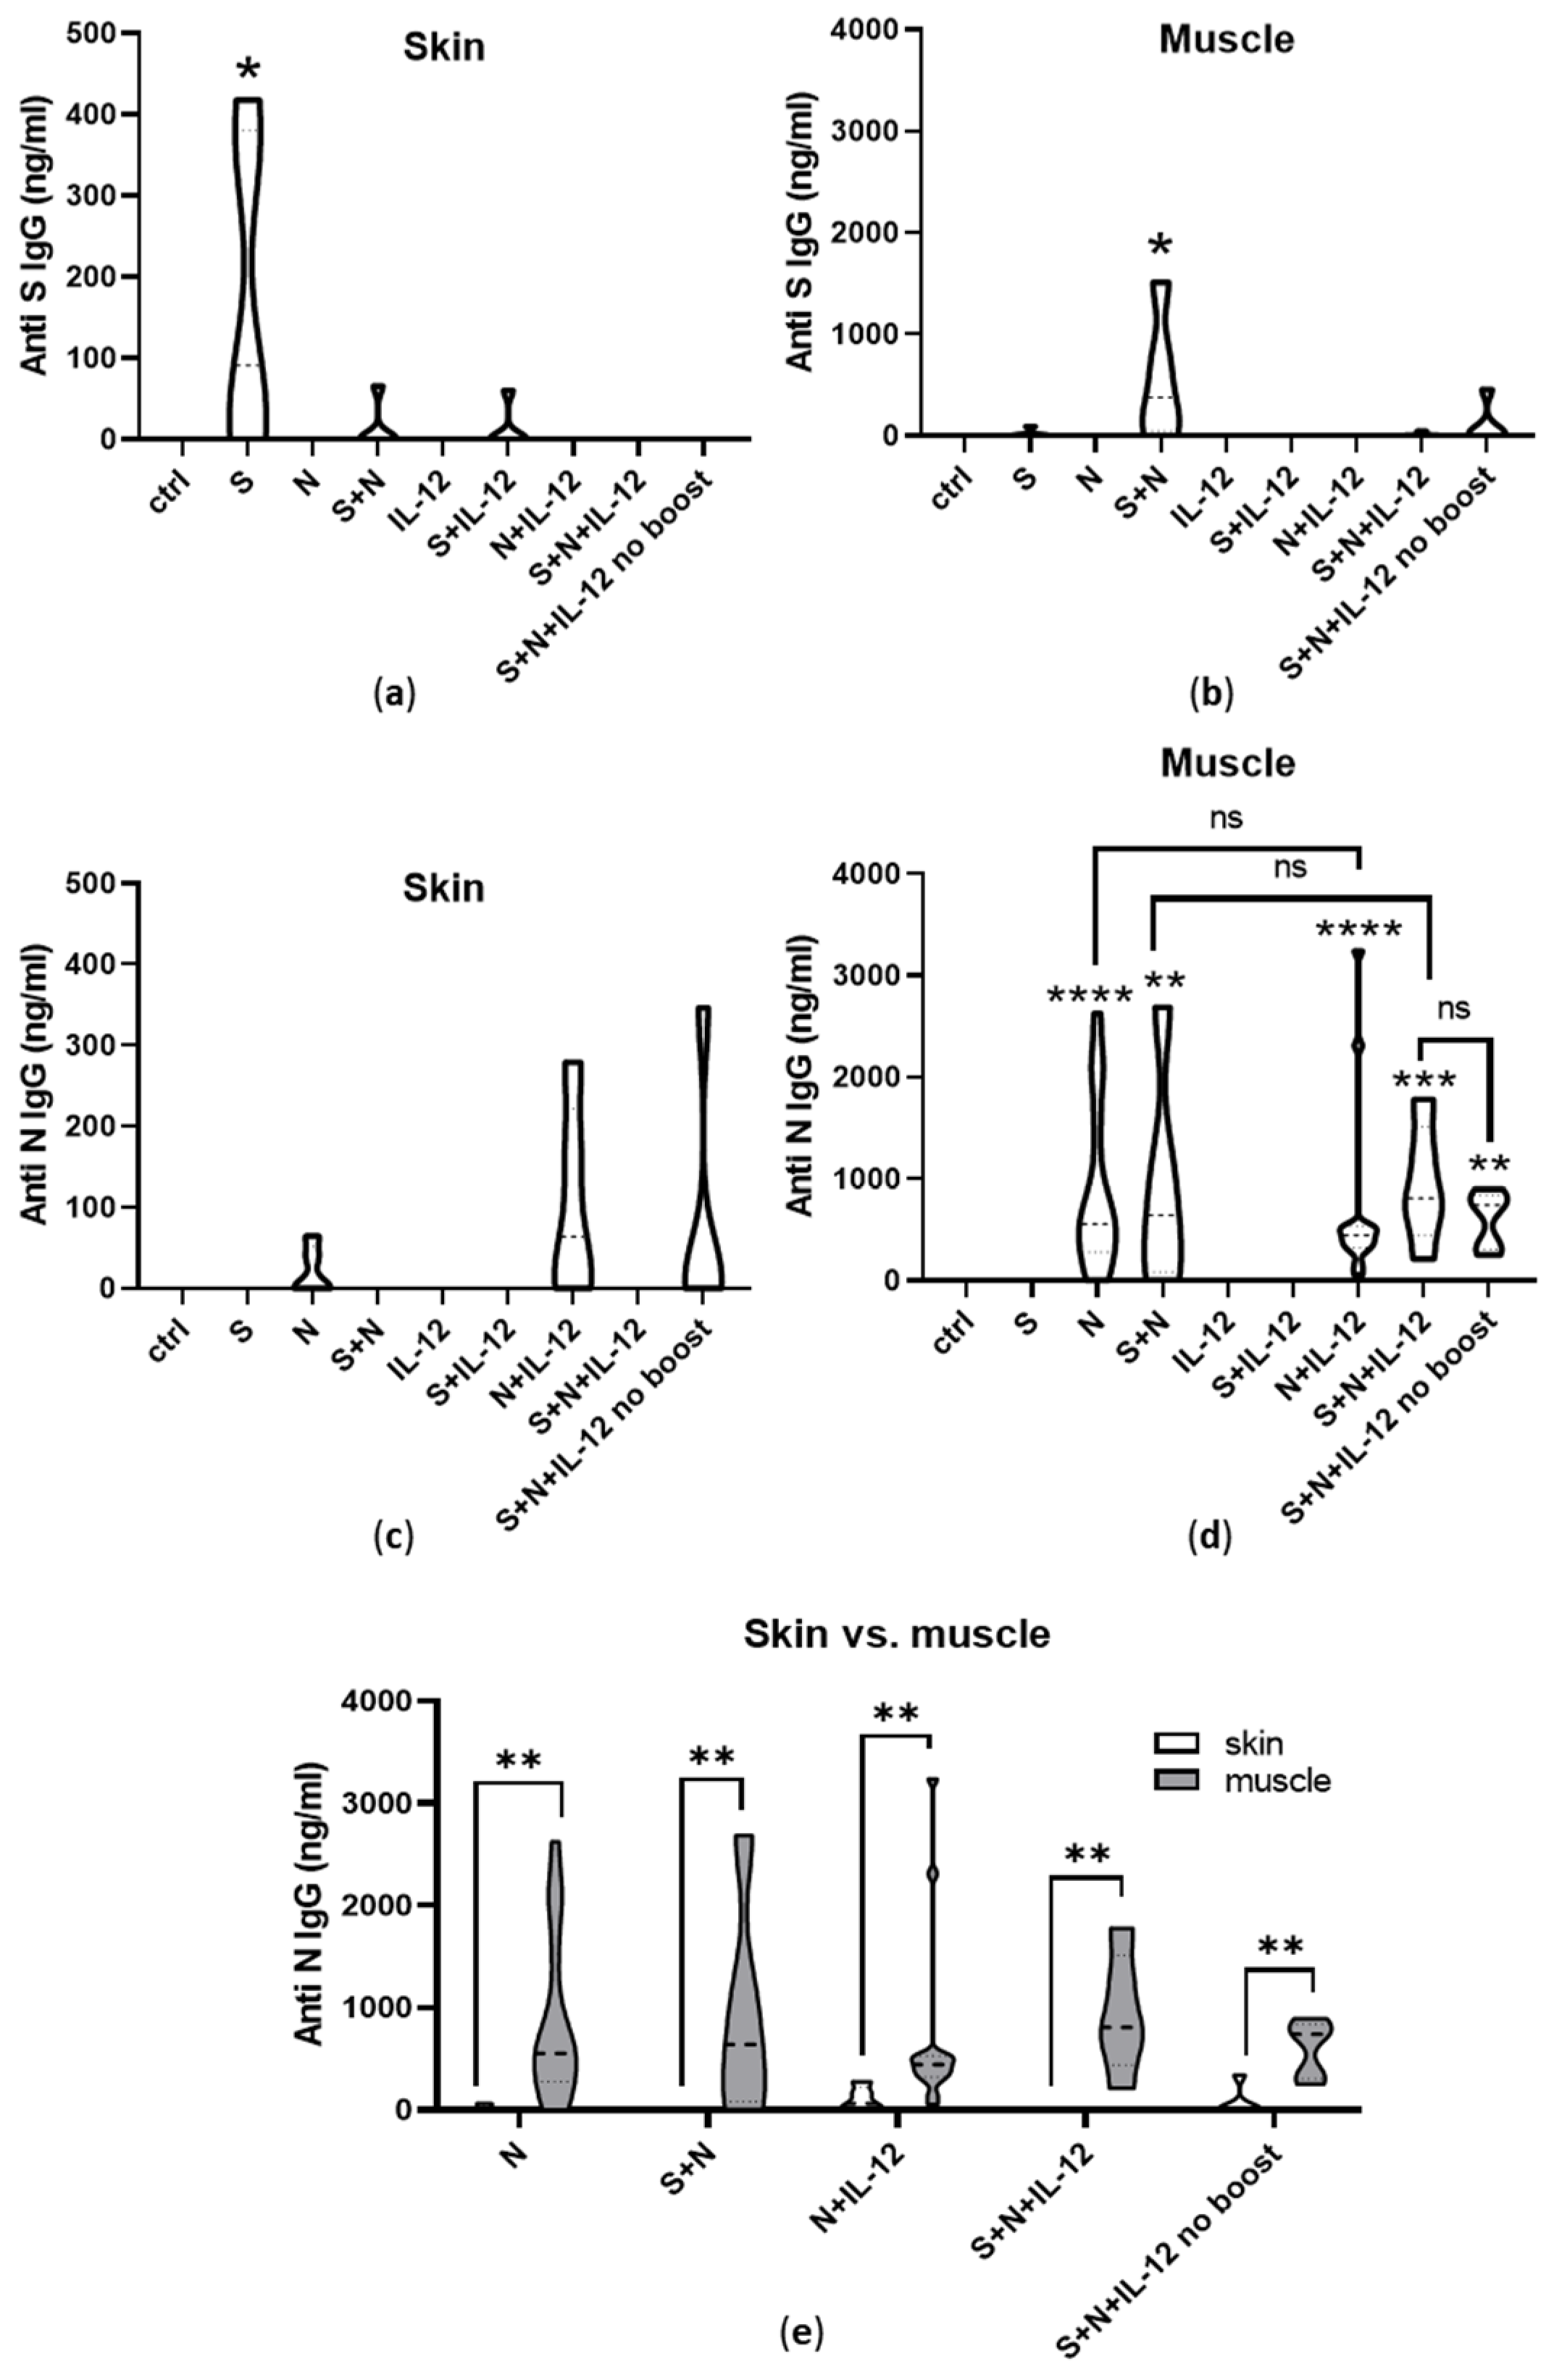
3.4. Induction of Humoral Immunity
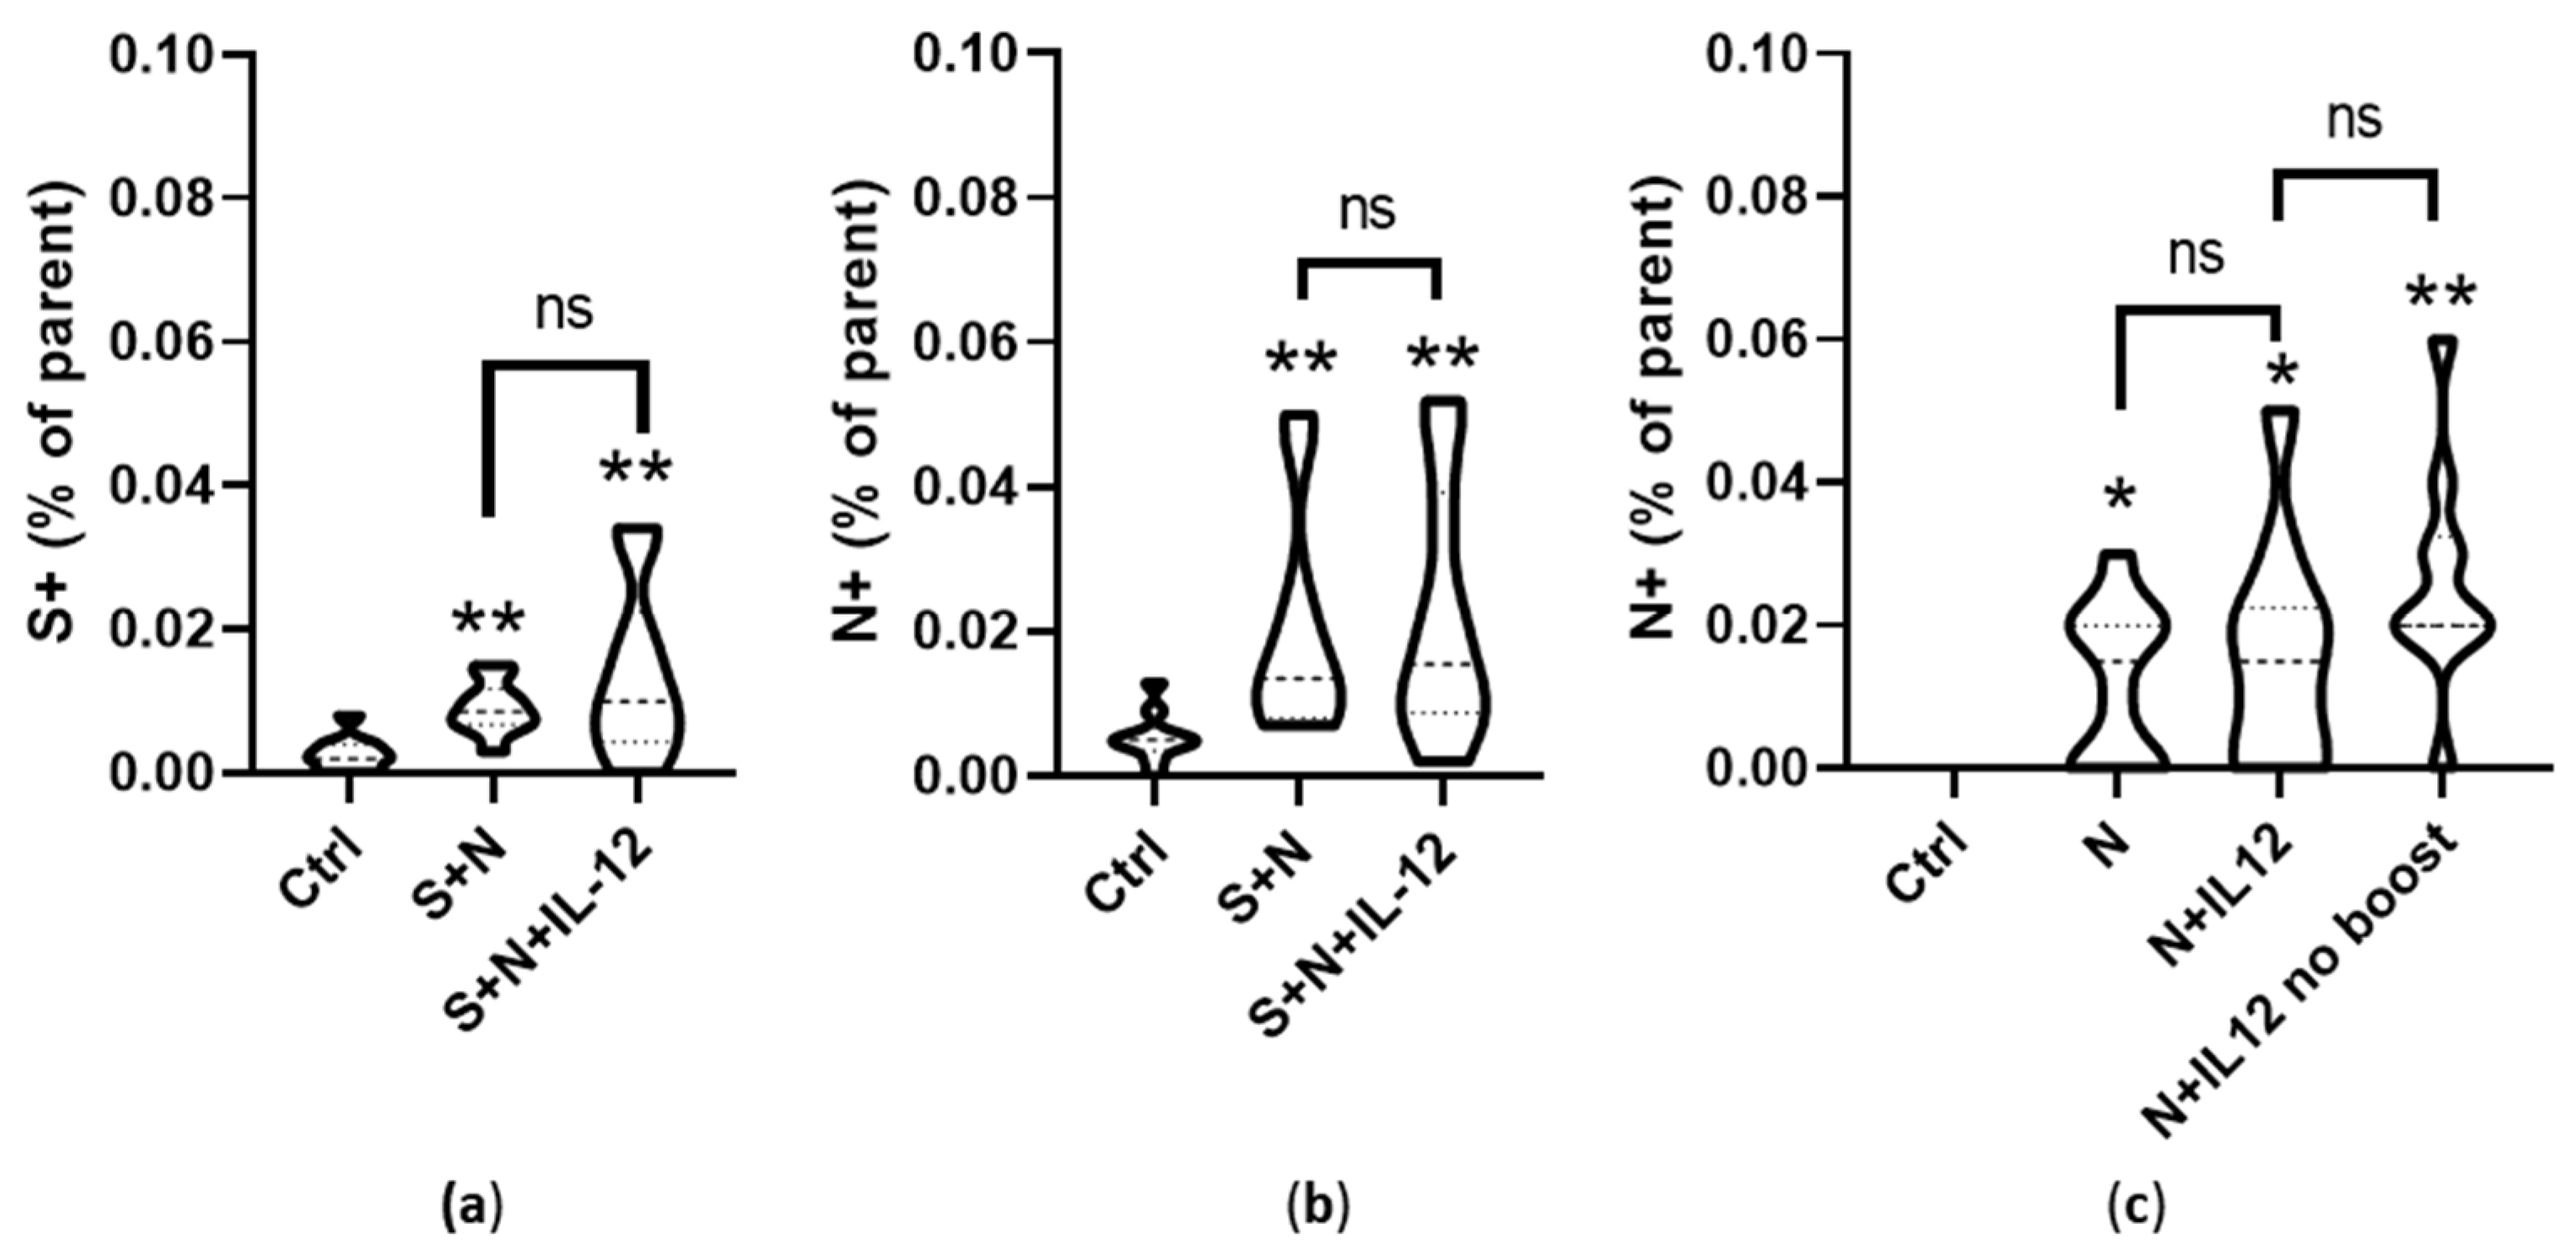
3.5. Induction of Cell-Mediated Immunity
4. Discussion
5. Conclusions
Supplementary Materials
Author Contributions
Funding
Institutional Review Board Statement
Informed Consent Statement
Data Availability Statement
Acknowledgments
Conflicts of Interest
References
- Hobernik, D.; Bros, M. DNA Vaccines—How Far From Clinical Use? Int. J. Mol. Sci. 2018, 19, 3605. [Google Scholar] [CrossRef] [PubMed] [Green Version]
- Kutzler, M.A.; Weiner, D.B. DNA vaccines: Ready for prime time? Nat. Rev. Genet. 2008, 9, 776–788. [Google Scholar] [CrossRef] [PubMed]
- Gary, E.N.; Weiner, D.B. DNA vaccines: Prime time is now. Curr. Opin. Immunol. 2020, 65, 21–27. [Google Scholar] [CrossRef] [PubMed]
- Villarreal, D.O.; Talbott, K.T.; Choo, D.K.; Shedlock, D.J.; Weiner, D.B. Synthetic DNA vaccine strategies against persistent viral infections. Expert Rev. Vaccines 2013, 12, 537. [Google Scholar] [CrossRef] [Green Version]
- Liu, M.A. A Comparison of Plasmid DNA and mRNA as Vaccine Technologies. Vaccines 2019, 7, 37. [Google Scholar] [CrossRef] [PubMed] [Green Version]
- Shafaati, M.; Saidijam, M.; Soleimani, M.; Hazrati, F.; Mirzaei, R.; Amirheidari, B.; Tanzadehpanah, H.; Karampoor, S.; Kazemi, S.; Yavari, B.; et al. A brief review on DNA vaccines in the era of COVID-19. Future Virol. 2021, 17, 49–66. [Google Scholar] [CrossRef]
- Rosa, S.S.; Prazeres, D.M.F.; Azevedo, A.M.; Marques, M.P.C. mRNA vaccines manufacturing: Challenges and bottlenecks. Vaccine 2021, 39, 2190–2200. [Google Scholar] [CrossRef]
- Li, B.; Zhang, X.; Dong, Y. Nanoscale platforms for messenger RNA delivery. Wiley Interdiscip. Rev. Nanomed. Nanobiotechnol. 2019, 11, e1530. [Google Scholar] [CrossRef]
- Zampaglione, I.; Simon, A.J.; Capone, S.; Finnefrock, A.C.; Casimiro, D.R.; Kath, G.S.; Tang, A.; Folgori, A.; La Monica, N.; Shiver, J.; et al. Genetic vaccination by gene electro-transfer in non-human primates. J. Drug Deliv. Sci. Technol. 2006, 16, 85–89. [Google Scholar] [CrossRef]
- Maria De Barcelos Alves, A.; Cruz Foundation, O.; Lins, R.; Elong Ngono, A.; Weiner, D.B.; Xu, Z.; Patel, A.; Tursi, N.J.; Zhu, X.; Muthumani, K.; et al. Harnessing Recent Advances in Synthetic DNA and Electroporation Technologies for Rapid Vaccine Development Against COVID-19 and Other Emerging Infectious Diseases. Front. Med. Technol. 2020, 2, 571030. [Google Scholar] [CrossRef]
- Imbrechts, M.; Maes, W.; Ampofo, L.; Neyts, J.; Declerck, P.; Geukens, N. Potent neutralizing anti-SARS-CoV-2 human antibodies cure infection with SARS-CoV-2 variants in hamster model. iScience 2022, 25, 104705. [Google Scholar] [CrossRef] [PubMed]
- Groselj, A.; Bosnjak, M.; Jesenko, T.; Cemazar, M.; Markelc, B.; Strojan, P.; Sersa, G.; Serša, G. Treatment of skin tumors with intratumoral interleukin 12 gene electrotransfer in the head and neck region: A first-in-human clinical trial protocol. Radiol. Oncol. 2022, 56, 398–408. [Google Scholar] [CrossRef] [PubMed]
- Rosazza, C.; Haberl Meglic, S.; Zumbusch, A.; Rols, M.-P.; Miklavcic, D. Gene Electrotransfer: A Mechanistic Perspective. Curr. Gene Ther. 2016, 16, 98–129. [Google Scholar] [CrossRef] [PubMed] [Green Version]
- Kalams, S.A.; Parker, S.D.; Elizaga, M.; Metch, B.; Edupuganti, S.; Hural, J.; De Rosa, S.; Carter, D.K.; Rybczyk, K.; Frank, I.; et al. Safety and comparative immunogenicity of an HIV-1 DNA vaccine in combination with plasmid interleukin 12 and impact of intramuscular electroporation for delivery. J. Infect. Dis. 2013, 208, 818–829. [Google Scholar] [CrossRef] [Green Version]
- Mpendo, J.; Mutua, G.; Nanvubya, A.; Anzala, O.; Nyombayire, J.; Karita, E.; Dally, L.; Hannaman, D.; Price, M.; Fast, P.E.; et al. Acceptability and tolerability of repeated intramuscular electroporation of Multi-antigenic HIV (HIVMAG) DNA vaccine among healthy African participants in a phase 1 randomized controlled trial. PLoS ONE 2020, 15, e0233151. [Google Scholar] [CrossRef]
- Conforti, A.; Marra, E.; Palombo, F.; Roscilli, G.; Ravà, M.; Fumagalli, V.; Muzi, A.; Maffei, M.; Luberto, L.; Lione, L.; et al. COVID-eVax, an electroporated DNA vaccine candidate encoding the SARS-CoV-2 RBD, elicits protective responses in animal models. Mol. Ther. 2022, 30, 311–326. [Google Scholar] [CrossRef]
- Ahn, J.Y.; Lee, J.; Suh, Y.S.; Song, Y.G.; Choi, Y.J.; Lee, K.H.; Seo, S.H.; Song, M.; Oh, J.W.; Kim, M.; et al. Safety and immunogenicity of two recombinant DNA COVID-19 vaccines containing the coding regions of the spike or spike and nucleocapsid proteins: An interim analysis of two open-label, non-randomised, phase 1 trials in healthy adults. Lancet Microbe 2022, 3, e173–e183. [Google Scholar] [CrossRef]
- Tebas, P.; Yang, S.P.; Boyer, J.D.; Reuschel, E.L.; Patel, A.; Christensen-Quick, A.; Andrade, V.M.; Morrow, M.P.; Kraynyak, K.; Agnes, J.; et al. Safety and immunogenicity of INO-4800 DNA vaccine against SARS-CoV-2: A preliminary report of an open-label, Phase 1 clinical trial. EClinicalMedicine 2021, 31, 100689. [Google Scholar] [CrossRef]
- Kraynyak, K.A.; Blackwood, E.; Agnes, J.; Tebas, P.; Giffear, M.; Amante, D.; Reuschel, E.L.; Purwar, M.; Christensen-Quick, A.; Liu, N.; et al. SARS-CoV-2 DNA Vaccine INO-4800 Induces Durable Immune Responses Capable of Being Boosted in a Phase 1 Open-Label Trial. J. Infect. Dis. 1923, 2022, 1923–1955. [Google Scholar] [CrossRef]
- Search of: Plasmid Electroporation—List Results—ClinicalTrials.gov. Available online: https://classic.clinicaltrials.gov/ct2/results?term=plasmid+electroporation&Search=Search (accessed on 27 June 2023).
- Widera, G.; Austin, M.; Rabussay, D.; Goldbeck, C.; Barnett, S.W.; Chen, M.; Leung, L.; Otten, G.R.; Thudium, K.; Selby, M.J.; et al. Increased DNA vaccine delivery and immunogenicity by electroporation in vivo. J. Immunol. 2000, 164, 4635–4640. [Google Scholar] [CrossRef] [Green Version]
- Mann, J.F.S.; McKay, P.F.; Fiserova, A.; Klein, K.; Cope, A.; Rogers, P.; Swales, J.; Seaman, M.S.; Combadiere, B.; Shattock, R.J. Enhanced immunogenicity of an HIV-1 DNA vaccine delivered with electroporation via combined intramuscular and intradermal routes. J. Virol. 2014, 88, 6959–6969. [Google Scholar] [CrossRef] [PubMed] [Green Version]
- Donate, A.; Coppola, D.; Cruz, Y.; Heller, R. Evaluation of a Novel Non-Penetrating Electrode for Use in DNA Vaccination. PLoS ONE 2011, 6, e19181. [Google Scholar] [CrossRef] [PubMed] [Green Version]
- Roos, A.K.; Moreno, S.; Leder, C.; Pavlenko, M.; King, A.; Pisa, P. Enhancement of cellular immune response to a prostate cancer DNA vaccine by intradermal electroporation. Mol. Ther. 2006, 13, 320–327. [Google Scholar] [CrossRef]
- Rochard, A.; Scherman, D.; Bigey, P. Genetic Immunization with Plasmid DNA Mediated by Electrotransfer. Hum. Gene Ther. 2011, 22, 789–798. [Google Scholar] [CrossRef] [PubMed]
- Jalah, R.; Patel, V.; Kulkarni, V.; Rosati, M.; Alicea, C.; Ganneru, B.; Von Gegerfelt, A.; Huang, W.; Guan, Y.; Broderick, K.E.; et al. IL-12 DNA as molecular vaccine adjuvant increases the cytotoxic T cell responses and breadth of humoral immune responses in SIV DNA vaccinated macaques. Hum. Vaccines Immunother. 2012, 8, 1620–1629. [Google Scholar] [CrossRef] [PubMed]
- Peachman, K.K.; Rao, M.; Alving, C.R. Immunization with DNA through the skin. Methods 2003, 31, 232–242. [Google Scholar] [CrossRef] [PubMed]
- Jorritsma, S.H.T.; Gowans, E.J.; Grubor-Bauk, B.; Wijesundara, D.K. Delivery methods to increase cellular uptake and immunogenicity of DNA vaccines. Vaccine 2016, 34, 5488–5494. [Google Scholar] [CrossRef]
- Tevz, G.; Pavlin, D.; Kamensek, U.; Kranjc, S.; Mesojednik, S.; Coer, A.; Sersa, G.; Cemazar, M. Gene electrotransfer into murine skeletal muscle: A systematic analysis of parameters for long-term gene expression. Technol. Cancer Res. Treat. 2008, 7, 91–101. [Google Scholar] [CrossRef]
- Kos, S.; Blagus, T.; Cemazar, M.; Lampreht Tratar, U.; Stimac, M.; Prosen, L.; Dolinsek, T.; Kamensek, U.; Kranjc, S.; Steinstraesser, L.; et al. Electrotransfer parameters as a tool for controlled and targeted gene expression in skin. Mol. Ther. Nucleic Acids 2016, 5, e356. [Google Scholar] [CrossRef] [Green Version]
- Pavšelj, N.; Préat, V. DNA electrotransfer into the skin using a combination of one high- and one low-voltage pulse. J. Control Release 2005, 106, 407–415. [Google Scholar] [CrossRef]
- Pasquet, L.; Chabot, S.; Bellard, E.; Markelc, B.; Rols, M.P.; Reynes, J.P.; Tiraby, G.; Couillaud, F.; Teissie, J.; Golzio, M. Safe and efficient novel approach for non-invasive gene electrotransfer to skin. Sci. Rep. 2018, 8, 16833. [Google Scholar] [CrossRef] [PubMed]
- Bausart, M.; Vanvarenberg, K.; Ucakar, B.; Lopes, A.; Vandermeulen, G.; Malfanti, A.; Préat, V. Combination of DNA Vaccine and Immune Checkpoint Blockades Improves the Immune Response in an Orthotopic Unresectable Glioblastoma Model. Pharmaceutics 2022, 14, 1025. [Google Scholar] [CrossRef]
- Kashem, S.W.; Haniffa, M.; Kaplan, D.H. Antigen-Presenting Cells in the Skin. Annu. Rev. Immunol. 2017, 35, 469–499. [Google Scholar] [CrossRef]
- Marino, M.; Scuderi, F.; Provenzano, C.; Bartoccioni, E. Skeletal muscle cells: From local inflammatory response to active immunity. Gene Ther. 2011, 18, 109–116. [Google Scholar] [CrossRef] [PubMed] [Green Version]
- Bosnjak, M.; Dolinsek, T.; Cemazar, M.; Kranjc, S.; Blagus, T.; Markelc, B.; Stimac, M.; Zavrsnik, J.; Kamensek, U.; Heller, L.; et al. Gene electrotransfer of plasmid AMEP, an integrin-targeted therapy, has antitumor and antiangiogenic action in murine B16 melanoma. Gene Ther. 2015, 22, 578–590. [Google Scholar] [CrossRef] [PubMed]
- Zhang, Z.; Shen, Q.; Chang, H. Vaccines for COVID-19: A Systematic Review of Immunogenicity, Current Development, and Future Prospects. Front. Immunol. 2022, 13, 843928. [Google Scholar] [CrossRef]
- Heinz, F.X.; Stiasny, K. Distinguishing features of current COVID-19 vaccines: Knowns and unknowns of antigen presentation and modes of action. Npj Vaccines 2021, 6, 104. [Google Scholar] [CrossRef]
- Thoring, L.; Dondapati, S.K.; Stech, M.; Wüstenhagen, D.A.; Kubick, S. High-yield production of “difficult-to-express” proteins in a continuous exchange cell-free system based on CHO cell lysates. Sci. Rep. 2017, 7, 11710. [Google Scholar] [CrossRef] [Green Version]
- Schaub, J.M.; Chou, C.W.; Kuo, H.C.; Javanmardi, K.; Hsieh, C.L.; Goldsmith, J.; DiVenere, A.M.; Le, K.C.; Wrapp, D.; Byrne, P.O.; et al. Expression and characterization of SARS-CoV-2 spike proteins. Nat. Protoc. 2021, 16, 5339–5356. [Google Scholar] [CrossRef]
- Spike, S1, RBD|SARS-CoV-2 Plasmids|InvivoGen. Available online: https://www.invivogen.com/sars2-spike-vectors (accessed on 29 May 2023).
- Schoenborn, J.R.; Wilson, C.B. Regulation of interferon-gamma during innate and adaptive immune responses. Adv. Immunol. 2007, 96, 41–101. [Google Scholar] [CrossRef]
- Hamza, T.; Barnett, J.B.; Li, B. Interleukin 12 a key immunoregulatory cytokine in infection applications. Int. J. Mol. Sci. 2010, 11, 789–806. [Google Scholar] [CrossRef] [PubMed] [Green Version]
- Bhat, P.; Leggatt, G.; Waterhouse, N.; Frazer, I.H. Interferon-γ derived from cytotoxic lymphocytes directly enhances their motility and cytotoxicity. Cell Death Dis. 2017, 8, e2836. [Google Scholar] [CrossRef] [PubMed] [Green Version]
- Keating, S.E.; Baran, M.; Bowie, A.G. Cytosolic DNA sensors regulating type I interferon induction. Trends Immunol. 2011, 32, 574–581. [Google Scholar] [CrossRef] [PubMed]
- Ramot, Y.; Caselli, G.; Aurisicchio, L.; Andreini, I.; Marra, E.; Luberto, L.; Stoppoloni, D.; Pacello, M.L.; Monetini, L.; Nyska, A. Toxicity and Local Tolerance of COVID- eVax, a Plasmid DNA Vaccine for SARS-CoV-2, Delivered by Electroporation. Toxicol. Pathol. 2021, 49, 1255–1268. [Google Scholar] [CrossRef] [PubMed]
- Maestri, E. The 3Rs Principle in Animal Experimentation: A Legal Review of the State of the Art in Europe and the Case in Italy. BioTech 2021, 10, 9. [Google Scholar] [CrossRef]
- Waldman, A.D.; Fritz, J.M.; Lenardo, M.J. A guide to cancer immunotherapy: From T cell basic science to clinical practice. Nat. Rev. Immunol. 2020, 20, 651–668. [Google Scholar] [CrossRef]
- Moss, P. The T cell immune response against SARS-CoV-2. Nat. Immunol. 2022, 23, 186–193. [Google Scholar] [CrossRef]
- Tobery, T.W.; Siliciano, R.F. Targeting of HIV-1 Antigens for Rapid Intracellular Degradation Enhances Cytotoxic T Lymphocyte (CTL) Recognition and the Induction of De Novo CTL Responses In Vivo After Immunization. J. Exp. Med. 1997, 185, 909. [Google Scholar] [CrossRef]
- Rodriguez, F.; Zhang, J.; Whitton, J.L. DNA immunization: Ubiquitination of a viral protein enhances cytotoxic T-lymphocyte induction and antiviral protection but abrogates antibody induction. J. Virol. 1997, 71, 8497. [Google Scholar] [CrossRef]
- Pulendran, B.; Arunachalam, P.S.; O’Hagan, D.T. Emerging concepts in the science of vaccine adjuvants. Nat. Rev. Drug Discov. 2021, 20, 454–475. [Google Scholar] [CrossRef]
- IL-12 Gene as a DNA Vaccine Adjuvant in a Herpes Mouse Model: IL-12 Enhances Th1-Type CD4+ T Cell-Mediated Protective Immunity against Herpes Simplex Virus-2 Challenge—PubMed. Available online: https://pubmed.ncbi.nlm.nih.gov/10072541/ (accessed on 29 March 2023).
- Trinchieri, G. Interleukin-12: A Proinflammatory Cytokine with Immunoregulatory Functions that Bridge Innate Resistance and Antigen-Specific Adaptive Immunity. Annu. Rev. Immunol. 1995, 13, 251–276. [Google Scholar] [CrossRef] [PubMed]
- Remic, T.; Sersa, G.; Levpuscek, K.; Lampreht Tratar, U.; Ursic Valentinuzzi, K.; Cör, A.; Kamensek, U. Tumor cell-based vaccine contributes to local tumor irradiation by eliciting a tumor model-dependent systemic immune response. Front. Immunol. 2022, 13, 974912. [Google Scholar] [CrossRef] [PubMed]
- Remic, T.; Sersa, G.; Ursic, K.; Cemazar, M.; Kamensek, U. Development of tumor cell-based vaccine with IL-12 gene electrotransfer as adjuvant. Vaccines 2020, 8, 111. [Google Scholar] [CrossRef] [Green Version]
- Kamensek, U.; Ursic, K.; Markelc, B.; Cemazar, M.; Setrajcic Dragos, V.; Sersa, G. Mutational burden, MHC-I expression and immune infiltration as limiting factors for in situ vaccination by TNFα and IL-12 gene electrotransfer. Bioelectrochemistry 2021, 140, 107831. [Google Scholar] [CrossRef] [PubMed]
- Ursic, K.; Kos, S.; Kamensek, U.; Cemazar, M.; Miceska, S.; Markelc, B.; Bucek, S.; Staresinic, B.; Kloboves Prevodnik, V.; Heller, R.; et al. Potentiation of electrochemotherapy effectiveness by immunostimulation with IL-12 gene electrotransfer in mice is dependent on tumor immune status. J. Control Release 2021, 332, 623–635. [Google Scholar] [CrossRef]
- Petrovsky, N. Comparative Safety of Vaccine Adjuvants: A Summary of Current Evidence and Future Needs. Drug Saf. 2015, 38, 1059. [Google Scholar] [CrossRef]


| Groups | pS (µg) | pN (µg) | pIL-12 (µg) | pControl (µg) | Sum (µg) |
|---|---|---|---|---|---|
| Ctrl | 0 | 0 | 0 | 0 | 0 |
| S | 20 | 0 | 0 | 25 | 45 |
| N | 0 | 20 | 0 | 25 | 45 |
| S + N | 20 | 20 | 0 | 5 | 45 |
| IL-12 | 0 | 0 | 5 | 40 | 45 |
| S + IL-12 | 20 | 0 | 5 | 20 | 45 |
| N + IL-12 | 0 | 20 | 5 | 20 | 45 |
| N + IL-12 (no boost) | 0 | 20 | 5 | 20 | 45 |
| S + N + IL-12 | 20 | 20 | 5 | 0 | 45 |
| S + N + IL-12 (no boost) | 20 | 20 | 5 | 0 | 45 |
| Target | Primer | Sequence |
|---|---|---|
| Nucleocapsid (SARS-CoV-2) | N-F | CTCACTCAACATGGCAAGGA |
| N-R | GTCTGGTAGCTCTTCGGTAGTA | |
| Spike (SARS-CoV-2) | S-F | GTGCAGGTATATGCGCTAGTT |
| S-R | GCACCAAGTGACATAGTGTAGG | |
| Interleukin 12 (mouse) | IL-12-F | CGGCAGCAGATTAAATATGAG |
| IL-12_R | GAGTTCTTCAAAGGCTTCATC | |
| Interferon gamma (mouse) | IFN-γ-F | CACACTGCATCTTGGCTTTG |
| IFN-γ-R | GCTGTTGCTGAAGAAGGTAGTA | |
| Beta-actin (mouse) | Actb-F | GAAGTGTGACGTTGACATCC |
| Actb-R | ACTCATCGTACTCCTGCTTG | |
| Glyceraldehyde 3-phosphate dehydrogenase (mouse) | Gapdh-F | TTCACCACCATGGAGAAGGC |
| Gapdh-R | GGCATGGACTGTGGTCATGA |
| Target | ELISA Kit | Provider |
|---|---|---|
| N-Protein | COVID-19 N-Protein ELISA Kit | Abcam, Cambridge, UK |
| S-Protein | COVID-19 Spike Protein ELISA Kit | Abcam |
| S-Protein | GENLISA™ Human SARS-CoV-2 (COVID-19) Spike Protein S1 Antigen Quantitative ELISA kit | Krishgen BioSystems, Mumbai, India |
| Mouse IFN-gamma | Mouse IFN-gamma Quantikine ELISA Kit | Abcam |
| Anti-S mouse IgG | GENLISA™ Mouse Anti-SARS-CoV-2 (COVID-19) IgG Antibody to Spike S1 + S2 ECD Protein Quantitative TITRATION ELISA | Krishgen BioSystems |
| Anti-N mouse IgG | GENLISA™ Mouse Anti-SARS-CoV-2 (COVID-19) IgG Antibody to Nucleocapsid Protein Quantitative TITRATION ELISA | Krishgen BioSystems |
| Tetramer/Antibody | Supplier | Catalog Number | Conjugate | Dilution |
|---|---|---|---|---|
| Anti S tetramer H-2Kb/VNFNFNGL | Tetramer shop | Custom | BV786 | 1:20 |
| Anti-N tetramer H-2Kb/LALLLLDRL | Tetramer shop | Custom | BUV395 | 1:20 |
| Anti-Vaccinia tetramer H-2Kb/TSYKFESV | Tetramer shop | MHC-LC558 | APC | 1:20 |
| Fixable Viability Dye | Thermo Fisher Scientific | 65-0865-14 | eFluor 780 | 1:1000 |
| CD45 Monoclonal Antibody (30-F11) | Thermo Fisher Scientific | 56-0451-82 | Alexa Fluor 700 | 1:66 |
| CD8a Monoclonal Antibody (53-6.7) | Thermo Fisher Scientific | 53-0081-80 | Alexa Fluor 488 | 1:83 |
| CD4 Monoclonal Antibody (RM4-5) | Thermo Fisher Scientific | 45-0042-80 | PerCP-Cyanine5.5 | 1:83 |
| CD3 Monoclonal Antibody (17A2) | Biolegend | 100234 | Brilliant Violet 510 | 1:50 |
Disclaimer/Publisher’s Note: The statements, opinions and data contained in all publications are solely those of the individual author(s) and contributor(s) and not of MDPI and/or the editor(s). MDPI and/or the editor(s) disclaim responsibility for any injury to people or property resulting from any ideas, methods, instructions or products referred to in the content. |
© 2023 by the authors. Licensee MDPI, Basel, Switzerland. This article is an open access article distributed under the terms and conditions of the Creative Commons Attribution (CC BY) license (https://creativecommons.org/licenses/by/4.0/).
Share and Cite
Kamensek, U.; Cemazar, M.; Kranjc Brezar, S.; Jesenko, T.; Kos, S.; Znidar, K.; Markelc, B.; Modic, Z.; Komel, T.; Gorse, T.; et al. What We Learned about the Feasibility of Gene Electrotransfer for Vaccination on a Model of COVID-19 Vaccine. Pharmaceutics 2023, 15, 1981. https://doi.org/10.3390/pharmaceutics15071981
Kamensek U, Cemazar M, Kranjc Brezar S, Jesenko T, Kos S, Znidar K, Markelc B, Modic Z, Komel T, Gorse T, et al. What We Learned about the Feasibility of Gene Electrotransfer for Vaccination on a Model of COVID-19 Vaccine. Pharmaceutics. 2023; 15(7):1981. https://doi.org/10.3390/pharmaceutics15071981
Chicago/Turabian StyleKamensek, Urska, Maja Cemazar, Simona Kranjc Brezar, Tanja Jesenko, Spela Kos, Katarina Znidar, Bostjan Markelc, Ziva Modic, Tilen Komel, Tim Gorse, and et al. 2023. "What We Learned about the Feasibility of Gene Electrotransfer for Vaccination on a Model of COVID-19 Vaccine" Pharmaceutics 15, no. 7: 1981. https://doi.org/10.3390/pharmaceutics15071981