
Application of Quality by Design Principles to the Development of Oral Lyophilizates Containing Olanzapine

Abstract
:
1. Introduction
2. Materials and Methods
2.1. Materials
2.2. Methods
2.2.1. Sample Preparation
2.2.2. Lyophilization Process
2.2.3. Product Appearance
2.2.4. Disintegration Time
2.3. QbD Approach
2.3.1. Knowledge Space Development
2.3.2. Definition of QTPP and Determination of the CQAs
2.3.3. Risk Identification Process
2.3.4. Risk Analysis and Assessment
2.3.5. Design Space Establishment
3. Results and Discussion
3.1. Knowledge Space
3.1.1. Active Pharmaceutical Ingredient
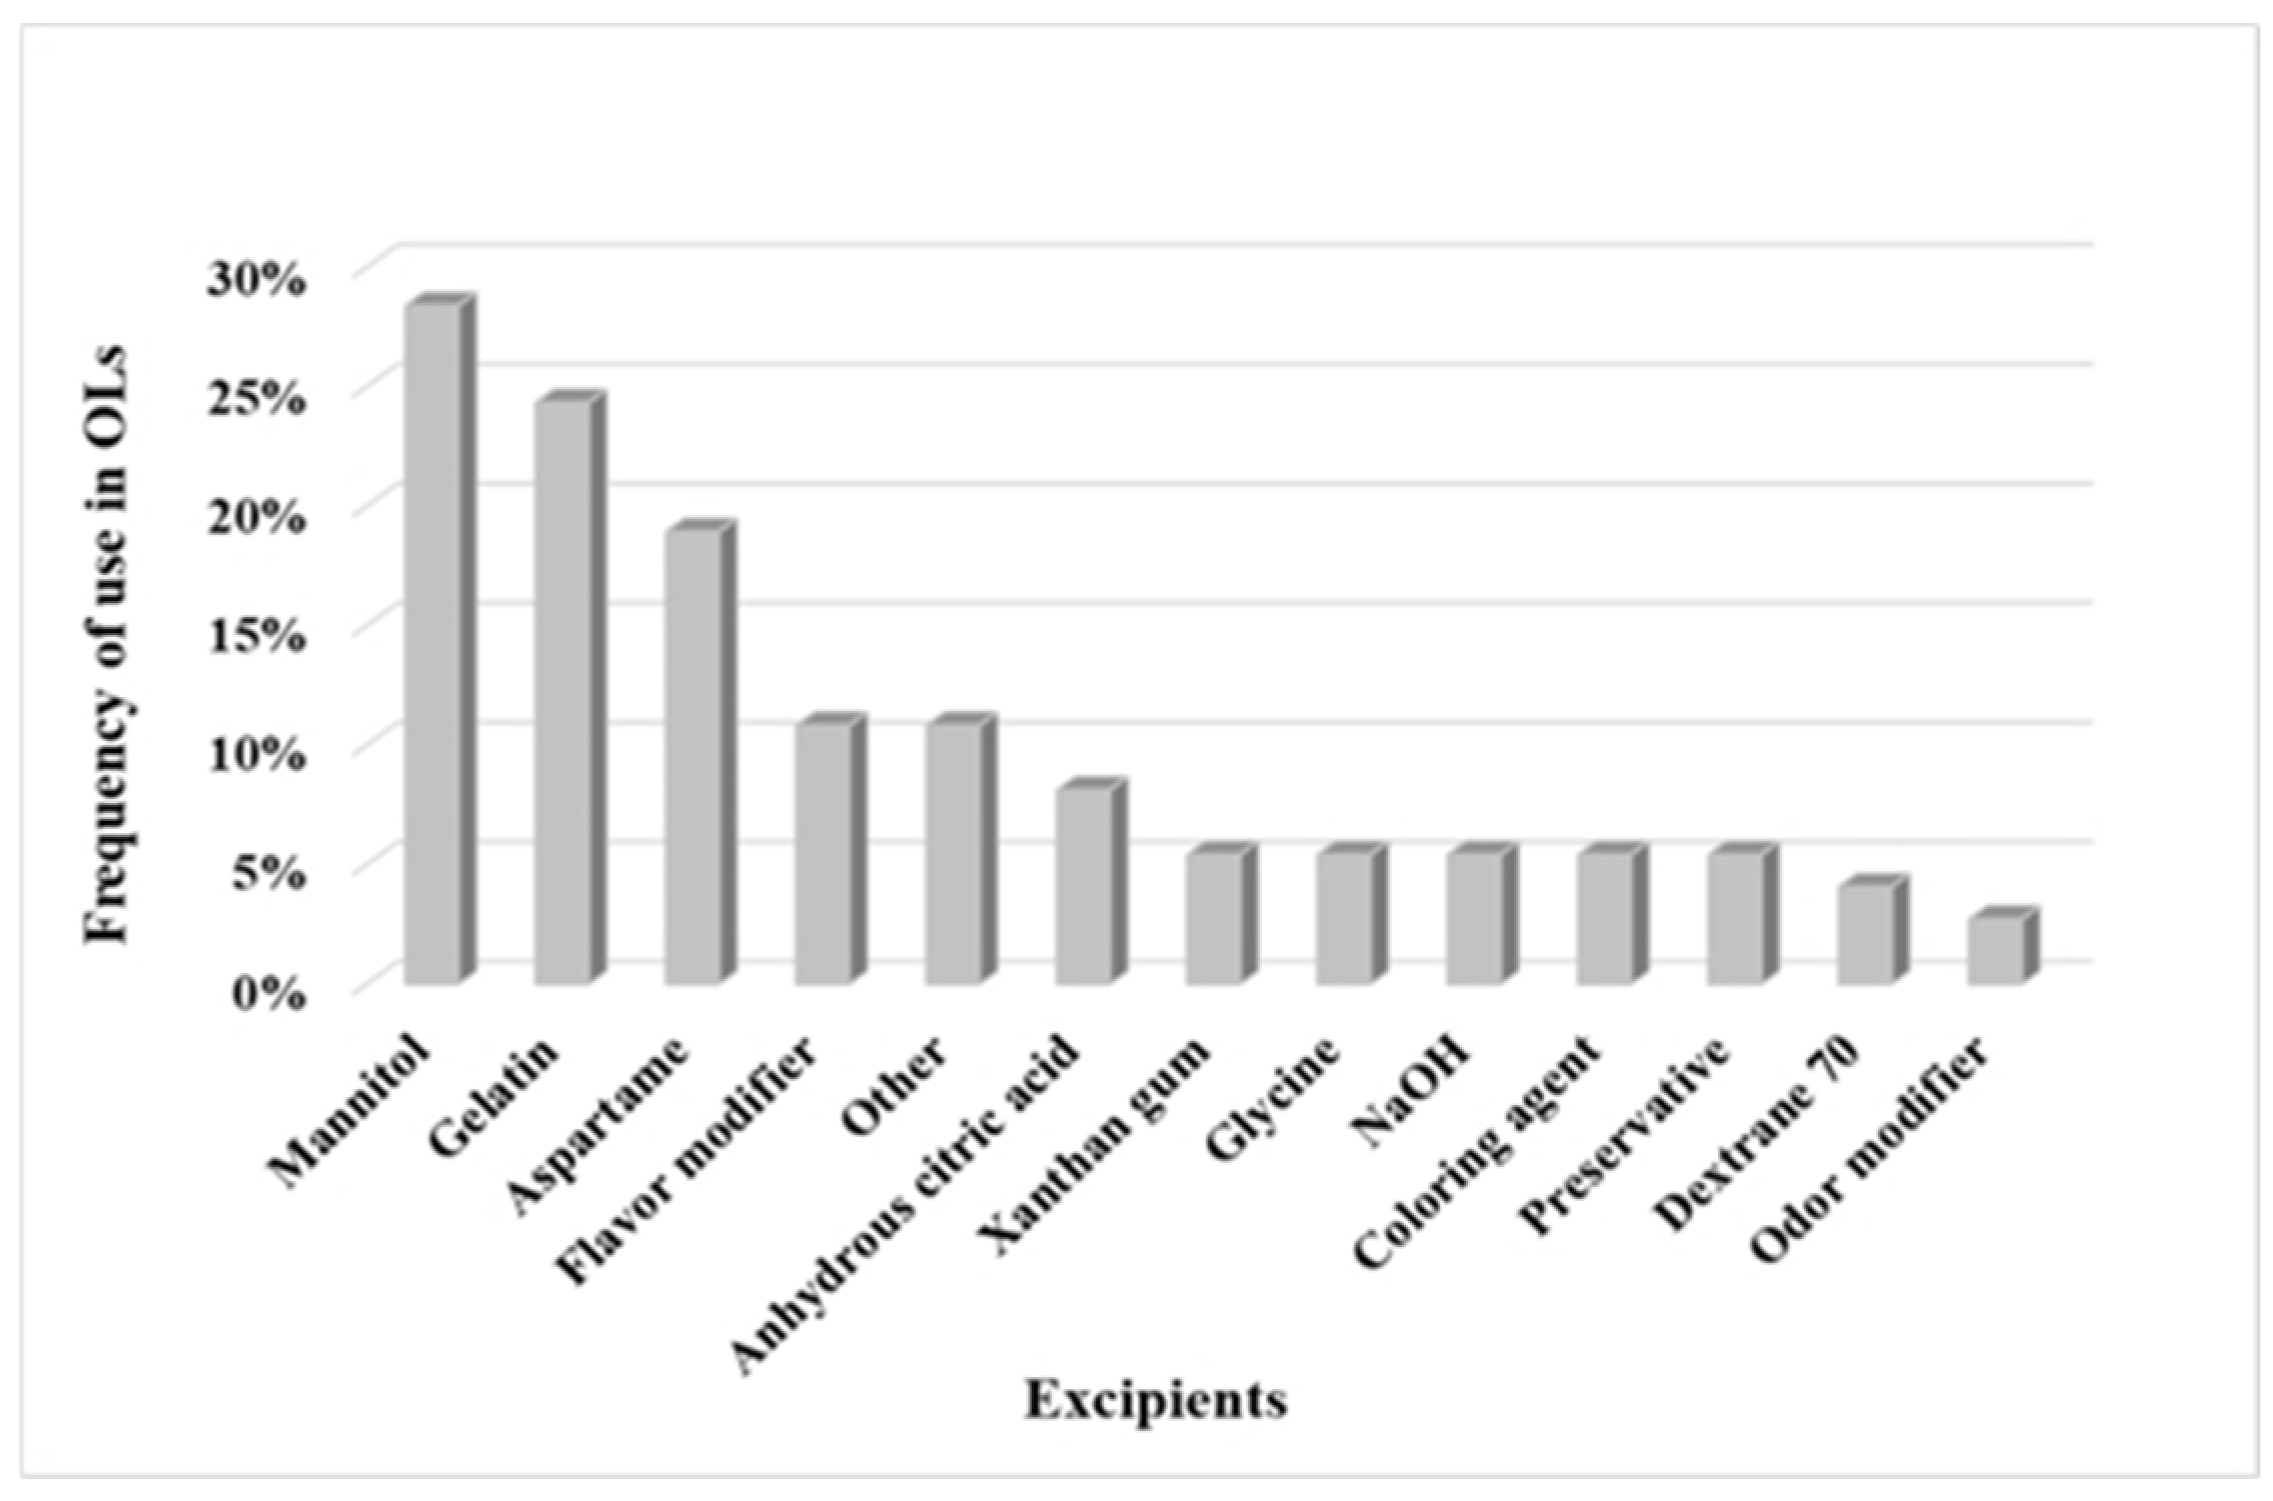
3.1.2. Excipients
3.1.3. Manufacturing Process
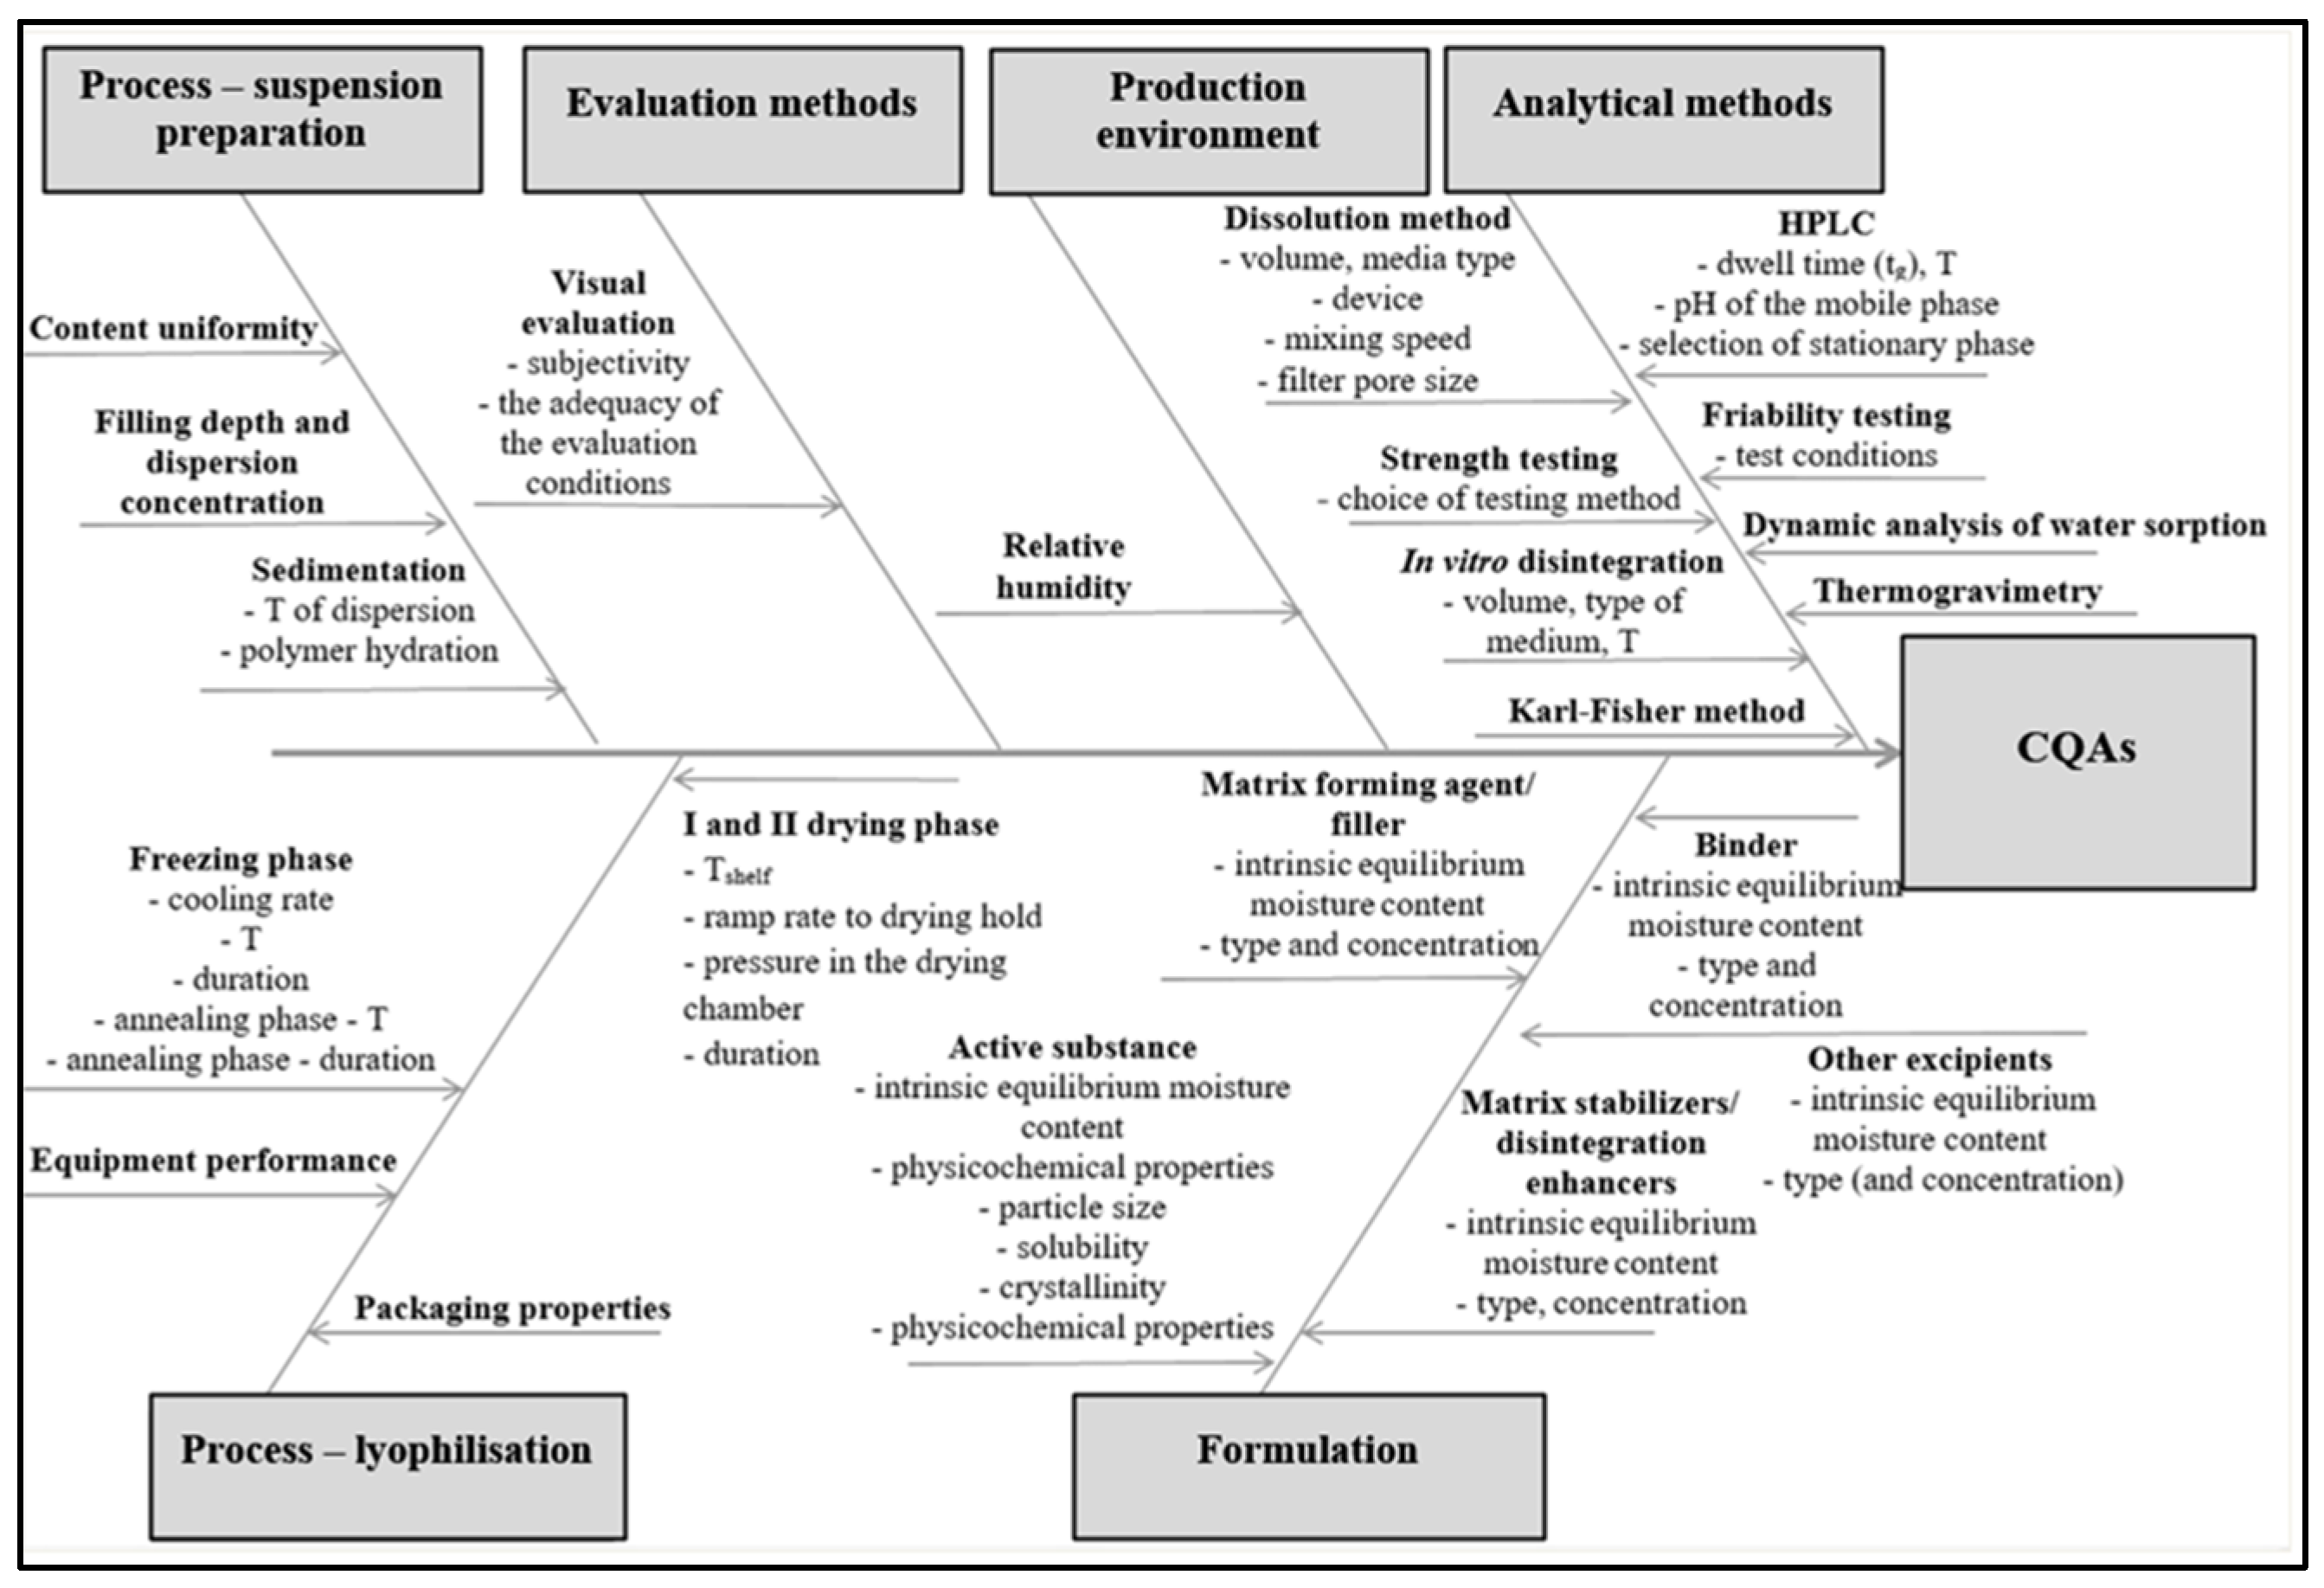
3.2. Risk Identification
3.3. Risk Analysis and Assessment
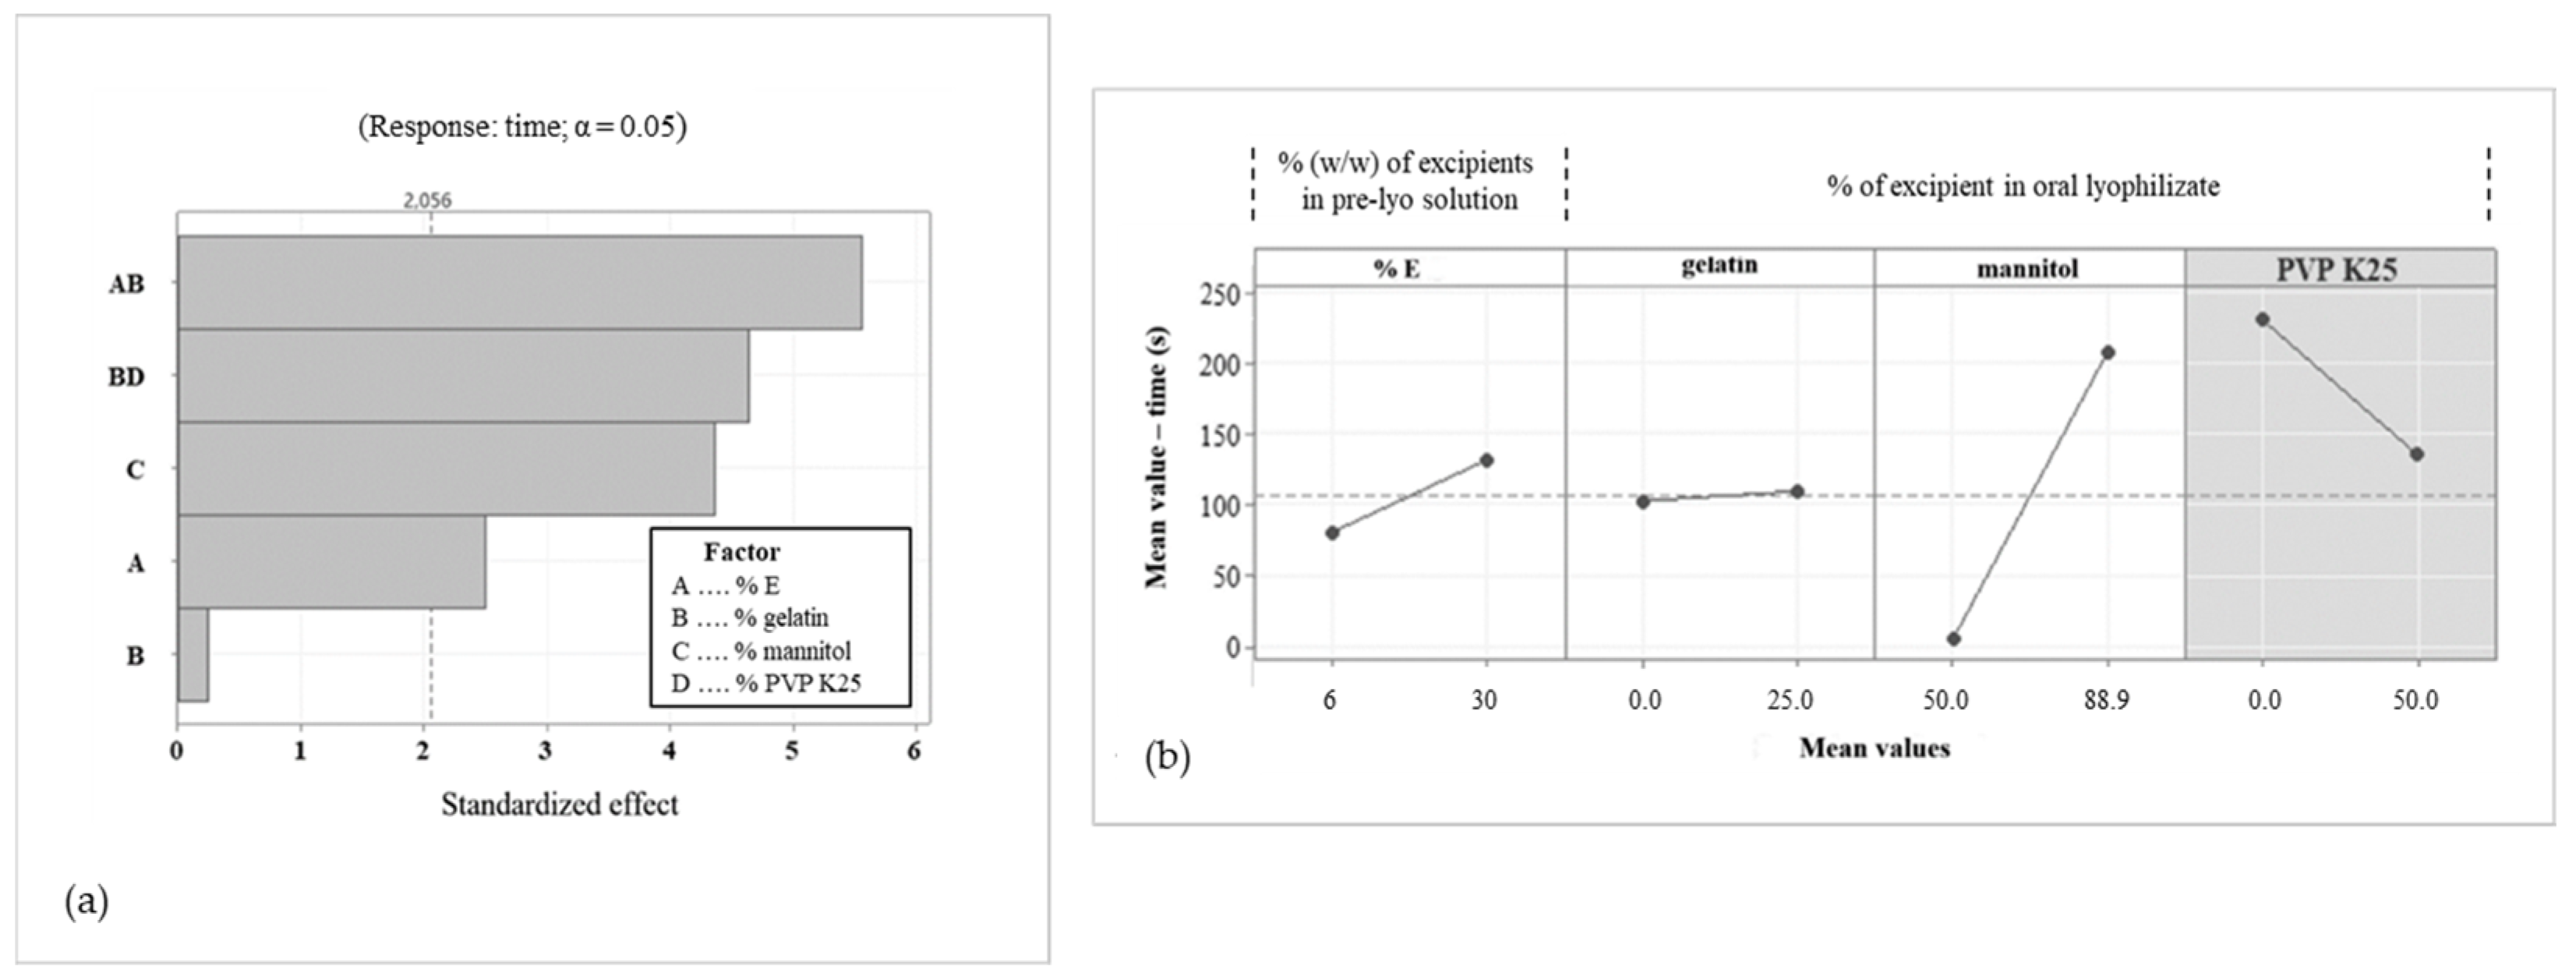
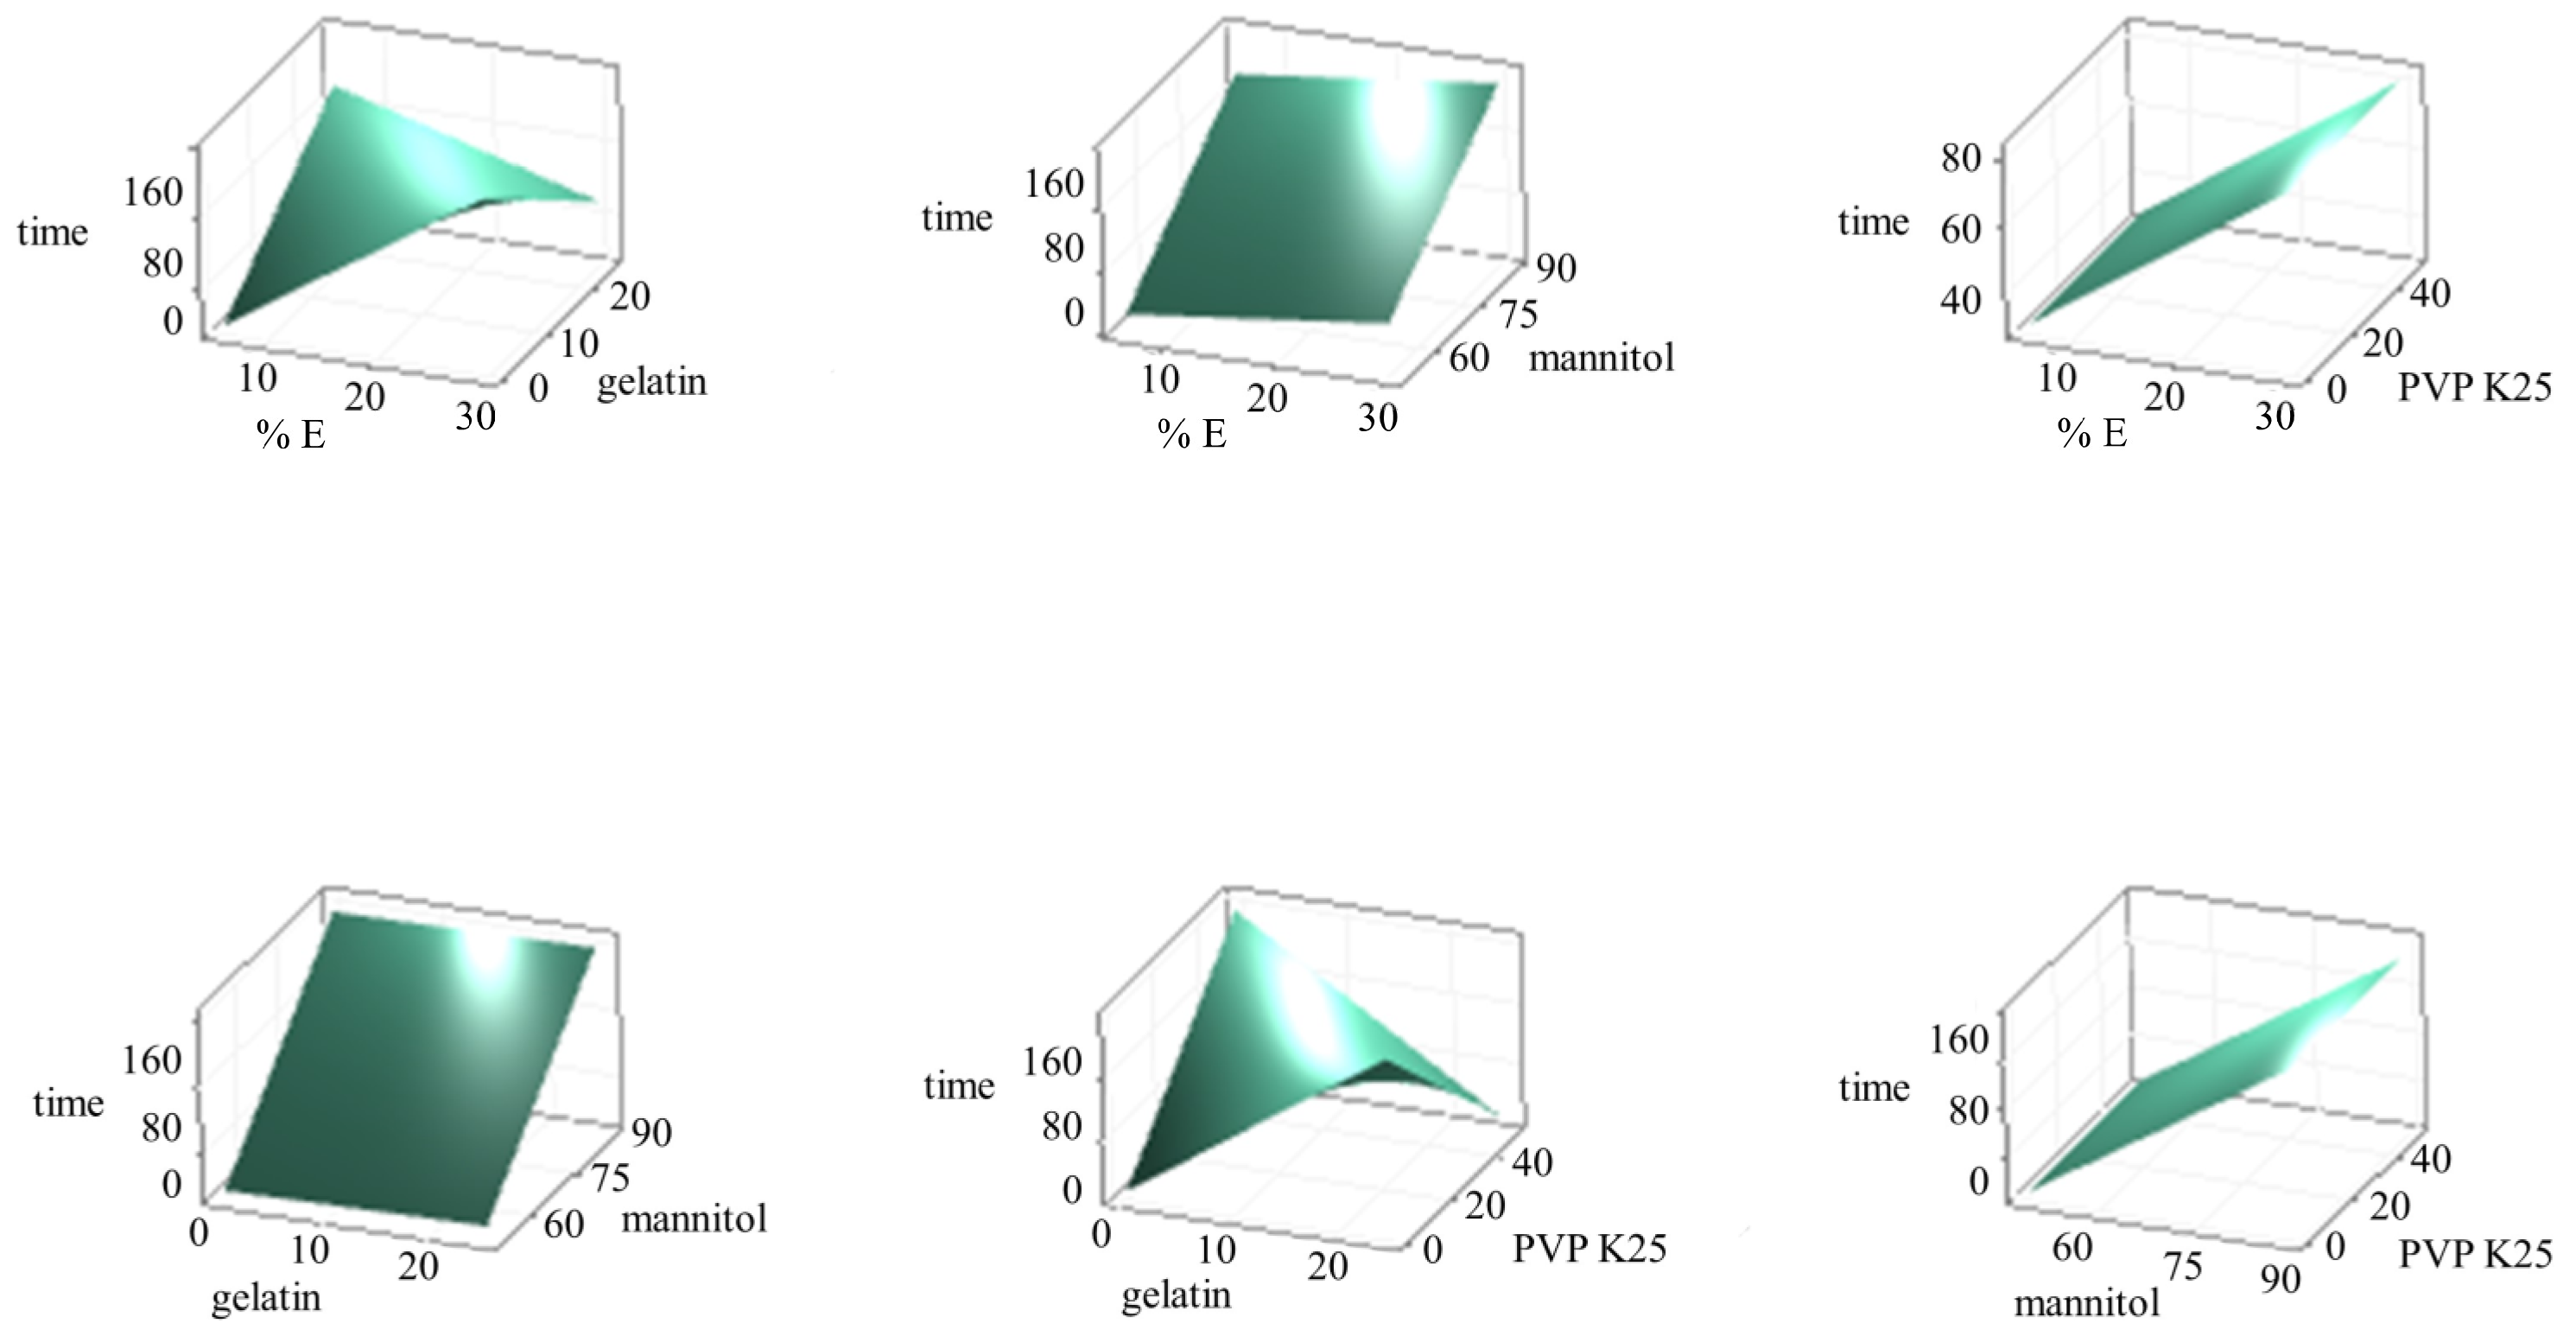
3.4. Design Space Establishment
R2, R2 (pre), R2 (adj)
3.5. OLs Formulation Optimization
4. Conclusions
Author Contributions
Funding
Institutional Review Board Statement
Informed Consent Statement
Data Availability Statement
Acknowledgments
Conflicts of Interest
References
- European Pharmacopoeia, 10th ed.; Council of Europe: Strasbourg, France, 2019.
- Dixit, M.; Kini, A.G.; Kulkarni, P.K. Enhancing the aqueous solubility and dissolution of olanzapine using freeze-drying. Brazilian J. Pharm. Sci. 2011, 47, 743–749. [Google Scholar] [CrossRef] [Green Version]
- Elly Lilli Canada Inc. Zyprexa. 2020. Available online: http://pi.lilly.com/ca/zyprexa-ca-pm.pdf (accessed on 16 June 2023).
- Ghosh, T.; Ghosh, A.; Prasad, D. A review on new generation orodispersible tablets and Its future prospective. Int. J. Pharm. Pharm. Sci. 2011, 3, 1–7. [Google Scholar]
- Nagar, P.; Singh, K.; Chauhan, I.; Verma, M.; Yasir, M.; Khan, A.; Sharma, R.; Gupta, N. Orally disintegrating tablets: Formulation, preparation techniques and evaluation. J. Appl. Pharm. Sci. 2011, 1, 35–45. [Google Scholar]
- PharmTech. Available online: http://www.pharmtech.com/orally-disintegrating-tablets-effect-recent-fda-guidance-odt-technologies-and-applications (accessed on 16 June 2023).
- Slavkova, M.; Breitkreutz, J. Orodispersible drug formulations for children and elderly. Eur. J. Pharm. Sci. 2015, 75, 2–9. [Google Scholar] [CrossRef]
- Al Husban, F.A.; El Shaer, A.M.; Jones, R.J.; Mohammed, A.R. Recent patents and trends in orally disintegrating tablets. Recent Pat. Drug Deliv. Formul. 2010, 4, 178–197. [Google Scholar] [CrossRef]
- Patil, P.B.; More, V.N.; Tour, N.S. Recent Trends in Orodispersible Tablets—An Overview of Formulation Technology and Future Prospects. Int. J. Pharma Sci. Res. 2015, 6, 1056–1066. [Google Scholar]
- Lyophilization—The Key to Creating Acceptable & Effective Fast-Dissolving Oral Formulations. Available online: https://drug-dev.com/lyophilization-the-key-to-creating-acceptable-effective-fast-dissolving-oral-formulations/ (accessed on 15 June 2023).
- EMEA/CHMP ICH Topic Q8 (R2) Pharmaceutical Development, Step 5: Note for Guidance on Pharmaceutical Development. Available online: http://www.ema.europa.eu/docs/en_GB/document_library/Scientific_guideline/2009/09/WC500002872.pdf (accessed on 15 June 2023).
- Porfire, A.; Tomuta, I.; Iurian, S.; Casian, T. Quality by Design Considerations for the Development of Lyophilized Products. In Pharmaceutical Quality by Design; Academic Press: Cambridge, MA, USA, 2019; pp. 193–207. [Google Scholar] [CrossRef]
- Preskar, M.; Videc, D.; Vrečer, F.; Gašperlin, M. Investigation of design space for freeze-drying injectable ibuprofen using response surface methodology. Acta Pharm. 2021, 71, 81–98. [Google Scholar] [CrossRef]
- Radhakrishnan, V.; Davis, P.; Hiebert, D. Scientific approaches for the application of QbD principles in lyophilization process development. In Challenges in Protein Product Development; Warne, N., Mahler, H.C., Eds.; Springer: Cham, Swizerland; New York, NY, USA, 2018; Volume 38, pp. 441–471. [Google Scholar] [CrossRef]
- Manteghi, R.; Pallagi, E.; Olajos, G.; Csóka, I. Pegylation and formulation strategy of Anti-Microbial Peptide (AMP) according to the quality by design approach. Eur. J. Pharm. Sci. 2020, 144, 105197. [Google Scholar] [CrossRef]
- European Medicines Agency (EMA). ICH Guideline Q9 on Quality Risk Management; European Medicines Agency: Amsterdam, The Netherlands, 2014; Volume 44, pp. 1–20. [Google Scholar]
- Suciu, Ș.; Iurian, S.; Bogdan, C.; Iovanov, R.; Rus, L.; Moldovan, M.; Tomuţă, I. QbD approach in the development of oral lyophilisates with ibuprofen for paediatric use. Farmacia 2018, 66, 514–523. [Google Scholar] [CrossRef]
- Casian, T.; Iurian, S.; Bogdan, C.; Rus, L.; Moldovan, M.; Tomută, I. QbD for pediatric oral lyophilisates development: Risk assessment followed by screening and optimization. Drug Dev. Ind. Pharm. 2017, 43, 1932–1944. [Google Scholar] [CrossRef] [PubMed]
- Kotak, M. Pharma Project Risk Management. Available online: https://www.slideshare.net/kotakmegha/pharma-project-risk-management (accessed on 5 June 2023).
- Pallagi, E.; Ismail, R.; Paál, T.L.; Csóka, I. Initial Risk Assessment as part of the Quality by Design in peptide drug containing formulation development. Eur. J. Pharm. Sci. 2018, 122, 160–169. [Google Scholar] [CrossRef] [PubMed] [Green Version]
- Lai, F.; Pini, E.; Corrias, F.; Perricci, J.; Manconi, M.; Fadda, A.M.; Sinico, C. Formulation strategy and evaluation of nanocrystal piroxicam orally disintegrating tablets manufacturing by freeze-drying. Int. J. Pharm. 2014, 467, 27–33. [Google Scholar] [CrossRef] [PubMed]
- Anko, M.; Bjelošević, M.; Planinšek, O.; Trstenjak, U.; Logar, M.; Ahlin Grabnar, P.; Brus, B. The formation and effect of mannitol hemihydrate on the stability of monoclonal antibody in the lyophilized state. Int. J. Pharm. 2019, 564, 106–116. [Google Scholar] [CrossRef] [PubMed]
- Baheti, A.; Kumar, L.; Bansal, A.K. Excipients used in lyophilization of small molecules. J. Excipients Food Chem. 2010, 1, 41–54. [Google Scholar]
- Bjelošević, M.; Zvonar Pobirk, A.; Planinšek, O.; Ahlin Grabnar, P. Excipients in freeze-dried biopharmaceuticals: Contributions toward formulation stability and lyophilisation cycle optimisation. Int. J. Pharm. 2020, 576, 119029. [Google Scholar] [CrossRef]
- Jones, R.J.; Rajabi-Siahboomi, A.; Levina, M.; Perrie, Y.; Mohammed, A.R. The influence of formulation and manufacturing process parameters on the characteristics of lyophilized orally disintegrating tablets. Pharmaceutics 2011, 3, 440–457. [Google Scholar] [CrossRef] [Green Version]
- Lin, W.; Yan, L.; Mu, C.; Li, W.; Zhang, M.; Zhu, Q. Effect of pH on gelatin self-association investigated by laser light scattering and atomic force microscopy. Polym. Int. 2002, 51, 233–238. [Google Scholar] [CrossRef]
- De Beer, T.R.M.; Wiggenhorn, M.; Hawe, A.; Kasper, J.C.; Almeida, A.; Quinten, T.; Friess, W.; Winter, G.; Vervaet, C.; Remon, J.P. Optimization of a pharmaceutical freeze-dried product and its process using an experimental design approach and innovative process analyzers. Talanta 2011, 83, 1623–1633. [Google Scholar] [CrossRef]
- Patel, Z.K.; Patel, R.R.; Patel, K.R.; Patel, M.R. A Review: Formulation of Fast Dissolving Tablet. PharmaTutor. 2014, 2, 30–46. [Google Scholar]
- Kasper, J.C.; Friess, W. The freezing step in lyophilization: Physico-chemical fundamentals, freezing methods and consequences on process performance and quality attributes of biopharmaceuticals. Eur. J. Pharm. Biopharm. 2011, 78, 248–263. [Google Scholar] [CrossRef]
- Bjelošević, M.; Seljak, K.B.; Trstenjak, U.; Logar, M.; Brus, B.; Ahlin Grabnar, P. Aggressive conditions during primary drying as a contemporary approach to optimise freeze-drying cycles of biopharmaceuticals. Eur. J. Pharm. Sci. 2018, 122, 292–302. [Google Scholar] [CrossRef] [PubMed]
- Patel, S.M.; Nail, S.L.; Pikal, M.J.; Geidobler, R.; Winter, G.; Hawe, A.; Davagnino, J.; Rambhatla Gupta, S. Lyophilized Drug Product Cake Appearance: What Is Acceptable? J. Pharm. Sci. 2017, 106, 1706–1721. [Google Scholar] [CrossRef] [PubMed]
- ParmTech. Residual Moisture Testing Methods for Lyophilized Drug Products. Available online: www.pharmtech.com/residual-moisture-testing-methods-lyophilized-drug-products (accessed on 20 May 2023).
- Sangshetti, J.N.; Deshpande, M.; Zaheer, Z.; Shinde, D.B.; Arote, R. Quality by design approach: Regulatory need. Arab. J. Chem. 2017, 10, S3412–S3425. [Google Scholar] [CrossRef] [Green Version]
- How to Interpret Adjusted R-Squared and Predicted R-Squared in Regression Analysis. Available online: https://statisticsbyjim.com/regression/interpret-adjusted-r-squared-predicted-r-squared-regression (accessed on 20 May 2023).


| % E [w/w] | % of Gelatin in Lyophilizate | % of Mannitol in Lyophilizate | % of PVP K25 in Lyophilizate | Disintegration Time [s] | Appearance Acceptability |
|---|---|---|---|---|---|
| 30 | 11.1 | 88.9 | 0 | >180 | NO |
| 30 | 16.7 | 83.3 | 0 | >180 | NO |
| 30 | 25 | 75 | 0 | >180 | NO |
| 25 | 16.7 | 83.3 | 0 | >180 | NO |
| 20 | 16.7 | 83.3 | 0 | >180 | NO |
| 15 | 16.7 | 83.3 | 0 | >180 | NO |
| 10 | 16.7 | 83.3 | 0 | >180 | NO |
| 6 | 16.7 | 83.3 | 0 | >180 | NO |
| 30 | 0 | 50 | 50 | >180 | NO |
| 30 | 0 | 83.3 | 16.7 | >180 | NO |
| 25 | 0 | 83.3 | 16.7 | >180 | NO |
| 20 | 0 | 50 | 50 | >180 | NO |
| 15 | 0 | 50 | 50 | 39 | NO |
| 15 | 0 | 83.3 | 16.7 | 31 | NO |
| 15 | 0 | 88.9 | 11.1 | 24 | NO |
| 15 | 0 | 71.4 | 28.6 | 26 | NO |
| 15 | 0 | 62.5 | 37.5 | 16 | NO |
| 10 | 0 | 50 | 50 | 15 | NO |
| 10 | 0 | 83.3 | 16.7 | 17 | NO |
| 10 | 0 | 88.9 | 11.1 | 17 | NO |
| 10 | 0 | 71.4 | 28.6 | 21 | NO |
| 10 | 0 | 62.5 | 37.5 | 11 | NO |
| 6 | 0 | 50 | 50 | 9 | NO |
| 6 | 0 | 83.3 | 16.7 | 15 | YES |
| 6 | 0 | 88.9 | 11.1 | 15 | YES |
| 6 | 0 | 71.4 | 28.6 | 15 | YES |
| 6 | 0 | 62.5 | 37.5 | 10 | NO |
| 6 | 7.7 | 76.9 | 15.4 | 12 | YES |
| 6 | 6.7 | 80 | 13.3 | 9 | YES |
| 6 | 14.3 | 71.4 | 14.3 | 22 | YES |
| 6 | 12.5 | 62.5 | 25 | 25 | YES |
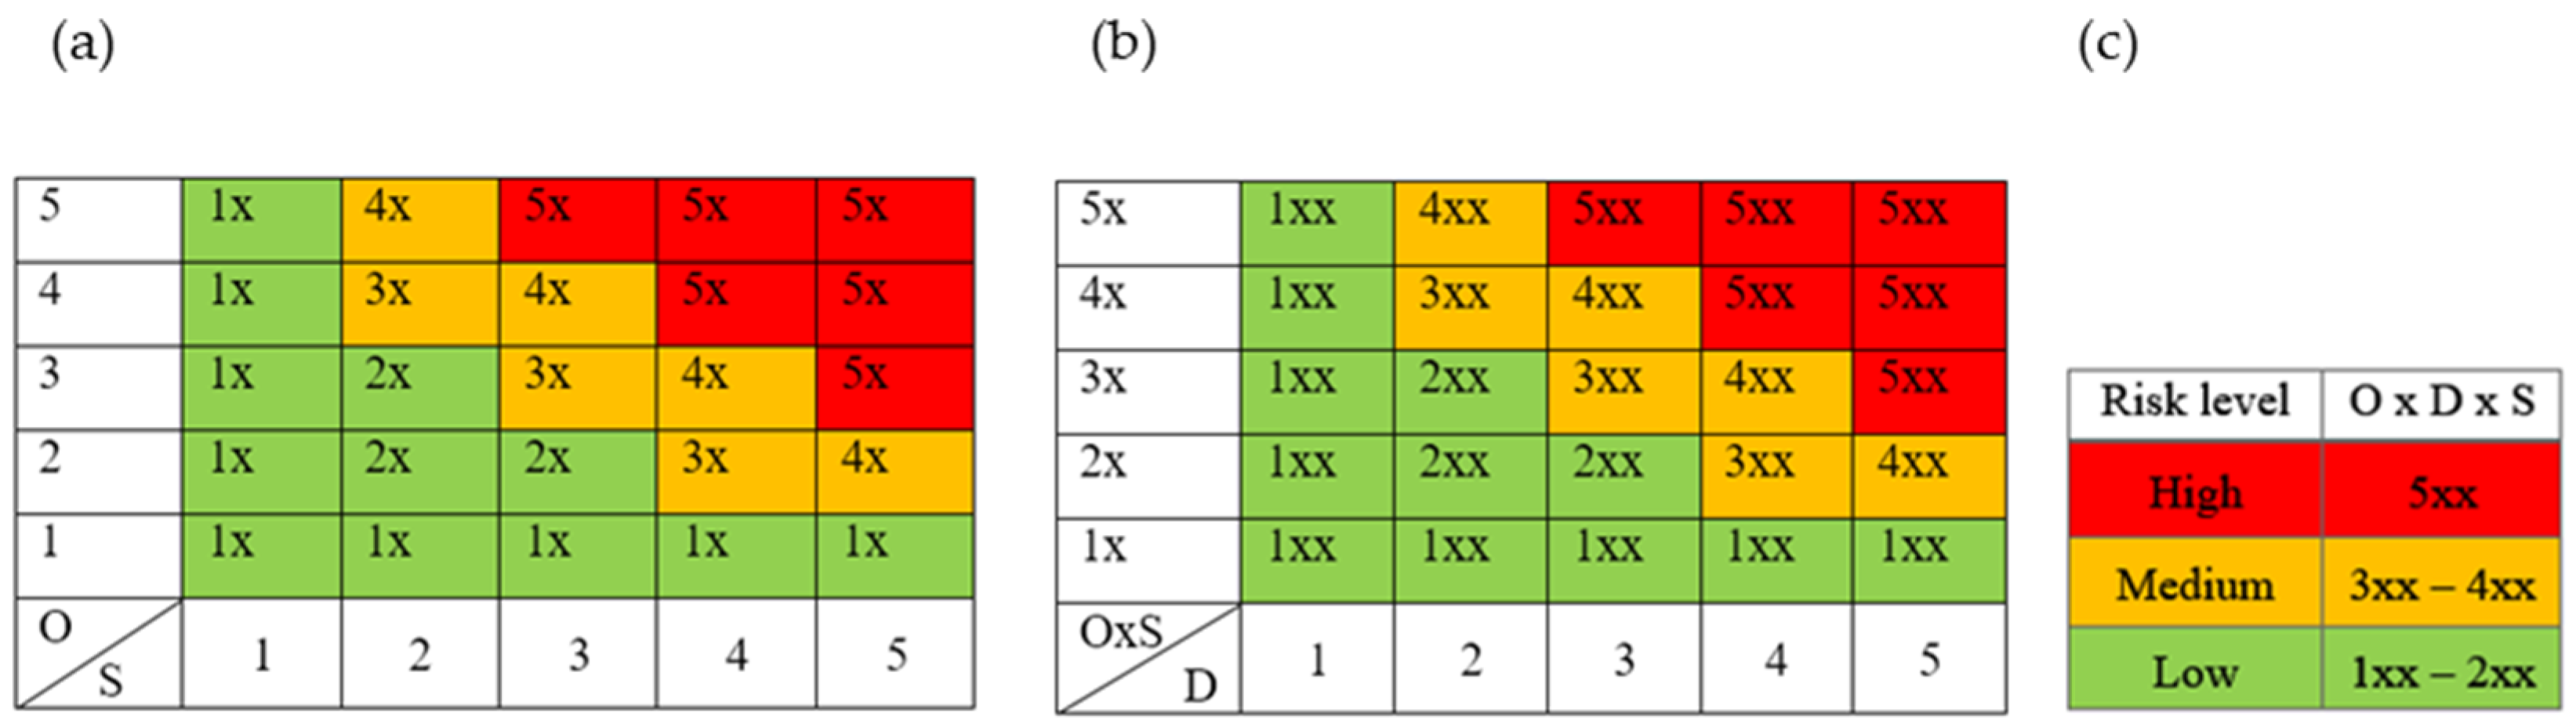
| (a) Occurrence Probability (O) | Level | Justification |
|---|---|---|
| 5 | Very likely | An error was detected in several important experiments |
| 4 | Probably | An error was detected in some important experiments |
| 3 | Unlikely | An error was detected in some important experiments, but the probability of its occurrence is minimal if the procedures are performed according to previously known instructions |
| 2 | Almost impossible | An error occurred in one or two important experiments |
| 1 | Practically impossible | The error has never occurred; its occurrence is theoretically possible |
| (b) Severity (S) | ||
| 5 | Catastrophic | The error has a great impact on the quality of the product; reprocessing is not possible |
| 4 | Critical | The error has a great impact on the quality of the product; reprocessing is possible |
| 3 | Serious | The error has an impact on the quality of the product, but it can be corrected by recycling |
| 2 | Not serious | The error has no effect on the quality of the product |
| 1 | Negligible | The error has no effect on product quality or process robustness |
| (c) Detectability (D) | ||
| 5 | Difficult to detect | There is no possibility of detecting an error |
| 4 | Low probability of detection | Non-validated automatic or manually operated fault detection system (e.g., visual inspection) exists |
| 3 | Moderate probability of detection | A validated manually controlled system for indirect fault detection exists (e.g., process analysis technology (PAT) measurements or in-process control of parameters not directly related to the fault) |
| 2 | Easier to detect | A validated, manually controlled system for direct error measurement exists |
| 1 | Easy | 1. A validated automatic system for direct error measurement exists 2. There are two or more validated manually operated sensing systems; direct or indirect detection (e.g., control area or in-process control) |
| QTPP | Target | Justification | |
|---|---|---|---|
| Route of administration | Oral | Ease of taking medications, patient compliance | |
| Pharmaceutical form | Oral lyophilizate | Disintegration time <3 min, ease of administration, no water required, prevention of patient suffocation | |
| Strength (olanzapine) | 5 mg | Desired dose in pharmaceutical form, safety, efficacy | |
| Quality attributes | Physical properties | No visible defects, uniformity of dosage units, no visible collapse of the structure | Aesthetic appearance and desired functionality |
| In vitro dissolution | e.g., at least 90% in 180 s | Rate of onset of therapeutic action, bioavailability | |
| Disintegration time | <3 min | Intact pharmaceutical form, consumption prevention, suffocation of the patient prevention, non-consumption prevention, ease of taking, dissolving active substance | |
| Mechanical resistance | ≥15 N | Packaging selection, handling, storage conditions | |
| Wetting time | ≤15 s | Redispersion rate, dissolution time | |
| Content | 95–105% | Safety, efficacy, quality | |
| Primary packaging | Suitable for storage under normal conditions | Ensures product integrity throughout storage time | |
| Product Quality Attributes | Target | Is This CQA? | |
|---|---|---|---|
| Physical properties | Appearance | No visible defects, uniformity of dosage units, no visible collapse of the structure | YES |
| Odor | No unpleasant odor | NO | |
| Size | Suitable | NO | |
| Mechanical resistance | ≥15 N | YES | |
| In vitro dissolution | e.g., at least 90% in 180 s | YES | |
| Disintegration time | <3 min | YES | |
| Wetting time | ≤15 s | NO | |
| Moisture residue | <1% | YES | |
| Potential Risk | “What Can Go Wrong?” | RPN Calculation | |||||
|---|---|---|---|---|---|---|---|
| O | S | D | RPN | ||||
| Formulation Parameters | Drug Binder Filler Disintegrant Other excipients | Quality, safety, efficiency of the drug | Unsuitable concentration and/or substance, intrinsic equilibrium moisture content | 4 | 5 | 3 | 60 |
| 5 | 5 | 3 | 75 | ||||
| 5 | 5 | 3 | 75 | ||||
| 5 | 5 | 3 | 75 | ||||
| 2 | 3 | 2 | 12 | ||||
| Inadequate mechanical resistance, instability of drug, influence on Bioavailability | Particle size | 4 | 5 | 3 | 60 | ||
| Crystallinity/amorphousness | 4 | 5 | 3 | 60 | |||
| Solubility | 4 | 5 | 3 | 60 | |||
| Intrinsic equilibrium moisture content | 2 | 4 | 2 | 16 | |||
| Incomplete hydration of the polymer | 3 | 4 | 3 | 36 | |||
| Temperature | 2 | 4 | 3 | 24 | |||
| Process Parameters | Freezing phase | Formation of small and inhomogeneous ice crystals | Cooling rate | 4 | 4 | 4 | 64 |
| Quality, safety, efficiency of the drug | Temperature | 3 | 4 | 3 | 36 | ||
| Duration | 2 | 4 | 3 | 24 | |||
| Annealing phase—temperature | 3 | 3 | 2 | 18 | |||
| Annealing phase—duration | 3 | 3 | 2 | 18 | |||
| Primary drying | Tp > Tc, loss of porous structure | Ramp rate to drying hold | 2 | 2 | 3 | 12 | |
| Shelf temperature | 4 | 4 | 3 | 48 | |||
| Pressure in the drying chamber | 4 | 4 | 3 | 48 | |||
| Filling depth | 2 | 4 | 3 | 24 | |||
| Highly concentrated samples | 3 | 4 | 2 | 24 | |||
| Duration | 4 | 4 | 3 | 48 | |||
| Secondary drying | Tp > Tc, loss of porous structure, high moisture residue | Shelf temperature | 4 | 4 | 3 | 48 | |
| Pressure in the drying chamber | 2 | 2 | 2 | 8 | |||
| Duration | 4 | 4 | 4 | 64 | |||
| Ramp rate to drying hold | 3 | 4 | 3 | 36 | |||
| % | Gelatin | Mannitol | PVP K25 | API [mg/mL] | Disintegration Time [s] |
|---|---|---|---|---|---|
| MINITAB® | 0.0 | 72.60 | 27.39 | / | 9 |
| 0.0 | 88.90 | 11.10 | / | 9 | |
| 0.0 | 68.98 | 31.02 | / | 9 | |
| 0.0 | 51.79 | 48.21 | / | 9 | |
| 0.0 | 87.33 | 12.67 | / | 9 | |
| Experimentally Obtained | 0.0 | 83.3 | 16.7 | / | 15 |
| 0.0 | 88.9 | 11.1 | / | 15 | |
| 0.0 | 71.4 | 28.6 | / | 15 | |
| 7.7 | 76.9 | 15.4 | / | 12 | |
| 6.7 | 80.0 | 13.3 | / | 9 | |
| 14.3 | 71.4 | 14.3 | / | 22 | |
| 12.5 | 62.5 | 25 | / | 25 | |
| 6.7 | 80.0 | 13.3 | 2.5 | 5 | |
| 12.5 | 62.5 | 25 | 2.5 | 5 |
Disclaimer/Publisher’s Note: The statements, opinions and data contained in all publications are solely those of the individual author(s) and contributor(s) and not of MDPI and/or the editor(s). MDPI and/or the editor(s) disclaim responsibility for any injury to people or property resulting from any ideas, methods, instructions or products referred to in the content. |
© 2023 by the authors. Licensee MDPI, Basel, Switzerland. This article is an open access article distributed under the terms and conditions of the Creative Commons Attribution (CC BY) license (https://creativecommons.org/licenses/by/4.0/).
Share and Cite
Bjelošević Žiberna, M.; Ahlin Grabnar, P. Application of Quality by Design Principles to the Development of Oral Lyophilizates Containing Olanzapine. Pharmaceutics 2023, 15, 1967. https://doi.org/10.3390/pharmaceutics15071967
Bjelošević Žiberna M, Ahlin Grabnar P. Application of Quality by Design Principles to the Development of Oral Lyophilizates Containing Olanzapine. Pharmaceutics. 2023; 15(7):1967. https://doi.org/10.3390/pharmaceutics15071967
Chicago/Turabian StyleBjelošević Žiberna, Maja, and Pegi Ahlin Grabnar. 2023. "Application of Quality by Design Principles to the Development of Oral Lyophilizates Containing Olanzapine" Pharmaceutics 15, no. 7: 1967. https://doi.org/10.3390/pharmaceutics15071967