


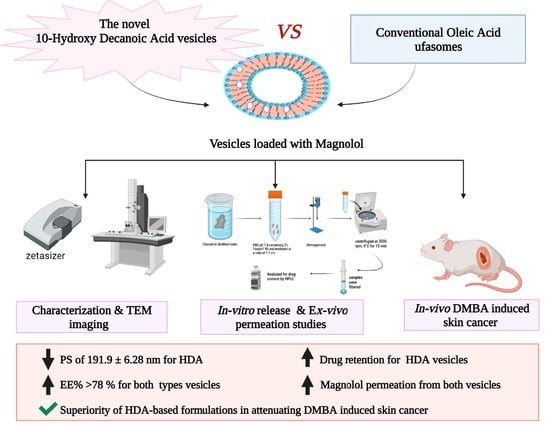
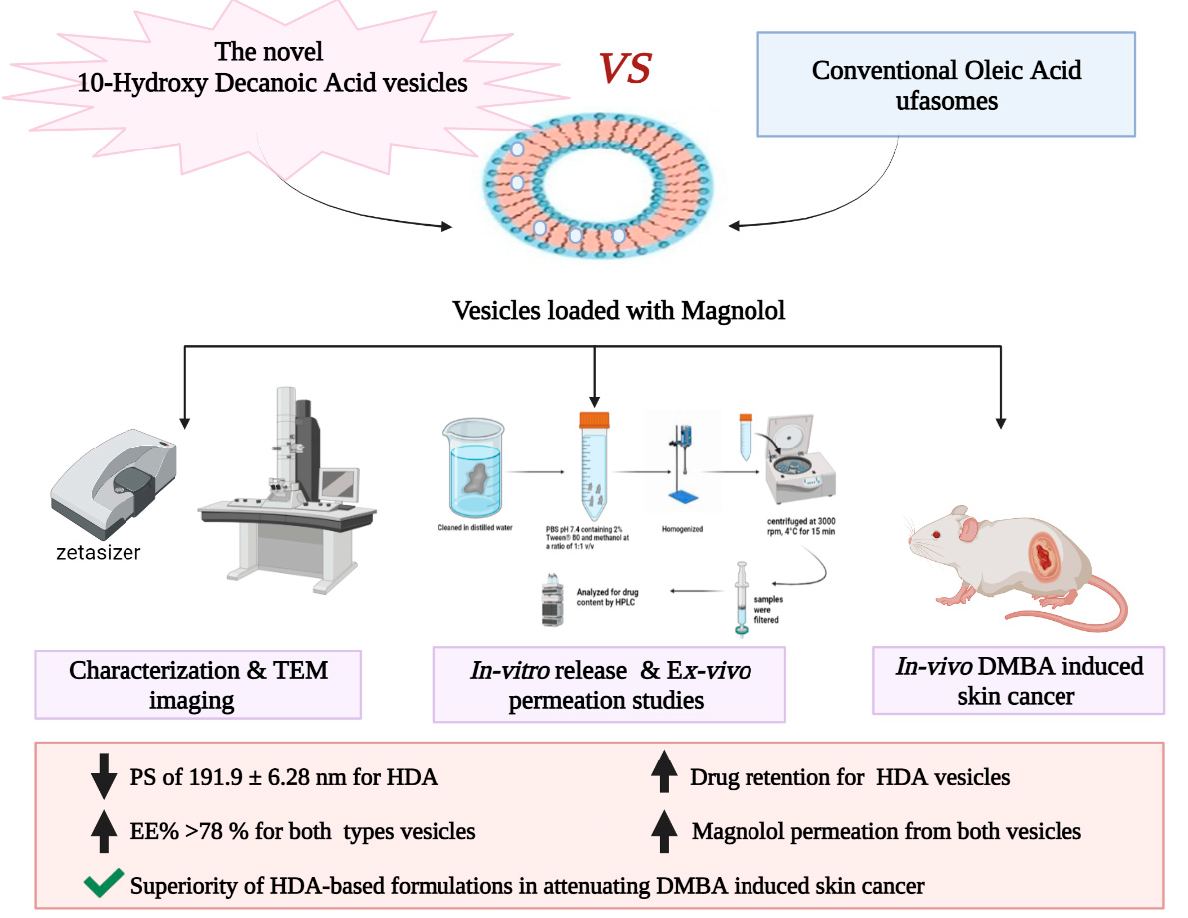
10-Hydroxy Decanoic Acid-Based Vesicles as a Novel Topical Delivery System: Would It Be a Better Platform Than Conventional Oleic Acid Ufasomes for Skin Cancer Treatment?

Abstract
:
1. Introduction
2. Materials and Methods
2.1. Materials
2.2. Methods
2.2.1. Preparation of Plain Fatty Acid Vesicles
2.2.2. Preparation of Mag-Loaded Nanovesicles
2.2.3. Optimization of Mag-Loaded Vesicular Formulations
2.2.4. Characterization of the Prepared Fatty Acid Vesicles
PS and PDI Measurements
Zeta Potential (ZP) Determination
Determination of Mag Encapsulation Efficiency (EE)
Morphological Examination by Transmission Electron Microscope (TEM)
Differential Scanning Calorimetry (DSC) Analysis
2.3. In Vitro Drug Release Study
2.4. Ex Vivo Skin Permeation and Deposition Studies
2.4.1. Preparation of Rat Skin
2.4.2. Skin Permeation Studies
2.4.3. Skin Deposition Studies
2.5. Physical Stability Study of Mag-Loaded Nanovesicles
2.6. In Vivo Anti-Cancer Evaluation
2.6.1. Animal Model
2.6.2. Tumor Induction Using DMBA
2.6.3. Treatment with the Selected Mag-Loaded Formulations
2.6.4. Assessment of Mice Body Weight
2.6.5. Measurements of Tumor Size and Number of Papilloma
2.6.6. Determination of Malondialdehyde (MDA) and Glutathione (GSH) Levels in Skin Tumor Samples
2.6.7. Immunohistochemistry (Ki-67 Expression) Study
2.6.8. Histopathological Examinations
2.7. Statistical Analysis
3. Results and Discussion
3.1. Preparation of Plain Fatty Acid Vesicles
3.2. Optimization of Mag-Loaded Vesicles According to Box–Behnken Design
3.2.1. Model Generation
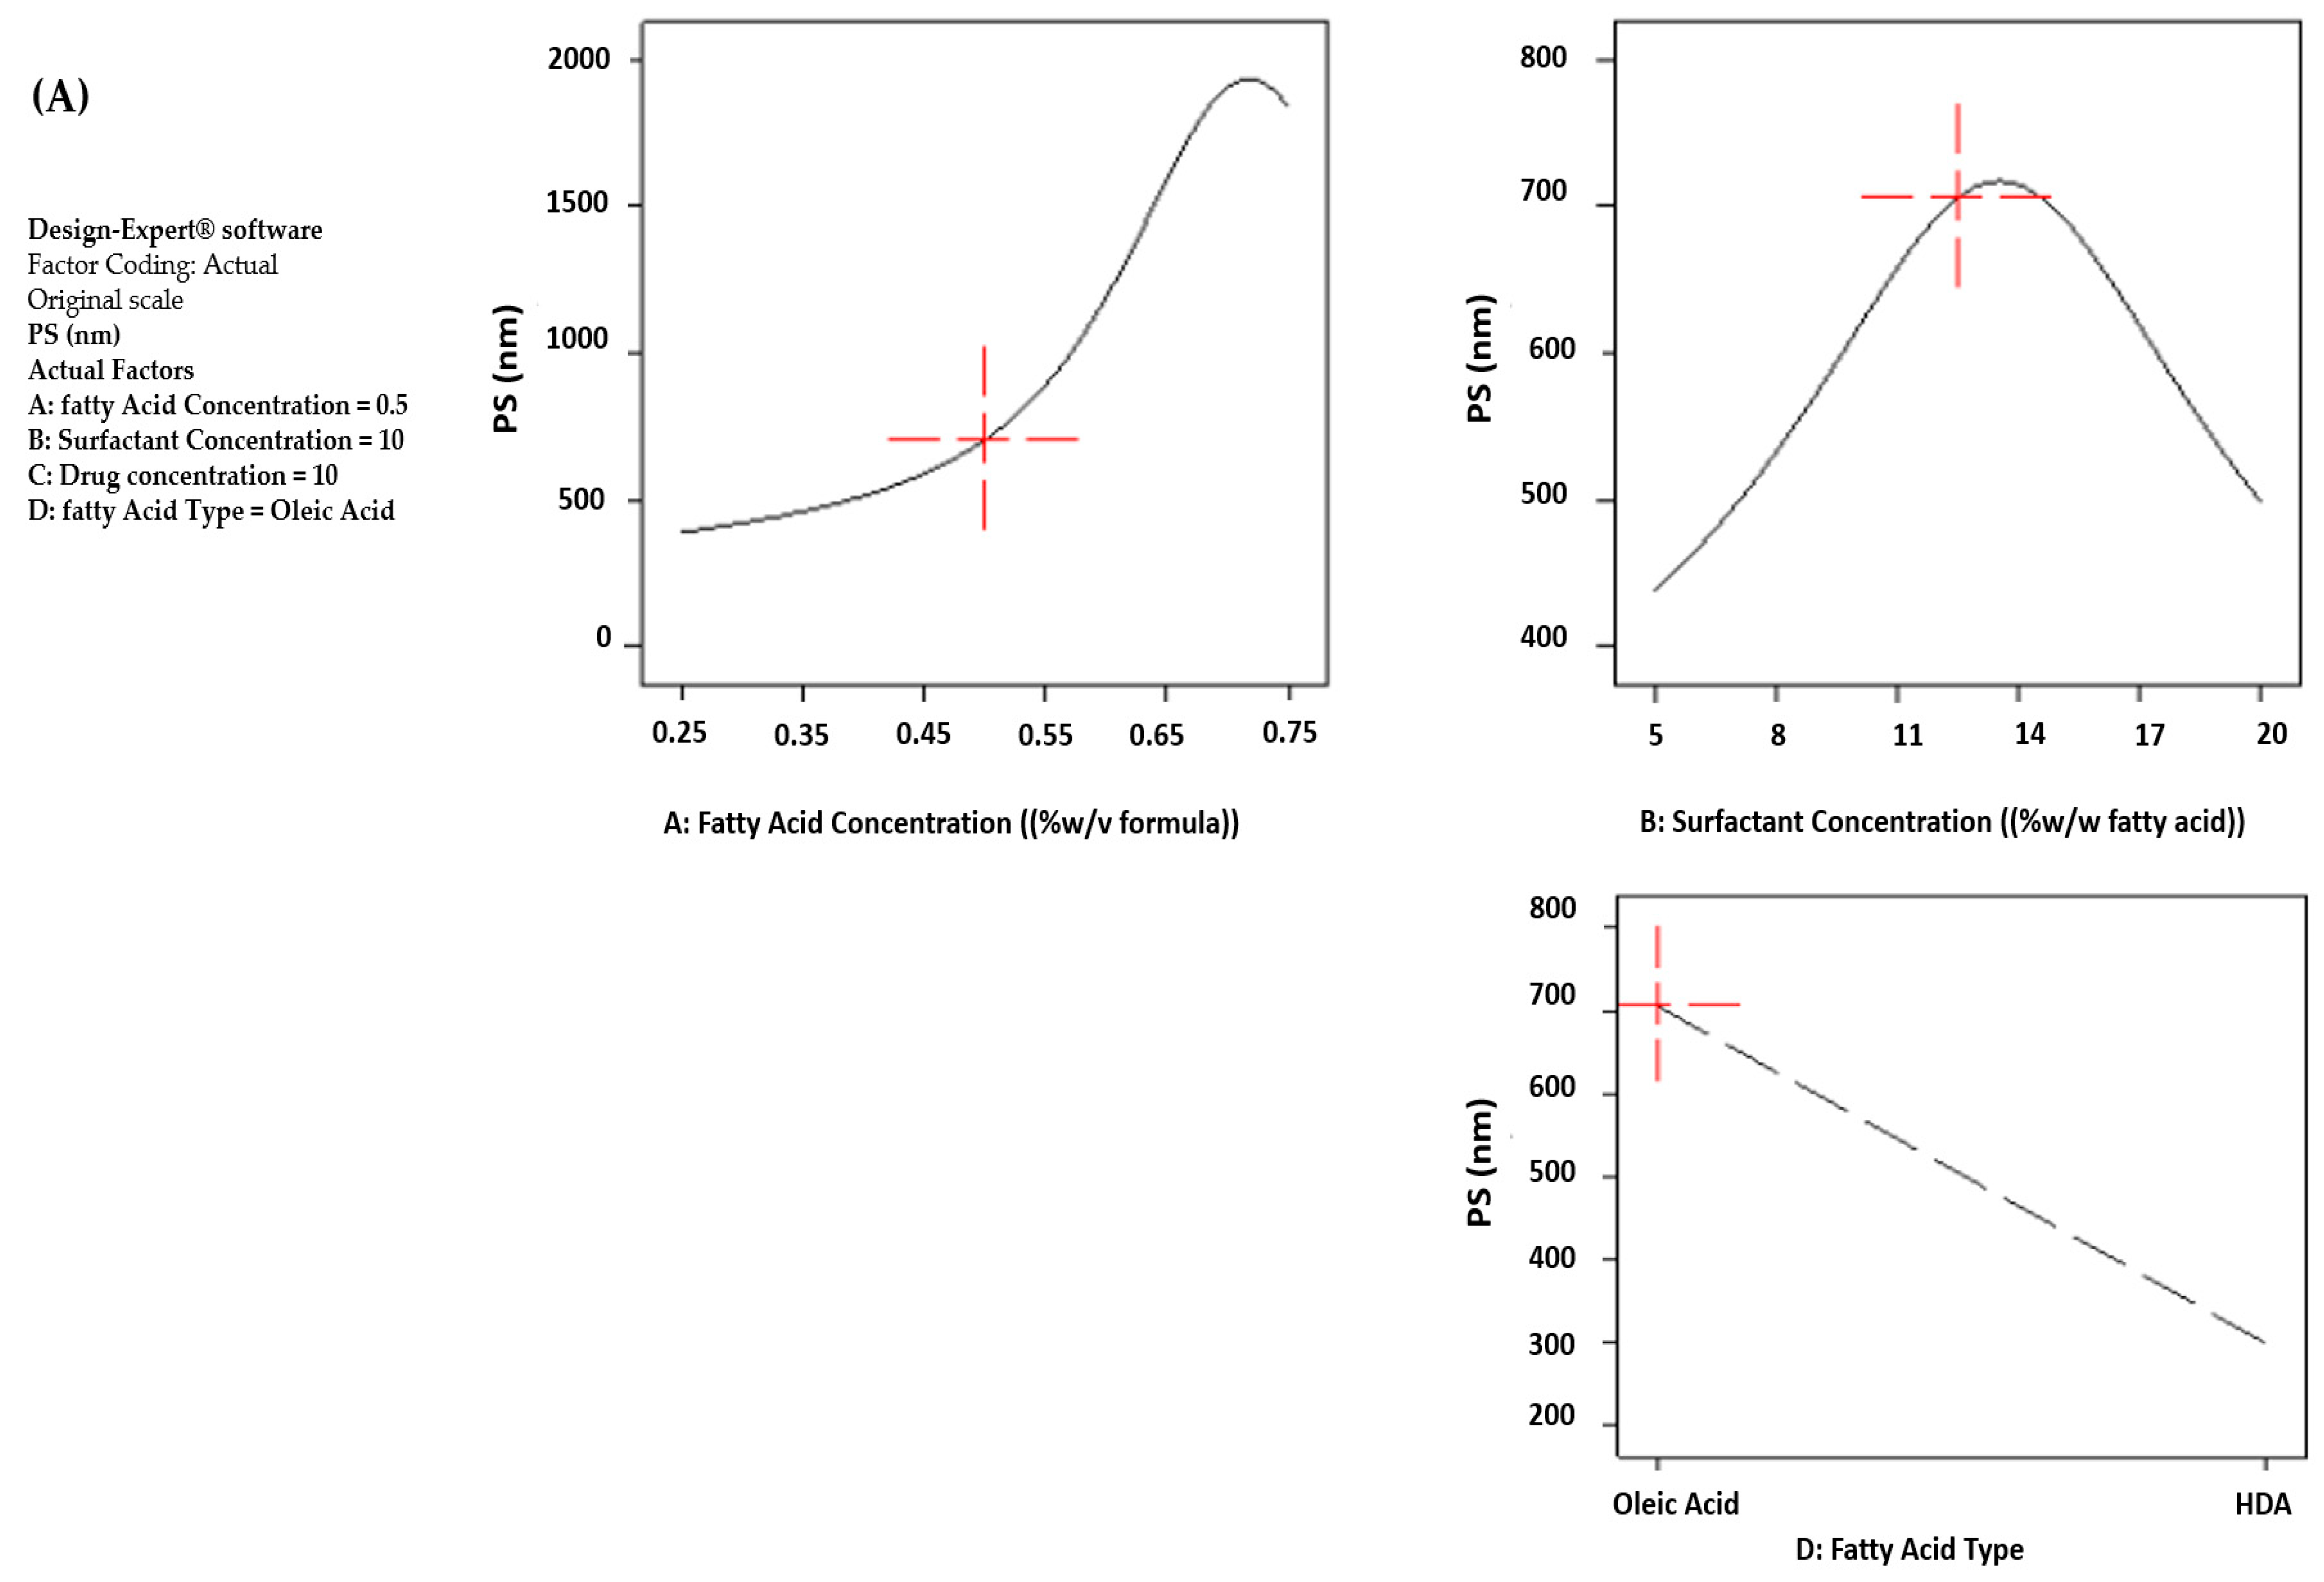
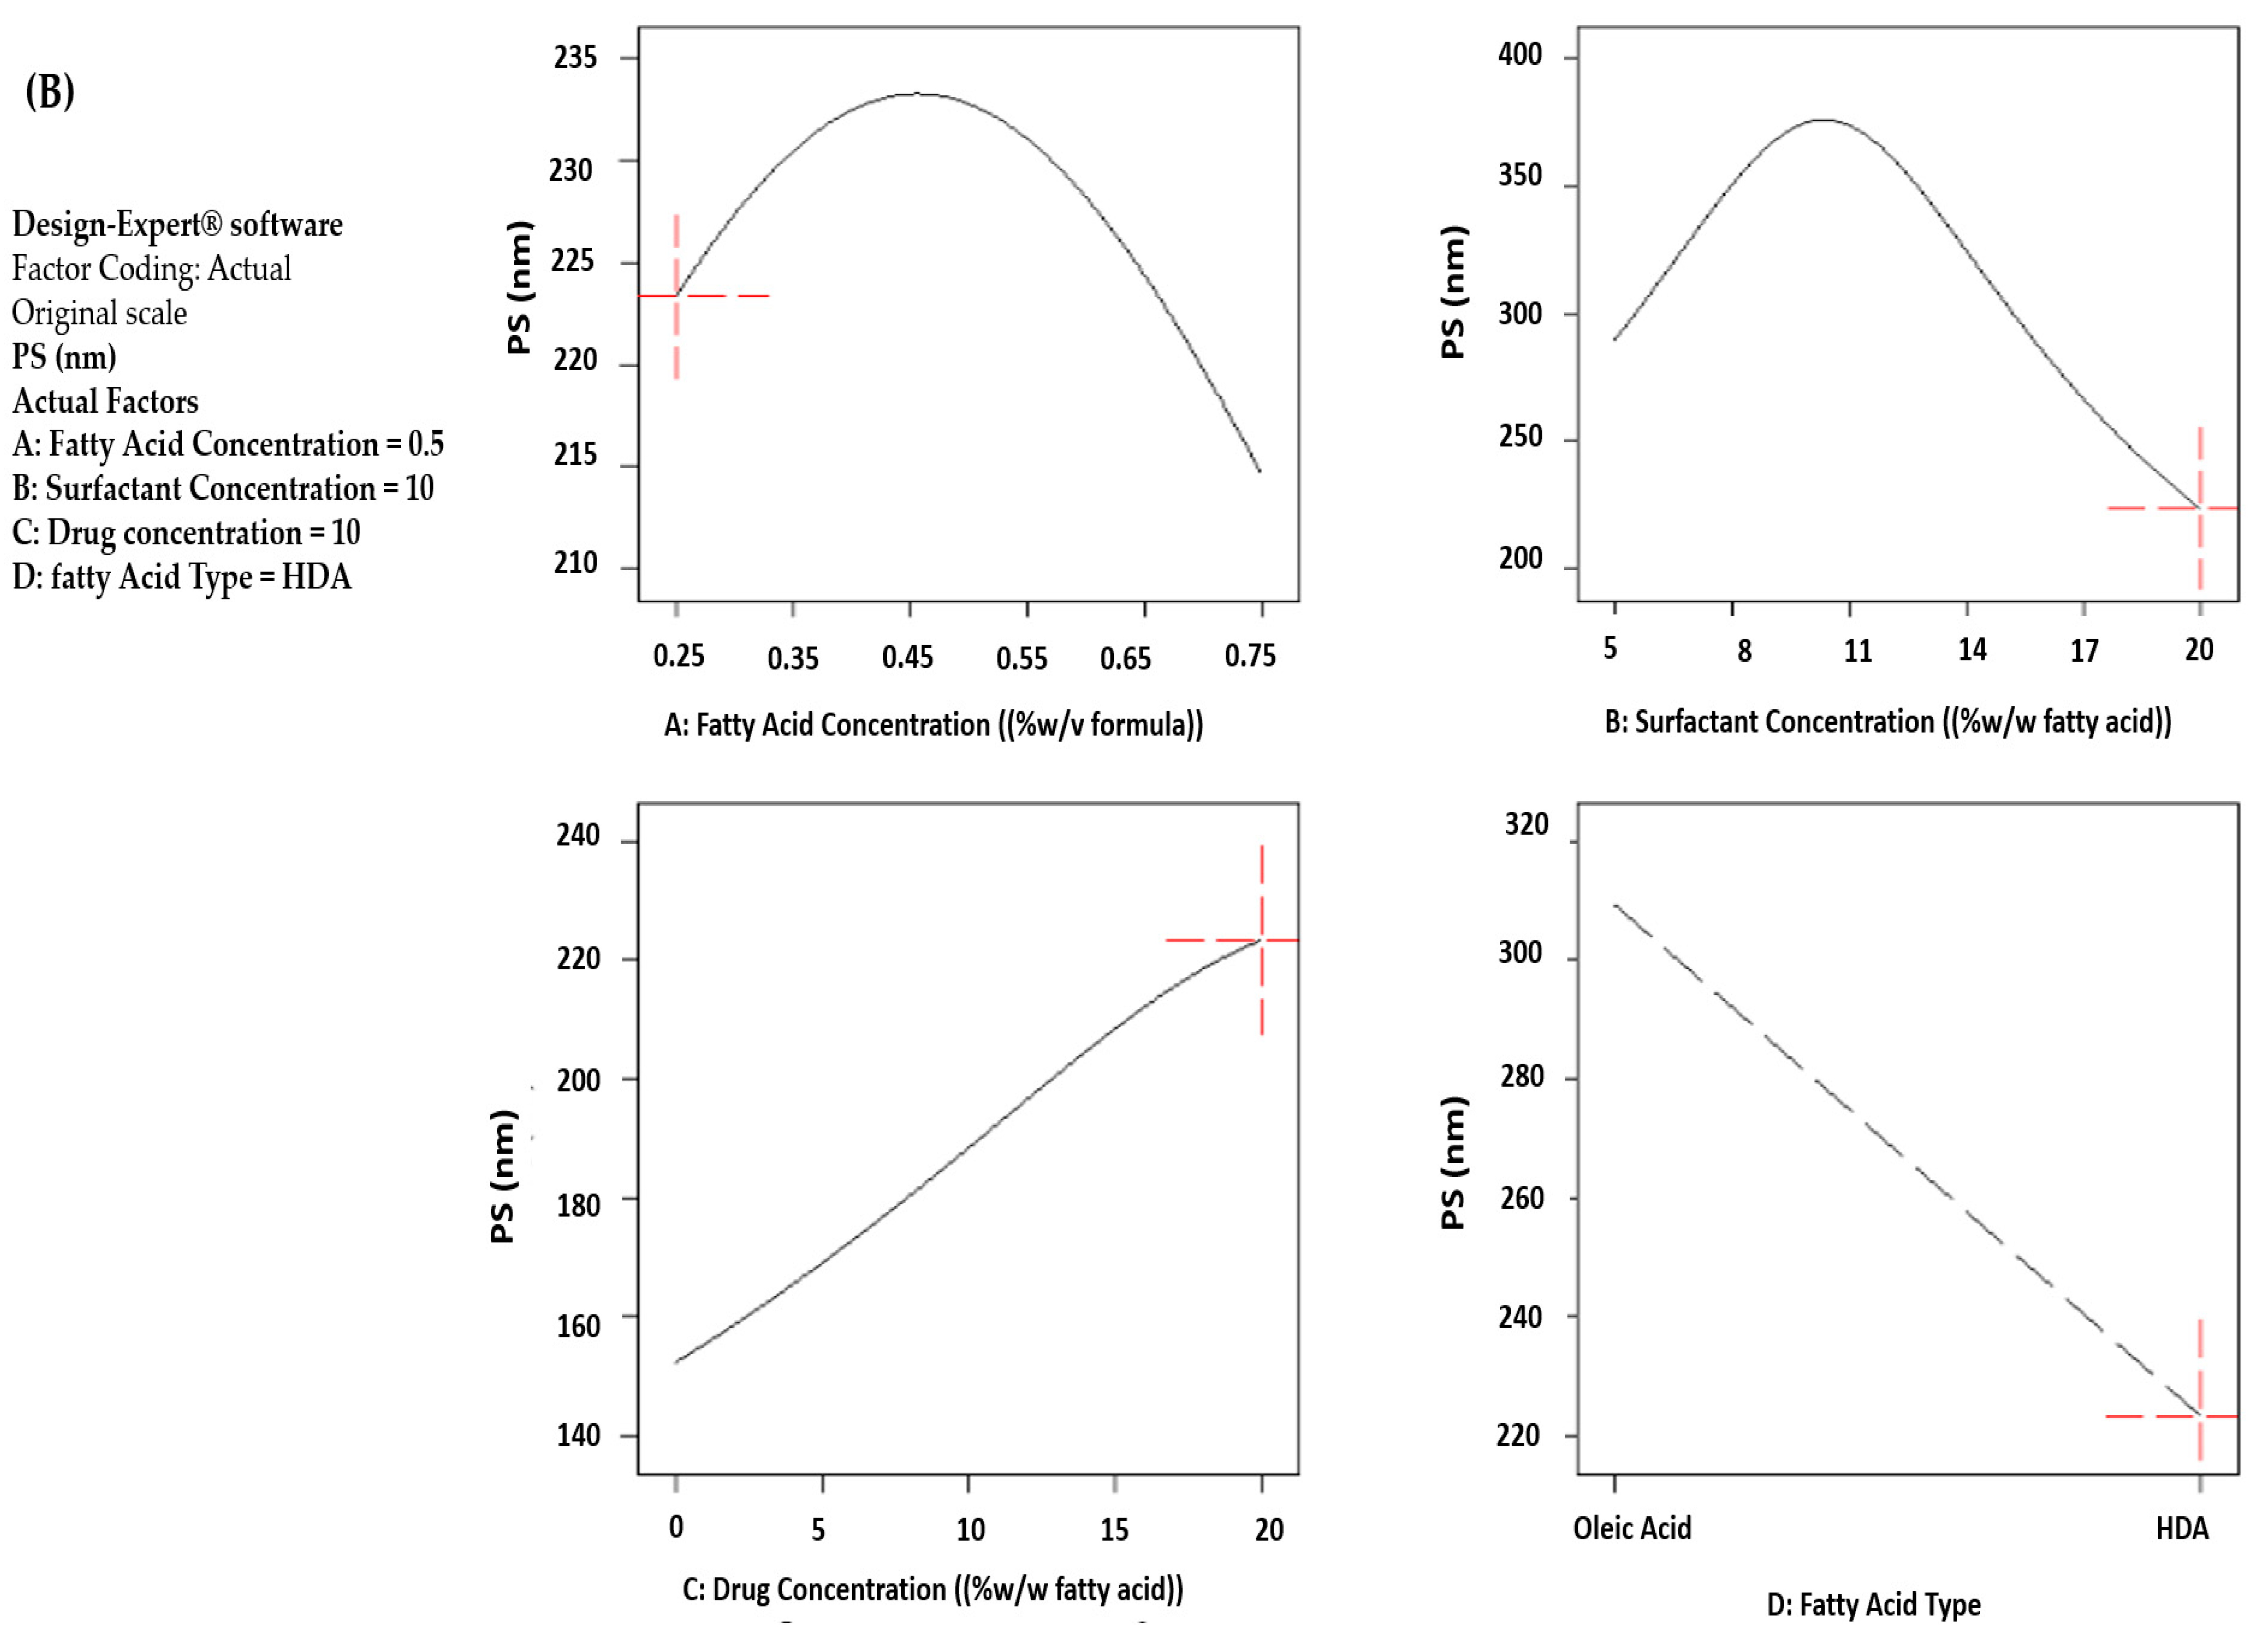
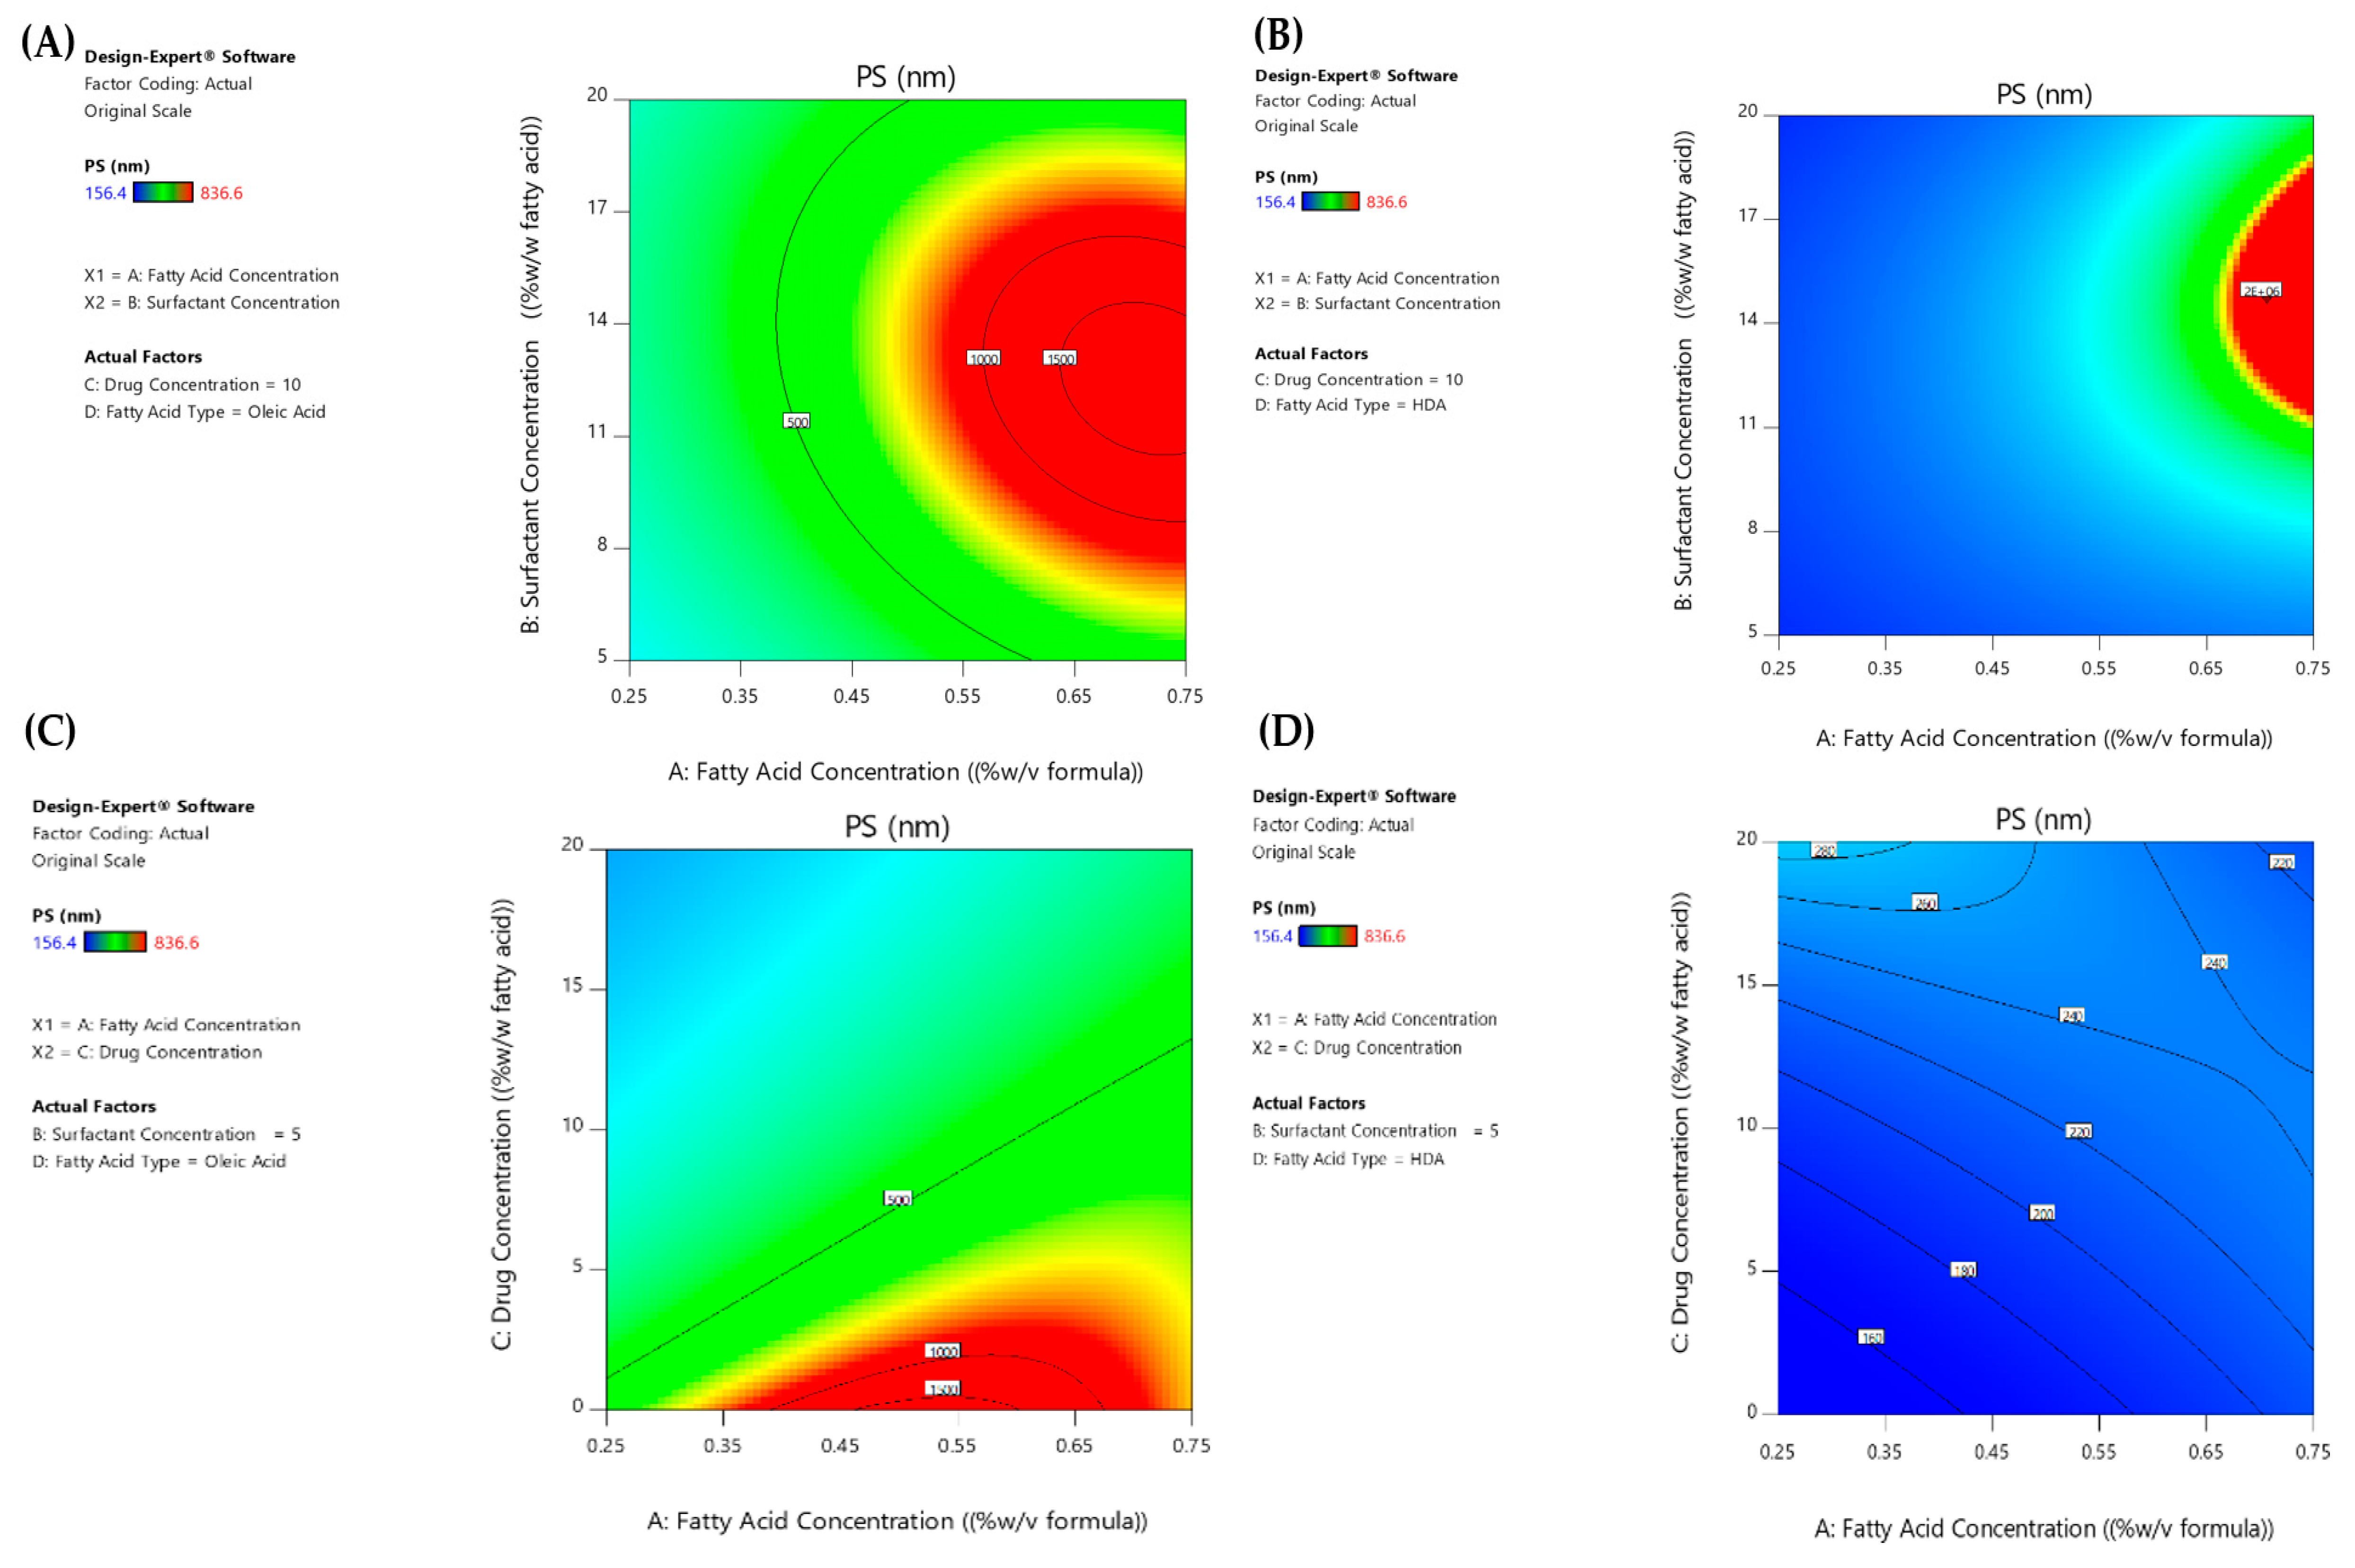
3.2.2. PS Response
Effect of Fatty Acid Concentration on PS
Effect of Mag Concentration on PS
Effect of Span®80 Concentration on PS
Effect of Fatty Acid Type on PS
Two-Way Interactions
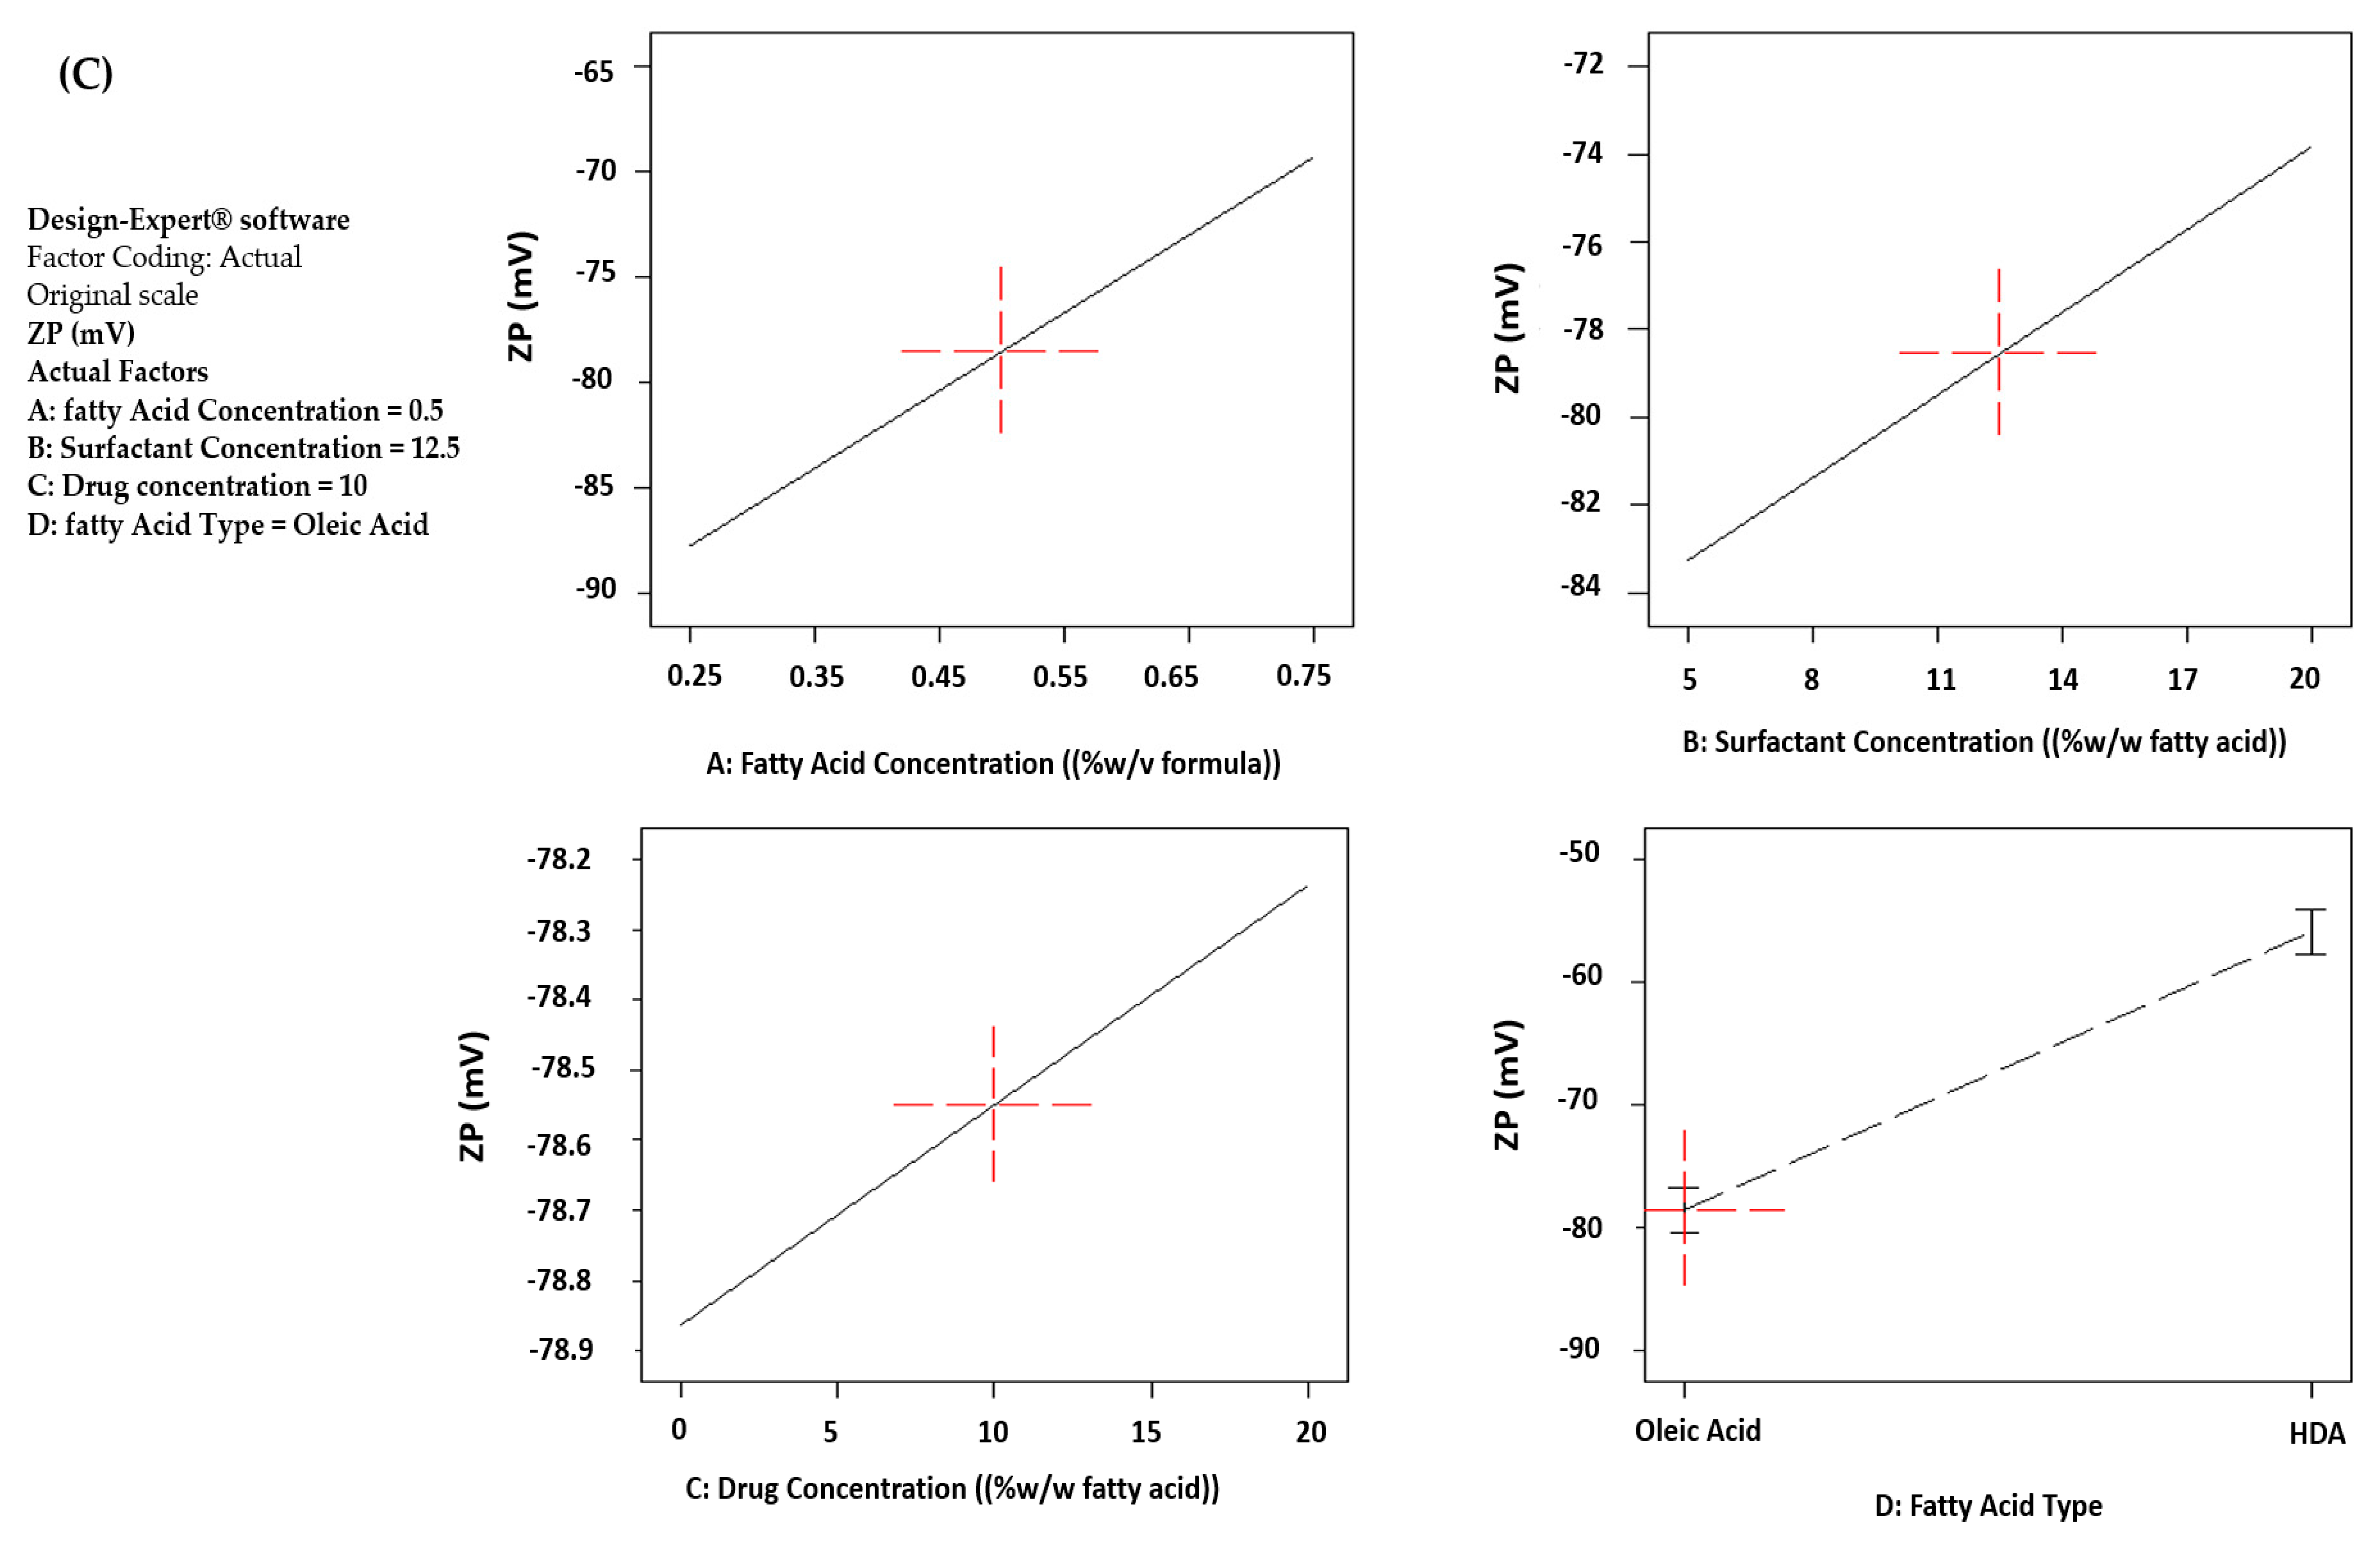
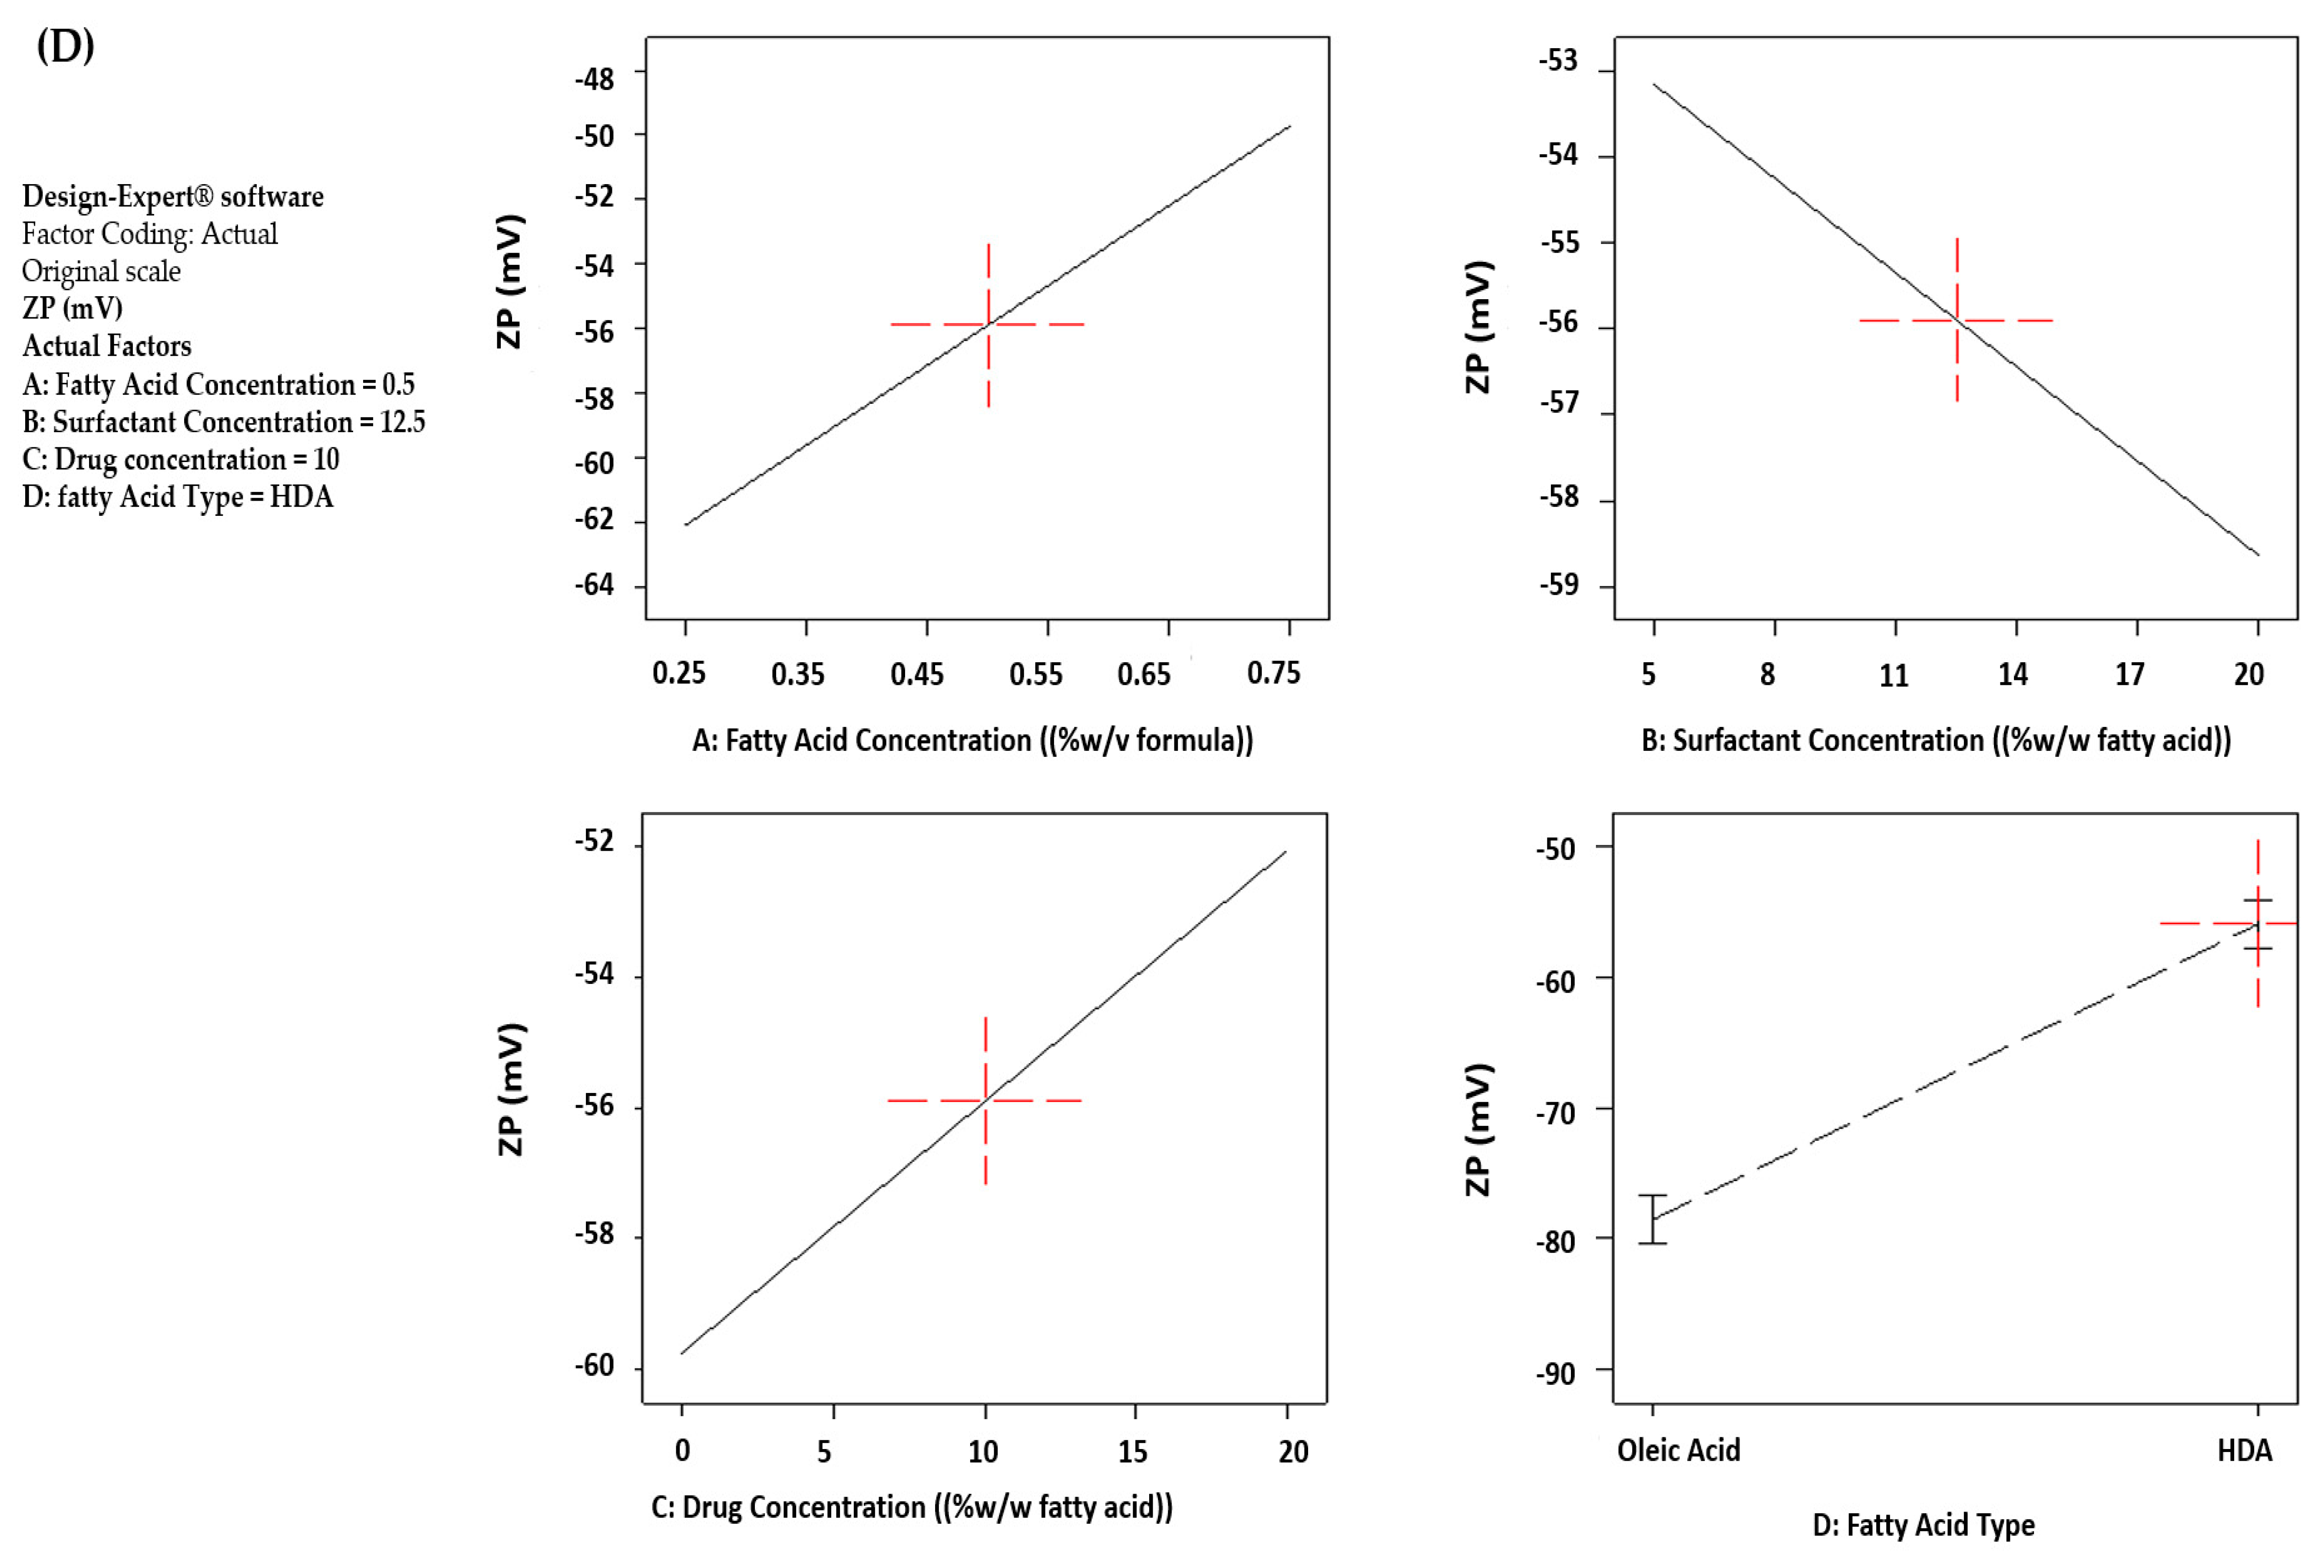
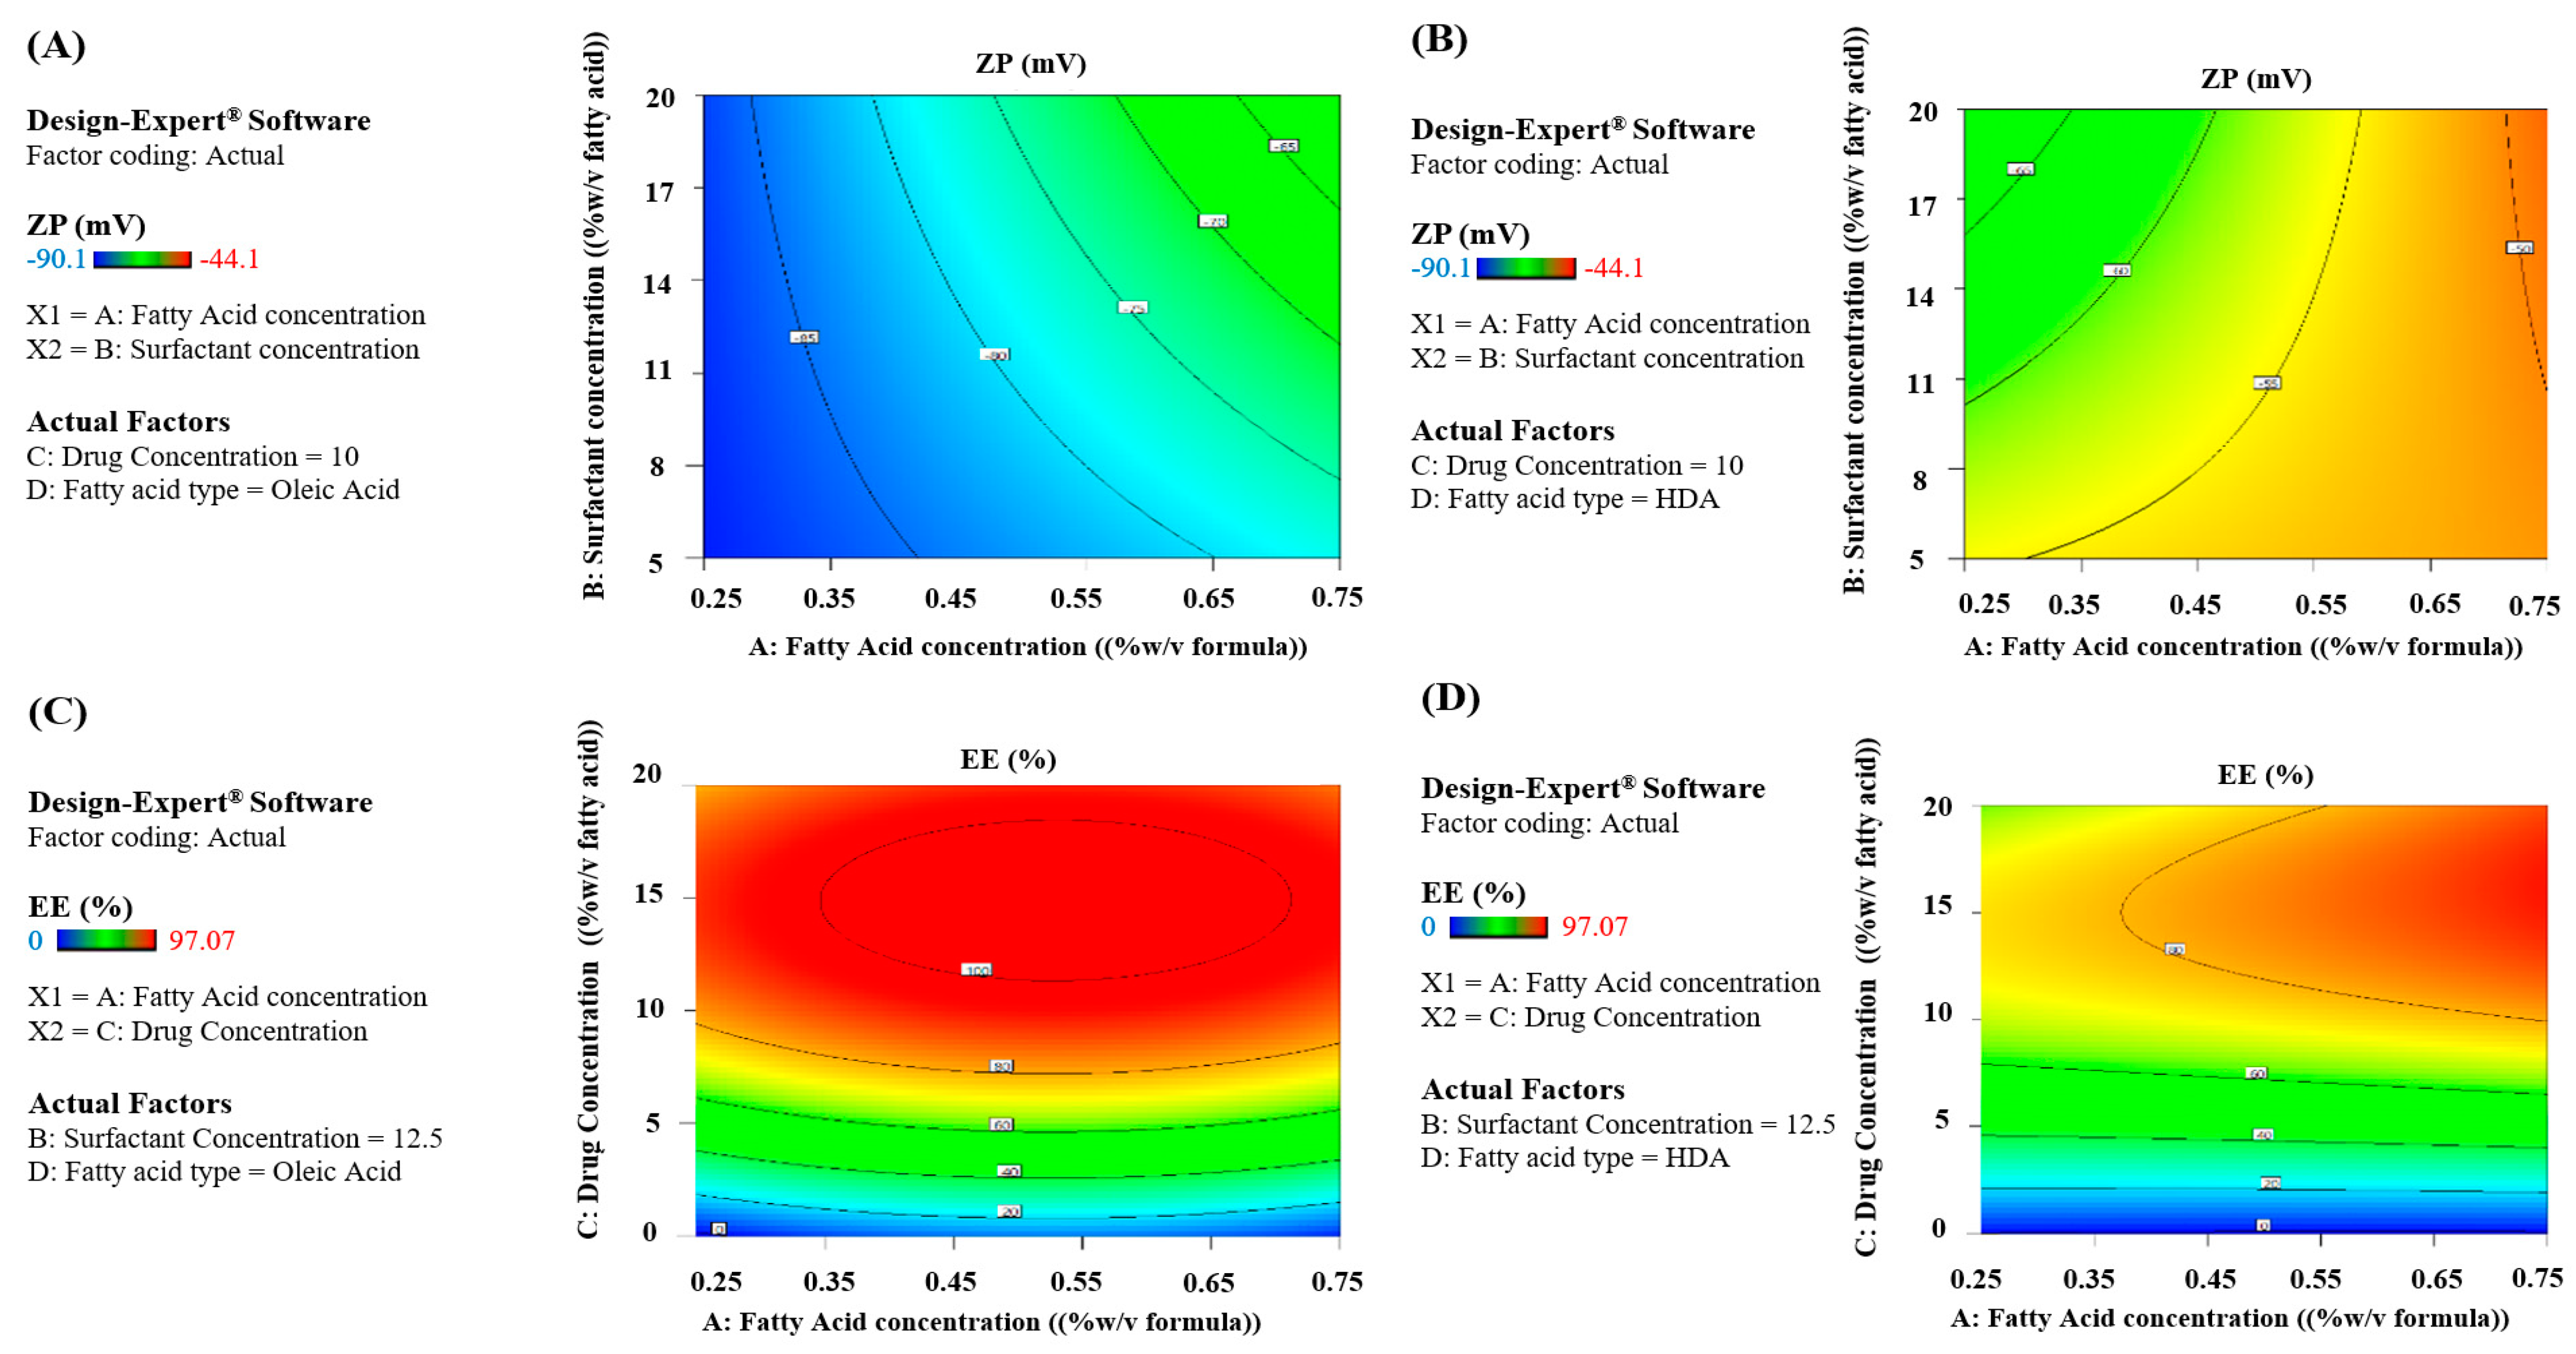
3.2.3. ZP Response
Effect of Fatty Acid Type on ZP
Effect of Fatty Acid Concentration on ZP
Two-Way Interactions
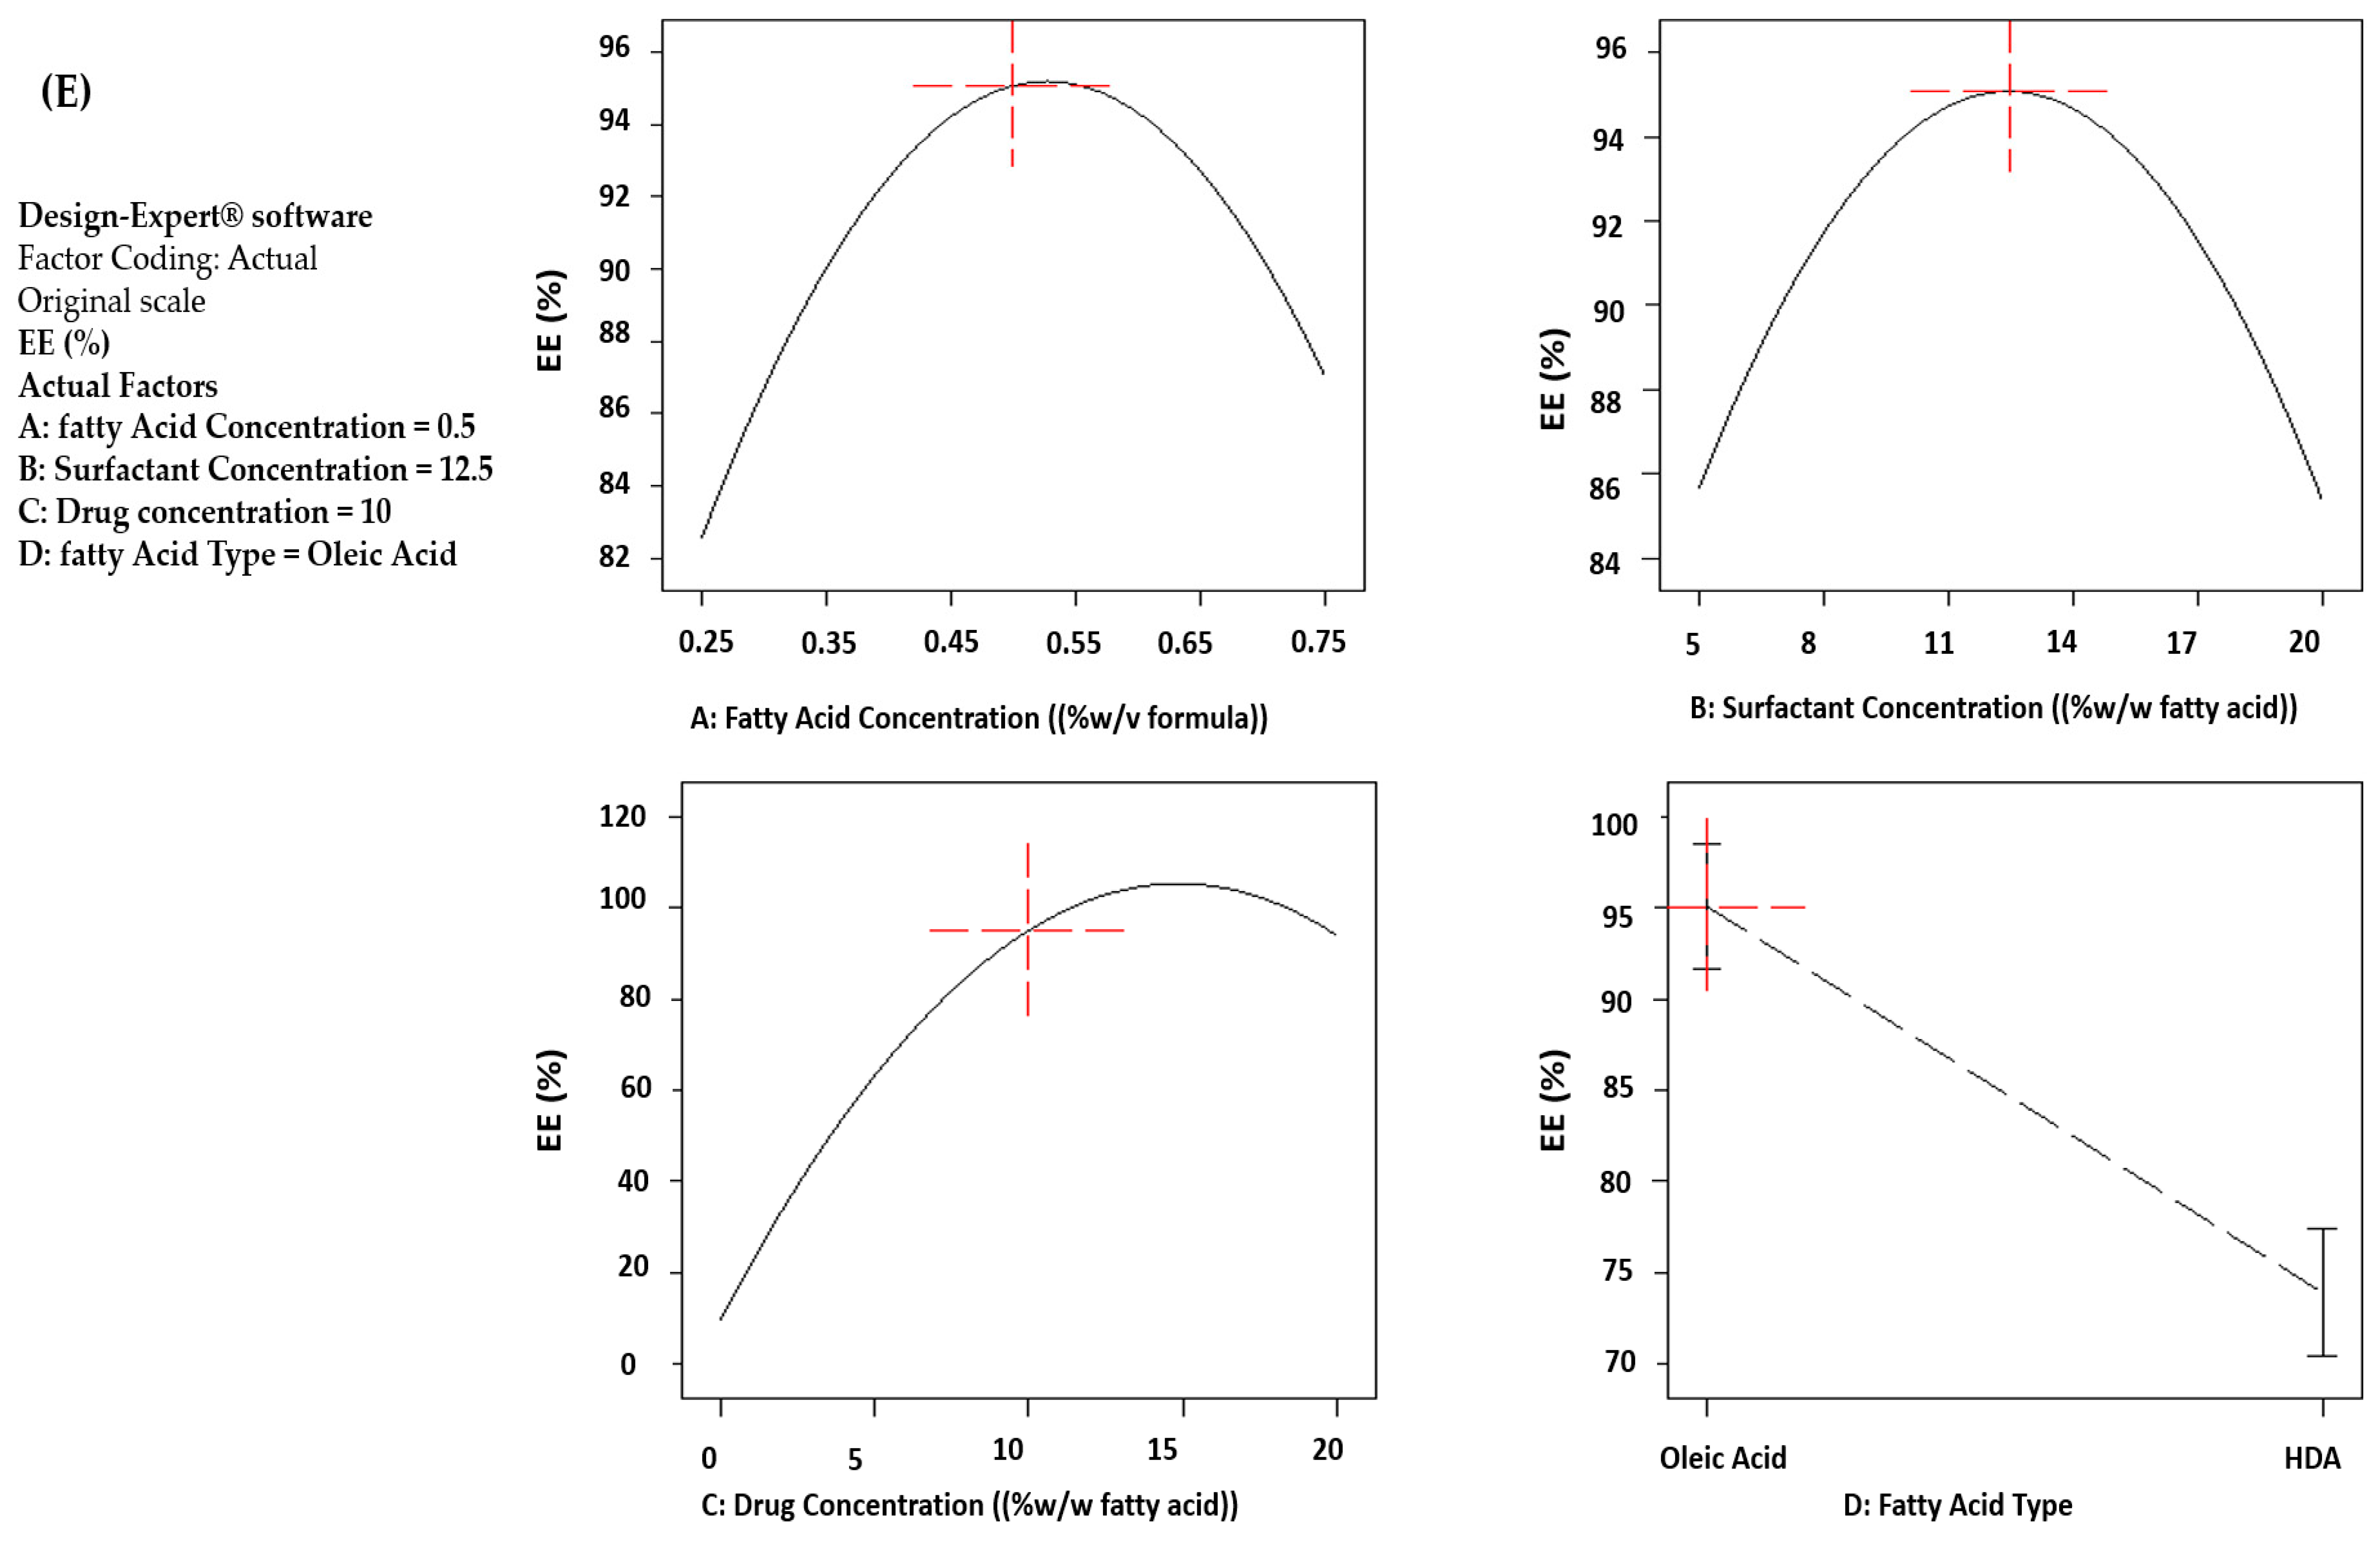
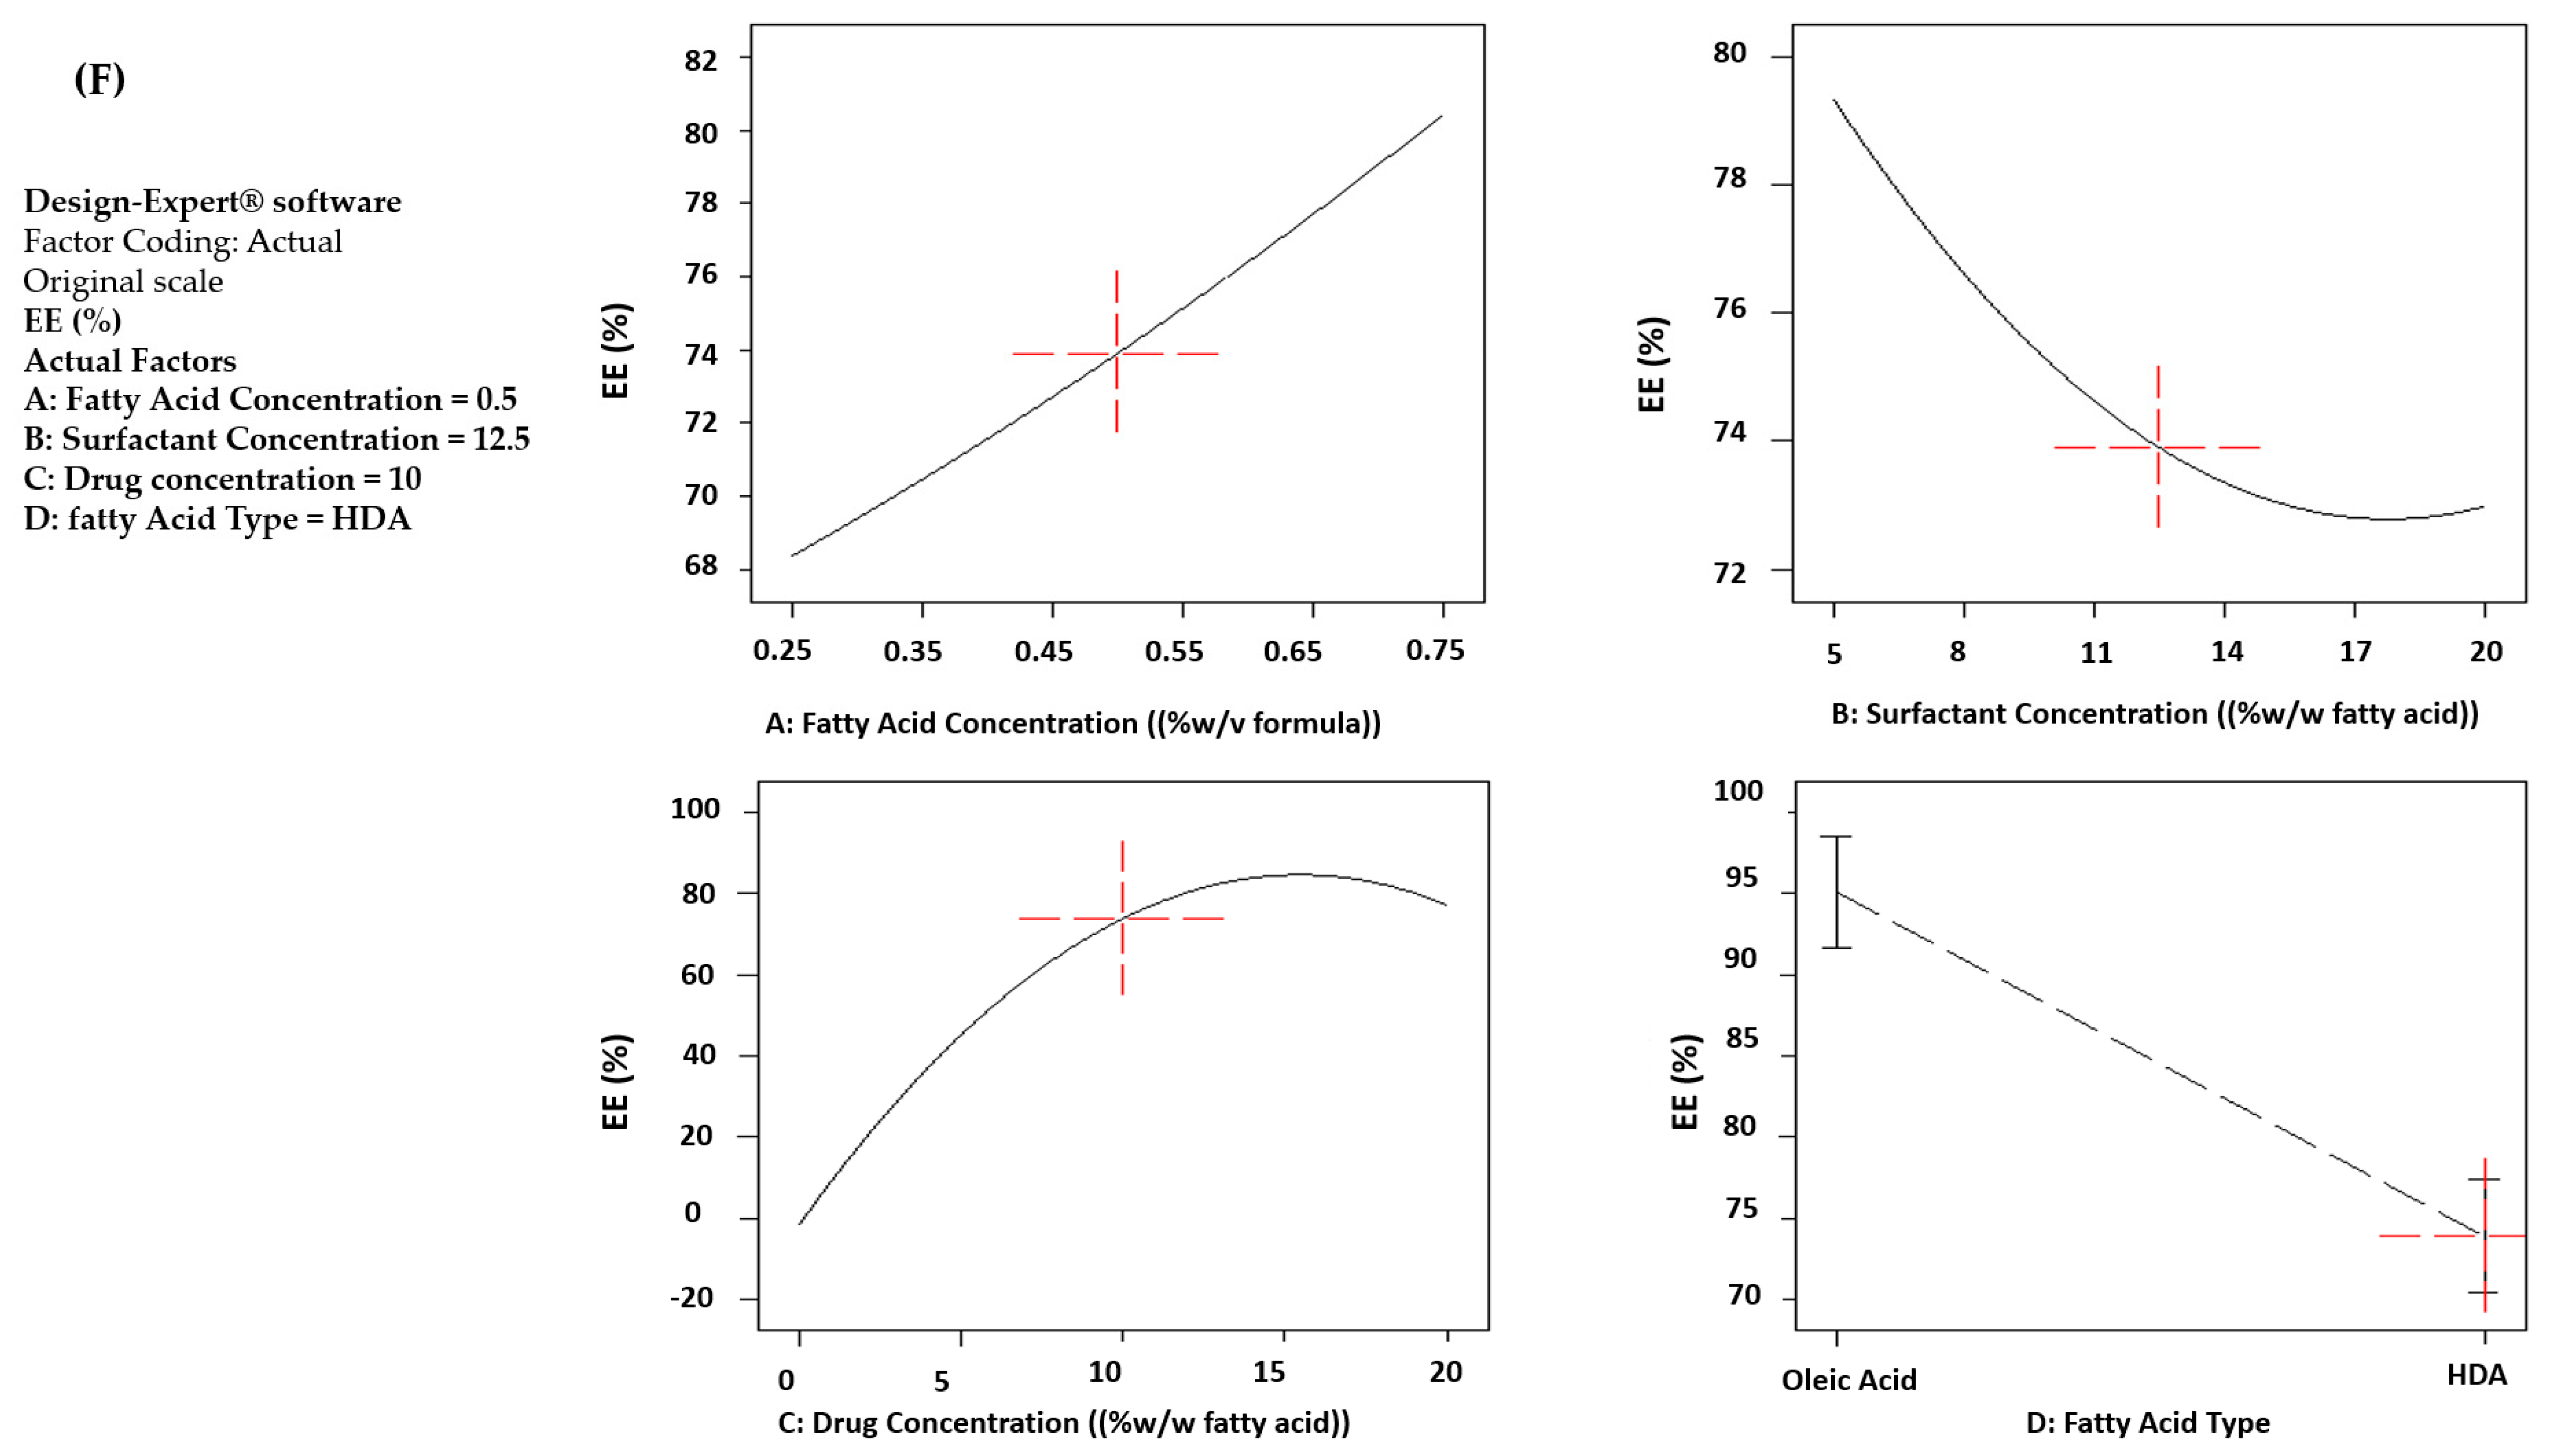
3.2.4. EE Response
Effect of Fatty Acid Concentration on EE
Effect of Drug Concentration on EE
Effect of Fatty Acid Type on EE
Two-Way Interactions
3.2.5. Model Validation
3.2.6. Optimization Analysis
3.3. Characterization of the Optimized Fatty Acid Vesicles
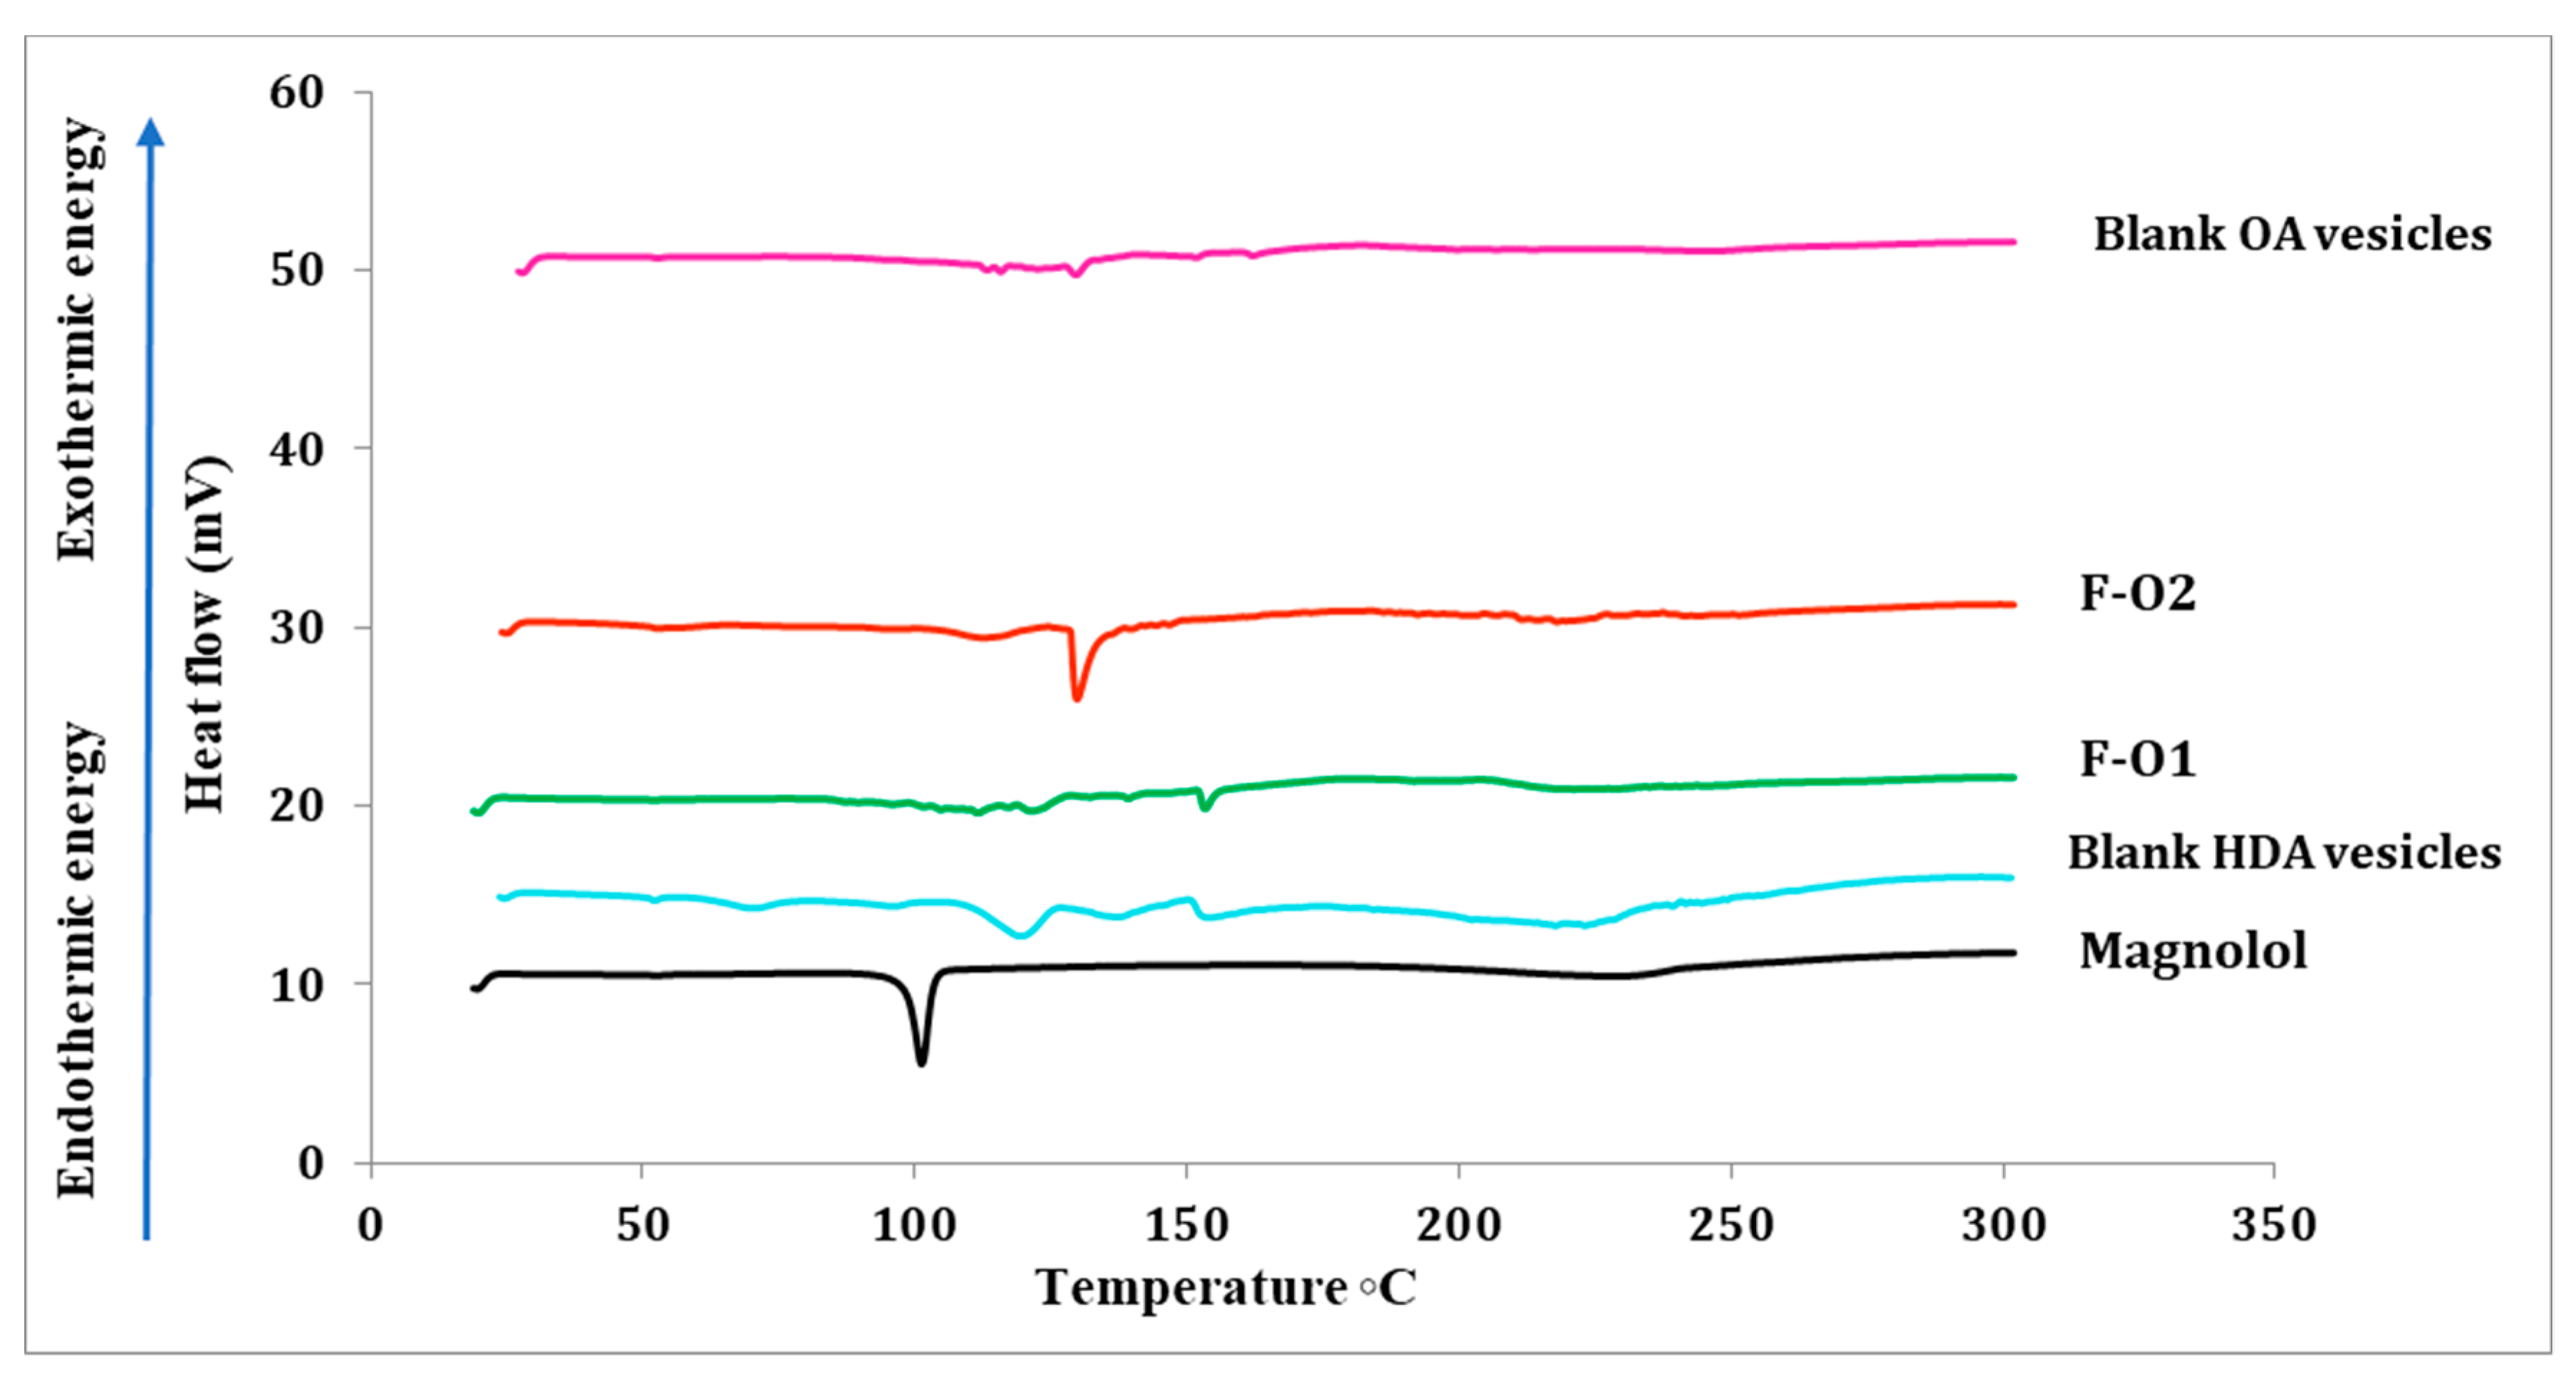
3.3.1. Differential Scanning Calorimetry (DSC)
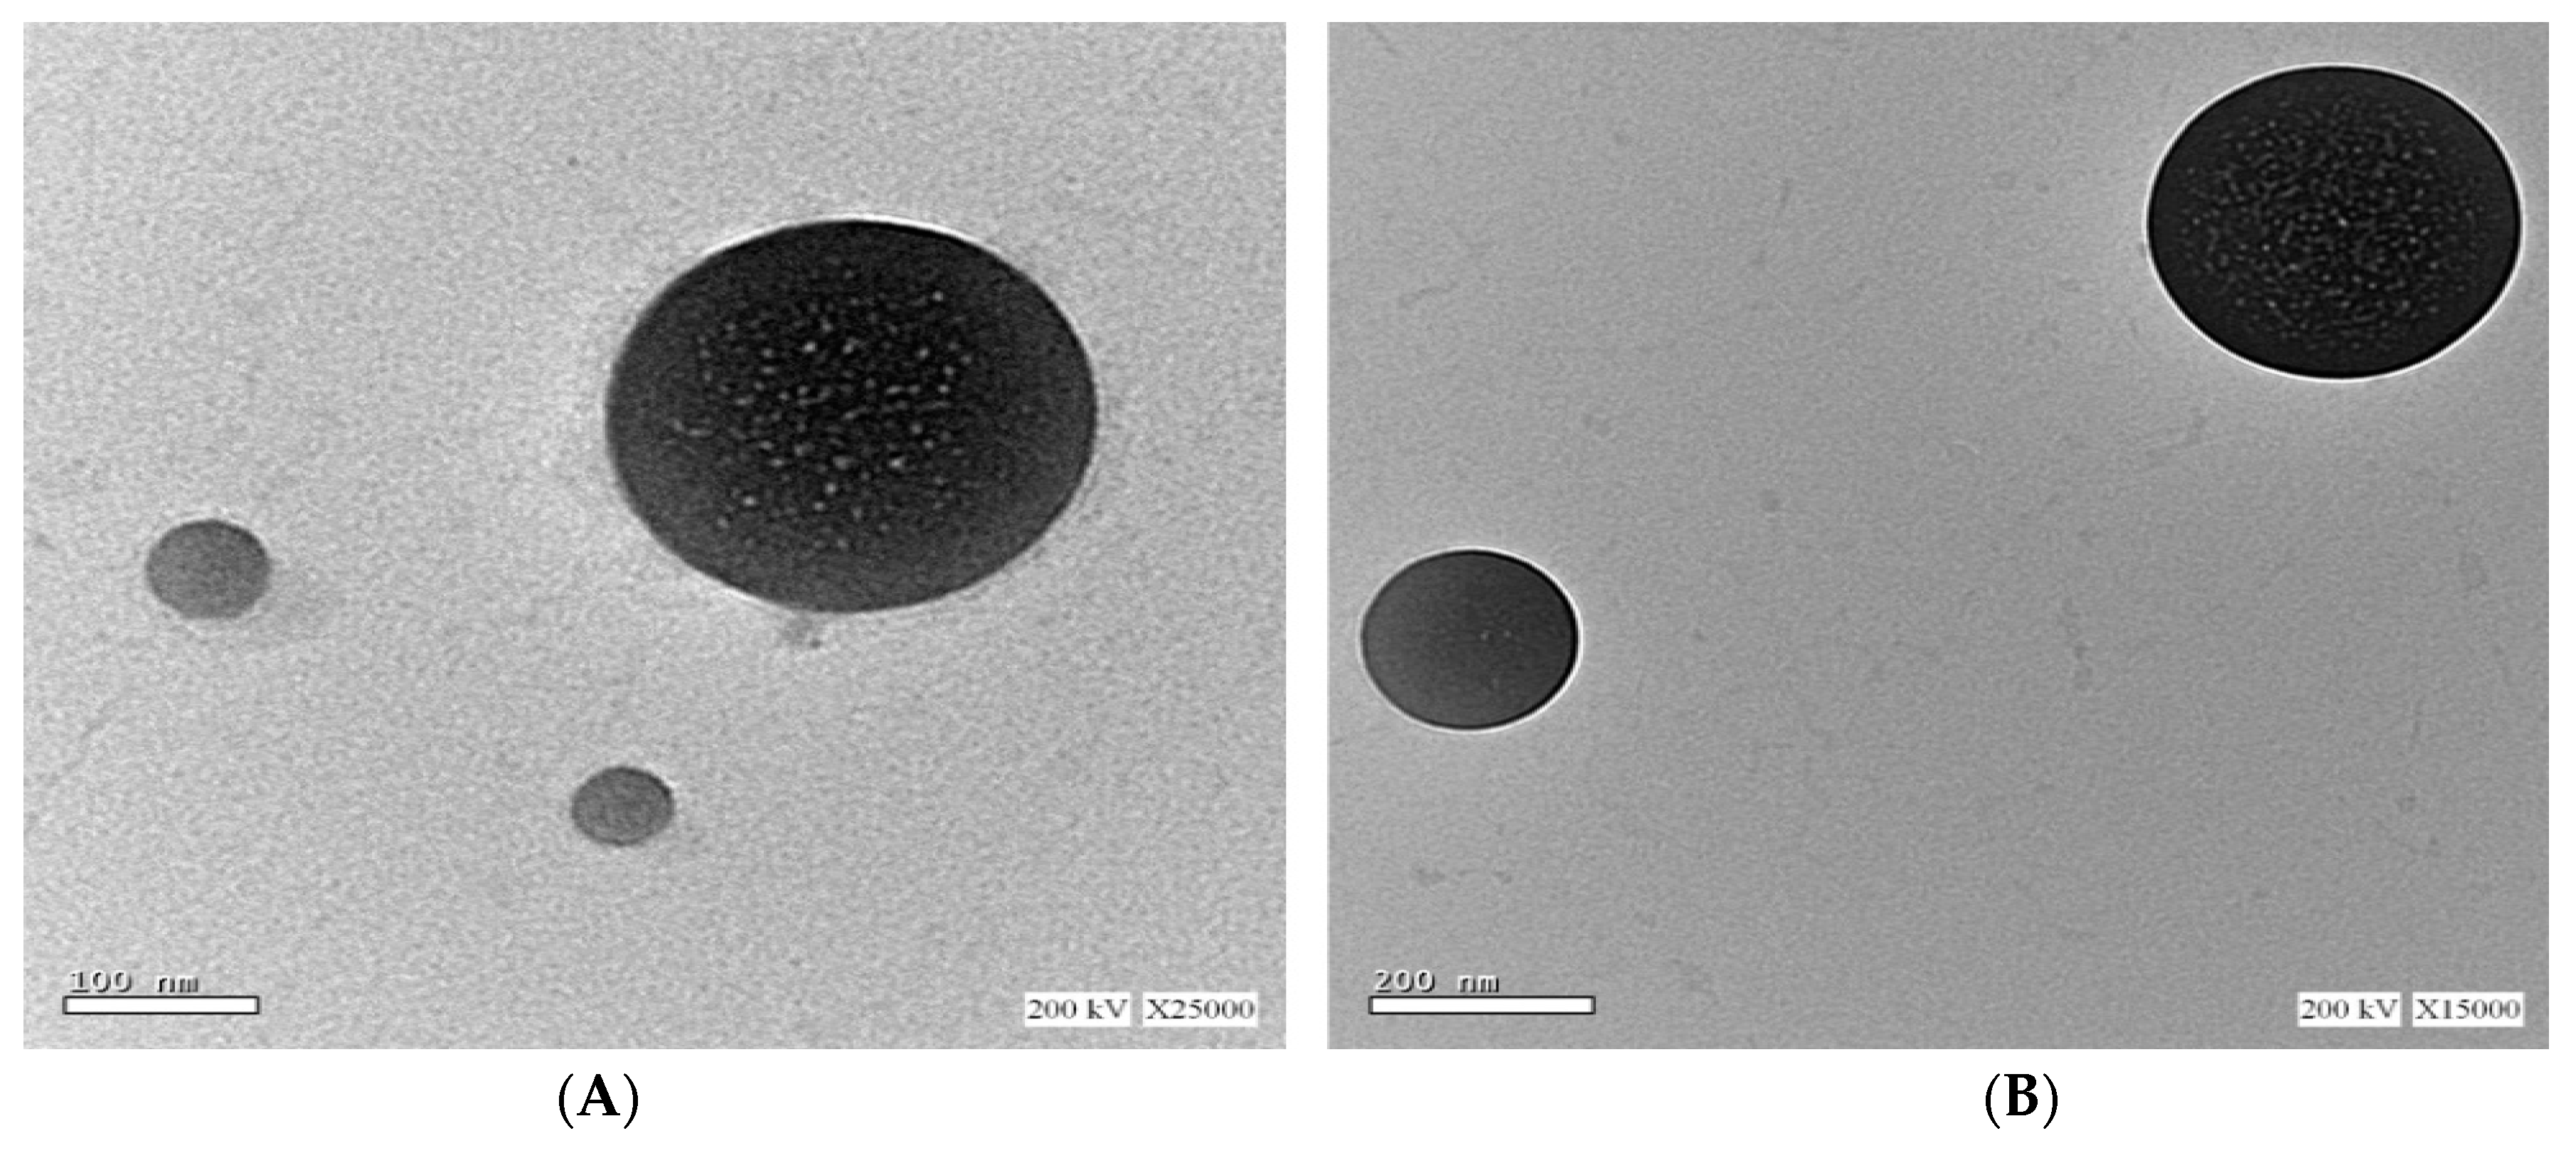
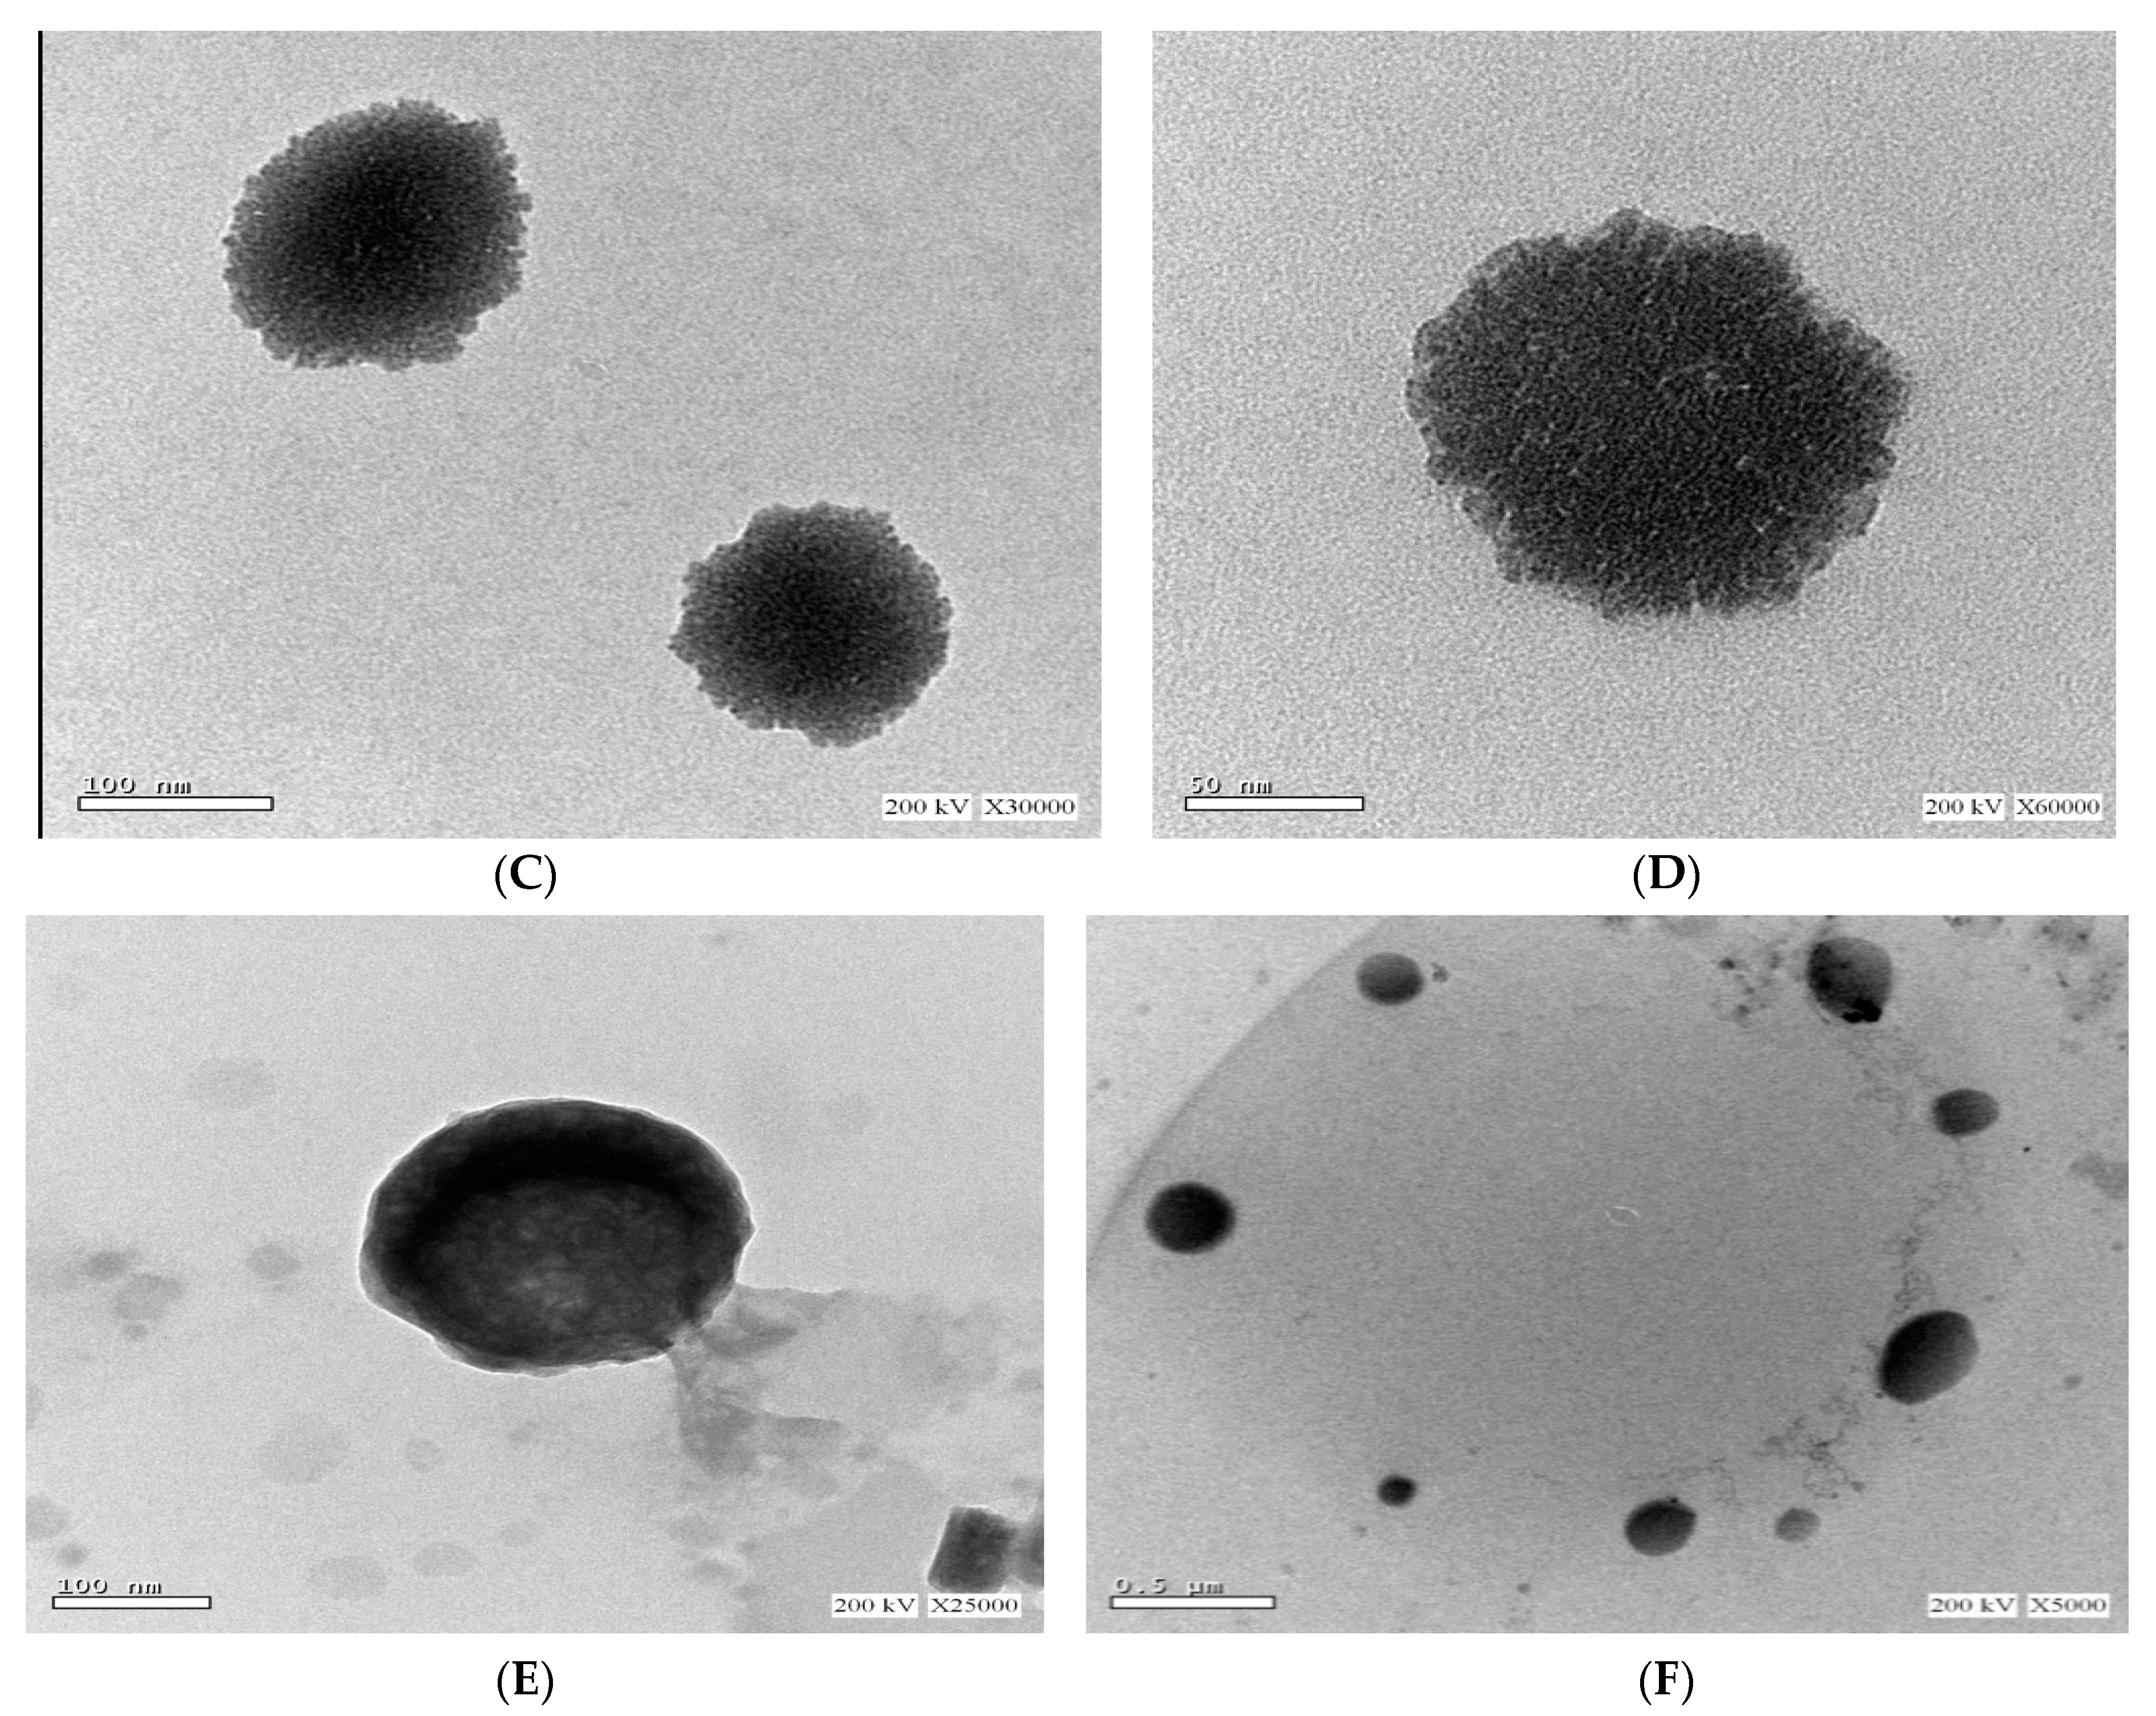
3.3.2. TEM Imaging
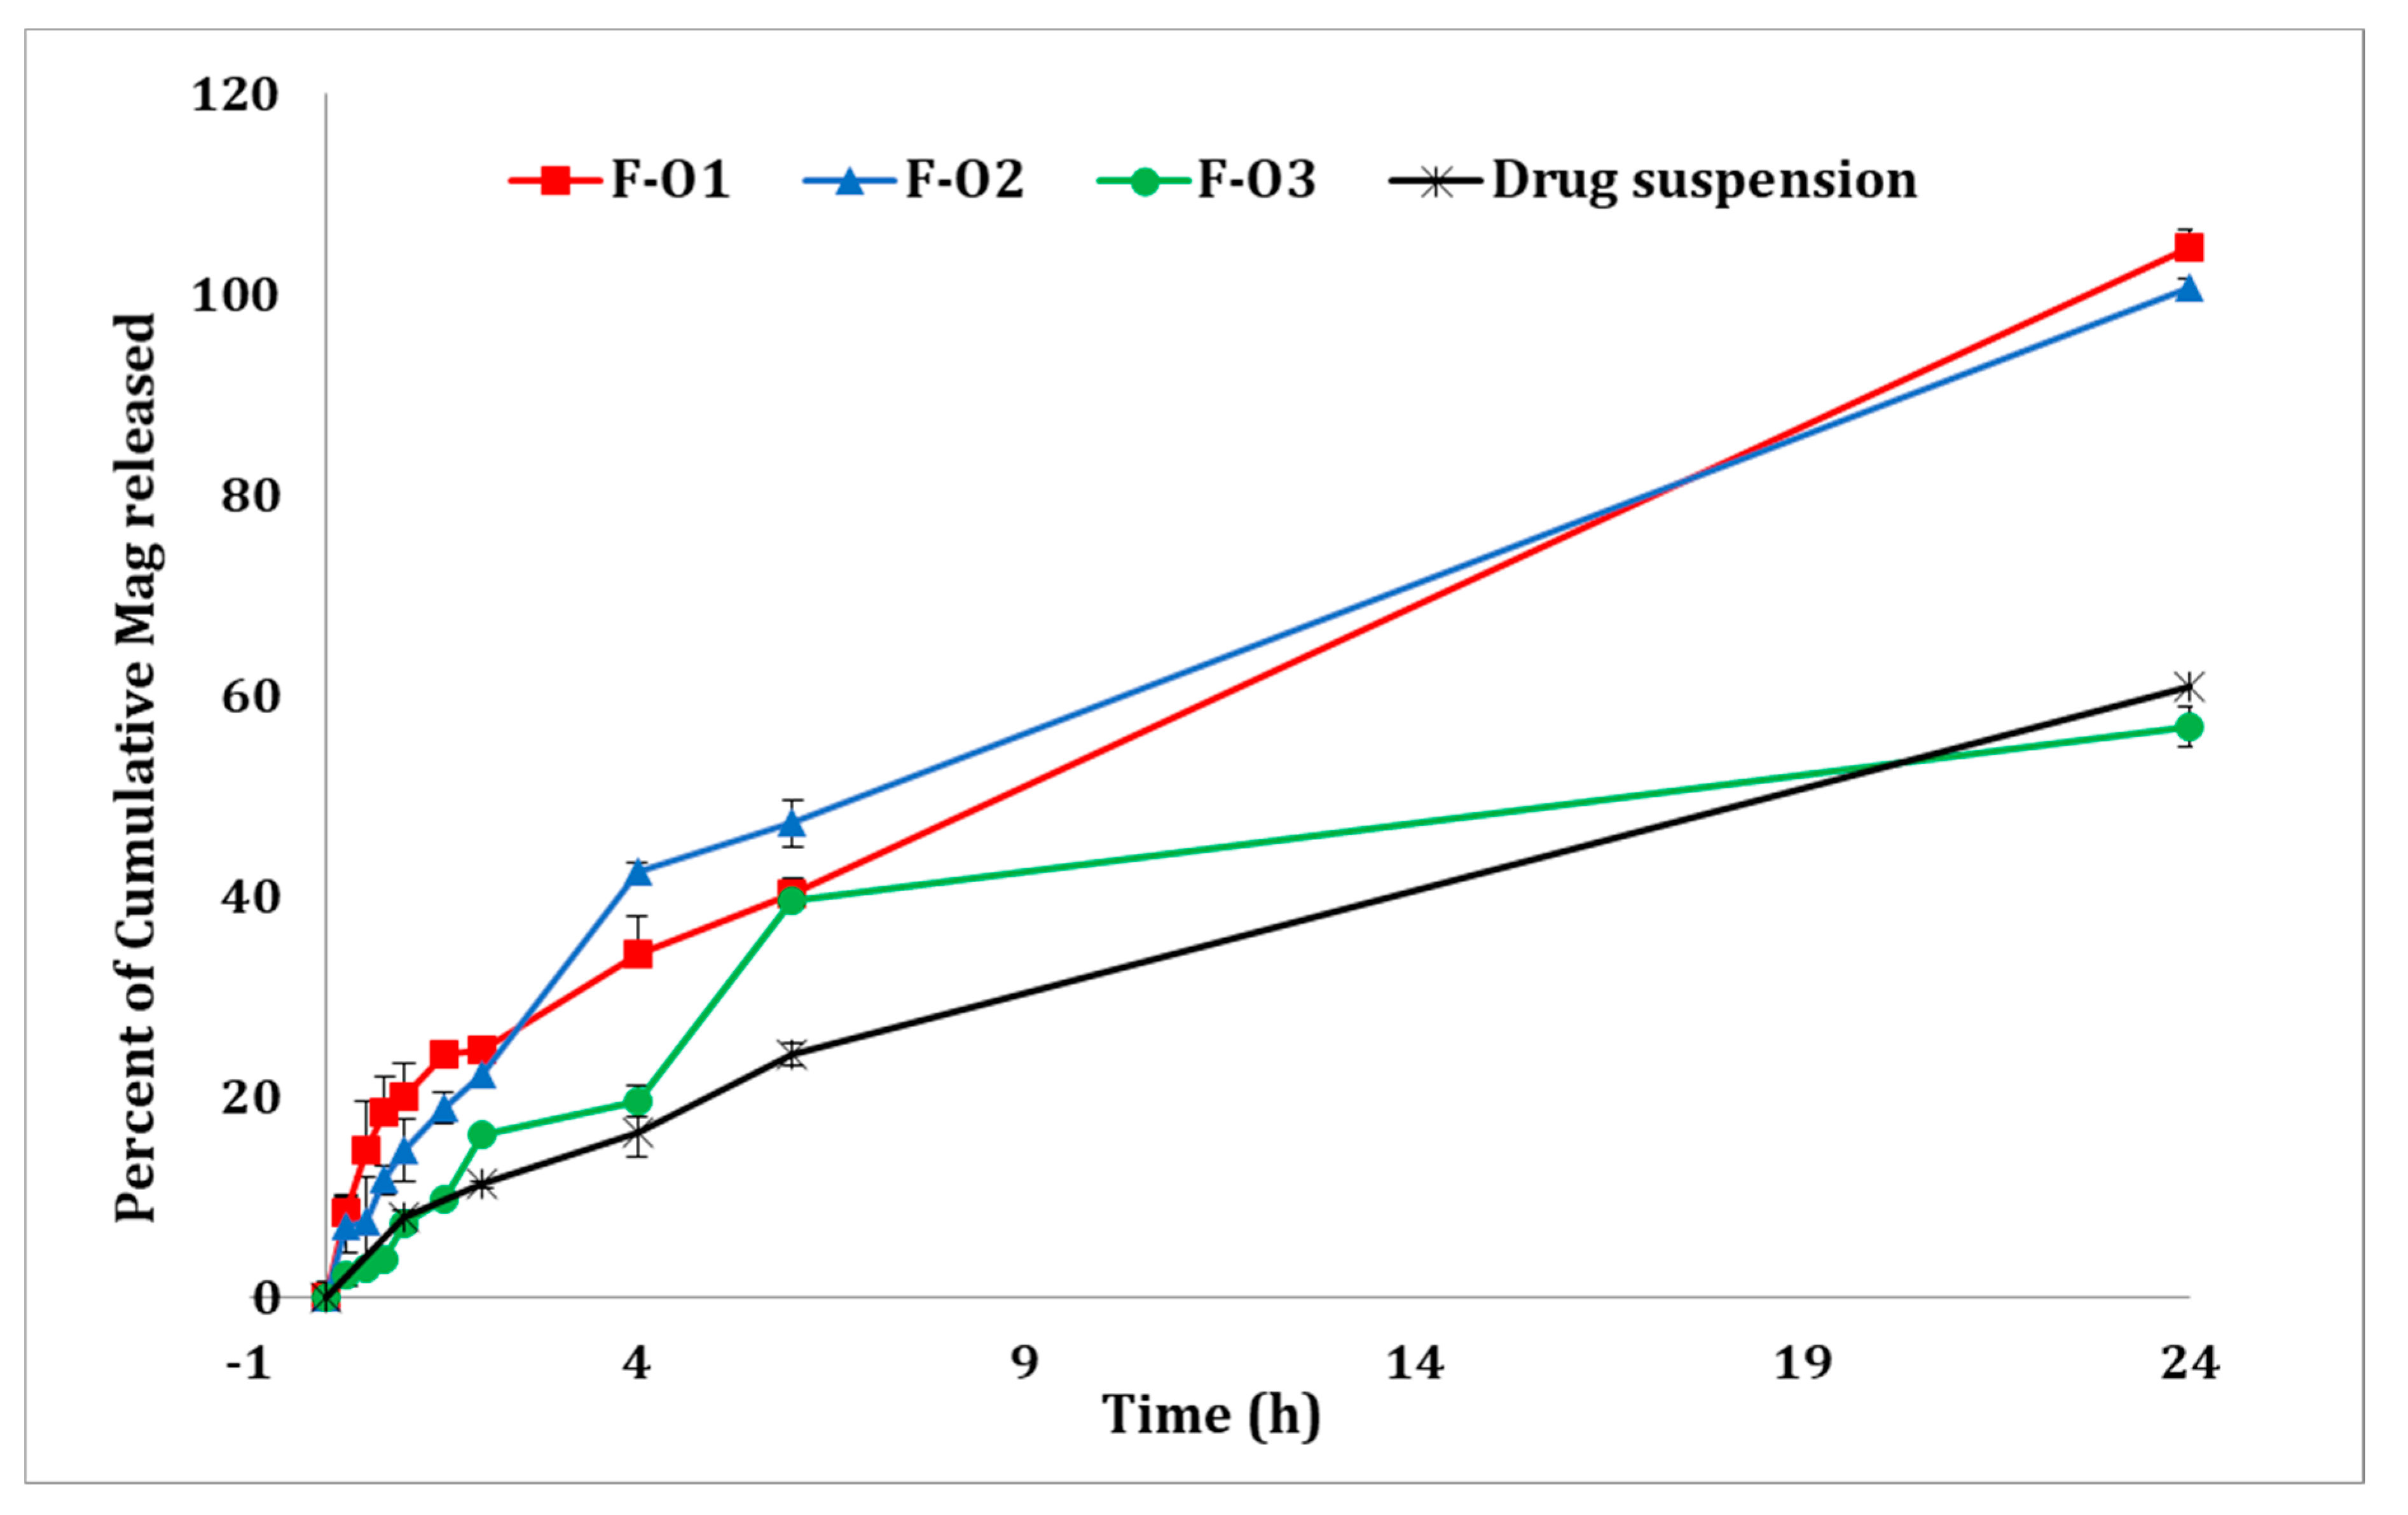
3.4. In Vitro Drug Release Studies
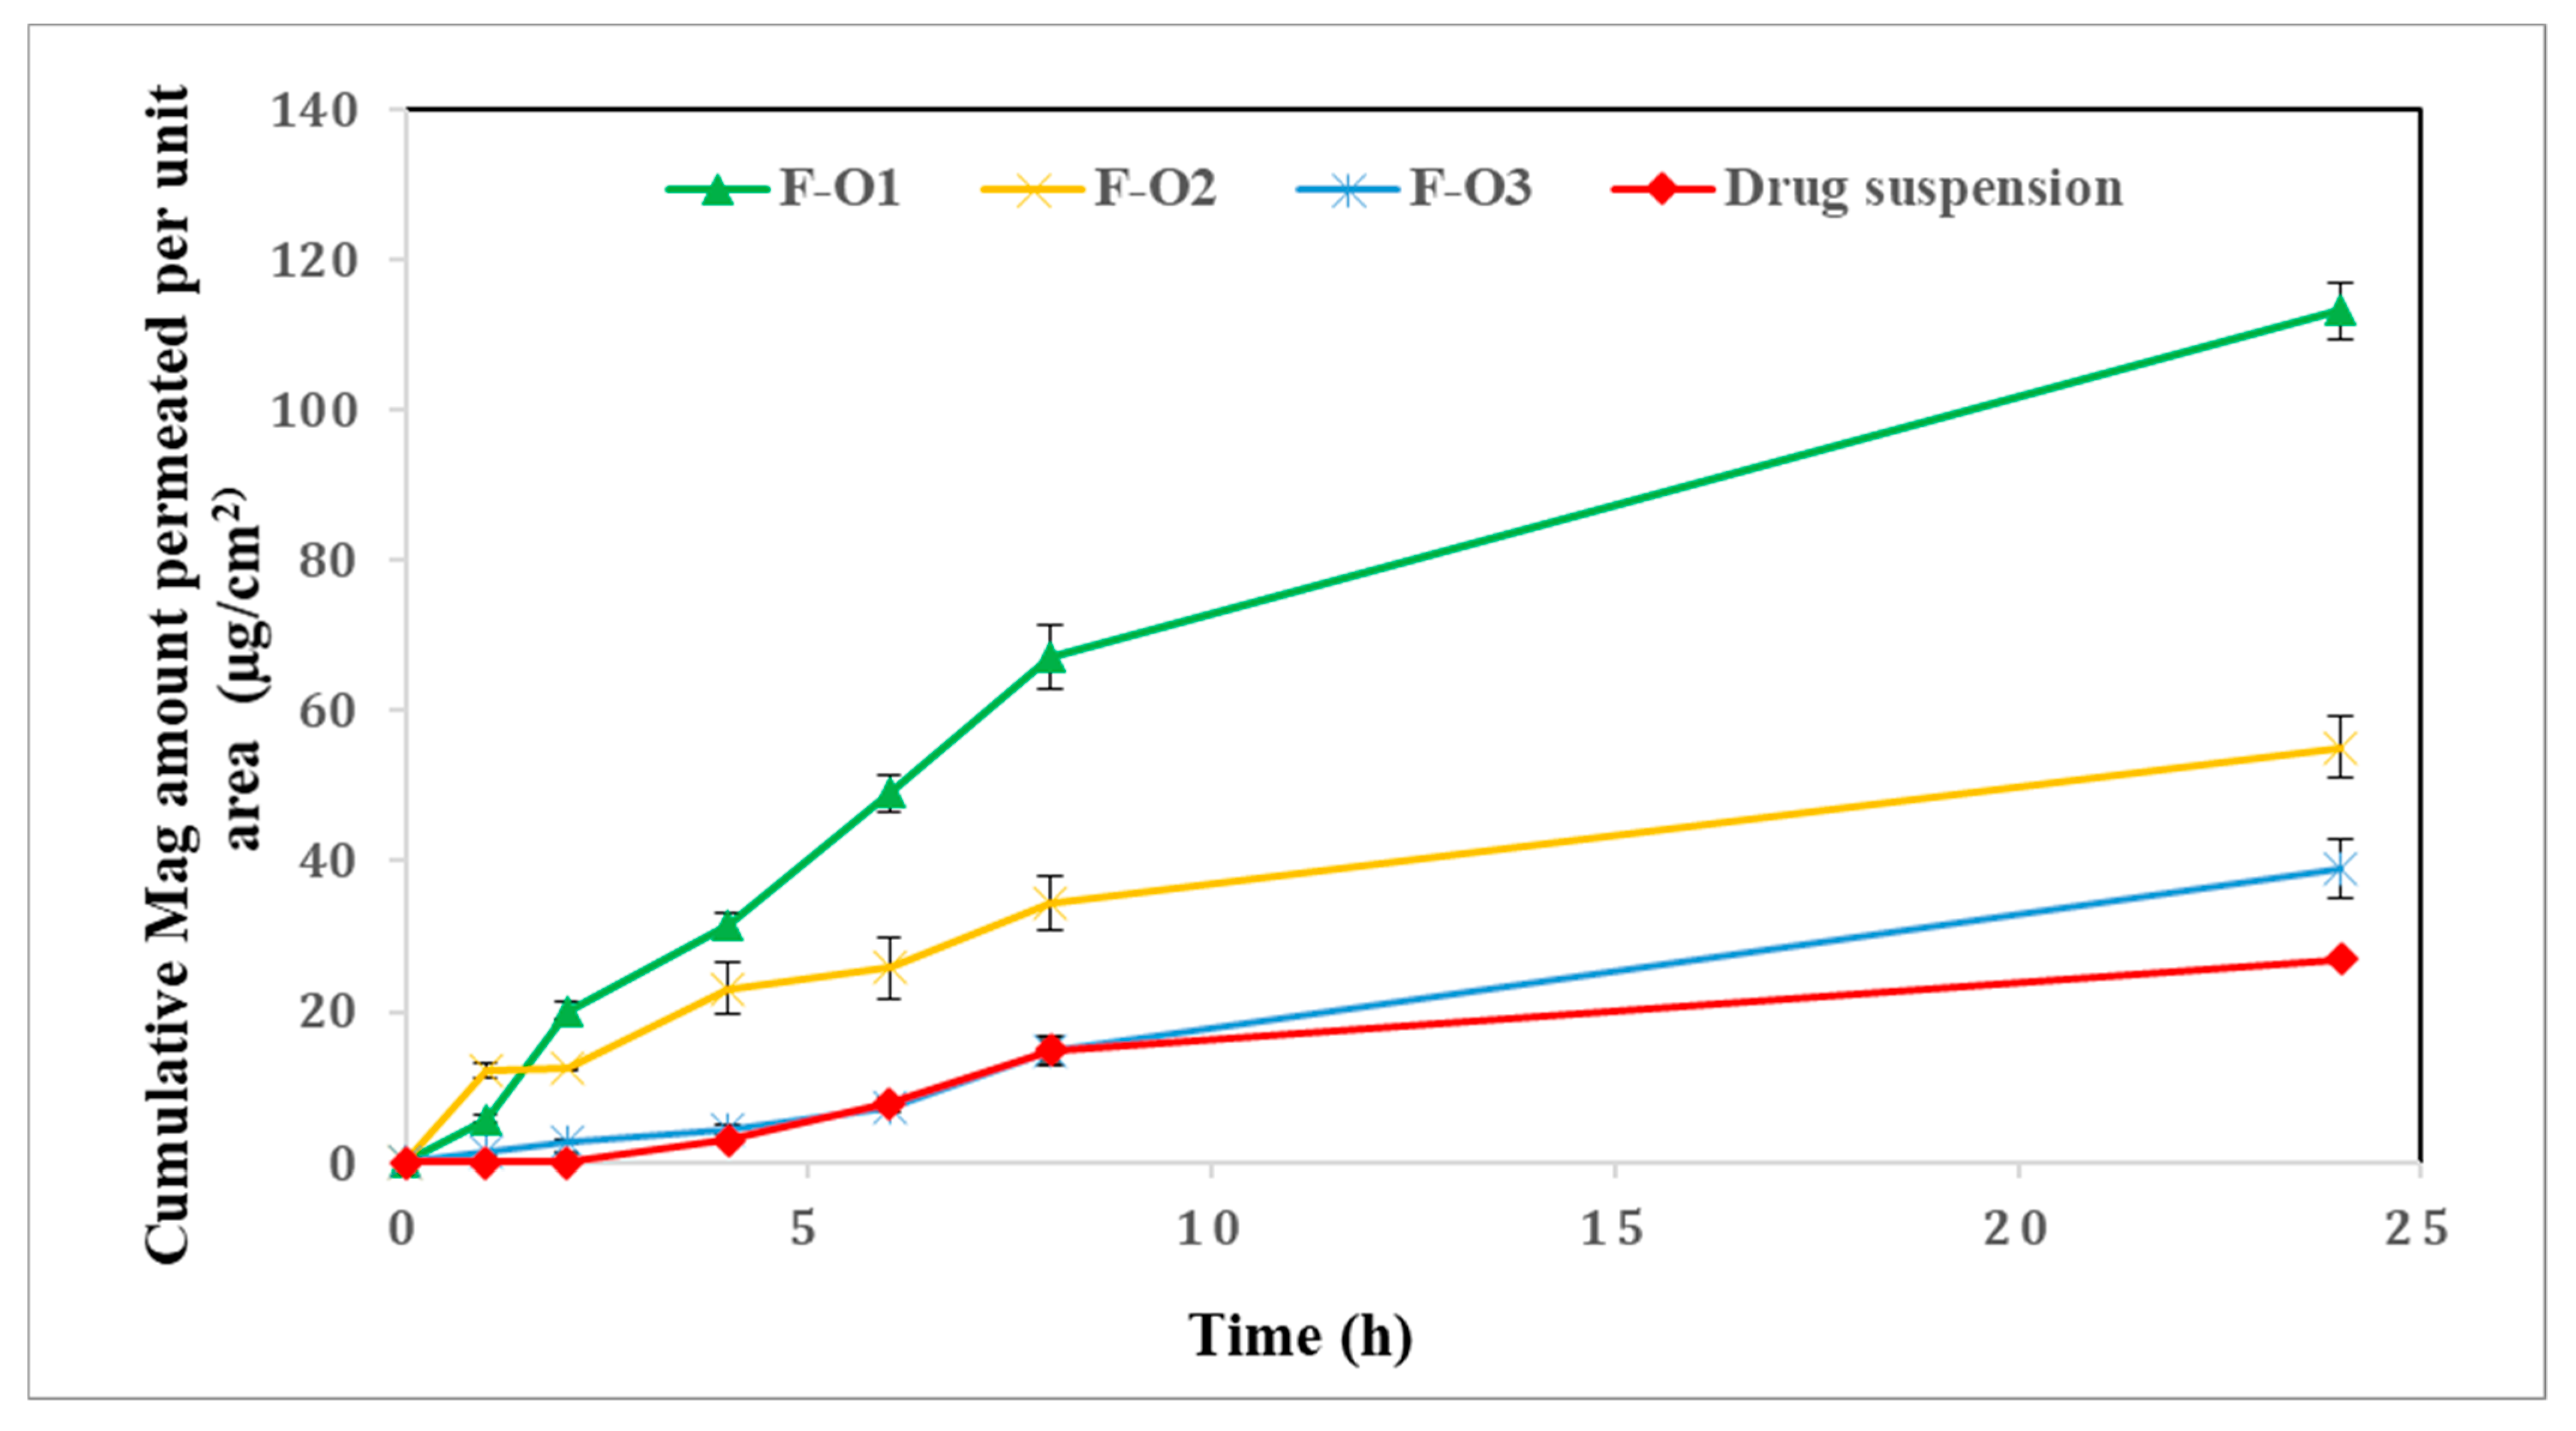
3.5. Ex Vivo Skin Permeation Studies
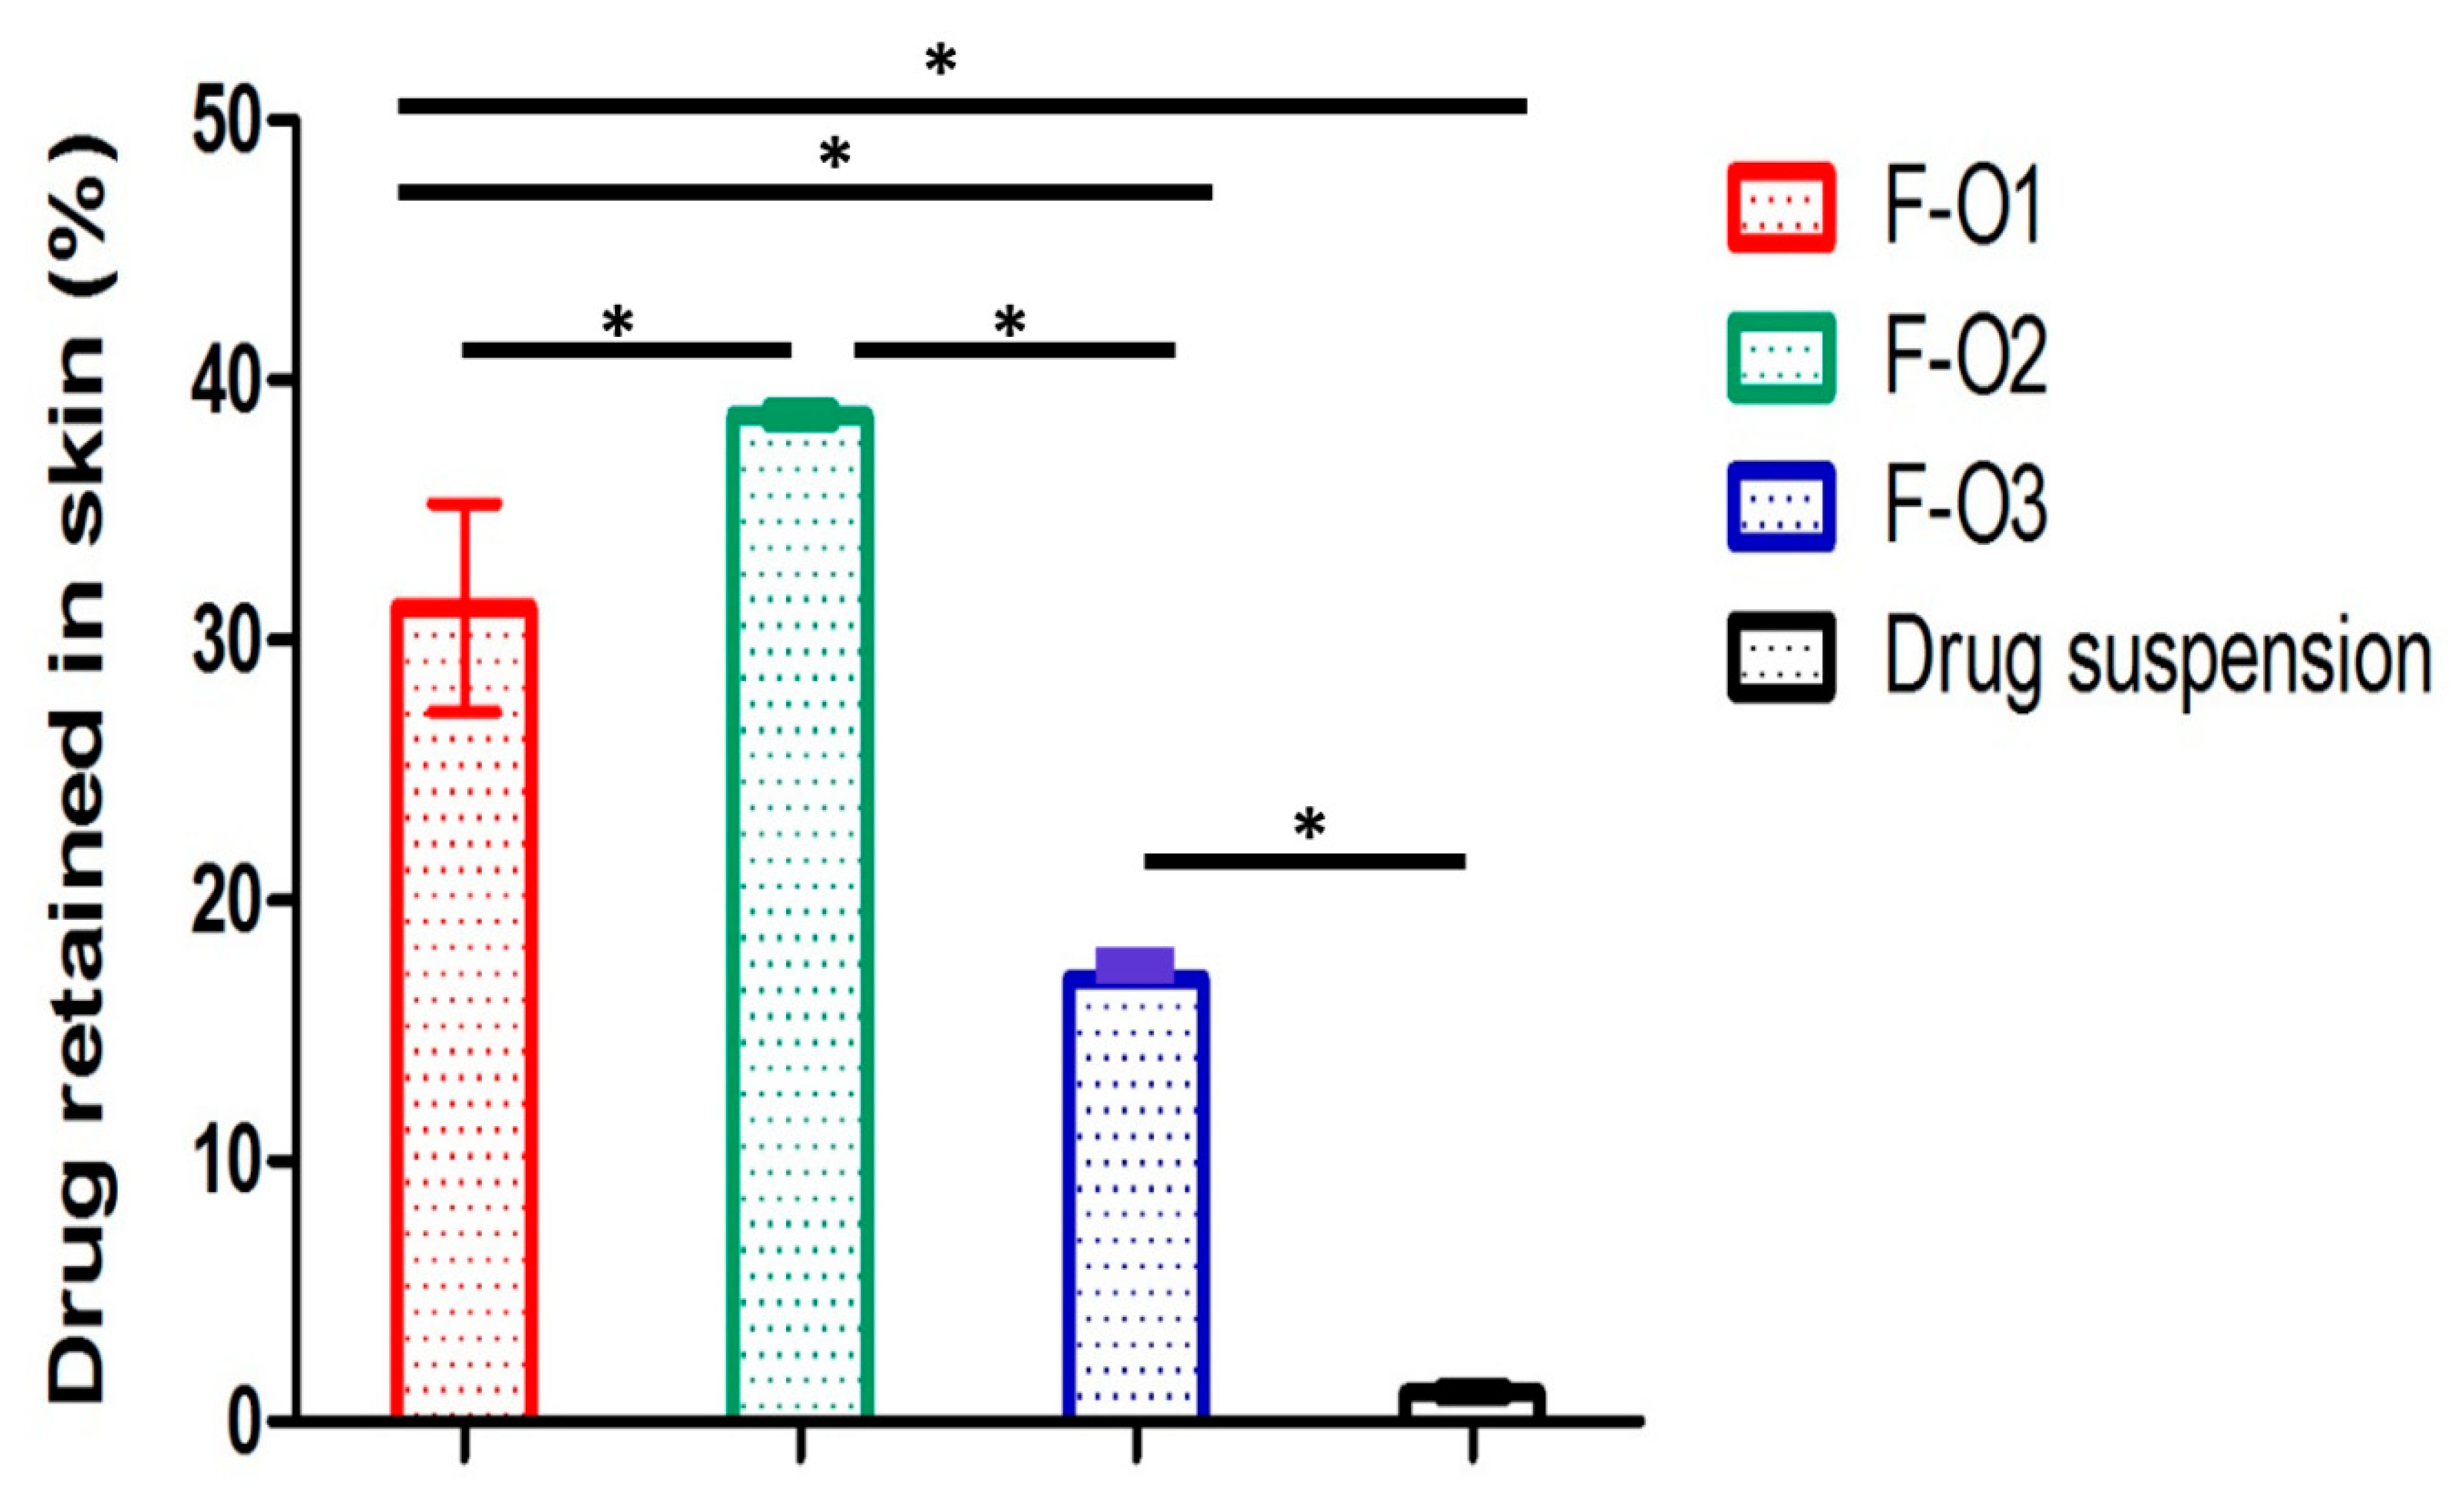
3.6. Skin Deposition Studies
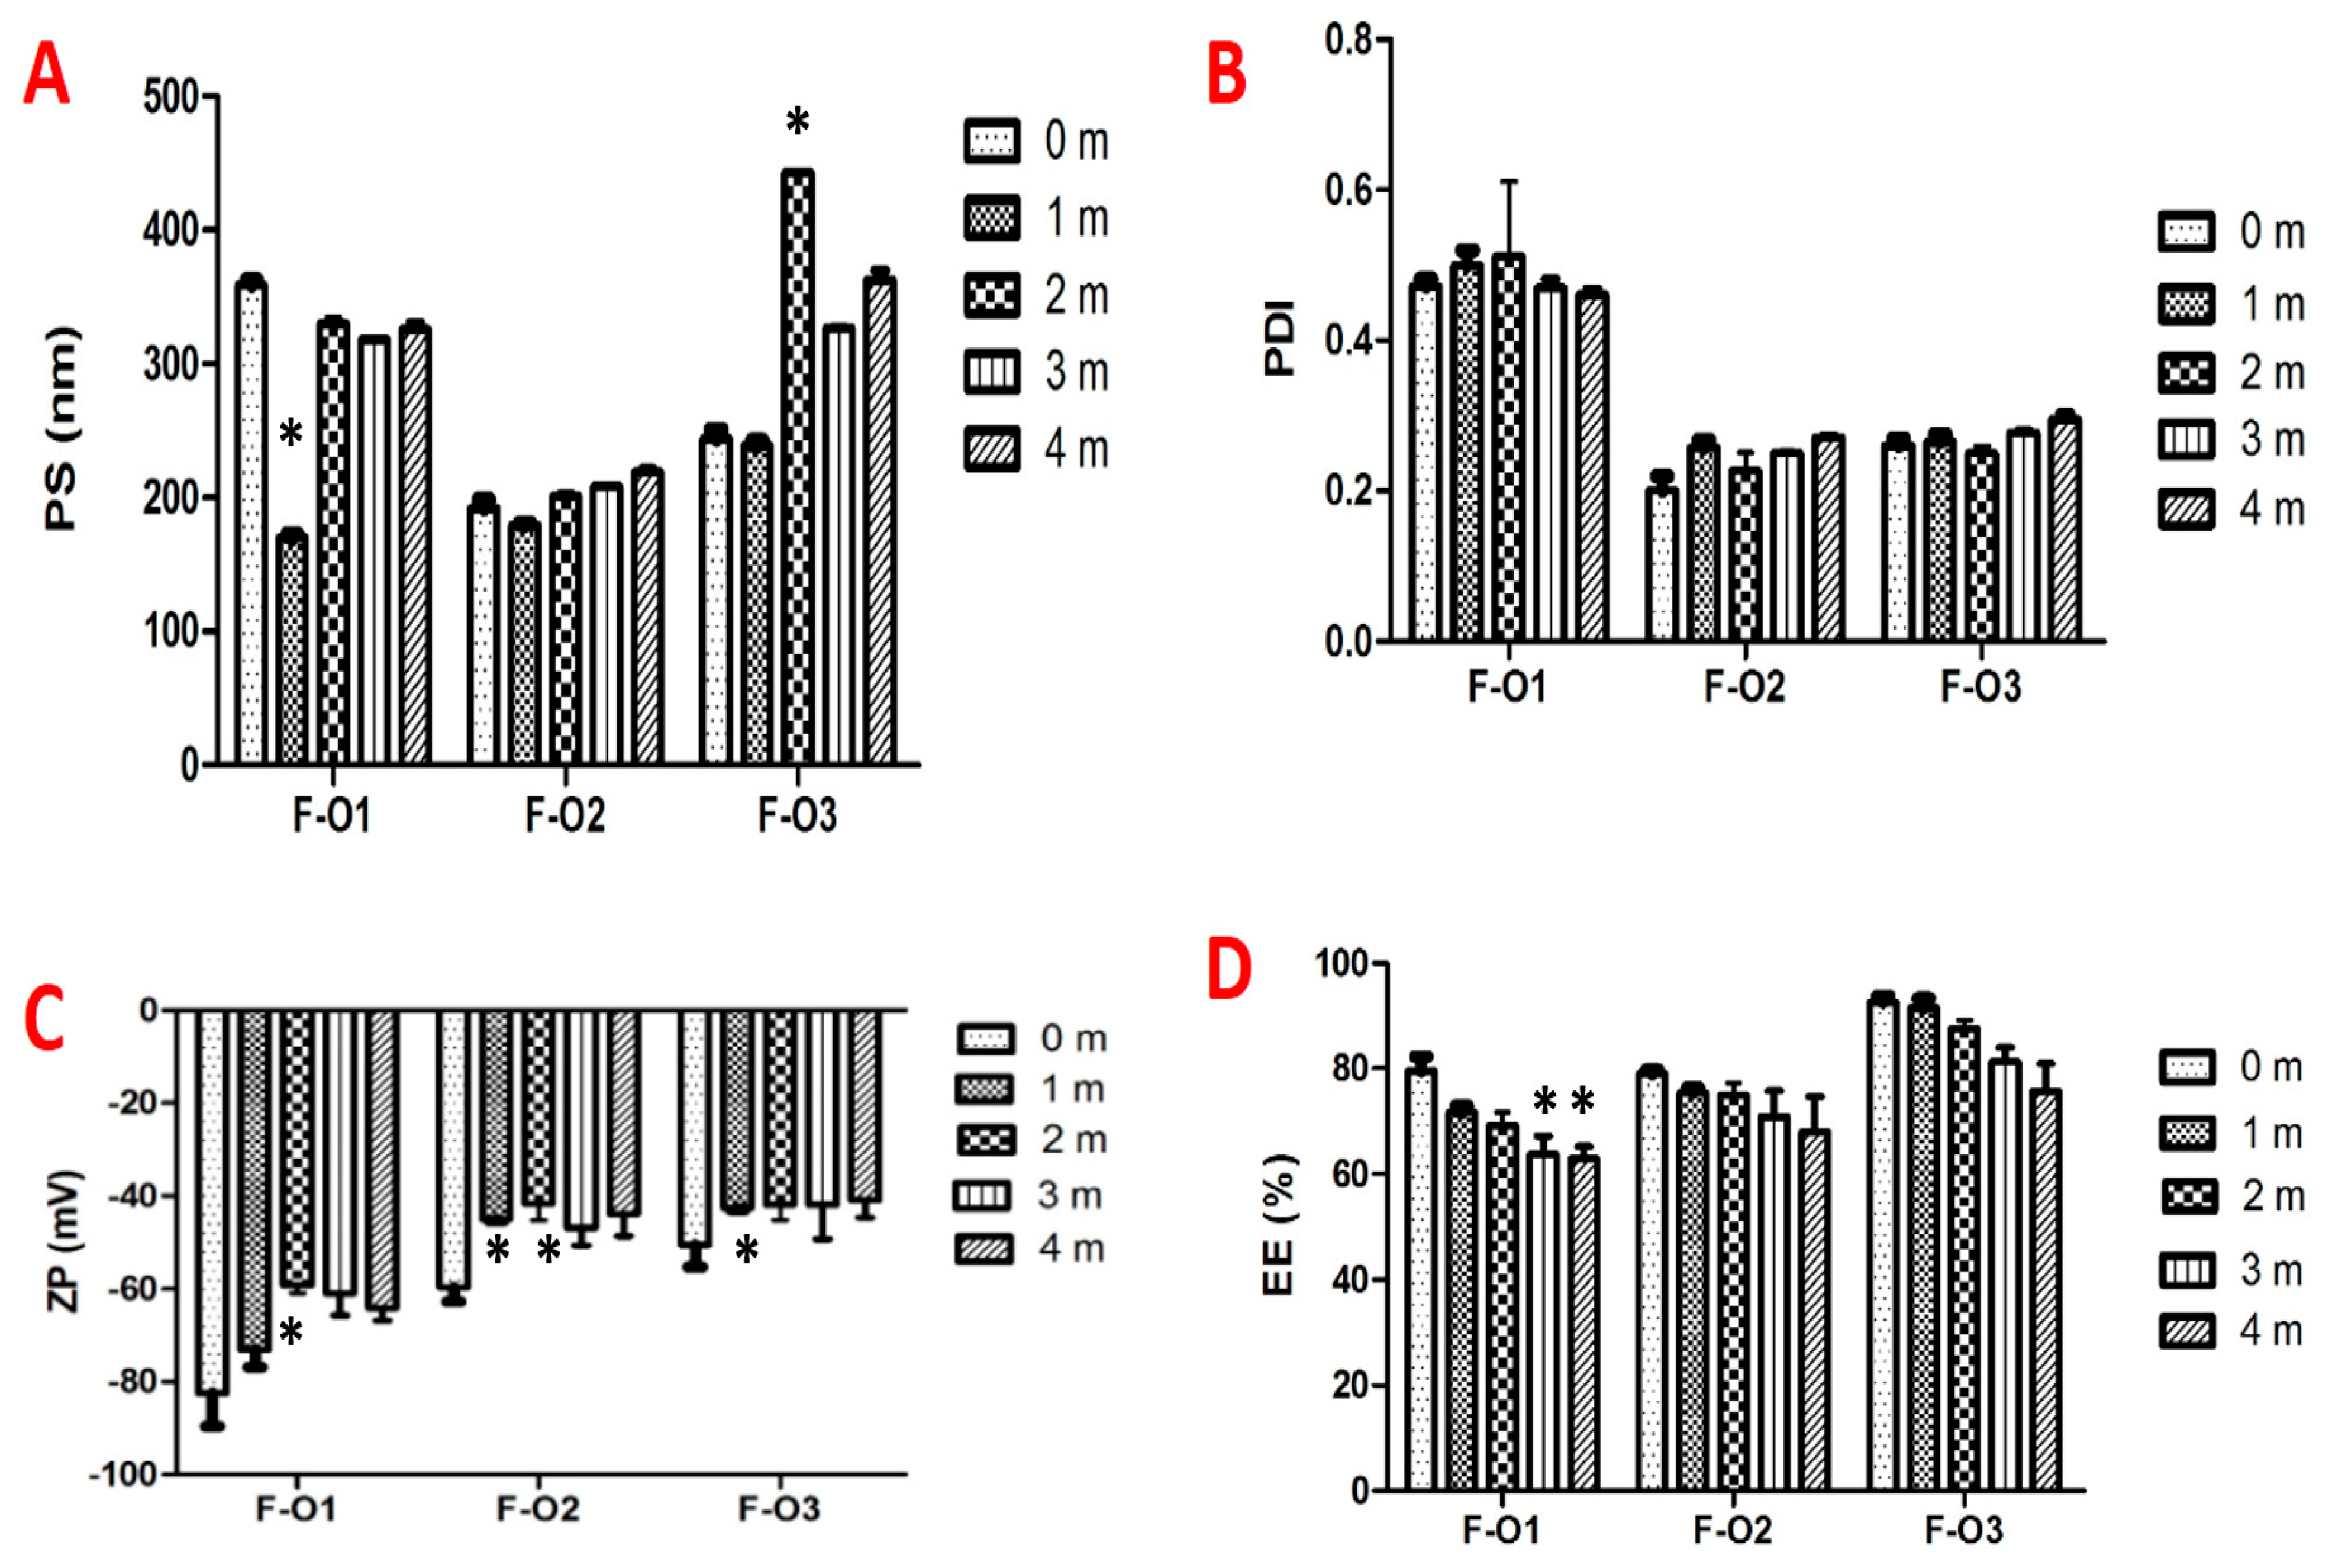
3.7. Physical Stability Study
3.8. In Vivo Assessment
3.8.1. Mice Body Weight
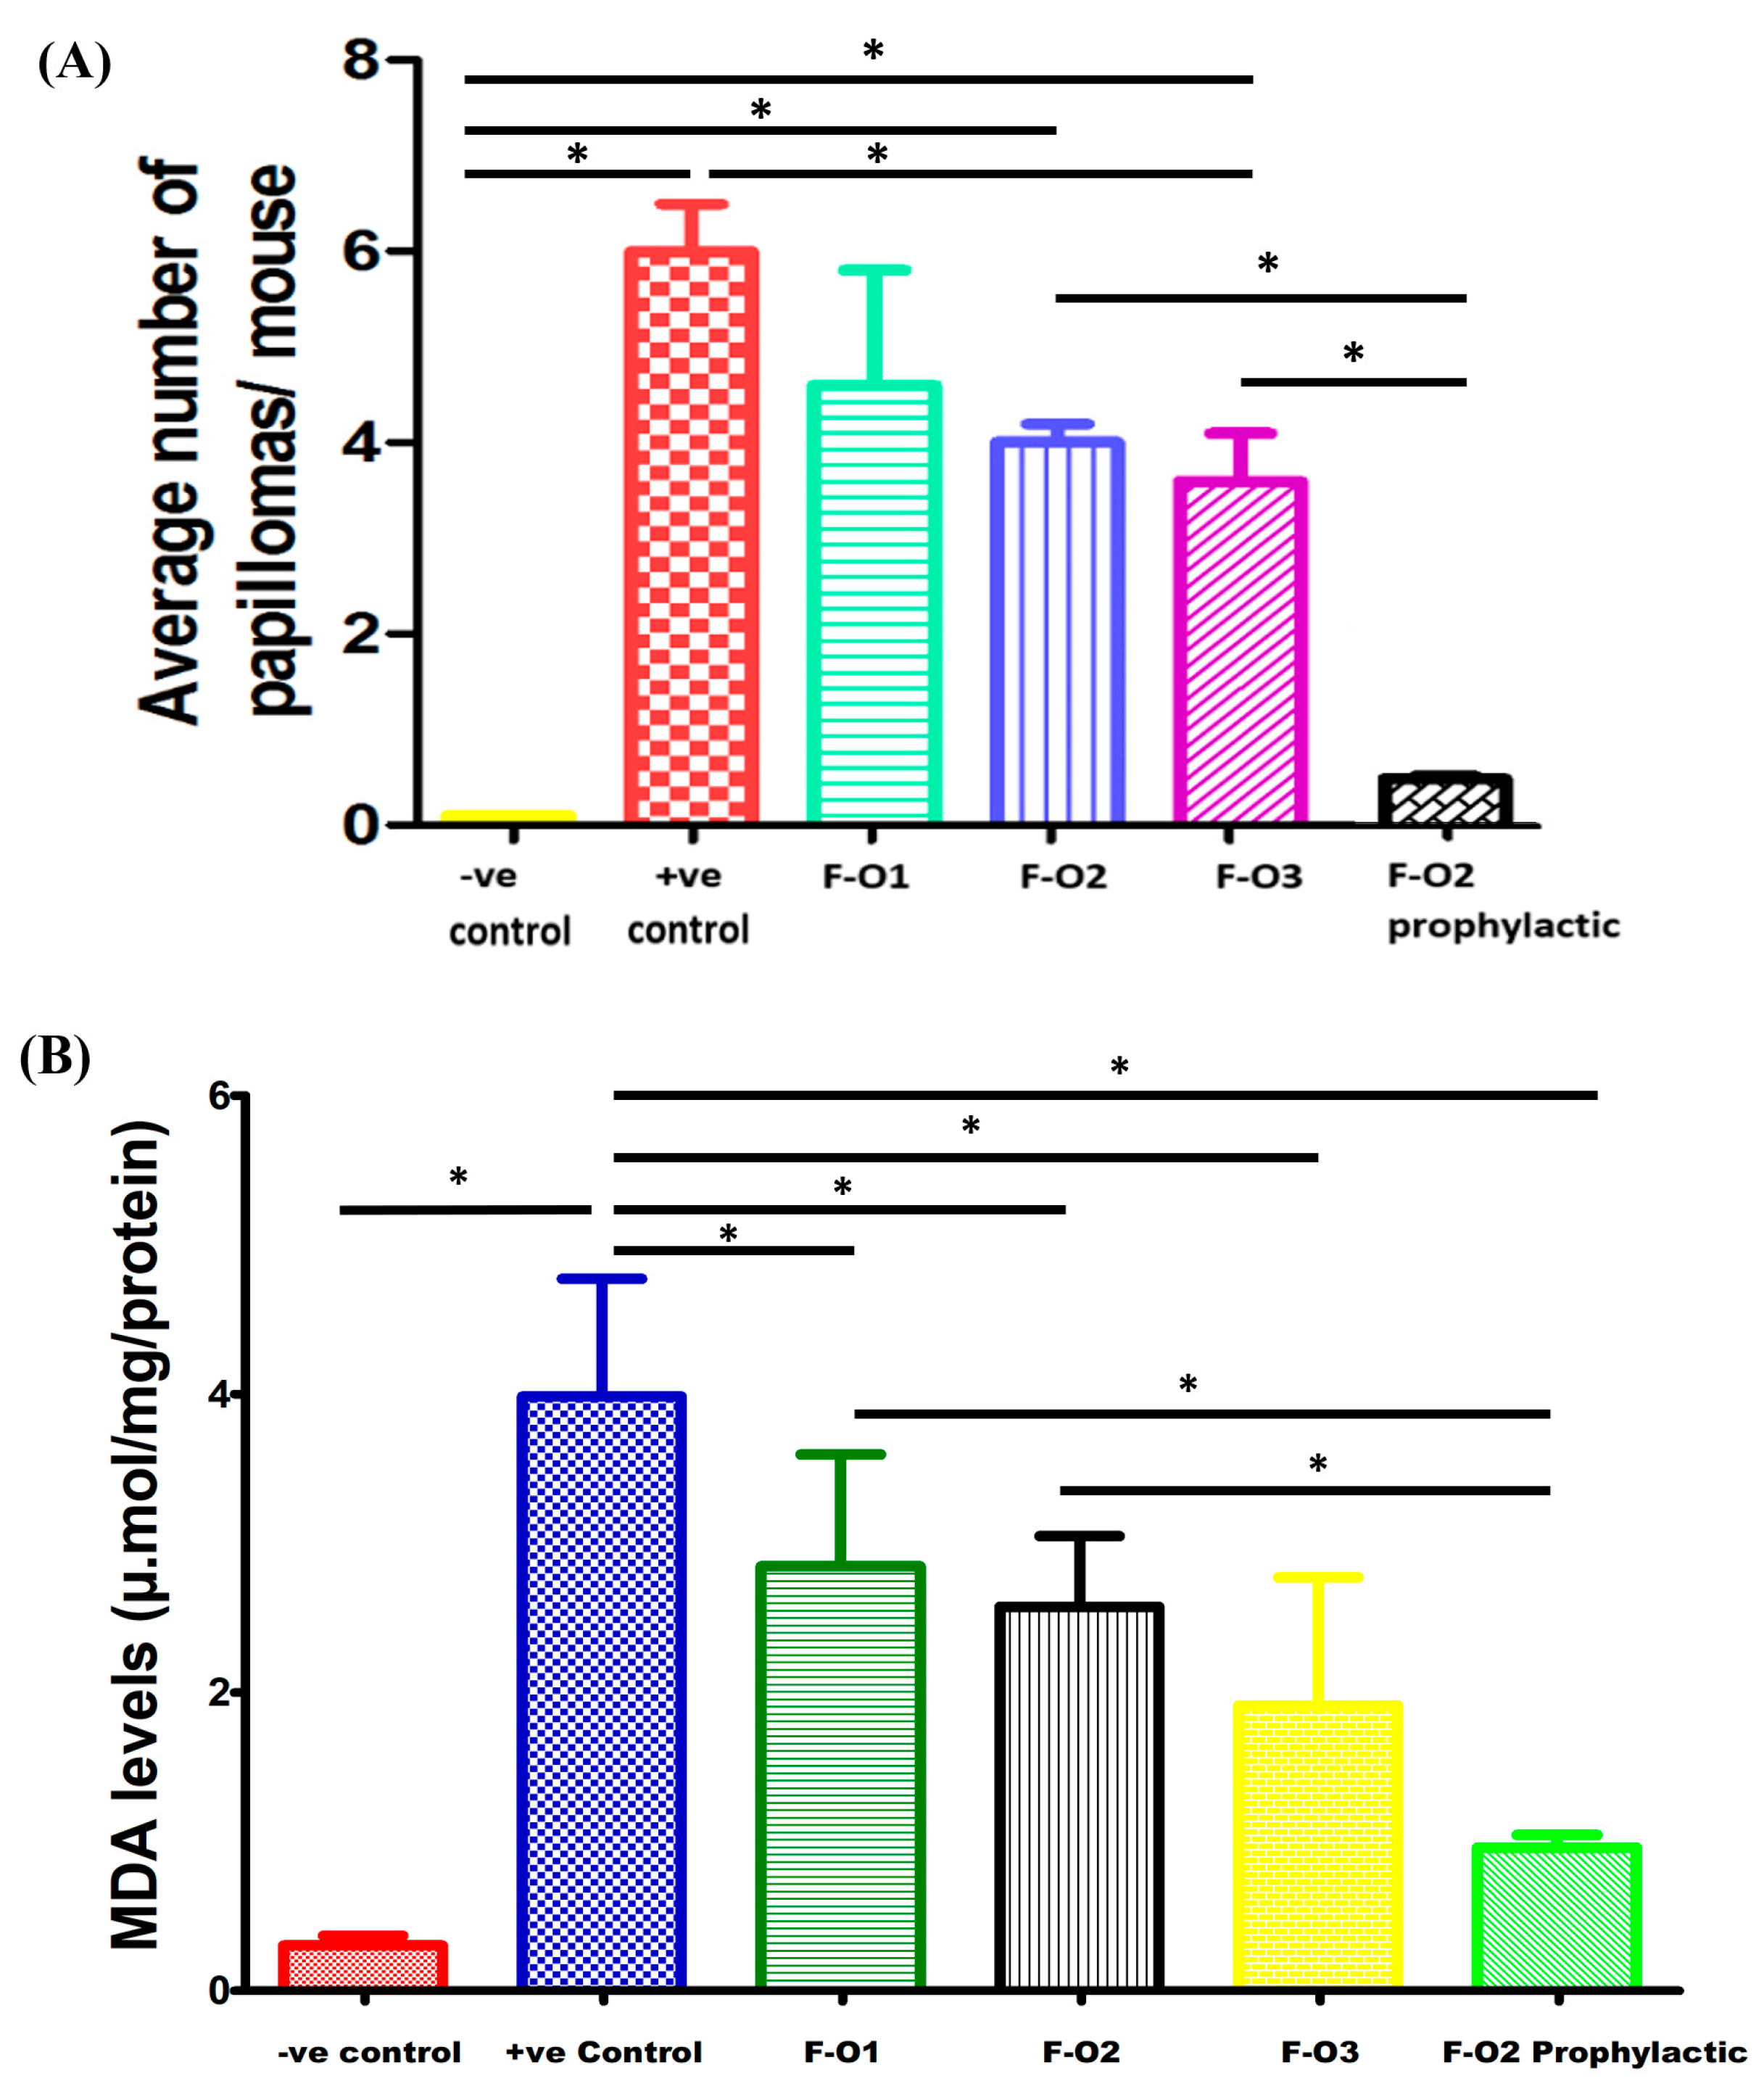
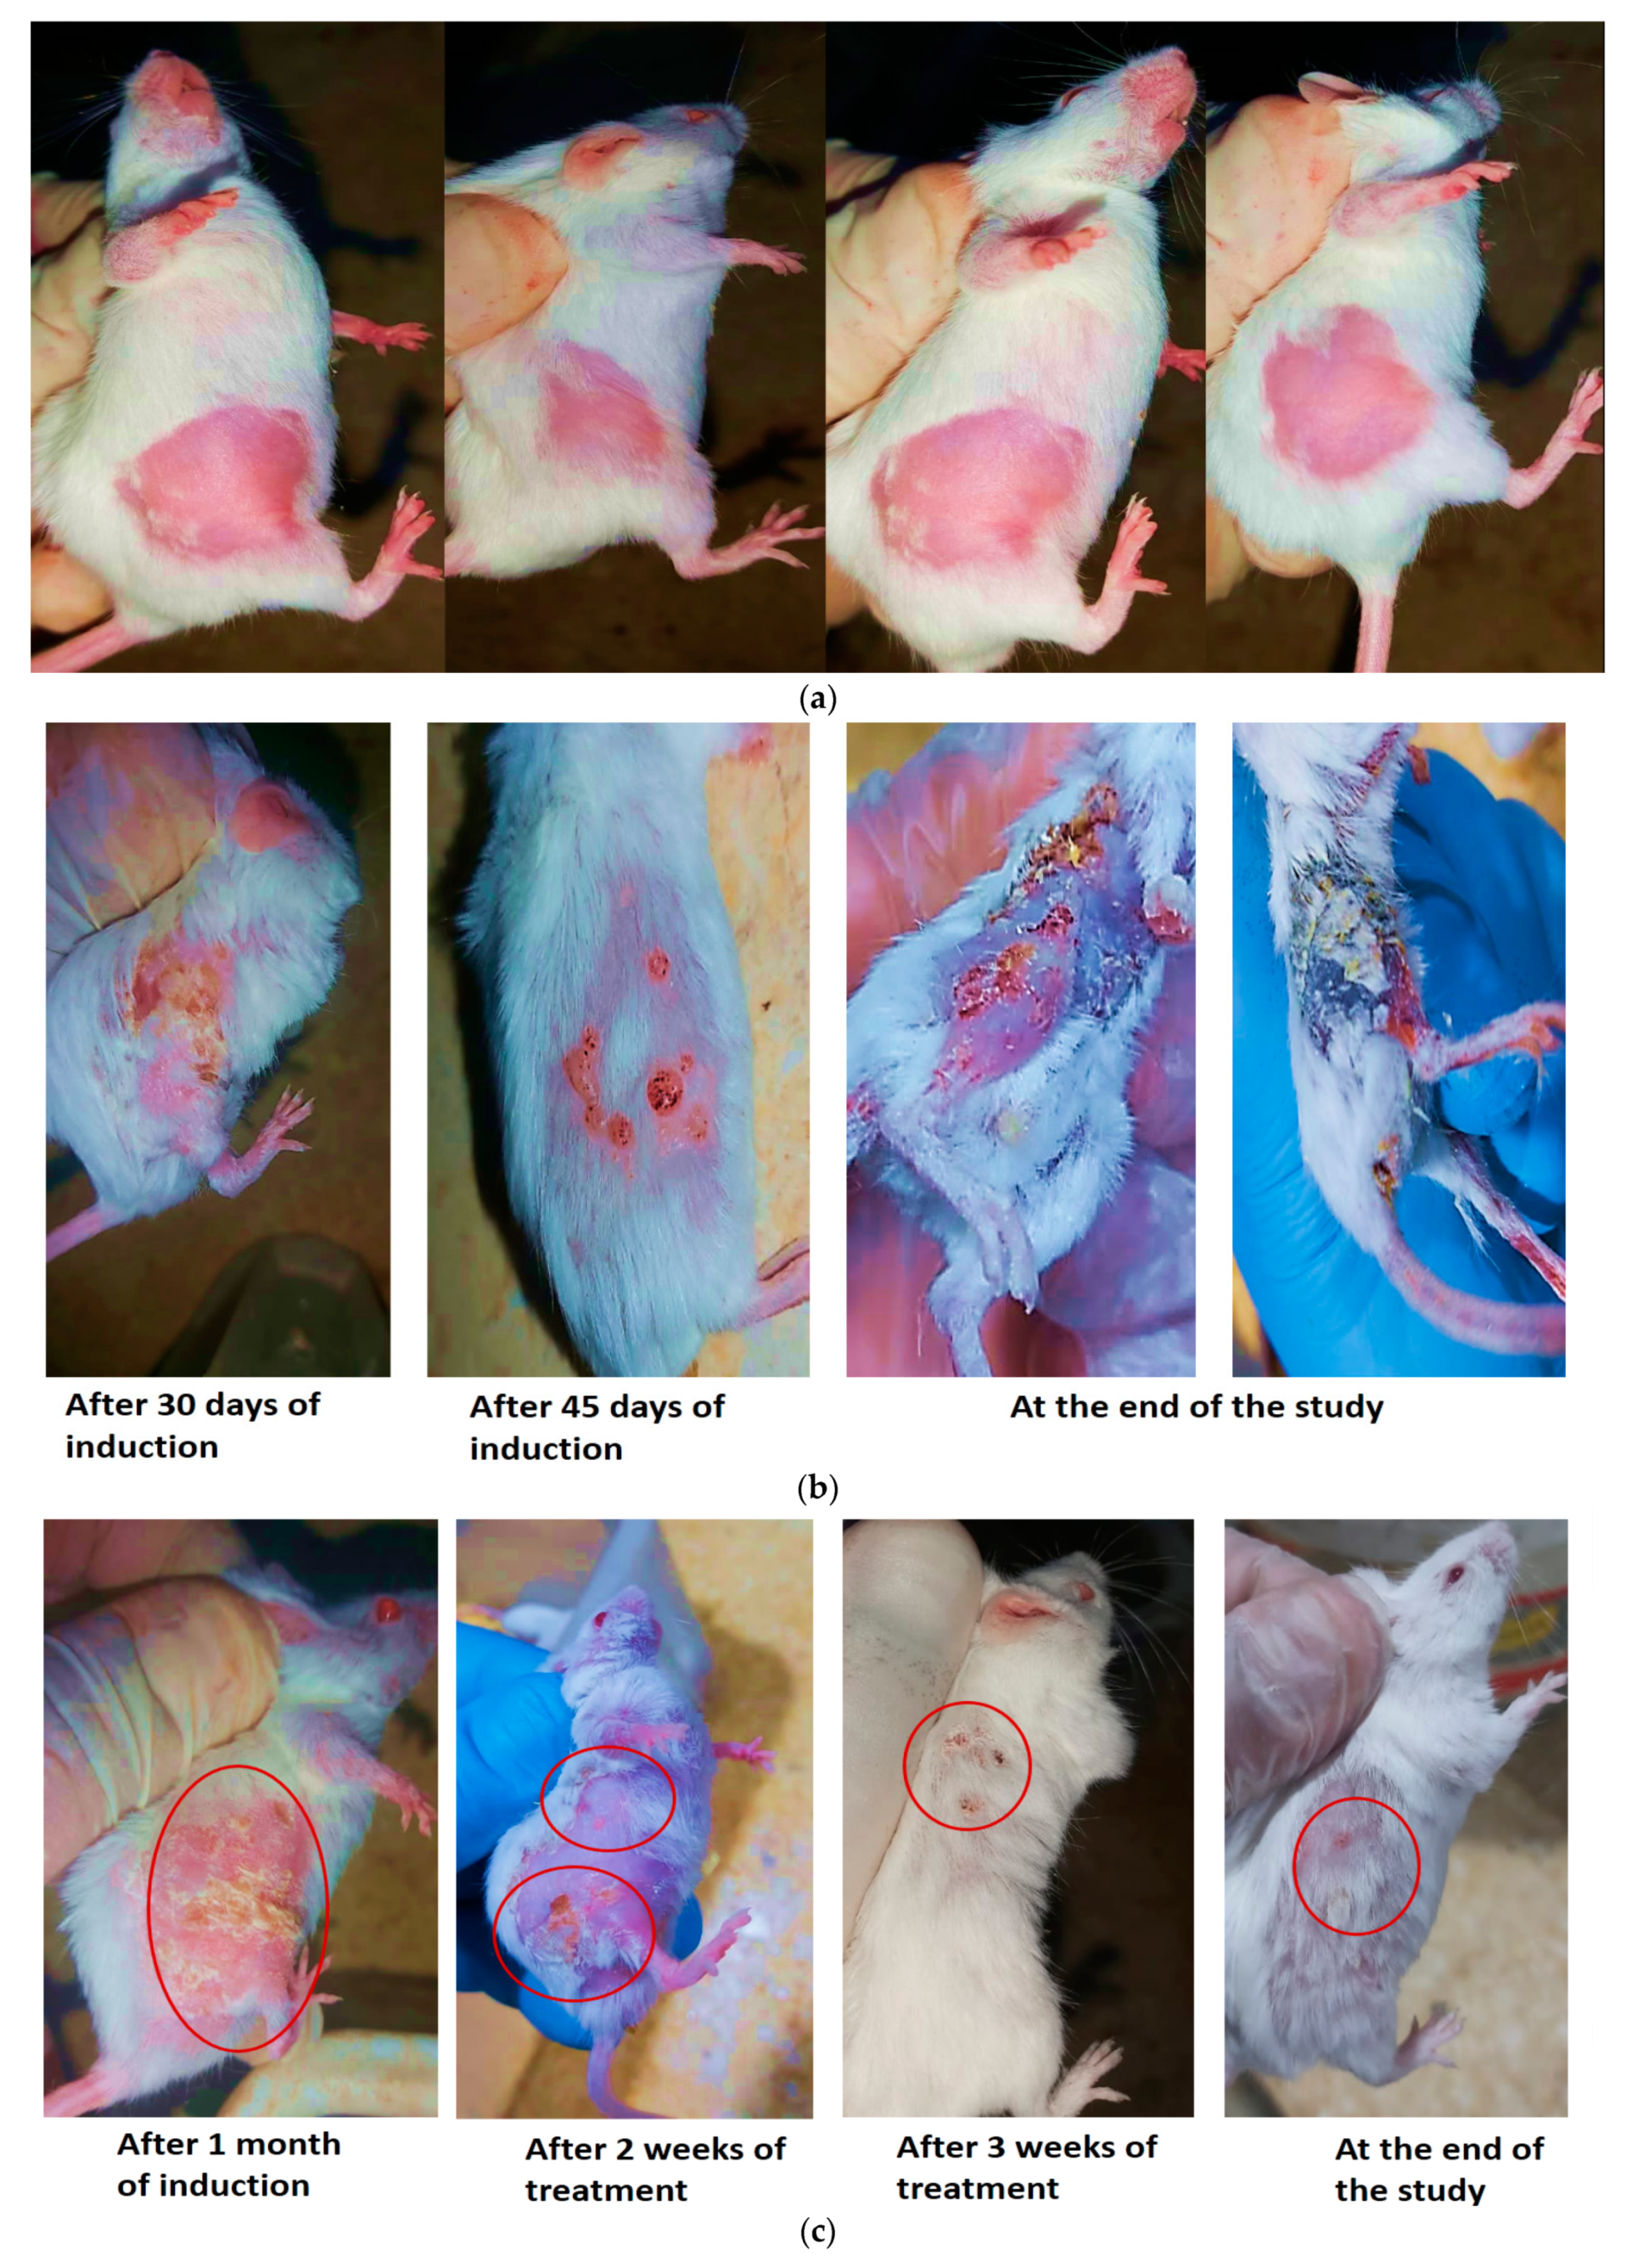
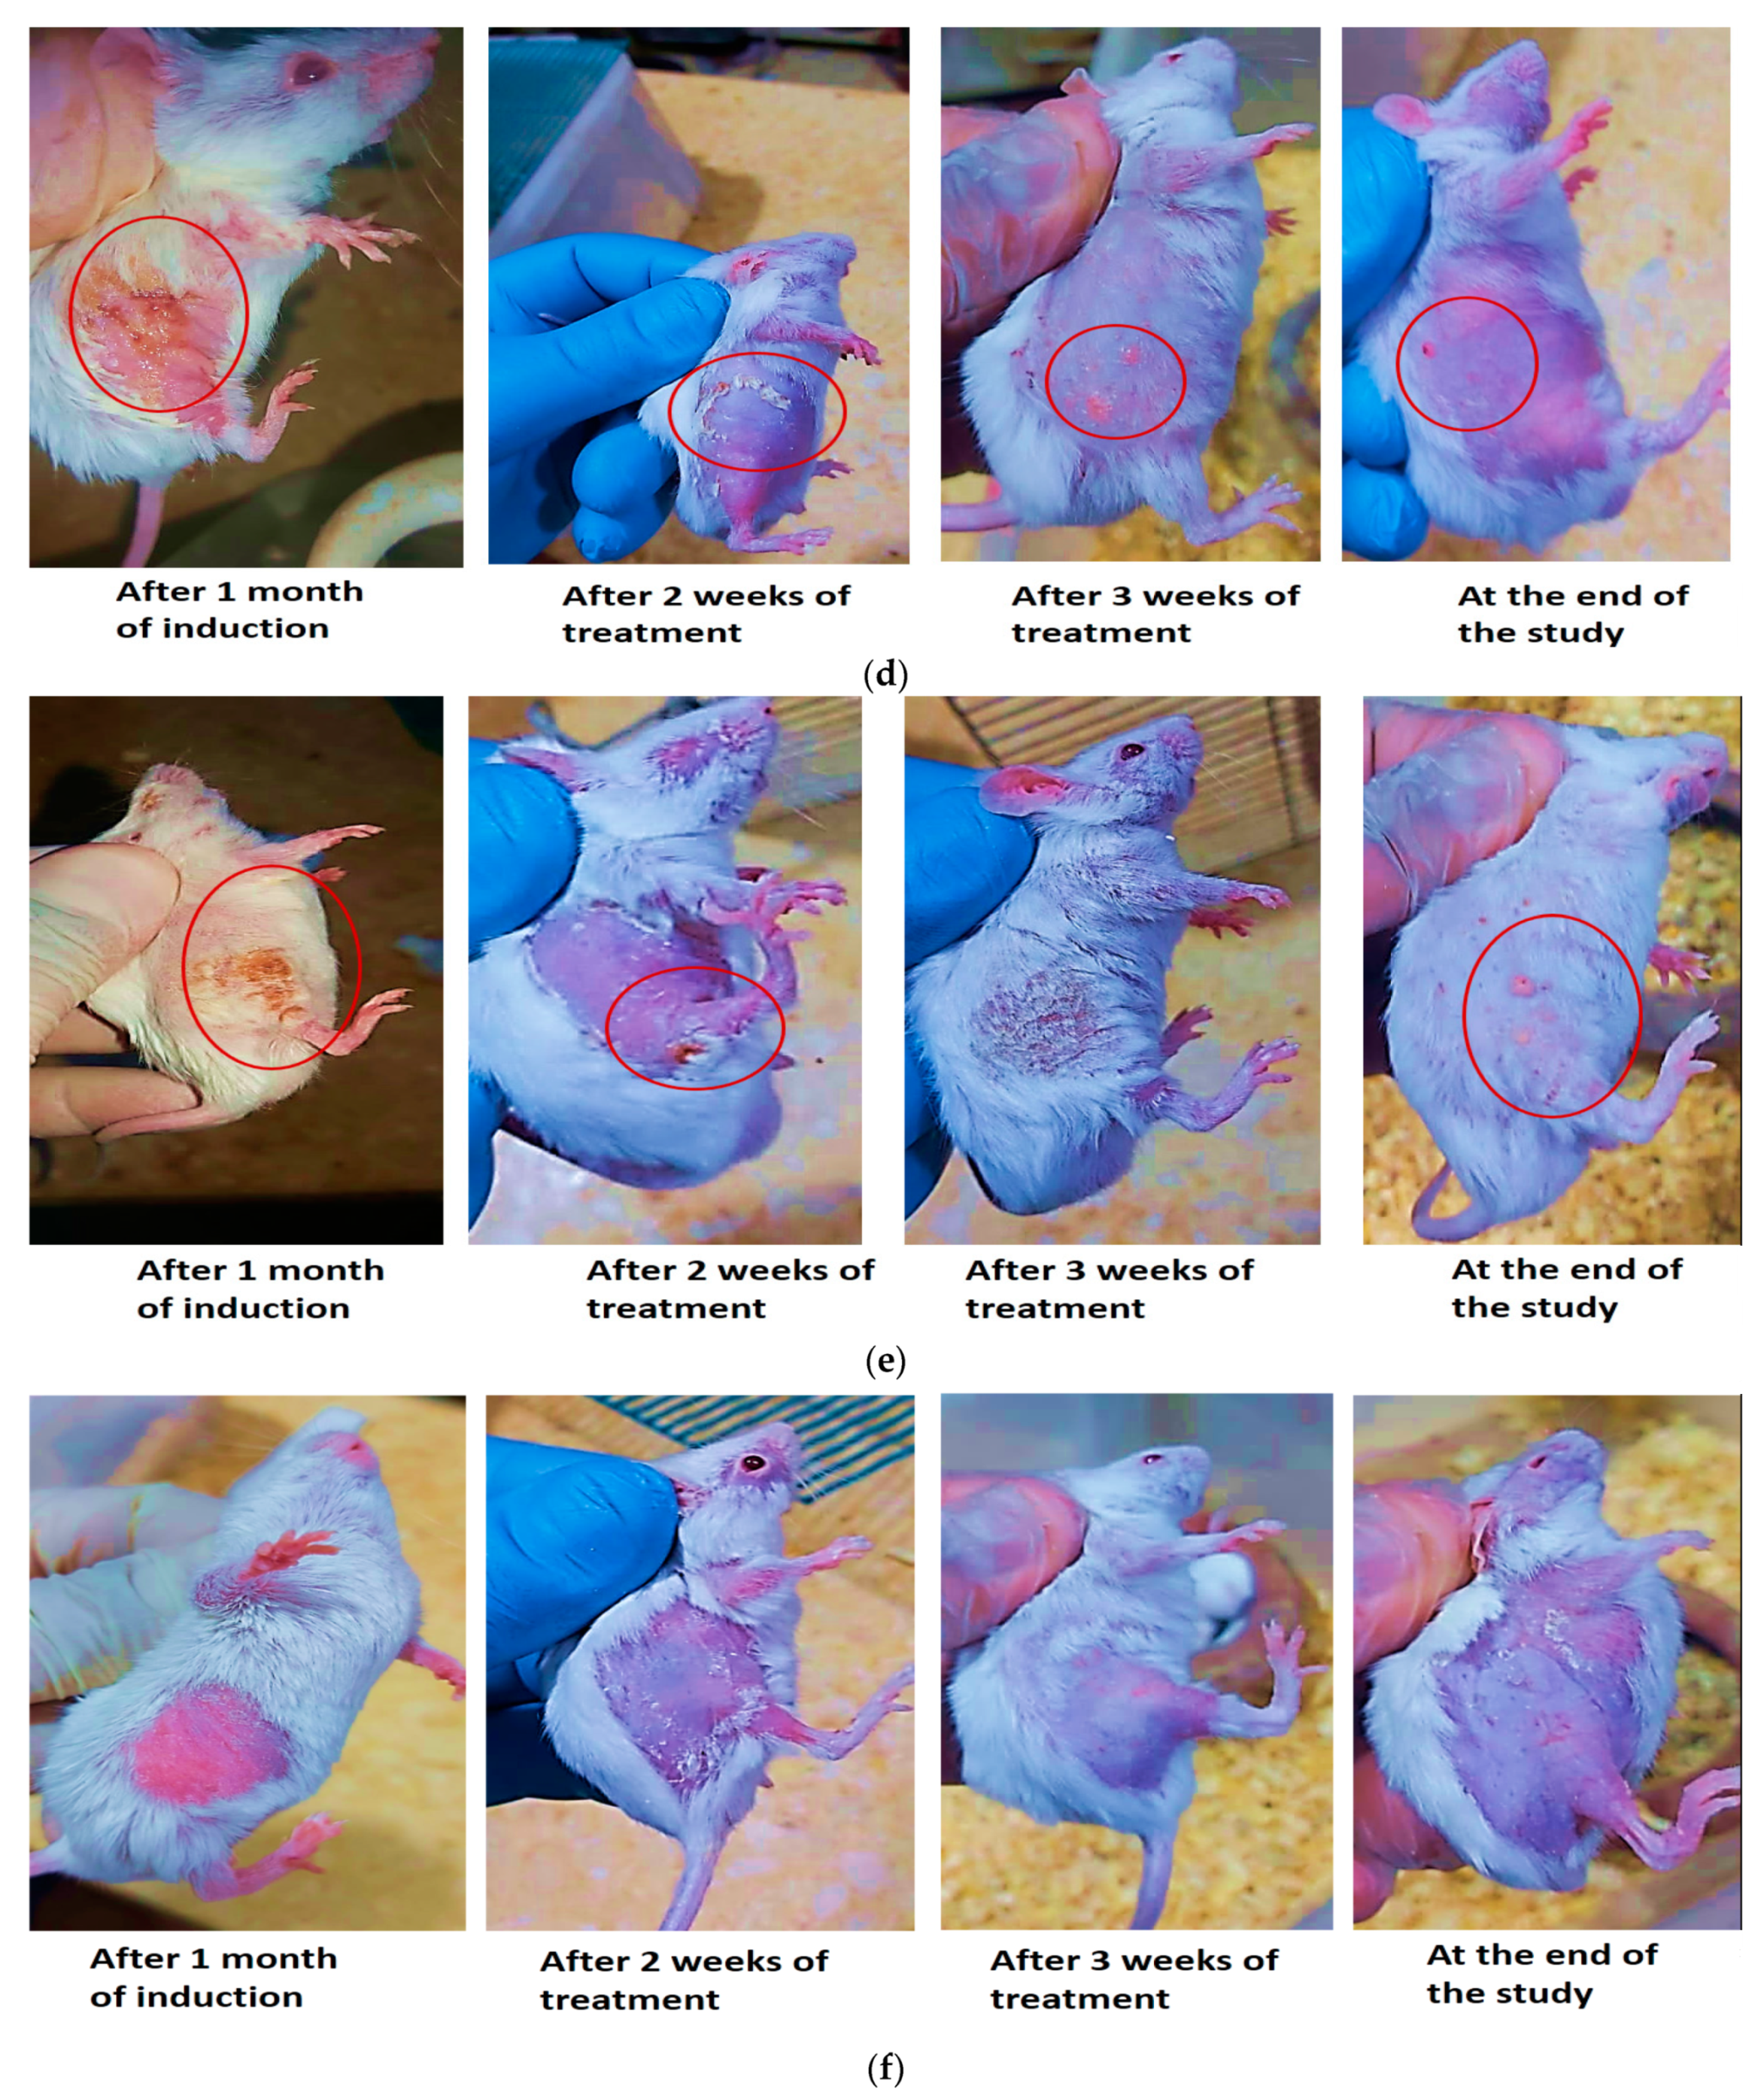
3.8.2. Tumor Size and Number of Papilloma
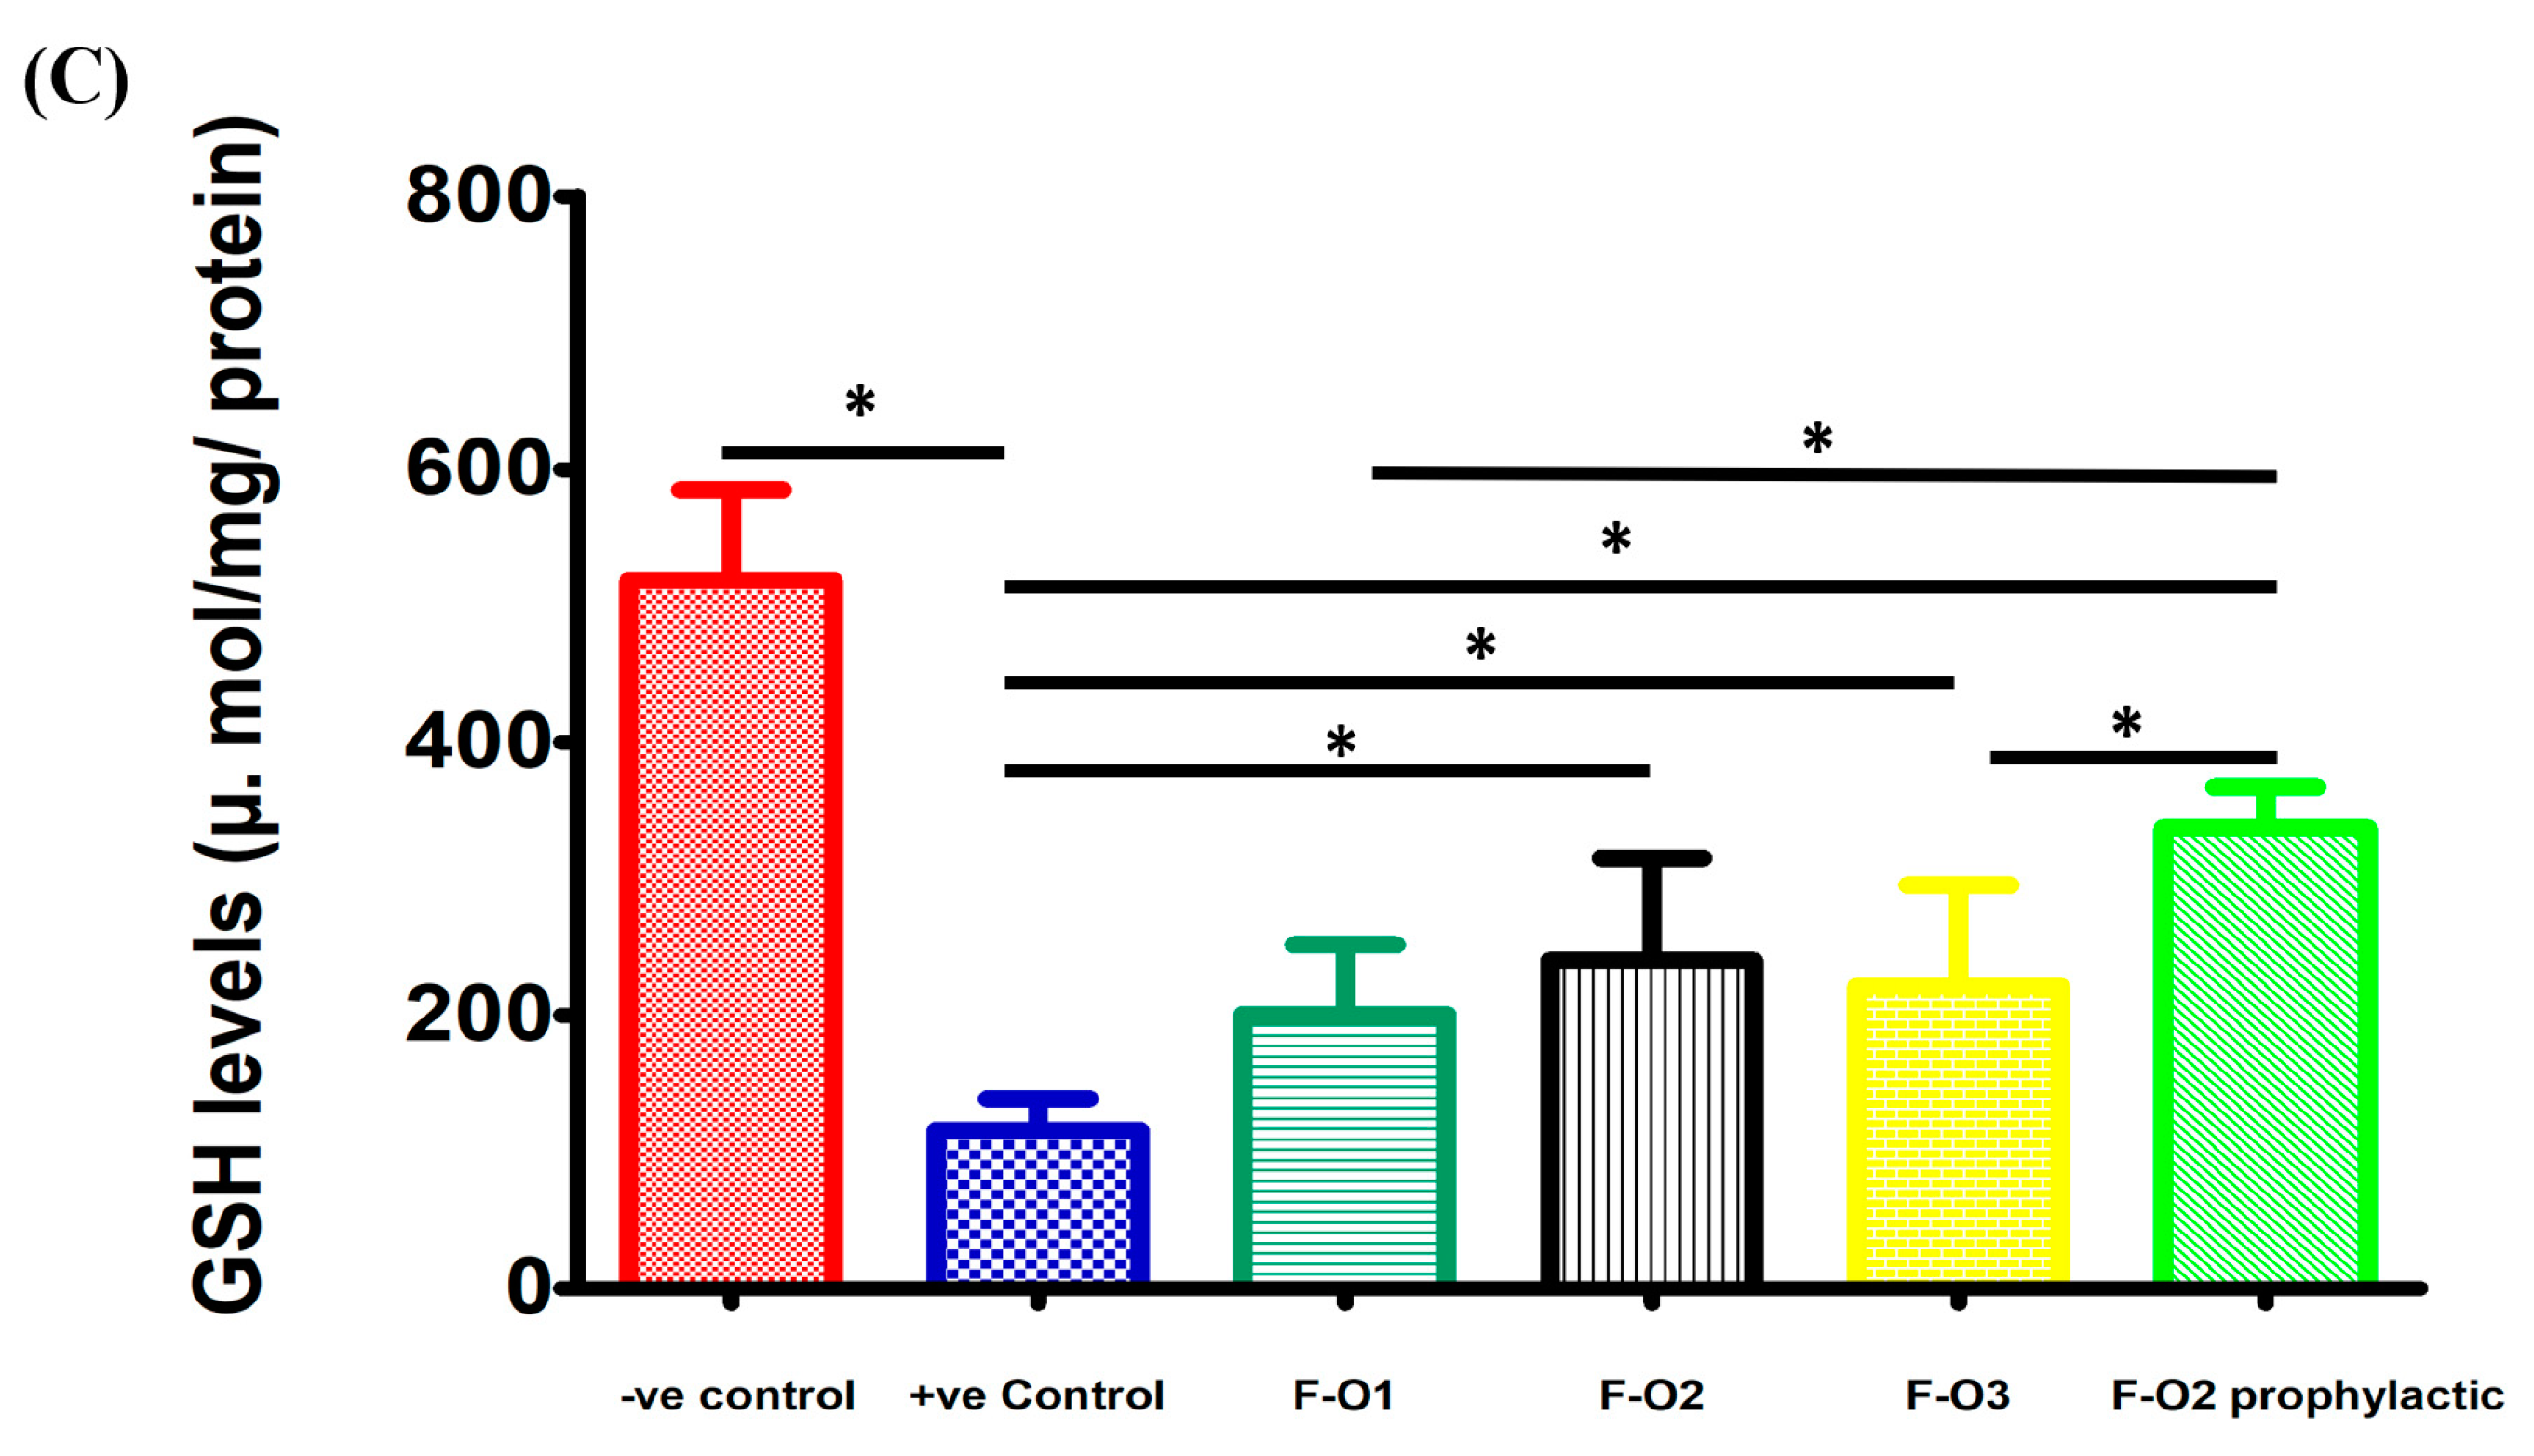
3.8.3. MDA and GSH Levels in Skin Tumor Samples
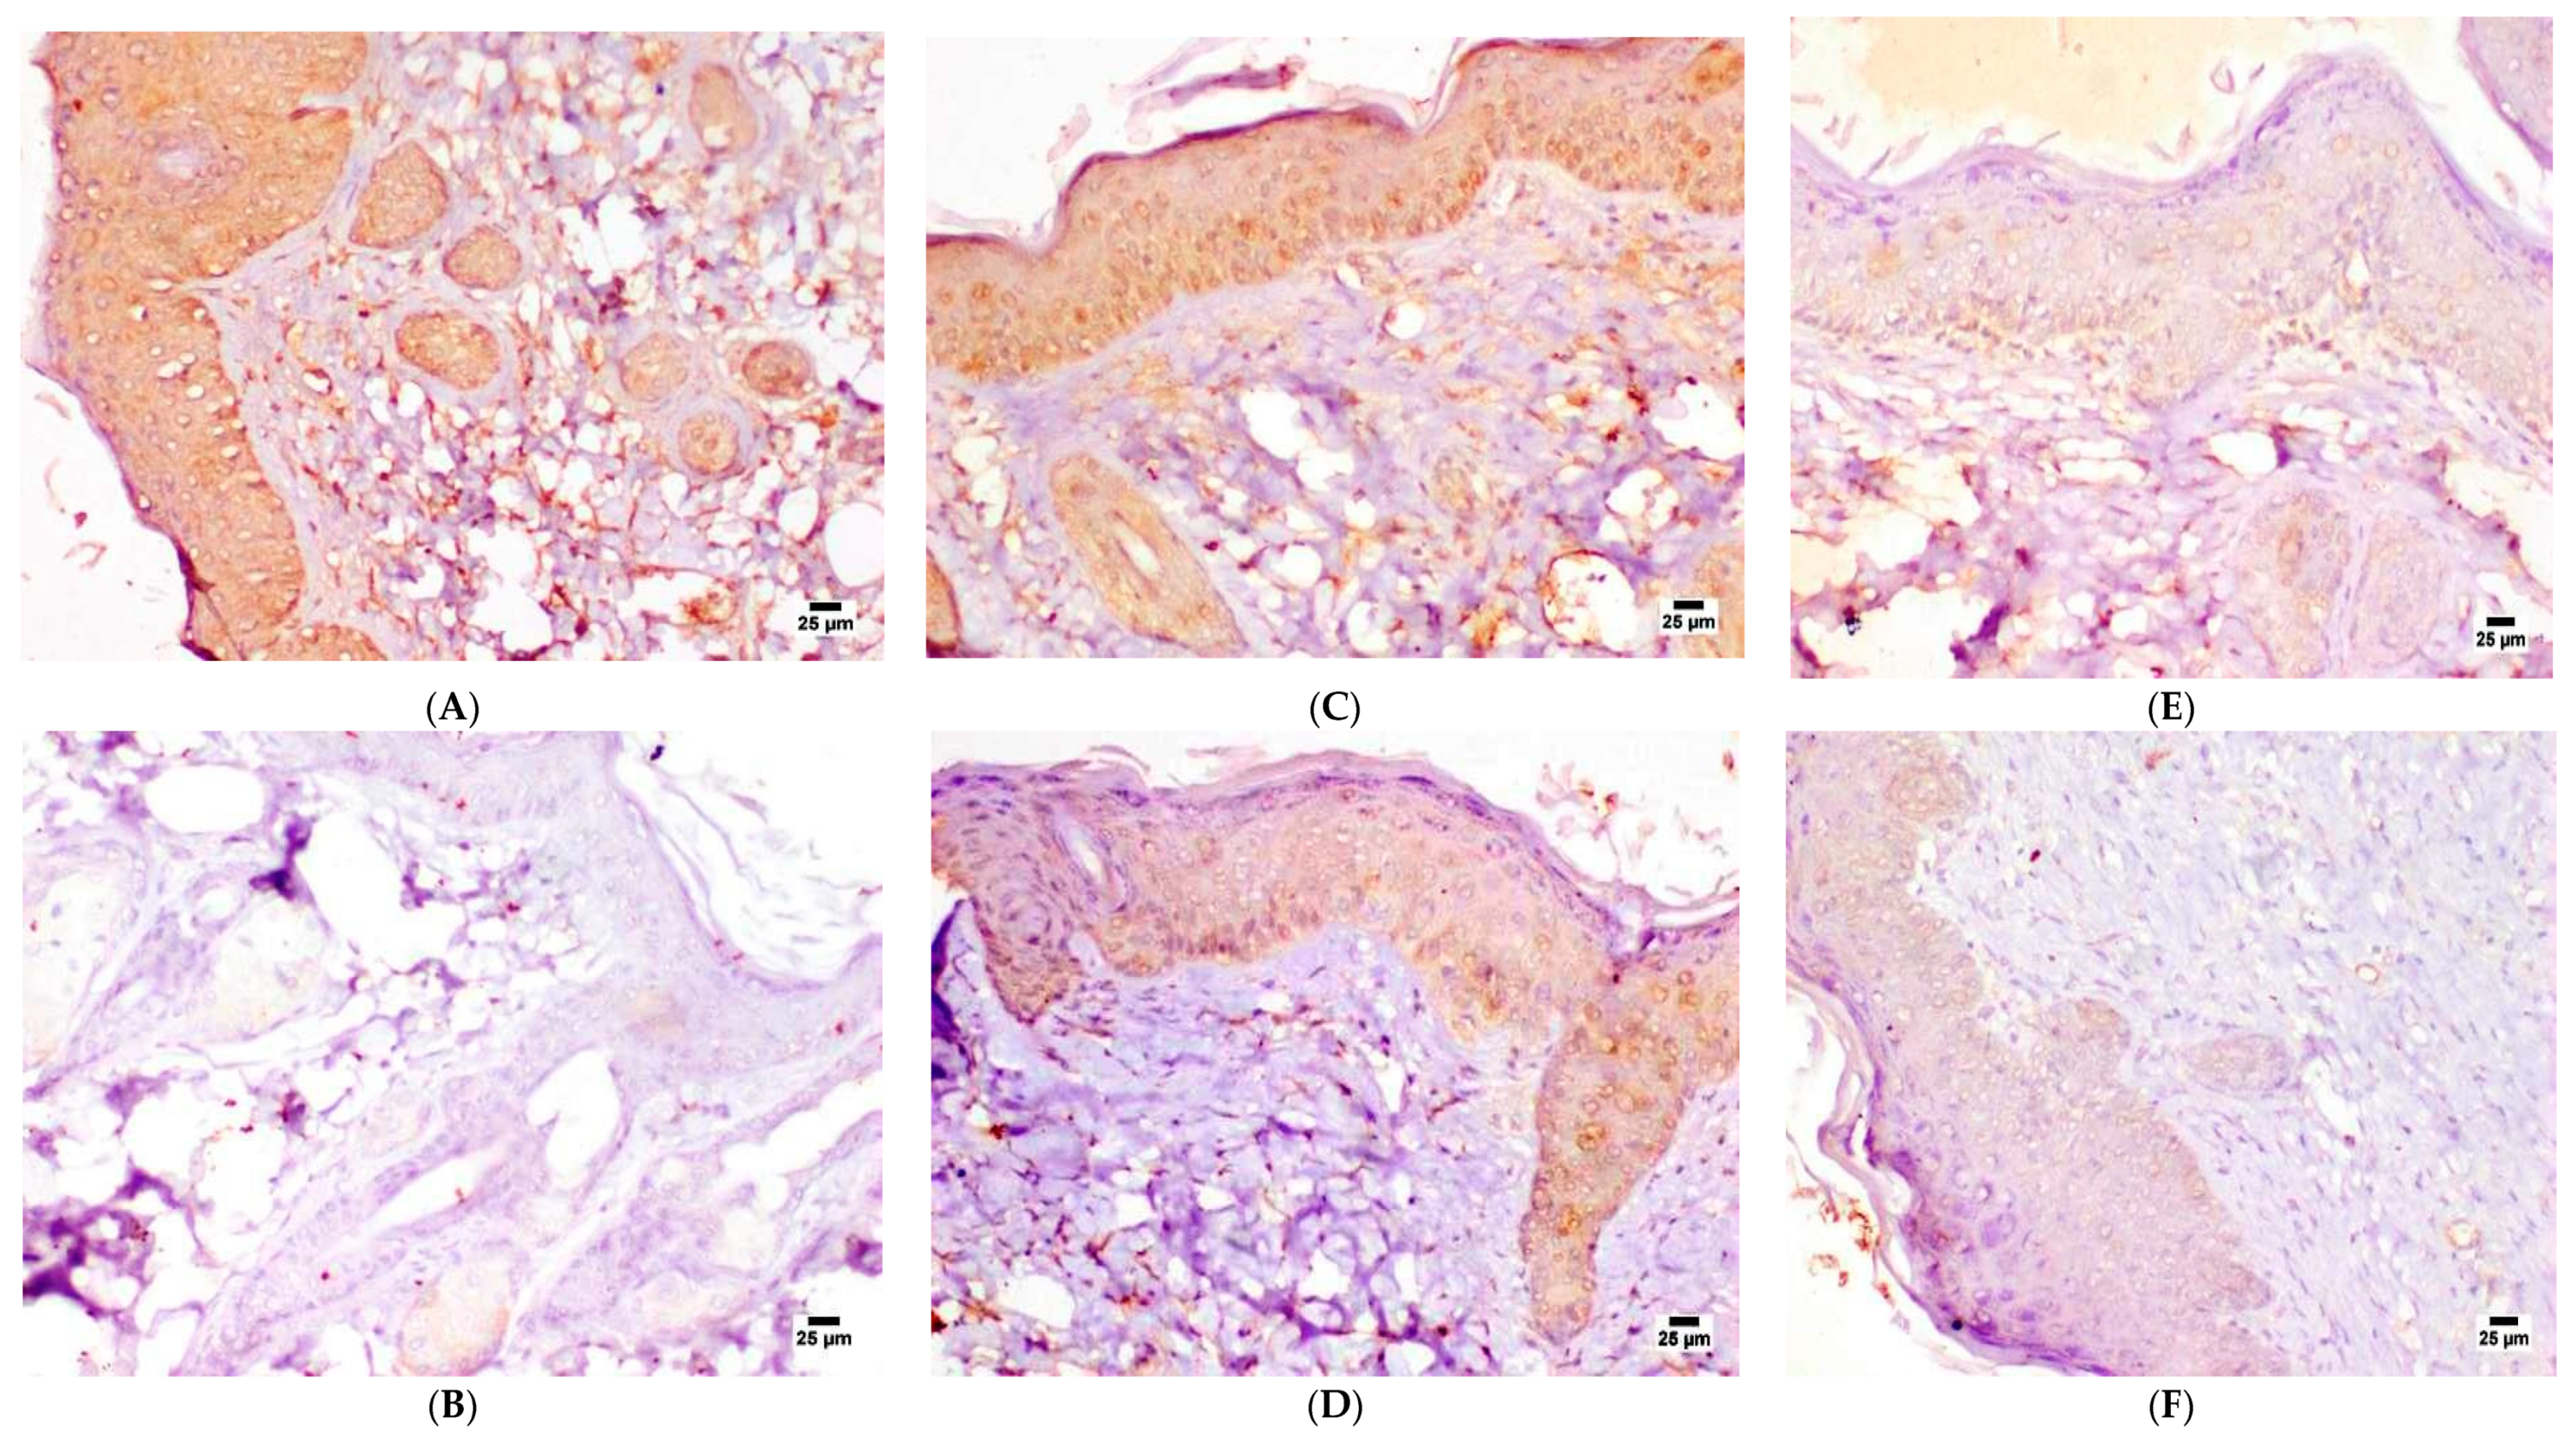
3.8.4. Immunohistochemistry (Ki-67 Expression) Analysis
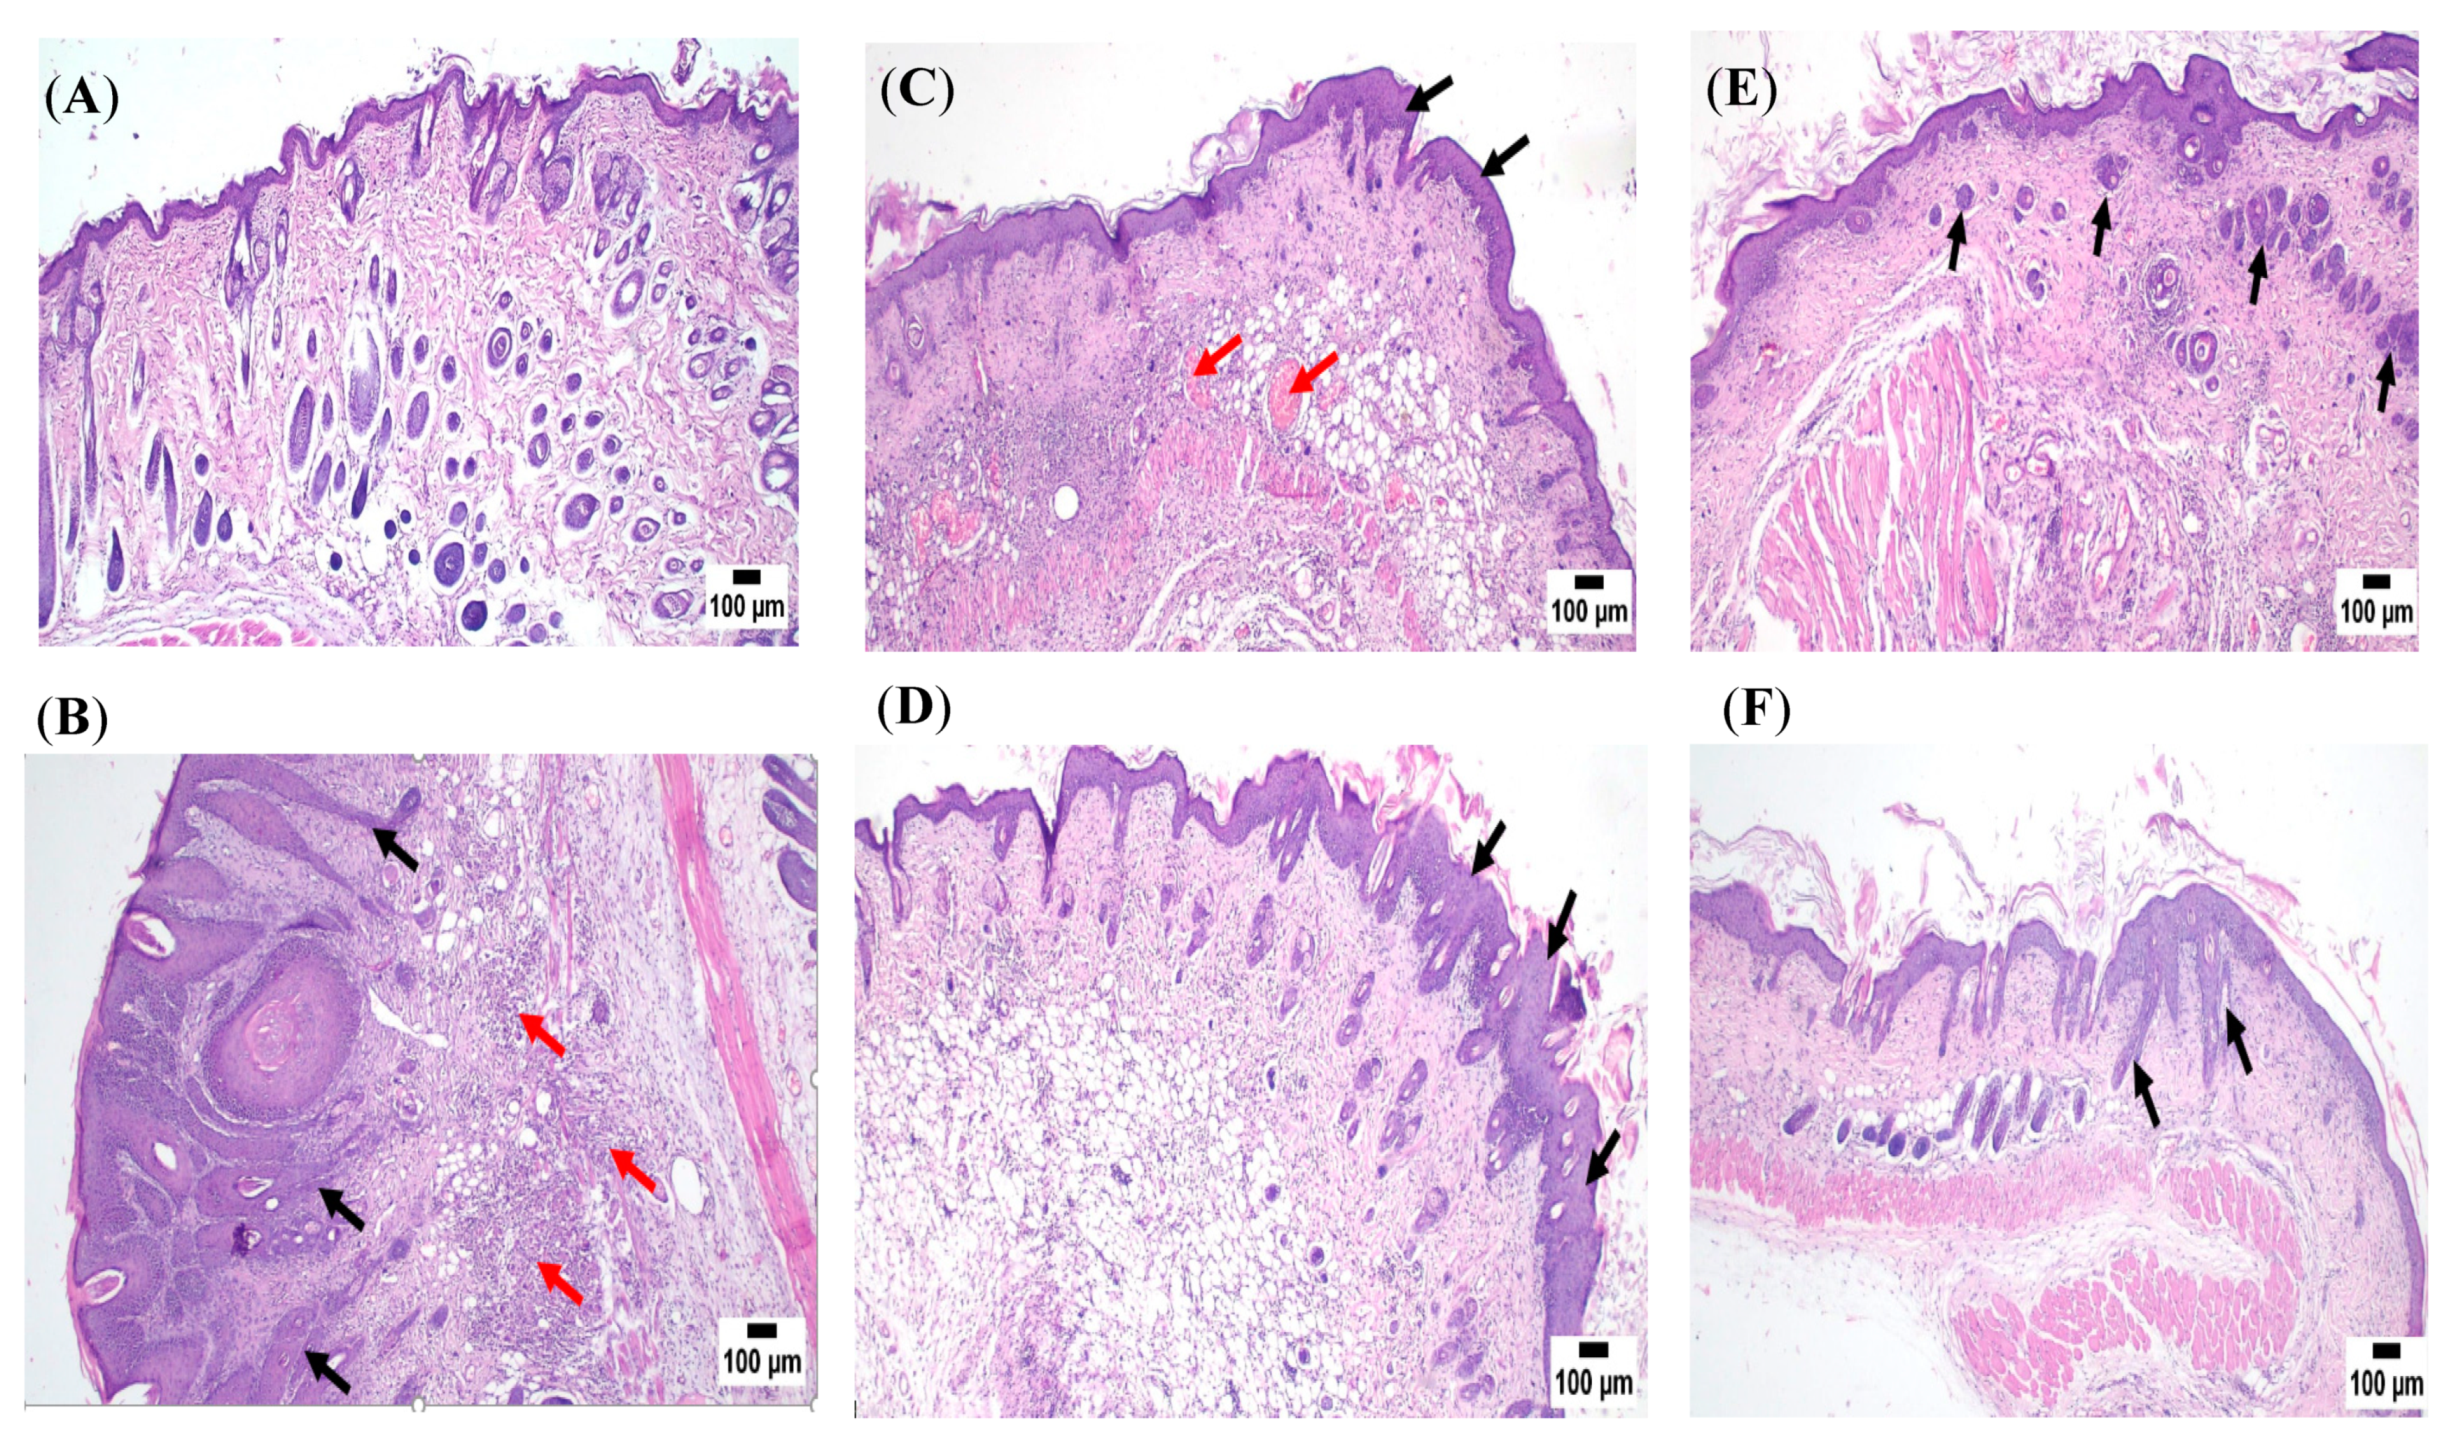
3.8.5. Histopathological Examinations
4. Conclusions
Author Contributions
Funding
Institutional Review Board Statement
Data Availability Statement
Conflicts of Interest
References
- Cameron, M.C.; Lee, E.; Hibler, B.P.; Barker, C.A.; Mori, S.; Cordova, M.; Nehal, K.S.; Rossi, A.M. Basal cell carcinoma: Epidemiology; Pathophysiology; Clinical and histological subtypes; And disease associations. J. Am. Acad. Dermatol. 2019, 80, 303–317. [Google Scholar] [CrossRef] [PubMed]
- Didona, D.; Paolino, G.; Bottoni, U.; Cantisani, C. Non melanoma skin cancer pathogenesis overview. Biomedicines 2018, 6, 6. [Google Scholar] [CrossRef] [PubMed]
- Cullen, J.K.; Simmons, J.L.; Parsons, P.G.; Boyle, G.M. Topical treatments for skin cancer. Adv. Drug Deliv. Rev. 2020, 153, 54–64. [Google Scholar] [CrossRef] [PubMed]
- Krishnan, V.; Peng, K.; Sarode, A.; Prakash, S.; Zhao, Z.; Filippov, S.K.; Todorova, K.; Sell, B.R.; Lujano, O.; Bakre, S. Hyaluronic acid conjugates for topical treatment of skin cancer lesions. Sci. Adv. 2021, 7, 6627–6640. [Google Scholar] [CrossRef] [PubMed]
- Ruela, A.L.M.; Perissinato, A.G.; Lino, M.E.d.S.; Mudrik, P.S.; Pereira, G.R. Evaluation of skin absorption of drugs from topical and transdermal formulations. Braz. J. Pharm. Sci. 2016, 52, 527–544. [Google Scholar] [CrossRef]
- Mottaghi, S.; Abbaszadeh, H.J.N. Cancer. Natural lignans honokiol and magnolol as potential anticarcinogenic and anticancer agents. A comprehensive mechanistic review. Nutr. Cancer 2021, 74, 761–778. [Google Scholar] [CrossRef]
- Ranaware, A.M.; Banik, K.; Deshpande, V.; Padmavathi, G.; Roy, N.K.; Sethi, G.; Fan, L.; Kumar, A.P.; Kunnumakkara, A.B. Magnolol: A neolignan from the magnolia family for the prevention and treatment of cancer. Int. J. Mol. Sci. 2018, 19, 2362. [Google Scholar] [CrossRef]
- Wang, Y.-D.; Sun, X.-J.; Yang, W.-J.; Li, J.; Yin, J.-J. Magnolol exerts anticancer activity in hepatocellular carcinoma cells through regulating endoplasmic reticulum stress-mediated apoptotic signaling. OncoTargets Ther. 2018, 11, 5219–5226. [Google Scholar] [CrossRef]
- Seo, J.-U.; Kim, M.-H.; Kim, H.-M.; Jeong, H.-J. Anticancer potential of magnolol for lung cancer treatment. Arch. Pharmacal Res. 2011, 34, 625–633. [Google Scholar] [CrossRef]
- Zhang, J.; Chen, Z.; Huang, X.; Shi, W.; Zhang, R.; Chen, M.; Huang, H.; Wu, L. Insights on the multifunctional activities of magnolol. BioMed Res. Int. 2019, 2019, 1847130. [Google Scholar] [CrossRef]
- Chen, Y.; Huang, K.; Ding, X.; Tang, H.; Xu, Z. Magnolol inhibits growth and induces apoptosis in esophagus cancer KYSE-150 cell lines via the MAP kinase pathway. J. Thorac. Dis. 2019, 11, 3030–3038. [Google Scholar] [CrossRef] [PubMed]
- Liu, Y.; Cao, W.; Zhang, B.; Liu, Y.-Q.; Wang, Z.-Y.; Wu, Y.-P.; Yu, X.-J.; Zhang, X.-D.; Ming, P.-H.; Zhou, G.-B. The natural compound magnolol inhibits invasion and exhibits potential in human breast cancer therapy. Sci. Rep. 2013, 3, 3098. [Google Scholar] [CrossRef] [PubMed]
- Chilampalli, C.; Zhang, X.; Kaushik, R.S.; Young, A.; Zeman, D.; Hildreth, M.B.; Fahmy, H.; Dwivedi, C. Chemopreventive effects of combination of honokiol and magnolol with α-santalol on skin cancer developments. Drug Discov. Ther. 2013, 7, 109–115. [Google Scholar] [PubMed]
- Chilampalli, C.; Guillermo, R.; Zhang, X.; Kaushik, R.S.; Young, A.; Zeman, D.; Hildreth, M.B.; Fahmy, H.; Dwivedi, C. Effects of magnolol on UVB-induced skin cancer development in mice and its possible mechanism of action. BMC Cancer 2011, 11, 456. [Google Scholar] [CrossRef] [PubMed]
- Usach, I.; Alaimo, A.; Fernández, J.; Ambrosini, A.; Mocini, S.; Ochiuz, L.; Peris, J.-E. Magnolol and Honokiol: Two Natural Compounds with Similar Chemical Structure but Different Physicochemical and Stability Properties. Pharmaceutics 2021, 13, 224. [Google Scholar] [CrossRef]
- Lu, C.-H.; Chen, S.-H.; Chang, Y.-S.; Liu, Y.-W.; Wu, J.-Y.; Lim, Y.-P.; Yu, H.-I.; Lee, Y.-R. Honokiol, a potential therapeutic agent, induces cell cycle arrest and program cell death in vitro and in vivo in human thyroid cancer cells. Pharmacol. Res. 2017, 115, 288–298. [Google Scholar] [CrossRef]
- Weng, Z.; Song, L.; Qi, Y.; Li, J.; Cao, Q.; Liu, C.; Zhang, S.; Wang, J.; Jian, X. Natural magnolol derivatives as platform chemicals for bio-based phthalonitrile thermoset: Achieving high performances without an external curing agent. Polymer 2021, 226, 123814–123825. [Google Scholar] [CrossRef]
- Patel, D.M.P.; Rushiraj, J. Ufasomes: A Vesicular Drug Delivery. Syst. Rev. Pharm. 2011, 2, 72–78. [Google Scholar] [CrossRef]
- Bhattacharya, S. Preparation and characterizations of glyceryl oleate ufasomes of terbinafine hydrochloride: A novel approach to trigger Candida albicans fungal infection. Future J. Pharm. Sci. 2021, 7, 3. [Google Scholar] [CrossRef]
- Sugiyama, T.; Takahashi, K.; Mori, H. Royal jelly acid, 10-hydroxy-trans-2-decenoic acid, as a modulator of the innate immune responses. Endocr. Metab. Immune Disord Drug Targets 2012, 12, 368–376. [Google Scholar] [CrossRef]
- Pavel, C.I.; Mărghitaş, L.A.; Bobiş, O.; Dezmirean, D.S.; Şapcaliu, A.; Radoi, I.; Mădaş, M.N. Biological activities of royal jelly-review. Sci. Pap. Anim. Sci. Biotechnol. 2011, 44, 108–118. [Google Scholar]
- You, M.; Miao, Z.; Sienkiewicz, O.; Jiang, X.; Zhao, X.; Hu, F. 10-Hydroxydecanoic acid inhibits LPS-induced inflammation by targeting p53 in microglial cells. Int. Immunopharmacol. 2020, 84, 106501–106513. [Google Scholar] [CrossRef] [PubMed]
- Ali, A.M.; Hendawy, A.O. Royal jelly acid, 10-hydroxy-trans-2-decenoic acid, for psychiatric and neurological disorders: How helpful could it be?! Edelweiss J. Food Sci. Technol. 2019, 1, 1–4. [Google Scholar]
- Kumar, P.; Singh, S.K.; Handa, V.; Kathuria, H. Oleic Acid Nanovesicles of Minoxidil for Enhanced Follicular Delivery. Medicines 2018, 5, 103. [Google Scholar] [CrossRef] [PubMed]
- Lai, W.F.; Tang, R.; Wong, W.T. Ionically Crosslinked Complex Gels Loaded with Oleic Acid-Containing Vesicles for Transdermal Drug Delivery. Pharmaceutics 2020, 12, 725. [Google Scholar] [CrossRef]
- Bolla, P.K.; Meraz, C.A.; Rodriguez, V.A.; Deaguero, I.; Singh, M.; Yellepeddi, V.K.; Renukuntla, J. Clotrimazole Loaded Ufosomes for Topical Delivery: Formulation Development and In-Vitro Studies. Molecules 2019, 24, 3139. [Google Scholar] [CrossRef]
- Salama, A.H.; Aburahma, M.H. Ufasomes nano-vesicles-based lyophilized platforms for intranasal delivery of cinnarizine: Preparation, optimization, ex-vivo histopathological safety assessment and mucosal confocal imaging. Pharm. Dev. Technol. 2016, 21, 706–715. [Google Scholar] [CrossRef]
- Zakir, F.; Vaidya, B.; Goyal, A.K.; Malik, B.; Vyas, S.P. Development and characterization of oleic acid vesicles for the topical delivery of fluconazole. Drug Deliv. 2010, 17, 238–248. [Google Scholar] [CrossRef]
- Tran, Y.T.H.; Tran, G.N.; Hoang, A.L.; Vu, G.T.T. Niosomes loaded with diclofenac for transdermal administration: Physico-chemical characterization, ex vivo and in vivo skin permeation studies. J. Appl. Pharm. Sci. 2020, 10, 53–61. [Google Scholar]
- Sharma, A.; Arora, S. Formulation and in vitro evaluation of ufasomes for dermal administration of methotrexate. ISRN Pharm. 2012, 2012, 873653. [Google Scholar] [CrossRef]
- Mehra, N.; Aqil, M.; Sultana, Y. A grafted copolymer-based nanomicelles for topical ocular delivery of everolimus: Formulation, characterization, ex-vivo permeation, in-vitro ocular toxicity, and stability study. Eur. J. Pharm. Sci. 2021, 159, 105735. [Google Scholar] [CrossRef] [PubMed]
- Gannu, R.; Palem, C.R.; Yamsani, V.V.; Yamsani, S.K.; Yamsani, M.R. Enhanced bioavailability of lacidipine via microemulsion based transdermal gels: Formulation optimization, ex vivo and in vivo characterization. Int. J. Pharm. 2010, 388, 231–241. [Google Scholar] [CrossRef] [PubMed]
- Al-mahallawi, A.M.; Fares, A.R.; Abd-Elsalam, W.H. Enhanced Permeation of Methotrexate via Loading into Ultra-permeable Niosomal Vesicles: Fabrication, Statistical Optimization, Ex Vivo Studies, and In Vivo Skin Deposition and Tolerability. AAPS PharmSciTech 2019, 20, 171–181. [Google Scholar] [CrossRef] [PubMed]
- Mittal, R.; Sharma, A.; Arora, S. Ufasomes Mediated Cutaneous Delivery of Dexamethasone: Formulation and Evaluation of Anti-Inflammatory Activity by Carrageenin-Induced Rat Paw Edema Model. J. Pharm. 2013, 2013, 680580–680592. [Google Scholar] [CrossRef]
- Wang, F.; Ma, H.; Liu, Z.; Huang, W.; Xu, X.; Zhang, X. α-Mangostin inhibits DMBA/TPA-induced skin cancer through inhibiting inflammation and promoting autophagy and apoptosis by regulating PI3K/Akt/mTOR signaling pathway in mice. Biomed. Pharmacother. 2017, 92, 672–680. [Google Scholar] [CrossRef]
- Gupta, D.; Trivedi, P. In vitro and in vivo characterization of pharmaceutical topical nanocarriers containing anticancer drugs for skin cancer treatment. In Lipid Nanocarriers for Drug Targeting; Elsevier: Amsterdam, The Netherlands, 2018; pp. 563–627. [Google Scholar] [CrossRef]
- Ong, C.P.; Lee, W.L.; Tang, Y.Q.; Yap, W.H. Honokiol: A Review of Its Anticancer Potential and Mechanisms. Cancers 2020, 12, 48. [Google Scholar] [CrossRef]
- Kong, Y.-H.; Xu, S.-P. Salidroside prevents skin carcinogenesis induced by DMBA/TPA in a mouse model through suppression of inflammation and promotion of apoptosis. Oncol. Rep. 2018, 39, 2513–2526. [Google Scholar] [CrossRef]
- Williams, J.D.; Bermudez, Y.; Park, S.L.; Stratton, S.P.; Uchida, K.; Hurst, C.A.; Wondrak, G.T. Malondialdehyde-derived epitopes in human skin result from acute exposure to solar UV and occur in nonmelanoma skin cancer tissue. J. Photochem. Photobiol. B 2014, 132, 56–65. [Google Scholar] [CrossRef]
- Jacquoilleot, S.; Sheffield, D.; Olayanju, A.; Sison-Young, R.; Kitteringham, N.R.; Naisbitt, D.J.; Aleksic, M. Glutathione metabolism in the HaCaT cell line as a model for the detoxification of the model sensitisers 2,4-dinitrohalobenzenes in human skin. Toxicol. Lett. 2015, 237, 11–20. [Google Scholar] [CrossRef]
- Nielsen, T.O.; Leung, S.C.Y.; Rimm, D.L.; Dodson, A.; Acs, B.; Badve, S.; Denkert, C.; Ellis, M.J.; Fineberg, S.; Flowers, M.; et al. Assessment of Ki67 in Breast Cancer: Updated Recommendations From the International Ki67 in Breast Cancer Working Group. J. Natl. Cancer Inst. 2020, 113, 808–819. [Google Scholar] [CrossRef]
- Klöppel, G.; La Rosa, S. Ki67 labeling index: Assessment and prognostic role in gastroenteropancreatic neuroendocrine neoplasms. Virchows Arch. 2018, 472, 341–349. [Google Scholar] [CrossRef] [PubMed]
- Melling, N.; Kowitz, C.M.; Simon, R.; Bokemeyer, C.; Terracciano, L.; Sauter, G.; Izbicki, J.R.; Marx, A.H. High Ki67 expression is an independent good prognostic marker in colorectal cancer. J. Clin. Pathol. 2016, 69, 209–214. [Google Scholar] [CrossRef] [PubMed]
- Mansy, M.; Soliman, M.; Mubarak, R.; Shamel, M. The role of exogenous epidermal growth factor on Ki-67 proliferation marker expression in the submandibular salivary gland of albino rats receiving doxorubicin. F1000Research 2020, 9, 1393. [Google Scholar] [CrossRef] [PubMed]
- Kumar, V.; Goswami, H.M. Spectrum of non-neoplastic skin lesions: A histopathological study based on punch biopsy. Int. J. Curr. Res. Rev. 2018, 10, 43–48. [Google Scholar]
- Popovska, O.; Simonovska, J.; Kavrakovski, Z.; Rafajlovska, V. An Overview: Methods for Preparation and Characterization of Liposomes as Drug Delivery Systems. Int. J. Pharm. Phytopharm. Res. 2013, 3, 182–189. [Google Scholar]
- Barker, S.A.; Foster, A.B.; Lamb, D.C.; Hodgson, N. Identification of 10-Hydroxy-Δ2-decenoic Acid in Royal Jelly. Nature 1959, 183, 996–997. [Google Scholar] [CrossRef]
- Kodai, T.; Umebayashi, K.; Nakatani, T.; Ishiyama, K.; Noda, N. Compositions of royal jelly II. Organic acid glycosides and sterols of the royal jelly of honeybees (Apis mellifera). Chem. Pharm. Bull. 2007, 55, 1528–1531. [Google Scholar] [CrossRef]
- Angelov, T.; Hristov, I. HPLC determination of pka value of 10-hydroxy-2-decenoic acid. J. Liq. Chromatogr. Relat. Technol. 2018, 41, 87–92. [Google Scholar] [CrossRef]
- Novales, B.; Navailles, L.; Axelos, M.; Nallet, F.; Douliez, J.-P. Self-Assembly of Fatty Acids Hydroxyl Derivative Salts. Langmuir Am. Chem. Soc. J. Surf. Colloids 2008, 24, 62–68. [Google Scholar] [CrossRef]
- Salimi, A.; Emam, M.; Mohammad Soleymani, S. Increase adapalene delivery using chemical and herbal enhancers. J. Cosmet. Dermatol. 2021, 20, 3011–3017. [Google Scholar] [CrossRef]
- Brgles, M.; Jurašin, D.; Sikirić, M.D.; Frkanec, R.; Tomašić, J. Entrapment of ovalbumin into liposomes—Factors affecting entrapment efficiency, liposome size, and zeta potential. J. Liposome Res. 2008, 18, 235–248. [Google Scholar] [CrossRef] [PubMed]
- Weaver, N.; Johnston, N.C.; Benjamin, R.; Law, J.H. Novel fatty acids from the royal jelly of honeybees (Apis mellifera, L.). Lipids 1968, 3, 535–538. [Google Scholar] [CrossRef] [PubMed]
- Gill, P.; Moghadam, T.T.; Ranjbar, B. Differential scanning calorimetry techniques: Applications in biology and nanoscience. J. Biomol. Tech. 2010, 21, 167–193. [Google Scholar] [PubMed]
- Santoyo, S.; Arellano, A.; Ygartua, P.; Martin, C. Penetration enhancer effects on the in vitro percutaneous absorption of piroxicam through rat skin. Int. J. Pharm. 1995, 117, 219–224. [Google Scholar] [CrossRef]
- Engelbrecht, T.N.; Schroeter, A.; Hauß, T.; Neubert, R.H. Lipophilic penetration enhancers and their impact to the bilayer structure of stratum corneum lipid model membranes: Neutron diffraction studies based on the example oleic acid. Biochim. Biophys. Acta Biomembr. 2011, 1808, 2798–2806. [Google Scholar] [CrossRef]
- Verma, S.; Bhardwaj, A.; Vij, M.; Bajpai, P.; Goutam, N.; Kumar, L. Oleic acid vesicles: A new approach for topical delivery of antifungal agent. Artif. Cells Nanomed. Biotechnol. 2014, 42, 95–101. [Google Scholar] [CrossRef]
- Jiang, S.J.; Hwang, S.M.; Choi, E.H.; Ahn, S.K.; Elias, P.M.; Lee, S.H. Structural and functional effects of oleic acid and iontophoresis on hairless mouse stratum corneum. J. Investig. Dermatol. 2000, 114, 64–70. [Google Scholar] [CrossRef]
- Da Silva, E.R.; Faria de Freitas, Z.M.; Brito Gitirana, L.d.; Ricci-Júnior, E. Improving the topical delivery of zinc phthalocyanine using oleic acid as a penetration enhancer: In vitro permeation and retention. Drug Dev. Ind. Pharm. 2011, 37, 569–575. [Google Scholar] [CrossRef]
- Dias, M.F.; de Figueiredo, B.C.P.; Teixeira-Neto, J.; Guerra, M.C.A.; Fialho, S.L.; Cunha, A.S. In vivo evaluation of antitumoral and antiangiogenic effect of imiquimod-loaded polymeric nanoparticles. Biomed. Pharmacother. 2018, 103, 1107–1114. [Google Scholar] [CrossRef]
- Nainu, F.; Masyita, A.; Bahar, M.; Raihan, M.; Prova, S.R.; Mitra, S.; Emran, T.B.; Simal-Gandara, J. Pharmaceutical prospects of bee products: Special focus on anticancer, antibacterial, antiviral, and antiparasitic properties. Antibiotics 2021, 10, 822. [Google Scholar] [CrossRef]
- Khazaei, M.; Ansarian, A.; Ghanbari, E. New findings on biological actions and clinical applications of royal jelly: A review. J. Diet. Suppl. 2018, 15, 757–775. [Google Scholar] [CrossRef] [PubMed]
- Ayna, A.; Tunc, A.; Özbolat, S.N.; Bengü, A.Ş.; Aykutoğlu, G.; Canli, D.; Polat, R.; Ciftci, M.; Darendelioğlu, E. Anticancer, and antioxidant activities of royal jelly on HT-29 colon cancer cells and melissopalynological analysis. Turk. J. Bot. 2021, 45, 809–819. [Google Scholar] [CrossRef]
- Albalawi, A.E.; Althobaiti, N.A.; Alrdahe, S.S.; Alhasani, R.H.; Alaryani, F.S.; BinMowyna, M.N. Antitumor Activity of Royal Jelly and Its Cellular Mechanisms against Ehrlich Solid Tumor in Mice. BioMed Res. Int. 2022, 2022, 7233997. [Google Scholar] [CrossRef] [PubMed]


| Independent Variable | Low Level (−1) | Medium Level (0) | High Level (+1) |
|---|---|---|---|
| A: Fatty Acid Concentration (%w/v) | 0.25 | 0.5 | 0.75 |
| B: Span® 80 Concentration(a) (%w/w) | 5 | 12.5 | 20 |
| C: Mag Concentration (a) (%w/w) | 0 | 10 | 20 |
| D: Fatty acid type (b) | OA | - | HDA |
| Formula Code | Independent Variables | Responses * ± SD | ||||||
|---|---|---|---|---|---|---|---|---|
| A: Fatty Acid Concentration | B: Surfactant Concentration | C: Drug Concentration | D: Fatty Acid Type | Y1: PS (nm) | Y2: PDI | Y3: ZP (mV) | Y4: EE | |
| F1 | 0.25 | 12.5 | 0 | OA | 662.75 ± 40.09 | 0.638 ± 0.110 | −83.4 ± 1 | 0 |
| F2 | 0.5 | 12.5 | 10 | OA | 557.40 ± 20.51 | 0.676 ± 0.168 | −83.6 ± 5 | 95.08 ± 2.82 |
| F3 | 0.25 | 12.5 | 20 | HDA | 198.17 ± 11.34 | 0.200 ± 0.008 | −61.2 ± 2 | 63.86 ± 6.78 |
| F4 | 0.75 | 12.5 | 0 | HDA | 413.20 ± 55.50 | 0.560 ± 0.122 | −48.7 ± 1 | 0 |
| F5 | 0.5 | 5 | 0 | OA | 547.85 ± 155.35 | 0.509 ± 0.038 | −87.1 ± 6 | 0 |
| F6 | 0.5 | 12.5 | 10 | HDA | 297.37 ± 14.72 | 0.360 ± 0.022 | −57.6 ± 4 | 73.90 ± 4.87 |
| F7 | 0.25 | 20 | 10 | OA | 362.30 ± 21.92 | 0.530 ± 0.098 | −83.0 ± 2 | 68.44 ± 12.29 |
| F8 | 0.5 | 5 | 20 | OA | 324.20 ± 36.20 | 0.568 ± 0.122 | −82.7 ± 3 | 80.03 ± 3.01 |
| F9 | 0.75 | 12.5 | 20 | OA | 532.07 ± 102.89 | 0.767 ± 0.224 | −63.9 ± 2 | 84.15 ± 1.41 |
| F10 | 0.5 | 12.5 | 10 | HDA | 304.90 ± 16.87 | 0.366 ± 0.211 | −61.7 ± 5 | 70.82 ± 4.51 |
| F11 | 0.5 | 5 | 20 | HDA | 752.80 ± 5.37 | 0.790 ± 0.231 | −44.8 ± 3 | 86.55 ± 0.96 |
| F12 | 0.25 | 20 | 10 | HDA | 185.80 ± 17.96 | 0.229 ± 0.120 | −65.0 ± 4 | 65.37 ± 2.30 |
| F13 | 0.25 | 12.5 | 20 | OA | 291.55 ± 49.55 | 0.539 ± 0.147 | −90.1 ± 3 | 82.68 ± 6.02 |
| F14 | 0.25 | 5 | 10 | OA | 344.37 ± 43.88 | 0.549 ± 0.167 | −89.6 ± 6 | 73.87 ± 19.97 |
| F15 | 0.5 | 20 | 20 | HDA | 235.80 ± 11.74 | 0.305 ± 0.013 | −59.3 ± 2 | 74.10 ± 1.41 |
| F16 | 0.5 | 12.5 | 10 | OA | 542.90 ± 19.40 | 0.766 ± 0.176 | −73.7 ± 1 | 93.09 ± 2.83 |
| F17 | 0.75 | 5 | 10 | OA | 495.60 ± 25.17 | 0.529 ± 0.033 | −78.4 ± 1 | 82.06 ± 8.79 |
| F18 | 0.5 | 20 | 0 | HDA | 199.50 ± 1.77 | 0.229 ± 0.011 | −56.4 ± 2 | 0 |
| F19 | 0.75 | 20 | 10 | HDA | 481.05 ± 47.87 | 0.647 ± 0.203 | −48.2 ± 1 | 81.46 ± 10.49 |
| F20 | 0.5 | 12.5 | 10 | HDA | 306.80 ± 8.98 | 0.334 ± 0.183 | −59.6 ± 1 | 71.37 ± 2.77 |
| F21 | 0.5 | 12.5 | 10 | OA | 557.40 ± 45.31 | 0.735 ± 0.157 | −78.65 ± 6 | 97.08 ± 1.92 |
| F22 | 0.75 | 5 | 10 | HDA | 248.30 ± 15.98 | 0.407 ± 0.103 | −51.1 ± 4 | 83.03 ± 4.86 |
| F23 | 0.5 | 20 | 20 | OA | 437.60 ± 11.40 | 0.697 ± 0.143 | −76.2 ±3 | 89.67 ± 0.13 |
| F24 | 0.5 | 20 | 0 | OA | 477.80 ± 10.04 | 0.619 ± 0.047 | −77.9 ± 2 | 0 |
| F25 | 0.5 | 5 | 0 | HDA | 167.90 ± 13.01 | 0.230 ± 0.005 | −65.4 ± 5 | 0 |
| F26 | 0.75 | 20 | 10 | OA | 432.53 ± 125.53 | 0.650 ± 0.164 | −63.0 ± 6 | 76.69 ± 1.71 |
| F27 | 0.75 | 12.5 | 0 | OA | 836.60 ± 397.90 | 0.505 ± 0.021 | −67.0 ± 4 | 0 |
| F28 | 0.75 | 12.5 | 20 | HDA | 243.20 ± 37.62 | 0.337 ± 0.022 | −44.1 ± 7 | 89.76 ± 7.21 |
| F29 | 0.25 | 12.5 | 0 | HDA | 156.40 ± 1.56 | 0.168 ± 0.014 | −69.7 ± 4 | 0 |
| F30 | 0.25 | 5 | 10 | HDA | 185.10 ± 7.88 | 0.213 ± 0.056 | −45.7 ± 2 | 76.77 ± 7.68 |
| Terms | Responses | |||||
|---|---|---|---|---|---|---|
| PS | ZP | EE | ||||
| F-Value | p-Value | F-Value | p-Value | F-Value | p-Value | |
| Model | 165.82 * | <0.0001 | 23.65 * | <0.0001 | 143.77 * | <0.0001 |
| A | 387.78 * | <0.0001 | 41.61 * | <0.0001 | 18.94 * | 0.0014 |
| B | 29.54 * | 0.0003 | 0.68 NS | 0.4188 | 3.06 NS | 0.1110 |
| C | 162.06 * | <0.0001 | 3.03 NS | 0.0977 | 1832.62 * | <0.0001 |
| D | 39.57 * | <0.0001 | 168.48 * | <0.0001 | 46.57 * | <0.0001 |
| AB | 6.83 * | 0.0259 | 5.26 * | 0.0334 | 0.85 NS | 0.3792 |
| AC | 212.04 * | <0.0001 | 0.19 NS | 0.6674 | 6.48 * | 0.0291 |
| AD | 217.62 * | <0.0001 | 1.62 NS | 0.2190 | 3.98 NS | 0.0739 |
| BC | 21.76 * | 0.0009 | 3.76 NS | 0.0675 | 0.07 NS | 0.7991 |
| BD | 19.02 * | 0.0014 | 9.72 * | 0.0057 | 2.55 NS | 0.1416 |
| CD | 319.84 * | <0.0001 | 2.19 NS | 0.1551 | 2.14 NS | 0.1738 |
| A2 | 19.54 * | 0.0013 | 12.20 * | 0.0058 | ||
| B2 | 108.1 * | <0.0001 | 6.80 * | 0.0262 | ||
| C2 | 69.57 * | <0.0001 | 799.74 * | <0.0001 | ||
| ABD | 11.97 * | 0.0061 | 0.83 NS | 0.3848 | ||
| ACD | 338.1 * | <0.0001 | 5.16 * | 0.0464 | ||
| BCD | 48.24 * | <0.0001 | 4.23 NS | 0.0670 | ||
| A2D | 6.19 * | 0.0321 | 14.81 * | 0.0032 | ||
| B2D | 59.89 * | <0.0001 | 17.81 * | 0.0018 | ||
| C2D | 55.21 * | <0.0001 | 6.46 * | 0.0293 | ||
| Lack of fit | 3.03 NS | 0.1514 | 1.75 NS | 0.3128 | 1.07 NS | 0.4961 |
| Response | PS | ZP | EE |
|---|---|---|---|
| Suggested Model | Reduced Cubic | 2FI | Reduced Cubic |
| Equation | (PS)−3 = +2.211 × 10⁻⁸ − 3.128 × 10⁻⁸A − 8.632 × 10⁻⁹B − 2.022 × 10⁻⁸C + 1.632 × 10⁻⁸D − 5.870 × 10⁻⁹AB + 3.271 × 10⁻⁸AC − 2.343 × 10⁻⁸AD + 1.048 × 10⁻⁸BC − 6.926 × 10⁻⁹BD − 2.841 × 10⁻⁸CD + 1.033 × 10⁻⁸A2 + 2.431 × 10⁻⁸B2 + 1.950 × 10⁻⁸C2 − 7.771 × 10⁻⁹ABD + 4.130 × 10⁻⁸ACD + 1.560 × 10⁻⁸BCD + 5.816 × 10⁻⁹A2D + 1.809 × 10⁻⁸B2D + 1.737 × 10⁻⁸C2D | ZP = −67.23 + 7.71A + 0.9875B + 2.08C + 11.33D + 3.88AB + 0.7375AC − 1.52AD − 3.28BC − 3.72BD + 1.77CD | EE = +84.49 + 4.13A − 1.66B + 40.68C − 10.59D + 1.24AB + 3.42AC + 1.90AD − 0.3512BC − 1.52BD − 1.39CD − 4.88A2 − 3.65B2 − 39.55C2 + 1.22ABD + 3.05ACD − 2.76BCD + 5.38A2D + 5.90B2D + 3.55C2D |
| R2 | 0.9968 | 0.9256 | 0.9964 |
| Adjusted R2 | 0.9908 | 0.8865 | 0.9894 |
| Predicted R2 | 0.9572 | 0.7965 | 0.9609 |
| Adequate Precision | 51.3279 | 15.0279 | 31.3583 |
| Formula Code | Formulation Composition | Experimental Results * | Predicted Results | Prediction Error (%) | ||||||
|---|---|---|---|---|---|---|---|---|---|---|
| PS (nm) ± SD | ZP (mV) ± SD | EE (%) ± SD | PS (nm) | ZP (mV) | EE (%) | PS | ZP | EE | ||
| F-V1 | 0.25% w/v OA, 6.96% w/w Span®80, and 14.56% w/w Mag. | 358.90 ± 3.20 | −82.50 ± 7.13 | 79.56 ± 2.76 | 310.96 | −87.48 | 86.71 | 15.42 | 5.69 | 8.25 |
| F-V2 | 0.47% w/v OA, 20% w/w Span®80, and 8.78% w/w Mag. | 404.40 ± 10.54 | −70.30 ± 6.20 | 88.97 ± 1.92 | 496.22 | −74.56 | 79.11 | 18.50 | 5.71 | 12.46 |
| F-V3 | 0.25% w/v HDA, 20% w/w Span®80, and 12.94% w/w Mag | 191.90 ± 6.28 | −59.60 ± 3.07 | 78.94 ± 0.86 | 200.37 | −68.75 | 70.62 | 4.23 | 13.31 | 11.78 |
| F-V4 | 0.75 % w/v HDA, 16.95 w/w Span®80, and 16.12% w/w Mag. | 287.60 ± 11.48 | −53.10 ± 4.78 | 93.18 ± 3.42 | 304.57 | −47.42 | 94.19 | 5.57 | 11.98 | 1.07 |
| F-V5 | 0.425 % w/v HDA, 15.69% w/w Span®80, and 15.35% w/w Mag | 243.90 ± 6.61 | −50.60 ± 4.60 | 92.62 ± 1.20 | 300.00 | −58.23 | 79.83 | 18.70 | 13.10 | 16.02 |
| Formula Code | Independent Factors | Measured Responses * ± SD | ||||||
|---|---|---|---|---|---|---|---|---|
| A: Fatty Acid Concentration (%w/v) | B: Surfactant Concentration (%w/w) a | C: Drug Concentration (%w/w) a | D: Fatty Acid Type | PS (nm) | PDI | ZP (mV) | EE (%) | |
| F-O1 | 0.25 | 6.96 | 14.56 | OA | 358.90 ± 3.20 | 0.472 ± 0.011 | −82.50 ± 7.13 | 79.56 ± 2.76 |
| F-O2 | 0.25 | 20 | 12.95 | HDA | 191.90 ± 6.28 | 0.200 ± 0.021 | −59.60 ± 3.07 | 78.94 ± 0.86 |
| F-O3 | 0.425 | 15.69 | 15.35 | HDA | 243.90 ± 6.61 | 0.260 ± 0.013 | −50.60 ± 4.60 | 92.62 ± 1.20 |
| Formula Code | Q24 a ± SD (µg/cm2) | Jss (µg/cm2/h) | ER b |
|---|---|---|---|
| F-O1 | 113.24 ± 6.39 | 4.61 | 2.24 |
| F-O2 | 55.19 ± 6.97 | 2.05 | 1.72 |
| F-O3 | 39.03 ± 6.80 | 1.66 | 1.39 |
| Drug suspension | 26.91 ± 4.50 | 1.19 | --- |
| Group Number | Initial Average Mice Body Weight (g) ± SD | Average Weight (g) at the End of the Study ± SD |
|---|---|---|
| I | 23.00 ± 1.83 | 23.00 ± 1.83 |
| II | 23.03 ± 1.61 | 16.05 ± 2.01 |
| III | 24.07 ± 1.50 | 18.65 ± 0.79 |
| IV | 23.42 ± 1.67 | 19.55 ± 1.85 |
| V | 23.13 ± 1.88 | 20.04 ± 1.63 |
| VI | 24.09 ± 1.01 | 22.06 ± 0.87 |
Disclaimer/Publisher’s Note: The statements, opinions and data contained in all publications are solely those of the individual author(s) and contributor(s) and not of MDPI and/or the editor(s). MDPI and/or the editor(s) disclaim responsibility for any injury to people or property resulting from any ideas, methods, instructions or products referred to in the content. |
© 2023 by the authors. Licensee MDPI, Basel, Switzerland. This article is an open access article distributed under the terms and conditions of the Creative Commons Attribution (CC BY) license (https://creativecommons.org/licenses/by/4.0/).
Share and Cite
Atef, B.; Ishak, R.A.H.; Badawy, S.S.; Osman, R. 10-Hydroxy Decanoic Acid-Based Vesicles as a Novel Topical Delivery System: Would It Be a Better Platform Than Conventional Oleic Acid Ufasomes for Skin Cancer Treatment? Pharmaceutics 2023, 15, 1461. https://doi.org/10.3390/pharmaceutics15051461
Atef B, Ishak RAH, Badawy SS, Osman R. 10-Hydroxy Decanoic Acid-Based Vesicles as a Novel Topical Delivery System: Would It Be a Better Platform Than Conventional Oleic Acid Ufasomes for Skin Cancer Treatment? Pharmaceutics. 2023; 15(5):1461. https://doi.org/10.3390/pharmaceutics15051461
Chicago/Turabian StyleAtef, Bassant, Rania A. H. Ishak, Sabry S. Badawy, and Rihab Osman. 2023. "10-Hydroxy Decanoic Acid-Based Vesicles as a Novel Topical Delivery System: Would It Be a Better Platform Than Conventional Oleic Acid Ufasomes for Skin Cancer Treatment?" Pharmaceutics 15, no. 5: 1461. https://doi.org/10.3390/pharmaceutics15051461