1. Introduction
Cancer has become a deadly threat to global human health nowadays, and the complexity and diversity of tumors still require more advanced and effective treatments. For decades, nanozymes with peroxidase (POD)-like activity have demonstrated their great potential for converting hydrogen peroxide (H
2O
2) and oxygen (O
2) into toxic reactive oxygen species (ROS) [
1,
2,
3], for instance, singlet oxygen (
1O
2) [
4], superoxide ion (•O
2−) [
5], or hydroxyl radical (•OH) [
6]. ROS is known as a super oxidant, which has an anti-tumor effect on the immune system, and ROS can kill cancer cells by destroying DNA, proteins, cell membranes, etc., [
7,
8,
9,
10] The excessive products of H
2O
2 decomposition in the tumor microenvironment (TME) provide raw materials for enhancing the effect of chemodynamic therapy (CDT) on tumors by mediating Fenton-like reactions [
11,
12]. A more advantageous point is that the H
2O
2 deficiency in normal cells does not cause severe Fenton reaction, which means minor damage to normal tissues [
13,
14,
15]. Some researchers pointed out that tumor cells are more sensitive to ROS than normal cells, which may be related to their different antioxidant mechanisms [
16,
17]. Therefore, utilizing highly generated ROS to eliminate cancer cells would be an ideal antitumor strategy. However, it does need to be noted that the process of anaerobic glycolysis produces an abnormal excess of glutathione (GSH) in the TME, which can greatly reduce the catalytic activity of nanozyme and affect the therapeutic effect [
18,
19,
20,
21]. Therefore, reducing GSH levels in the TME is crucial to enhance the effectiveness of CDT against tumors.
Single-atom catalysts (SACs) allow for the maximal presence of accessible active sites and may confer unique catalytic properties unattainable by their non-atomically dispersed counterparts [
22,
23,
24,
25]. The well-defined atomic-level dispersion provides maximum atom utilization efficiency, favoring atom economy for metal usage [
26,
27,
28,
29]. Their unique structure and coordination environment enhances catalytic activity in reactions with superior stability of materials [
30,
31,
32,
33]. Therefore, the construction of SACs will be an effective strategy for organismal biochemical reactions. Recently, economical SACs composed of Fe-N
4 moieties have been listed as one of the most promising candidates for excellent activity because of their lowest cost and ultrahigh metal utilization [
34,
35,
36,
37]. However, the structure of Fe-N
4 exists in a state of symmetrical electron distribution, resulting in ideal adsorption energy for O
2 intermediates. Herein, establishing an adjacent metal center to regulate the electron localization of Fe-N
4 would be a promising approach to promote ROS generation.
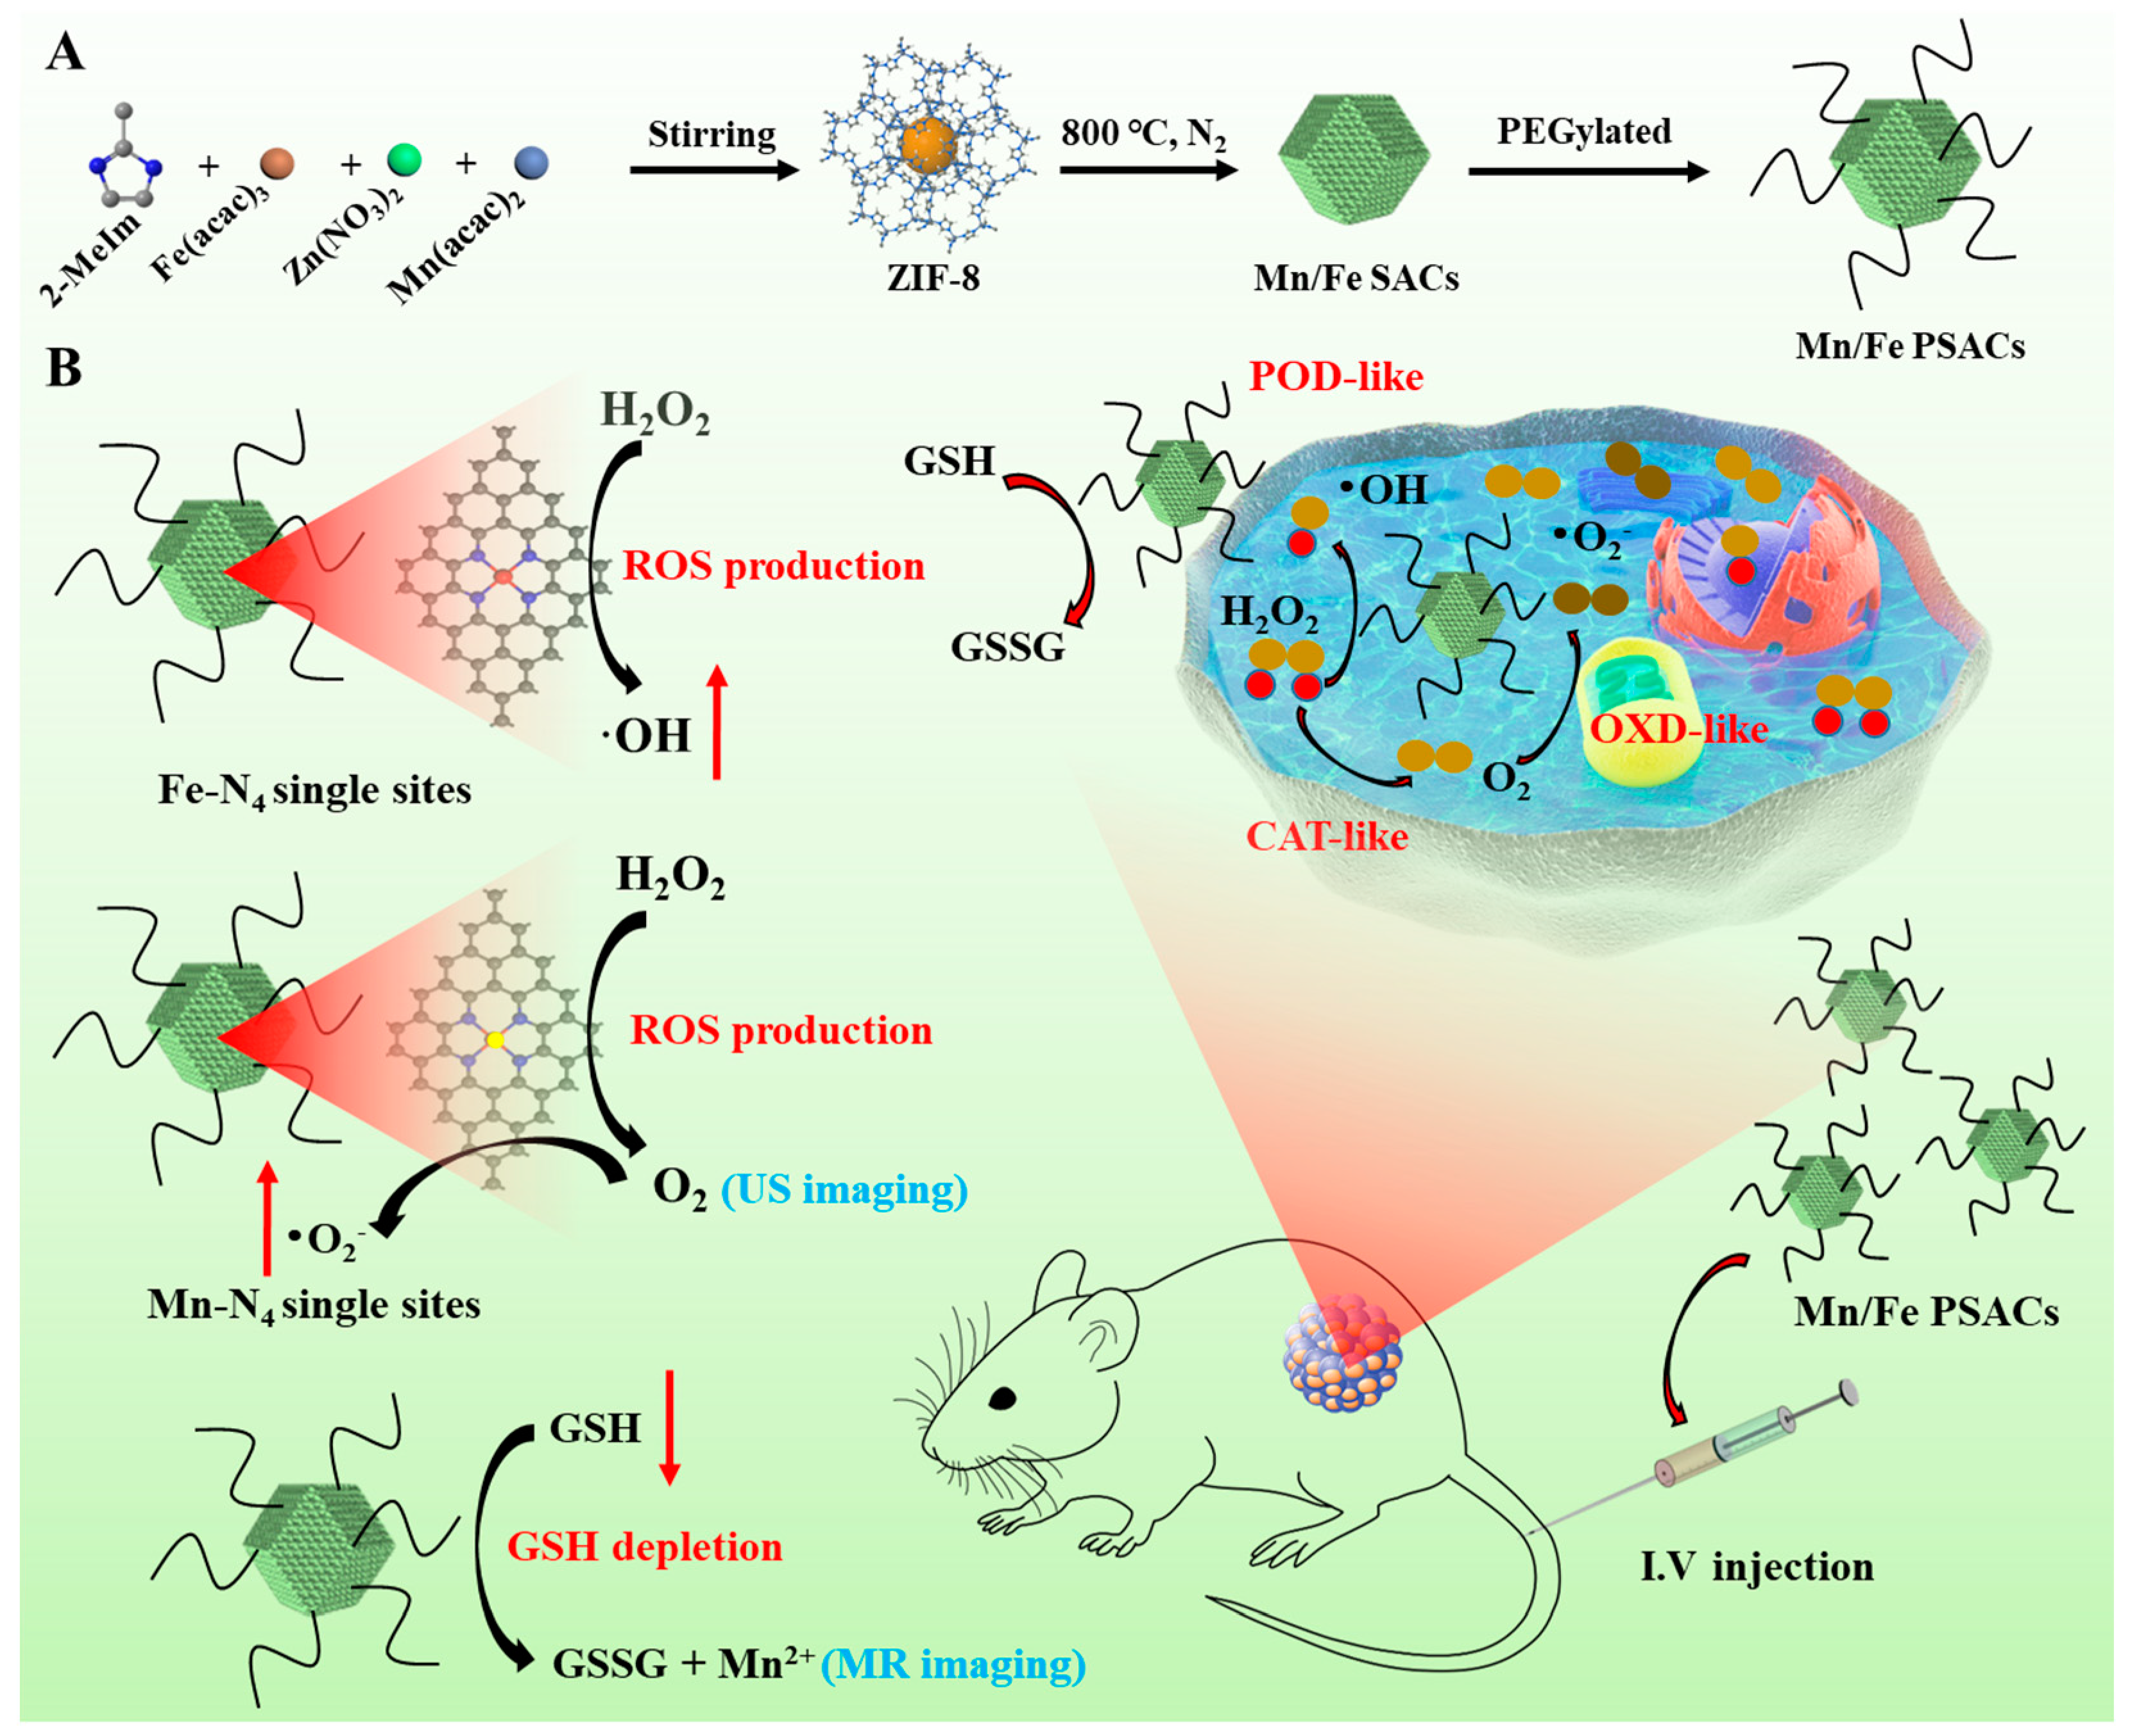
In this study, PEGylated nanocatalysts of SACs (Mn/Fe PSACs) with the co-presence of Fe-N
4 and Mn-N
4 moieties were synthesized, in which SACs have an efficient ability to catalyze POD-like reactions, producing abundant ROS kills cancer cells (
Scheme 1). The single Mn/Fe atoms coordinated to nitrogen show high Fenton activity in hollow zeolite imidazole frameworks (ZIF-8s). With this advantage, Mn/Fe PSACs convert cellular H
2O
2 into •OH through a Fenton-like reaction, while the decomposed product–O
2 can be continuously catalyzed into cytotoxic •O
2− through oxidase-like activity. Moreover, Mn/Fe PSACs also exhibited GSH-depleting properties, which could enhance the therapeutic effect of ROS-eliminating cancer. The excellent chemodynamic performance and magnetic resonance contrast imaging capabilities of Mn/Fe PSACs also support superior tumor suppression. Above all, Mn/Fe PSACs can serve as super diagnostic and therapeutic nanoagents, which have great potential for biomedical and clinical treatments in the future.
2. Experimental Section
2.1. Chemicals and Materials
Zinc nitrate hexahydrate (Zn(NO3)2·6H2O, 98%, Alfa Aesar, MA, USA), Manganese acetylacetonate (Mn(acac)2, AR, Aladdin, Shanghai, China), 2-methylimidazole (2-MeIm, 98%, Thermo Fisher Scientific, MA, USA), Iron (III) 2,4-pentanedionate (Fe(acac)3, Alfa Aesar, MA, USA), methanol (Sinopharm Chemical, Shanghai, China), KOH (analytical grade, Sinopharm Chemical, Shanghai, China), Nafion D-521 dispersion (5% w/w in water and 1-propanol) (Alfa Aesar, MA, USA), N, N-dimethylformamide (DMF, Sinopharm Chemical, Shanghai, China) were directly used. Distilled water was used in all experiments.
2.2. Synthesis of Mn/Fe PSACs
Solution A: 1.314 g (16 mM) 2-MeIm was dissolved in 10 mL methanol and sonicated for 10 min. Solution B: 1.19 g (4 mM) Zn(NO3)2·6H2O, 70.6 mg Fe(acac)3 (0.2 mM), and 39 mg Mn(acac)2 (0.4 mM) were dissolved in 30 mL methanol and sonicated for 10 min. Solution B was quickly added to solution A and the mixture was stirred for 1 h at room temperature. The mixture was transferred into a 50 mL Teflon-lined stainless-steel autoclave and sealed at 120 °C for 5 h. The mixture was centrifuged and washed with DMF until the supernatant was colorless and then washed with methanol three times and dried at 60 °C under vacuum for 12 h. Then, Mn/Fe SACs were obtained after pyrolysis at 1000 °C under an N2 atmosphere for 2 h. Finally, Mn/Fe PSACs were modified with SH-PEG by stirring at room temperature.
2.3. Characterization
The crystal structure was determined by X-ray powder diffraction (XRD) (Bruker) equipped with Cu-Kα radiation (λ = 0.154 nm). Transmission electron microscopy (TEM) was recorded using an FEI Tecnai G2 S-Twin with a field emission gun. The high-angle annular dark-field scanning transmission electron microscopy (HAADF-STEM) images were acquired with a Titan 80–300 scanning/transmission electron microscope. Raman shifts were carried out by using a LabRAM Aramis Raman spectrometer instrument. The UV-vis absorption spectra were obtained from the U-3100 spectrophotometer (Hitachi, Tokyo, Japan). The X-ray photoelectron spectra (XPS) were taken on a VG ESCALAB MK II electron spectrometer. Dynamic light scattering (DLS) and Zeta potential were obtained by using a Malvern instrument Zetasizer Nano system (Malvern Instruments, Worcestershire, UK). The electron spin resonance (ESR) spectrum was measured by using Bruker EMXplus Spectrometer System (BrukerBioSpin, Rheinstetten, Germany). The elements’ contents were measured by an inductively coupled plasma mass spectrometer (ICP-MS, Agilent 7500Cx, Agilent Technologies, CA, USA).
2.4. Hemolysis and the Shape of RBCs
The centrifugation of whole blood (5 mL, with anticoagulation) at 3000 rpm for 15 min could acquire RBCs. PBS was used to dilute the RBCs (V
PBS:V
RBCs = 9:1). Afterward, Mn/Fe PSACs were confected into different concentration dispersion (2 mL) by PBS, and then the dispersions were incubated with 0.5 mL of RBCs suspension. 2 mL of deionized water and PBS were mixed with 0.5 mL of RBCs suspension, respectively, served as positive and negative controls. Keeping all mixtures maintain at 37 °C for 3 h. After the mixtures were centrifuged at 3000 rpm for 15 min, the optical density (O.D.) of the supernatant at 541 nm was measured by a microplate reader (BioTek synergy 2). The hemolysis rate was calculated with the following formula:
where O.D.
sample, O.D.
positive, and O.D.
negative was the O.D. of the sample, positive control, and negative control, respectively. The observation of RBCs’ shape through light microscopy (BM2100, Nanjing Jiangnan Novel Optics Co., Ltd., Nanjing, China).
2.5. Decomposition of H2O2
For verifying the catalytic durability of 200 μg/mL toward H2O2, H2O2 solution was added repeatedly to the 200 μg/mL solution followed by measuring the catalytic efficiency under a pH value of 6.5. An optical oxygen sensor (NeoFox, Ocean Optics, FL, USA) was used to quantify the amount of evolving oxygen in the reaction system (150 µM of H2O2 and 200 μg/mL of Mn/Fe PSACs).
2.6. GSH-Depleted Property of Mn/Fe PSACs
The consumption of GSH was detected with a DTNB probe by UV-vis-NIR spectroscopy. The as-obtained Cu SASs/NPC with different concentrations (200 μg/mL) were mixed with GSH (1.0 mM) at room temperature. At different time points, 100 μL of the mixture was added into 900 μL phosphate buffer saline (PBS, pH 7.4), and then DTNB (0.1 mM) was added to the mixed solution. Three minutes later, the absorbance spectrum of this mixed solution was recorded by a UV-vis-NIR spectrophotometer.
2.7. POD-Mimic Activity
POD-mimic activity assays of Mn/Fe PSACs were performed using Tetramethylbenzidine (TMB) as substrates in the presence of H2O2. In brief, Mn/Fe PSACs (200 μg/mL), H2O2 (1 mM), and TMB (100 μg/mL) were added to 2 mL of PBS solution (pH 6.5) at 42 °C. The absorbance of the color reactions was recorded after a certain reaction time using a UV-vis spectrophotometer.
2.8. Oxidase-like Activity of Mn/Fe PSACs and Kinetic Assay
The oxidase-like activity of the Mn/Fe PSACs was tested by oxidation of TMB in the HAc-NaAc buffer solution (0.1 M, pH = 4.5). In the general procedure, 25 µL (200 µg/mL) Mn/Fe PSACs solution was added into 2.0 mL buffer solution, followed by 20 µL TMB (in EtOH, 5 mg/mL). UV–Vis absorption spectra were used to measure the absorbance at 370 and 652 nm. The kinetic assays of nanozyme with TMB as the substrate was performed by adding different amounts (0, 100, 200, 400, and 800 µmol/L) of TMB solution. The Michaelis–Menten constant was calculated according to the Michaelis–Menten saturation curve.
2.9. Cell Culture
HepG2 cells were seeded in RPMI 1640 medium supplemented with 10% FBS, penicillin (100 units/mL), and streptomycin (100 μg/mL) in 5% CO2 at 37 °C.
2.10. Cell Uptake Assay
Mn/Fe PSACs were labeled with Cy5 and centrifuged to eliminate excess free Cy5. HepG2 cells (5 × 10⁵ cells, 24-well plate) were cultured in RPMI 1640 medium at 37 °C. The HepG2 cells were treated with the free Mn/Fe PSACs (20 μg/mL). The HepG2 cells were then incubated for 4 h. At last, PBS was used to wash the cells and a fluorescent microscope was used to observe the cell morphology.
2.11. Intracellular Generation of ROS
The HepG2 cells (1 × 10⁵ cells/well) were cultured in a 24-well plate for 1 day. The culture medium was discarded and the fresh culture medium containing Mn/Fe PSACs (200 μg/mL) and H2O2 (100 μM) was added 4 h later, adding 2,7-dichlorofluorescein diacetate (DCFH-DA) in the medium was incubated for a further 0.5 h. At last, PBS was used to wash the cells and a fluorescent microscope was used to observe the cell morphology.
2.12. In Vitro Living/Dead Staining
HepG2 cells were seeded on glass-bottom dishes and cultured for 24 h and transferred with fresh acidified medium (pH = 6.0) containing different samples and H2O2 (100 μM) and sequentially incubated for another 4 h. After 24 h, cells were washed with PBS for three times and stained with calcein-AM (2 µL) and PI (2 µL) for 15 min. Cells were washed with PBS three times again and detected by using a fluorescent microscope.
2.13. In Vitro Cell Cytotoxicity Assay
The cytotoxicity of Mn/Fe PSACs was evaluated in HepG2 cells following the CCK-8 assay standard protocol. Briefly, HepG2 cells were seeded in 96-well plates (5 × 10³ cells per well) and cultured in complete RPMI 1640 media for 12 h at 37 °C. Then, media were replaced with fresh media containing Mn/Fe PSACs (0 to 250 μg/mL) and H2O2 (100 μM) and incubated for 24 h. Afterward, the media was replaced with 100 μL of fresh complete medium containing 10% CCK-8. The absorbance at 450 nm of each well was recorded using a microplate reader (Multiskan MK3, Thermo Scientific, Waltham, MA, USA).
2.14. Animal Model
Female nude mice (5–7 weeks old) were obtained from Jiangsu KeyGEN BioTECH Corp., Ltd (Nanjing, China). All performance of in vivo experiments was in line with the institutional animal use and care regulations approved by Jiangnan University (ethics committee approval code, IACUC-001-20). Mice were subcutaneously injected with HepG2 cells.
2.15. In Vivo Magnetic Resonance Imaging (MRI)
The intravenous injection of Mn/Fe PSACs (100 μL, 10 mg/kg) in tumor-bearing mice was used to perform in vivo MRI. The MRI photos were obtained through Bruker Icon 3.0 T scanning mice after 24 h.
2.16. In Vivo Ultrasound (US) Imaging
The Esaote MyLab Twice device was employed to perform in vivo US imaging. The SAFe-NMCNs nanozyme (100 μL, 10 mg/kg) was intravenously injected in tumor-bearing mice and then captured the image of tumors after 24 h.
2.17. In Vivo Antitumor Effects
Tumor-bearing mice were randomly divided into 2 groups with 5 mice per group. Subsequently, mice in every group were intravenously administrated the following treatments (10 mg/kg): (I) PBS, and (II) Mn/Fe PSACs. Body weight and tumor size of mice with different administrations were recorded every two days. Tumor volume (V) was calculated as the following formula: V = width2 × length/2. After 14 days, all the mice were sacrificed and tumors and main organs (liver, spleen, kidney, heart, and lung) were collected from every group. Then tumors and major organs were immersed in a 4% paraformaldehyde solution for ready-to-use. Tissues were embedded in paraffin and sectioned into slices, then undertaken to hematoxylin and eosin (H&E) staining, Ki-67 immunohistochemistry staining, and TdT-mediated dUTP-biotin nick end labeling (TUNEL) staining assay.
2.18. Statistical Analysis
All the test data in this work were calculated mean value and standard deviation (mean ± S.D.). The statistical analysis of experimental groups was compared by the Student’s t-test. p < 0.05 (*), p < 0.01 (**), and p < 0.001 (***) were regarded as statistically significant.
3. Result and Discussion
Mn/Fe SACs were synthesized using a “top-down” approach, which achieved stripping metal nanoparticles (NPs) into a single atom [
38,
39]. As usual, Fe and Mn ions could be encapsulated into ZIF-8s to form Mn/Fe ZIF-8s. As shown by transmission electron microscopy (TEM), Mn/Fe ZIF-8s had a uniform rhombohedral dodecahedral geometry with a particle size of 90 nm (
Figure 1A). Then, Mn/Fe ZIF-8s was performed, followed by pyrolysis at 800 °C for 3 h under an N
2 atmosphere. The morphology of Mn/Fe SACs was identified by TEM without large crystalline NPs (
Figure 1B). Furthermore, the high-resolution TEM (HRTEM) images showed that a single Mn/Fe SAC structure had obvious graphite stripes (
Figure S1) and rich pores (
Figure 1C). The aberration-corrected high-angle annular dark-field scanning transmission electron microscopy (AC HAADF-STEM) image with atomic resolution predicted the successful anchoring of isolated Mn/Fe atoms in red circles on the carbon matrix (
Figure 1D). Uniform distributions of Mn, Fe, and N atoms were verified by energy-dispersive X-ray spectroscopy (EDS) enabled elemental mapping (
Figure 1E). Meanwhile, the typical TEM-EDX point-detection of the composition also confirmed the simultaneous existence of Fe and Mn elements (
Figure S2). The characteristic diffuse halo in the selected area electron diffraction spectrum (SAED) further demonstrated the fully amorphous nature, with no visualized crystalline Fe and Mn NPs (Figure 1F).
XRD pattern characterized two broad peaks at (002) and (101) for graphitic carbon in Mn/Fe SACs, in the range of 20−30° and 40−50°, respectively (
Figure 1G). Raman spectrum of Mn/Fe SACs exhibited two typical peaks of D and G bands in graphitized carbon around 1390 cm
−1 and 1530 cm
−1, respectively (
Figure 1H). The mesoporous structure of Mn/Fe SACs was predicted by the typical type-IV curves in the N
2 adsorption−desorption isotherms (
Figure 1I). The surface areas of Mn/Fe SACs were calculated to be 227.8 m
2/g with uniform pore sizes of 3.6 nm by Brunauer−Emmett−Teller (BET) (inset of
Figure 1I). The high BET value of Mn/Fe SACs was attributed to the introduction of Fe and Mn species, which increased the microporosity. The binding states of contained elements (Mn, Fe, and N) in Mn/Fe SACs were detected through XPS (
Figure S3A). As shown in
Figure S3B, the high-resolution Fe 2p spectrum had two peaks at 710.6 and 723.9 eV, which were from the Fe 2p
3/2 and Fe 2p
1/2 orbits, illustrating the active sites of Fe in Mn/Fe SACs. Meanwhile, the two peaks in the high-resolution Mn 2p spectrum at 710.4 and 724.1 eV, which were from the Mn 2p
3/2 and Mn 2p
1/2 orbits, illustrate the Mn active sites in Mn/Fe SACs (
Figure S4A). As shown in the schematic diagram in
Figure S4B, the high-resolution N 1s spectrum of Mn/Fe SACs could be deconvoluted into four peaks at approximately 398.2, 399.4, 400.3, and 403.9 eV, corresponding to pyridinic–N, Fe–N
x, Mn–N
x, graphitic-N, and oxidized–N. The Mn and Fe concentration in Mn/Fe SACs was quantified to be 0.28 wt % and 0.72 wt % via ICP-MS (
Table S1).
To endow Mn/Fe SACs with better biocompatibility, SH-PEG was modified on the surface of Mn/Fe PSACs by electrostatic adsorption. SH-PEG was labeled with the red fluorescent agent cyanine 5.5 (Cy5.5) to predict the successful modification on the surface of Mn/Fe SACs by a confocal laser scanning microscope (CLSM). Unlike the general darkness of Mn/Fe SACs, Cy5.5-PEG@Mn/Fe SACs exhibited distinct red fluorescence (
Figure 1J). The obtained PEGylated Mn/Fe SACs (Mn/Fe PSACs) could be well dispersed in various physiological conditions (
Figure S5). The measured values of average hydrodynamic size and polymer dispersity index (PDI) showed no changes, and the stability characteristics were further verified by ICP-MS to detect leakage of Fe and Mn leaching during incubation (
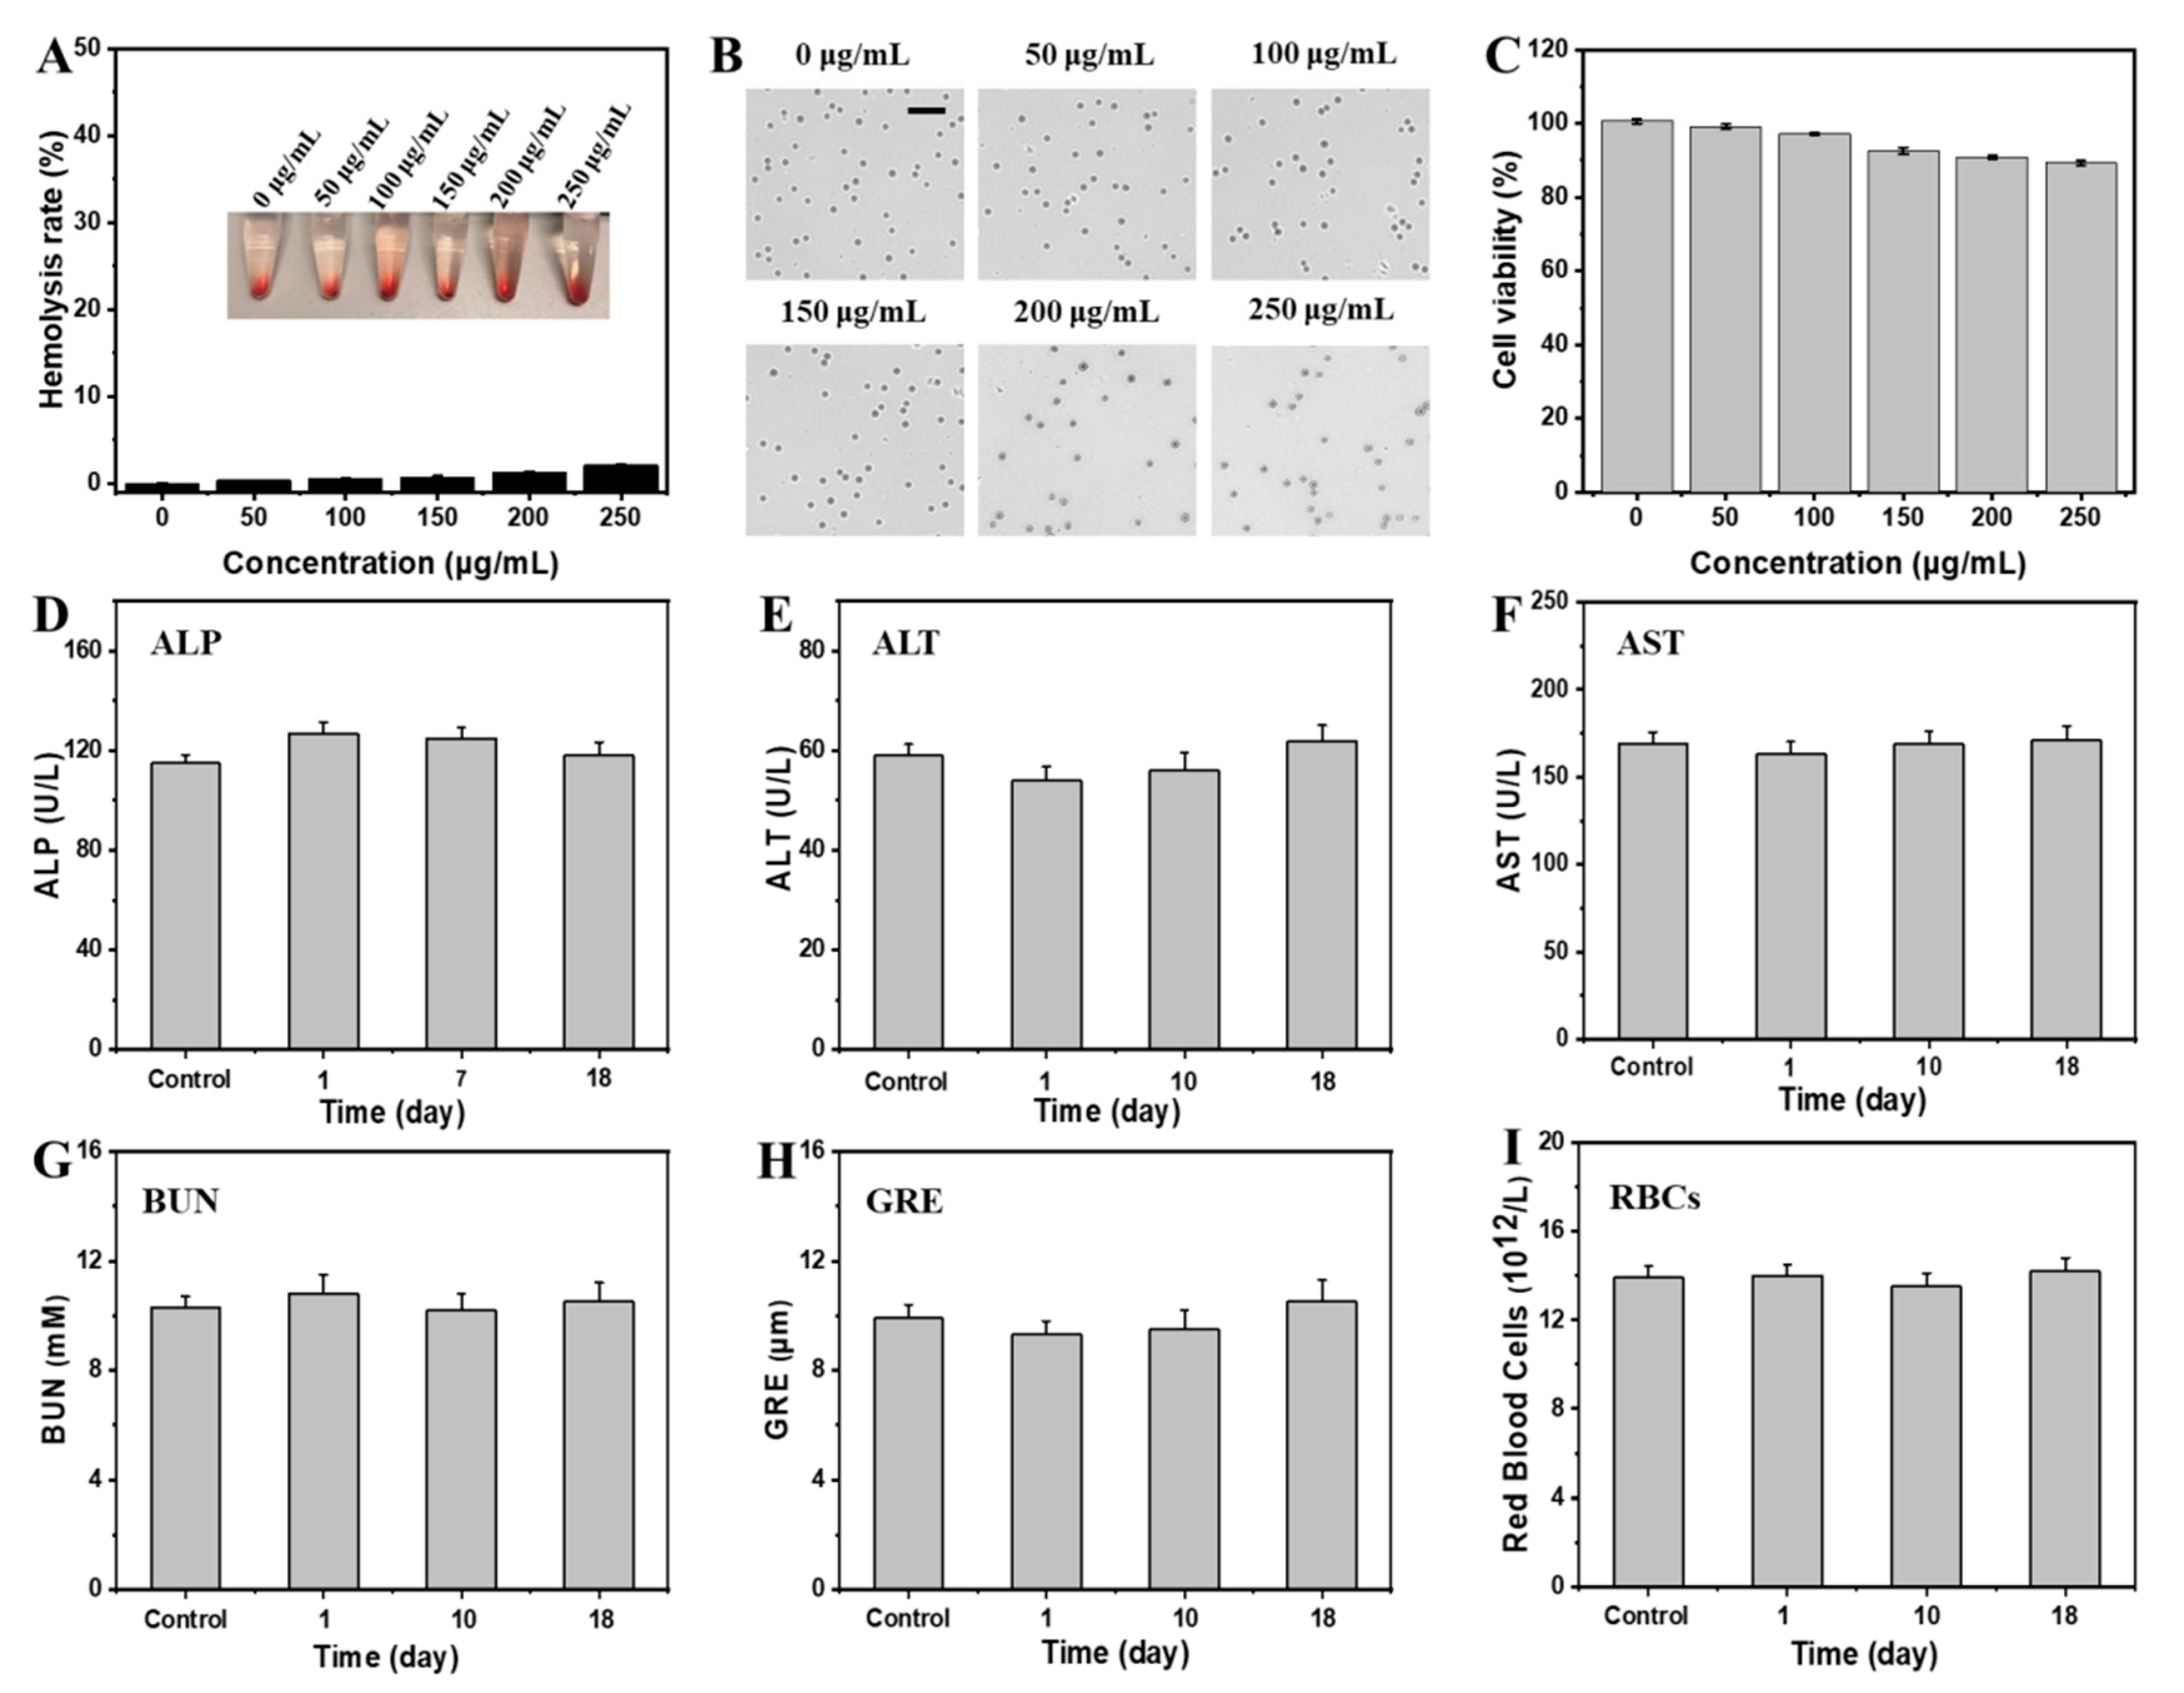
Figure S6). As a qualified candidate for biomedical applications, the biocompatibility of NPs needs to be assessed beforehand. Herein, the hemolysis rate was analyzed to assess the blood compatibility of Mn/Fe PSACs with rat red blood cells (RBCs). The highest hemolysis rate after Mn/Fe PSACs (250 μg/mL) incubation was less than 5% (
Figure 2A), which excluded the hemolytic probability of Mn/Fe PSACs as intravenously administrating agents. Representative microscopy images also confirmed that the morphology of RBCs did not change between different groups (
Figure 2B).
Based on the above data, we concluded that Mn/Fe PSACs are suitable for drug delivery systems and other in vivo treatments. HepG2 cell viability was tested by the CCK-8 method to determine the toxicity of Mn/Fe PSACs, which showed no toxicity with relatively high levels of cell viability in various treatments (
Figure 2C). In addition, in vivo hematological analysis was performed to assess the long-term toxicology of Mn/Fe PSACs by collecting blood samples at predicted time points (days 10th and 18th) after intravenous injection into nude mice (
Figure 2D–I). Blood samples on the day 1st were collected before injection. The general blood routine parameters of the Mn/Fe PSACs-injected mouse samples were not significantly different, indicating that the hepatotoxic effect of Mn/Fe PSAC injection was negligible.
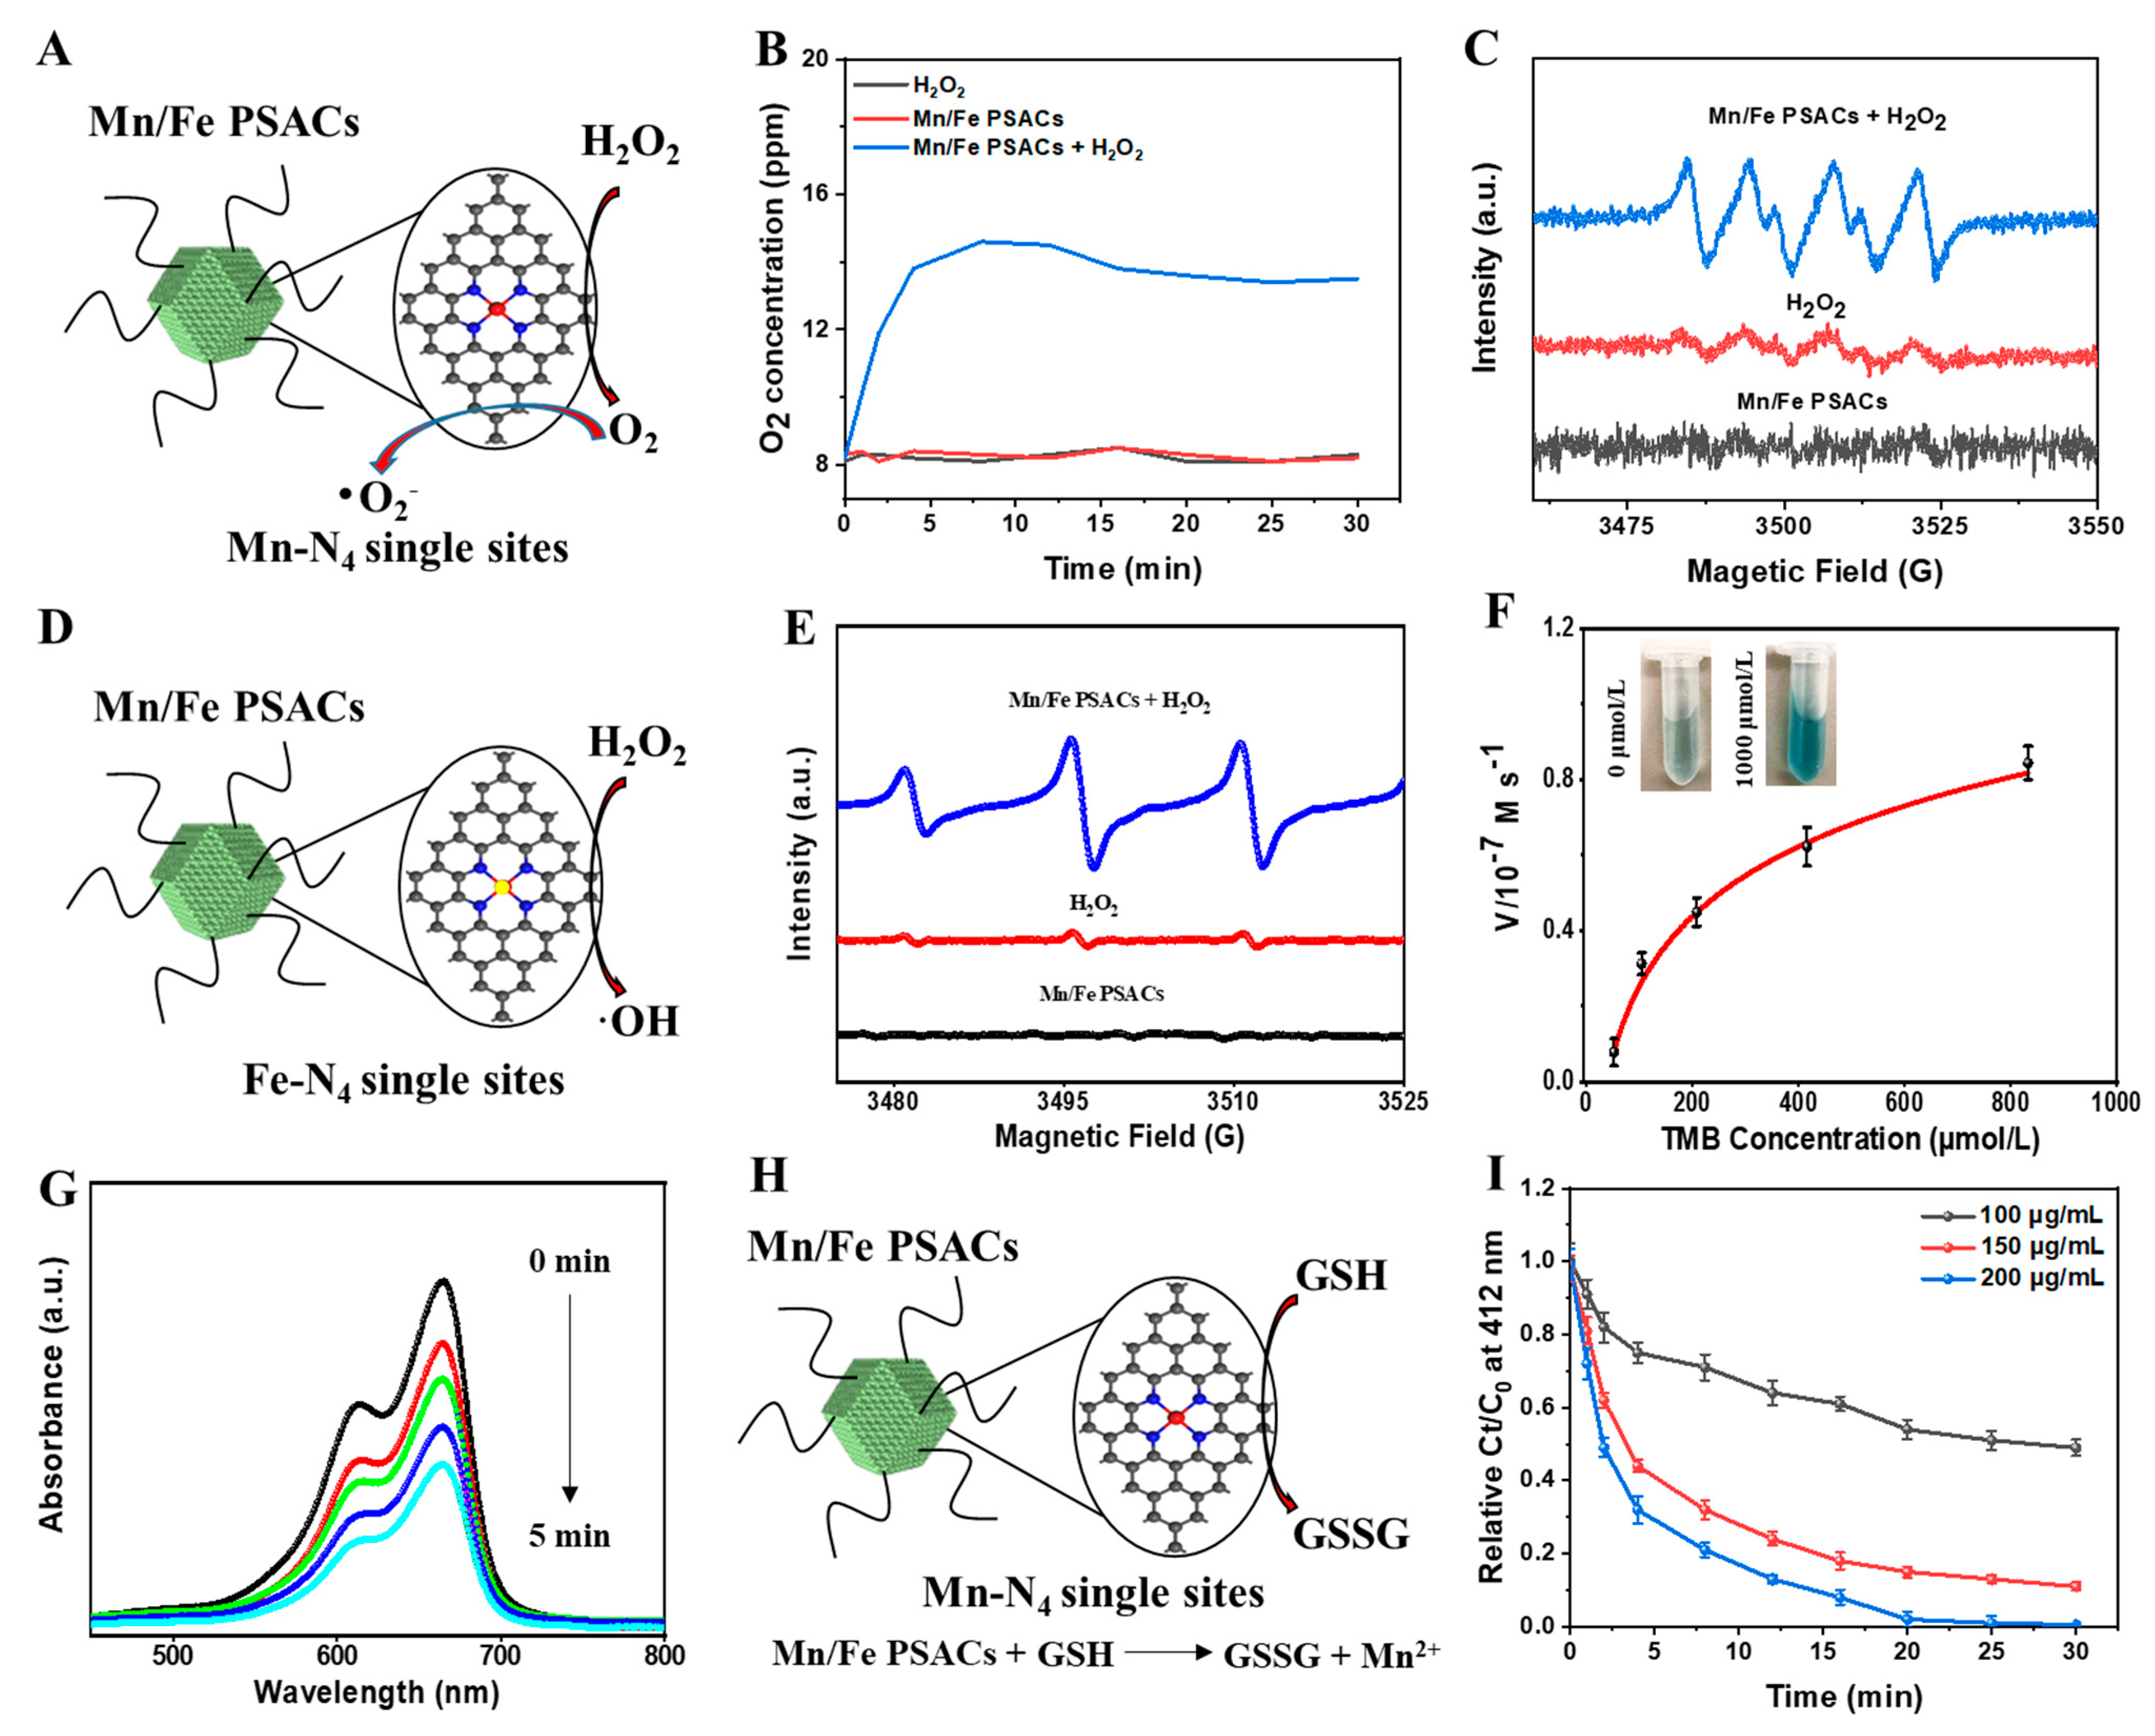
Catalase (CAT) is an enzyme that can catalyze the decomposition of H
2O
2 to generate O
2 (
Figure 3A) [
40,
41]. In
Figure 3B, with the increasing O
2 concentration in solution, Mn/Fe PSACs were demonstrated to have similar CAT activity to native catalase in converting H
2O
2 into O
2. Based on the oxidase (OXD)-like activity, Mn/Fe PSACs could facilitate electron transfer to substrate O
2 and generate superoxide radicals (•O
2−). ESR spectroscopy was used to confirm the ROS species by using a •O
2− trapping agent 5-tert-butoxycarbonyl-5-methyl-1-pyrroline N-oxide (BMPO). The characteristic peaks 1:1:1:1 of BMPO-OOH verified that the generation of •O
2− was catalyzed by the common CAT- and OXD-like enzymatic activities of Mn/Fe PSACs (
Figure 3C).
As exhibited in
Figure 3D, the POD activity of Mn/Fe PSACs was demonstrated by detecting the toxic •OH produced by the decomposition of H
2O
2 through a Fenton-like reaction. The generation of •OH was characterized by a characteristic quadruple signal (1:2:2:1) of DMPO-OH using a spin trapper 5,5-Dimethyl-1-pyrroline N-oxide (DMPO) (
Figure 3E). This result directly demonstrated the POD-like activity of Mn/Fe PSACs from the enzymatic assays described above. The generation of •OH catalyzed by Mn/Fe PSACs was measured by TMB assay. The appearance of blue TMB oxide during the incubation of Mn/Fe PSACs with H
2O
2 increases with increasing TMB concentration (
Figure 3F). The K
M value of the nanozyme was 0.079 mM for the TMB. The corresponding V
max value is 6.17 × 10
−8 M s
−1. In addition, the POD-like activity of Mn/Fe PSACs was enhanced in a mildly acidic pH environment, which demonstrated that Mn/Fe PSACs could initiate more pronounced POD activity in TME (
Figure S7). Moreover, the POD-like catalytic properties of Mn/Fe PSACs were further tested with methylene blue (MB) probes (
Figure 3G) and o-phenylenediamine (OPDA) (
Figure S8). Similar phenomena were found using MB probes, fully demonstrating the excellent POD-like catalysis of Mn/Fe PSACs.
As previously mentioned, POD-like nanozymes generated ROS could be depleted by GSH presented in excess in the TME [
3,
18,
20]. Mn-based catalysts have excellent GSH depletion ability due to their multivalent nature, which can effectively rescue the loss of ROS products [
42,
43]. Therefore, we proposed the mechanism of GSH depletion by Mn/Fe PSACs in
Figure 3H. The GSH-depleting capability of Mn/Fe PSACs was evaluated using the 5, 5′-dithio-bis (2-nitrobenzoic acid) (DTNB) probe. It could be found that the characteristic peak of DTNB at 412 nm was significantly reduced under the condition of Mn/Fe PSACs (
Figure 3I). As the concentration of Mn/Fe PSACs increased, the depletion of GSH became faster in a concentration-dependent manner. The result showed that Mn/Fe PSACs acted as a GSH peroxidase (GSH-Px)-like mimetic enzymes with satisfactory GSH-consuming ability.
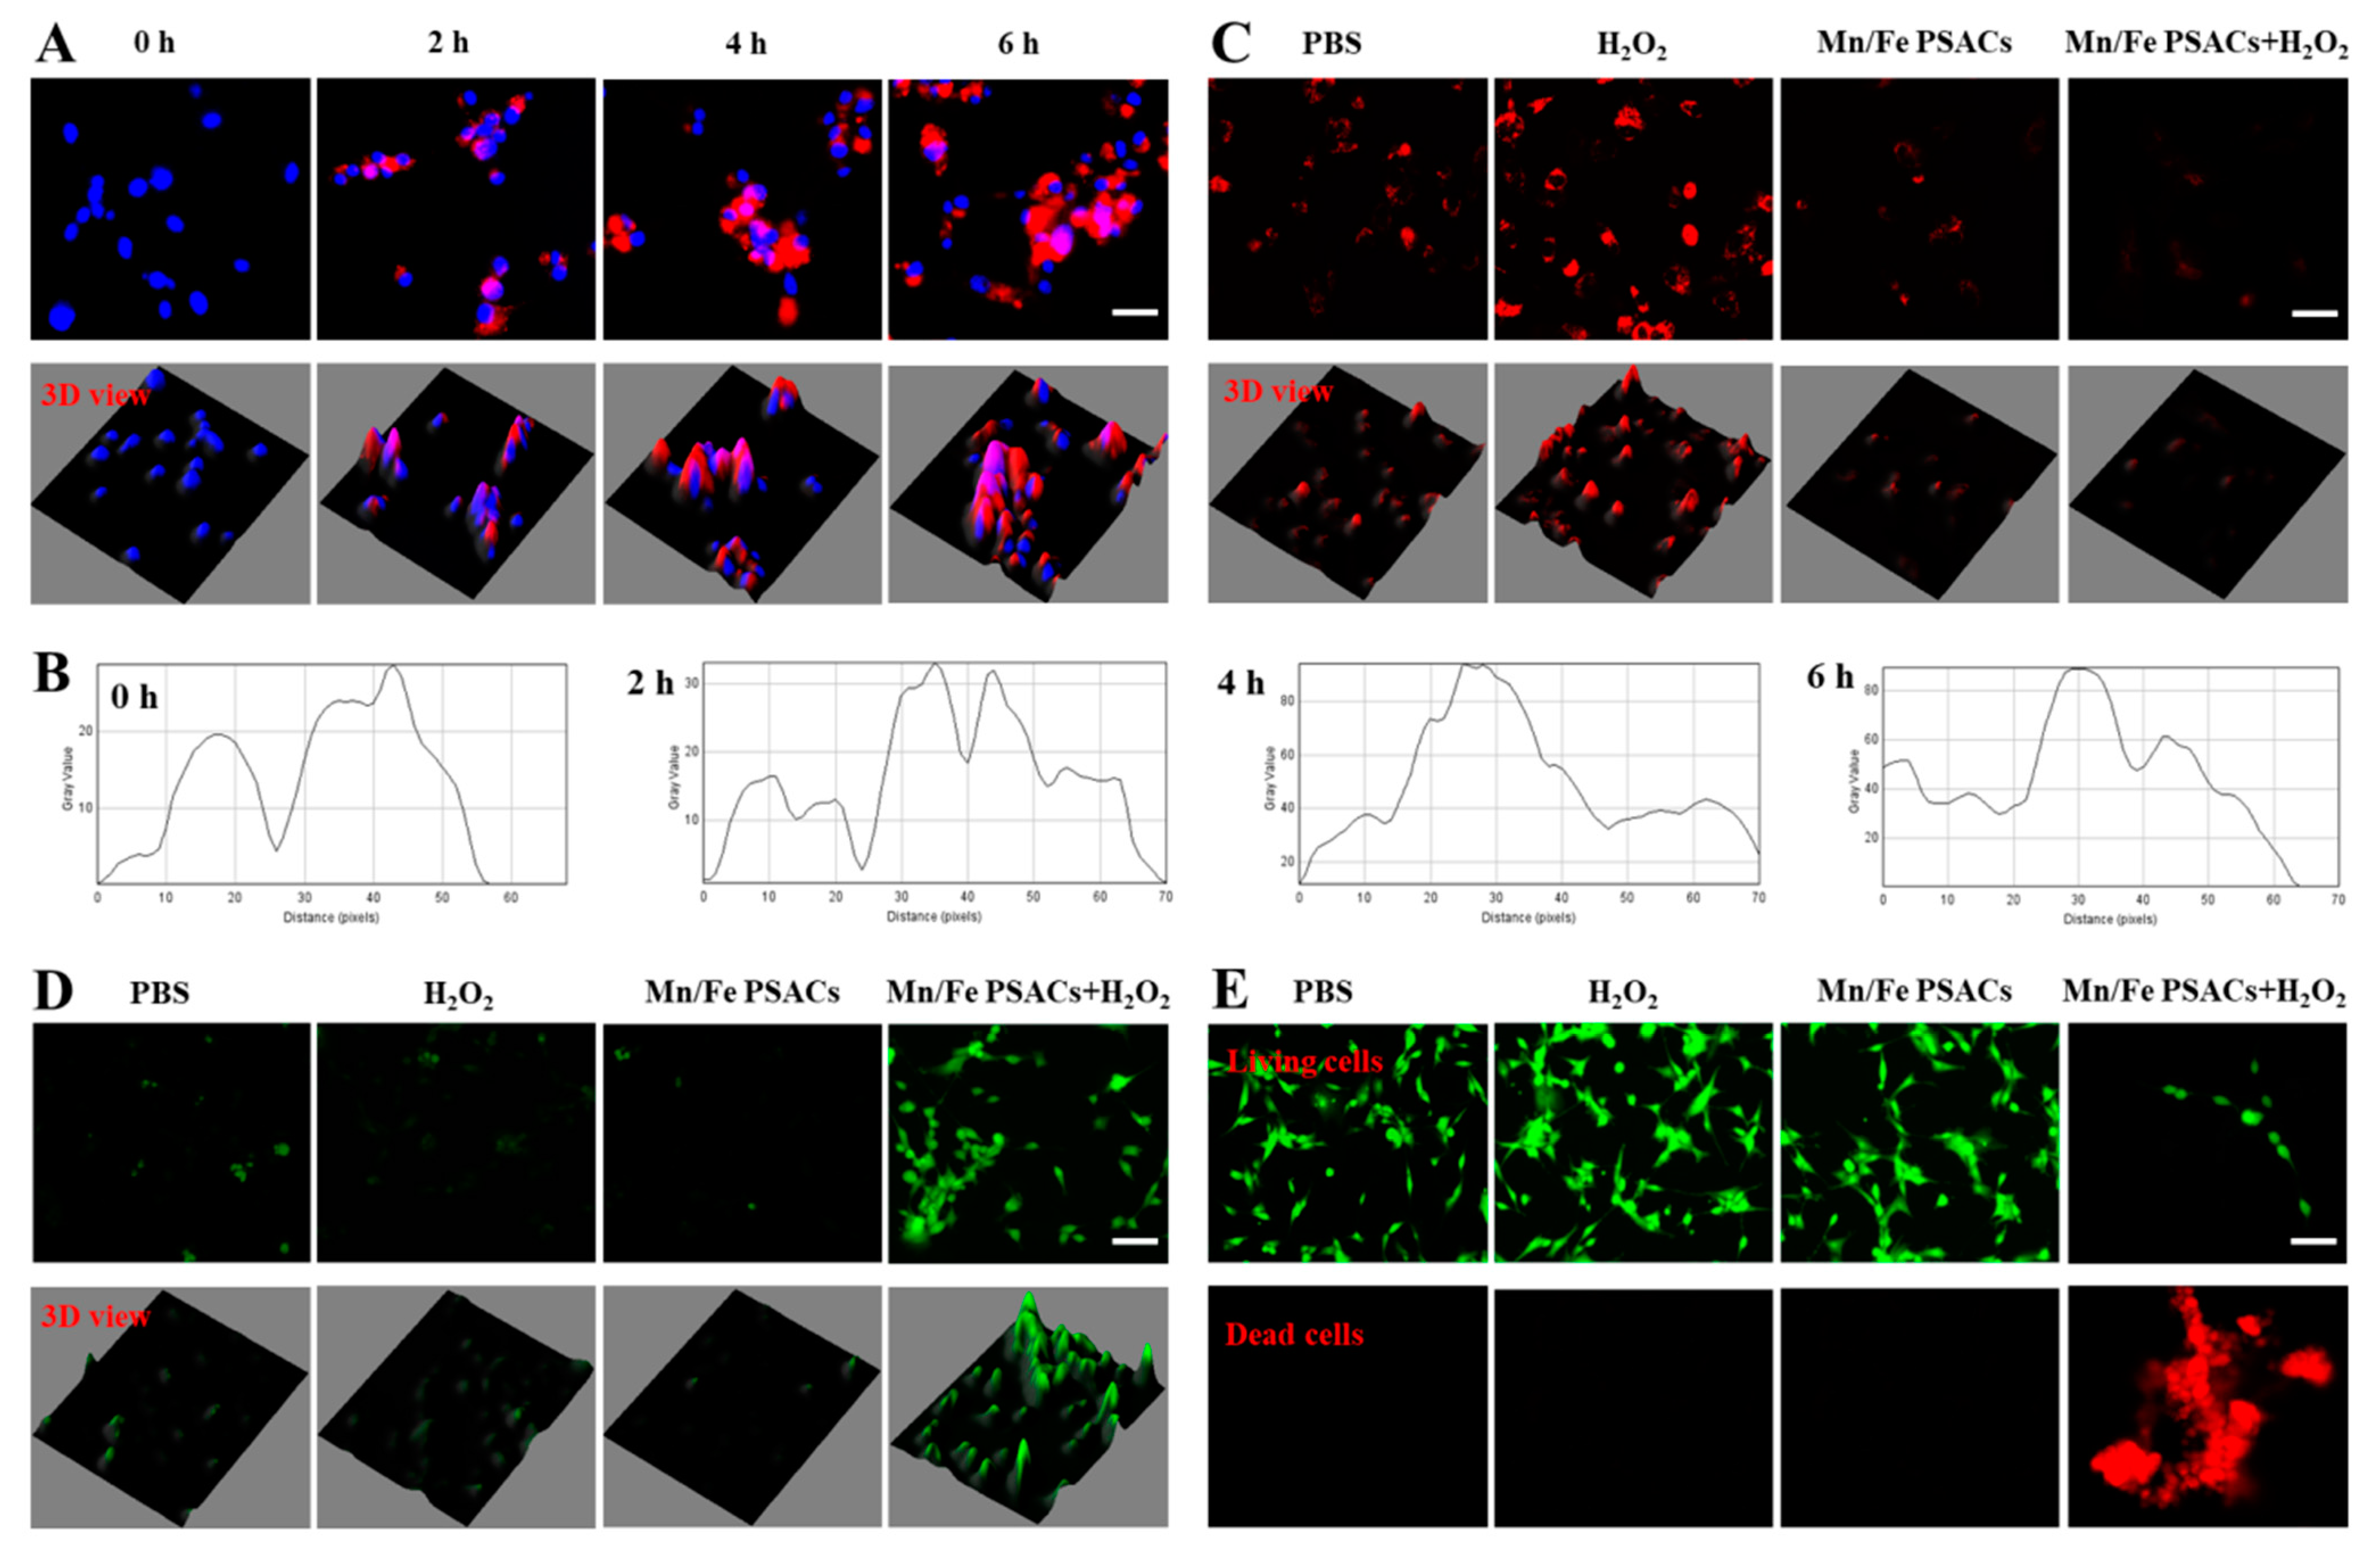
Next, the cellular uptake behavior of Mn/Fe PSACs was monitored after labeling NPs with Cy5.5. CLSM showed that Mn/Fe PSACs could be internalized after 2 h of incubation and increased within 6 h (
Figure 4A). The intracellular fluorescence intensities in different time points were quantified by Image J. As shown in
Figure 4B, the intracellular fluorescence intensity of Cy5.5-Mn/Fe PSACs was proportional to the incubation time within 6 h. Moreover, the common overlap between the red signal from Cy5.5-Mn/Fe PSACs and the green signal from the lysosomes after 2 h of incubation suggested efficient accumulation of Cy5.5-Mn/Fe PSACs in lysosomes (
Figure S9). The O
2 generation ability in cancer cells was also detected by using [Ru(dpp)
3]Cl
2, an intracellular O
2 level indicator with red fluorescence. The fluorescence in cells treated with Mn/Fe PSACs plus H
2O
2 was much weaker than that of the PBS control, H
2O
2, and Mn/Fe PSACs groups due to the increased intracellular O
2 level based on Mn/Fe PSACs-induced single atom-based catalysis (
Figure 4C). These data collectively confirmed that Mn/Fe PSACs could effectively regulate the in situ H
2O
2 decomposition and O
2 production. Simultaneously, the dual enzyme-mimetic catalytic activity of Mn/Fe PSACs was evaluated in HepG2 cells by measuring the ROS level using a DCFH-DA fluorescent probe. In the presence of ROS, DCFH-DA would be oxidated into 2,7-dichlorofluorescein (DCF) with green fluorescence. As shown in
Figure 4D, cells incubated with Mn/Fe PSACs plus H
2O
2 exhibited the strongest green fluorescence due to the admirable POD-mimetic catalytic performance of Mn/Fe PSACs, which could catalyze the decomposition of H
2O
2 into ROS, while the green signals were negligible in PBS, H
2O
2, and Mn/Fe PSACs groups.
The apoptosis of HepG2 cells treated with different treatments were visualized by co-staining with calcein-AM (living cells, green fluoresce) and PI (dead cells, red fluoresce). As shown in
Figure 4E, a large number of dead cells appeared in Mn/Fe PSACs to quantify cell viability after different treatments. As shown in
Figure 5A, co-cultivation of tumor cells with Mn/Fe PSACs plus H
2O
2 greatly reduced cell viability (97.5%) compared to PBS, H
2O
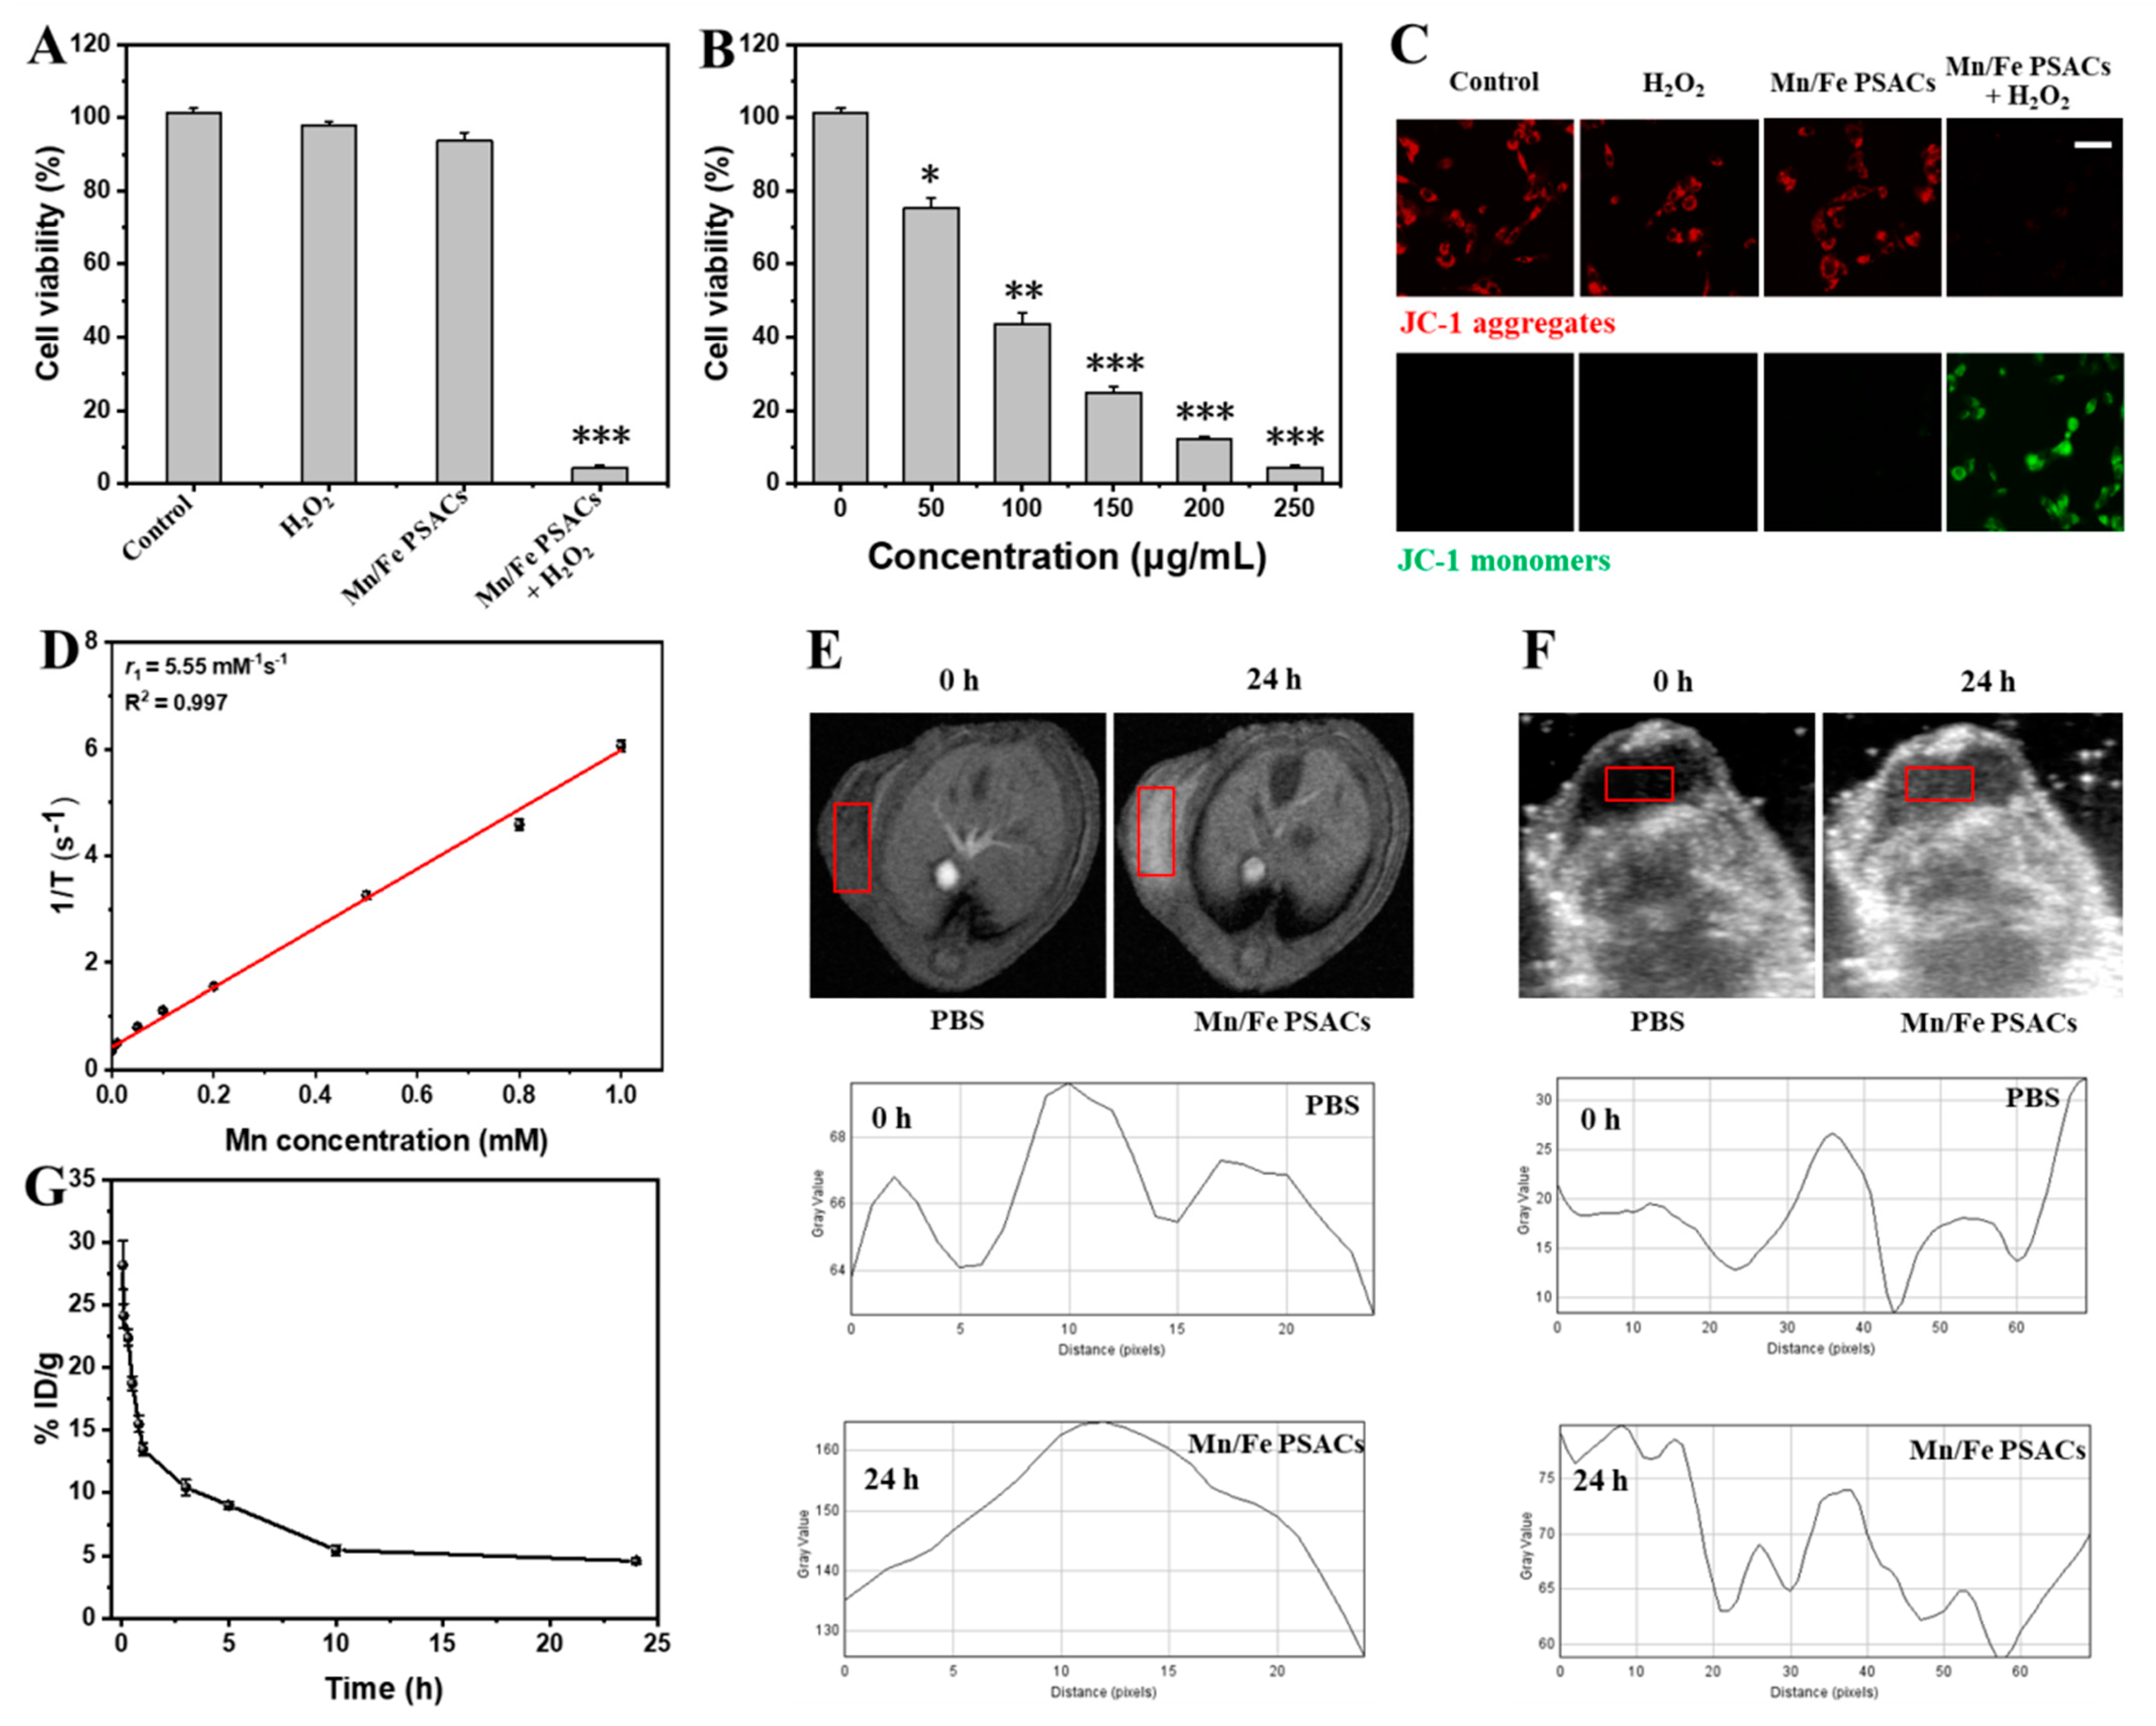
2, and single Mn/Fe PSACs treated groups, which was consistent with living/dead staining experiments. To explore the concentration-dependent manner effect of nanozyme-induced cancer cell death, we investigated cell viability by varying the concentration (0, 50, 100, 150, 200, and 250 µg/mL) of Mn/Fe PSACs. In
Figure 5B, cell viability significantly decreased with increasing Mn/Fe PSACs concentration, revealing that Mn/Fe PSACs could effectively mediate cancer cell death by inducing the CDT effect. 5,5′,6,6′-tetrachloro-1,1′,3,3′-tetraethyl-imidacarbocyanine iodide (JC-1) was widely used as a fluorescent probe to detect changes in mitochondrial membrane potential, and it could exhibit red fluorescence (from JC-1 aggregates) on intact mitochondrial membranes, and green fluorescence (from JC-1 monomers) on damaged mitochondrial. As shown in
Figure 5C, compared with PBS, H
2O
2, and Mn/Fe PSACs groups, HepG2 cells co-cultured with the Mn/Fe PSACs plus H
2O
2 showed stronger green fluorescence from JC-1 monomers and negligible red fluorescence from JC-1 aggregates. This result confirmed that Mn/Fe PSACs could induce cancer cell apoptosis with the existence of H
2O
2 by generating toxic ROS to damage the mitochondrial membrane.
To illustrate the stimuli-responsive MRI properties, the T1-weighted MRI images and longitudinal relaxivity (r1) of the Mn/Fe PSAC solutions with different Mn concentrations were evaluated using 3.0 T clinical MRI equipment. T1-weighted magnetic resonance images of Mn/Fe PSACs showed concentration-dependent signal enhancement (
Figure 5D). The corresponding longitudinal relaxivity (r1) value was quantitatively calculated to be 5.55 mM
−1 s
−1, which was higher than that of clinically Gd-based contrast agents (Magnevist, r1 = 4.56 mM
−1 s
−1). Thereafter, we utilize those samples to perform a T1-weighted MRI in a tumor-bearing mouse model. Before and after (24 h distribution) Mn/Fe PSAC (15 mg/kg) i.v. injection. The MRI signal intensity of Mn/Fe PSACs in the tumor area was significantly enhanced. Quantitative MRI signals within Mn/Fe PSACs-treated tumor sites further corroborate these findings (
Figure 5E). To confirm that the CAT-mimetic catalytic performance of Mn/Fe PSACs could achieve US imaging in vivo, mice were injected with Mn/Fe PSACs intravenously and then monitored by US imaging at different time points. Compared with pre-injection, US imaging contrast of the tumor area tended to be enhanced after Mn/Fe PSACs injection. Quantitative US signals within the tumor sites treated by Mn/Fe PSACs further corroborate these findings (
Figure 5F). The increase in US signals was mainly because Mn/Fe PSACs could decompose intratumoral H
2O
2 and generate O
2 bubbles through CAT-mimicking catalytic activity, thereby achieving impedance mismatch and generating sufficient echogenic reflectivity. These imaging abilities of the Mn/Fe PSACs would be very useful for guiding in vivo therapy. Pharmacokinetics studies showed that Mn/Fe PSACs had a long elimination half-life (
Figure 5G), indicating that Mn/Fe PSACs exhibited a satisfactory blood retention potential over an examination period of 24 h.
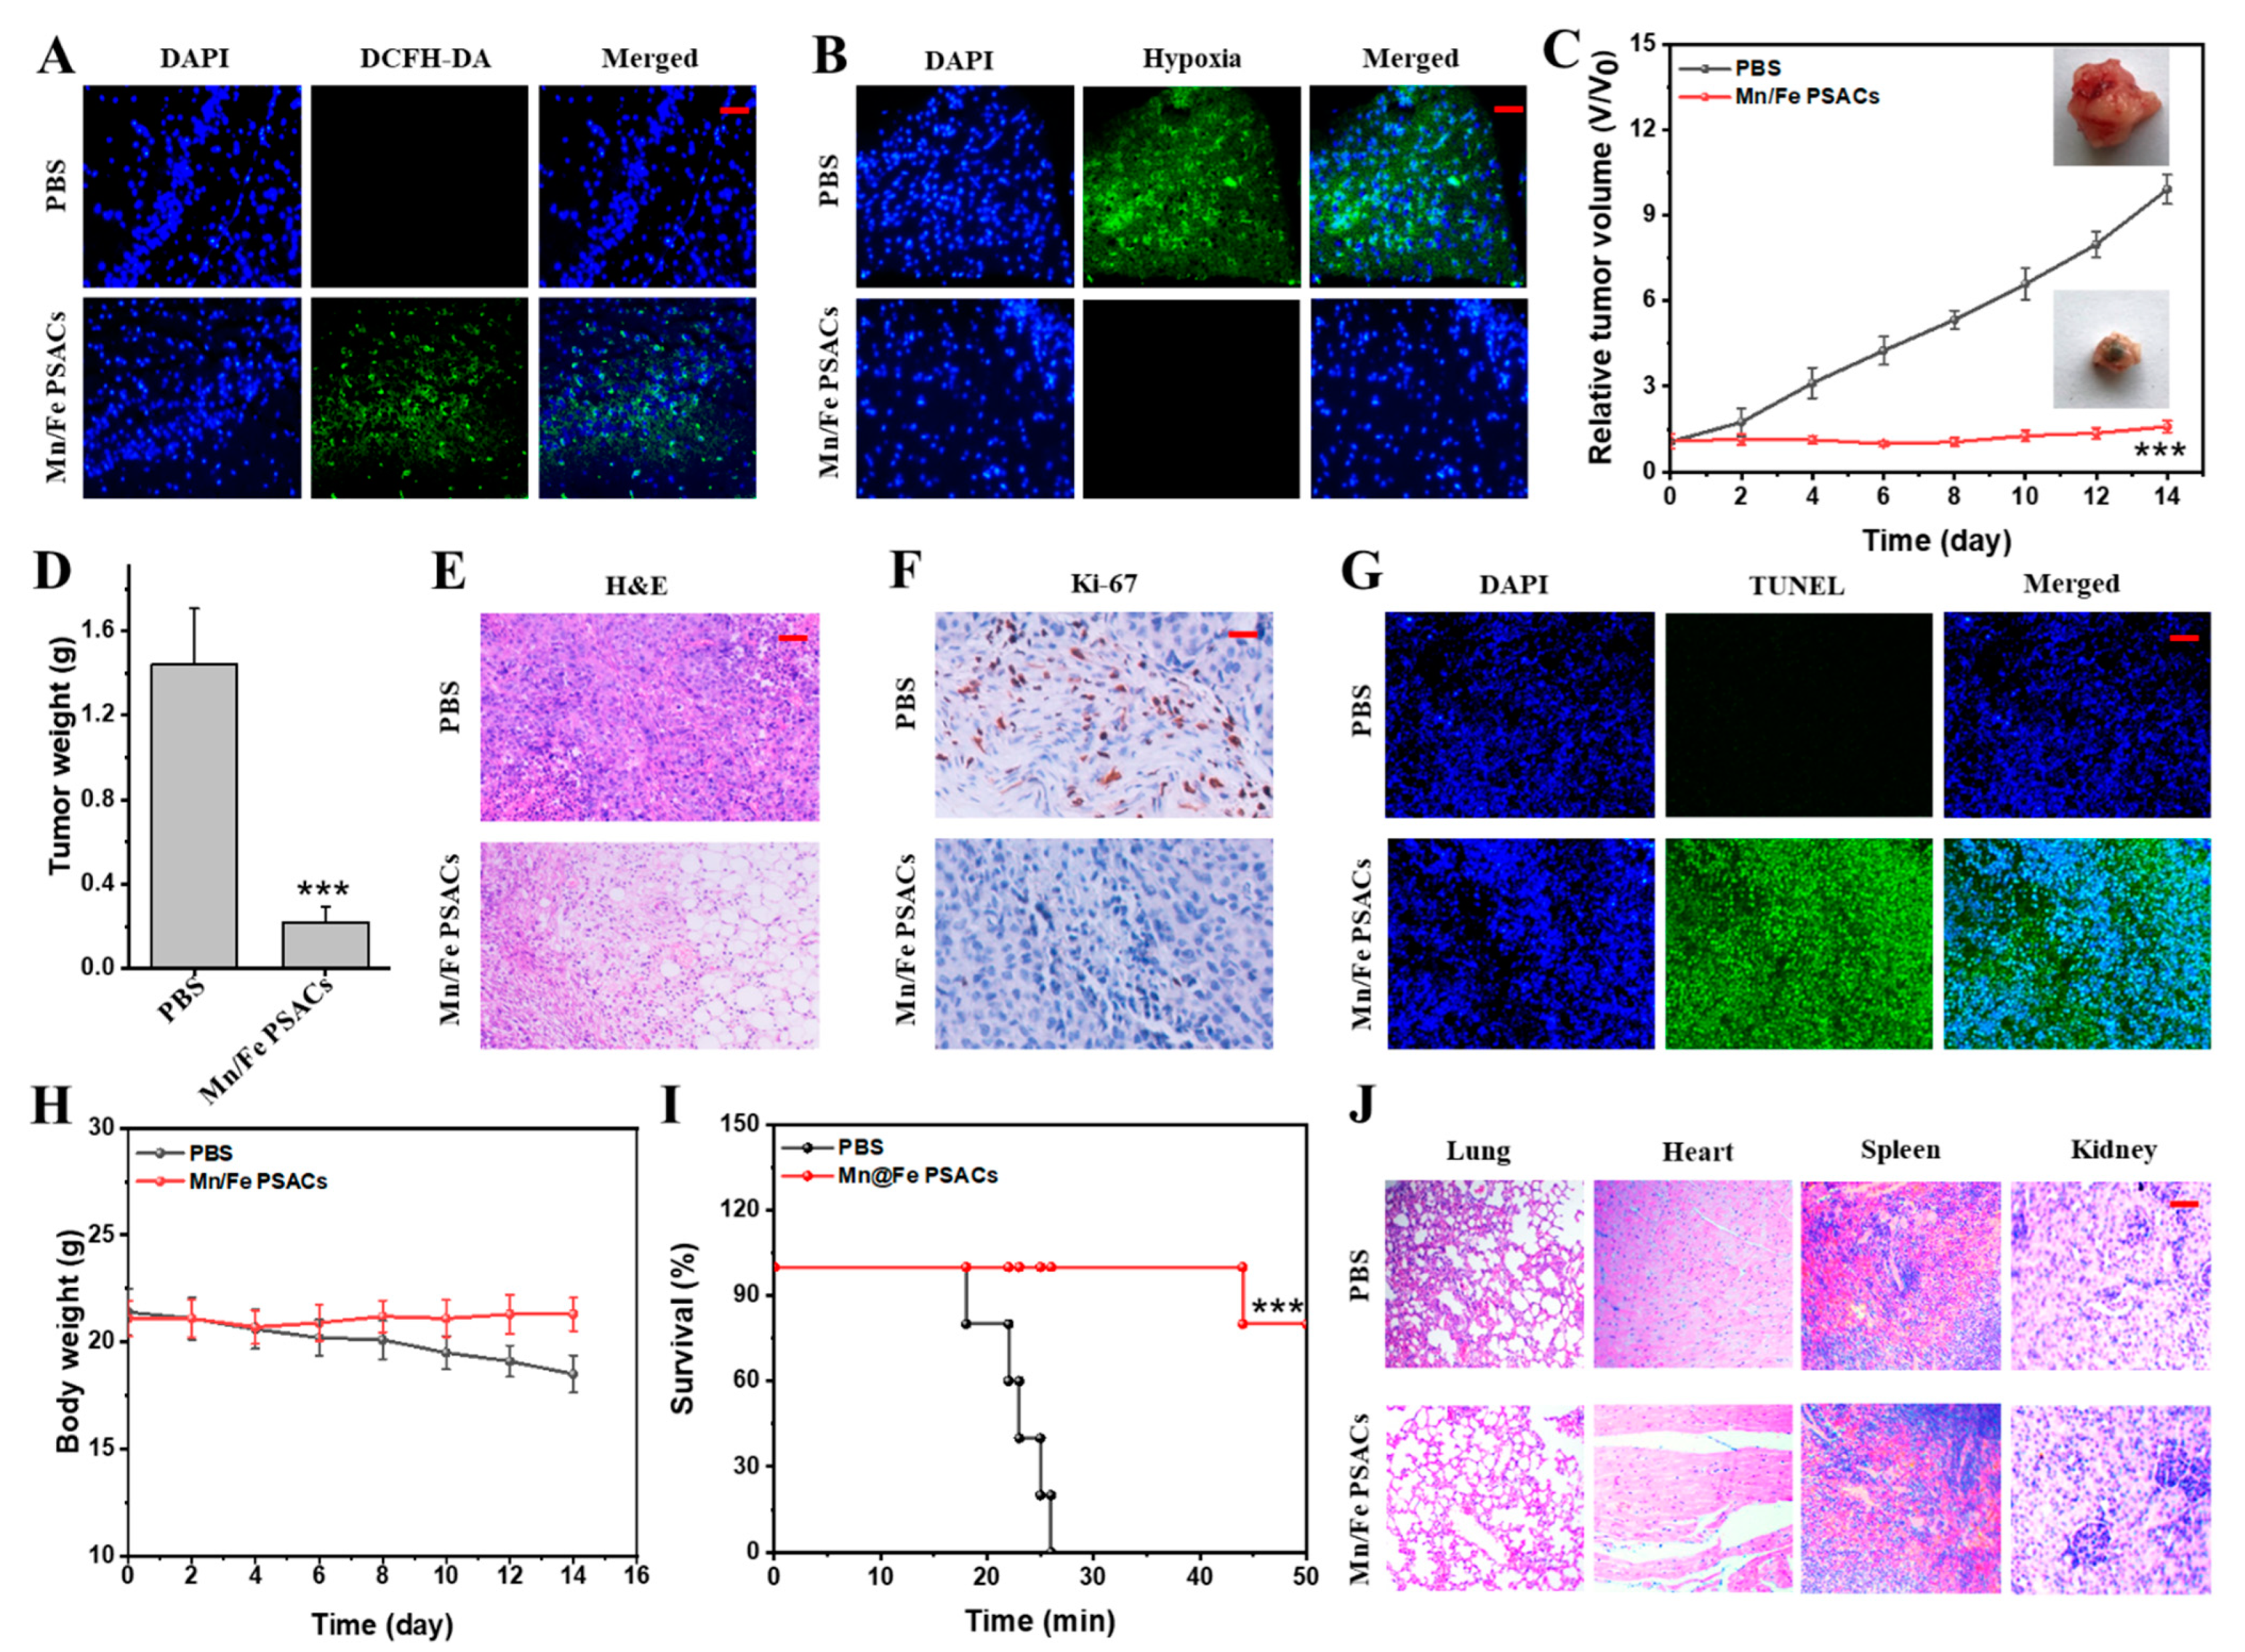
To test the activation of the nanoreactors specific to tumor sites, we first monitored ROS levels in living mice using CLSM. After 24 h post-injection of Mn/Fe PSACs and control groups, the ROS probe (DCFH-DA) was intravenously injected, and the green fluorescence intensity in the tumor was monitored using dorsal window chamber models due to the ROS-responsive green fluorescence conduction characteristics of the probe. As shown in
Figure 6A, strong green fluorescence in the Mn/Fe PSACs group indicated a sharp increase in ROS levels in tumor tissues. Moreover, immunofluorescence staining was performed to confirm the capability of Mn/Fe PSACs for in situ amelioration of hypoxia status within the tumor. To this end, pimonidazole hydrochloride was first employed as a hypoxia probe to detect the hypoxia state of tumor tissues. Tumor hypoxia and blood vessels were then stained with an anti-pimonidazole antibody (green signals). The results showed that mice treated with Mn/Fe PSACs could significantly reduce hypoxia signals in tumor tissues, while the control group exhibited bright green hypoxia signals (
Figure 6B). It could be concluded that the tumor hypoxia was alleviated due to the catalysis of H
2O
2 into O
2 in the presence of Mn/Fe PSACs.
Subsequently, we explored the antitumor effects of the combined enzymatic properties of Mn/Fe PSACs. The treatment procedure was as follows: Mn/Fe PSACs were injected into tumor-bearing BALB/c nude mice at the dose of 15 mg/kg. Interestingly, Mn/Fe PSACs significantly inhibited tumor growth during the treatment period for 14 days (
Figure 6C). At the end of treatment, mice from all groups were euthanized and tumor tissues were harvested. The results showed that the average weight of anatomically obtained tumors in the Mn/Fe PSACs group was only 0.21 g (
Figure 6D). H&E staining analysis of tumor tissues revealed severe necrosis in Mn/Fe PSACs treated mice, where nuclear condensation and cell shrinkage occurred (
Figure 6E). Furthermore, Ki-67 and TUNEL staining were performed on tumor sections to study the proliferation and apoptosis levels of tumor cells, respectively. Mn/Fe PSACs treatment group had the least brown area in the tumor section, indicating that it had a good inhibitory effect on tumor cell proliferation (
Figure 6F). Similarly, the results of the TUNEL analysis also showed that there were more apoptotic cells in the Mn/Fe PSACs-treated group compared with the control group (
Figure 6G). Systemic toxicity of Mn/Fe PSACs was evaluated by monitoring changes in body weight and survival rate during treatment. There was no significant change in body weight between different treatment groups, indicating that Mn/Fe PSACs treatment did not affect the growth of mice (
Figure 6H). All mice in the control group died within 27 days. In contrast, mice in the Mn/Fe PSACs group survived for more than 44 days (
Figure 6I), manifesting significantly elevated survival rates. Moreover, an H&E staining assay was performed on major organs (heart, lung, spleen, and kidney) after drug administration. No visible damage was observed in the main organs, indicating the good biocompatibility of Mn/Fe PSACs (
Figure 6J). These results confirmed that the Mn/Fe PSACs could exert a superior inhibitory effect on tumor cells through CDT with minimal side effects.

 and
and 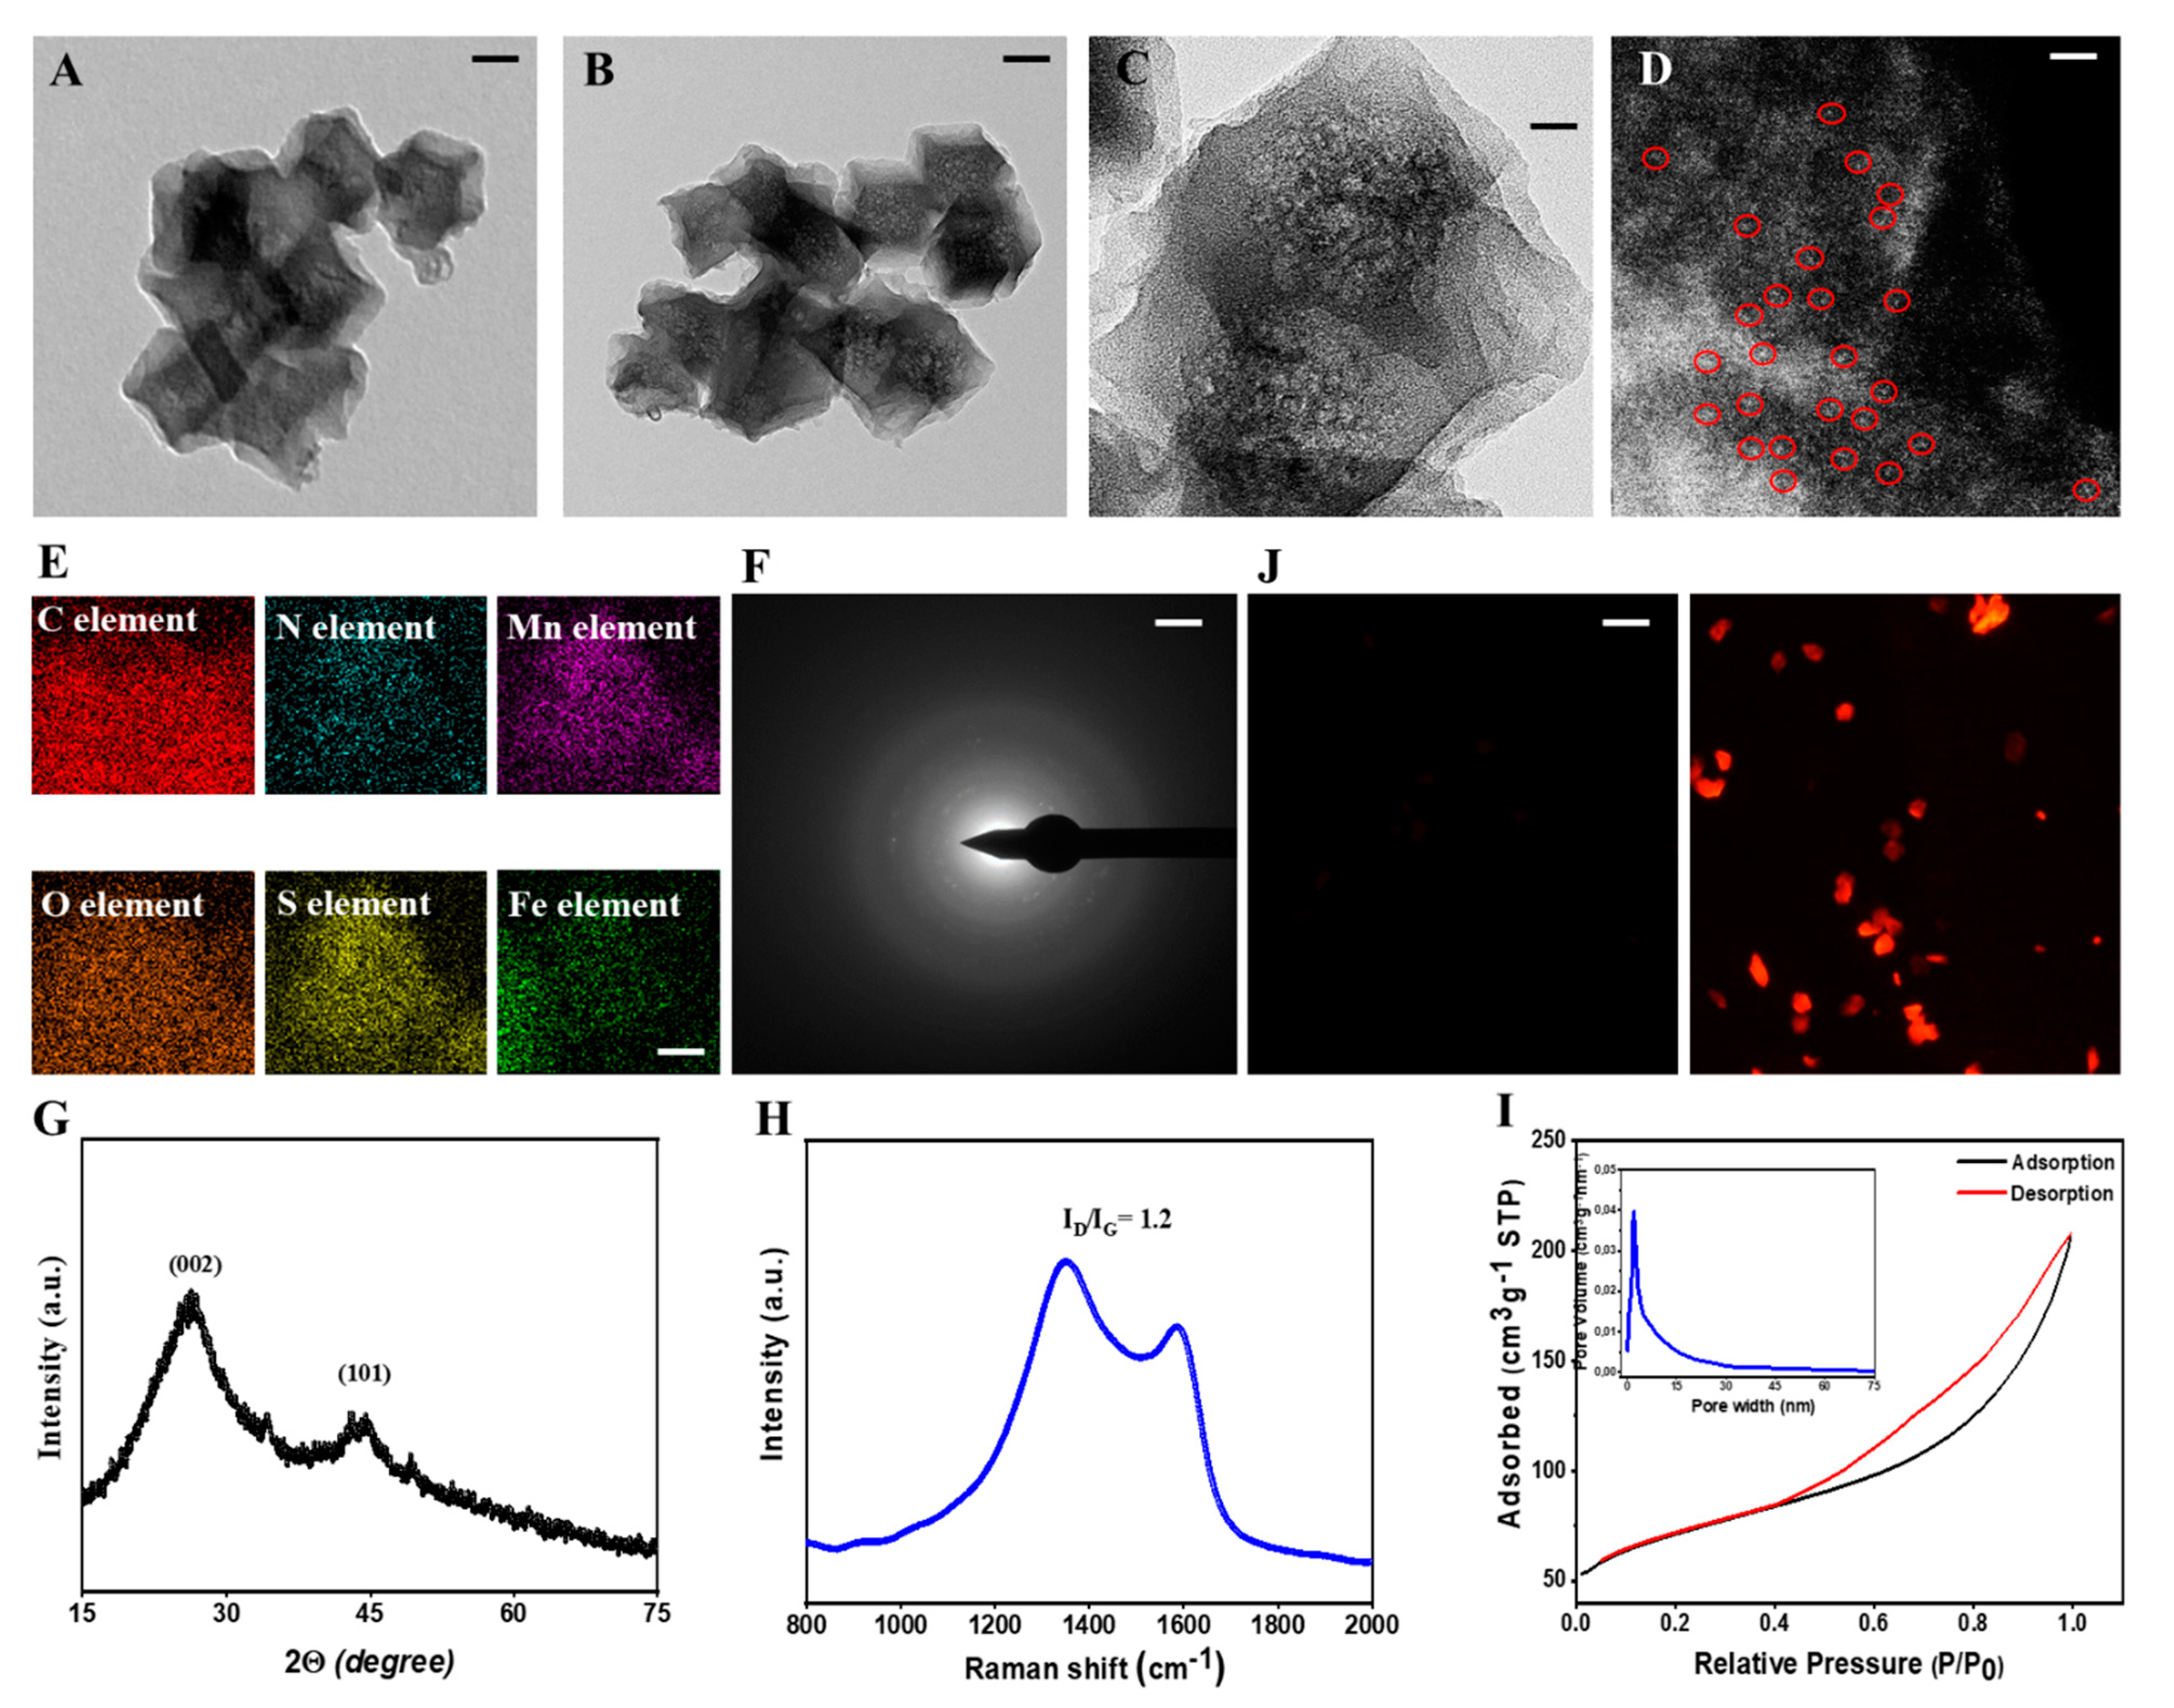


