
Folic Acid-Modified Ibrutinib-Loaded Silk Fibroin Nanoparticles for Cancer Cell Therapy with Over-Expressed Folate Receptor
 , , , and
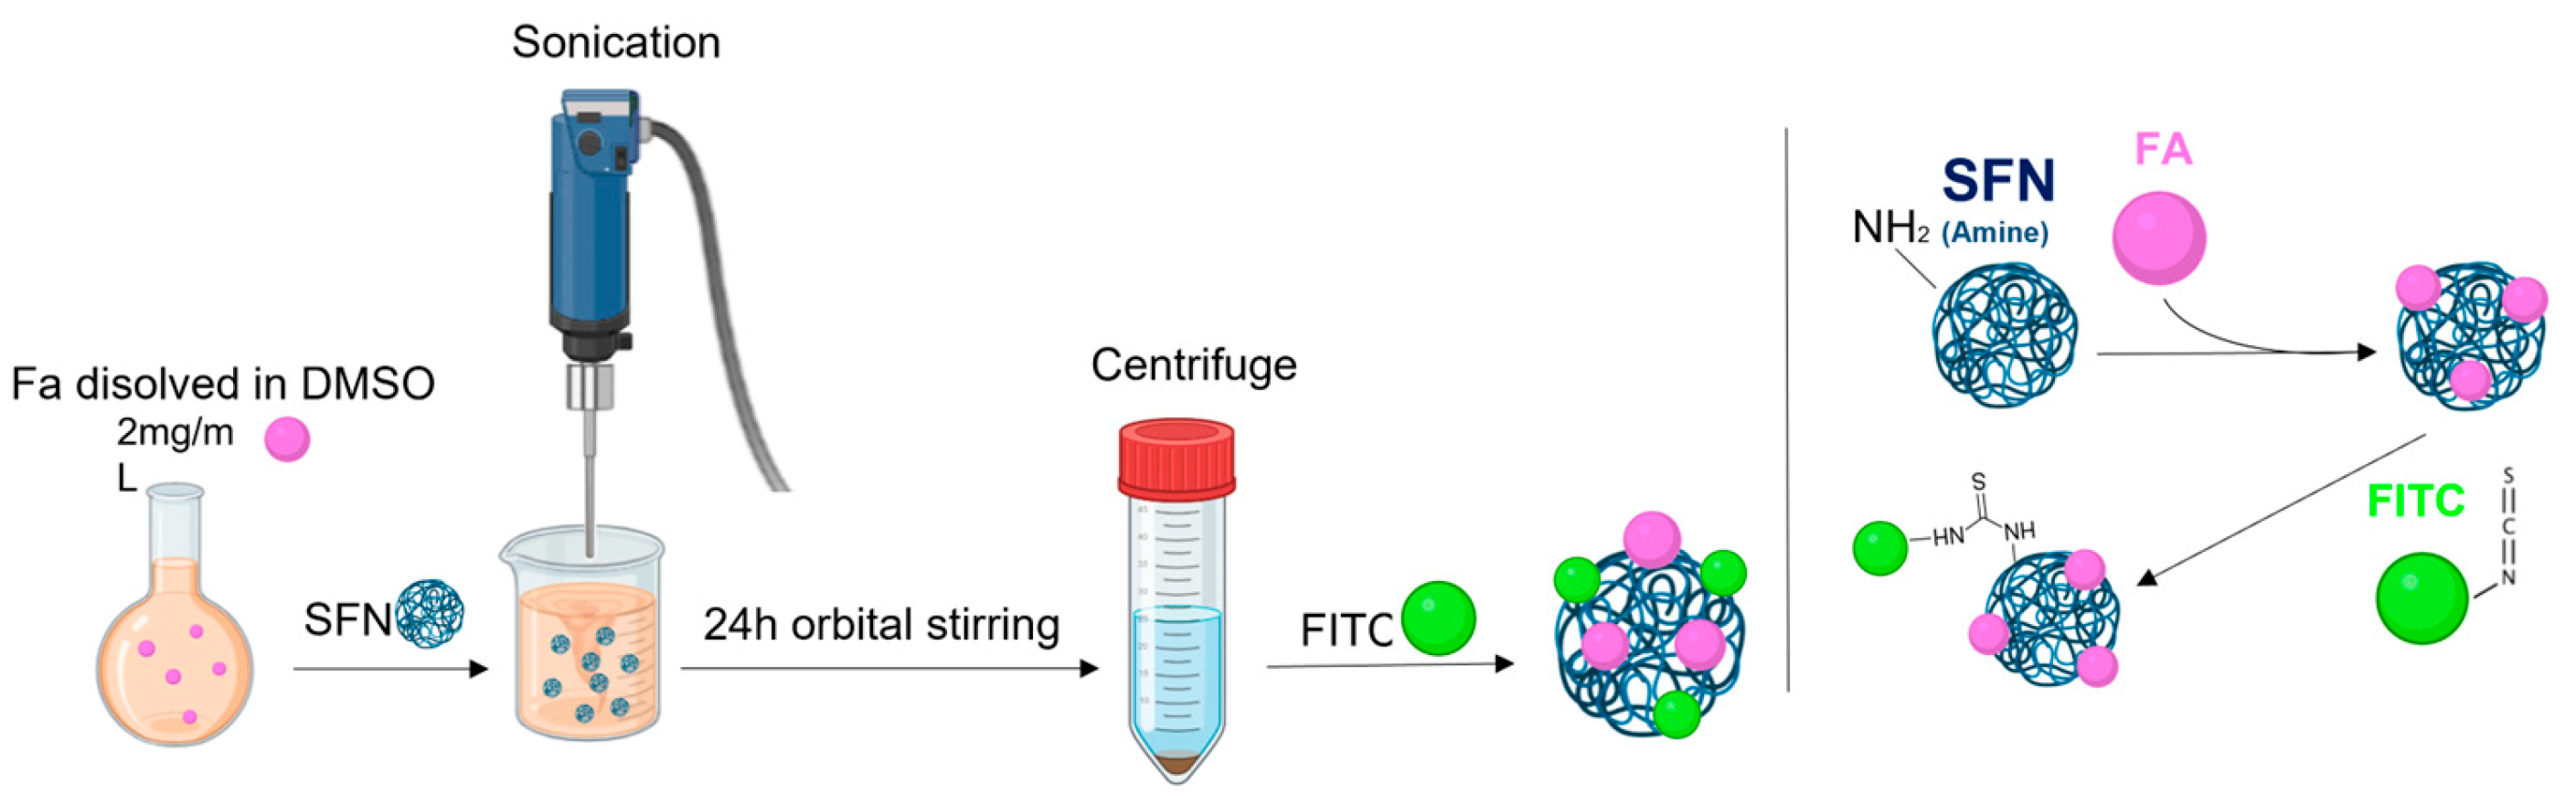
Abstract
:1. Introduction
2. Materials and Methods
2.1. Materials
2.2. Preparation of Silk Fibroin Nanoparticles (SFNs)
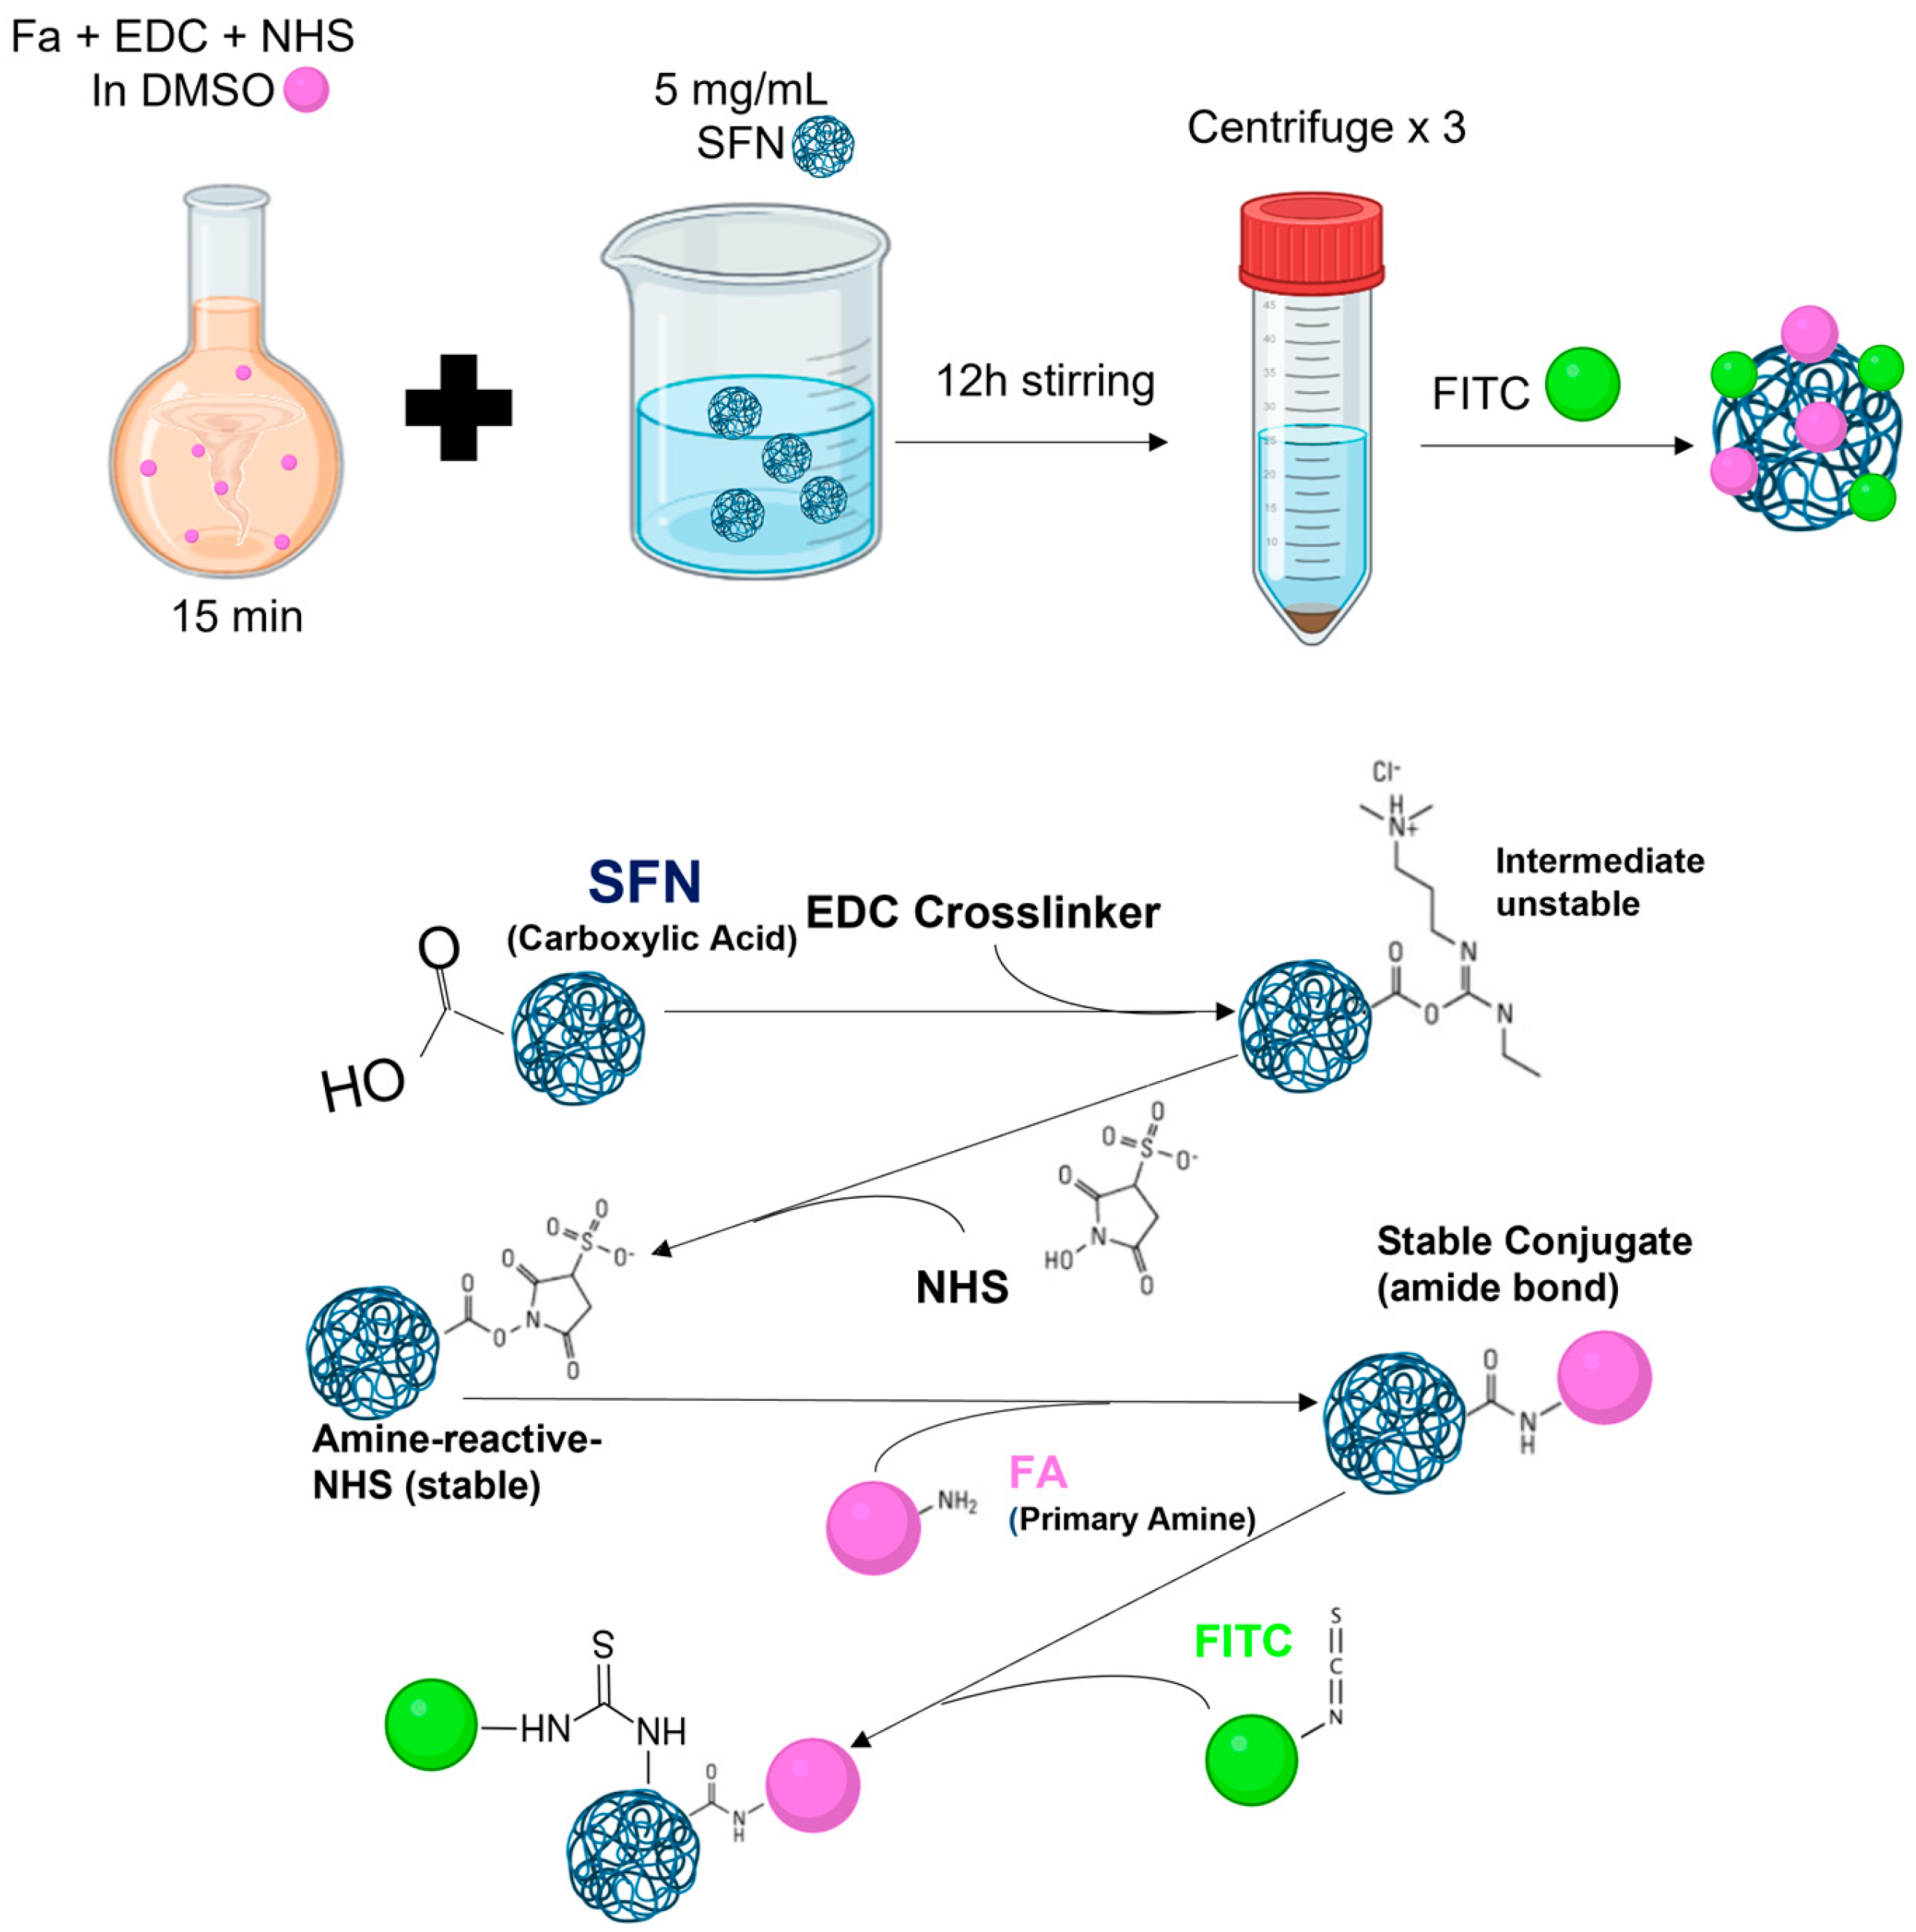
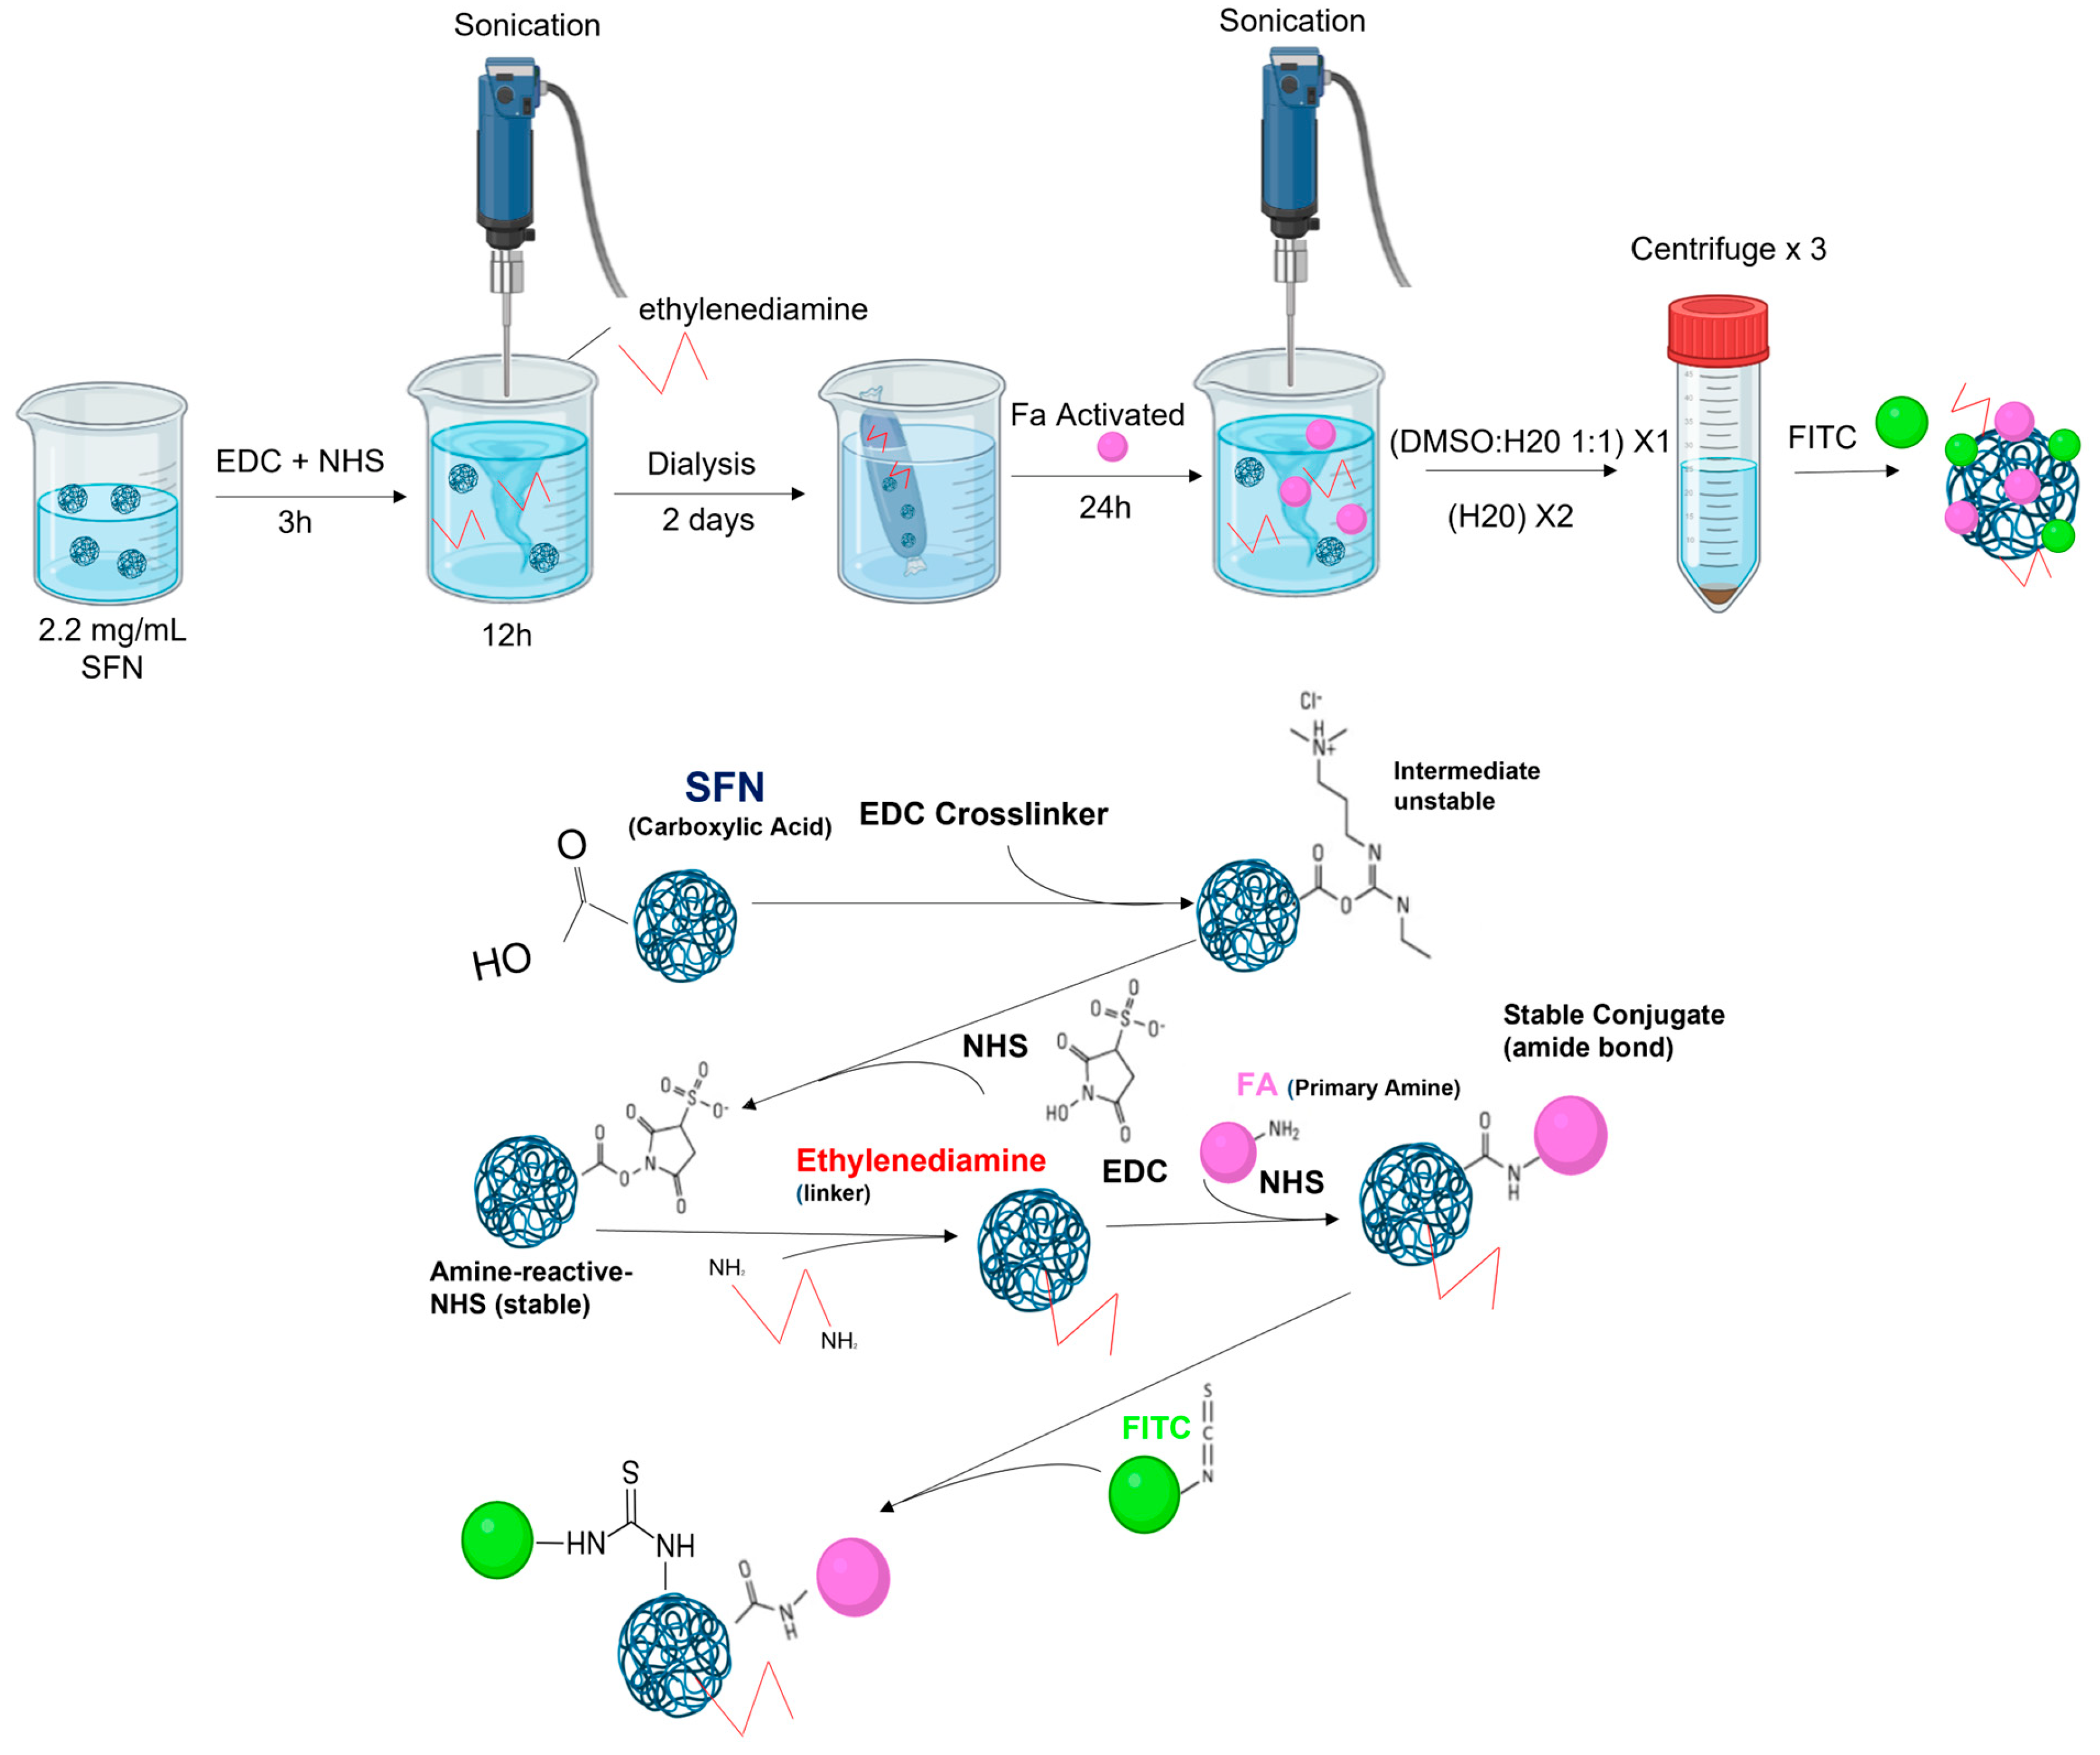
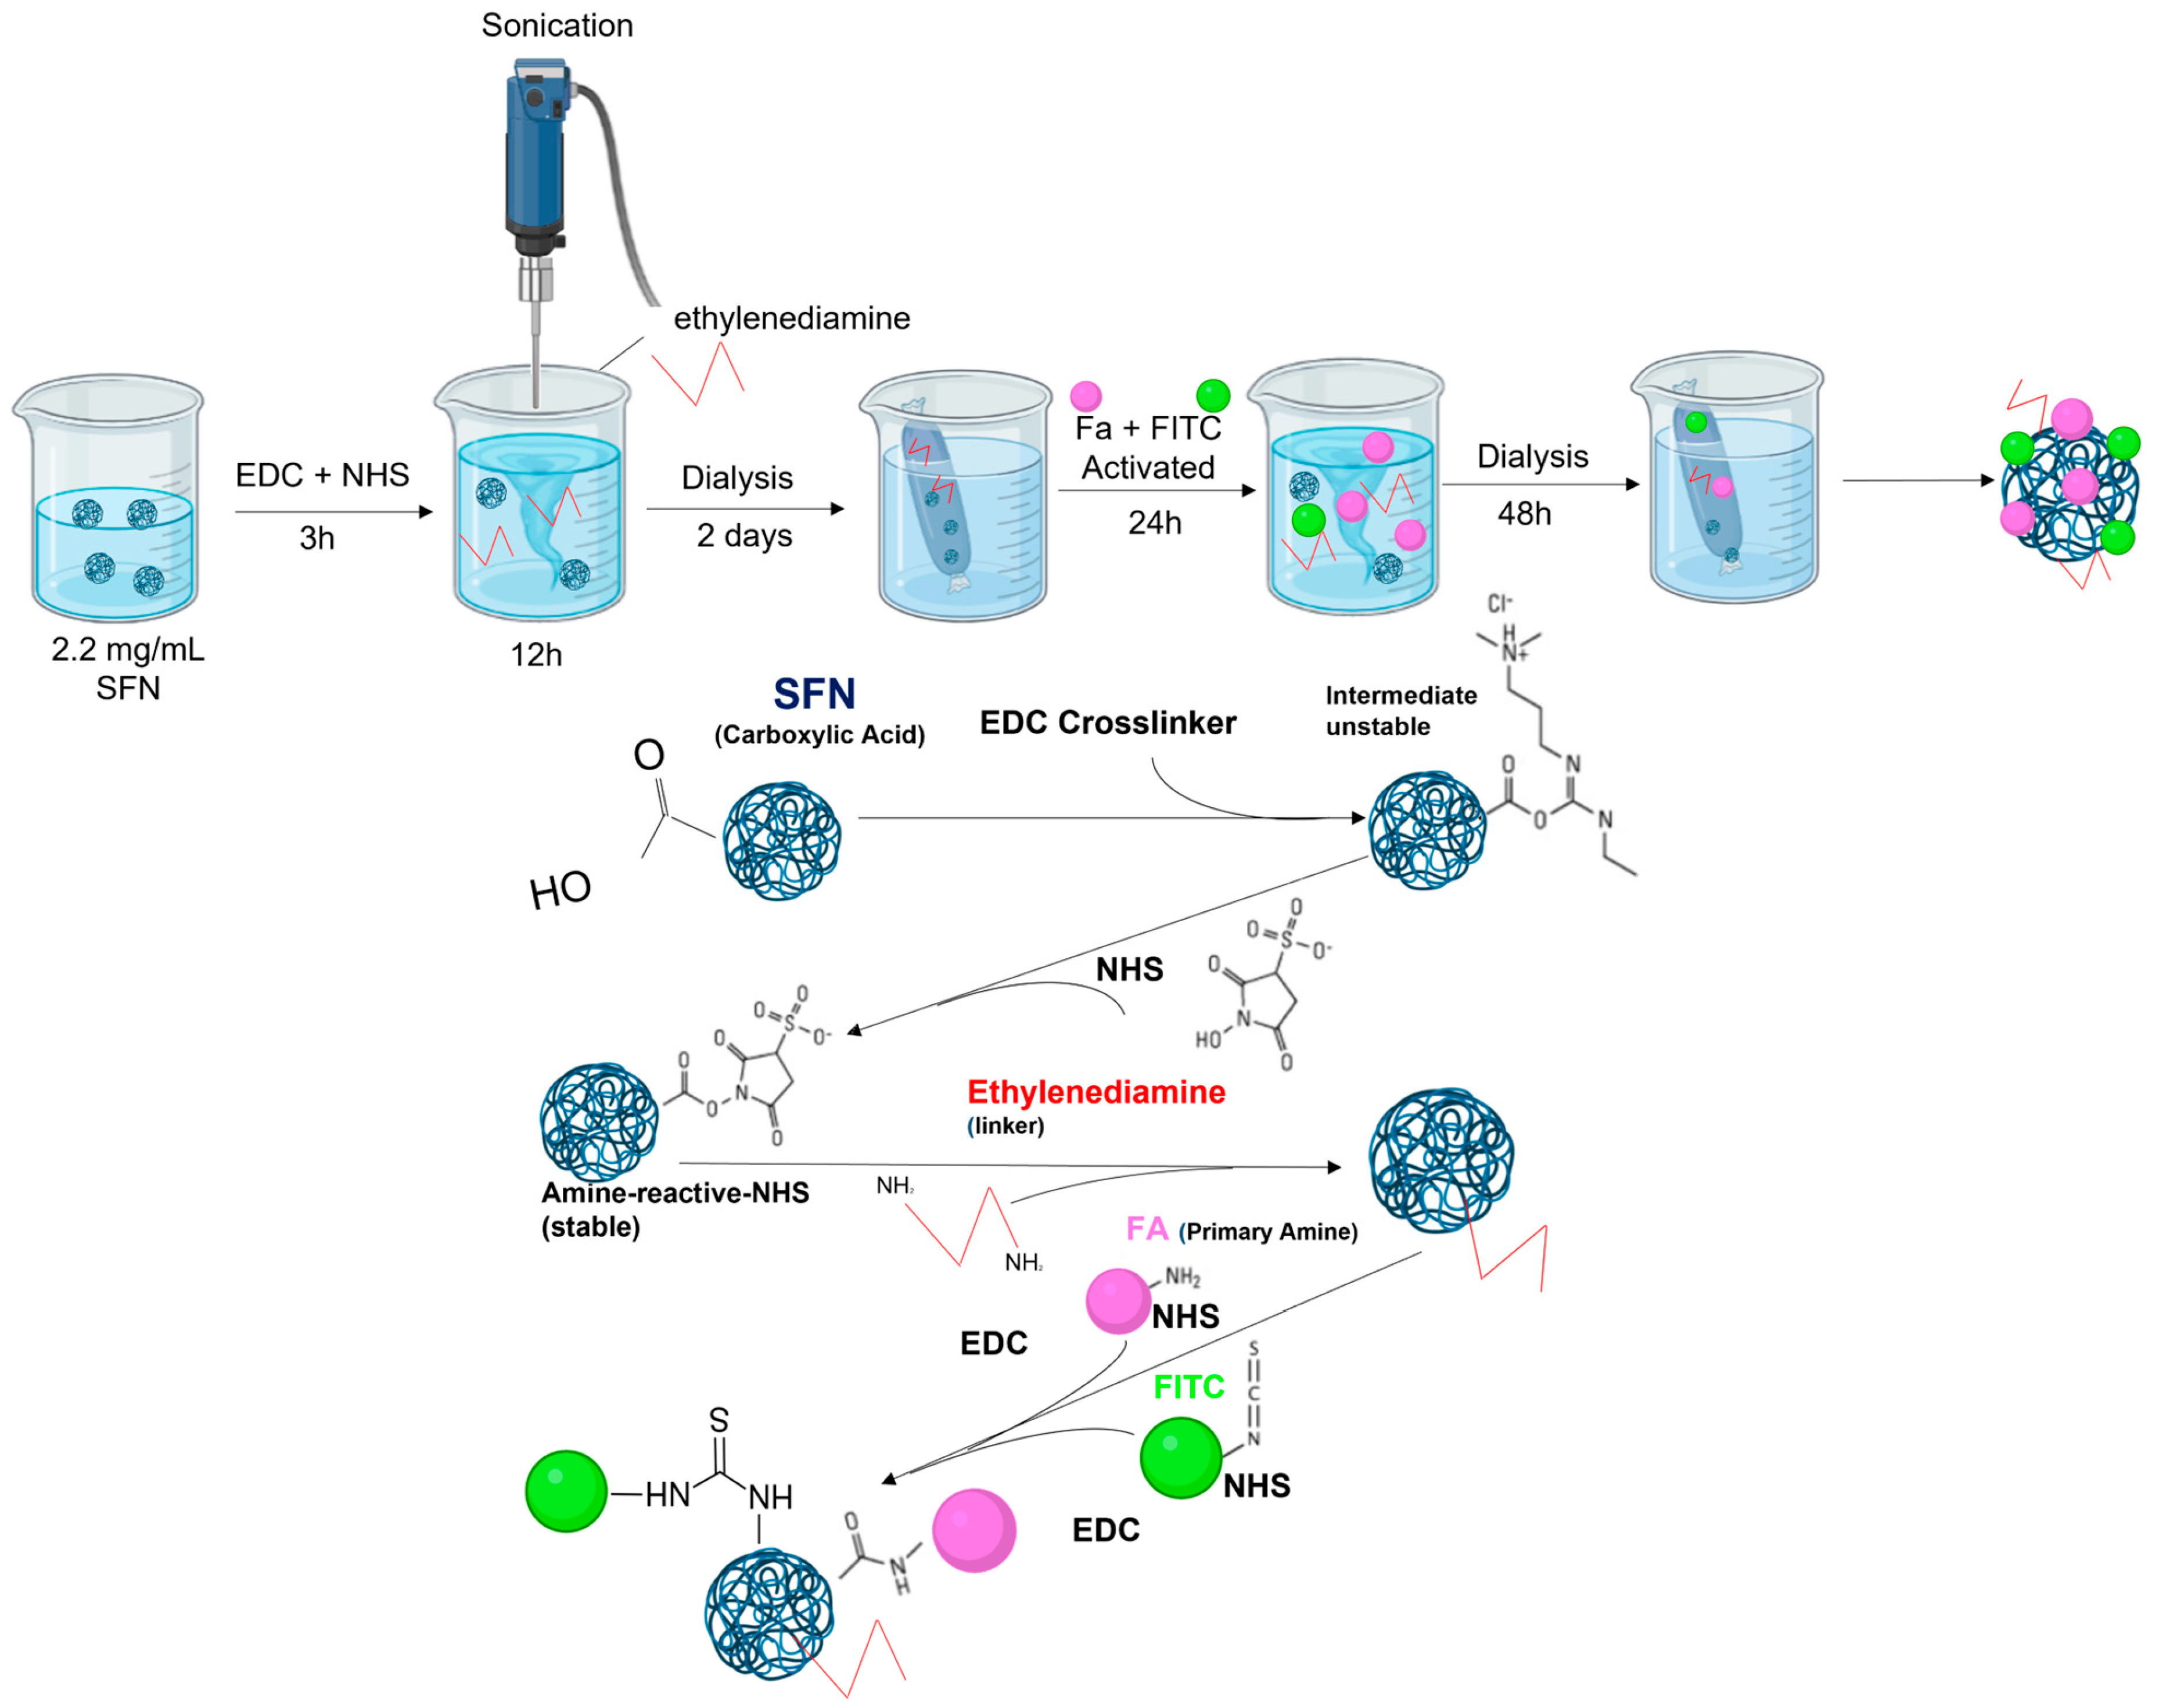
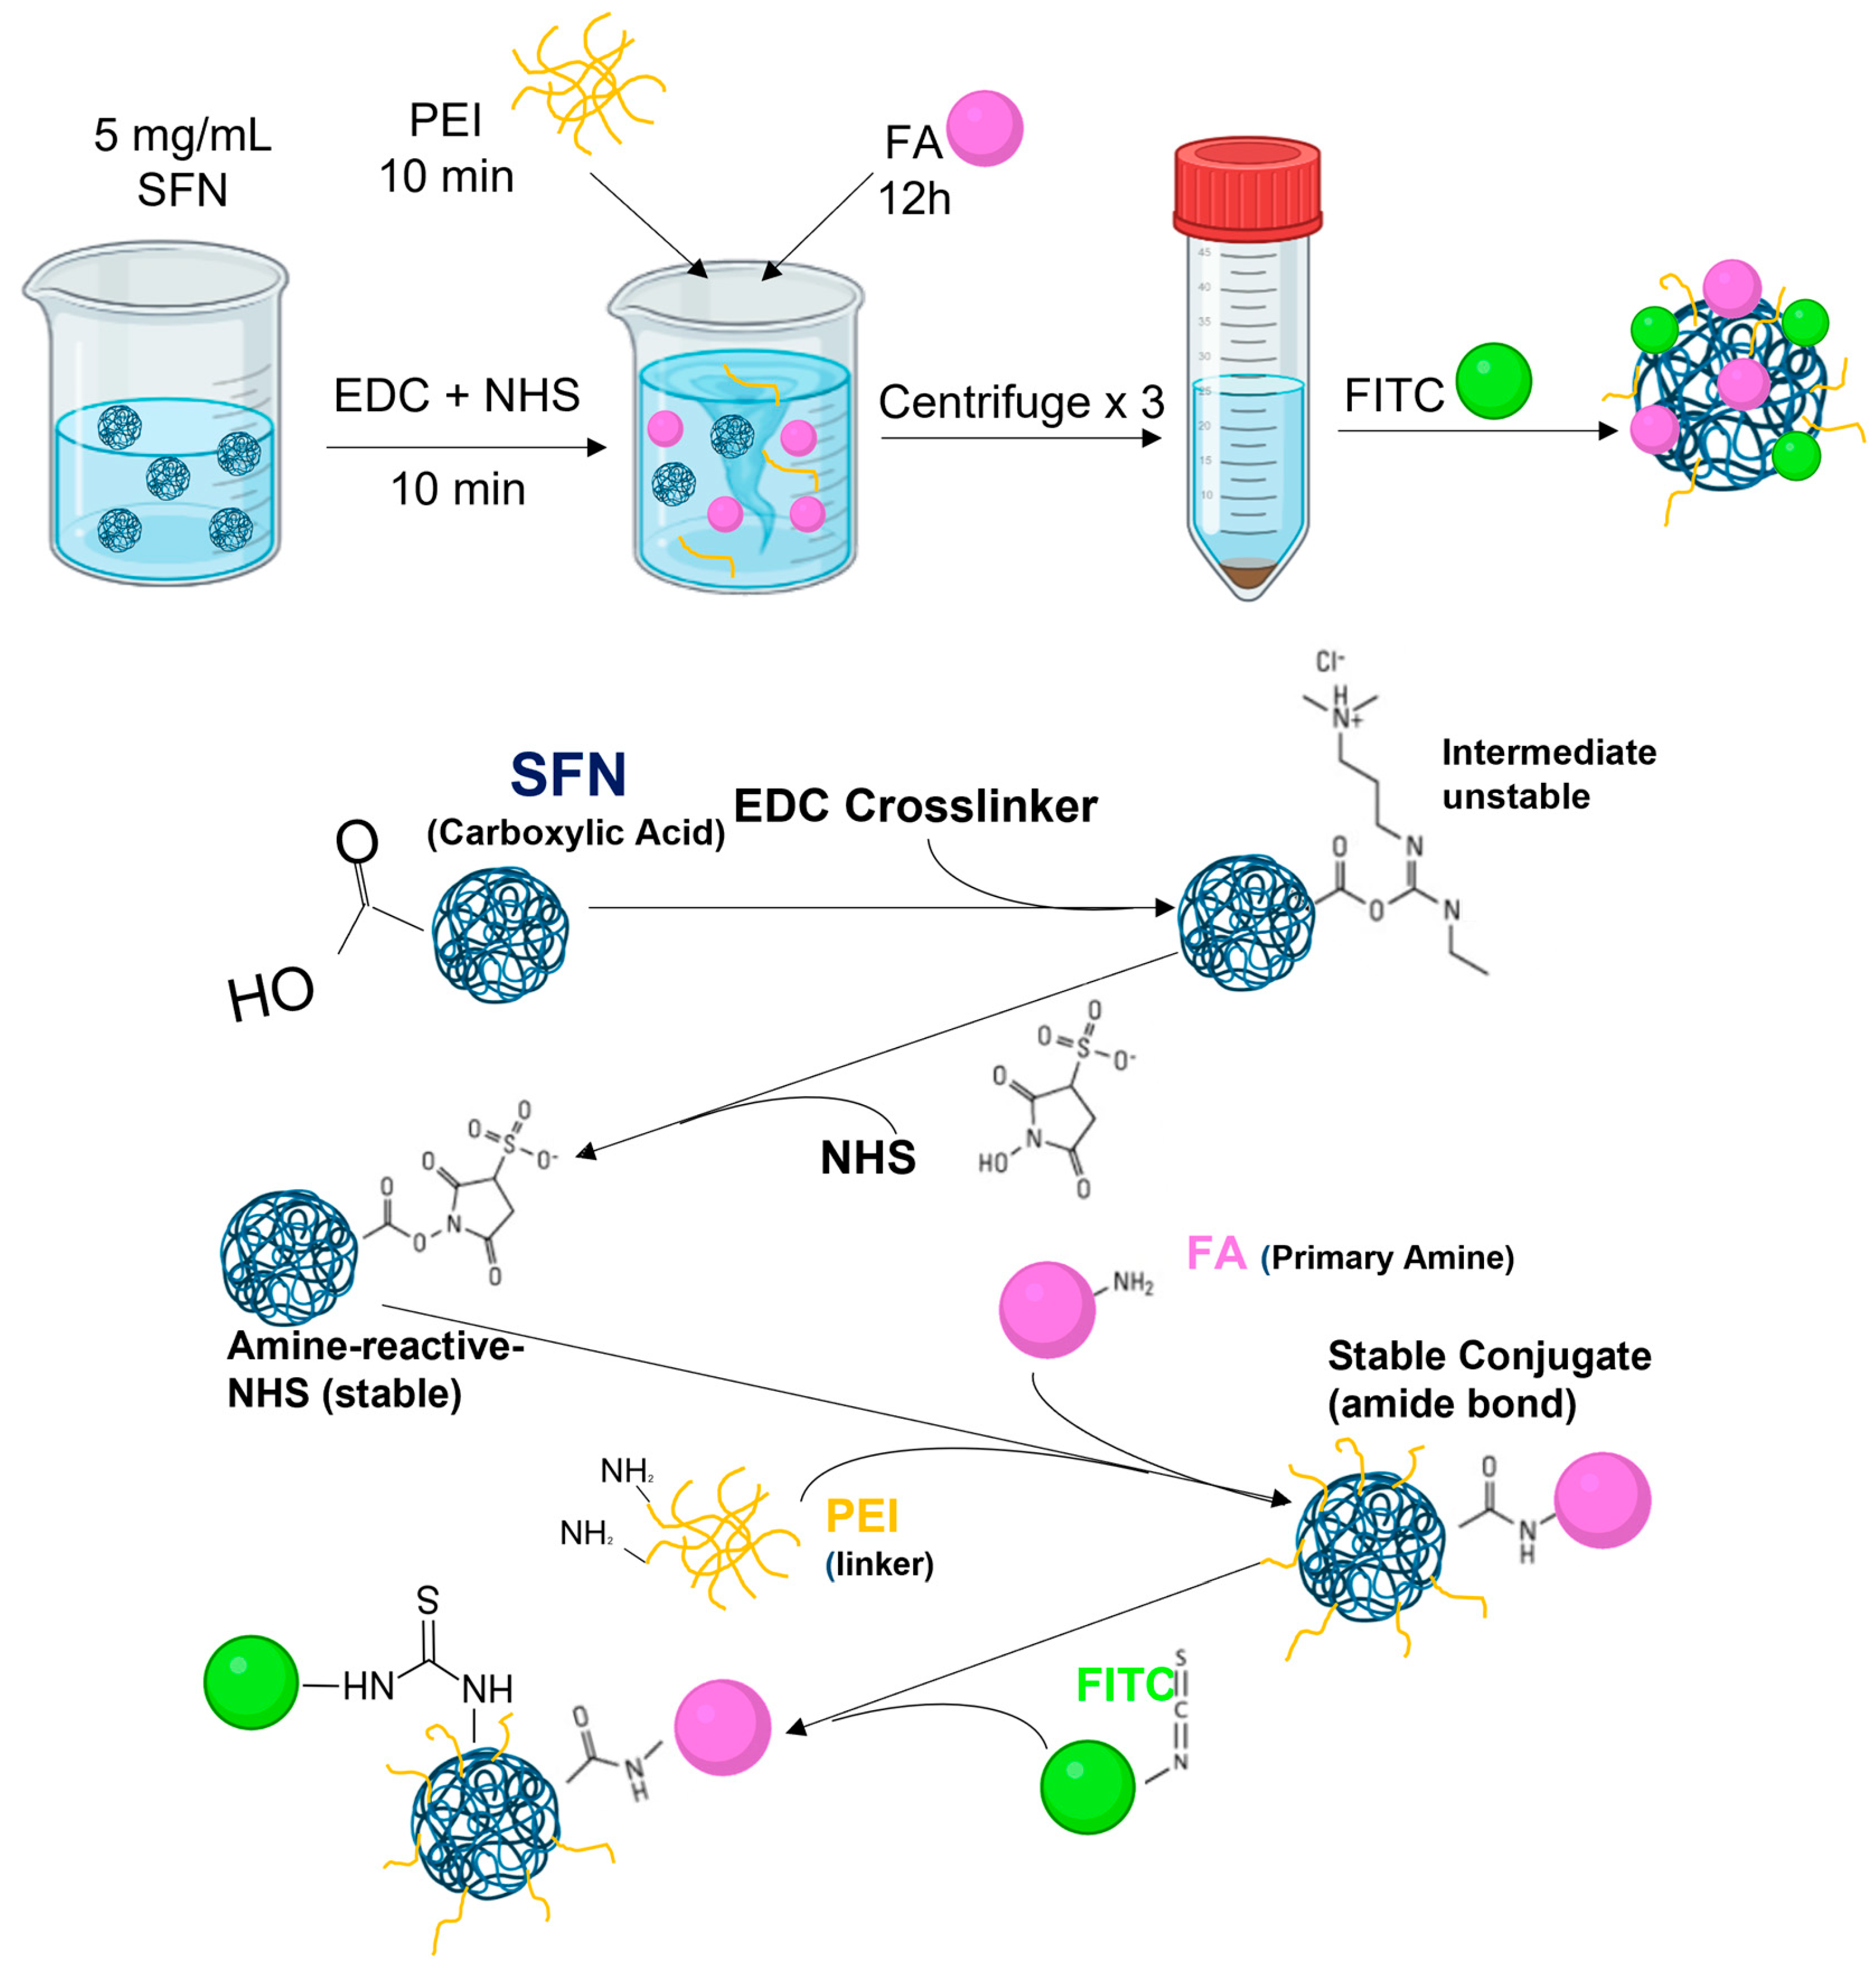
2.3. Functionalizing SFNs with Folic Acid (FA-SFNs)
2.4. Formulation of Ibrutinib-Loaded Silk Fibroin Nanoparticles (IB-SFNs/IB-FA-SFNs)
2.5. Labeling Silk Fibroin Nanoparticles with FITC (FITC-SFNs)
2.6. Physical Characterization of the Nanoparticles
2.6.1. Dynamic Light Scattering (DLS)
2.6.2. Drug Loading and Encapsulation Efficiency by Attenuated Total Reflectance Fourier-Transform Infrared (ATR-FTIR) Spectroscopy
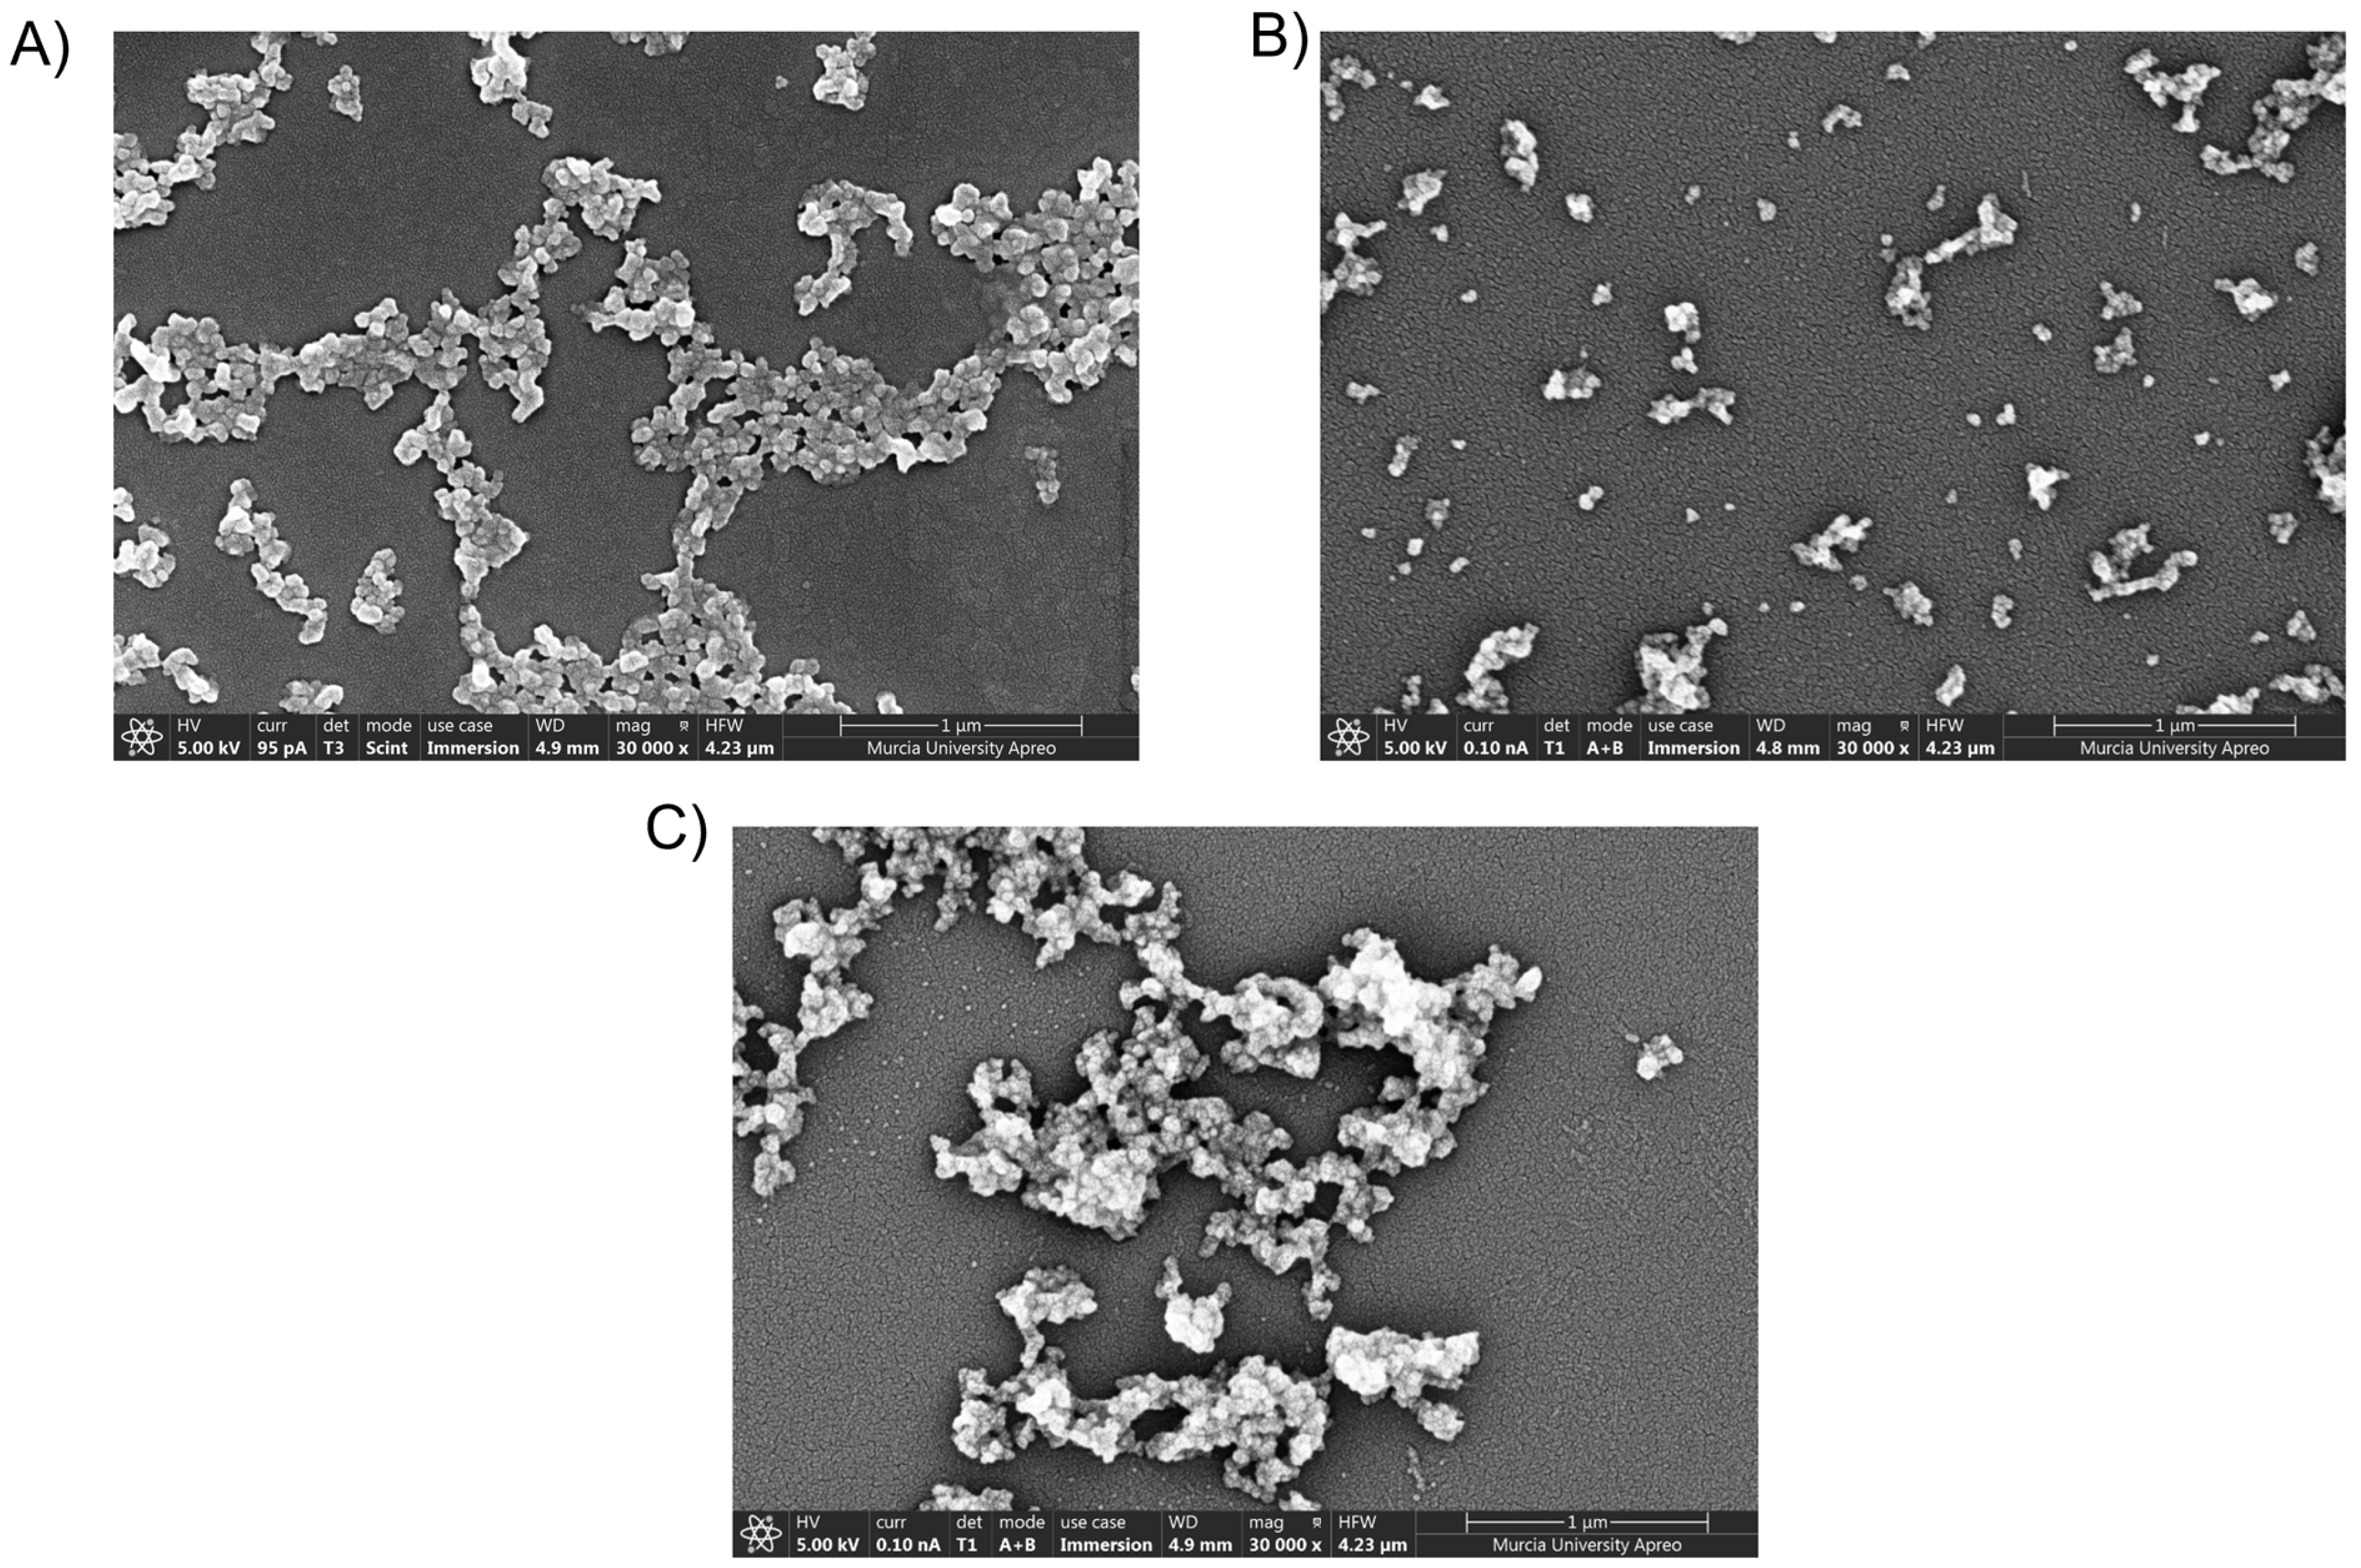
2.6.3. Field Emission Scanning Electron Microscopy (FESEM)
2.7. In Vitro Characterization of Nanoparticles
2.7.1. Cell Culture
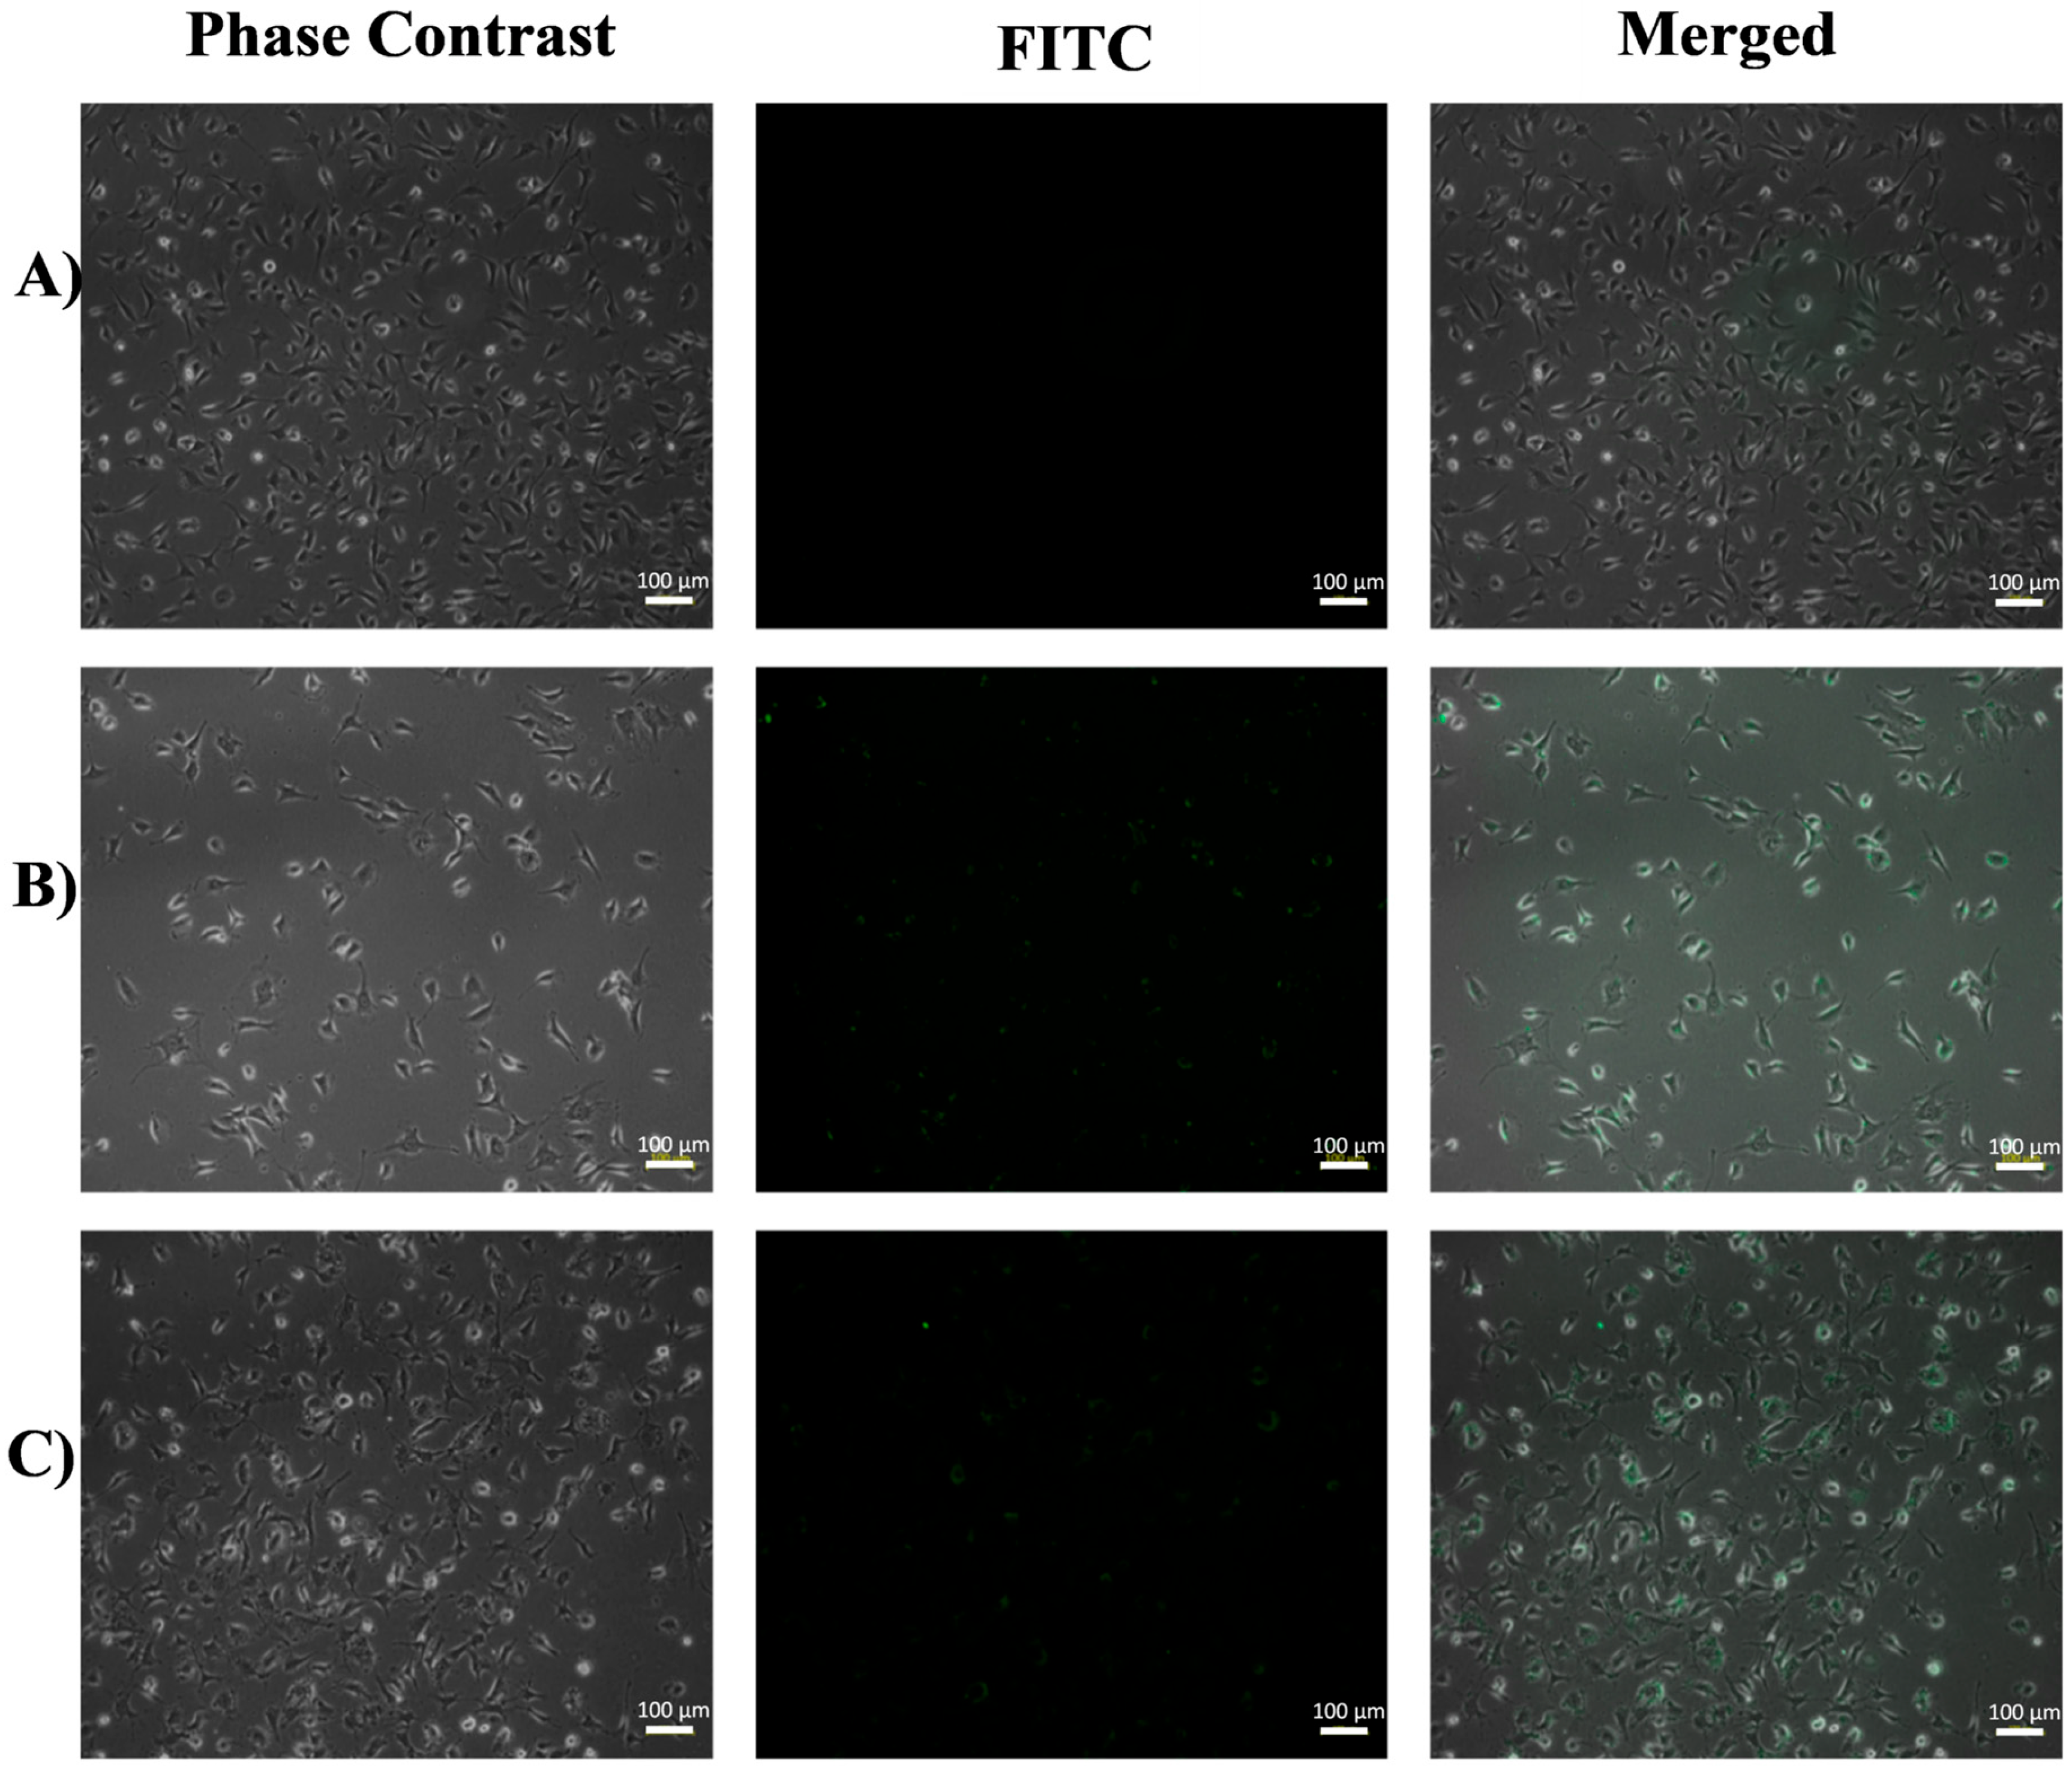
2.7.2. Inverted Fluorescence Microscopy
2.7.3. Cell Treatment
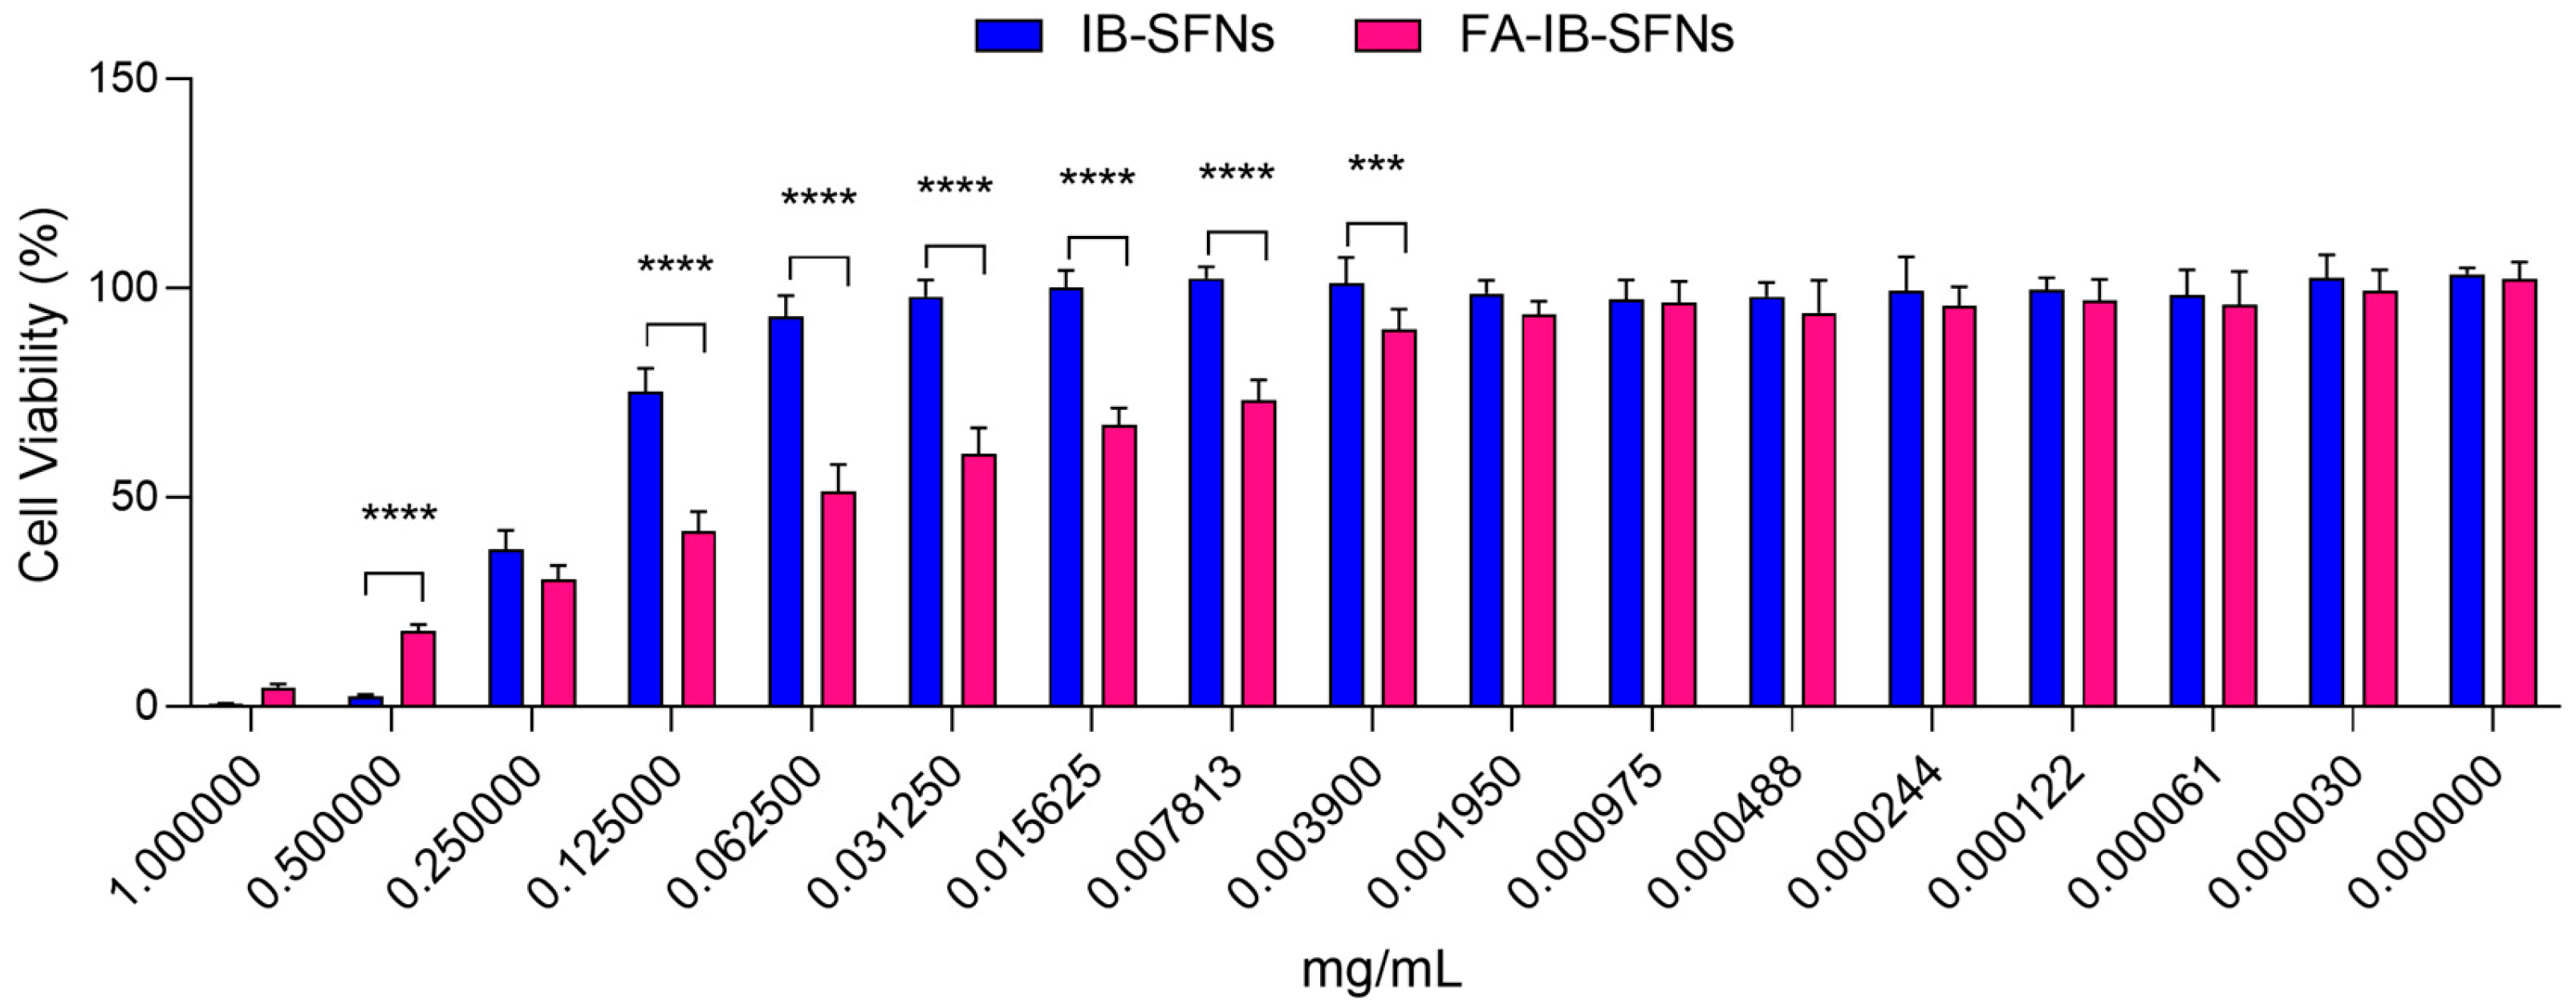
2.7.4. Cytotoxicity Assays
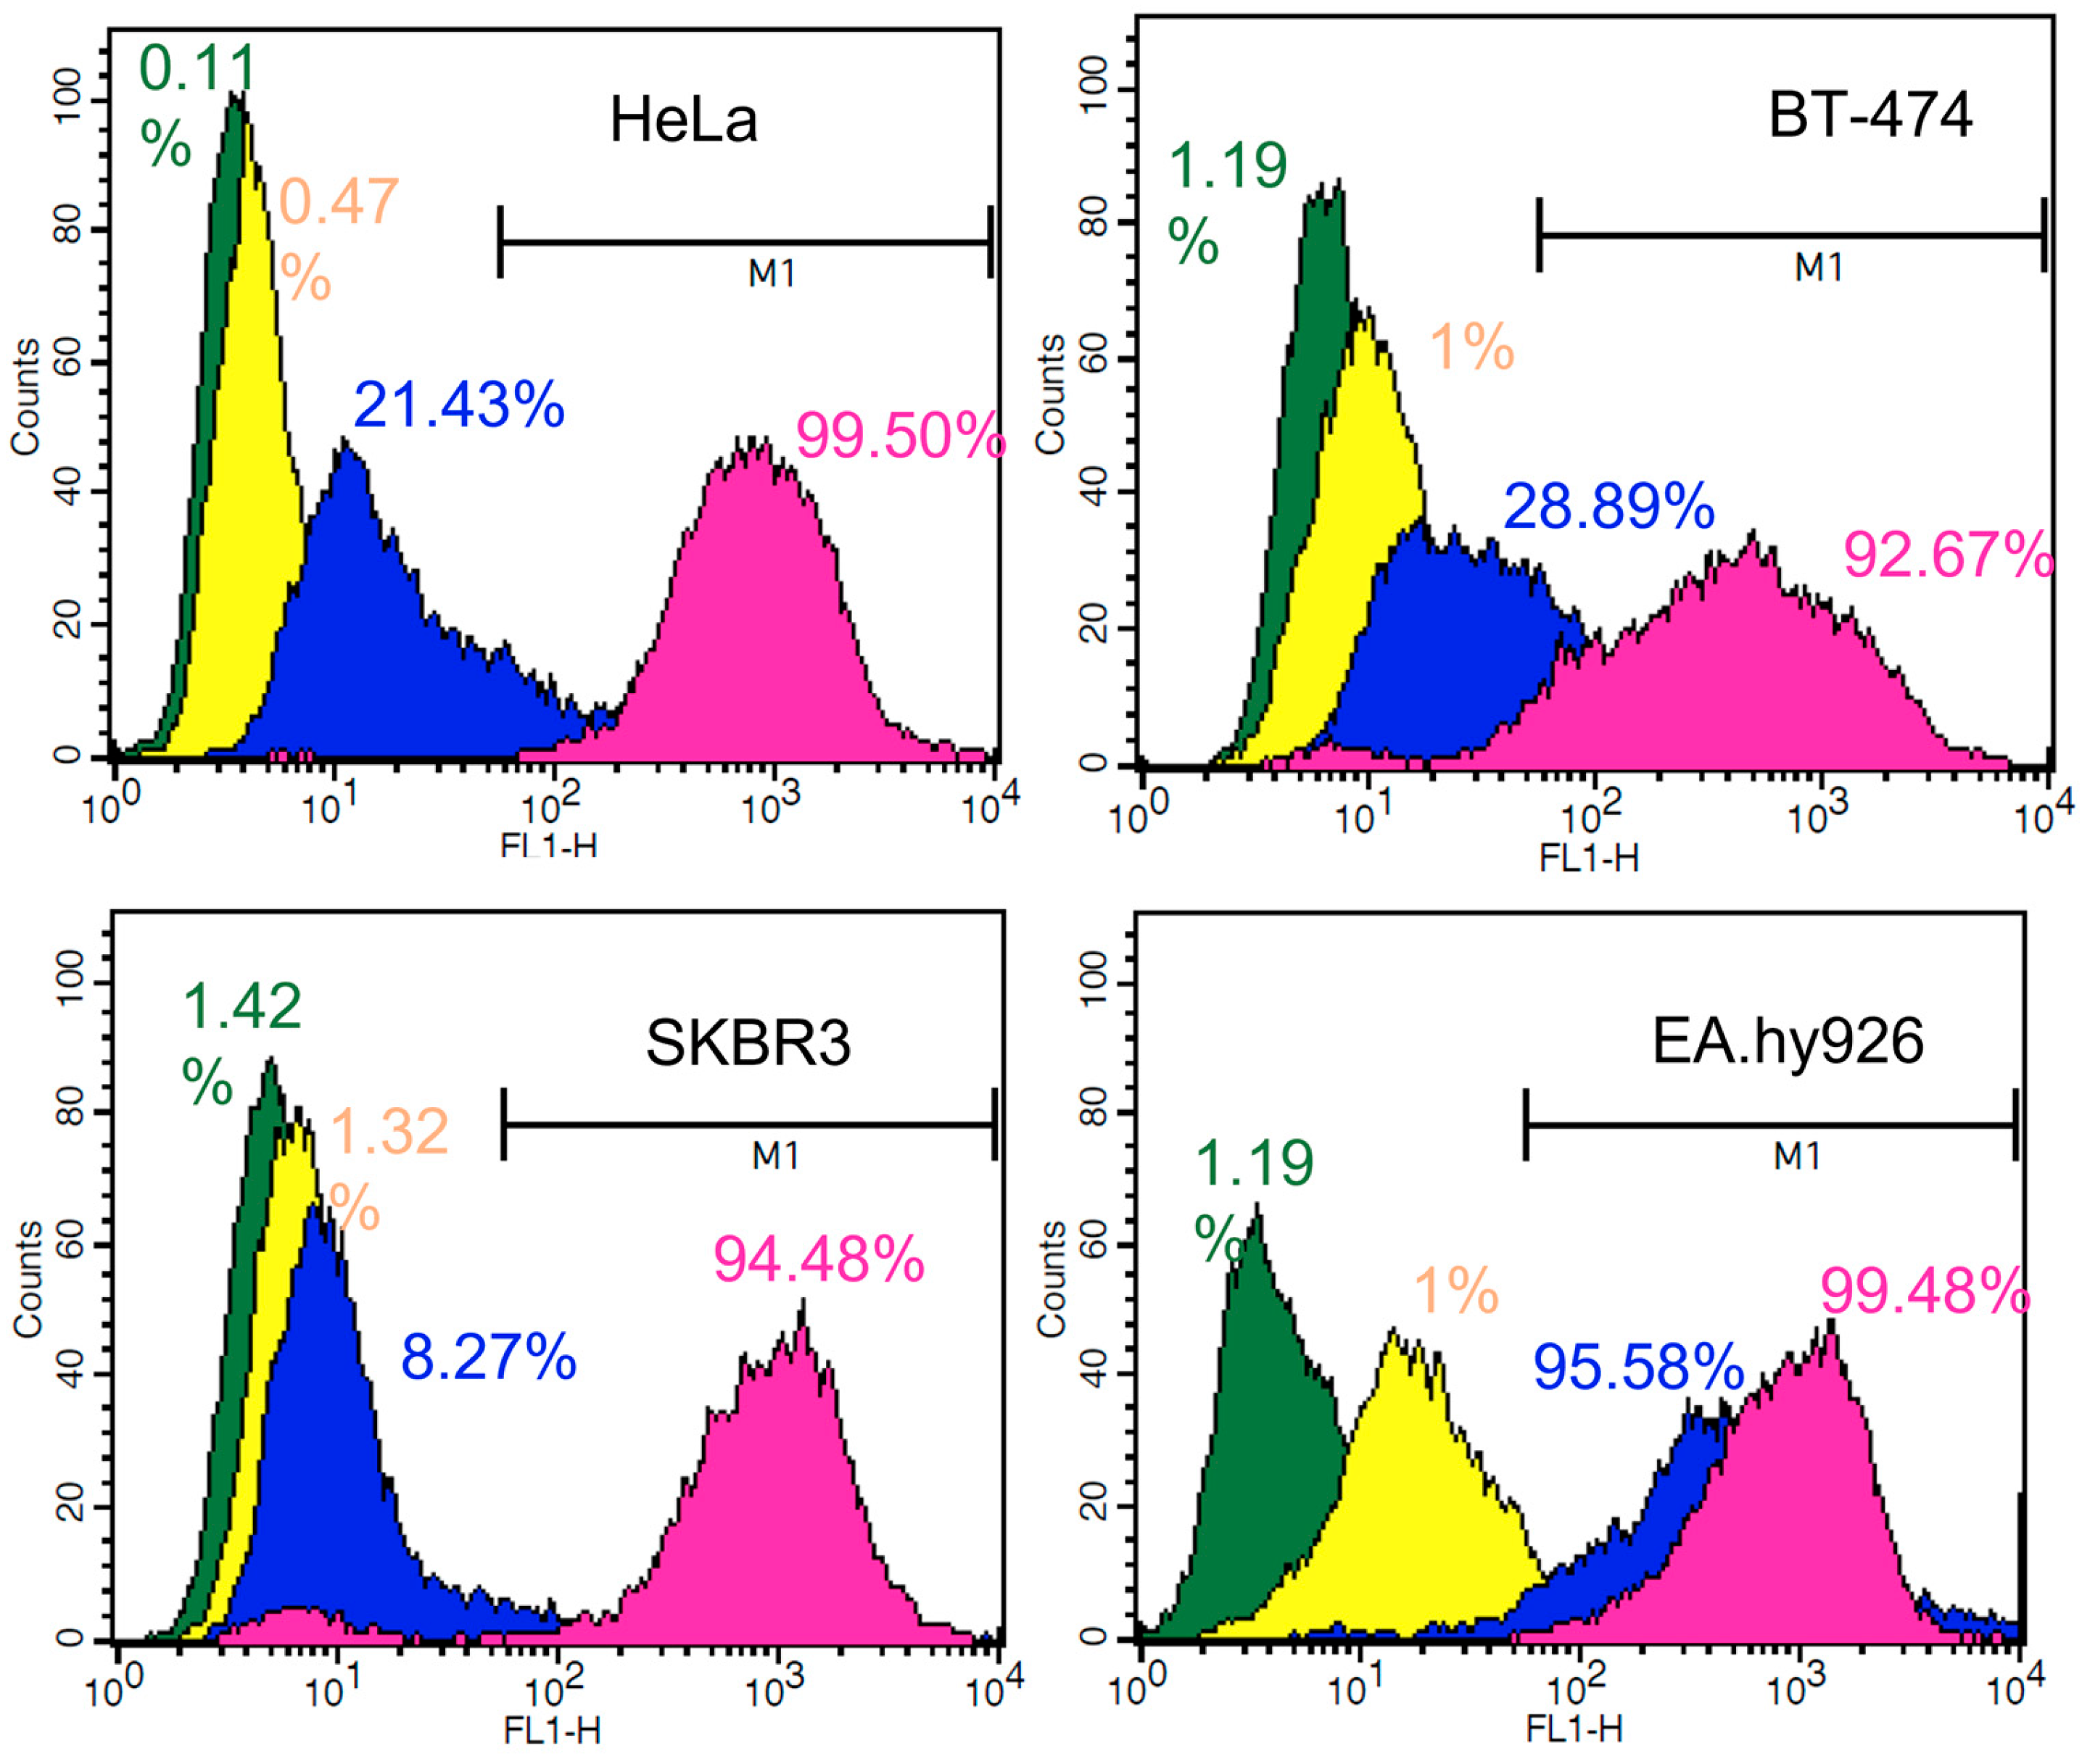
2.7.5. Nanoparticle Cellular Uptake
2.7.6. Confocal Laser Scanning Microscopy
2.7.7. Cell Cycle Arrest Assay
2.7.8. Apoptosis Assay
3. Results and Discussion
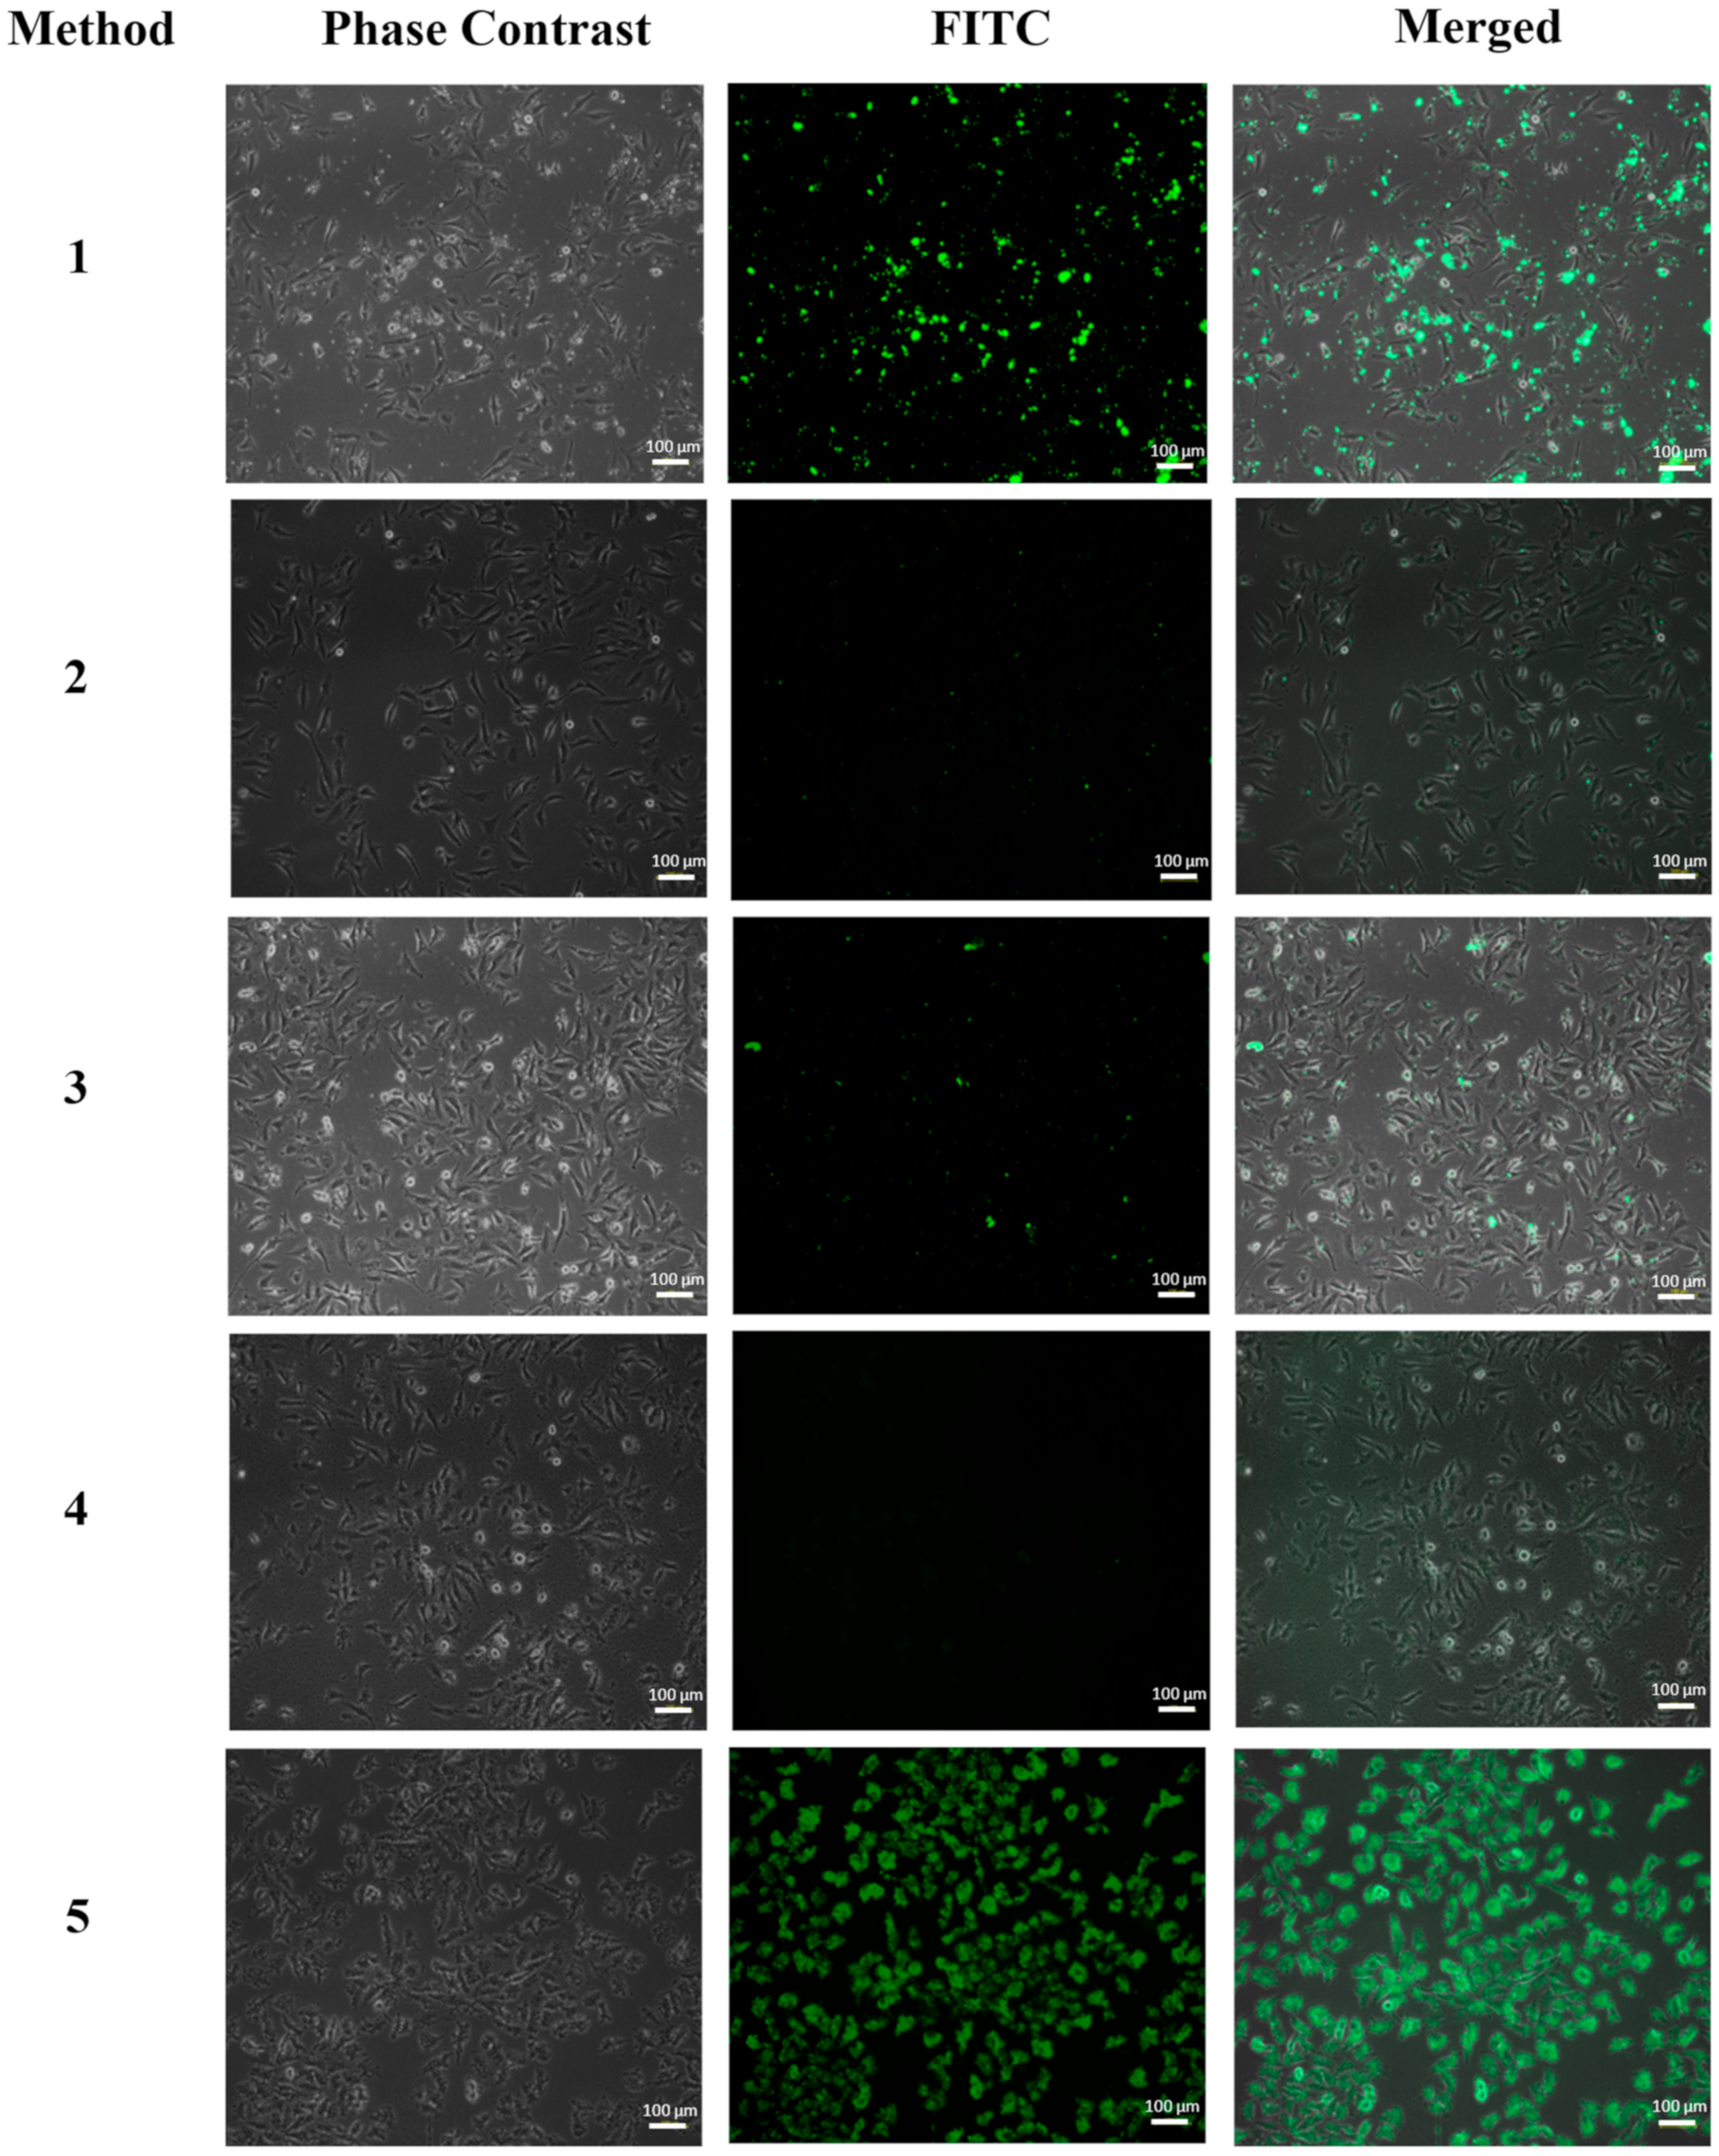
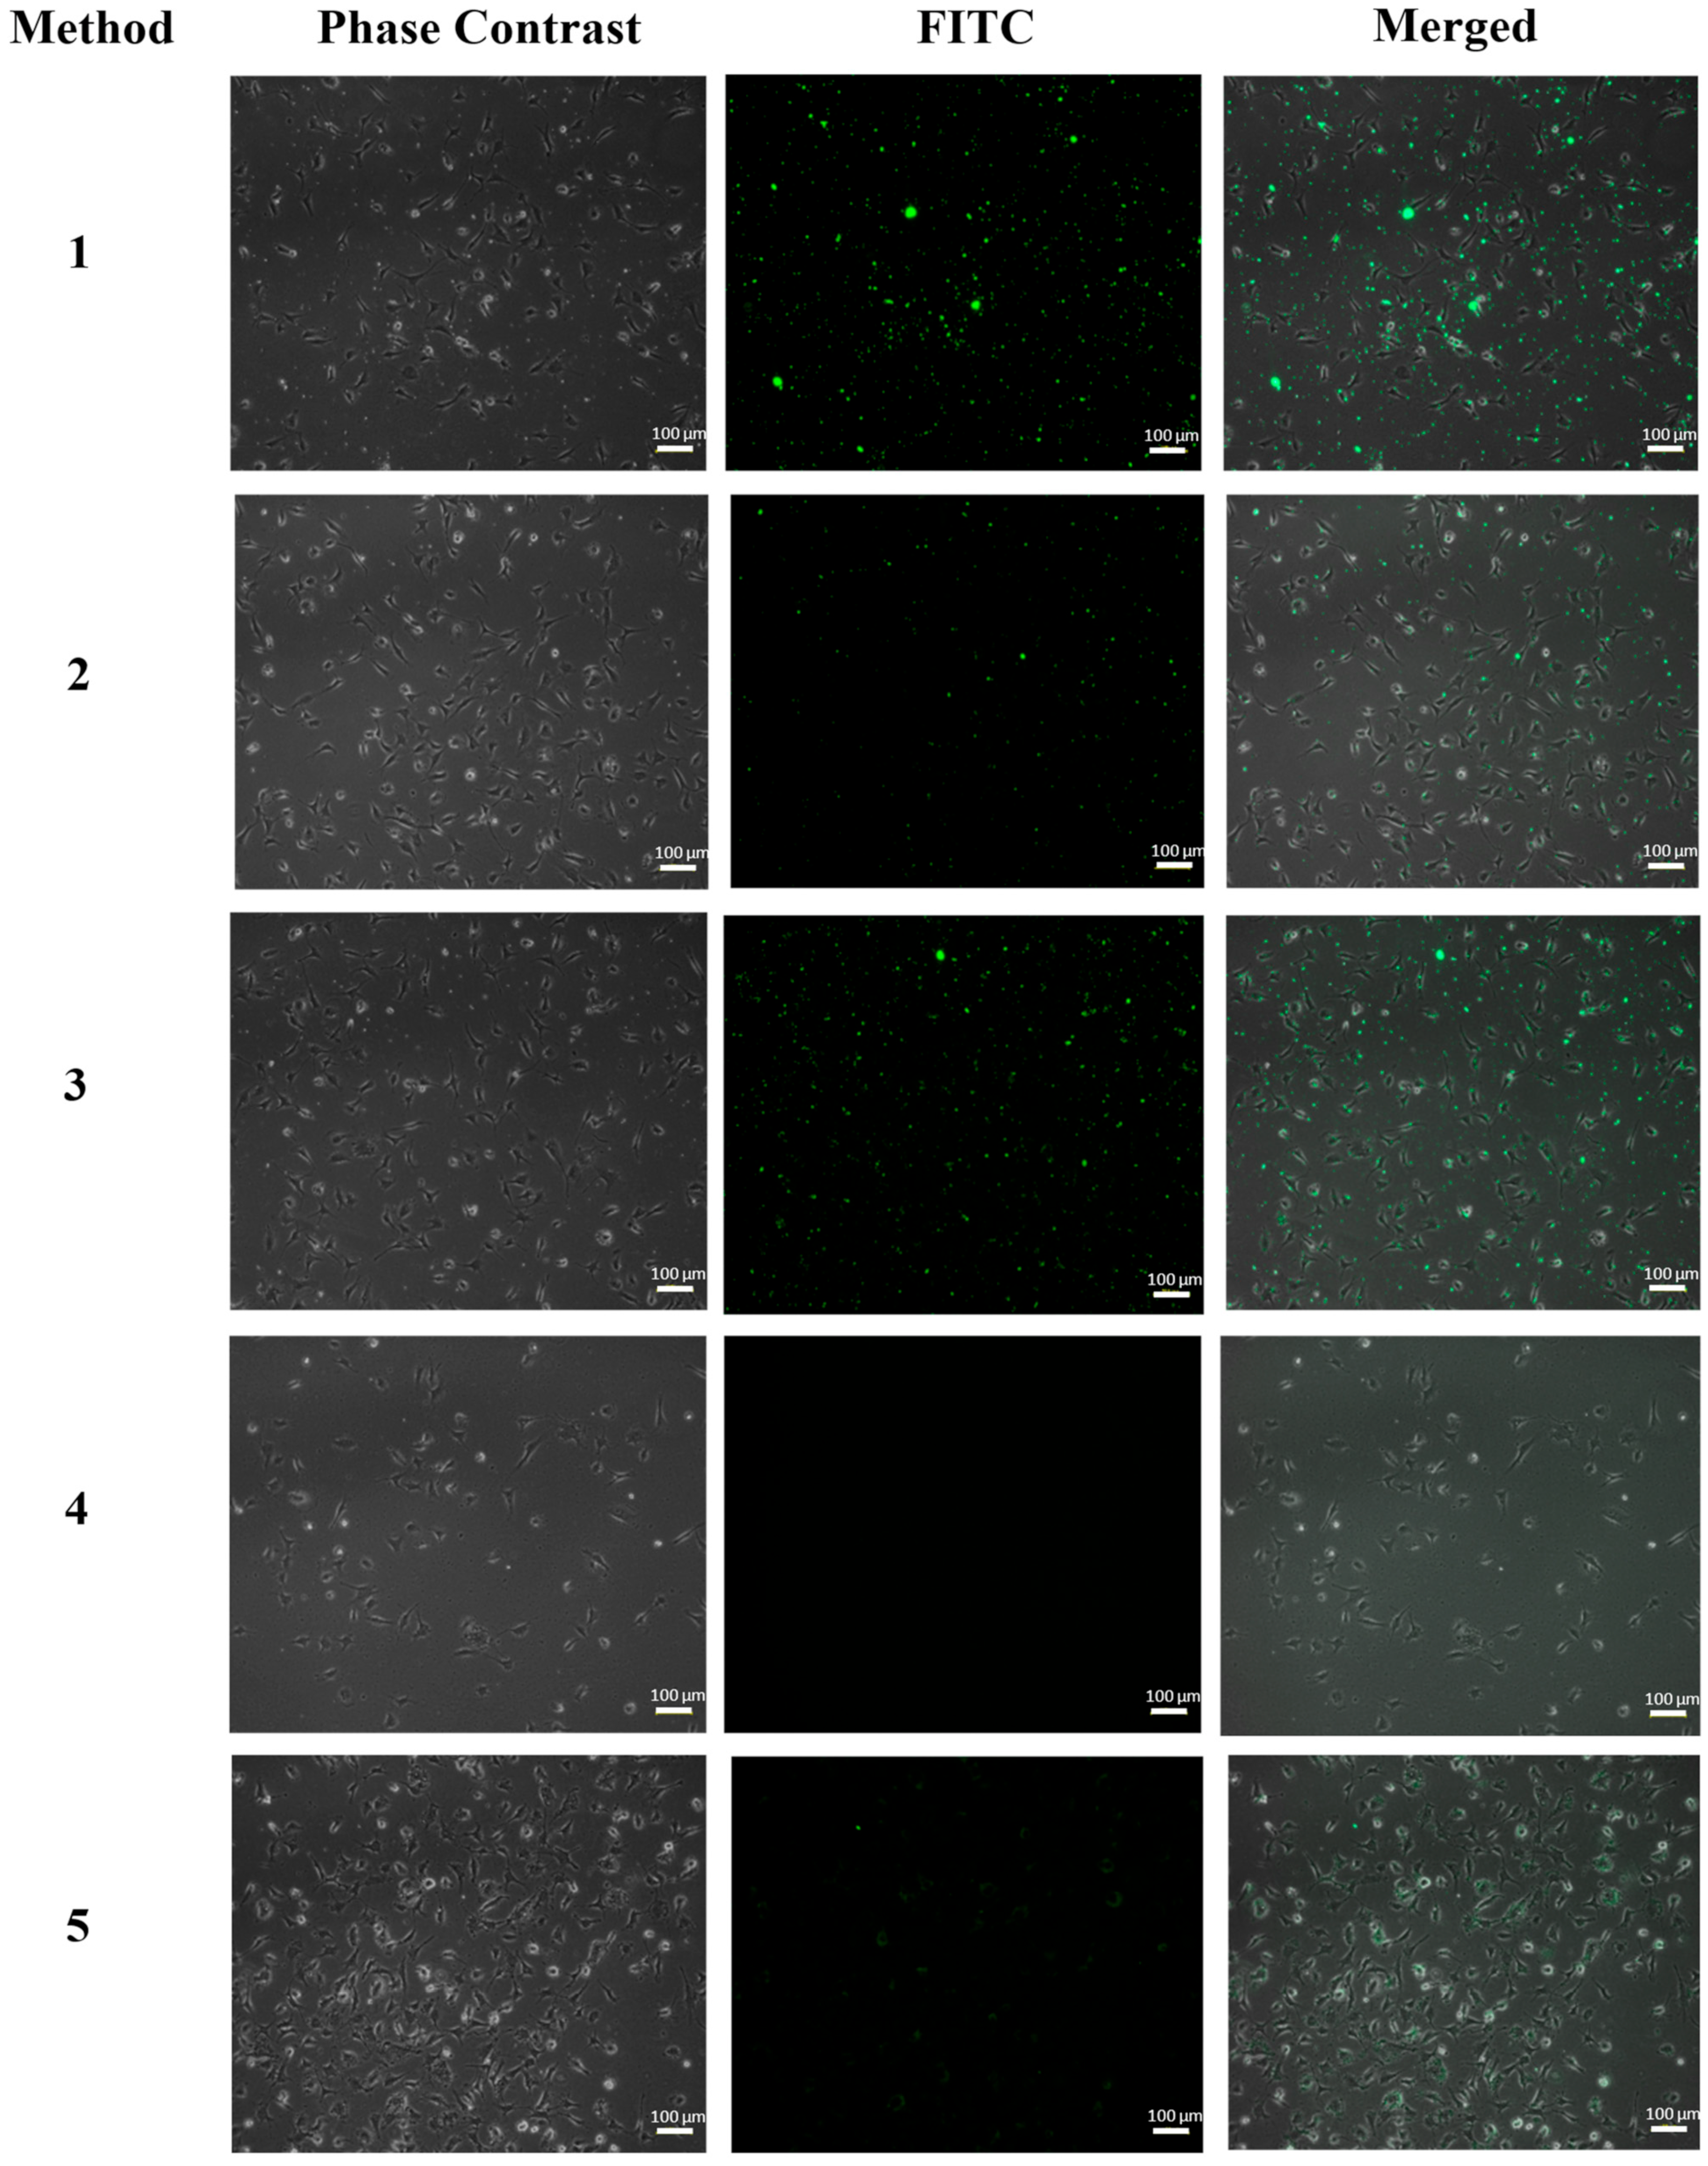
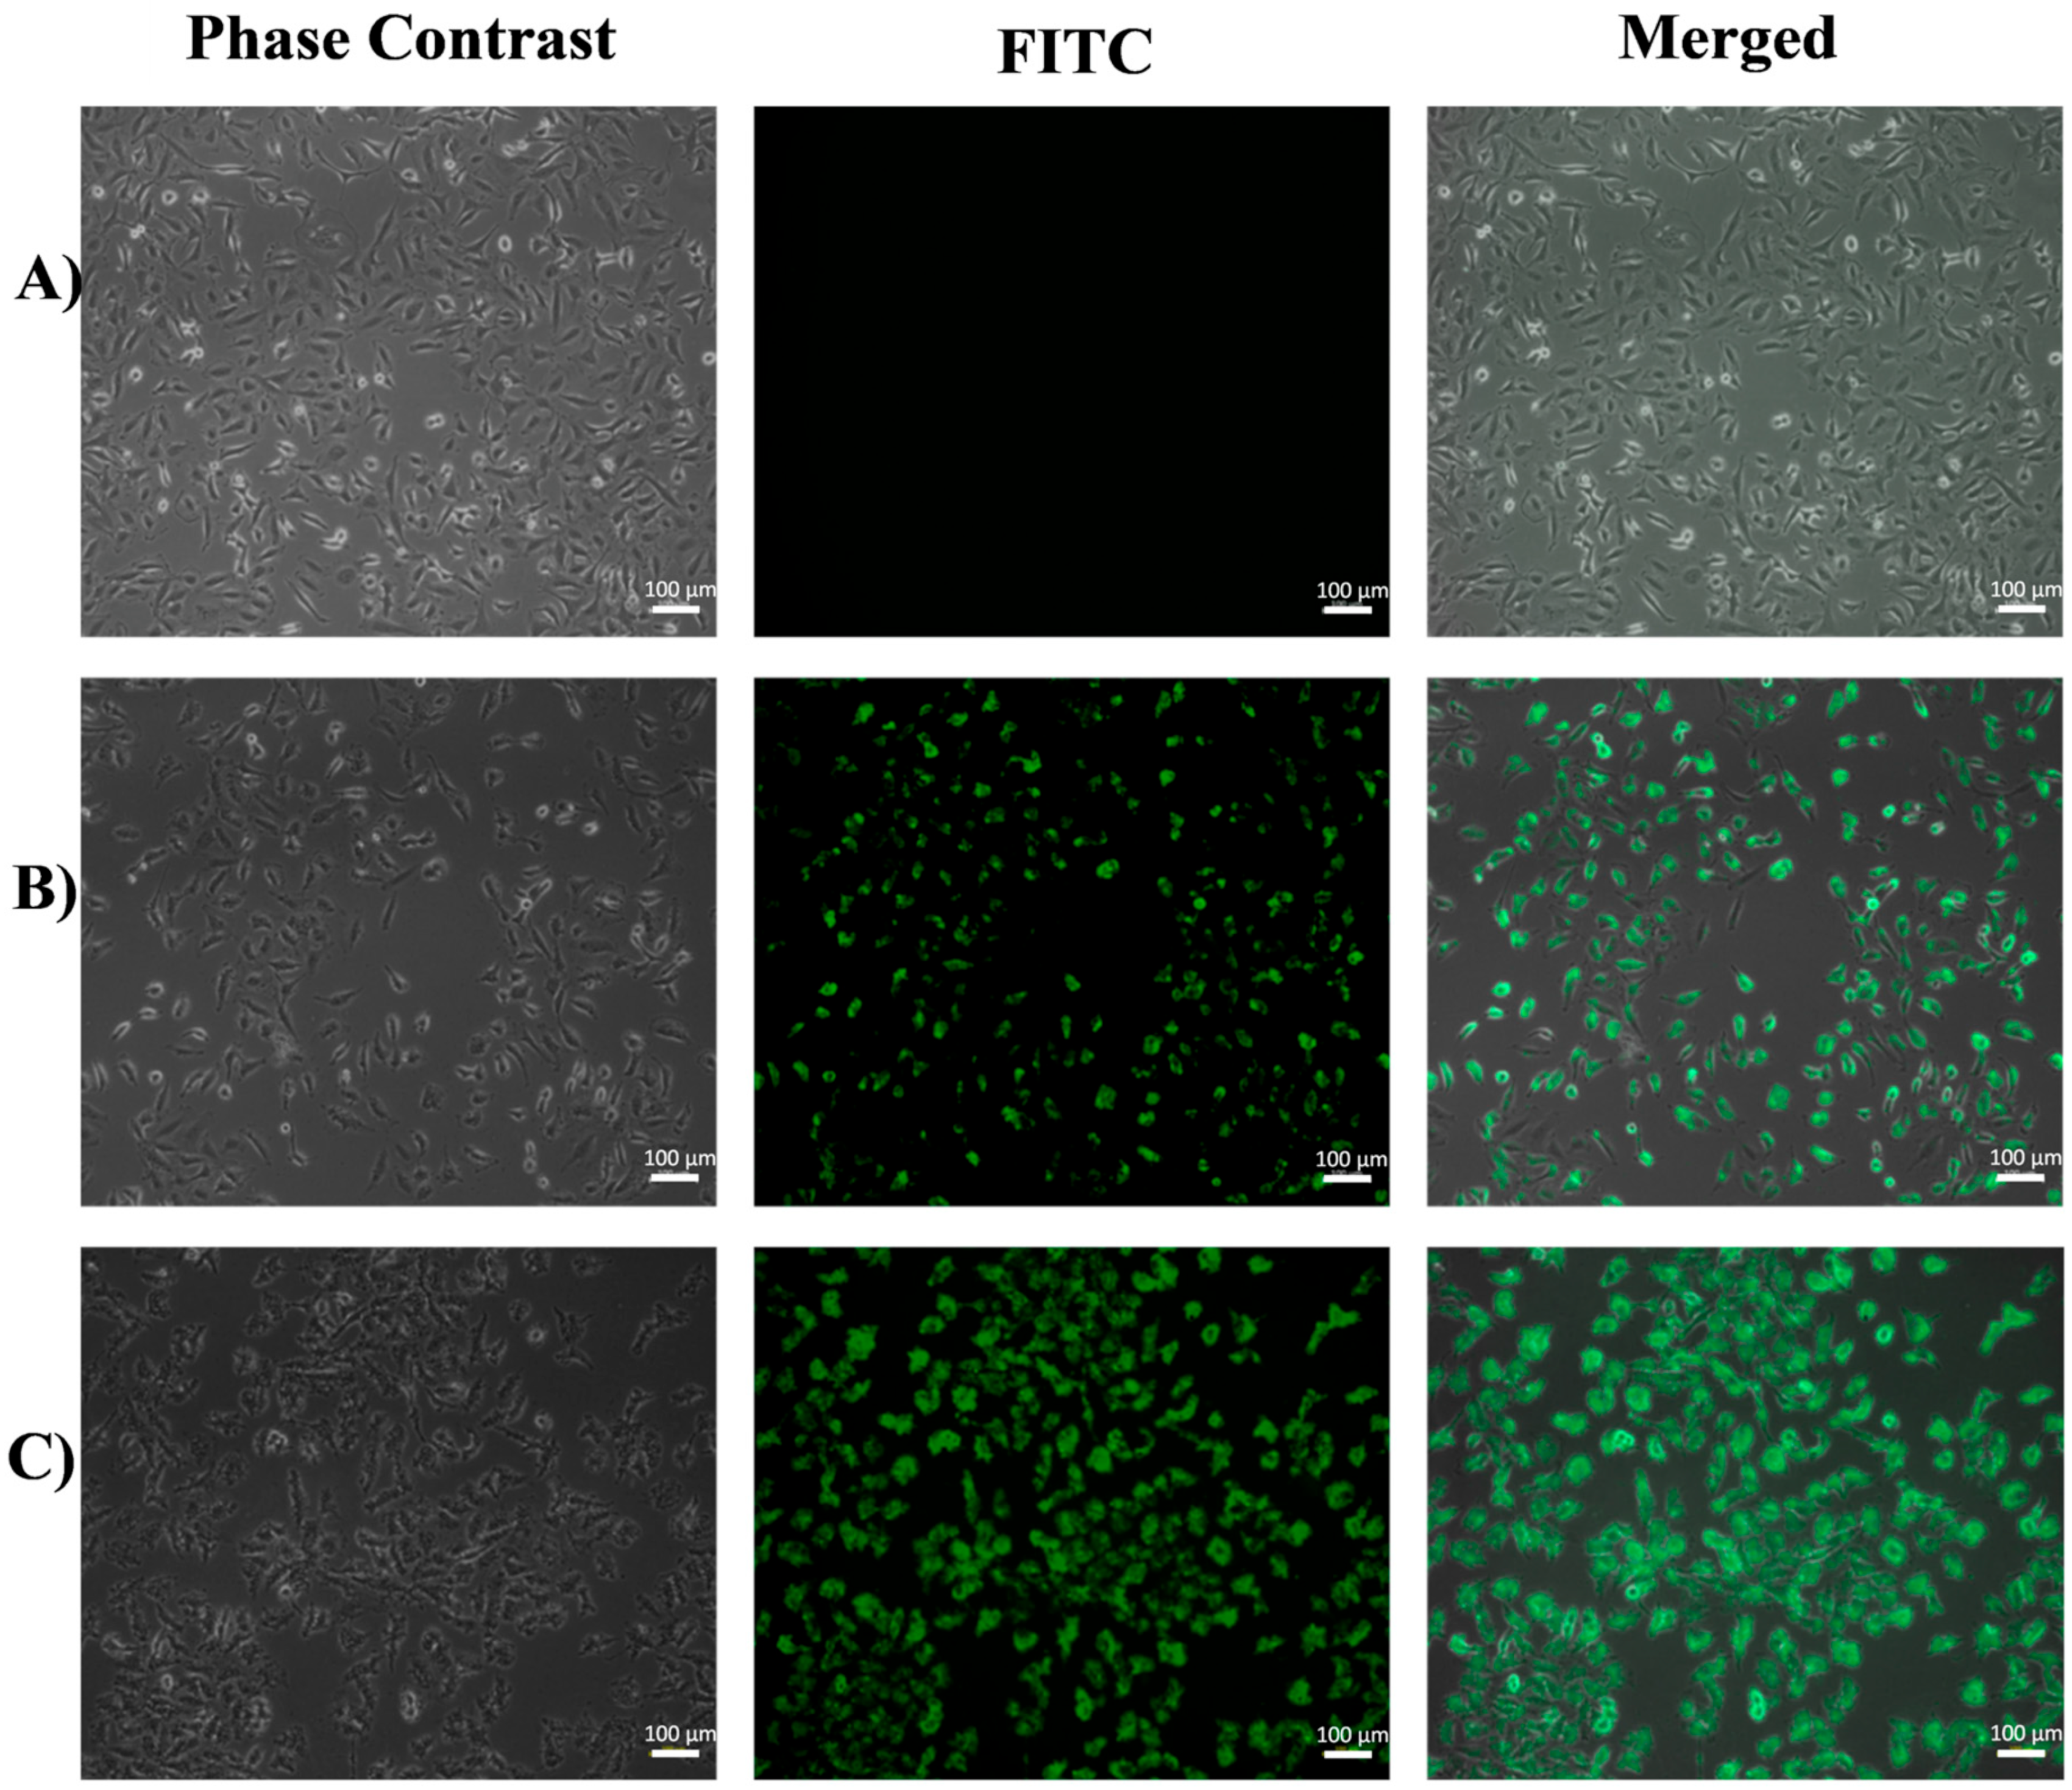
3.1. Inverted Fluorescence Microscopy
3.2. Hydrodynamic Mean Diameter and Z-Potential of the Nanoparticles
3.3. Field Emission Scanning Electron Microscopy (FESEM)
3.4. Drug Loading Content (DLC) and Encapsulation Efficiency (EE)
3.5. In Vitro Cytotoxicity
3.6. In Vitro Cellular Uptake by Flow Cytometry
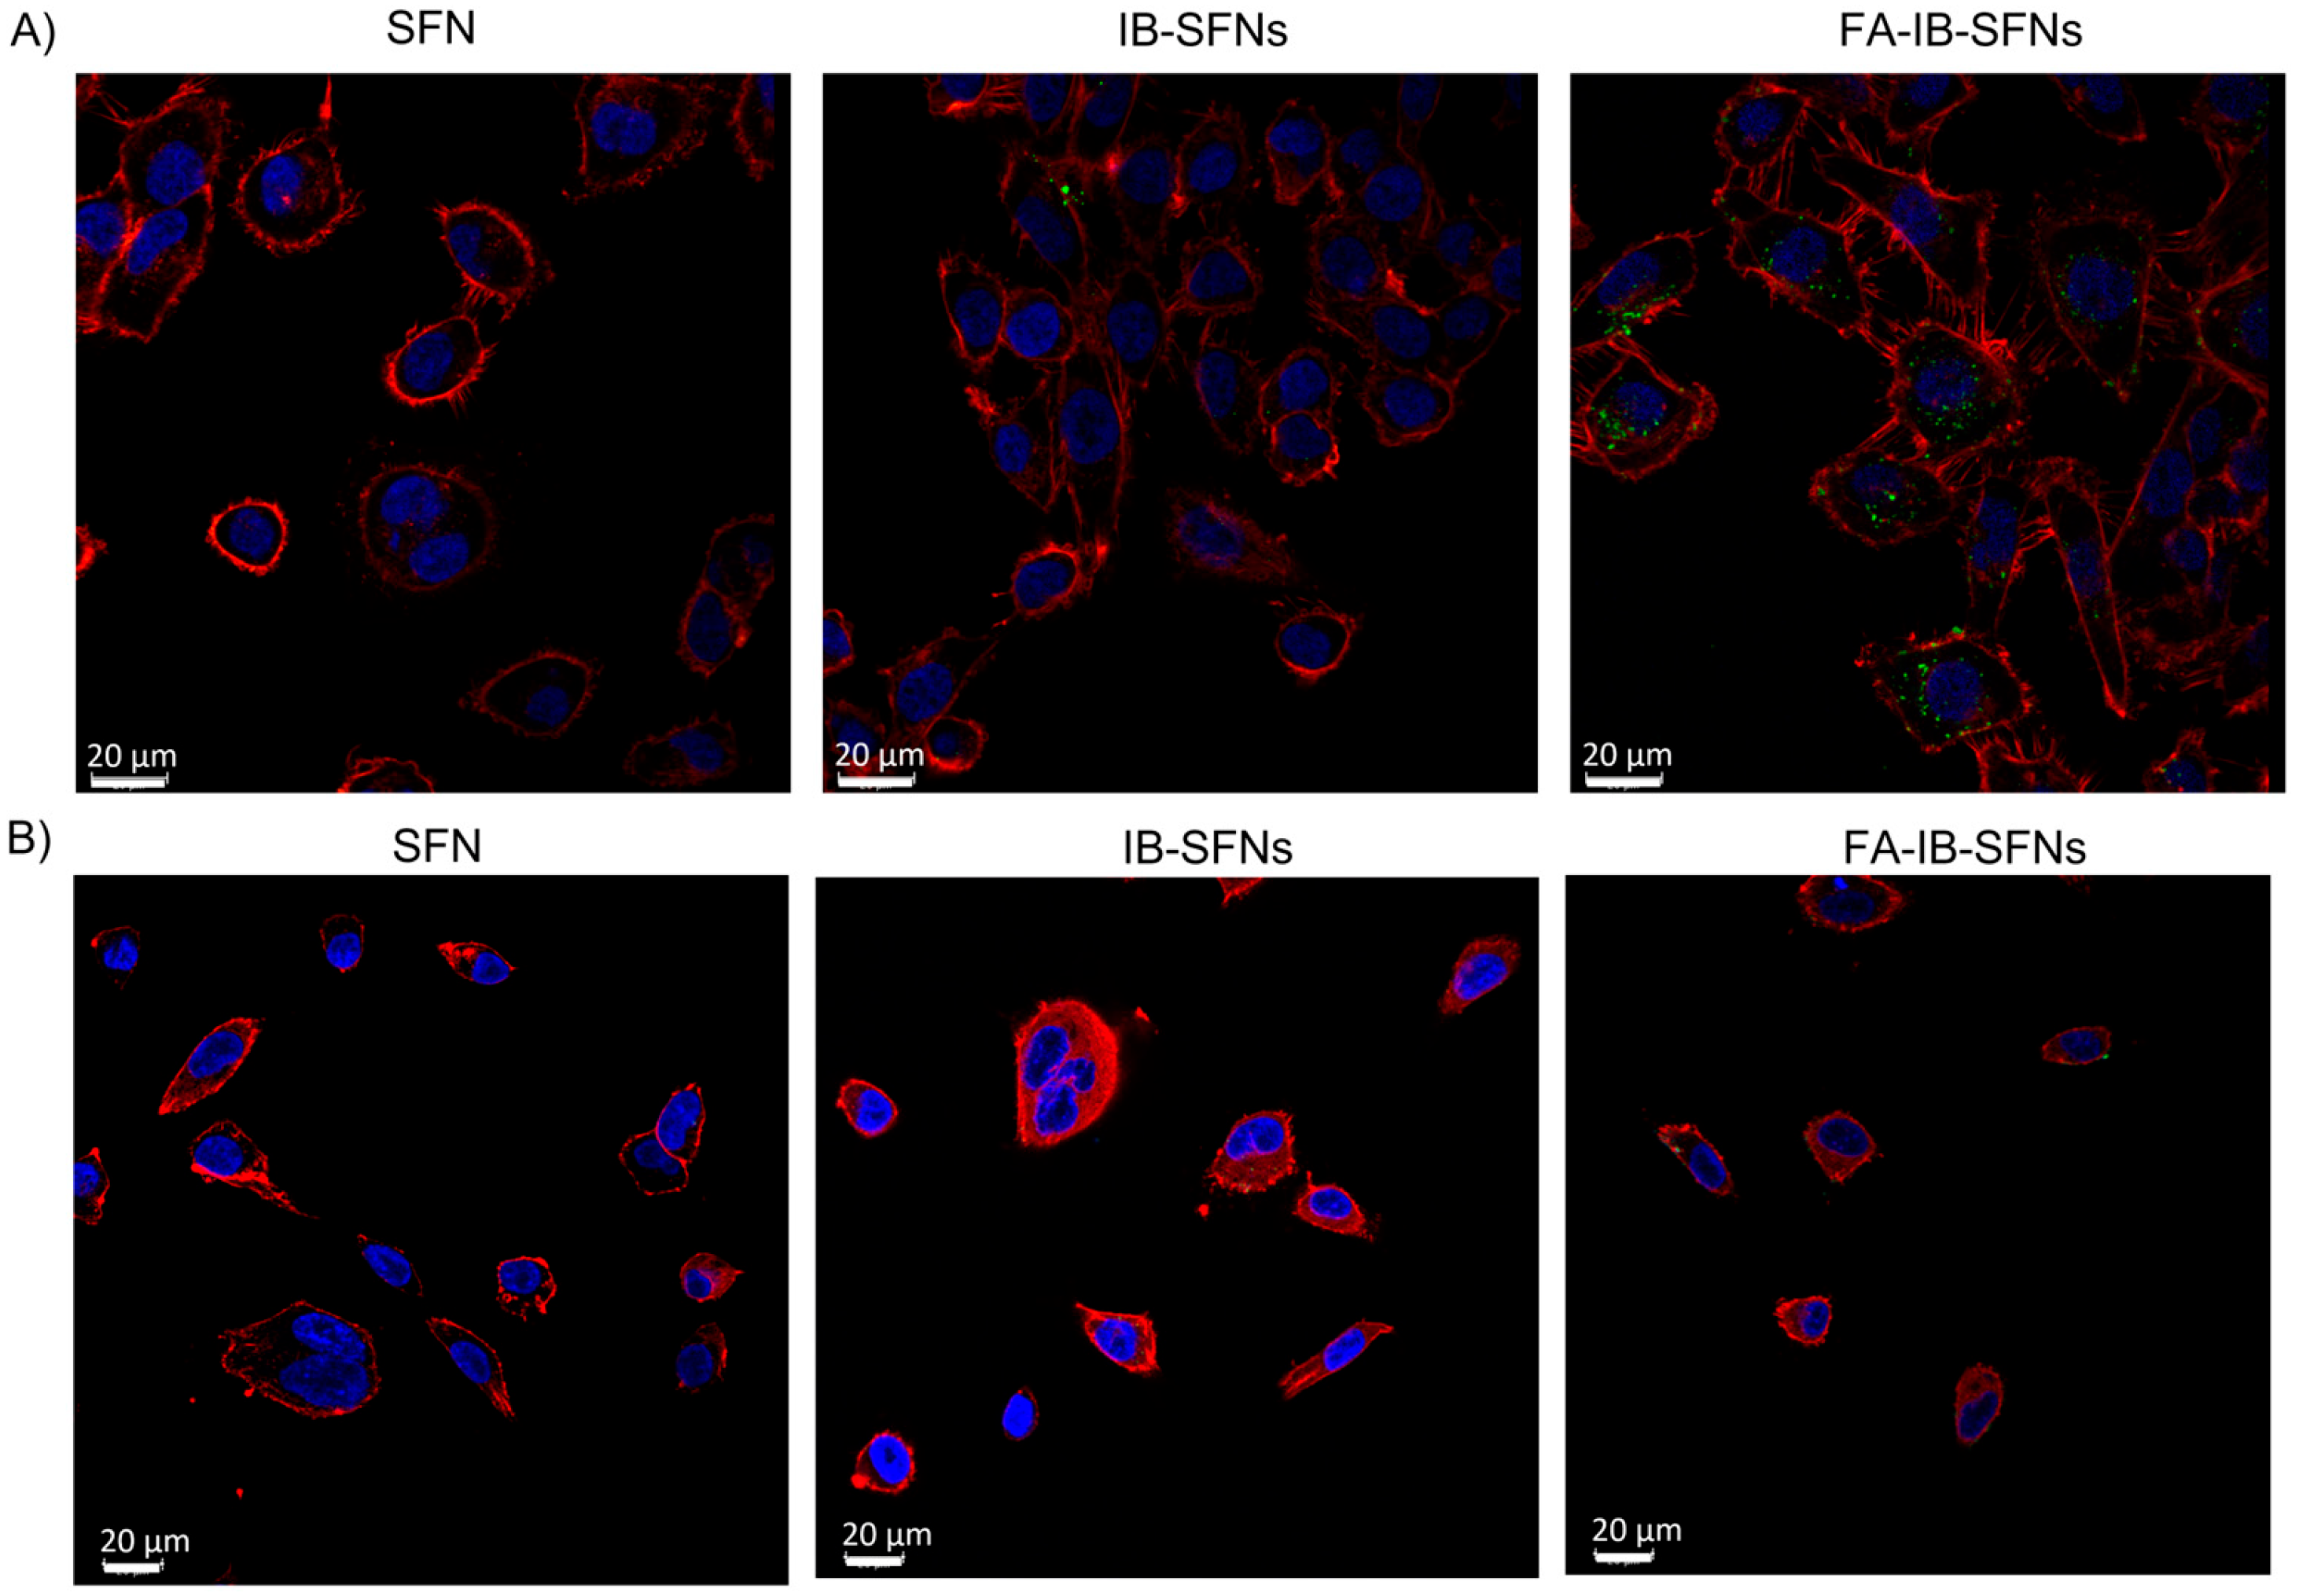
3.7. Confocal Laser Scanning Microscopy
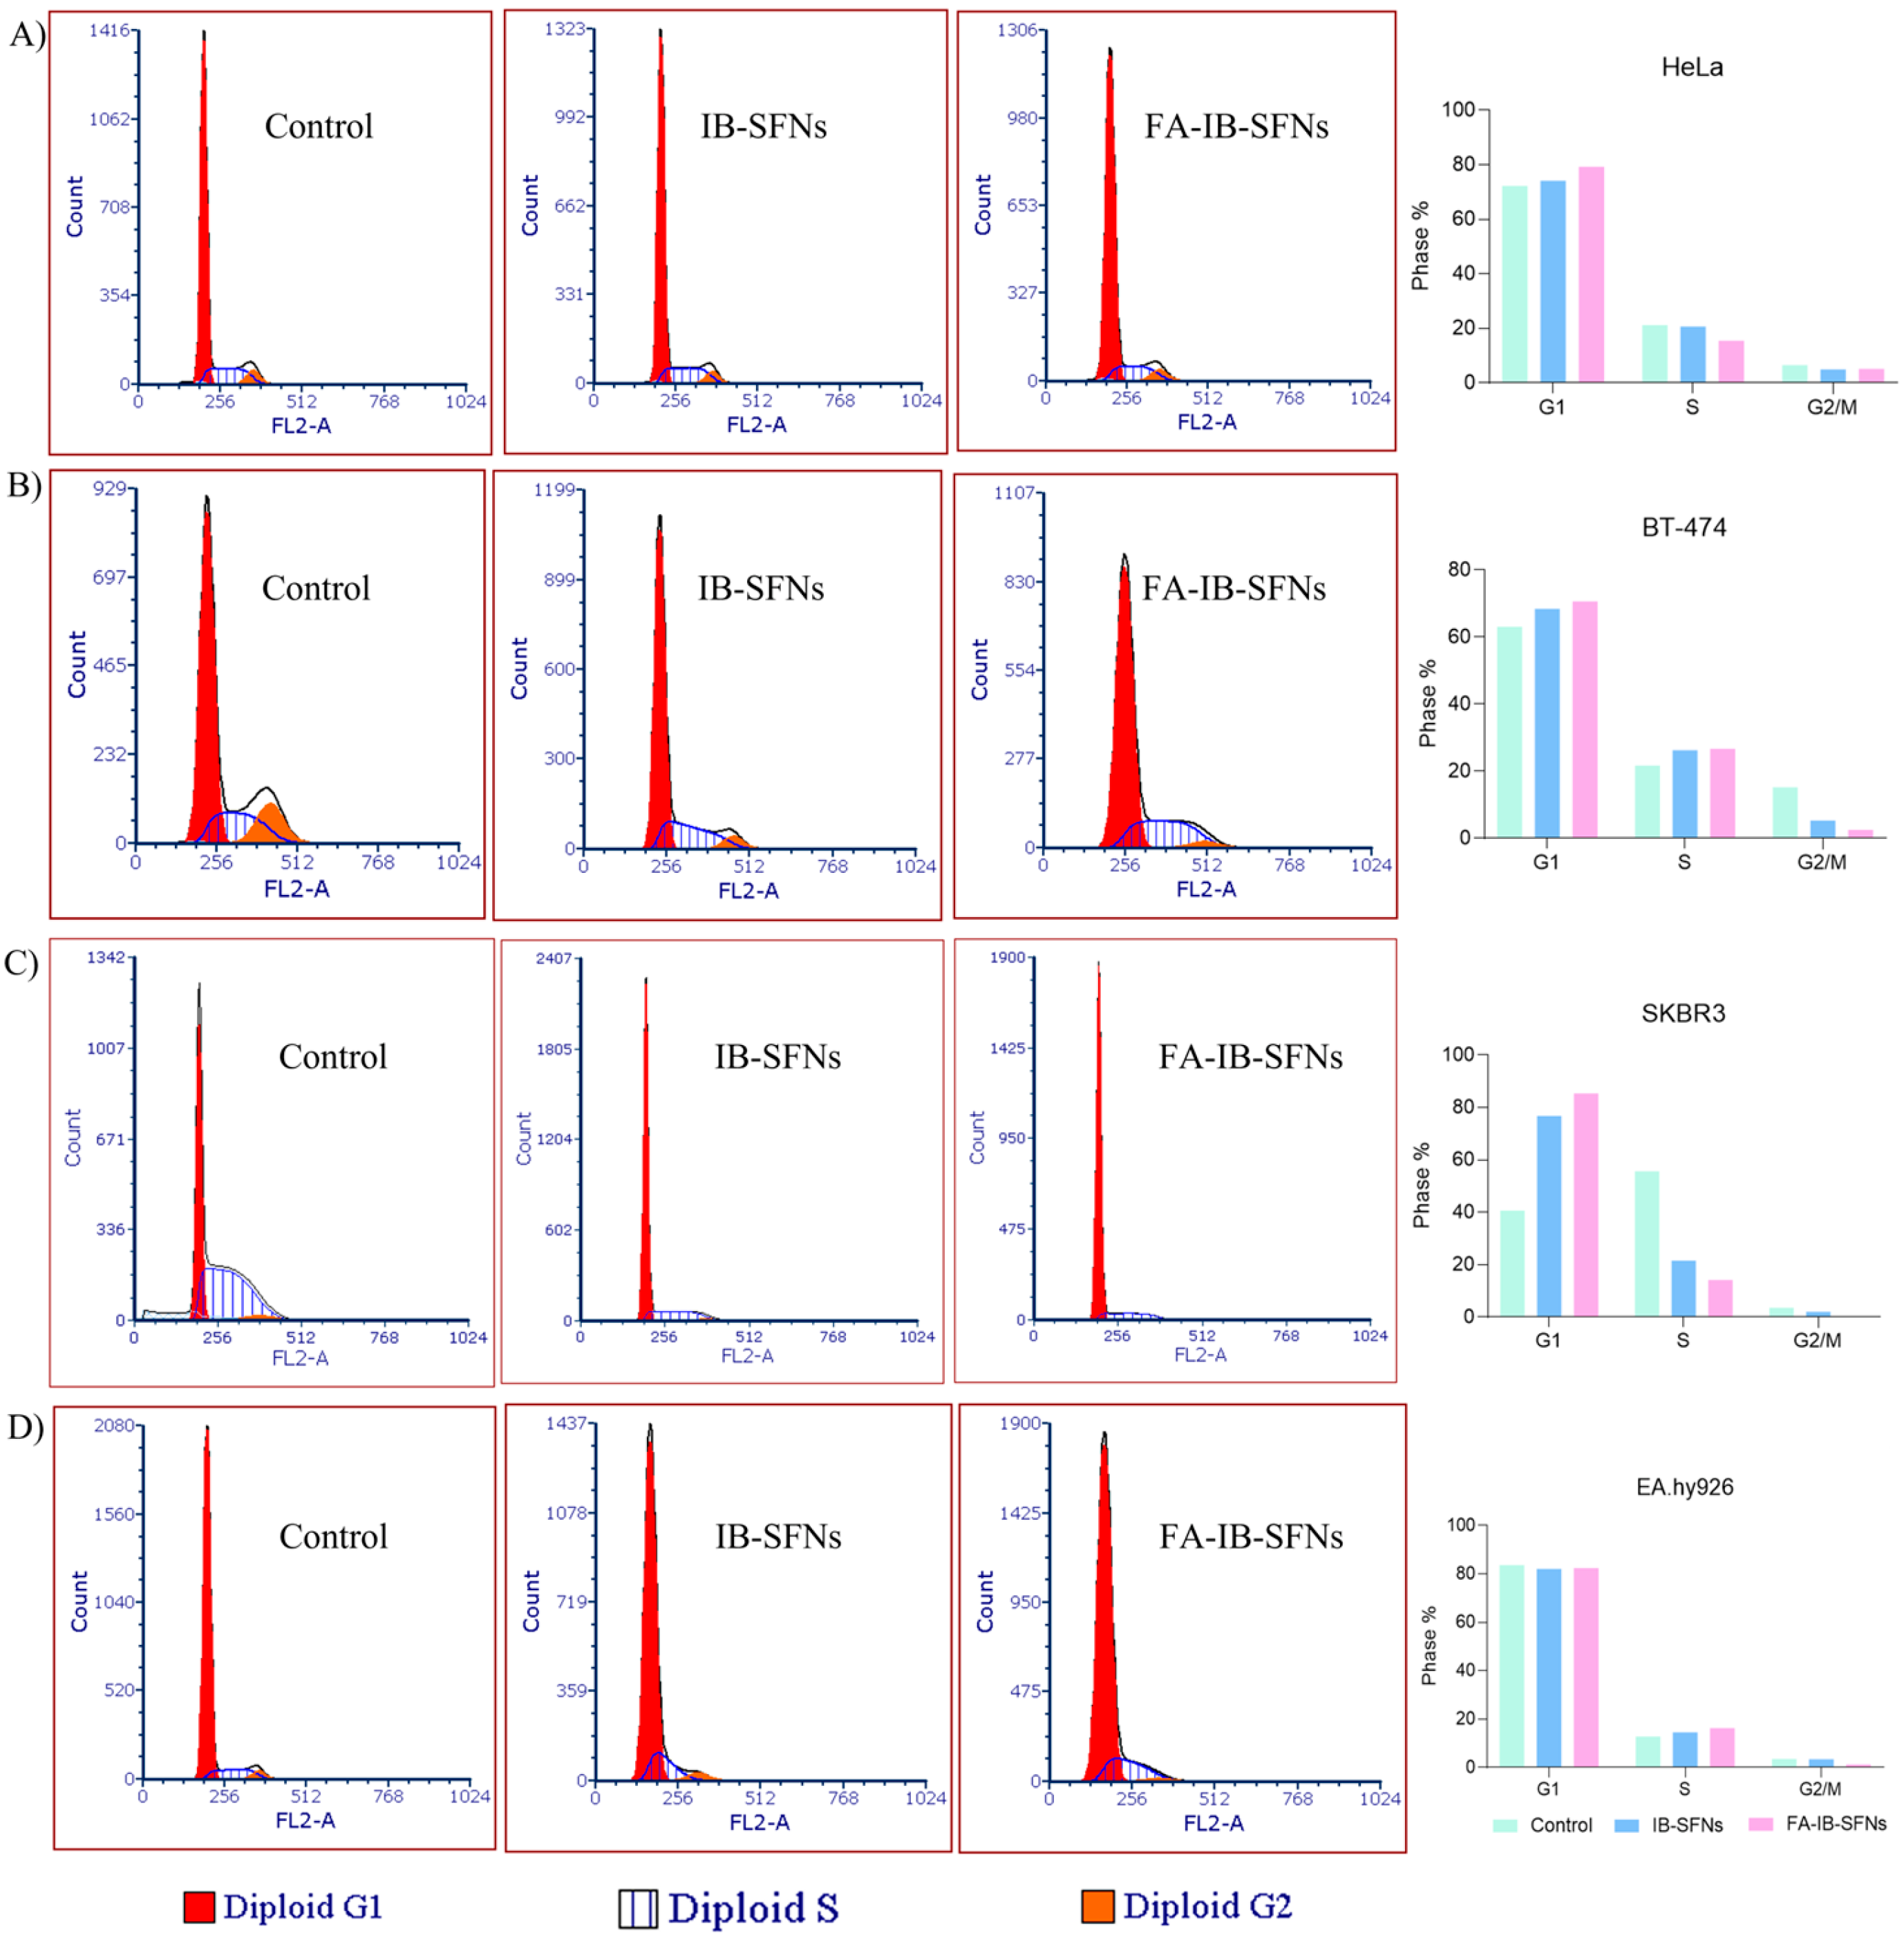
3.8. Influence of FA-IB-SFN and IB-SFN Treatments on the Cell Cycle
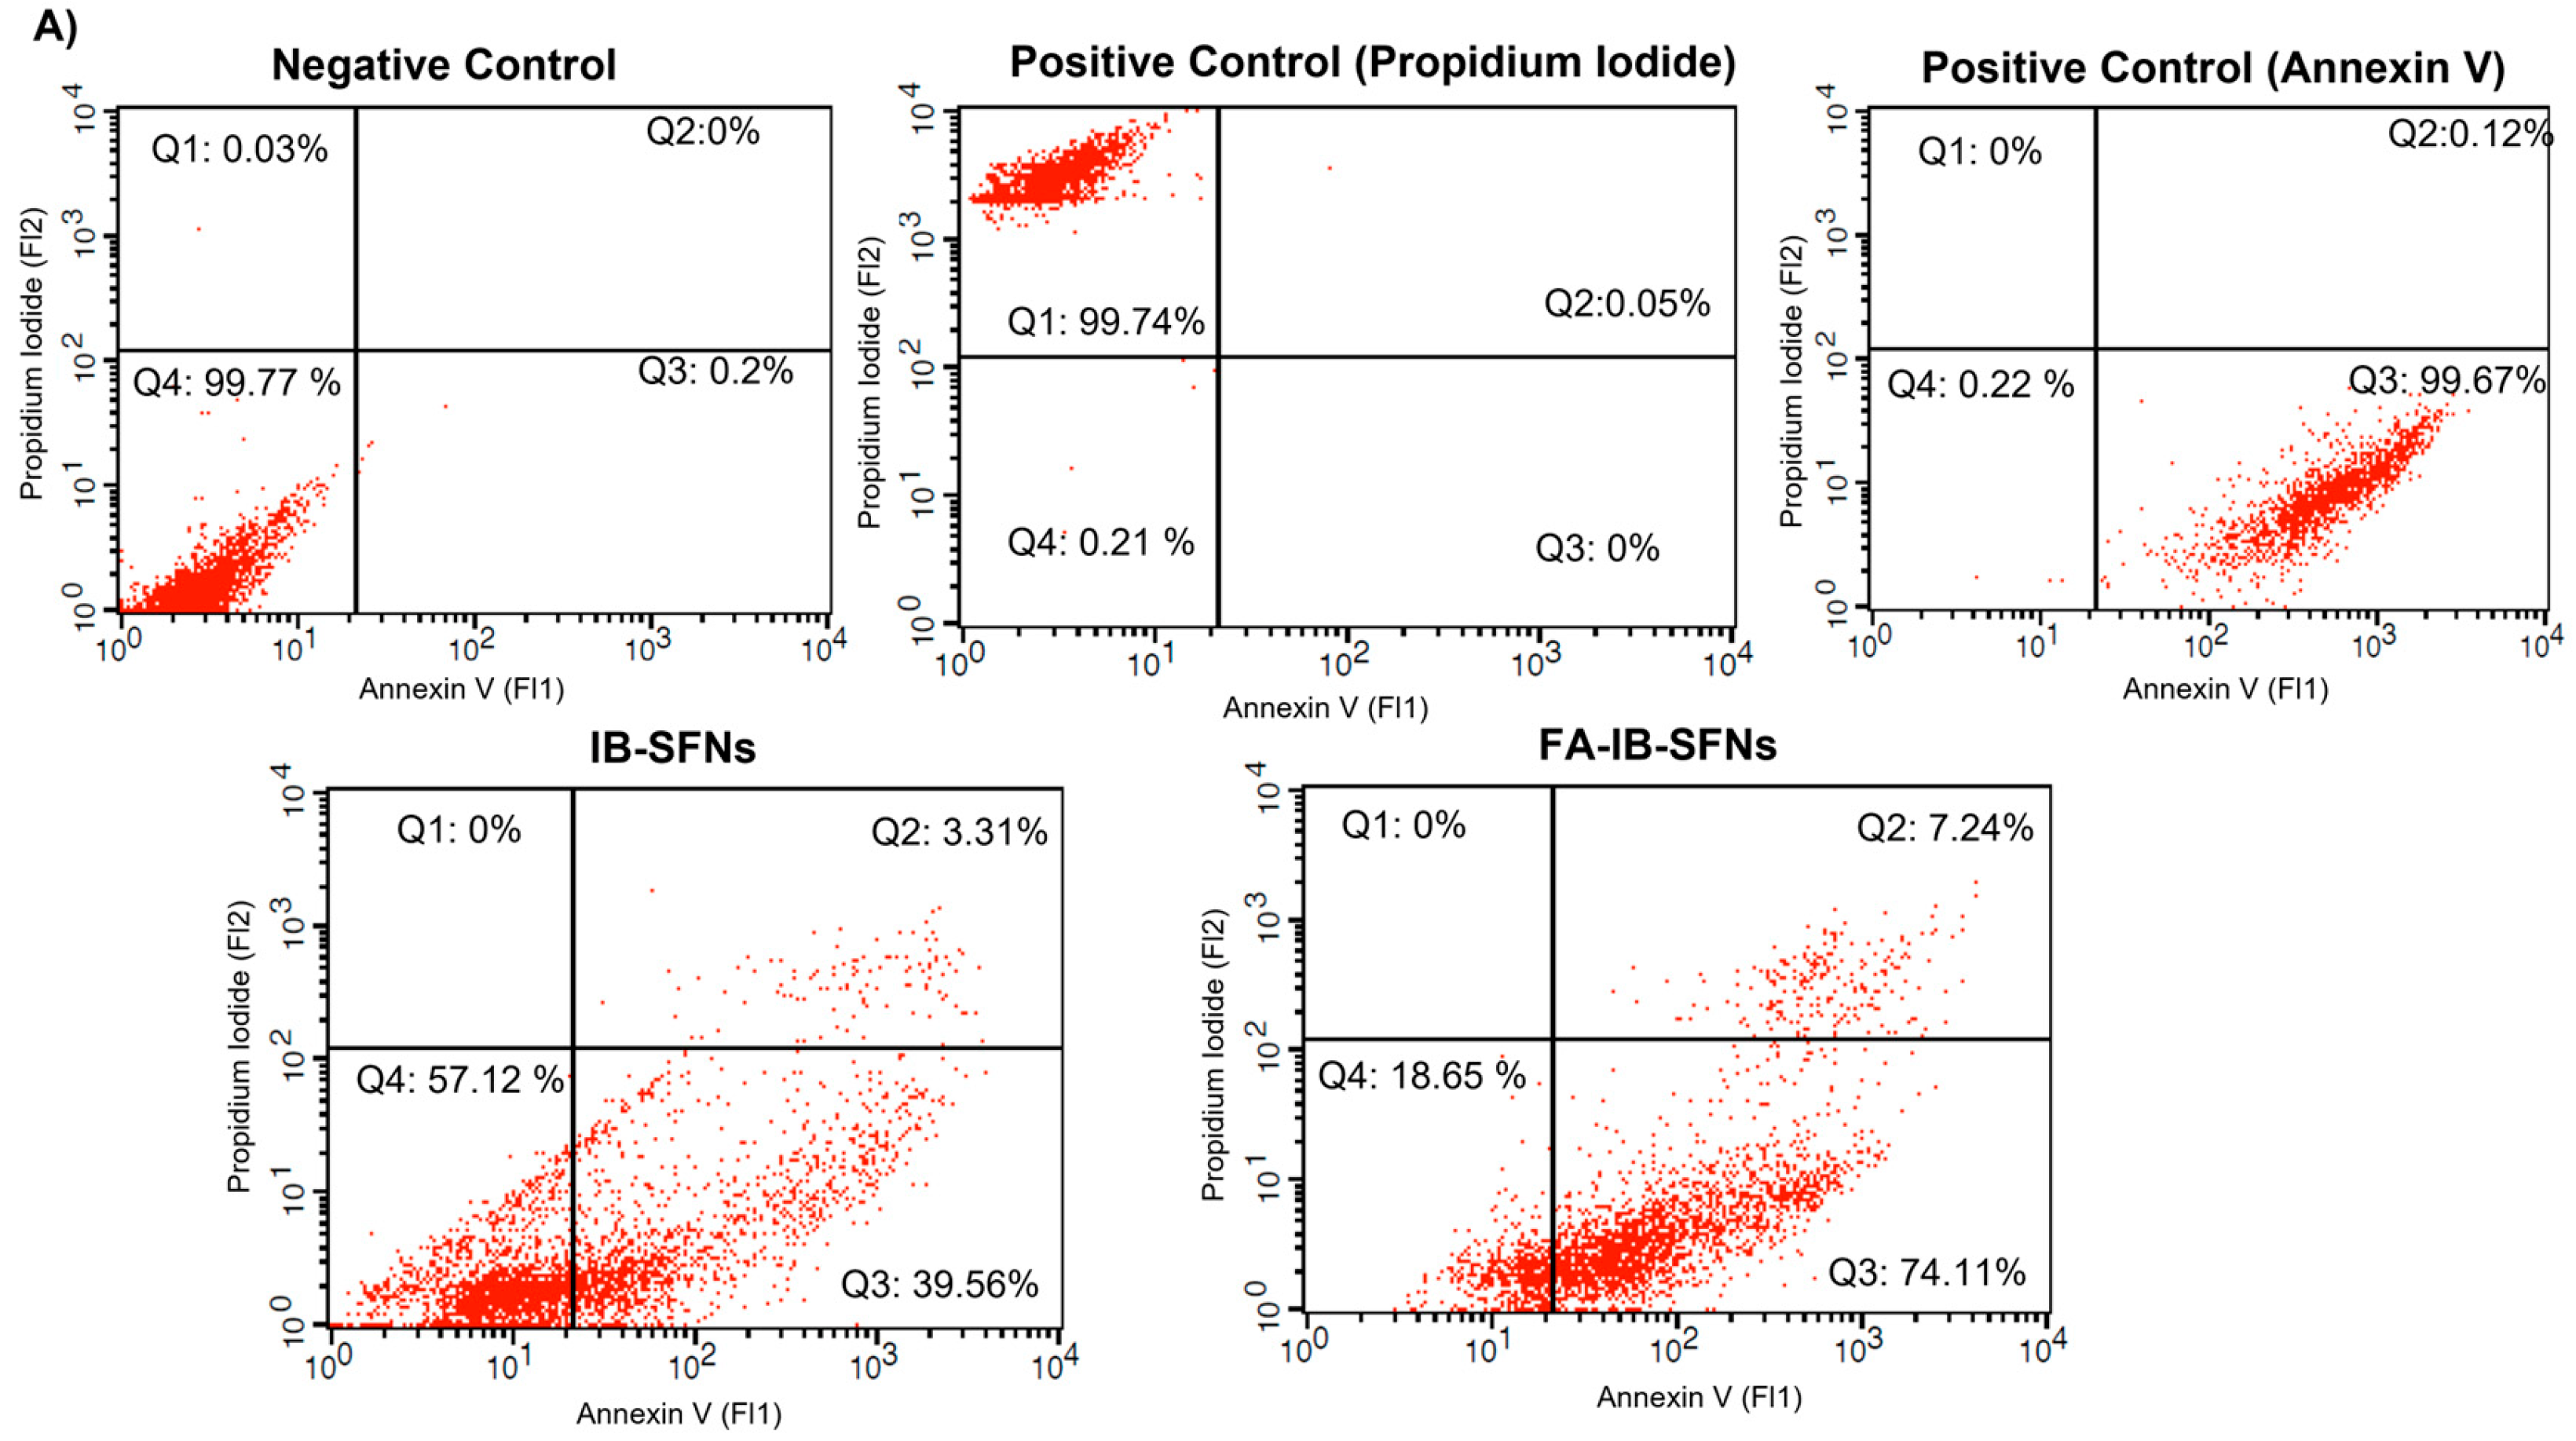
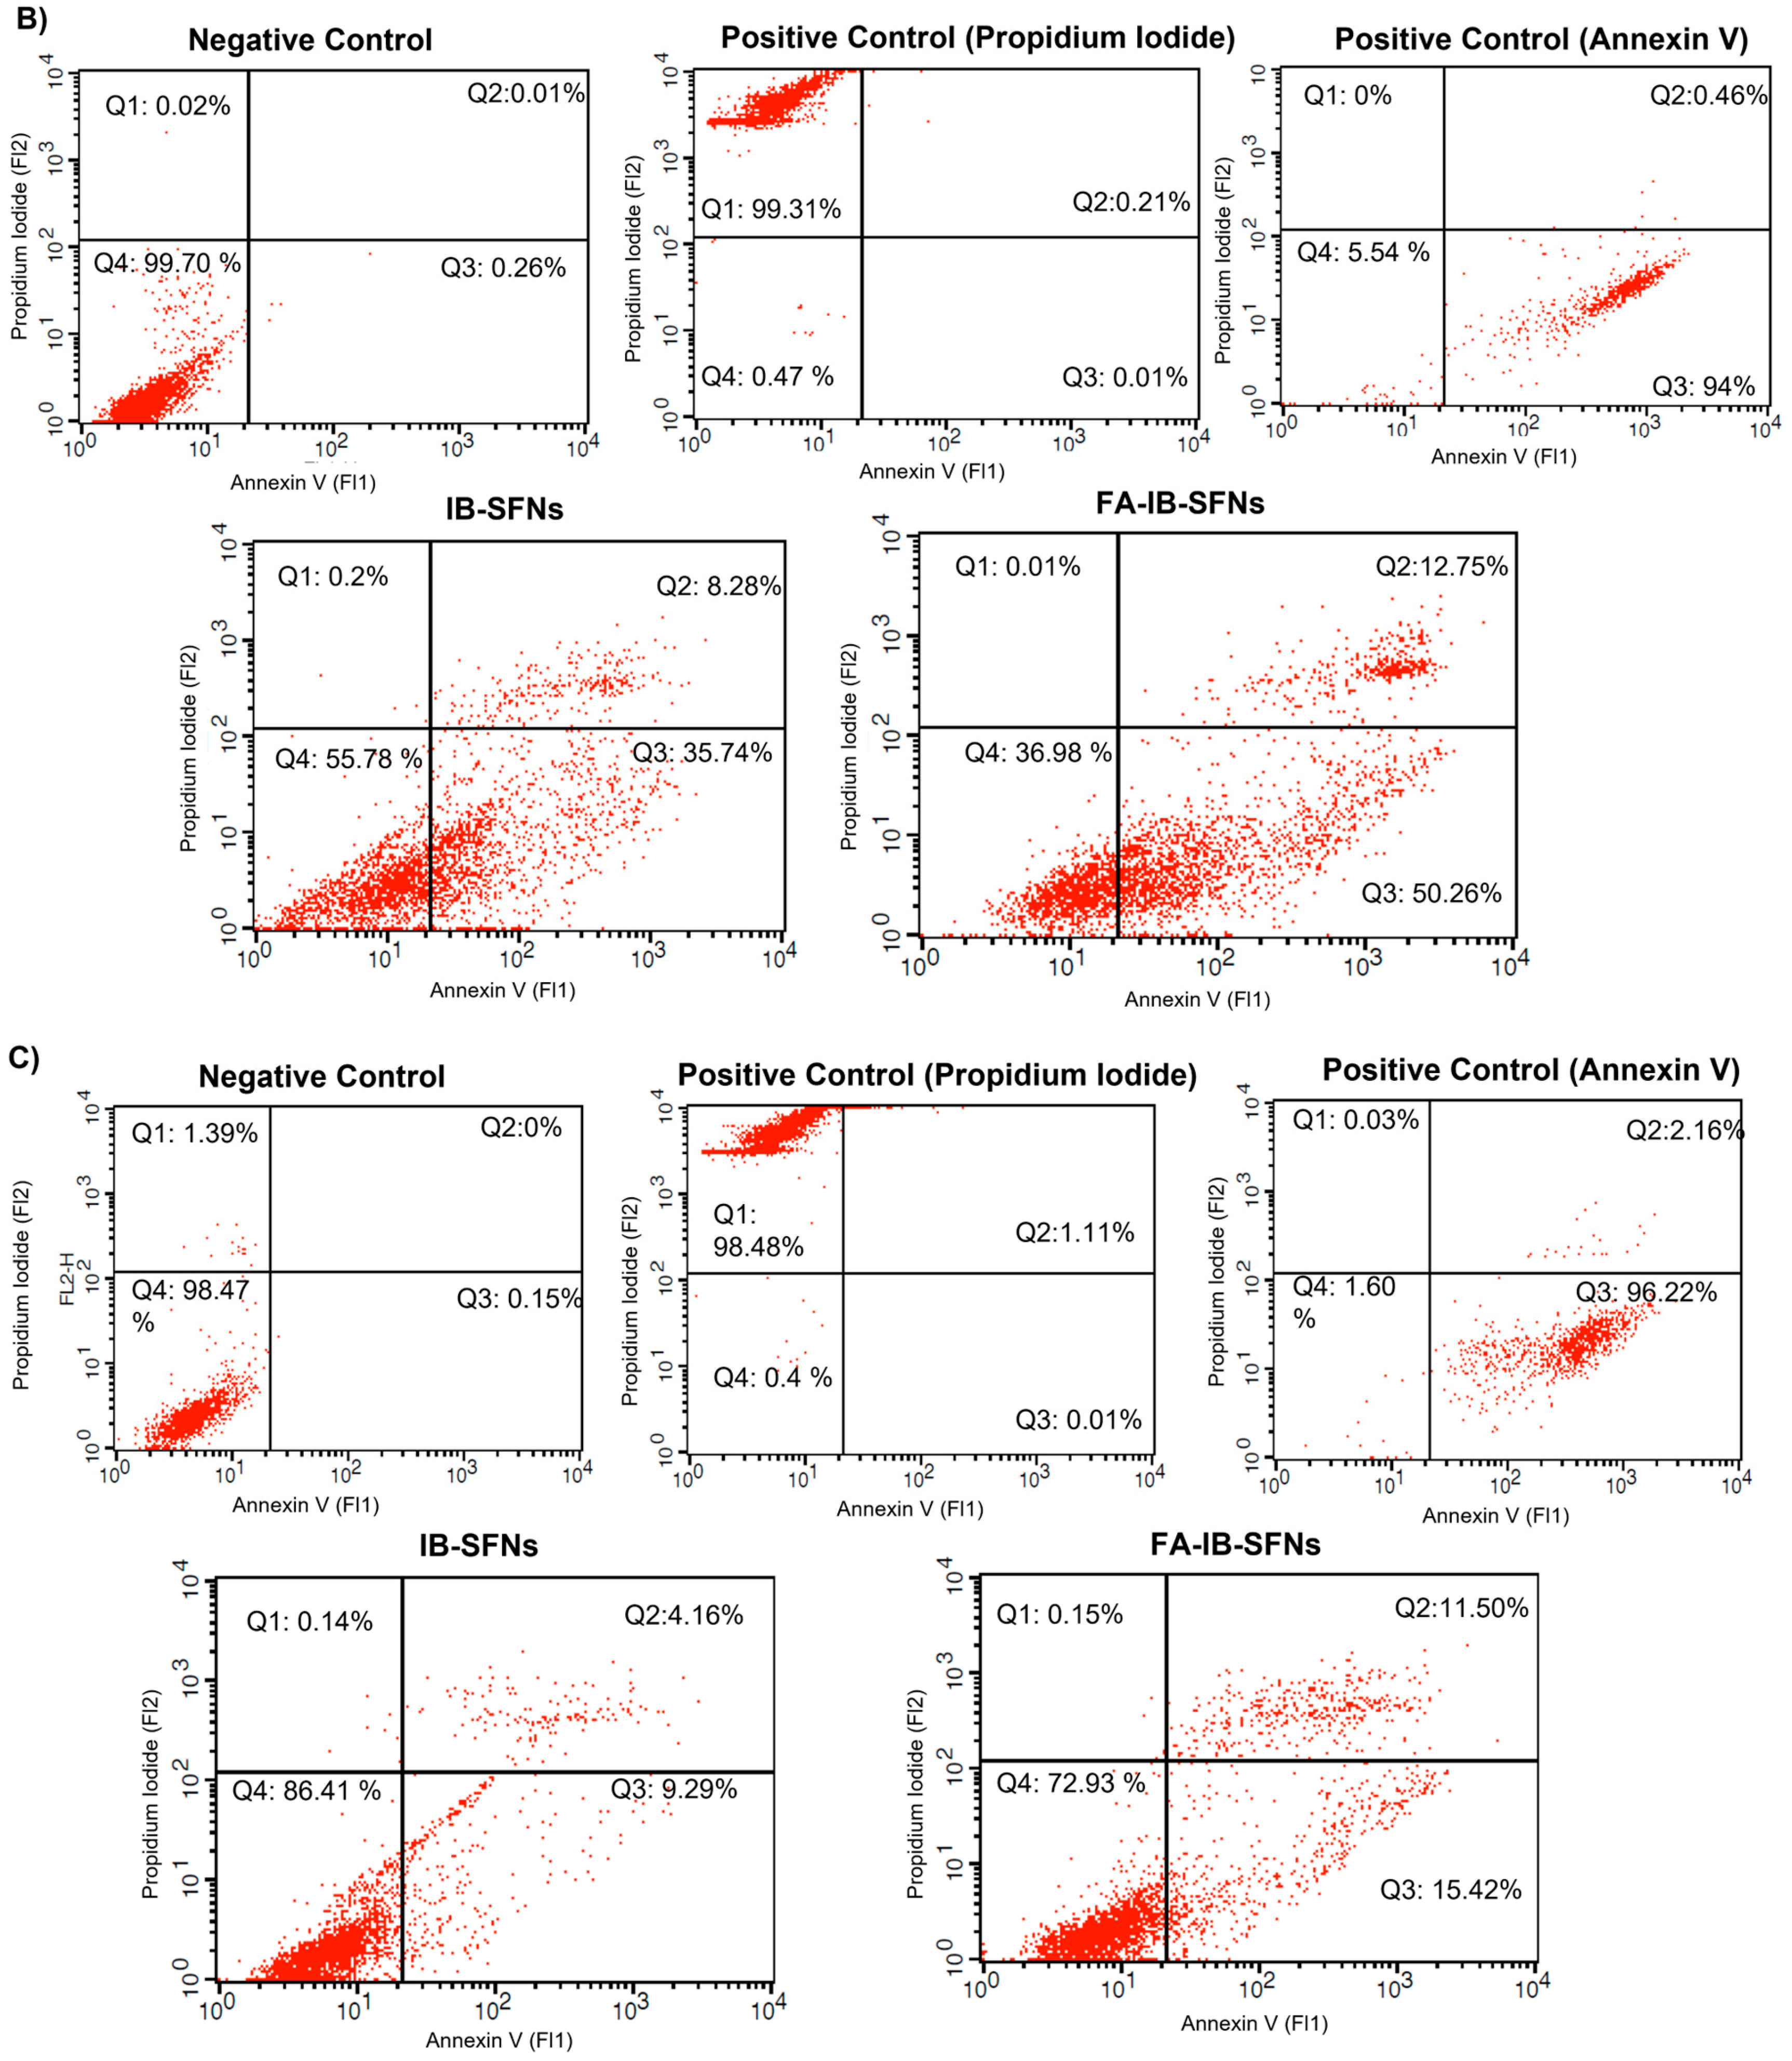
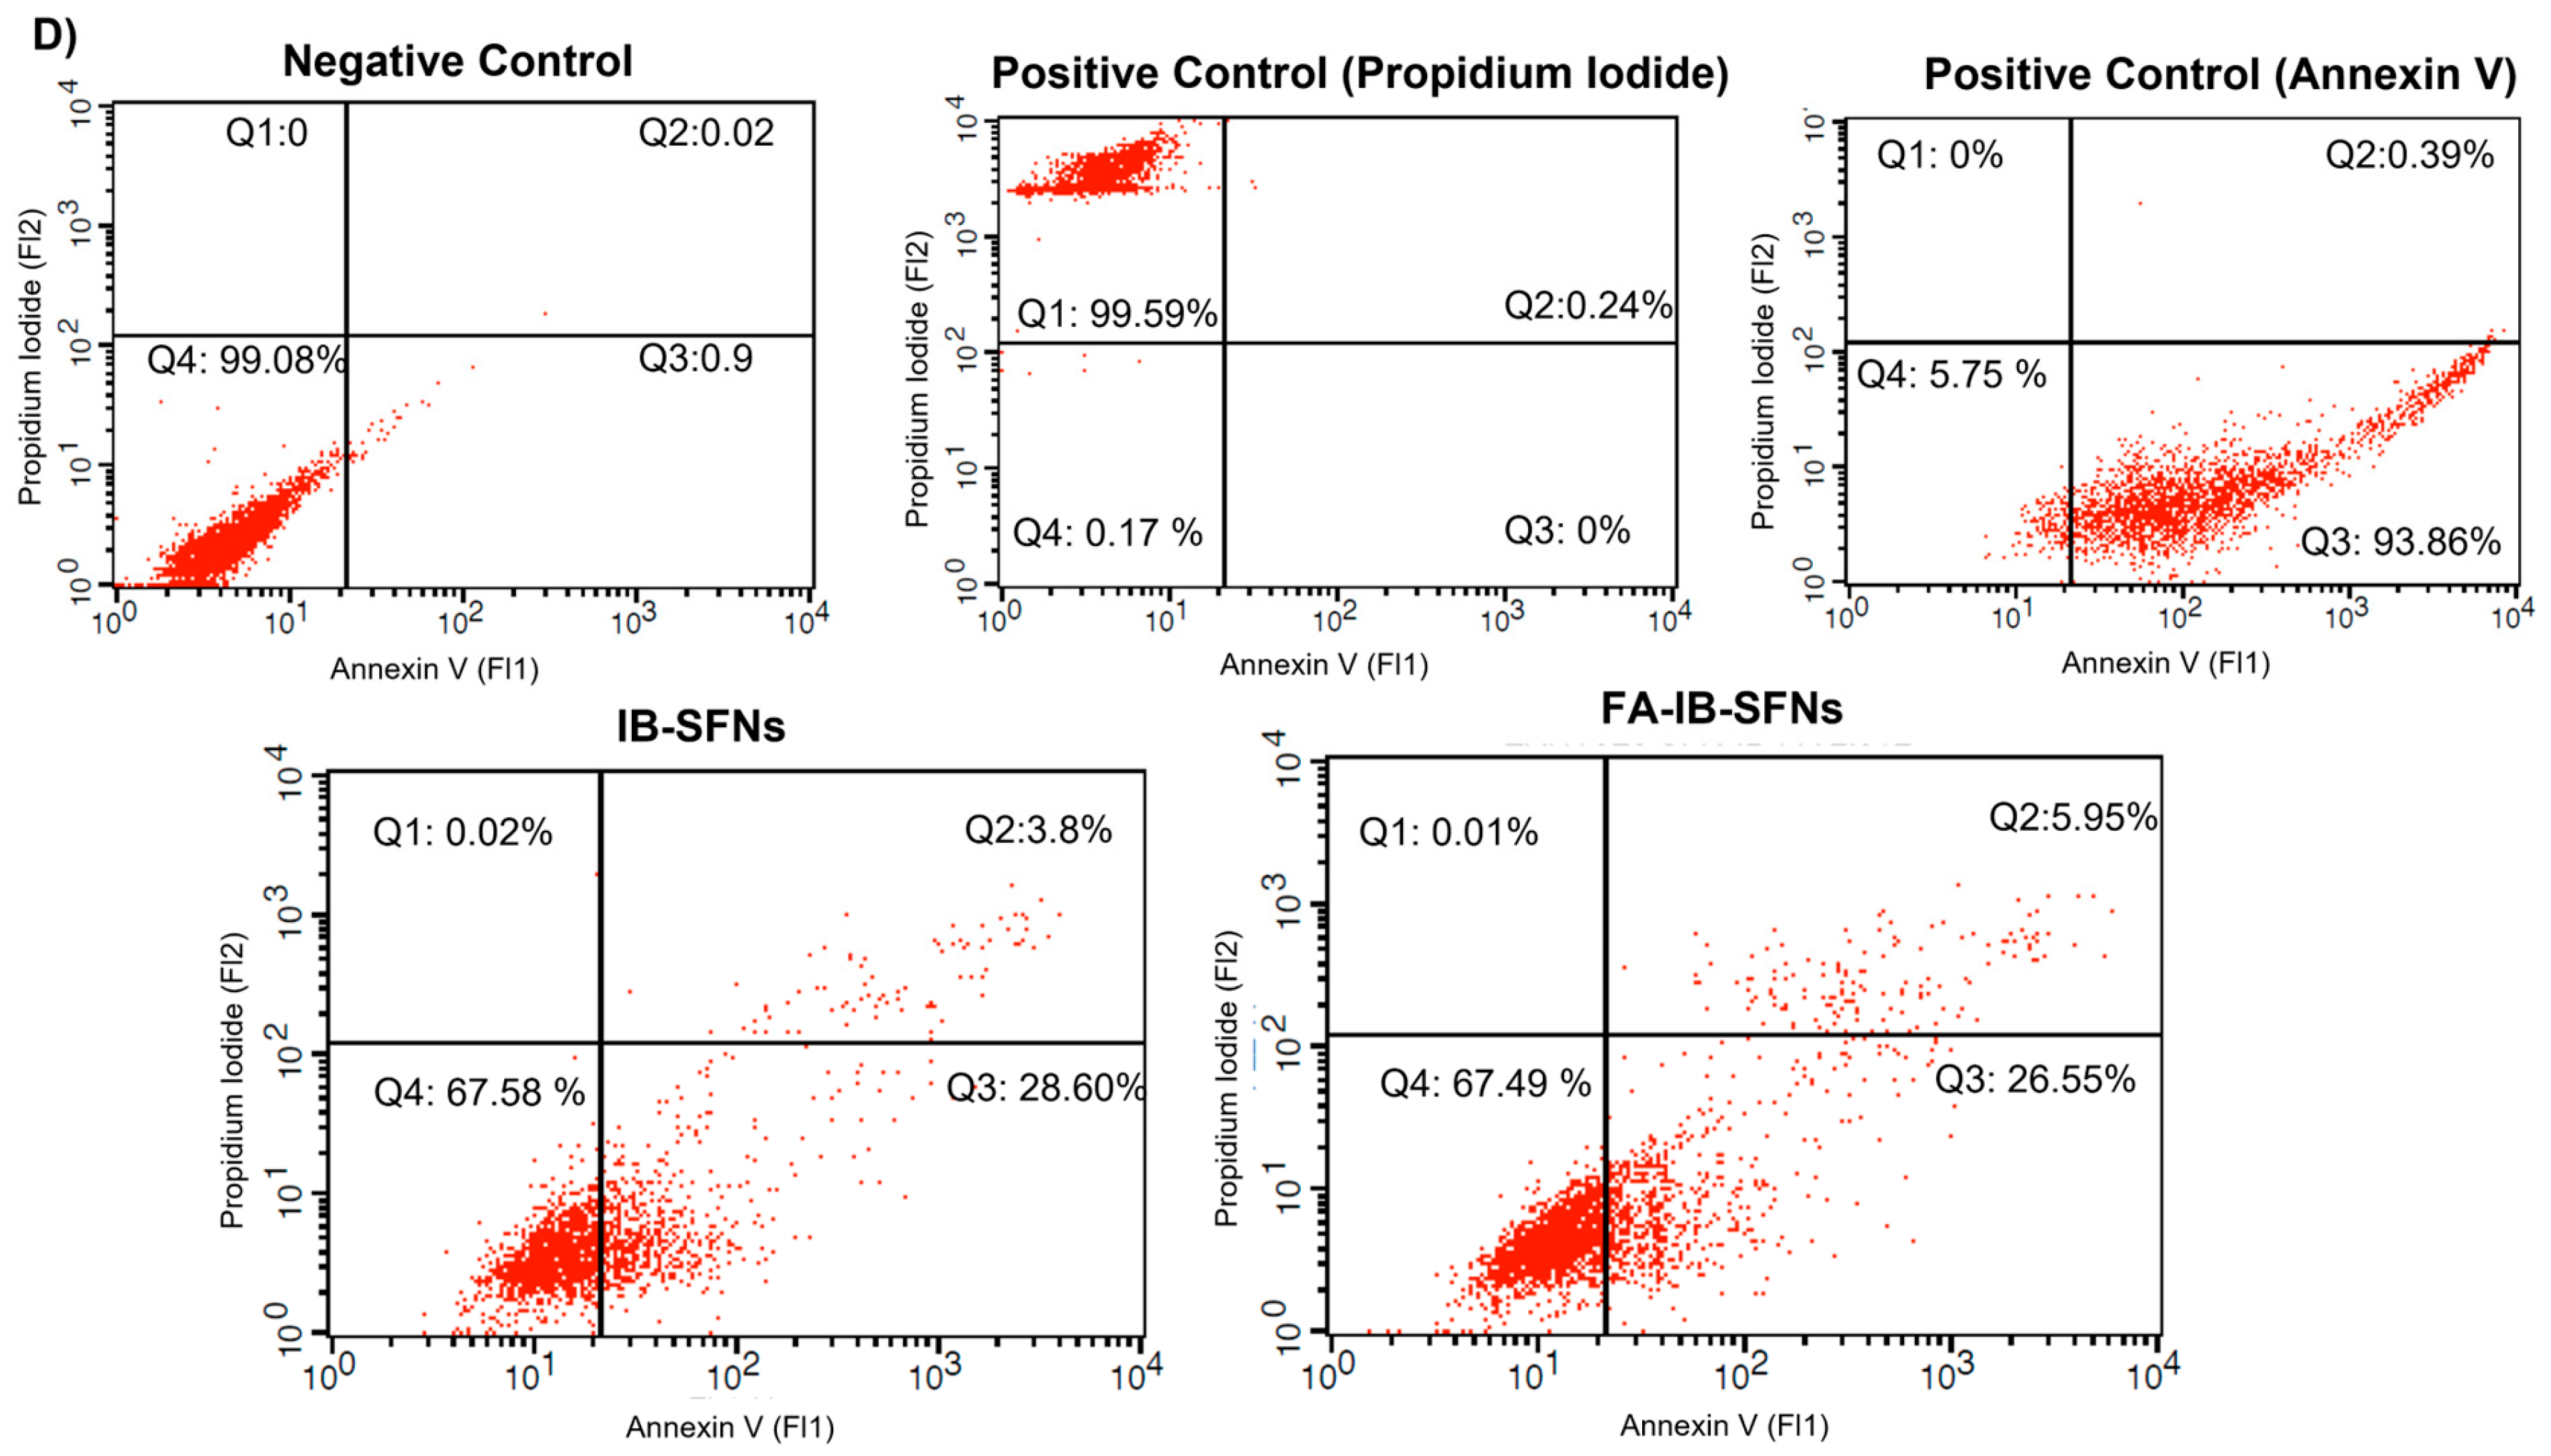
3.9. Apoptosis Assays
4. Conclusions
Supplementary Materials
Author Contributions
Funding
Institutional Review Board Statement
Informed Consent Statement
Data Availability Statement
Conflicts of Interest
References
- Gavas, S.; Quazi, S.; Karpiński, T.M. Nanoparticles for Cancer Therapy: Current Progress and Challenges. Nanoscale Res. Lett. 2021, 16, 173. [Google Scholar] [CrossRef]
- Qorri, B.; DeCarlo, A.; Mellon, M.; Szewczuk, M.R. Chapter 20—Drug delivery systems in cancer therapy. In Developments in Biomedical Engineering and Bioelectronics; E. B. T.-D. D. D., Chappel, T.S., Eds.; Academic Press: Cambridge, MA, USA, 2021; pp. 423–454. [Google Scholar]
- Yu, Z.; Gao, L.; Chen, K.; Zhang, W.; Zhang, Q.; Li, Q.; Hu, K. Nanoparticles: A New Approach to Upgrade Cancer Diagnosis and Treatment. Nanoscale Res. Lett. 2021, 16, 88. [Google Scholar] [CrossRef] [PubMed]
- Liu, Y.; Miyoshi, H.; Nakamura, M. Nanomedicine for drug delivery and imaging: A promising avenue for cancer therapy and diagnosis using targeted functional nanoparticles. Int. J. Cancer 2007, 120, 2527–2537. [Google Scholar] [CrossRef] [PubMed]
- Nishimoto-Sauceda, D.; Romero-Robles, L.E.; Antunes-Ricardo, M. Biopolymer nanoparticles: A strategy to enhance stability, bioavailability, and biological effects of phenolic compounds as functional ingredients. J. Sci. Food Agric. 2022, 102, 41–52. [Google Scholar] [CrossRef]
- Nitta, S.K.; Numata, K. Biopolymer-based nanoparticles for drug/gene delivery and tissue engineering. Int. J. Mol. Sci. 2013, 14, 1629–1654. [Google Scholar] [CrossRef] [PubMed] [Green Version]
- Sumana, M.; Thirumurugan, A.; Muthukumaran, P.; Anand, K. Biodegradable Natural Polymeric Nanoparticles as Carrier for Drug Delivery BT–Integrative Nanomedicine for New Therapies; Krishnan, A., Chuturgoon, A., Eds.; Springer International Publishing: Cham, Switzerland, 2020; pp. 231–246. [Google Scholar]
- Lozano-Pérez, A.A.; Montalbán, M.G.; Aznar-Cervantes, S.D.; Cragnolini, F.; Cenis, J.L.; Víllora, G. Production of silk fibroin nanoparticles using ionic liquids and high-power ultrasounds. J. Appl. Polym. Sci. 2014, 132, 12. [Google Scholar] [CrossRef]
- Lozano-Pérez, A.A.; Gil, A.L.; Pérez, S.A.; Cutillas, N.; Meyer, H.; Pedreño, M.; Aznar-Cervantes, S.D.; Janiak, C.; Cenis, J.L.; Ruiz, J. Antitumor properties of platinum(iv) prodrug-loaded silk fibroin nanoparticles. Dalton Trans. 2015, 44, 13513–13521. [Google Scholar] [CrossRef]
- Tian, Y.; Jiang, X.; Chen, X.; Shao, Z.; Yang, W. Doxorubicin-loaded magnetic silk fibroin nanoparticles for targeted therapy of multidrug-resistant cancer. Adv. Mater. 2014, 26, 7393–7398. [Google Scholar] [CrossRef]
- Wu, F.; Yang, M.; Qian, X.; Yu, L.; Jiang, X.; Liu, B. Facile Preparation of Paclitaxel Loaded Silk Fibroin Nanoparticles for Enhanced Antitumor E ffi cacy by Locoregional Drug Delivery. ACS Appl. Mater Interf. 2013, 5, 12638–12645. [Google Scholar] [CrossRef]
- Montalbán, M.; Coburn, J.; Lozano-Pérez, A.; Cenis, J.; Víllora, G.; Kaplan, D. Production of Curcumin-Loaded Silk Fibroin Nanoparticles for Cancer Therapy. Nanomaterials 2018, 8, 126. [Google Scholar] [CrossRef] [Green Version]
- Xue, B.; Zhang, Y.; Xu, M.; Wang, C.; Huang, J.; Zhang, H.; Li, X. Curcumin-Silk Fibroin Nanoparticles for Enhanced Anti-Candida albicans Activity In Vitro and In Vivo. J. Biomed. Nanotechnol. 2019, 15, 769–778. [Google Scholar] [CrossRef]
- Fuster, M.G.; Montalbán, M.G.; Carissimi, G.; Víllora, G. Improving Anticancer Therapy with Naringenin-Loaded Silk Fibroin Nanoparticles. Nanomaterials 2020, 10, 718. [Google Scholar] [CrossRef] [PubMed] [Green Version]
- Fuster, M.G.; Carissimi, G.; Montalbán, M.G.; Víllora, G. Antitumor Activity of Rosmarinic Acid-Loaded Silk Fibroin Nanoparticles on HeLa and MCF-7 Cells. Polymers 2021, 13, 3169. [Google Scholar] [CrossRef] [PubMed]
- Toan, P.D.; Waree, T. Fibroin nanoparticles: A promising drug delivery system. Drug Deliv. 2020, 27, 431–448. [Google Scholar]
- Lozano-Pérez, A.A.; Rivero, H.C.; Hernández, M.D.C.P.; Pagán, A.; Montalbán, M.G.; Víllora, G.; Cénis, J.L. Silk fibroin nanoparticles: Efficient vehicles for the natural antioxidant quercetin. Int. J. Pharm. 2017, 518, 11–19. [Google Scholar] [CrossRef]
- Takeuchi, I.; Shimamura, Y.; Kakami, Y.; Kameda, T.; Hattori, K. Transdermal delivery of 40-nm silk fibroin nanoparticles. Colloids Surf. B Biointerfaces 2019, 175, 564–568. [Google Scholar] [CrossRef] [PubMed]
- Gou, S.; Huang, Y.; Wan, Y.; Ma, Y.; Zhou, X.; Tong, X. Multi-bioresponsive silk fi broin-based nanoparticles with on-demand cytoplasmic drug release capacity for CD44-targeted alleviation of ulcerative colitis. Biomaterials 2019, 212, 39–54. [Google Scholar] [CrossRef]
- Chomchalao, P.; Nimtrakul, P.; Pham, D.T.; Tiyaboonchai, W. Development of amphotericin B-loaded fibroin nanoparticles: A novel approach for topical ocular application. J. Mater. Sci. 2020, 55, 5268–5279. [Google Scholar] [CrossRef]
- Besheli, N.H.; Mottaghitalab, F.; Eslami, M.; Gholami, M.; Kundu, S.C.; Kaplan, D.L.; Farokhi, M. Sustainable Release of Vancomycin from Silk Fibroin Nanoparticles for Treating Severe Bone Infection in Rat Tibia Osteomyelitis Model. ACS Appl. Mater Interf. 2017, 9, 5128–5138. [Google Scholar] [CrossRef]
- Subia, B.; Dey, T.; Sharma, S.; Kundu, S.C. Target Specific Delivery of Anticancer Drug in Silk Fibroin Based 3D Distribution Model of Bone–Breast Cancer Cells. ACS Appl. Mater. Interfaces 2015, 7, 2269–2279. [Google Scholar] [CrossRef]
- Maekawa, T.; Nakajima, A.; Kawata, H. Folic Acid. Nihon Rinsho. Jpn. J. Clin. Med. 1999, 57, 2254–2260. [Google Scholar]
- Liu, F.; Lan, M.; Ren, B.; Li, L.; Zou, T.; Kong, Z.; Fan, D.; Cai, T.; Cai, Y. Baicalin-loaded folic acid-modified albumin nanoparticles (FA-BSANPs/BA) induce autophagy in MCF-7 cells via ROS-mediated p38 MAPK and Akt/mTOR pathway. Cancer Nanotechnol. 2022, 13, 2. [Google Scholar] [CrossRef]
- Pourradi, N.M.A.; Babaei, H.; Hamishehkar, H.; Baradaran, B.; Shokouhi-Gogani, B.; Shanehbandi, D.; Azarmi, Y. Targeted delivery of doxorubicin by Thermo/pH-responsive magnetic nanoparticles in a rat model of breast cancer. Toxicol. Appl. Pharmacol. 2022, 446, 116036. [Google Scholar] [CrossRef] [PubMed]
- Geethakumari, D.; Sathyabhama, A.B.; Sathyan, K.R.; Mohandas, D.; Somasekharan, J.V.; Puthiyedathu, S.T. Folate functionalized chitosan nanoparticles as targeted delivery systems for improved anticancer efficiency of cytarabine in MCF-7 human breast cancer cell lines. Int. J. Biol. Macromol. 2022, 199, 150–161. [Google Scholar] [CrossRef] [PubMed]
- Subia, B.; Chandra, S.; Talukdar, S.; Kundu, S.C. Folate conjugated silk fibroin nanocarriers for targeted drug delivery. Integr. Biol. 2014, 6, 203–214. [Google Scholar] [CrossRef]
- Sun, N.; Lei, R.; Xu, J.; Kundu, S.C.; Cai, Y.; Yao, J.; Ni, Q. Fabricated porous silk fibroin particles for pH-responsive drug delivery and targeting of tumor cells. J. Mater. Sci. 2019, 54, 3319–3330. [Google Scholar] [CrossRef]
- Schlenk, R.F.; Kayser, S. Ibrutinib. Recent Results Cancer Res. 2018, 212, 133–168. [Google Scholar]
- Mohamed, A.J.; Yu, L.; Bäckesjö, C.-M.; Vargas, L.; Faryal, R.; Aints, A.; Christensson, B.; Berglöf, A.; Vihinen, M.; Nore, B.F.; et al. Bruton’s tyrosine kinase (Btk): Function, regulation, and transformation with special emphasis on the PH domain. Immunol. Rev. 2009, 228, 58–73. [Google Scholar] [CrossRef]
- Kitanaka, D.; Mano, A.; Conley, H.; Campana, M.E. Expression and activation of the nonreceptor tyrosine kinase Tec in human B cells. Blood 1998, 91, 3940–3948. [Google Scholar] [CrossRef] [Green Version]
- Honigberg, L.A.; Smith, A.M.; Sirisawad, M.; Verner, E.; Loury, D.; Chang, B.; Li, S.; Pan, Z.; Thamm, D.H.; Miller, R.A.; et al. The Bruton tyrosine kinase inhibitor PCI-32765 blocks B-cell activation and is efficacious in models of autoimmune disease and B-cell malignancy. Proc. Natl. Acad. Sci. USA 2010, 107, 13075–13080. [Google Scholar] [CrossRef] [Green Version]
- Grabinski, N.; Ewald, F. Ibrutinib (ImbruvicaTM) potently inhibits ErbB receptor phosphorylation and cell viability of ErbB2-positive breast cancer cells. Investig. New Drugs 2014, 32, 1096–1104. [Google Scholar] [CrossRef]
- Arteaga, C.L.; Engelman, J.A. ERBB receptors: From oncogene discovery to basic science to mechanism-based cancer therapeutics. Cancer Cell 2014, 25, 282–303. [Google Scholar] [CrossRef] [Green Version]
- Paydas, S. Management of adverse effects/toxicity of ibrutinib. Crit. Rev. Oncol. Hematol. 2019, 136, 56–63. [Google Scholar] [CrossRef]
- Li, D.; Chen, F.; Ding, J.; Lin, N.; Li, Z.; Wang, X. Knockdown of HIP1 expression promotes ligand-induced endocytosis of EGFR in HeLa cells. Oncol. Rep. 2017, 38, 3387–3391. [Google Scholar] [CrossRef] [PubMed] [Green Version]
- Neve, R.M.; Chin, K.; Fridlyand, J.; Yeh, J.; Baehner, F.L.; Fevr, T.; Gray, J.W. A collection of breast cancer cell lines for the study of functionally. Cancer Cell 2009, 10, 515–527. [Google Scholar] [CrossRef] [Green Version]
- Schwarzbich, M.A.; Witzens-Harig, M. Ibrutinib. Recent Results Cancer Res. 2014, 201, 259–267. [Google Scholar]
- Yang, S.-J.; Lin, F.-H.; Tsai, K.-C.; Wei, M.-F.; Tsai, H.-M.; Wong, J.-M.; Shieh, M.-J. Folic acid-conjugated chitosan nanoparticles enhanced protoporphyrin IX accumulation in colorectal cancer cells. Bioconjug. Chem. 2010, 21, 679–689. [Google Scholar] [CrossRef]
- Horo, H.; Bhattacharyya, S.; Mandal, B.; Kundu, L.M. Synthesis of functionalized silk-coated chitosan-gold nanoparticles and microparticles for target-directed delivery of antitumor agents. Carbohydr. Polym. 2021, 258, 117659. [Google Scholar] [CrossRef] [PubMed]
- Shah, D.; Guo, Y.; Ocando, J.; Shao, J. FITC labeling of human insulin and transport of FITC-insulin conjugates through MDCK cell monolayer. J. Pharm. Anal. 2019, 9, 400–405. [Google Scholar] [CrossRef] [PubMed]
- Carissimi, G.; Montalbán, M.G.; Víllora, G.; Barth, A. Direct quantification of drug loading content in polymeric nanoparticles by infrared spectroscopy. Pharmaceutics 2020, 12, 912. [Google Scholar] [CrossRef] [PubMed]
- Xia, J.M.; Wei, X.; Chen, X.W.; Shu, Y.; Wang, J.H. Folic acid modified copper nanoclusters for fluorescent imaging of cancer cells with over-expressed folate receptor. Microchim. Acta 2018, 185, 205. [Google Scholar] [CrossRef] [PubMed]
- Pérez, S.A.; Montalbán, M.G.; Carissimi, G.; Licence, P.; Víllora, G. In vitro cytotoxicity assessment of monocationic and dicationic pyridinium-based ionic liquids on HeLa, MCF-7, BGM and EA.hy926 cell lines. J. Hazard. Mater. 2020, 385, 121513. [Google Scholar] [CrossRef] [PubMed]
- Chen, J.; Kinoshita, T.; Sukbuntherng, J.; Chang, B.Y.; Elias, L. Ibrutinib inhibits ERBB receptor tyrosine kinases and HER2-amplified breast cancer cell growth. Mol. Cancer Ther. 2016, 15, 2835–2844. [Google Scholar] [CrossRef] [PubMed] [Green Version]
- Prabaharan, C.B.; Yang, A.B.; Chidambaram, D.; Rajamanickam, K.; Napper, S.; Sakharkar, M.K. Ibrutinib as a potential therapeutic option for HER2 overexpressing breast cancer—The role of STAT3 and p21. Investig. New Drugs 2020, 38, 909–921. [Google Scholar] [CrossRef]


Disclaimer/Publisher’s Note: The statements, opinions and data contained in all publications are solely those of the individual author(s) and contributor(s) and not of MDPI and/or the editor(s). MDPI and/or the editor(s) disclaim responsibility for any injury to people or property resulting from any ideas, methods, instructions or products referred to in the content. |
© 2023 by the authors. Licensee MDPI, Basel, Switzerland. This article is an open access article distributed under the terms and conditions of the Creative Commons Attribution (CC BY) license (https://creativecommons.org/licenses/by/4.0/).
Share and Cite
Fuster, M.G.; Montalbán, M.G.; Moulefera, I.; Víllora, G.; Kaplan, D.L. Folic Acid-Modified Ibrutinib-Loaded Silk Fibroin Nanoparticles for Cancer Cell Therapy with Over-Expressed Folate Receptor. Pharmaceutics 2023, 15, 1186. https://doi.org/10.3390/pharmaceutics15041186
Fuster MG, Montalbán MG, Moulefera I, Víllora G, Kaplan DL. Folic Acid-Modified Ibrutinib-Loaded Silk Fibroin Nanoparticles for Cancer Cell Therapy with Over-Expressed Folate Receptor. Pharmaceutics. 2023; 15(4):1186. https://doi.org/10.3390/pharmaceutics15041186
Chicago/Turabian StyleFuster, Marta G., Mercedes G. Montalbán, Imane Moulefera, Gloria Víllora, and David L. Kaplan. 2023. "Folic Acid-Modified Ibrutinib-Loaded Silk Fibroin Nanoparticles for Cancer Cell Therapy with Over-Expressed Folate Receptor" Pharmaceutics 15, no. 4: 1186. https://doi.org/10.3390/pharmaceutics15041186