
Pharmacokinetics and Pharmacodynamics of Antibody-Drug Conjugates Administered via Subcutaneous and Intratumoral Routes


Abstract
:1. Introduction
2. Materials and Methods
2.1. Synthesis and Characterization of T-vc-MMAE ADC
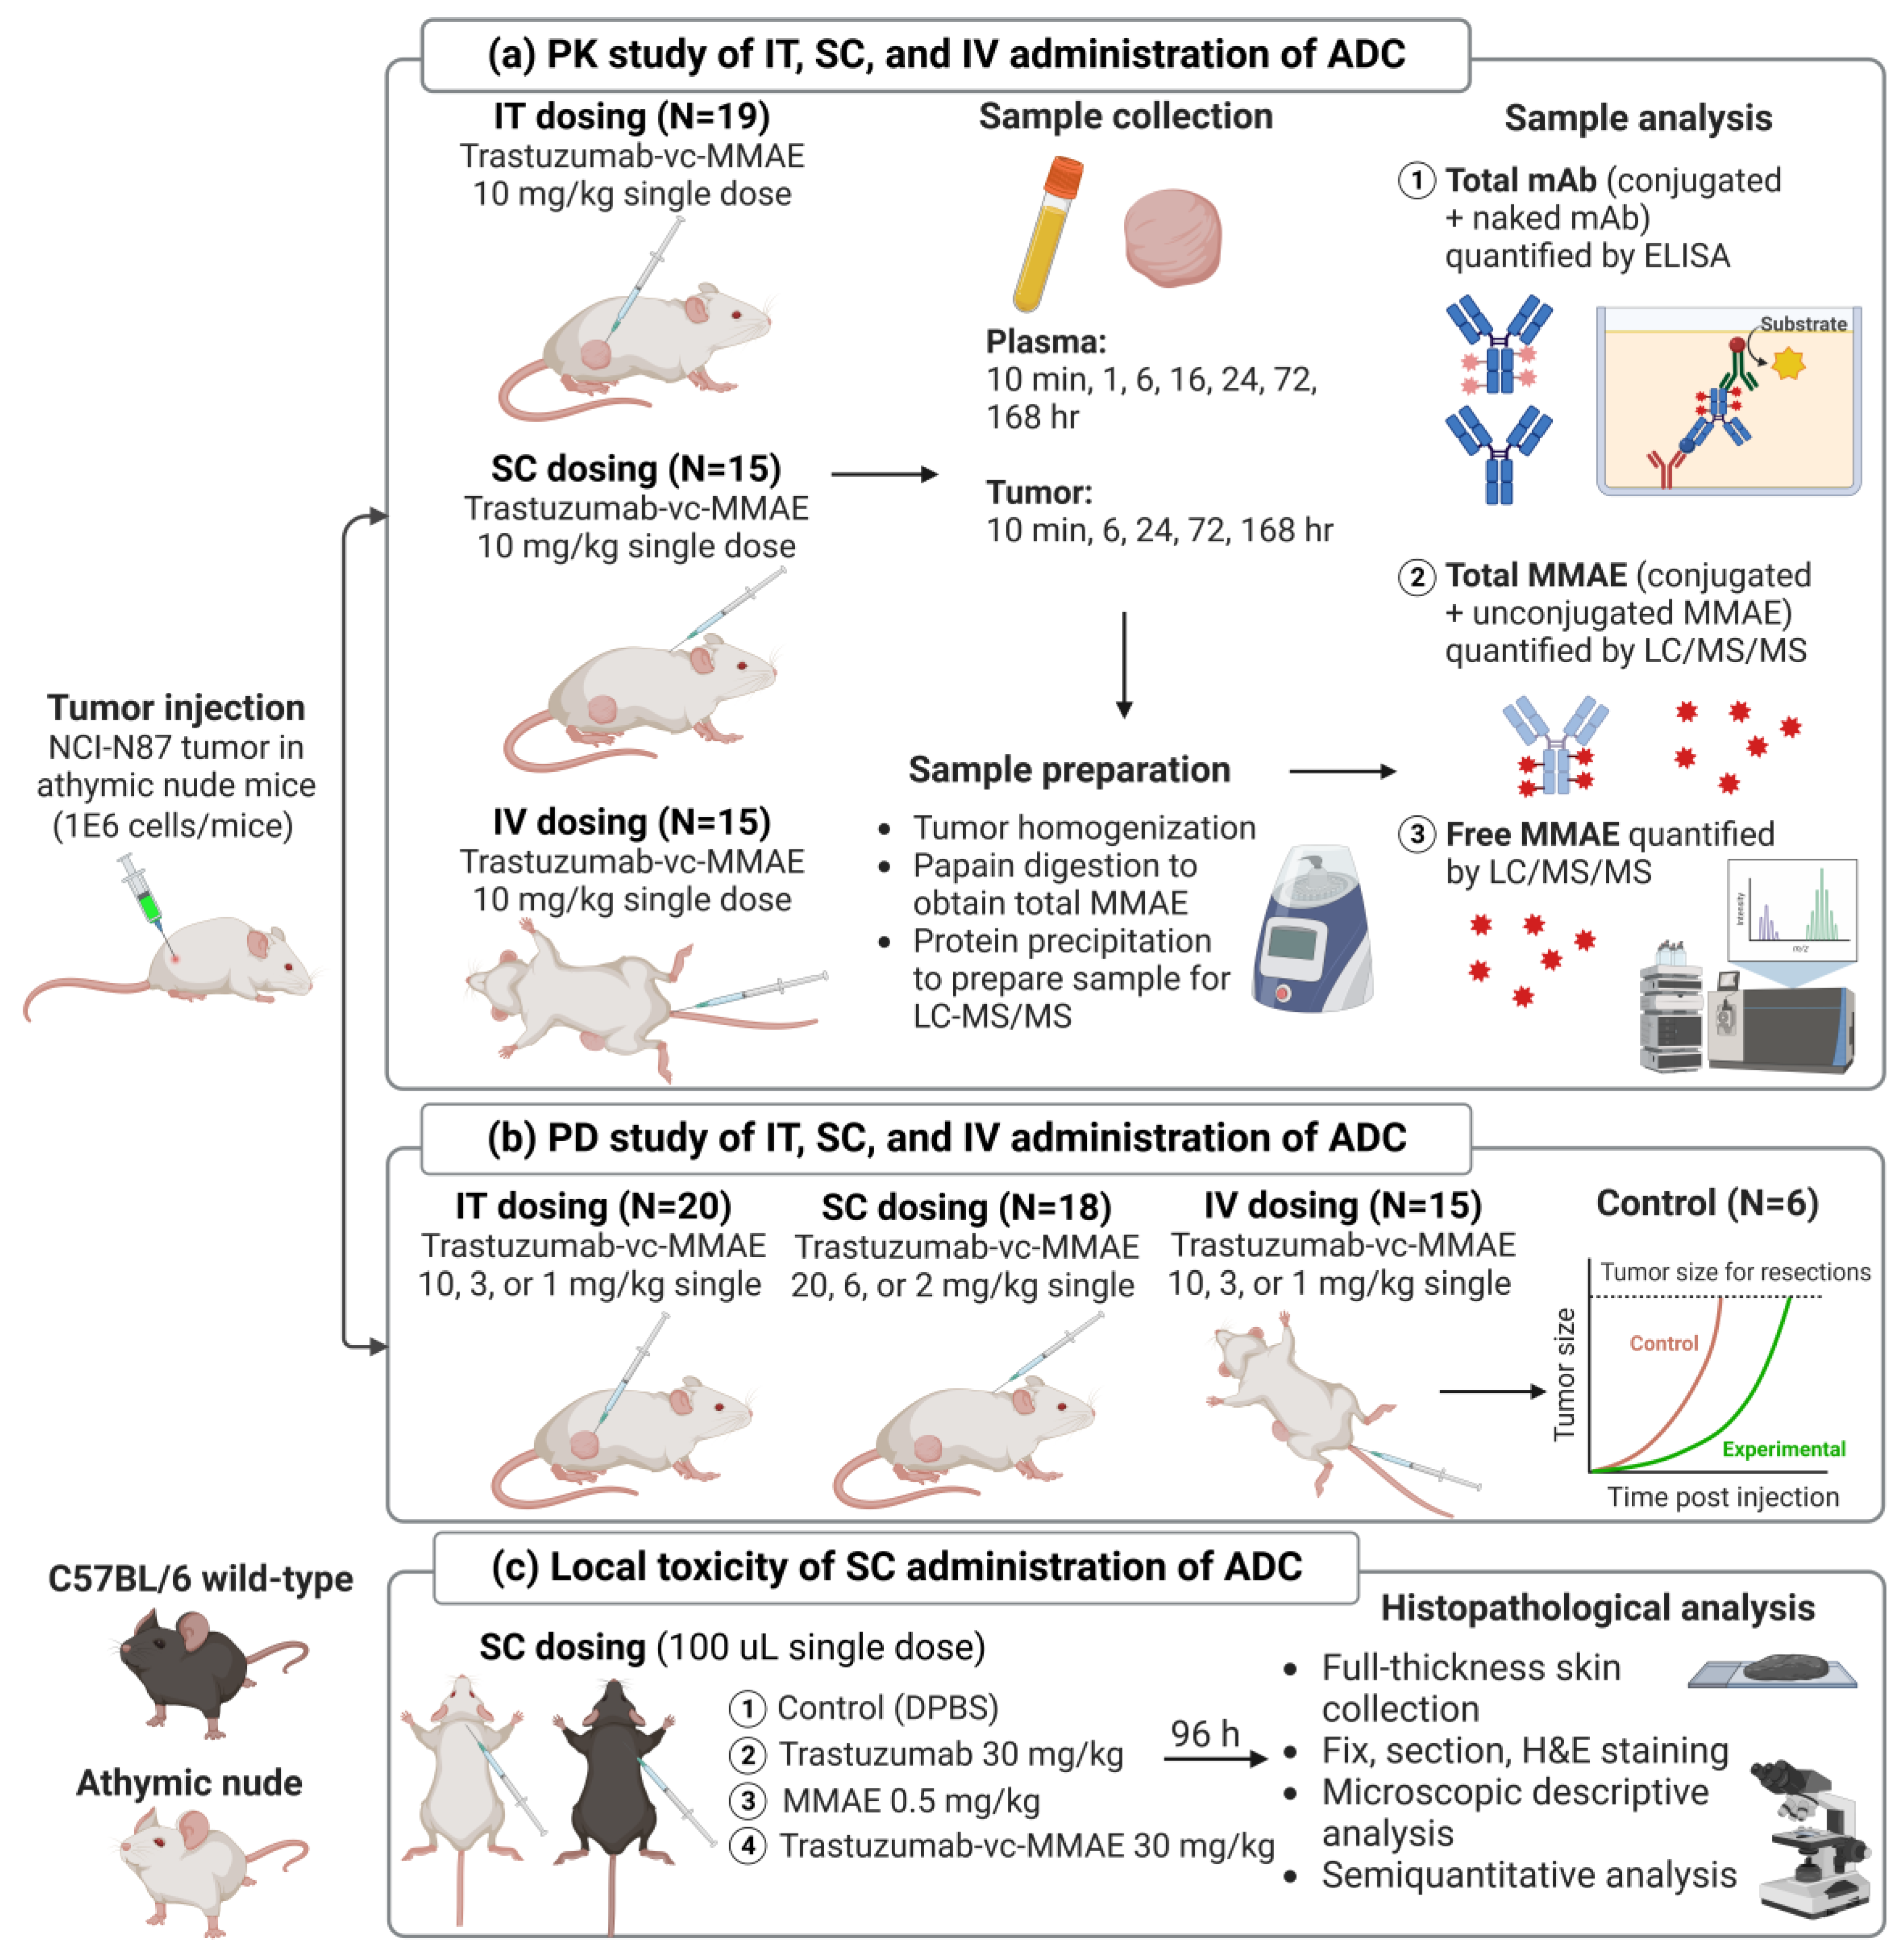
2.2. Development of Xenograft Mouse Model
2.3. PK of T-vc-MMAE Administered via IT, SC, and IV Route in Tumor-Bearing Mice
2.4. Bioanalytical Method
2.4.1. Sample Preparation
2.4.2. ELISA Method to Quantify Total mAb
2.4.3. LC-MS/MS to Quantify Unconjugated MMAE
2.4.4. Papain Deconjugation Method to Quantify Total MMAE
2.5. Efficacy Study of T-vc-MMAE Administered via IT, SC, and IV Route in Tumor-Bearing Mice
2.6. Local Toxicity Study of SC Administered T-vc-MMAE in Mice
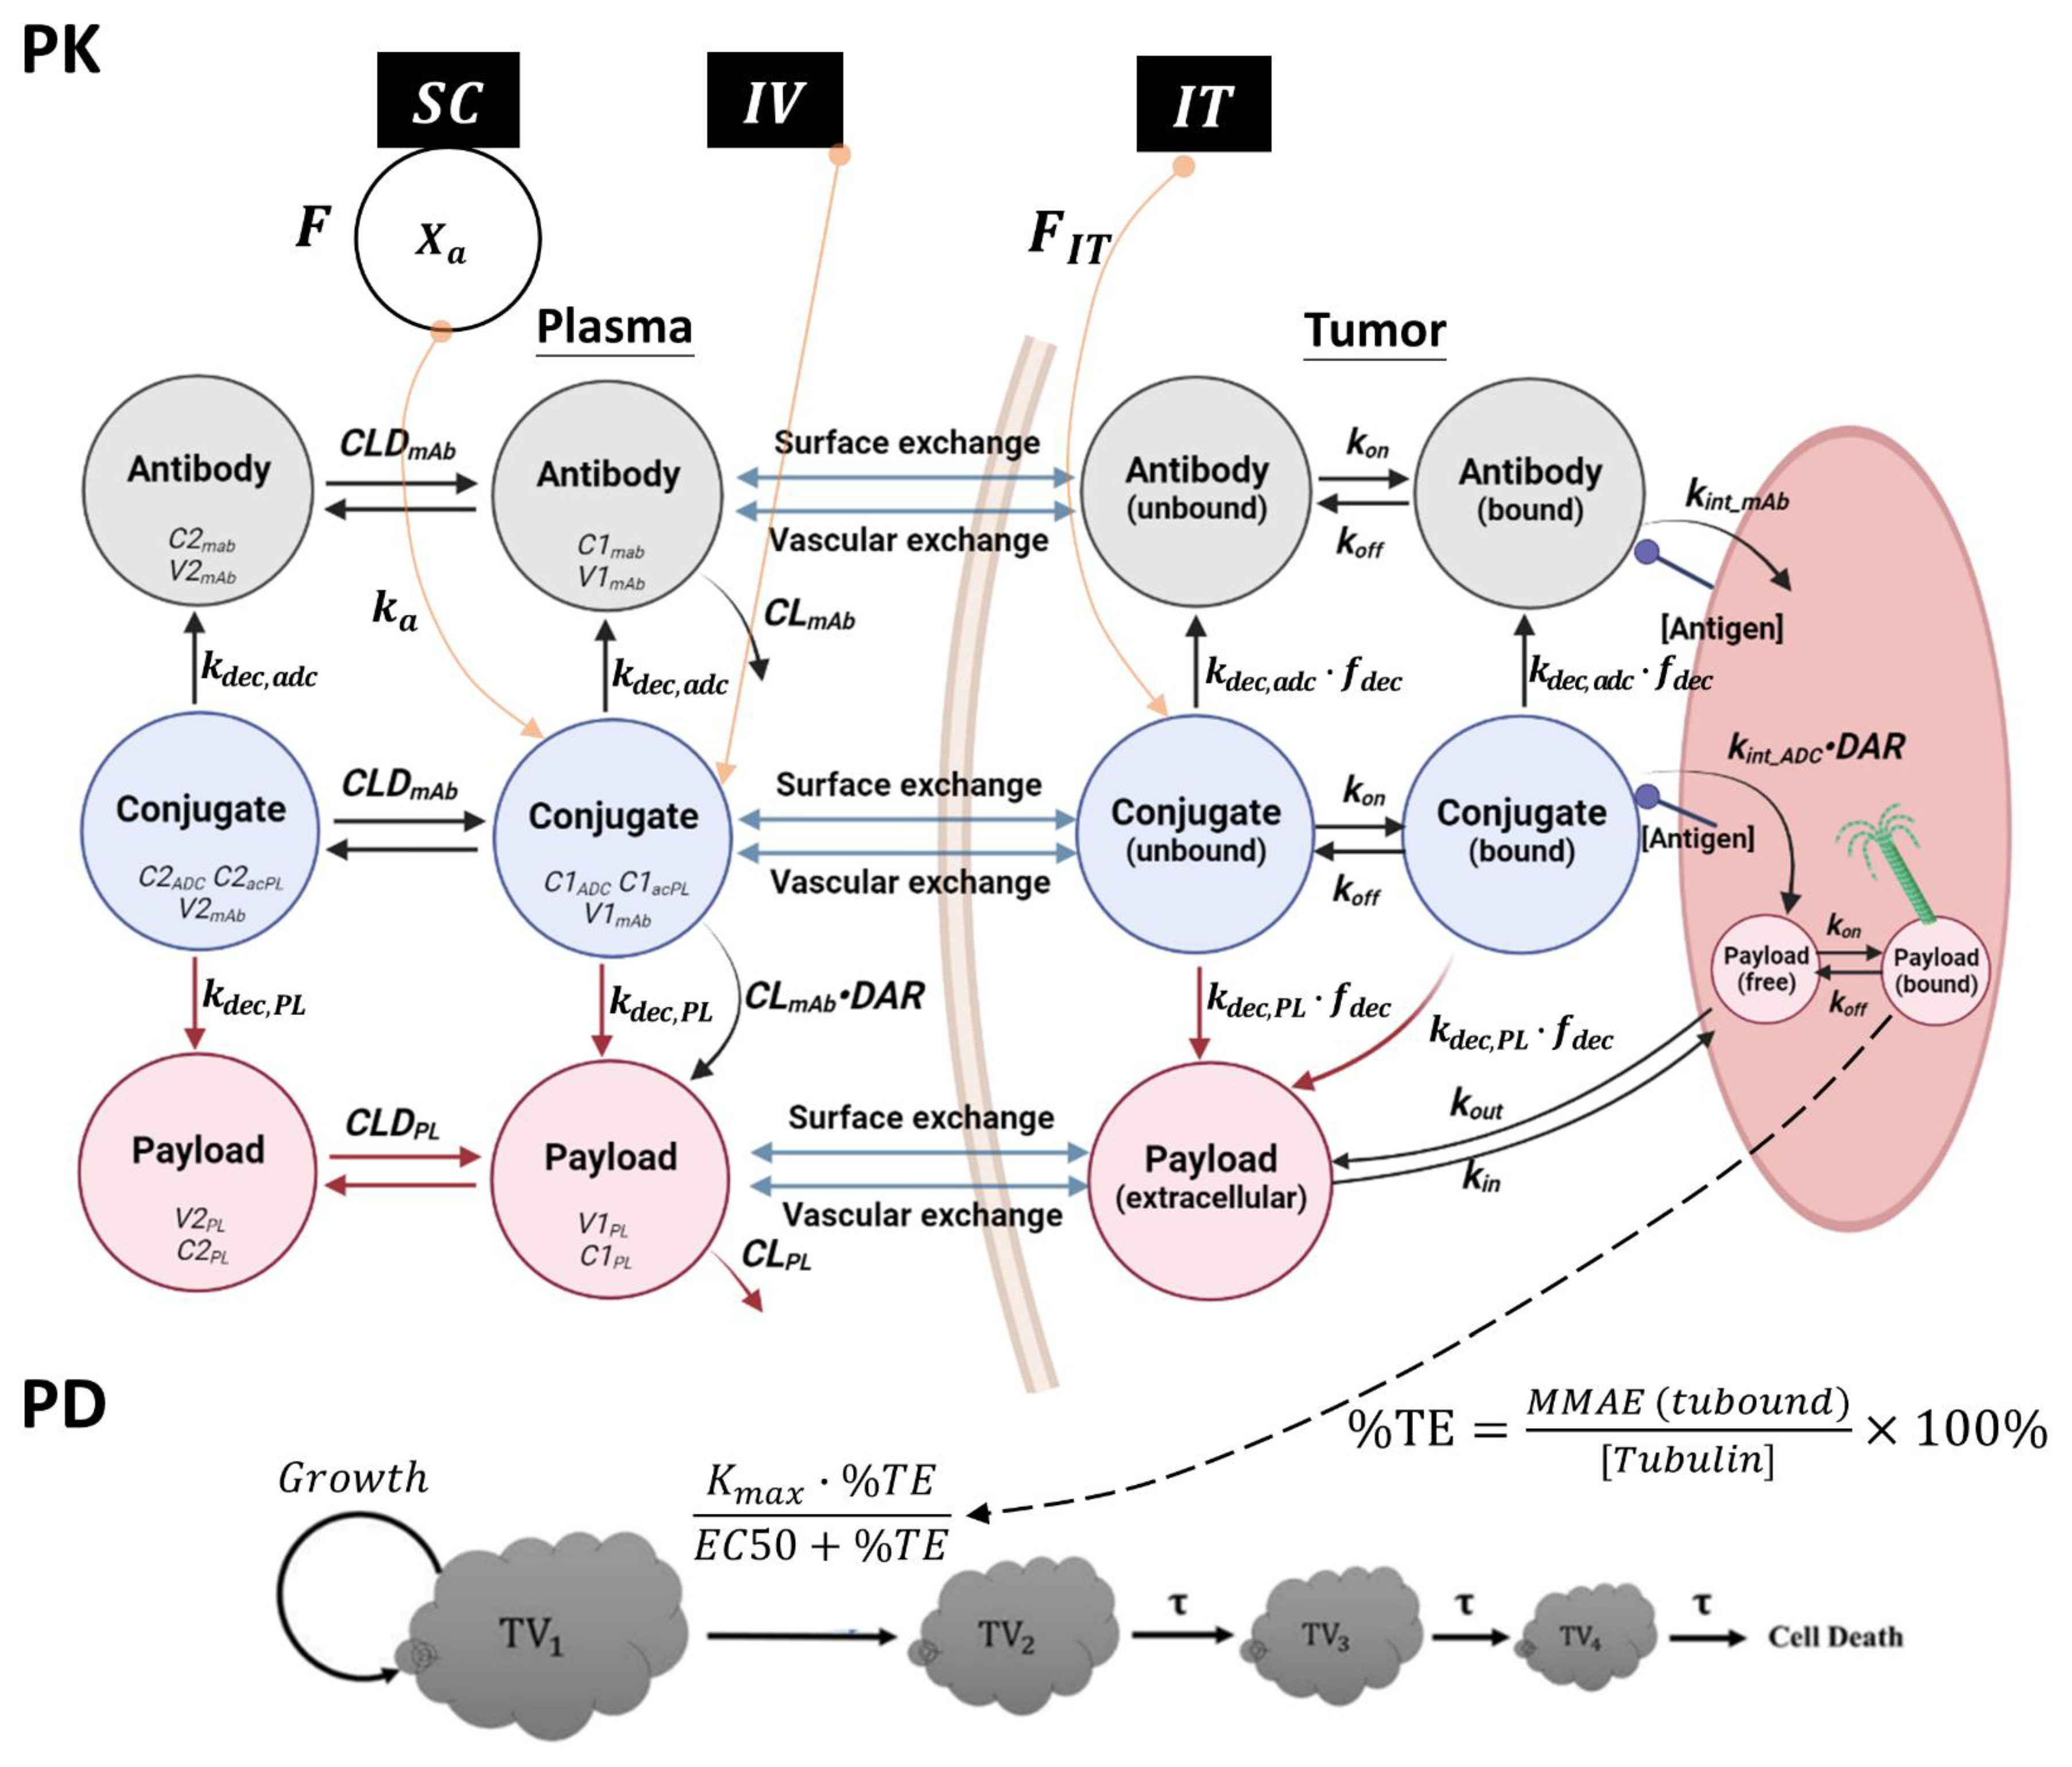
2.7. Development of a PK/PD Model for T-vc-MMAE Administered via IT, SC, and IV Routes
2.7.1. PK Model Structure

| Parameter | Definition | Value | Unit | Source |
|---|---|---|---|---|
| Plasma PK parameters | ||||
| Plasma clearance of ADC/mAb | 0.006 (10.8%) | mL/h | Estimated 1 | |
| Distribution clearance of ADC/mAb | 0.040 (28.9%) | mL/h | Estimated 1 | |
| Volume of distribution of ADC/mAb in the central compartment | 1.41 (6.48%) | mL | Estimated 1 | |
| Volume of distribution of ADC/mAb in the peripheral compartment | 0.861 (13.3%) | mL | Estimated 1 | |
| Plasma clearance of unconjugated MMAE | 15.9 | mL/h | Estimated 2 | |
| Distribution clearance of unconjugated MMAE | 0.811 (20.0%) | mL/h | Estimated 2 | |
| Volume of distribution of unconjugated MMAE in the central compartment | 2.25 (9.68%) | mL | Estimated 2 | |
| Volume of distribution of ADC/mAb in the central compartment | 5.60 (25.7%) | mL | Estimated 2 | |
| Deconjugation rate constant of ADC to form naked mAb | 0.00344 (9.65%) | 1/h | Estimated | |
| Deconjugation rate constant of ADC to release MMAE | 0.00905 (6.48%) | 1/h | Estimated | |
| Tumor PK parameters | ||||
| Permeability of ADC across tumor blood vessels | 0.01 | mm/h | [40] | |
| Permeability of MMAE across tumor blood vessels | 0.0875 | mm/h | [41] | |
| Diffusion rate of ADC | 0.00054 | mm2/h | [42] | |
| Diffusion rate of MMAE | 1.04 | mm2/h | [41] | |
| Tumor blood capillary radius | 0.008 | mm | [43] | |
| The average distance between two capillaries | 0.075 | mm | [43] | |
| Initial tumor volume | measured | mm3 | Experimental | |
| Tumor radius | dynamic | mm | Derived 3 | |
| Tumor void volume for ADC | 0.24 | - | [41] | |
| Tumor void volume for MMAE | 0.44 | - | [41] | |
| Association rate constant between ADC and HER2 | 1.25 | 1/nM/h | [44] | |
| Dissociation rate constant between ADC and HER2 | 2.26 | 1/h | [44] | |
| Internalization rate of ADC-antigen complex inside the cell | 0.112 (19.6%) | 1/h | Estimated | |
| Internalization rate of mAb-antigen complex inside the cell | 0.027 | 1/h | [45] | |
| Total antigen concentration | 1799 | nM | [44] | |
| Secondary order association rate constant between MMAE and tubulin | 0.00187 | 1/nM/h | [46,47] | |
| First-order dissociation rate constant between MMAE-tubulin complex | 0.545 | 1/h | [38,46] | |
| Total tubulin concentration | 500 | nM | [48] | |
| MMAE nonspecific uptake rate in cancer cell | 0.075 | 1/h | [49] | |
| MMAE efflux rate from the cell | 0.0116 (30.9%) | 1/h | Estimated | |
| Fold-increase of deconjugation rate in tumor | 30.8 (20.7%) | - | Estimated | |
| Route-specific PK parameters | ||||
| Percentage of injected dose retained in tumor after IT administration | 75.0 (4.61%) | % | Estimated | |
| Bioavailability for SC administered ADC | 47.6 (0.836%) | % | Estimated | |
| Absorption rate constant for SC administered ADC | 0.0498 (1.96%) | 1/h | Estimated | |
| PD parameters | ||||
| Zero-order rate constant of tumor growth | 3.08 (24.7%) | mm3/h | Estimated 4 | |
| First-order rate constant of tumor growth | 0.0018 (3.21%) | 1/h | Estimated 4 | |
| Maximum cell killing rate | 0.00673 (6.18%) | 1/h | Estimated | |
| Percentage of tubulin occupied by MMAE that produces 50% of | 17.9 (1.17%) | % | Estimated | |
| Mean transit time for the cell distribution model | 19.3 (21.6%) | h | Estimated | |
| Random effect population variability for tumor growth in the linear phase | 53.8 (17.2%) | % | Estimated 4 | |
| Random effect population variability for maximum tumor killing rate | 43.2 (4.93%) | % | Estimated | |
| Random effect variability for transit time between different administration routes | 131 (16.3%) | % | Estimated | |
2.7.2. PD Model Structure
2.7.3. PK/PD Model Fitting
2.8. PK/PD Model Simulation
2.9. Data Analysis
3. Results
3.1. Synthesis and Characterization of T-vc-MMAE ADC
3.2. Bioanalytical Method Development
3.3. In Vivo PK of T-vc-MMAE Administered via IT, SC, and IV Routes
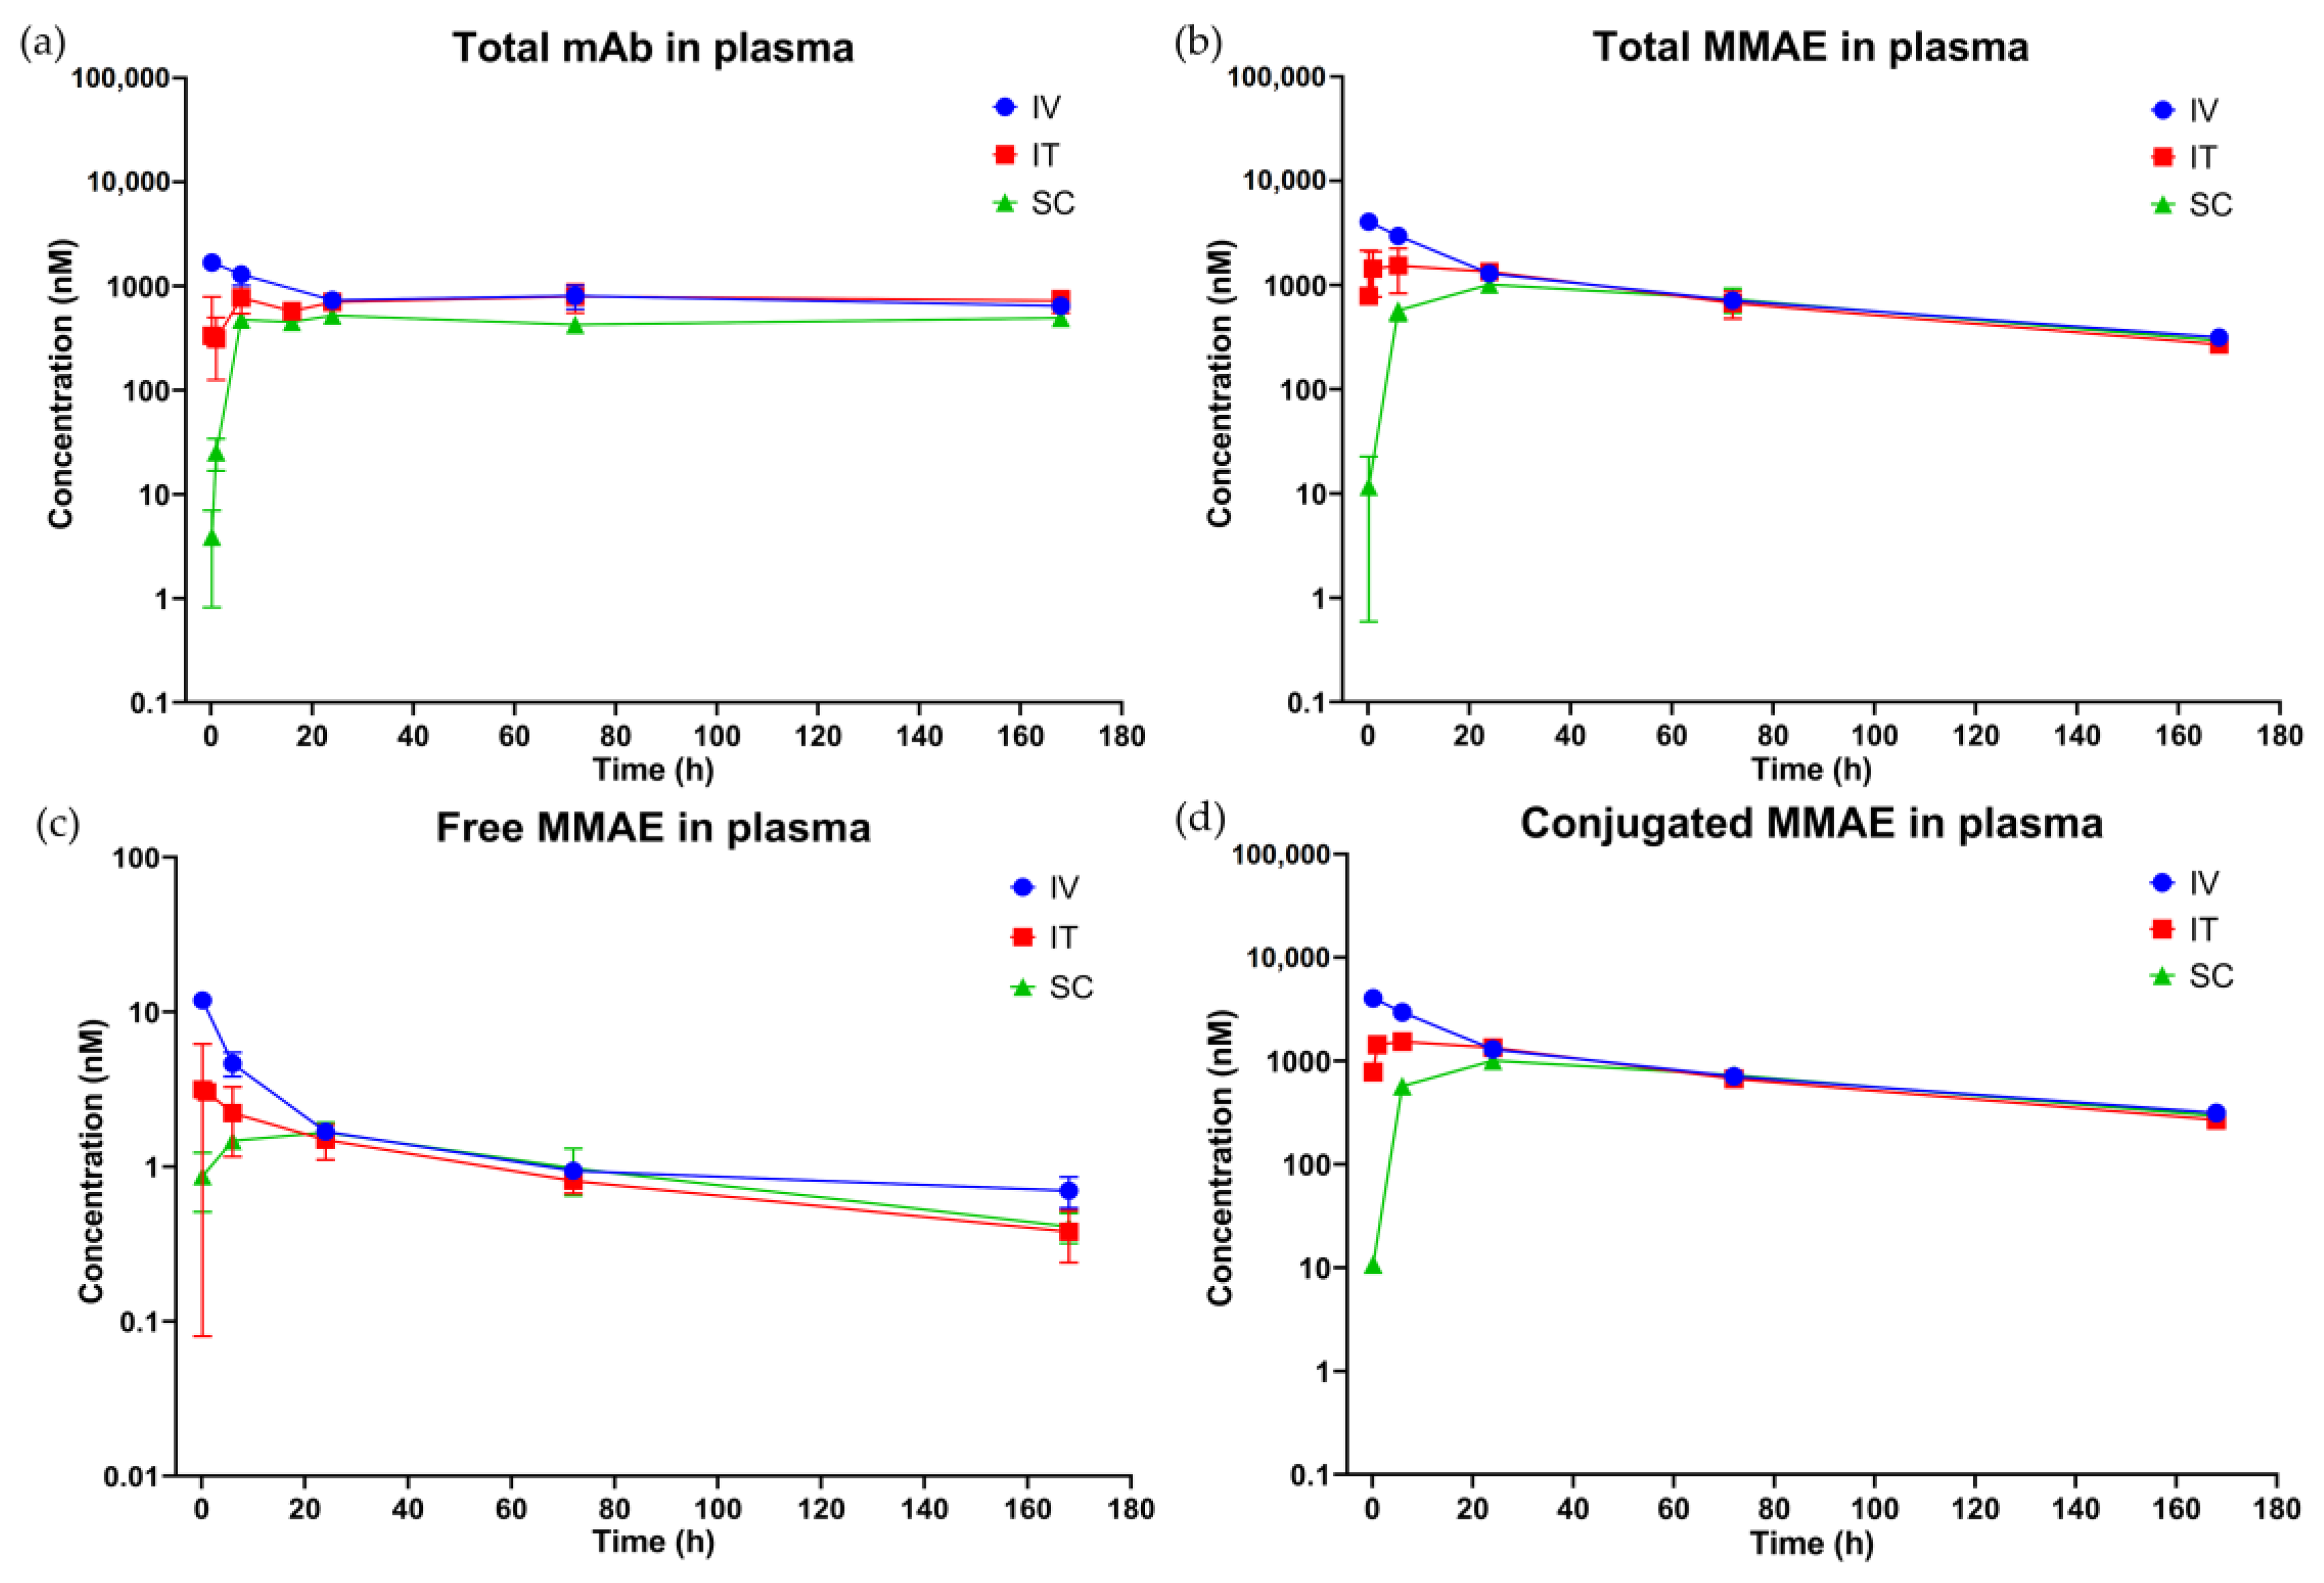
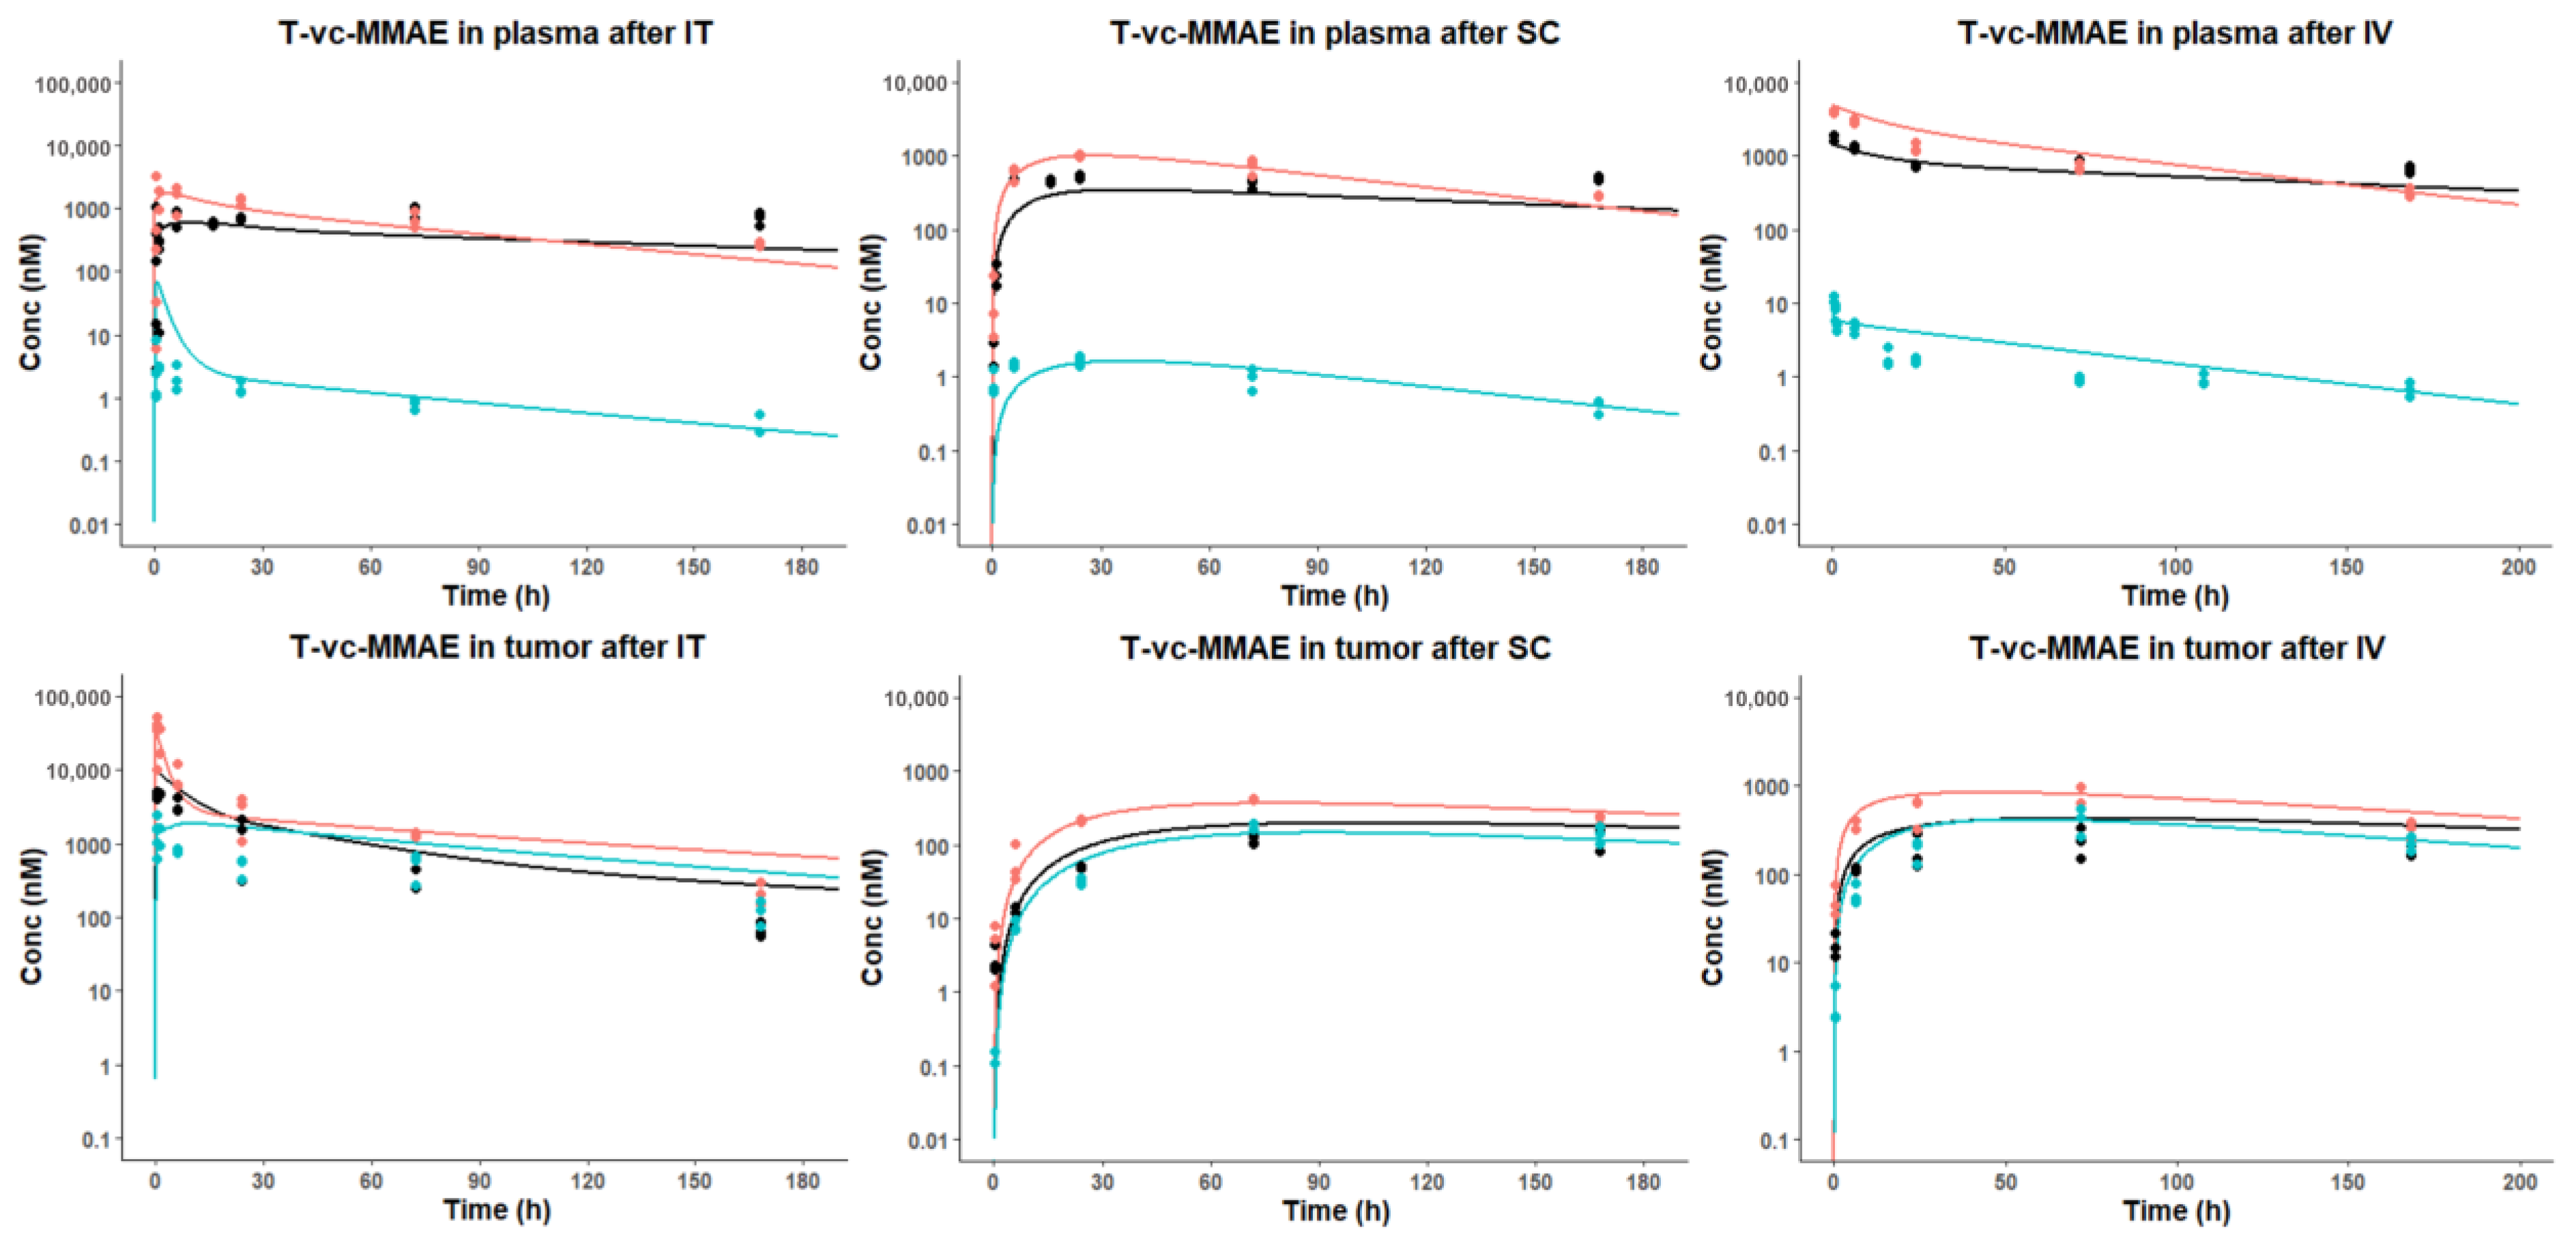
3.3.1. Plasma PK
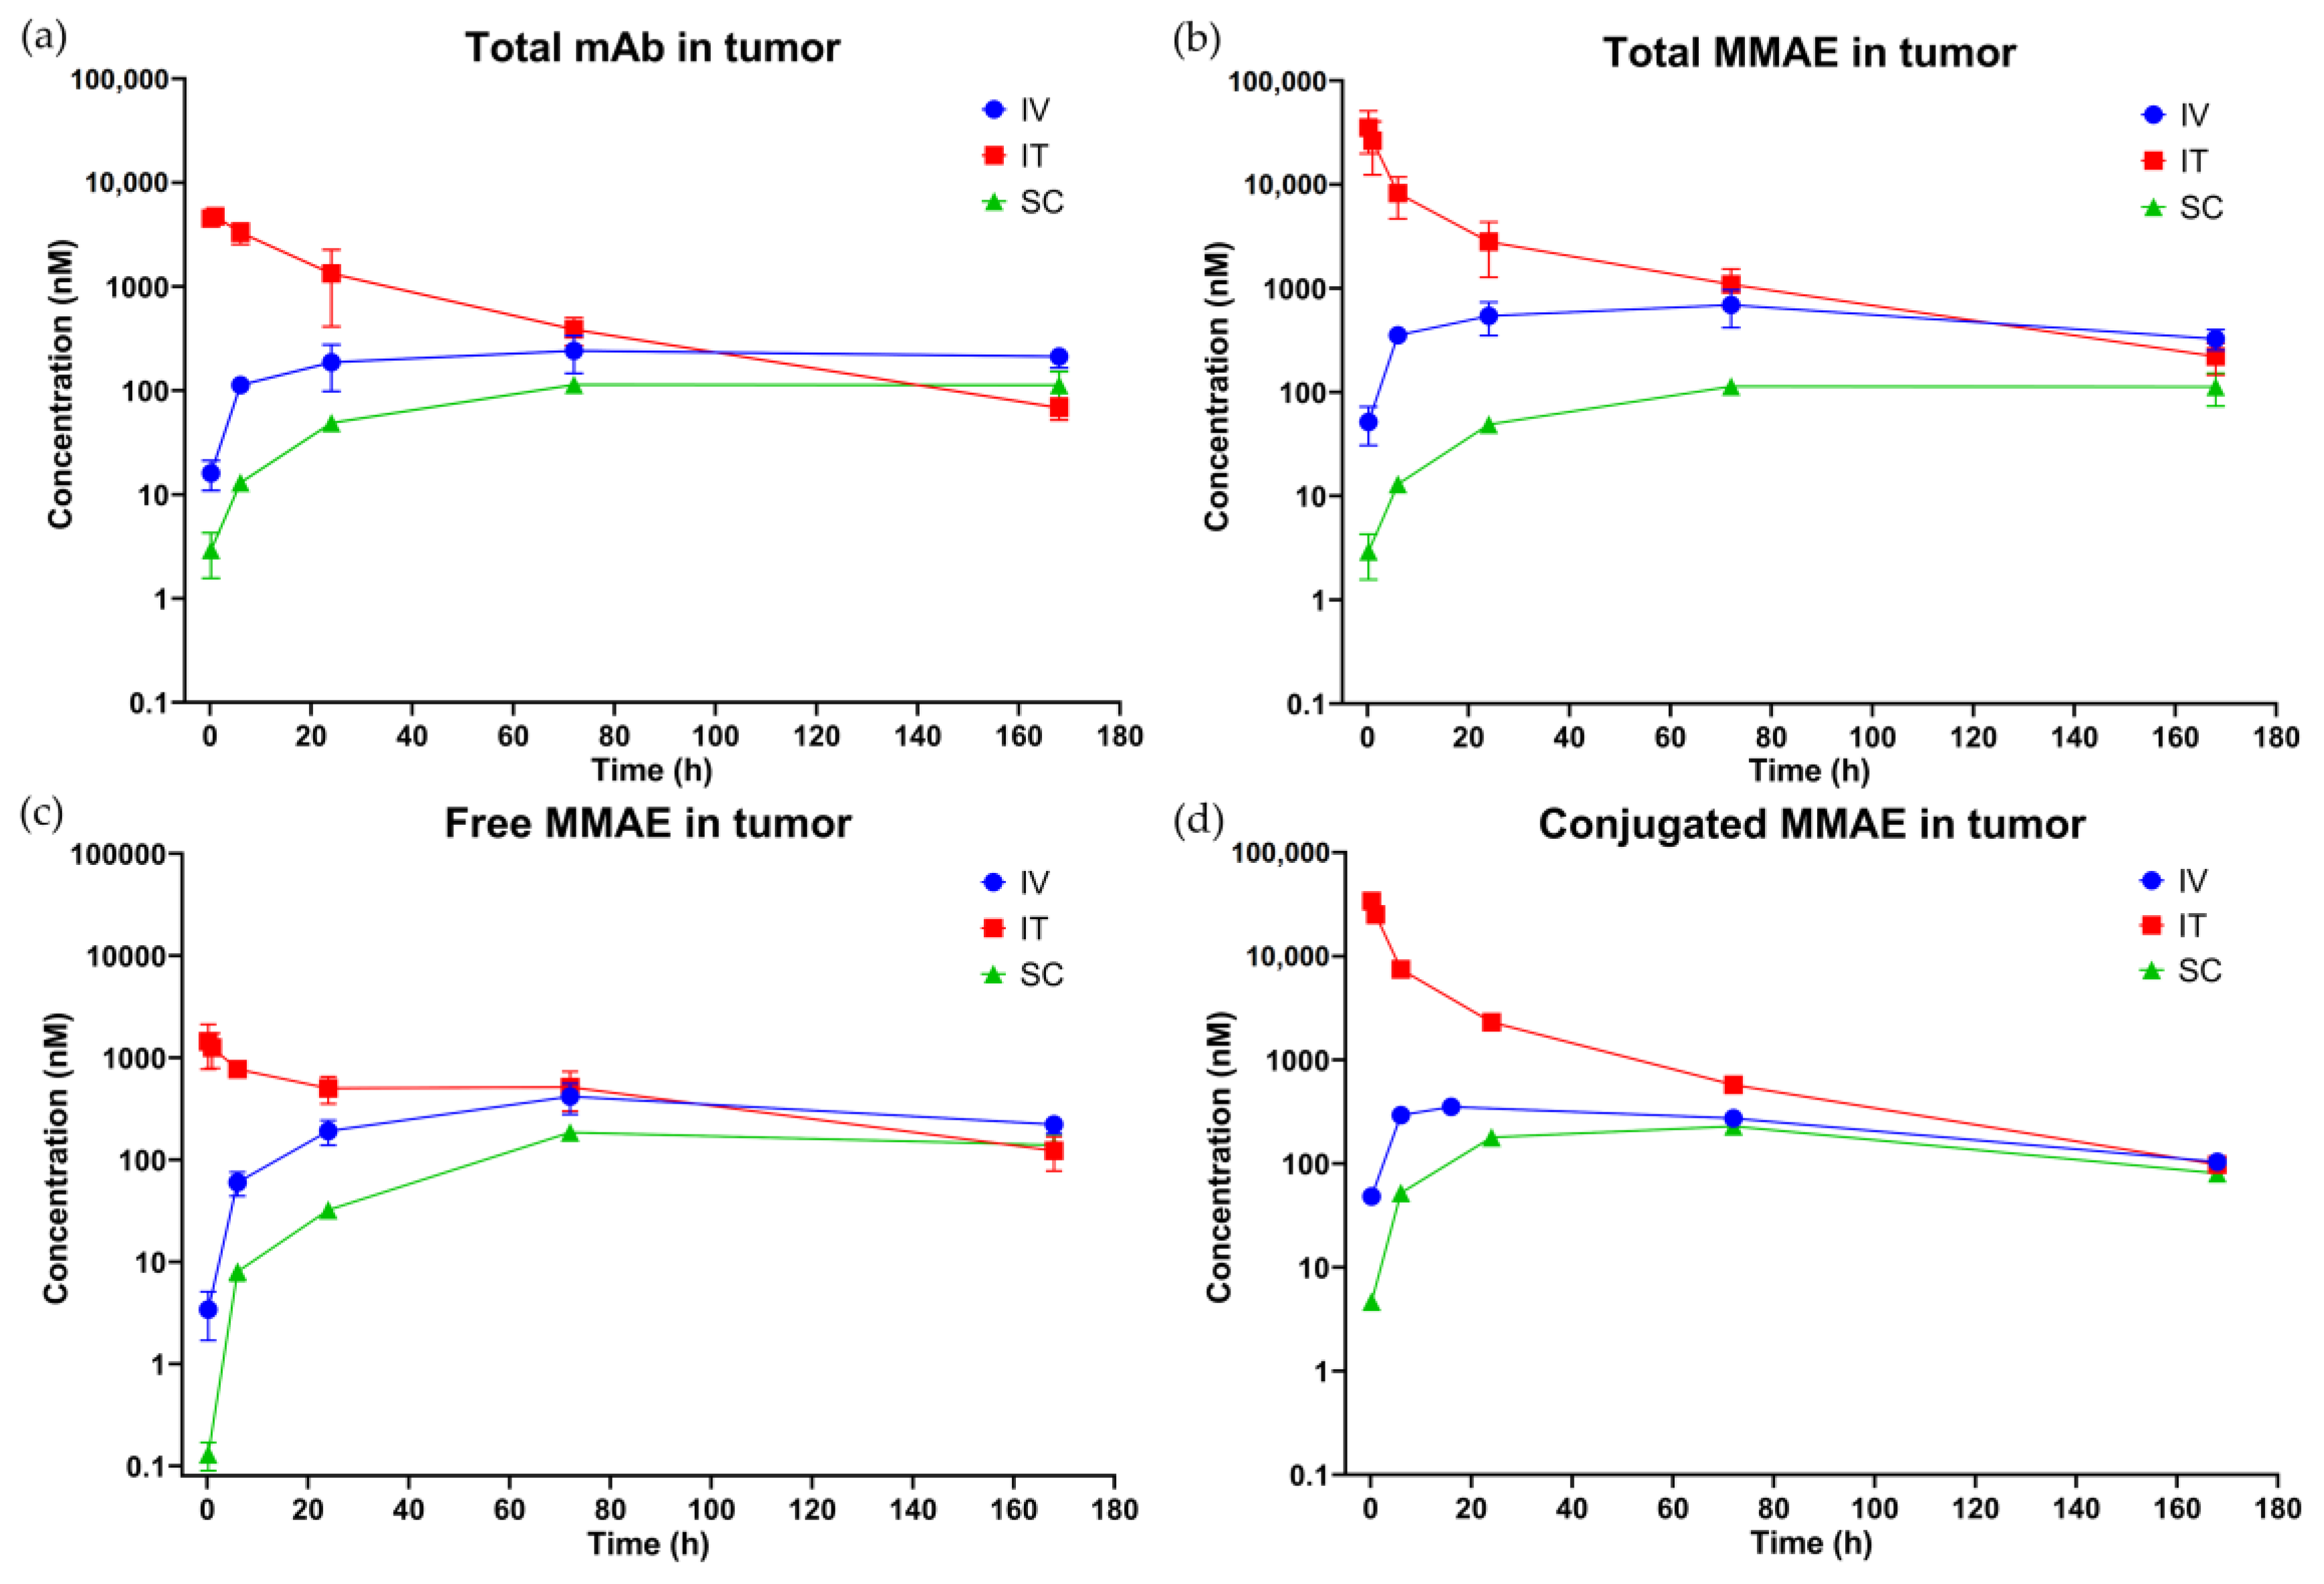
3.3.2. Tumor PK
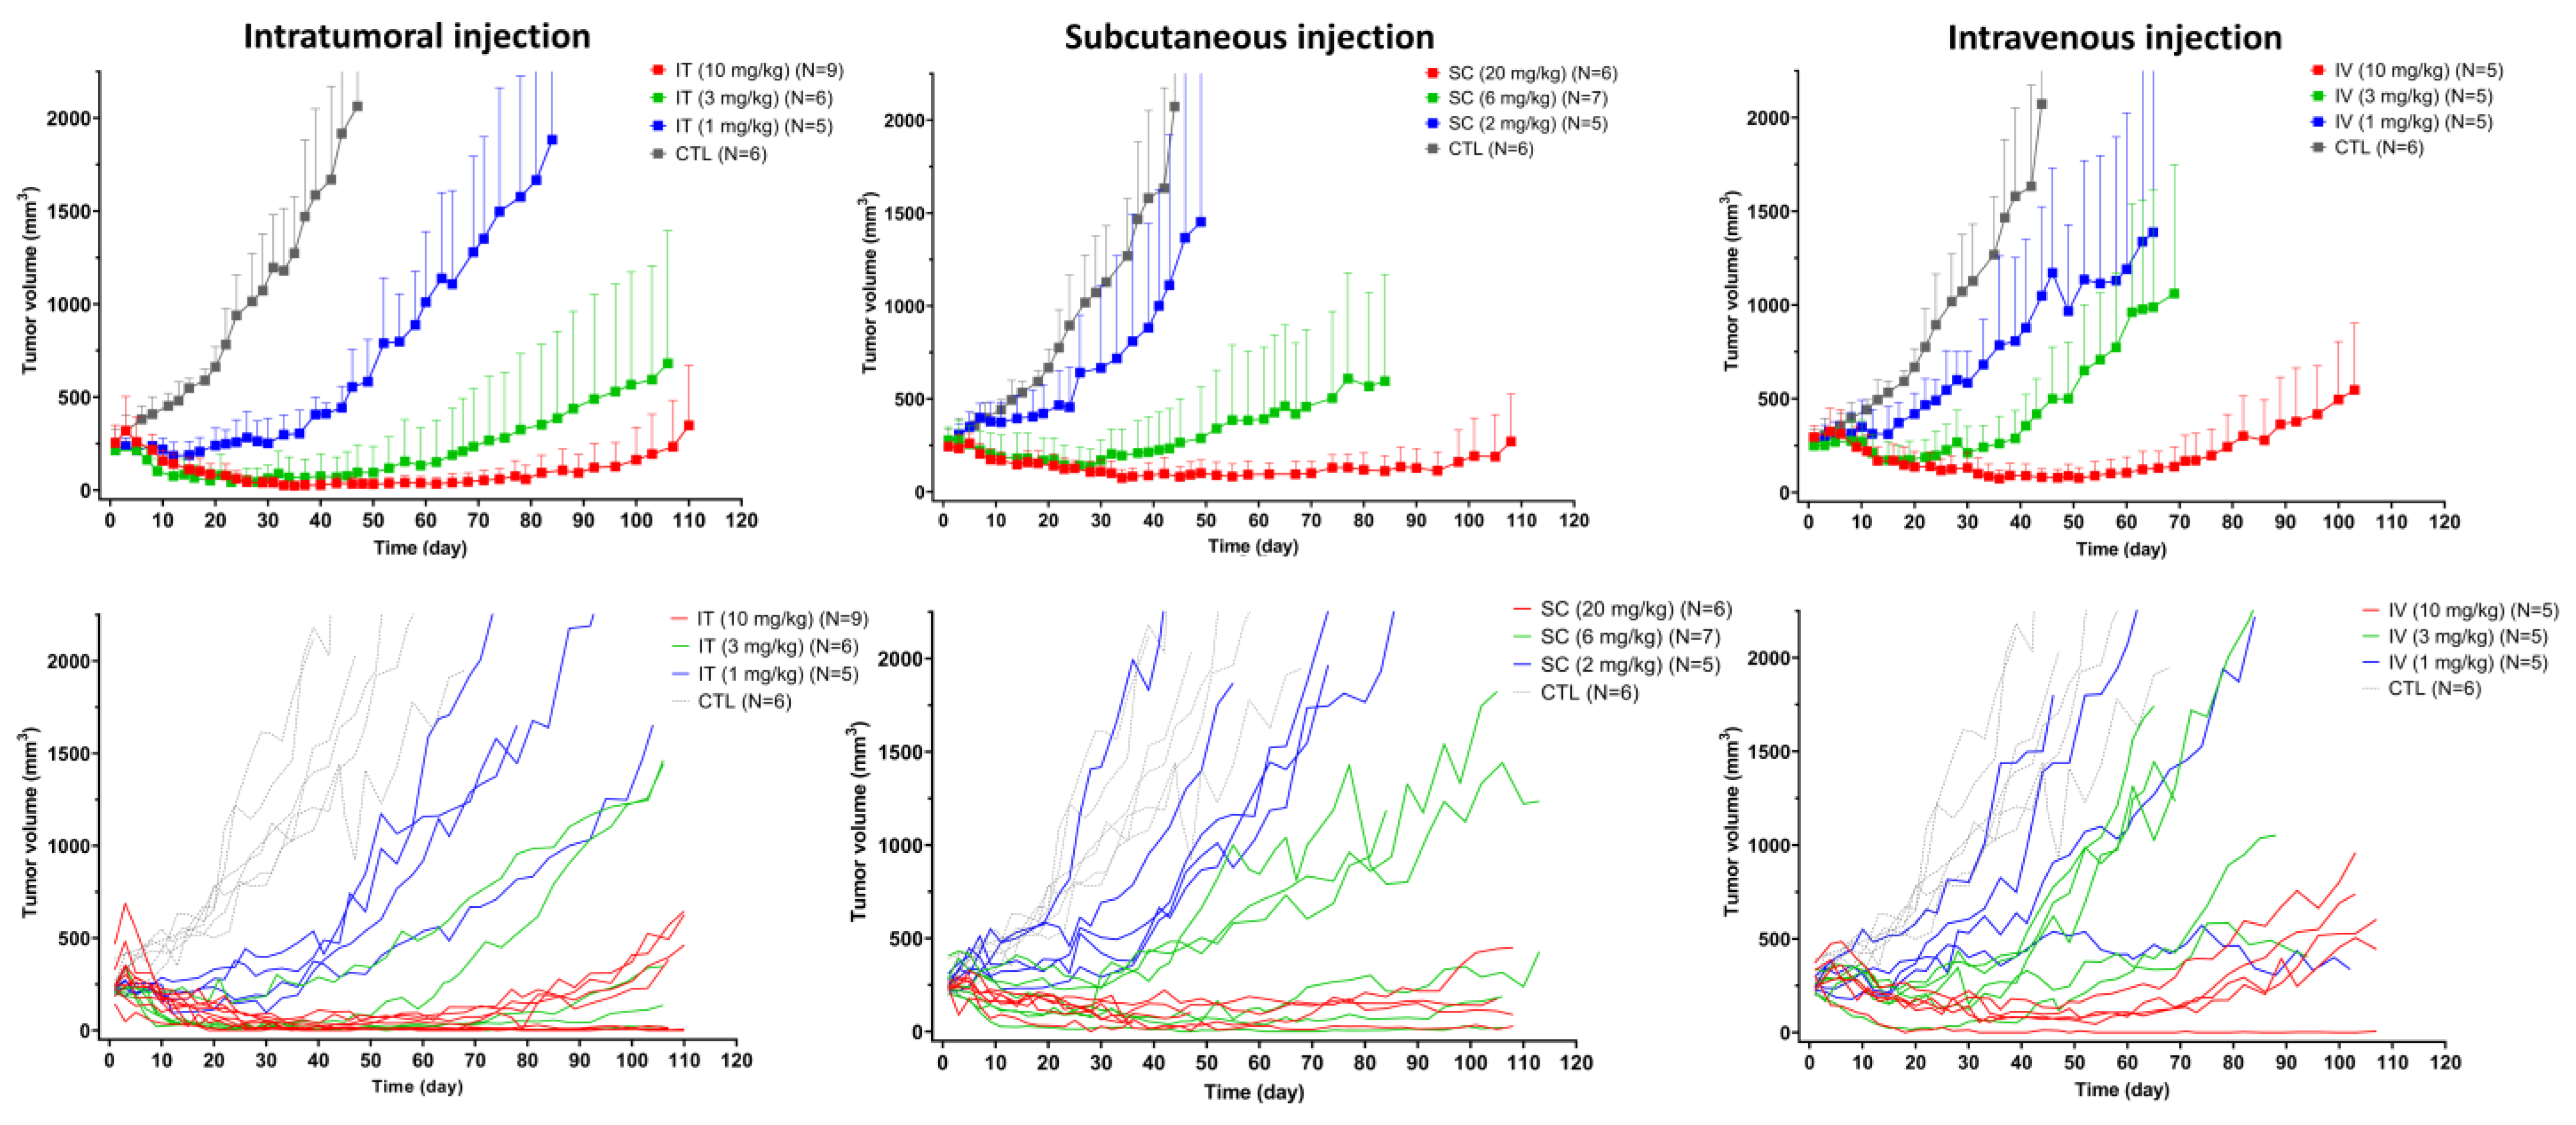
3.4. In Vivo Efficacy of T-vc-MMAE Administered via IT, SC, and IV Routes
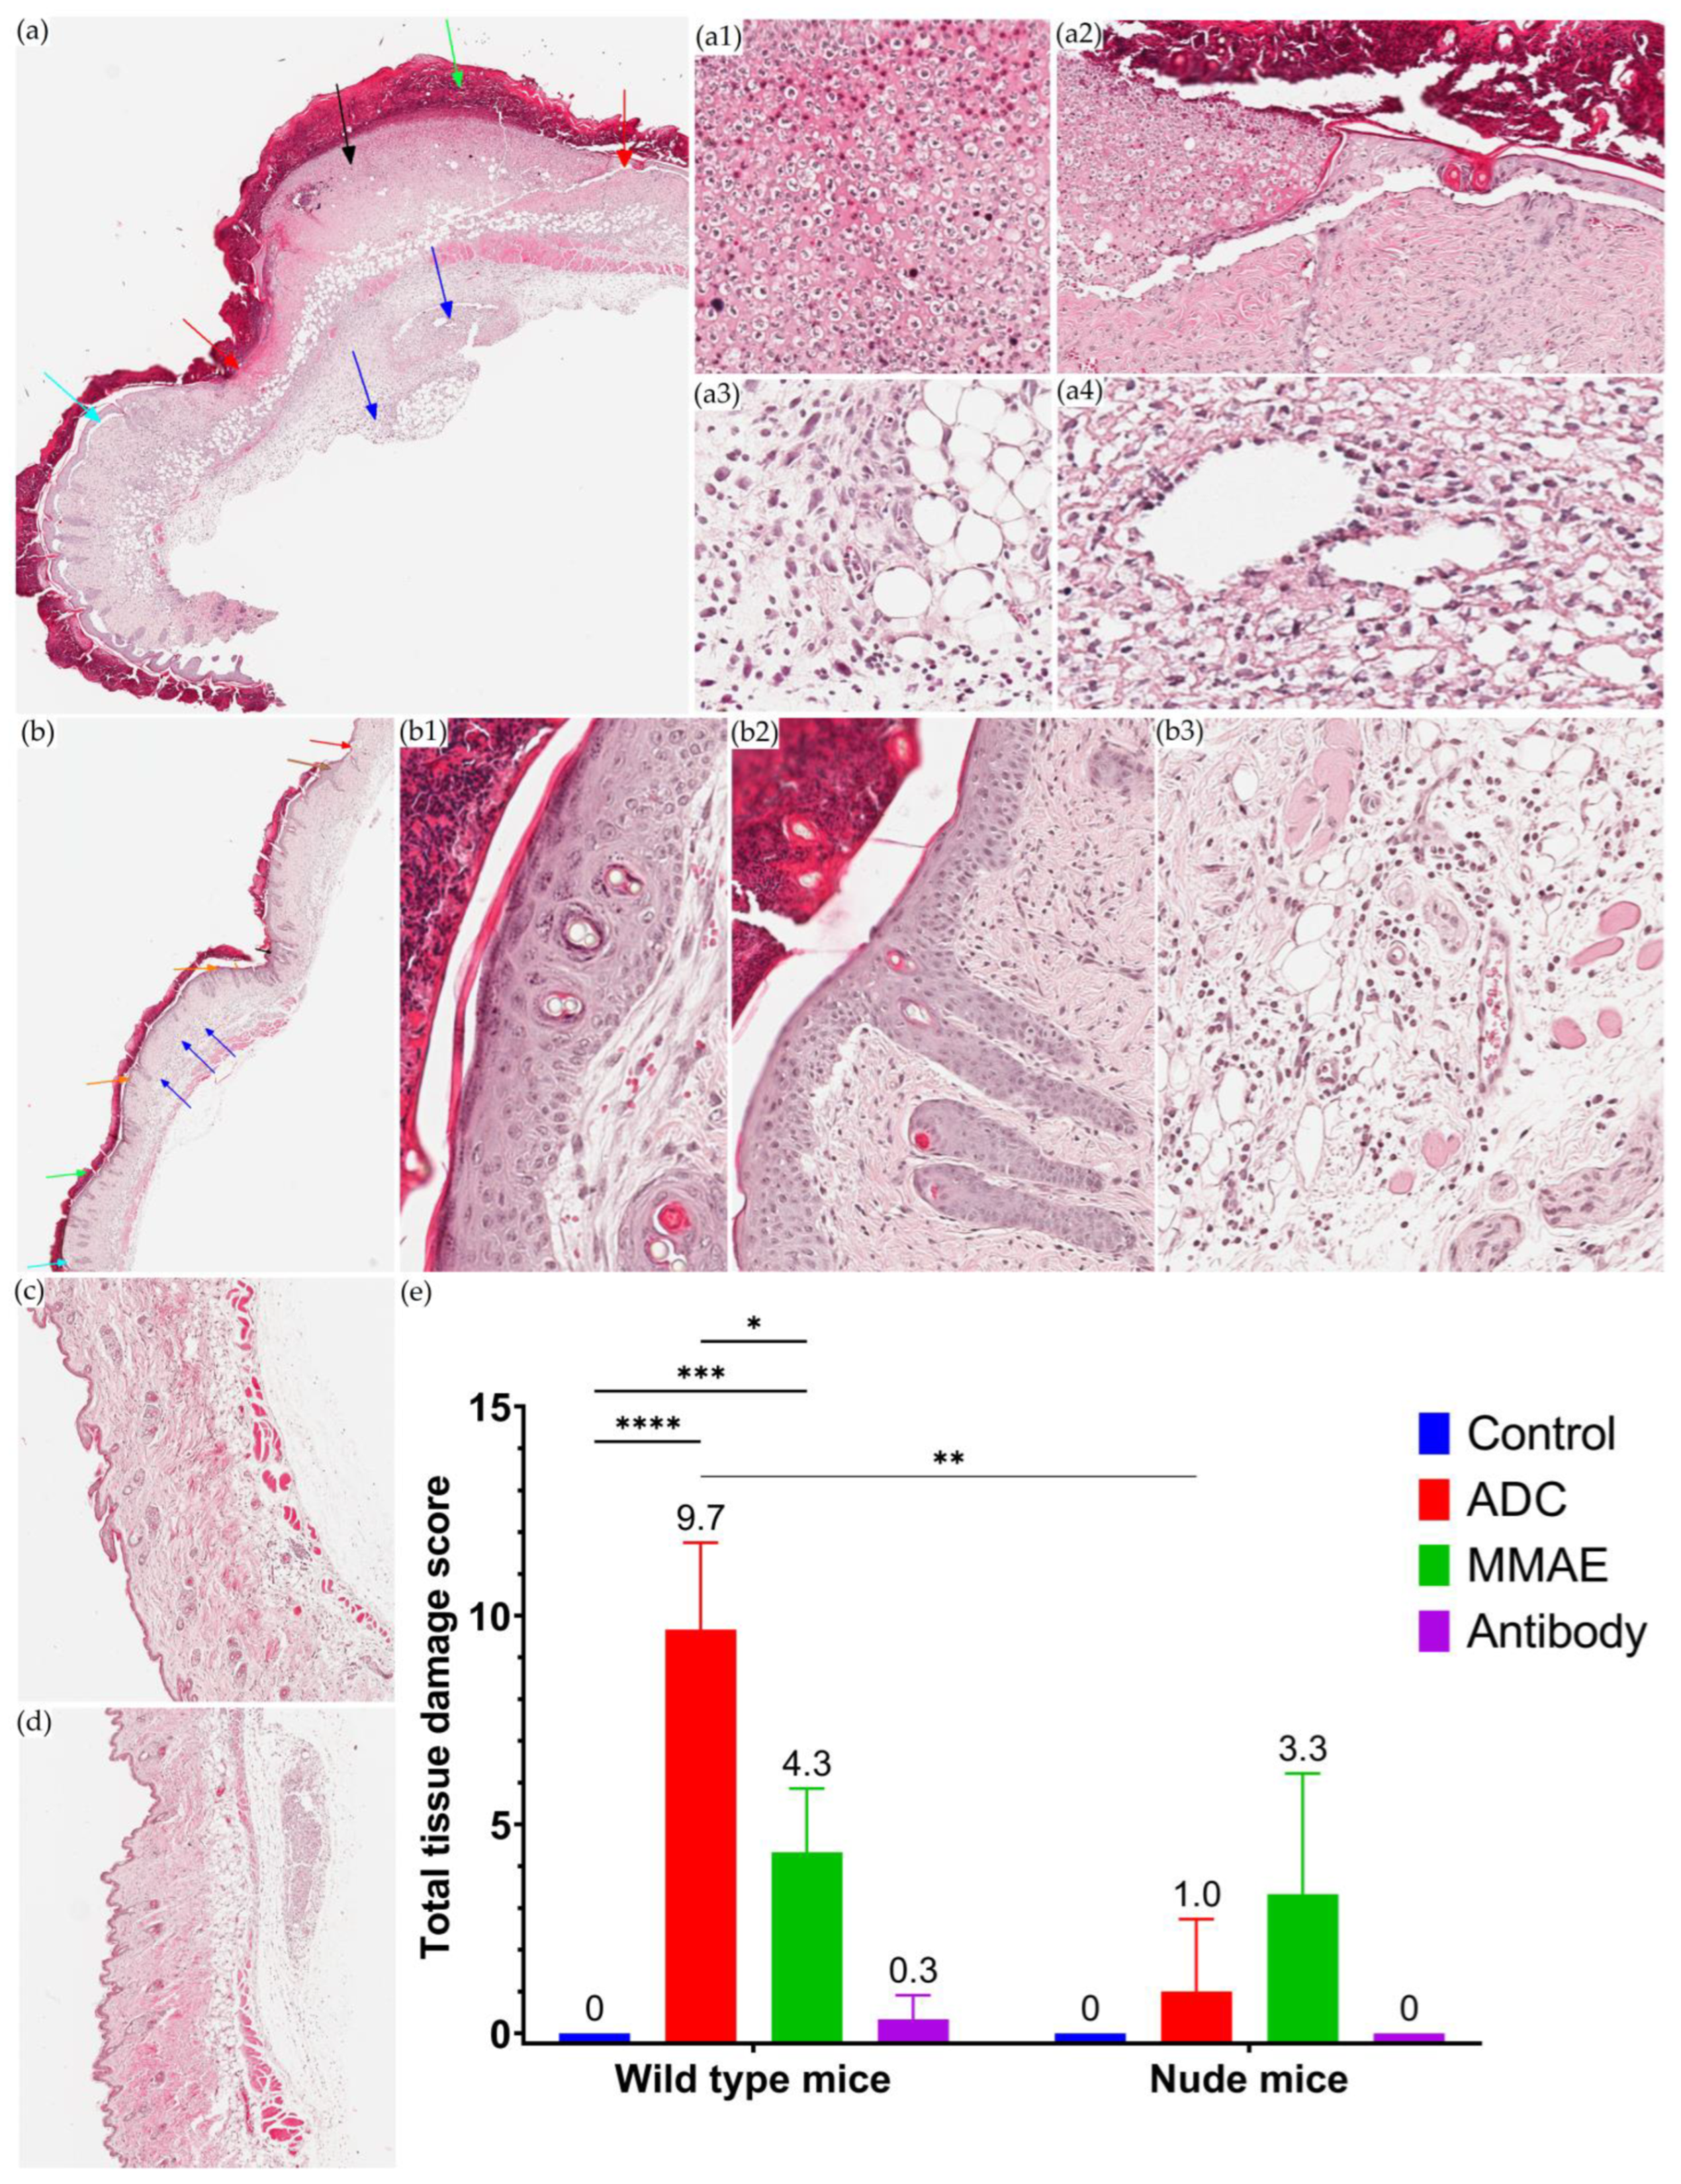
3.5. Local Toxicity Study of T-vc-MMAE after SC Administration
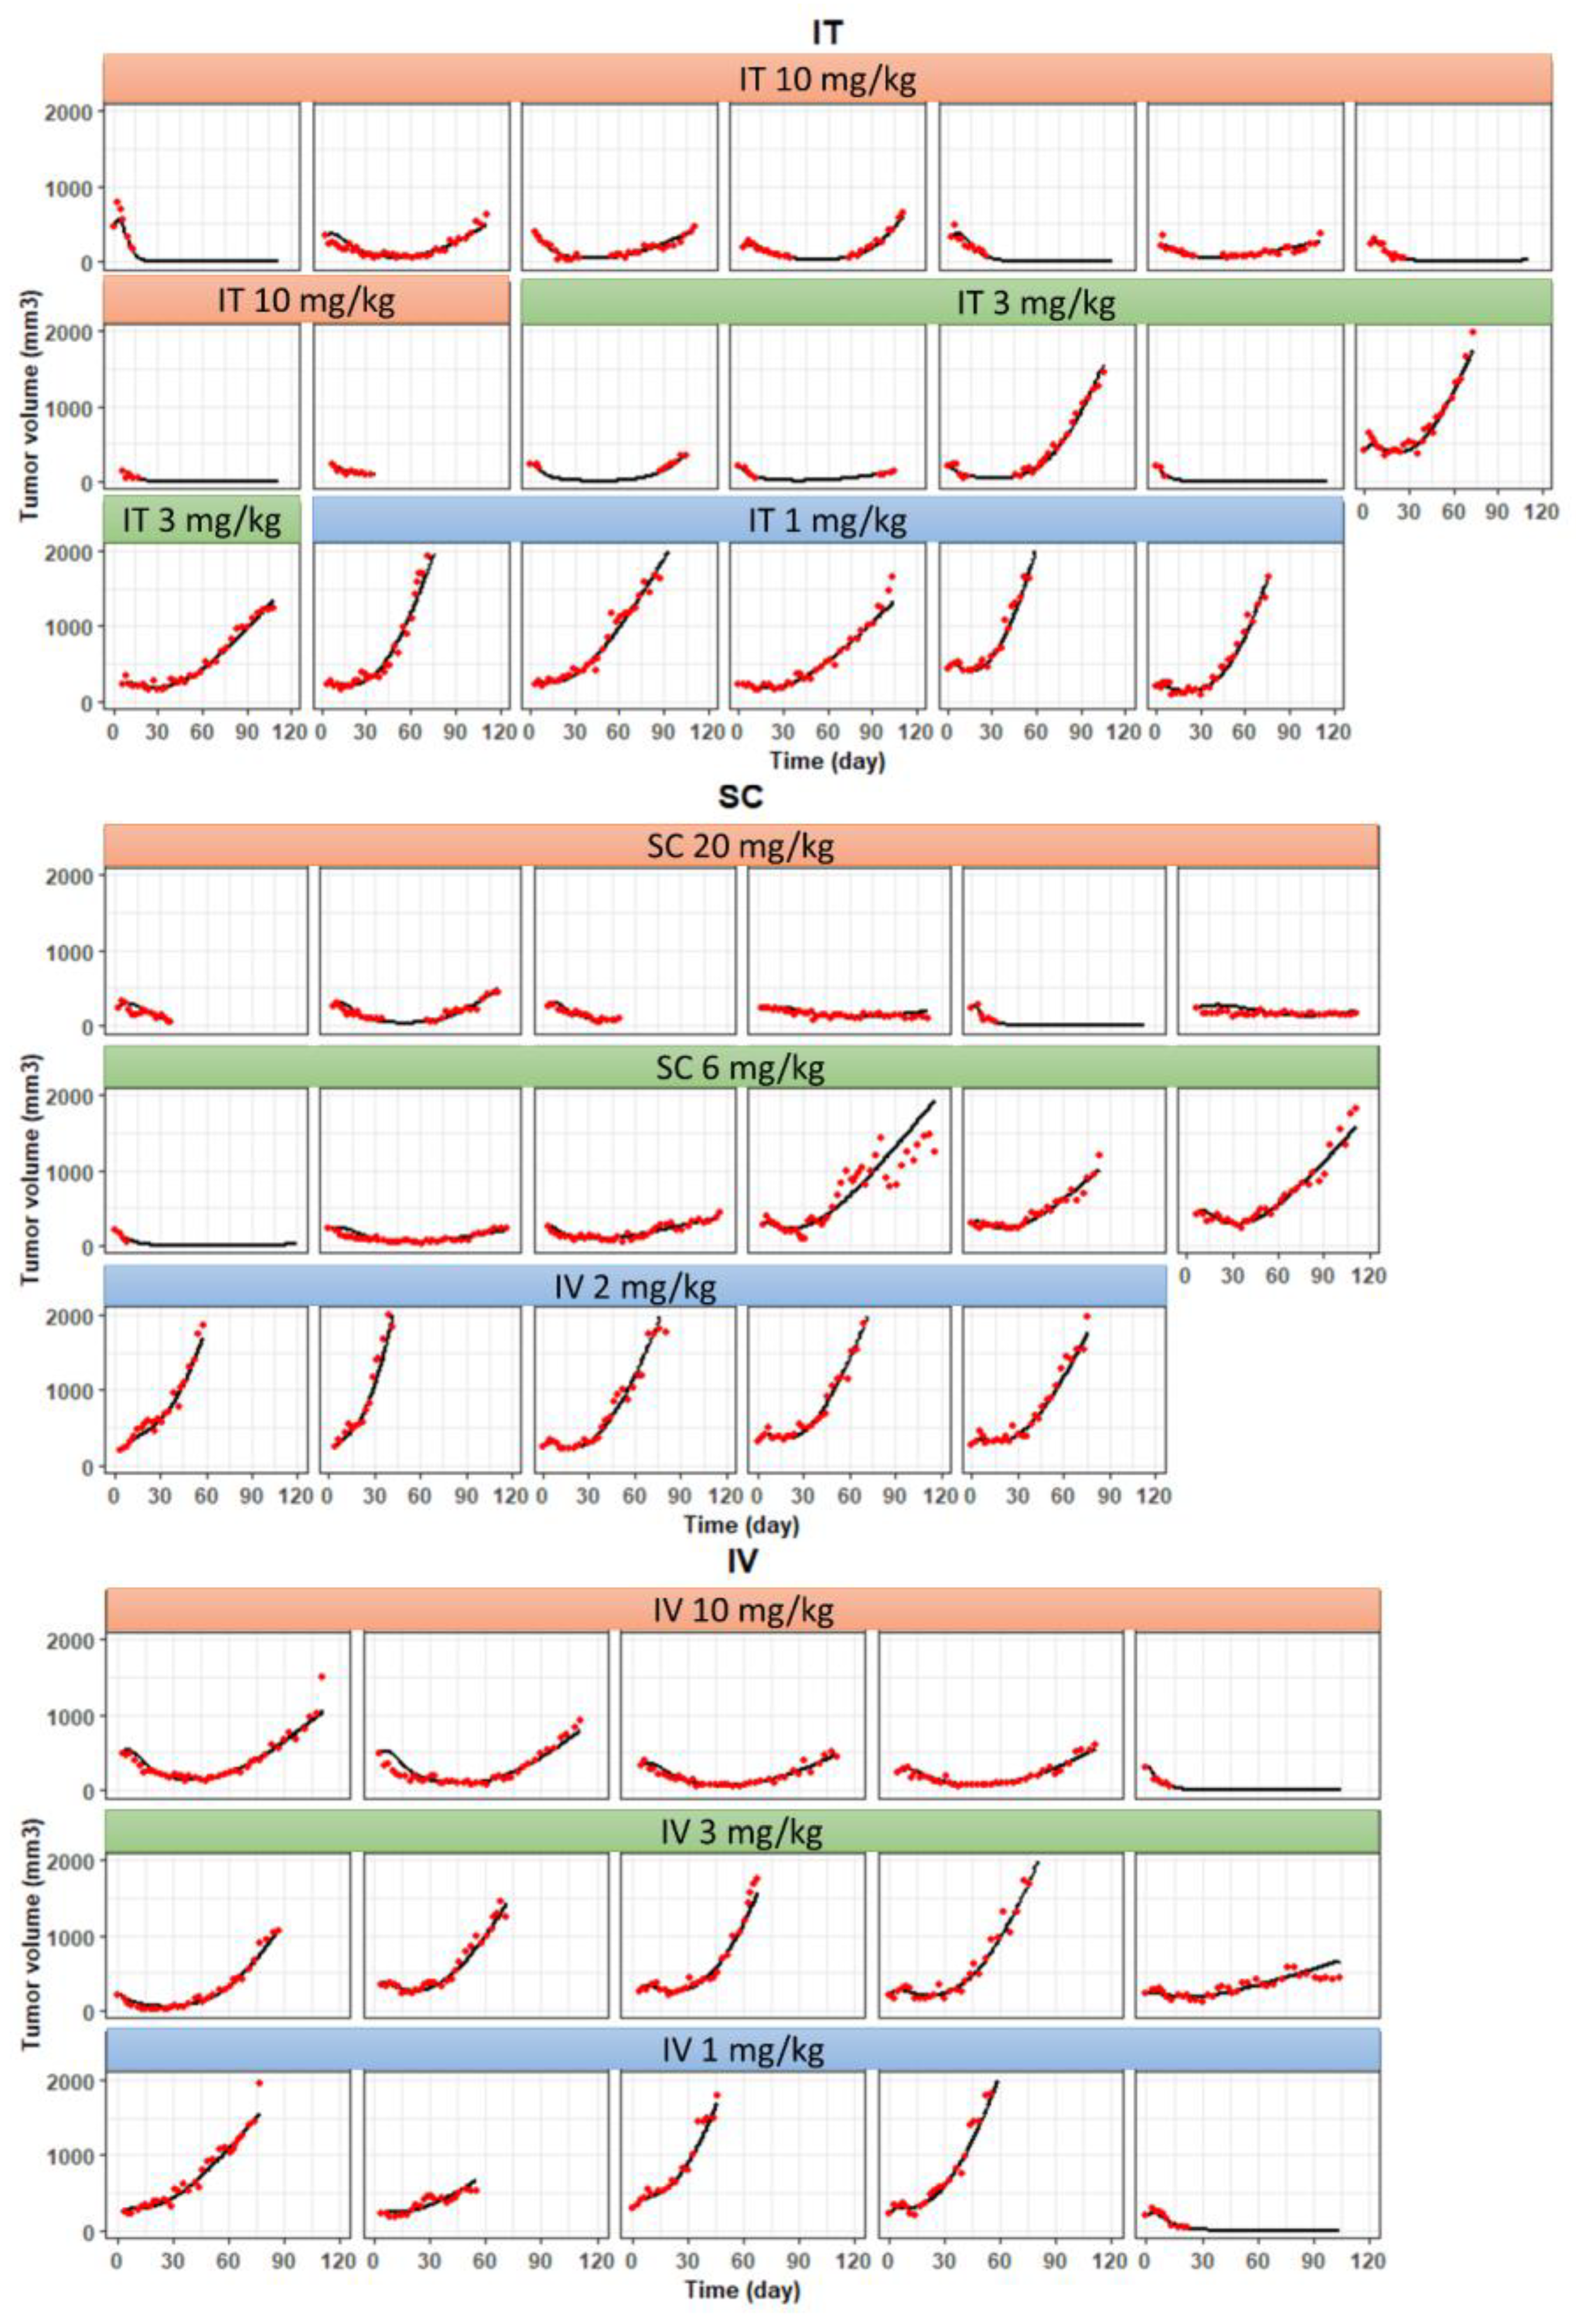
3.6. Development of a PK/PD Model for T-vc-MMAE Administered via IT, SC, and IV Routes
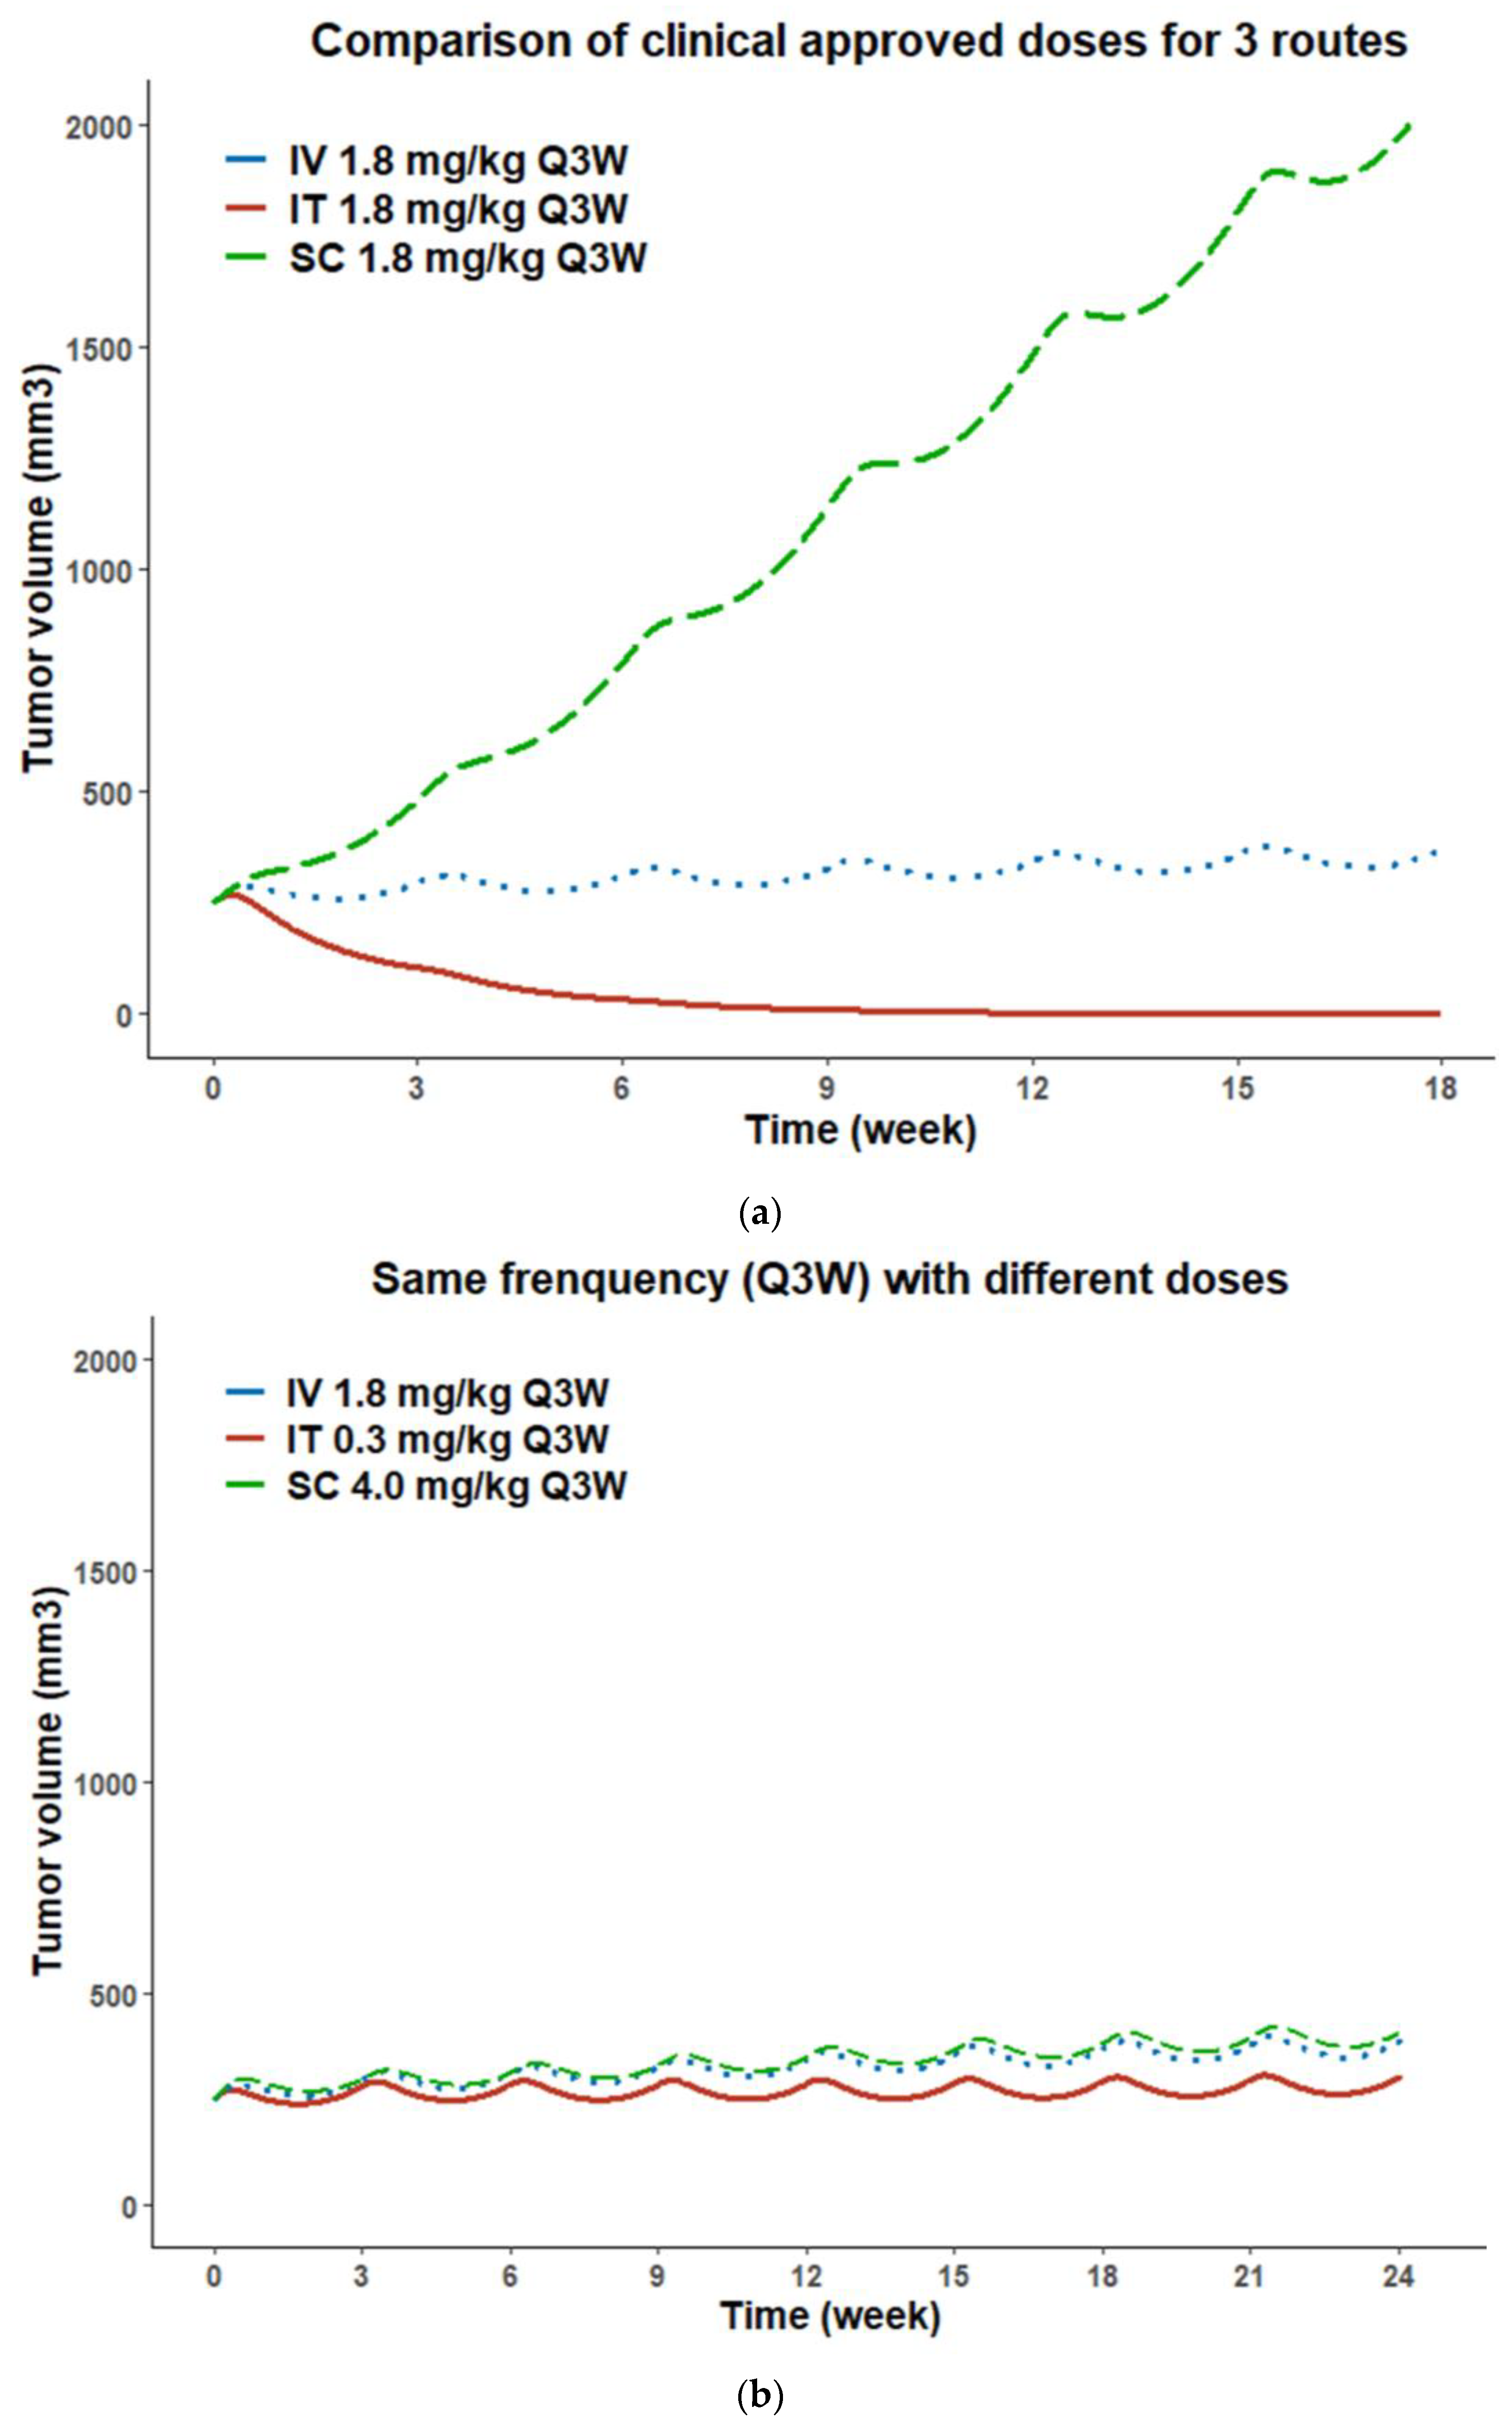
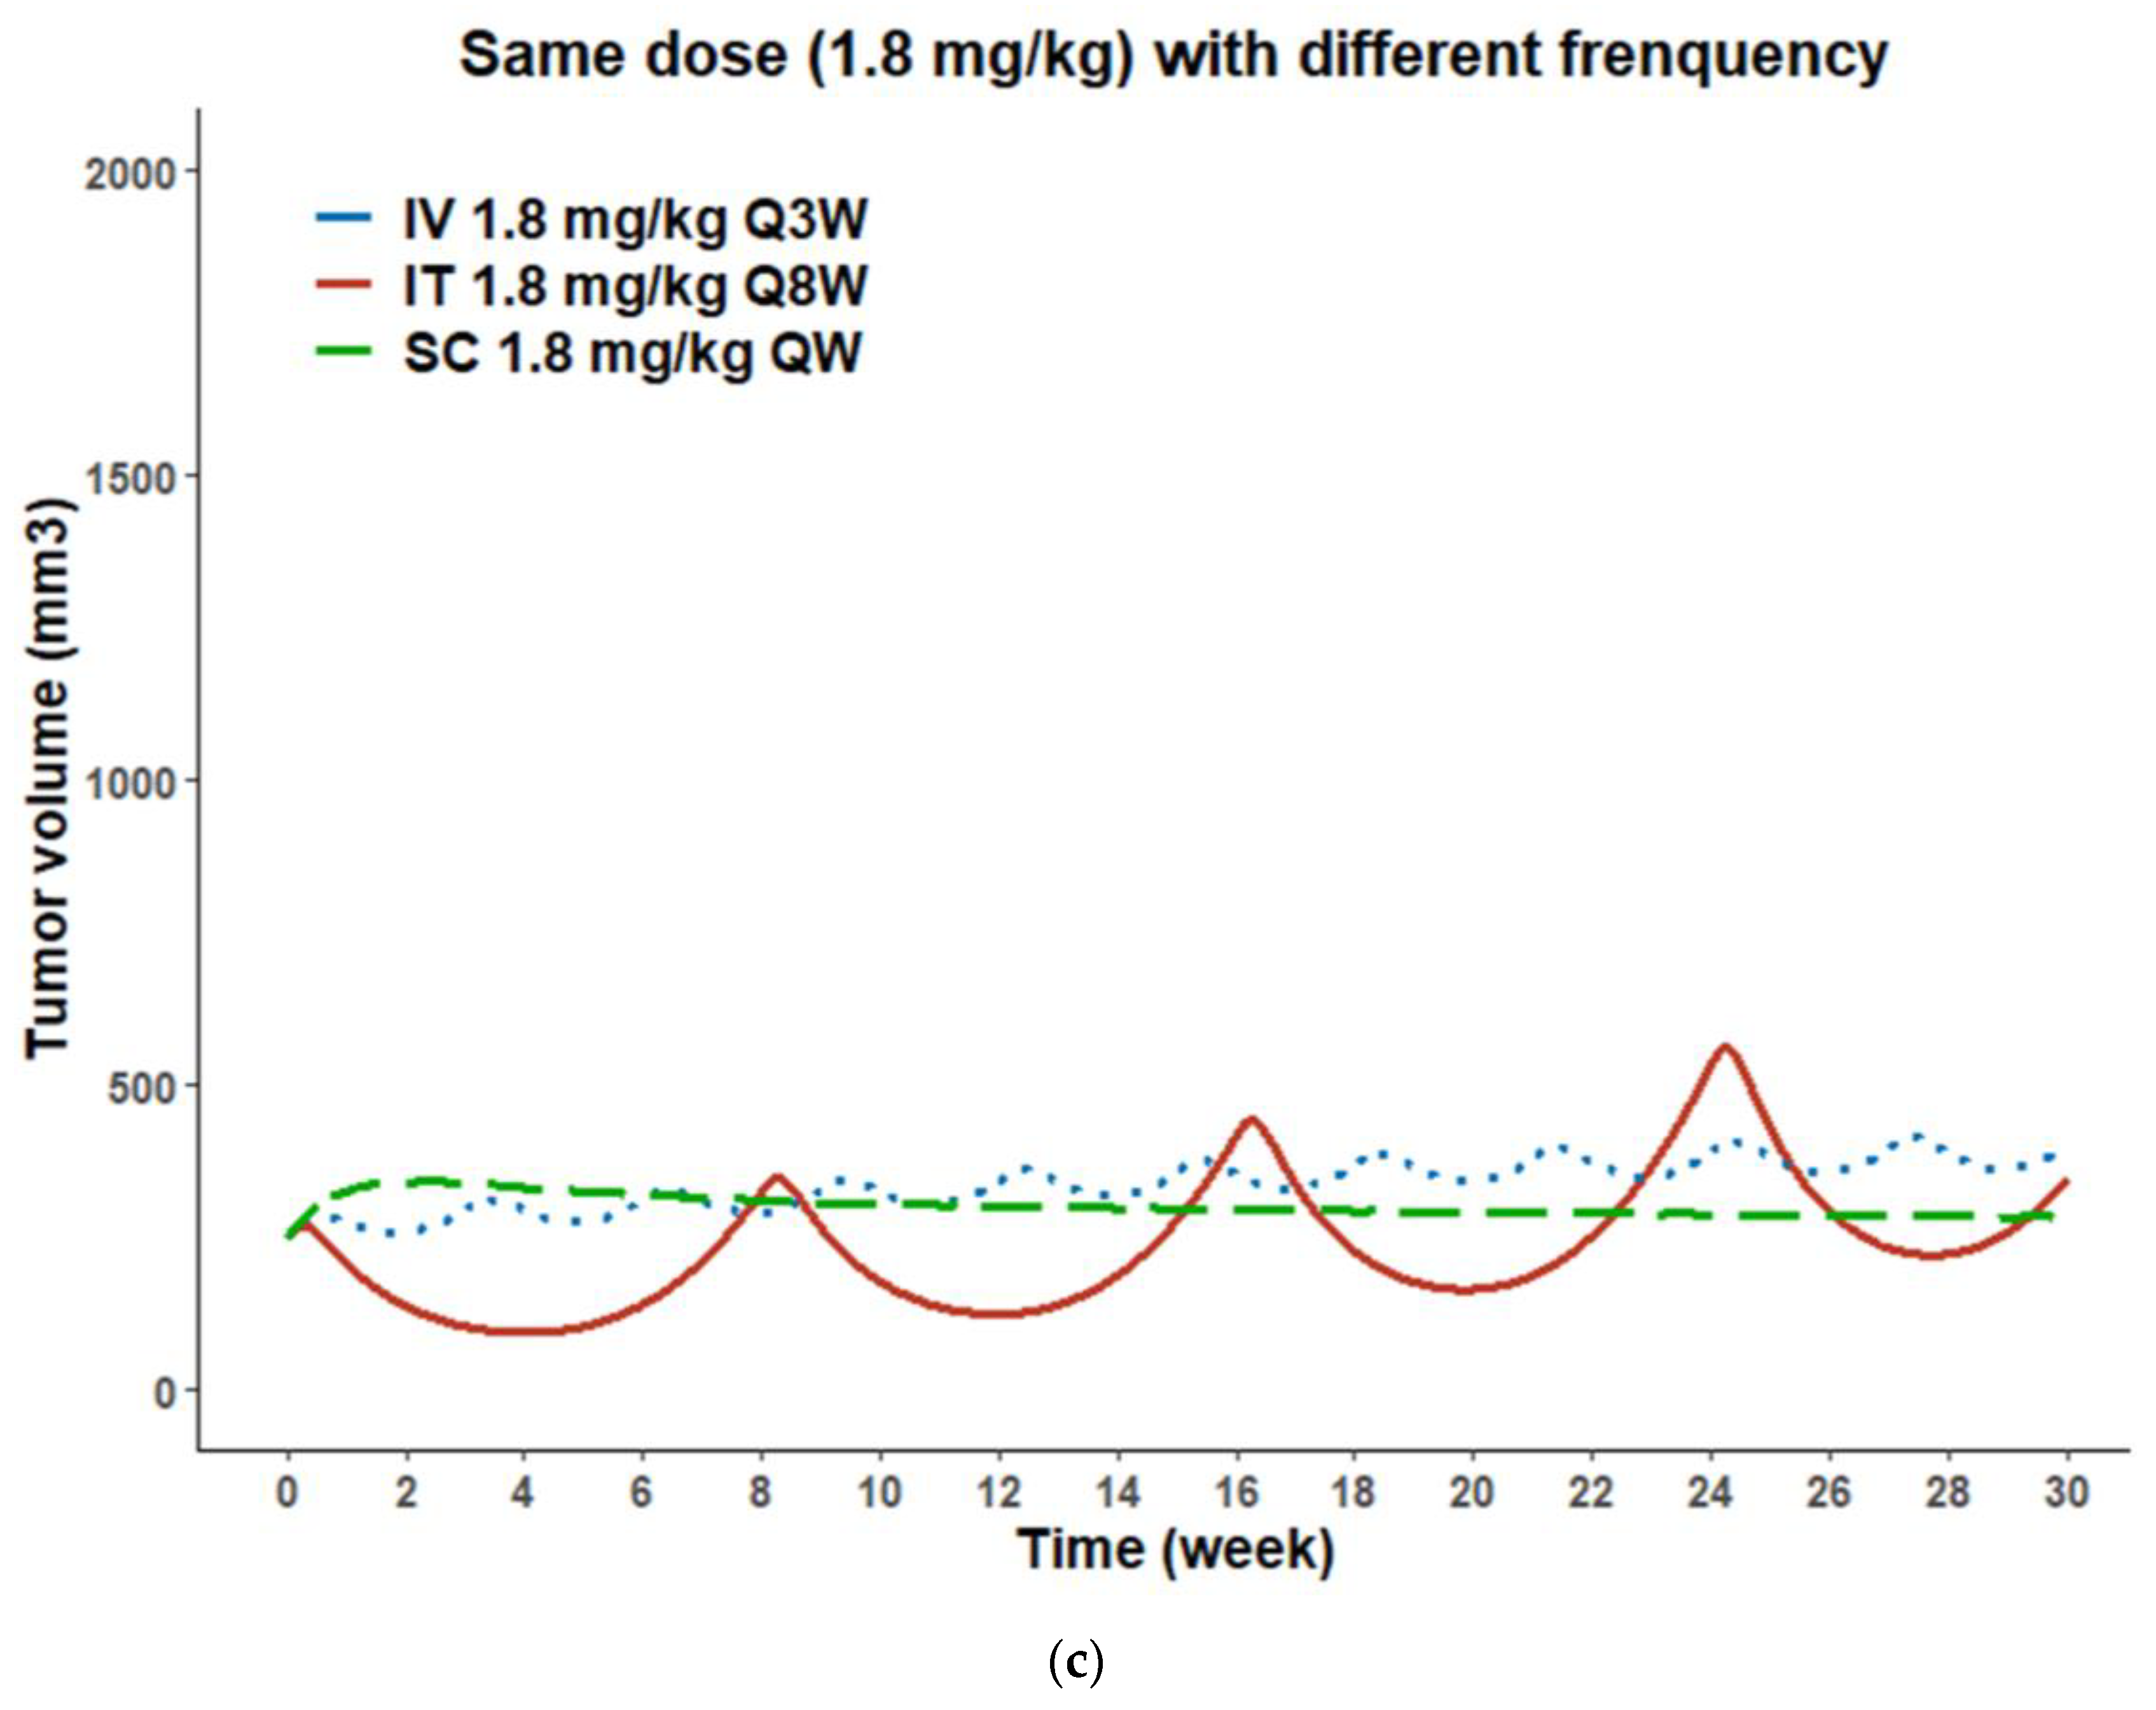
3.7. PK/PD Model Simulations for Administration Route-Dependent Dose Optimization
4. Discussion
5. Conclusions
Supplementary Materials
Author Contributions
Funding
Institutional Review Board Statement
Informed Consent Statement
Data Availability Statement
Conflicts of Interest
References
- Chau, C.H.; Steeg, P.S.; Figg, W.D. Antibody-Drug Conjugates for Cancer. Lancet 2019, 394, 793–804. [Google Scholar] [CrossRef]
- do Pazo, C.; Nawaz, K.; Webster, R.M. The Oncology Market for Antibody-Drug Conjugates. Nat. Rev. Drug Discov. 2021, 20, 583–584. [Google Scholar] [CrossRef]
- Leung, D.; Wurst, J.M.; Liu, T.; Martinez, R.M.; Datta-Mannan, A.; Feng, Y. Antibody Conjugates-Recent Advances and Future Innovations. Antibodies 2020, 9, 2. [Google Scholar] [CrossRef] [Green Version]
- Coats, S.; Williams, M.; Kebble, B.; Dixit, R.; Tseng, L.; Yao, N.S.; Tice, D.A.; Soria, J.C. Antibody-Drug Conjugates: Future Directions in Clinical and Translational Strategies to Improve the Therapeutic Index. Clin. Cancer Res. 2019, 25, 5441–5448. [Google Scholar] [CrossRef] [Green Version]
- Drago, J.Z.; Modi, S.; Chandarlapaty, S. Unlocking the Potential of Antibody–Drug Conjugates for Cancer Therapy. Nat. Rev. Clin. Oncol. 2021, 18, 327–344. [Google Scholar] [CrossRef]
- Khongorzul, P.; Ling, C.J.; Khan, F.U.; Ihsan, A.U.; Zhang, J. Antibody-Drug Conjugates: A Comprehensive Review. Mol. Cancer Res. 2020, 18, 3–19. [Google Scholar] [CrossRef] [PubMed] [Green Version]
- Shah, D.K.; Barletta, F.; Betts, A.; Hansel, S. Key Bioanalytical Measurements for Antibody-Drug Conjugate Development: PK/PD Modelers’ Perspective. Bioanalysis 2013, 5, 989–992. [Google Scholar] [CrossRef] [PubMed]
- Pitiot, A.; Heuzé-Vourc’h, N.; Sécher, T. Alternative Routes of Administration for Therapeutic Antibodies-State of the Art. Antibodies 2022, 11, 56. [Google Scholar] [CrossRef]
- Bittner, B.; Richter, W.; Schmidt, J. Subcutaneous Administration of Biotherapeutics: An Overview of Current Challenges and Opportunities. BioDrugs 2018, 32, 425–440. [Google Scholar] [CrossRef] [PubMed] [Green Version]
- Aznar, M.A.; Tinari, N.; Rullán, A.J.; Sánchez-Paulete, A.R.; Rodriguez-Ruiz, M.E.; Melero, I. Intratumoral Delivery of Immunotherapy-Act Locally, Think Globally. J. Immunol. 2017, 198, 31–39. [Google Scholar] [CrossRef] [Green Version]
- McDonald, T.A.; Zepeda, M.L.; Tomlinson, M.J.; Bee, W.H.; Ivens, I.A. Subcutaneous Administration of Biotherapeutics: Current Experience in Animal Models. Curr. Opin. Mol. Ther. 2010, 12, 461–470. [Google Scholar]
- Zhang, D.; Dragovich, P.S.; Yu, S.-F.; Ma, Y.; Pillow, T.H.; Sadowsky, J.D.; Su, D.; Wang, W.; Polson, A.; Khojasteh, S.C.; et al. Exposure-Efficacy Analysis of Antibody-Drug Conjugates Delivering an Excessive Level of Payload to Tissues. Drug Metab. Dispos. 2019, 47, 1146. [Google Scholar] [CrossRef]
- Collins, D.S.; Sánchez-Félix, M.; Badkar, A.V.; Mrsny, R. Accelerating the Development of Novel Technologies and Tools for the Subcutaneous Delivery of Biotherapeutics. J. Control. Release 2020, 321, 475–482. [Google Scholar] [CrossRef] [PubMed]
- Hafeez, U.; Parakh, S.; Gan, H.K.; Scott, A.M. Antibody-Drug Conjugates for Cancer Therapy. Molecules 2020, 25, 15–29. [Google Scholar] [CrossRef] [PubMed]
- Sánchez-Félix, M.; Burke, M.; Chen, H.H.; Patterson, C.; Mittal, S. Predicting Bioavailability of Monoclonal Antibodies After Subcutaneous Administration: Open Innovation Challenge. Adv. Drug Deliv. Rev. 2020, 167, 66–77. [Google Scholar] [CrossRef]
- Emens, L.; Beeram, M.; Hamilton, E.; Piha-Paul, S.; Odegard, V.; Hamke, S.; Hunder, N.; Klempner, S. A Phase 1/1b Study of SBT6050, a HER2-Directed Monoclonal Antibody Conjugated to A Toll-Like Receptor 8 Agonist, in Subjects with Advanced HER2-Expressing Solid Tumors (Abstract 317A). J. ImmunoTherapy Cancer 2020, 8, A195. [Google Scholar] [CrossRef]
- Klempner, S. Interim Results of a Phase I/Ib Study of SBT6050 Monotherapy and Pembrolizumab Combination in Patients with Advanced HER2-Expressing or Amplified Solid Tumors (Abstract 209P). Ann. Oncol. 2021, 32 (Suppl. S5), S447–S456. [Google Scholar] [CrossRef]
- Goldenberg, D.M. Subcutaneous Administration of Antibody-Drug Conjugates for Cancer Therapy. U.S. Patent 10799597B2, 11 October 2018. [Google Scholar]
- Fathallah, A.M.; Balu-Iyer, S.V. Anatomical, Physiological, and Experimental Factors Affecting the Bioavailability of sc-administered Large Biotherapeutics. J. Pharm. Sci. 2015, 104, 301–306. [Google Scholar] [CrossRef] [Green Version]
- Wang, W.; Chen, N.; Shen, X.; Cunningham, P.; Fauty, S.; Michel, K.; Wang, B.; Hong, X.; Adreani, C.; Nunes, C.N.; et al. Lymphatic Transport and Catabolism of Therapeutic Proteins after Subcutaneous Administration to Rats and Dogs. Drug Metab. Dispos. 2012, 40, 952–962. [Google Scholar] [CrossRef] [Green Version]
- Varkhede, N.; Bommana, R.; Schöneich, C.; Forrest, M.L. Proteolysis and Oxidation of Therapeutic Proteins After Intradermal or Subcutaneous Administration. J. Pharm. Sci. 2020, 109, 191–205. [Google Scholar] [CrossRef] [PubMed] [Green Version]
- Melero, I.; Castanon, E.; Alvarez, M.; Champiat, S.; Marabelle, A. Intratumoural Administration and Tumour Tissue Targeting of Cancer Immunotherapies. Nat. Rev. Clin. Oncol. 2021, 18, 558–576. [Google Scholar] [CrossRef]
- Hong, W.X.; Haebe, S.; Lee, A.S.; Westphalen, C.B.; Norton, J.A.; Jiang, W.; Levy, R. Intratumoral Immunotherapy for Early-stage Solid Tumors. Clin. Cancer Res. 2020, 26, 3091–3099. [Google Scholar] [CrossRef] [PubMed] [Green Version]
- Champiat, S.; Tselikas, L.; Farhane, S.; Raoult, T.; Texier, M.; Lanoy, E.; Massard, C.; Robert, C.; Ammari, S.; De Baère, T.; et al. Intratumoral Immunotherapy: From Trial Design to Clinical Practice. Clin. Cancer Res. 2021, 27, 665–679. [Google Scholar] [CrossRef]
- Som, A.; Rosenboom, J.G.; Chandler, A.; Sheth, R.A.; Wehrenberg-Klee, E. Image-Guided Intratumoral Immunotherapy: Developing a Clinically Practical Technology. Adv. Drug Deliv. Rev. 2022, 189, 114505. [Google Scholar] [CrossRef]
- Rehman, H.; Silk, A.W.; Kane, M.P.; Kaufman, H.L. Into The Clinic: Talimogene Laherparepvec (T-VEC), A First-in-Class Intratumoral Oncolytic Viral Therapy. J. Immunother. Cancer 2016, 4, 53. [Google Scholar] [CrossRef] [PubMed] [Green Version]
- Frampton, J.E. Teserpaturev/G47Δ: First Approval. BioDrugs 2022, 36, 667–672. [Google Scholar] [CrossRef] [PubMed]
- Bonvalot, S.; Rutkowski, P.L.; Thariat, J.; Carrère, S.; Ducassou, A.; Sunyach, M.-P.; Agoston, P.; Hong, A.M.; Mervoyer, A.; Rastrelli, M.; et al. Final Safety and Health-Related Quality of Life Results of the Phase 2/3 Act.In.Sarc Study with Preoperative NBTXR3 Plus Radiation Therapy Versus Radiation Therapy in Locally Advanced Soft-Tissue Sarcoma. Int. J. Radiat. Oncol. Biol. Phys. 2022, 114, 422–432. [Google Scholar] [CrossRef]
- Kitamura, K.; Takahashi, T.; Miyagaki, T.; Yamaoka, N.; Tsurumi, H.; Ohtsuji, E.; Kamiguchi, M.; Noguchi, A.; Yamaguchi, T. Efficacy and Specificity of a Monoclonal Antibody-Drug Conjugate in Chemotherapy by Intratumoral Injection. Jpn. J. Cancer Res. 1992, 83, 769–774. [Google Scholar] [CrossRef] [PubMed]
- Kitamura, K.; Takahashi, T.; Kotani, T.; Miyagaki, T.; Yamaoka, N.; Tsurumi, H.; Noguchi, A.; Yamaguchi, T. Local Administration of Monoclonal Antibody-Drug Conjugate: A New Strategy to Reduce the Local Recurrence of Colorectal Cancer. Cancer Res. 1992, 52, 6323–6328. [Google Scholar]
- Otsuji, E.; Yamaguchi, T.; Tsuruta, H.; Yata, Y.; Nishi, H.; Okamoto, K.; Taniguchi, K.; Kato, M.; Kotani, T.; Kitamura, K.; et al. The Effect of Intravenous and Intra-Tumoural Chemotherapy Using a Monoclonal Antibody-Drug Conjugate in A Xenograft Model of Pancreatic Cancer. Eur. J. Surg. Oncol. 1995, 21, 61–65. [Google Scholar] [CrossRef]
- Chang, H.-P.; Li, Z.; Shah, D.K. Development of a Physiologically-Based Pharmacokinetic Model for Whole-Body Disposition of MMAE Containing Antibody-Drug Conjugate in Mice. Pharm. Res. 2022, 39, 1–24. [Google Scholar] [CrossRef] [PubMed]
- Fu, Z.; Li, S.; Han, S.; Shi, C.; Zhang, Y. Antibody Drug Conjugate: The "Biological Missile" for Targeted Cancer Therapy. Signal Transduct. Target. Ther. 2022, 7, 93. [Google Scholar] [CrossRef] [PubMed]
- Singh, A.P.; Shah, D.K. Measurement and Mathematical Characterization of Cell-Level Pharmacokinetics of Antibody-Drug Conjugates: A Case Study with Trastuzumab-vc-MMAE. Drug Metab. Dispos. 2017, 45, 1120–1132. [Google Scholar] [CrossRef]
- Xu, K.; Liu, L.; Dere, R.; Mai, E.; Erickson, R.; Hendricks, A.; Lin, K.; Junutula, J.R.; Kaur, S. Characterization of the Drug-to-Antibody Ratio Distribution for Antibody-Drug Conjugates in Plasma/Serum. Bioanalysis 2013, 5, 1057–1071. [Google Scholar] [CrossRef]
- Singh, A.P.; Sharma, S.; Shah, D.K. Quantitative Characterization of In Vitro Bystander Effect of Antibody-Drug Conjugates. J. Pharmacokinet. Pharmacodyn. 2016, 43, 567–582. [Google Scholar] [CrossRef] [PubMed] [Green Version]
- Chang, H.P.; Kim, S.J.; Shah, D.K. Whole-Body Pharmacokinetics of Antibody in Mice Determined using Enzyme-Linked Immunosorbent Assay and Derivation of Tissue Interstitial Concentrations. J. Pharm. Sci. 2020, 110, 446–457. [Google Scholar] [CrossRef]
- Shah, D.K.; Haddish-Berhane, N.; Betts, A. Bench to Bedside Translation of Antibody Drug Conjugates Using a Multiscale Mechanistic PK/PD Model: A Case Study with Brentuximab-Vedotin. J. Pharmacokinet. Pharmacodyn. 2012, 39, 643–659. [Google Scholar] [CrossRef]
- Shah, D.K.; King, L.E.; Han, X.; Wentland, J.A.; Zhang, Y.; Lucas, J.; Haddish-Berhane, N.; Betts, A.; Leal, M. A Priori Prediction of Tumor Payload Concentrations: Preclinical Case Study with an Auristatin-Based Anti-5T4 Antibody-Drug Conjugate. AAPS J. 2014, 16, 452–463. [Google Scholar] [CrossRef] [Green Version]
- Yuan, F.; Dellian, M.; Fukumura, D.; Leunig, M.; Berk, D.A.; Torchilin, V.P.; Jain, R.K. Vascular Permeability in a Human Tumor Xenograft: Molecular Size Dependence and Cutoff Size1. Cancer Res. 1995, 55, 3752–3756. [Google Scholar] [PubMed]
- Schmidt, M.M.; Wittrup, K.D. A Modeling Analysis of the Effects of Molecular Size and Binding Affinity on Tumor Targeting. Mol. Cancer Ther. 2009, 8, 2861–2871. [Google Scholar] [CrossRef] [Green Version]
- Cartaxo, A.L.; Almeida, J.; Gualda, E.J.; Marsal, M.; Loza-Alvarez, P.; Brito, C.; Isidro, I.A. A Computational Diffusion Model to Study Antibody Transport Within Reconstructed Tumor Microenvironments. BMC Bioinform. 2020, 21, 529. [Google Scholar] [CrossRef] [PubMed]
- Thurber, G.M.; Dane Wittrup, K. A Mechanistic Compartmental Model for Total Antibody Uptake in Tumors. J. Theor. Biol. 2012, 314, 57–68. [Google Scholar] [CrossRef] [PubMed] [Green Version]
- Lua, W.-H.; Ling, W.-L.; Yeo, J.Y.; Poh, J.-J.; Lane, D.P.; Gan, S.K.-E. The Effects of Antibody Engineering CH and CL in Trastuzumab and Pertuzumab Recombinant Models: Impact on Antibody Production and Antigen-Binding. Sci. Rep. 2018, 8, 718. [Google Scholar] [CrossRef] [Green Version]
- Maass, K.F.; Kulkarni, C.; Betts, A.M.; Wittrup, K.D. Determination of Cellular Processing Rates for a Trastuzumab-Maytansinoid Antibody-Drug Conjugate (ADC) Highlights Key Parameters for ADC Design. AAPS J. 2016, 18, 635–646. [Google Scholar] [CrossRef] [Green Version]
- Waight, A.B.; Bargsten, K.; Doronina, S.; Steinmetz, M.O.; Sussman, D.; Prota, A.E. Structural Basis of Microtubule Destabilization by Potent Auristatin Anti-Mitotics. PLoS ONE 2016, 11, e0160890. [Google Scholar] [CrossRef] [Green Version]
- Chang, H.P.; Cheung, Y.K.; Shah, D.K. Whole-Body Pharmacokinetics and Physiologically Based Pharmacokinetic Model for Monomethyl Auristatin E (MMAE). J. Clin. Med. 2021, 10, 1332. [Google Scholar] [CrossRef]
- Dozier, J.H.; Hiser, L.; Davis, J.A.; Thomas, N.S.; Tucci, M.A.; Benghuzzi, H.A.; Frankfurter, A.; Correia, J.J.; Lobert, S. β Class II Tubulin Predominates in Normal and Tumor Breast Tissues. Breast Cancer Res. 2003, 5, R157. [Google Scholar] [CrossRef] [PubMed] [Green Version]
- Best, R.L.; LaPointe, N.E.; Azarenko, O.; Miller, H.; Genualdi, C.; Chih, S.; Shen, B.-Q.; Jordan, M.A.; Wilson, L.; Feinstein, S.C.; et al. Microtubule and Tubulin Binding and Regulation of Microtubule Dynamics by the Antibody Drug Conjugate (ADC) Payload, Monomethyl Auristatin E (MMAE): Mechanistic Insights into MMAE ADC Peripheral Neuropathy. Toxicol. Appl. Pharmacol. 2021, 421, 115534. [Google Scholar] [CrossRef]
- Parray, H.A.; Shukla, S.; Perween, R.; Khatri, R.; Shrivastava, T.; Singh, V.; Murugavelu, P.; Ahmed, S.; Samal, S.; Sharma, C.; et al. Inhalation Monoclonal Antibody Therapy: A New Way to Treat and Manage Respiratory Infections. Appl. Microbiol. Biotechnol. 2021, 105, 6315–6332. [Google Scholar] [CrossRef]
- Barcelona, P.F.; Galan, A.; Nedev, H.; Jian, Y.; Sarunic, M.V.; Saragovi, H.U. The Route of Administration Influences the Therapeutic Index of An Anti-ProNGF Neutralizing mAb for Experimental Treatment of Diabetic Retinopathy. PLoS ONE 2018, 13, e0199079. [Google Scholar] [CrossRef] [PubMed]
- Challita-Eid, P.M.; Satpayev, D.; Yang, P.; An, Z.; Morrison, K.; Shostak, Y.; Raitano, A.; Nadell, R.; Liu, W.; Lortie, D.R.; et al. Enfortumab Vedotin Antibody–Drug Conjugate Targeting Nectin-4 Is A Highly Potent Therapeutic Agent in Multiple Preclinical Cancer Models. Cancer Res. 2016, 76, 3003–3013. [Google Scholar] [CrossRef] [Green Version]
- Li, C.; Zhang, C.; Li, Z.; Samineni, D.; Lu, D.; Wang, B.; Chen, S.C.; Zhang, R.; Agarwal, P.; Fine, B.M.; et al. Clinical Pharmacology of Vc-MMAE Antibody-Drug Conjugates in Cancer Patients: Learning from Eight First-in-Human Phase 1 Studies. MAbs 2020, 12, 1699768. [Google Scholar] [CrossRef] [PubMed] [Green Version]
- Suri, A.; Mould, D.R.; Song, G.; Collins, G.P.; Endres, C.J.; Gomez-Navarro, J.; Venkatakrishnan, K. Population Pharmacokinetic Modeling and Exposure–Response Assessment for the Antibody-Drug Conjugate Brentuximab Vedotin in Hodgkin’s Lymphoma in the Phase III ECHELON-1 Study. Clin. Pharmacol. Ther. 2019, 106, 1268–1279. [Google Scholar] [CrossRef] [Green Version]
- Lu, T.; Gibiansky, L.; Li, X.; Li, C.; Shi, R.; Agarwal, P.; Hirata, J.; Miles, D.; Chanu, P.; Girish, S.; et al. Exposure-Safety and Exposure-Efficacy Analyses of Polatuzumab Vedotin in Patients with Relapsed or Refractory Diffuse Large B-Cell Lymphoma. Leuk Lymphoma 2020, 61, 2905–2914. [Google Scholar] [CrossRef]
- Liao, M.Z.; Lu, D.; Kågedal, M.; Miles, D.; Samineni, D.; Liu, S.N.; Li, C. Model-Informed Therapeutic Dose Optimization Strategies for Antibody–Drug Conjugates in Oncology: What Can We Learn From US Food and Drug Administration–Approved Antibody–Drug Conjugates? Clin. Pharmacol. Ther. 2021, 110, 1216–1230. [Google Scholar] [CrossRef] [PubMed]
- Hinrichs, M.J.M.; Ryan, P.M.; Zheng, B.; Afif-Rider, S.; Yu, X.Q.; Gunsior, M.; Zhong, H.; Harper, J.; Bezabeh, B.; Vashisht, K.; et al. Fractionated Dosing Improves Preclinical Therapeutic Index of Pyrrolobenzodiazepine-Containing Antibody Drug Conjugates. Clin. Cancer Res. 2017, 23, 5858–5868. [Google Scholar] [CrossRef] [Green Version]
- Momin, N.; Palmeri, J.R.; Lutz, E.A.; Jailkhani, N.; Mak, H.; Tabet, A.; Chinn, M.M.; Kang, B.H.; Spanoudaki, V.; Hynes, R.O.; et al. Maximizing Response to Intratumoral Immunotherapy in Mice by Tuning Local Retention. Nat. Commun. 2022, 13, 109. [Google Scholar] [CrossRef] [PubMed]
- Betts, A.M.; Haddish-Berhane, N.; Tolsma, J.; Jasper, P.; King, L.E.; Sun, Y.; Chakrapani, S.; Shor, B.; Boni, J.; Johnson, T.R. Preclinical to Clinical Translation of Antibody-Drug Conjugates Using PK/PD Modeling: A Retrospective Analysis of Inotuzumab Ozogamicin. AAPS J. 2016, 18, 1101–1116. [Google Scholar] [CrossRef]
- Haddish-Berhane, N.; Shah, D.K.; Ma, D.; Leal, M.; Gerber, H.P.; Sapra, P.; Barton, H.A.; Betts, A.M. On Translation of Antibody Drug Conjugates Efficacy from Mouse Experimental Tumors to The Clinic: A PK/PD Approach. J. Pharm. Pharm. 2013, 40, 557–571. [Google Scholar] [CrossRef]
- Center for Drug Evaluation and Research, U.S. Food and Drug Administration. Clinical Trial Endpoints for The Approval of Cancer Drugs and Biologics; Silver Spring, DC, USA, 2018.
- Francisco, J.A.; Cerveny, C.G.; Meyer, D.L.; Mixan, B.J.; Klussman, K.; Chace, D.F.; Rejniak, S.X.; Gordon, K.A.; DeBlanc, R.; Toki, B.E.; et al. cAC10-vcMMAE, An Anti-CD30–Monomethyl Auristatin E Conjugate with Potent and Selective Antitumor Activity. Blood 2003, 102, 1458–1465. [Google Scholar] [CrossRef] [Green Version]
- Newman, R.A.; Fuentes, A.; Covey, J.M.; Benvenuto, J.A. Preclinical Pharmacology of the Natural Marine Product Dolastatin 10 (NSC 376128). Drug Metab. Dispos. 1994, 22, 428–432. [Google Scholar]
- Pasparakis, M.; Haase, I.; Nestle, F.O. Mechanisms Regulating Skin Immunity and Inflammation. Nat. Rev. Immunol. 2014, 14, 289–301. [Google Scholar] [CrossRef]
- Viola, M.; Sequeira, J.; Seiça, R.; Veiga, F.; Serra, J.; Santos, A.C.; Ribeiro, A.J. Subcutaneous Delivery of Monoclonal Antibodies: How Do We Get There? J. Control. Release 2018, 286, 301–314. [Google Scholar] [CrossRef] [PubMed]
- Xie, Y.; Hu, C.; Feng, Y.; Li, D.; Ai, T.; Huang, Y.; Chen, X.; Huang, L.; Tan, J. Osteoimmunomodulatory Effects of Biomaterial Modification Strategies on Macrophage Polarization and Bone Regeneration. Regen. Biomater. 2020, 7, 233–245. [Google Scholar] [CrossRef] [PubMed]
- Marabelle, A.; Tselikas, L.; de Baere, T.; Houot, R. Intratumoral Immunotherapy: Using The Tumor as The Remedy. Ann. Oncol. 2017, 28, xii33–xii43. [Google Scholar] [CrossRef]
- Marabelle, A.; Andtbacka, R.; Harrington, K.; Melero, I.; Leidner, R.; de Baere, T.; Robert, C.; Ascierto, P.A.; Baurain, J.F.; Imperiale, M.; et al. Starting the Fight in The Tumor: Expert Recommendations for The Development of Human Intratumoral Immunotherapy (HIT-IT). Ann. Oncol. 2018, 29, 2163–2174. [Google Scholar] [CrossRef] [PubMed]
- Yuan, J.; Khilnani, A.; Brody, J.; Andtbacka, R.H.I.; Hu-Lieskovan, S.; Luke, J.J.; Diab, A.; Marabelle, A.; Snyder, A.; Cao, Z.A.; et al. Current Strategies for Intratumoural Immunotherapy—Beyond Immune Checkpoint Inhibition. Eur. J. Cancer 2021, 157, 493–510. [Google Scholar] [CrossRef]
- Müller, P.; Rios-Doria, J.; Harper, J.; Cao, A. Combining ADCs with Immuno-Oncology Agents. In Innovations for Next-Generation Antibody-Drug Conjugates; Damelin, M., Ed.; Springer International Publishing: Cham, Switzerland, 2018; pp. 11–44. [Google Scholar]
- Gerber, H.P.; Sapra, P.; Loganzo, F.; May, C. Combining Antibody-Drug Conjugates and Immune-Mediated Cancer Therapy: What to Expect? Biochem. Pharmacol. 2016, 102, 1–6. [Google Scholar] [CrossRef]
- Sheth, R.A.; Murthy, R.; Hong, D.S.; Patel, S.; Overman, M.J.; Diab, A.; Hwu, P.; Tam, A. Assessment of Image-Guided Intratumoral Delivery of Immunotherapeutics in Patients With Cancer. JAMA Netw. Open 2020, 3, e207911. [Google Scholar] [CrossRef]
- Zeeshan, R.; Mutahir, Z. Cancer Metastasis—Tricks of The Trade. Bosn. J. Basic Med. Sci. 2017, 17, 172–182. [Google Scholar] [CrossRef] [Green Version]
- Muñoz, N.M.; Williams, M.; Dixon, K.; Dupuis, C.; McWatters, A.; Avritscher, R.; Manrique, S.Z.; McHugh, K.; Murthy, R.; Tam, A.; et al. Influence of Injection Technique, Drug Formulation and Tumor Microenvironment on Intratumoral Immunotherapy Delivery and Efficacy. J. Immunother. Cancer 2021, 9, e001800. [Google Scholar] [CrossRef] [PubMed]
- Dorywalska, M.; Strop, P.; Melton-Witt, J.A.; Hasa-Moreno, A.; Farias, S.E.; Galindo Casas, M.; Delaria, K.; Lui, V.; Poulsen, K.; Loo, C.; et al. Effect of Attachment Site on Stability of Cleavable Antibody Drug Conjugates. Bioconjugate Chem. 2015, 26, 650–659. [Google Scholar] [CrossRef] [PubMed]


(h) | (nM) | (h·nM) | (h·nM) |
IT/IV and SC/IV Ratio (%) |
IT/IV and SC/IV Ratio (%) |
Tumor to Plasma Ratio (%) | |
|---|---|---|---|---|---|---|---|
| Total antibody (measured as conjugated + unconjugated antibody) | |||||||
| Plasma | |||||||
| IV | 0.167 | 1690 (5.87) | 1.34 × 10⁵ (4.12) | 7.48 × 10⁵ | - | - | - |
| IT | 72 | 798 (17.6) | 1.24 × 10⁵ (9.31) | 8.49 × 10⁵ | 47.2 | 92.5 | - |
| SC | 24 | 524 (3.73) | 7.70 × 10⁴ (3.98) | - 2 | 31.0 | 57.4 | - |
| Tumor | |||||||
| IV | 72 | 242 (22.7) | 3.52 × 10⁴ (12.8) | 1.94 × 10⁵ | - | - | 26.3 |
| IT | 1 | 4739 (3.16) | 1.30 × 10⁵ (14.6) | 1.33 × 10⁵ | 1959 | 369 | 104 |
| SC | 72 | 114 (7.88) | 1.54 × 10⁴ (8.24) | - 2 | 47.0 | 43.7 | 20.0 |
| Total MMAE 1 (measured as conjugated + unconjugated MMAE) | |||||||
| Plasma | |||||||
| IV | 0.167 | 4058 (3.37) | 1.28 × 10⁵ (3.39) | 1.52 × 10⁵ | - | - | - |
| IT | 6 | 1538 (26.5) | 1.28 × 10⁵ (7.97) | 1.52 × 10⁵ | 37.9 | 99.8 | - |
| SC | 24 | 1011 (2.12) | 1.07 × 10⁵ (7.51) | 1.41 × 10⁵ | 24.9 | 83.4 | - |
| Tumor | |||||||
| IV | 72 | 693 (22.9) | 8.79 × 10⁴ (13.9) | 1.74 × 10⁵ | - | - | 68.5 |
| IT | 0.167 | 3.54 × 10⁴ (19.7) | 3.75 × 10⁵ (13.6) | 3.87 × 10⁵ | 5111 | 426 | 293 |
| SC | 72 | 415 (1.24) | 4.82 × 10⁴ (2.20) | 8.17 × 10⁴ | 59.8 | 54.8 | 45.0 |
| Unconjugated MMAE | |||||||
| Plasma | |||||||
| IV | 0.167 | 11.9 (5.04) | 224 (3.50) | 324 | - | - | - |
| IT | 0.167 | 3.15 (43.6) | 161 (7.64) | 200 | 26.4 | 72.1 | - |
| SC | 24 | 1.67 (8.93) | 165 (8.89) | 207 | 14.0 | 73.9 | - |
| Tumor | |||||||
| IV | 72 | 419 (19.3) | 4.79 × 10⁴ (12.6) | 8.16 × 10⁴ | - | - | 2.14 × 10⁴ |
| IT | 0.167 | 1449 (20.9) | 7.30 × 10⁴ (13.2) | 8.59 × 10⁴ | 346 | 207 | 4.52 × 10⁴ |
| SC | 72 | 185 (6.13) | 2.12 × 10⁴ (6.28) | 6.87 × 10⁴ | 44.2 | 60.3 | 1.28 × 10⁴ |
| Conjugated MMAE | |||||||
| Plasma | |||||||
| IV | 0.167 | 4046 (3.37) | 1.28 × 10⁵ (3.40) | 1.51 × 10⁵ | - | - | - |
| IT | 6 | 1536 (26.5) | 1.28 × 10⁵ (7.98) | 1.52 × 10⁵ | 38.0 | 99.8 | - |
| SC | 24 | 1009 (2.13) | 1.07 × 10⁵ (7.51) | 1.41 × 10⁵ | 25.0 | 83.4 | - |
| Tumor | |||||||
| IV | 24 | 353 (23.0) | 4.01 × 10⁴ (16.9) | 5.25 × 10⁴ | - | - | 31.3 |
| IT | 0.167 | 3.40 × 10⁴ (19.8) | 3.02 × 10⁵ (15.4) | 3.06 × 10⁵ | 9635 | 753 | 236 |
| SC | 72 | 230 (5.75) | 2.70 × 10⁴ (3.98) | 3.44 × 10⁴ | 65.1 | 67.3 | 25.2 |
Disclaimer/Publisher’s Note: The statements, opinions and data contained in all publications are solely those of the individual author(s) and contributor(s) and not of MDPI and/or the editor(s). MDPI and/or the editor(s) disclaim responsibility for any injury to people or property resulting from any ideas, methods, instructions or products referred to in the content. |
© 2023 by the authors. Licensee MDPI, Basel, Switzerland. This article is an open access article distributed under the terms and conditions of the Creative Commons Attribution (CC BY) license (https://creativecommons.org/licenses/by/4.0/).
Share and Cite
Chang, H.-P.; Le, H.K.; Shah, D.K. Pharmacokinetics and Pharmacodynamics of Antibody-Drug Conjugates Administered via Subcutaneous and Intratumoral Routes. Pharmaceutics 2023, 15, 1132. https://doi.org/10.3390/pharmaceutics15041132
Chang H-P, Le HK, Shah DK. Pharmacokinetics and Pharmacodynamics of Antibody-Drug Conjugates Administered via Subcutaneous and Intratumoral Routes. Pharmaceutics. 2023; 15(4):1132. https://doi.org/10.3390/pharmaceutics15041132
Chicago/Turabian StyleChang, Hsuan-Ping, Huyen Khanh Le, and Dhaval K. Shah. 2023. "Pharmacokinetics and Pharmacodynamics of Antibody-Drug Conjugates Administered via Subcutaneous and Intratumoral Routes" Pharmaceutics 15, no. 4: 1132. https://doi.org/10.3390/pharmaceutics15041132