
Development of Olive Oil Containing Phytosomal Nanocomplex for Improving Skin Delivery of Quercetin: Formulation Design Optimization, In Vitro and Ex Vivo Appraisals

 , , , , ,
Abstract
:1. Introduction
2. Materials and Methods
2.1. Materials
2.2. Fabrication of Olive Oil/Phytosomal Complexes
2.3. Experimental Design
2.4. Particle Diameter and Surface Charge
2.5. EE%
2.6. Investigation of QC/Excipients Interaction
2.7. Stability Studies
2.8. In Vitro QC Release
2.9. Ex Vivo Skin Permeation
2.10. Skin Compliance
2.11. Statistical Analysis
3. Results and Discussion
3.1. Rationale and Formulation of QT Loaded Olive Oil/Phytosomal Nanocarries
3.2. Box–Behnken Design Analysis and Optimization
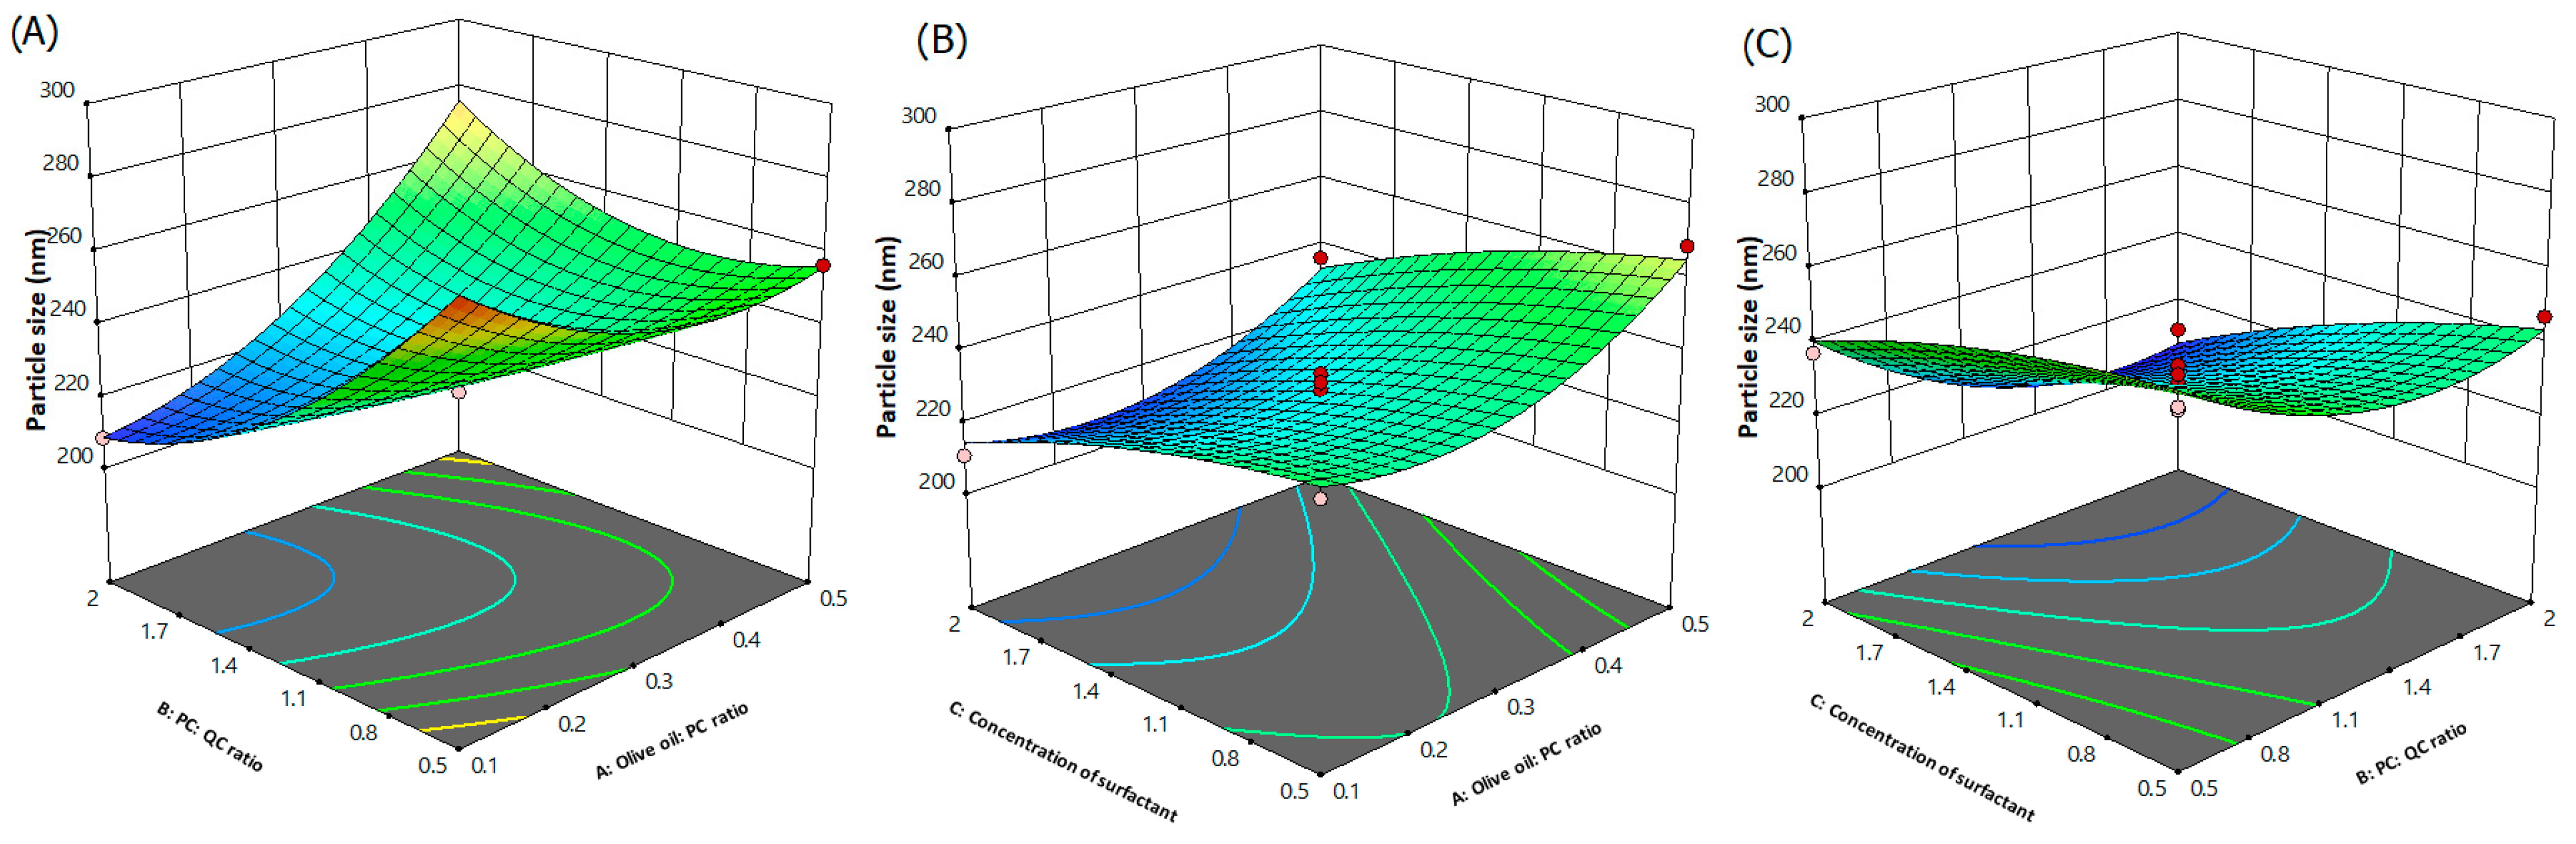
3.2.1. Effect of Independent Variables on Particle Size
3.2.2. Effect of Independent Variables on Surface Charge
3.2.3. Effect of Independent Variables on EE%
3.2.4. Optimization and Point Prediction
3.3. FT-IR
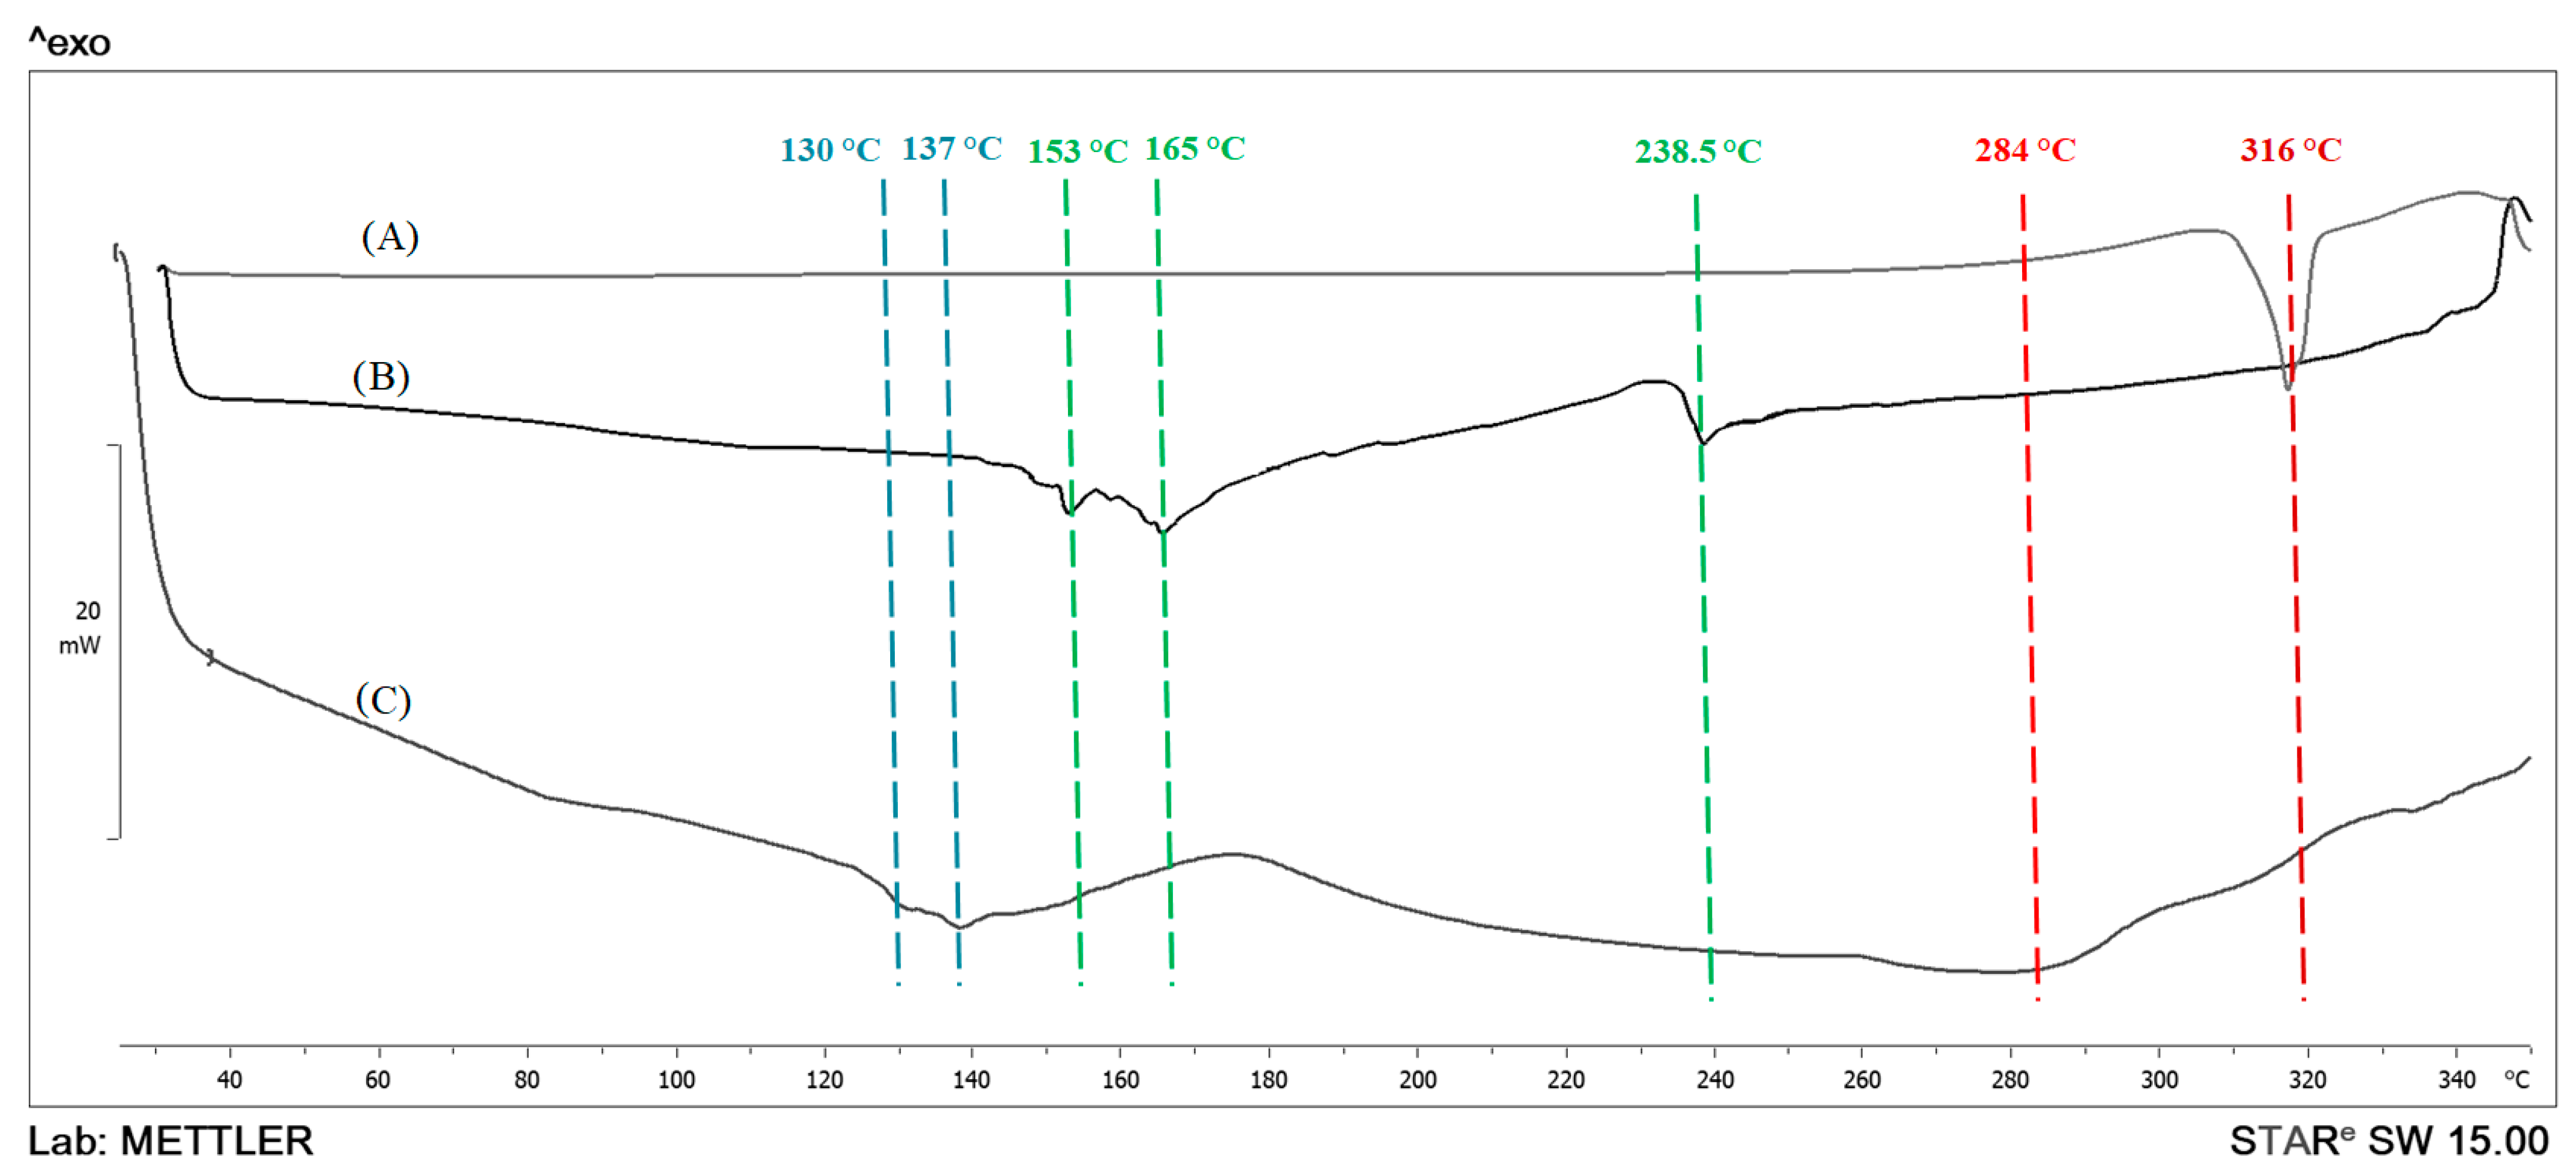
3.4. DSC
3.5. Stability Studies
3.6. In Vitro QC Release Studies
3.7. Ex Vivo Skin Permeation
3.8. Skin Compliance
4. Conclusions
Supplementary Materials
Author Contributions
Funding
Institutional Review Board Statement
Informed Consent Statement
Data Availability Statement
Acknowledgments
Conflicts of Interest
References
- Zhu, X.; Zeng, X.; Zhang, X.; Cao, W.; Wang, Y.; Chen, H.; Wang, T.; Tsai, H.-I.; Zhang, R.; Chang, D. The effects of quercetin-loaded PLGA-TPGS nanoparticles on ultraviolet B-induced skin damages in vivo. Nanomed. Nanotechnol. Biol. Med. 2016, 12, 623–632. [Google Scholar] [CrossRef] [PubMed]
- Bonina, F.; Lanza, M.; Montenegro, L.; Puglisi, C.; Tomaino, A.; Trombetta, D.; Castelli, F.; Saija, A. Flavonoids as potential protective agents against photo-oxidative skin damage. Int. J. Pharm. 1996, 145, 87–94. [Google Scholar] [CrossRef]
- Granado-Serrano, A.B.; Martín, M.A.; Bravo, L.; Goya, L.; Ramos, S. Quercetin modulates Nrf2 and glutathione-related defenses in HepG2 cells: Involvement of p38. Chem. Biol. Interact. 2012, 195, 154–164. [Google Scholar] [CrossRef] [Green Version]
- Solovchenko, A.; Schmitz-Eiberger, M. Significance of skin flavonoids for UV-B-protection in apple fruits. J. Exp. Bot. 2003, 54, 1977–1984. [Google Scholar] [CrossRef] [PubMed]
- Kirjavainen, M.; Urtti, A.; Valjakka-Koskela, R.; Kiesvaara, J.; Mönkkönen, J. Liposome–skin interactions and their effects on the skin permeation of drugs. Eur. J. Pharm. Sci. 1999, 7, 279–286. [Google Scholar] [CrossRef]
- Boots, A.W.; Haenen, G.R.M.M.; Bast, A. Health effects of quercetin: From antioxidant to nutraceutical. Eur. J. Pharmacol. 2008, 585, 325–337. [Google Scholar] [CrossRef]
- Casagrande, R.; Georgetti, S.R.; Verri Jr, W.A.; Dorta, D.J.; dos Santos, A.C.; Fonseca, M.J. V Protective effect of topical formulations containing quercetin against UVB-induced oxidative stress in hairless mice. J. Photochem. Photobiol. B Biol. 2006, 84, 21–27. [Google Scholar] [CrossRef]
- Vicentini, F.T.M.C.; Simi, T.R.M.; Del Ciampo, J.O.; Wolga, N.O.; Pitol, D.L.; Iyomasa, M.M.; Bentley, M.V.L.B.; Fonseca, M.J. V Quercetin in w/o microemulsion: In vitro and in vivo skin penetration and efficacy against UVB-induced skin damages evaluated in vivo. Eur. J. Pharm. Biopharm. 2008, 69, 948–957. [Google Scholar] [CrossRef]
- Piantelli, M.; Maggiano, N.; Ricci, R.; Larocca, L.M.; Capelli, A.; Scambia, G.; Isola, G.; Natali, P.G.; Ranelletti, F.O. Tamoxifen and quercetin interact with type II estrogen binding sites and inhibit the growth of human melanoma cells. J. Investig. Dermatol. 1995, 105, 248–253. [Google Scholar] [CrossRef] [Green Version]
- Jung, M.K.; Hur, D.Y.; Song, S.B.; Park, Y.; Kim, T.S.; Bang, S.I.; Kim, S.; Song, H.K.; Park, H.; Cho, D.H. Tannic acid and quercetin display a therapeutic effect in atopic dermatitis via suppression of angiogenesis and TARC expression in Nc/Nga mice. J. Investig. Dermatol. 2010, 130, 1459–1463. [Google Scholar] [CrossRef] [Green Version]
- Lin, C.-F.; Leu, Y.-L.; Al-Suwayeh, S.A.; Ku, M.-C.; Hwang, T.-L.; Fang, J.-Y. Anti-inflammatory activity and percutaneous absorption of quercetin and its polymethoxylated compound and glycosides: The relationships to chemical structures. Eur. J. Pharm. Sci. 2012, 47, 857–864. [Google Scholar] [CrossRef] [PubMed]
- Kitagawa, S.; Tanaka, Y.; Tanaka, M.; Endo, K.; Yoshii, A. Enhanced skin delivery of quercetin by microemulsion. J. Pharm. Pharmacol. 2009, 61, 855–860. [Google Scholar] [CrossRef] [PubMed]
- Bose, S.; Du, Y.; Takhistov, P.; Michniak-Kohn, B. Formulation optimization and topical delivery of quercetin from solid lipid based nanosystems. Int. J. Pharm. 2013, 441, 56–66. [Google Scholar] [CrossRef] [PubMed]
- Liu, D.; Hu, H.; Lin, Z.; Chen, D.; Zhu, Y.; Hou, S.; Shi, X. Quercetin deformable liposome: Preparation and efficacy against ultraviolet B induced skin damages in vitro and in vivo. J. Photochem. Photobiol. B Biol. 2013, 127, 8–17. [Google Scholar] [CrossRef] [PubMed]
- Chen-yu, G.; Chun-fen, Y.; Qi-lu, L.; Qi, T.; Yan-wei, X.; Wei-na, L.; Guang-xi, Z. Development of a quercetin-loaded nanostructured lipid carrier formulation for topical delivery. Int. J. Pharm. 2012, 430, 292–298. [Google Scholar] [CrossRef]
- Saija, A.; Tomaino, A.; Trombetta, D.; Giacchi, M.; De Pasquale, A.; Bonina, F. Influence of different penetration enhancers on in vitro skin permeation and in vivo photoprotective effect of flavonoids. Int. J. Pharm. 1998, 175, 85–94. [Google Scholar] [CrossRef]
- Scalia, S.; Franceschinis, E.; Bertelli, D.; Iannuccelli, V. Comparative evaluation of the effect of permeation enhancers, lipid nanoparticles and colloidal silica on in vivo human skin penetration of quercetin. Skin Pharmacol. Physiol. 2013, 26, 57–67. [Google Scholar] [CrossRef]
- Chessa, M.; Caddeo, C.; Valenti, D.; Manconi, M.; Sinico, C.; Fadda, A.M. Effect of penetration enhancer containing vesicles on the percutaneous delivery of quercetin through new born pig skin. Pharmaceutics 2011, 3, 497–509. [Google Scholar] [CrossRef] [Green Version]
- Tan, Q.; Liu, W.; Guo, C.; Zhai, G. Preparation and evaluation of quercetin-loaded lecithin-chitosan nanoparticles for topical delivery. Int. J. Nanomed. 2011, 6, 1621–1630. [Google Scholar]
- Kidd, P.M. Bioavailability and activity of phytosome complexes from botanical polyphenols: The silymarin, curcumin, green tea, and grape seed extracts. Altern. Med. Rev. 2009, 14, 226–246. [Google Scholar]
- Freag, M.S.; Elnaggar, Y.S.R.; Abdallah, O.Y. Lyophilized phytosomal nanocarriers as platforms for enhanced diosmin delivery: Optimization and ex vivo permeation. Int. J. Nanomed. 2013, 8, 2385. [Google Scholar]
- Hou, Z.; Li, Y.; Huang, Y.; Zhou, C.; Lin, J.; Wang, Y.; Cui, F.; Zhou, S.; Jia, M.; Ye, S. Phytosomes loaded with mitomycin C–soybean phosphatidylcholine complex developed for drug delivery. Mol. Pharm. 2013, 10, 90–101. [Google Scholar] [CrossRef] [PubMed]
- Khogta, S.; Patel, J.; Barve, K.; Londhe, V. Herbal nano-formulations for topical delivery. J. Herb. Med. 2020, 20, 100300. [Google Scholar] [CrossRef]
- Lai, F.; Caddeo, C.; Letizia Manca, M.; Manconi, M.; Sinico, C.; Maria Fadda, A. What’s new in the field of phospholipid vesicular nanocarriers for skin drug delivery. Int. J. Pharm. 2020, 583, 119398. [Google Scholar] [CrossRef]
- Elmowafy, M.; Musa, A.; Alnusaire, T.S.; Shalaby, K.; Fouda, M.; Salama, A.; Al-Sanea, M.M.; Abdelgawad, M.A.; Gamal, M.; Fouad, S.A. Olive Oil/Pluronic Oleogels for Skin Delivery of Quercetin: In Vitro Characterization and Ex Vivo Skin Permeability. Polymers 2021, 13, 1808. [Google Scholar] [CrossRef]
- Hussain, A.; Khan, G.M.; Jan, S.U.; Shah, S.U.; Shah, K.; Akhlaq, M.; Rahim, N.; Nawaz, A.; Wahab, A. Effect of olive oil on transdermal penetration of flurbiprofen from topical gel as enhancer. Pak. J. Pharm. Sci. 2012, 25, 365–369. [Google Scholar]
- Khan, J.; Alexander, A.; Saraf, S.; Saraf, S. Recent advances and future prospects of phyto-phospholipid complexation technique for improving pharmacokinetic profile of plant actives. J. Control. Release 2013, 168, 50–60. [Google Scholar] [CrossRef]
- Komeil, I.A.; El-Refaie, W.M.; Gowayed, M.A.; El-Ganainy, S.O.; El Achy, S.N.; Huttunen, K.M.; Abdallah, O.Y. Oral genistein-loaded phytosomes with enhanced hepatic uptake, residence and improved therapeutic efficacy against hepatocellular carcinoma. Int. J. Pharm. 2021, 601, 120564. [Google Scholar] [CrossRef]
- Freag, M.S.; Saleh, W.M.; Abdallah, O.Y. Self-assembled phospholipid-based phytosomal nanocarriers as promising platforms for improving oral bioavailability of the anticancer celastrol. Int. J. Pharm. 2018, 535, 18–26. [Google Scholar] [CrossRef]
- Fresta, M.; Mancuso, A.; Cristiano, M.C.; Urbanek, K.; Cilurzo, F.; Cosco, D.; Iannone, M.; Paolino, D. Targeting of the Pilosebaceous Follicle by Liquid Crystal Nanocarriers: In Vitro and In Vivo Effects of the Entrapped Minoxidil. Pharmaceutics 2020, 12, 1127. [Google Scholar] [CrossRef]
- El-Refaie, W.M.; Elnaggar, Y.S.R.; El-Massik, M.A.; Abdallah, O.Y. Novel self-assembled, gel-core hyaluosomes for non-invasive management of osteoarthritis: In-vitro optimization, ex-vivo and in-vivo permeation. Pharm. Res. 2015, 32, 2901–2911. [Google Scholar] [CrossRef]
- Elmowafy, M.; Shalaby, K.; Ali, H.M.; Alruwaili, N.K.; Salama, A.; Ibrahim, M.F.; Akl, M.A.; Ahmed, T.A. Impact of nanostructured lipid carriers on dapsone delivery to the skin: In vitro and in vivo studies. Int. J. Pharm. 2019, 572, 118781. [Google Scholar] [CrossRef]
- Zhang, J.; Tang, Q.; Xu, X.; Li, N. Development and evaluation of a novel phytosome-loaded chitosan microsphere system for curcumin delivery. Int. J. Pharm. 2013, 448, 168–174. [Google Scholar] [CrossRef] [PubMed]
- Allam, A.N.; Komeil, I.A.; Abdallah, O.Y. Curcumin phytosomal softgel formulation: Development, optimization and physicochemical characterization. Acta Pharm. 2015, 65, 285–297. [Google Scholar] [CrossRef] [PubMed] [Green Version]
- Laouini, A.; Charcosset, C.; Fessi, H.; Holdich, R.G.; Vladisavljević, G.T. Preparation of liposomes: A novel application of microengineered membranes–From laboratory scale to large scale. Colloids Surf. B Biointerfaces 2013, 112, 272–278. [Google Scholar] [CrossRef] [PubMed] [Green Version]
- Bombardelli, E. Pharmaceutical and Cosmetic Compositions Containing Complexes of Flavanolignans with Phospholipids. U.S. Patent No. 4895839, 23 January 1990. [Google Scholar]
- Duan, R.; Sun, X.; Liu, J.; Gong, T.; Zhang, Z. Mixed micelles loaded with silybin-polyene phosphatidylcholine complex improve drug solubility. Acta Pharmacol. Sin. 2011, 32, 108–115. [Google Scholar] [CrossRef] [Green Version]
- Choi, W.S.; Cho, H.I.; Lee, H.Y.; Lee, S.H.; Choi, Y.-W. Enhanced occlusiveness of nanostructured lipid carrier (NLC)-based carbogel as a skin moisturizing vehicle. J. Pharm. Investig. 2010, 40, 373–378. [Google Scholar]
- Chi, C.; Zhang, C.; Liu, Y.; Nie, H.; Zhou, J.; Ding, Y. Phytosome-nanosuspensions for silybin-phospholipid complex with increased bioavailability and hepatoprotection efficacy. Eur. J. Pharm. Sci. 2020, 144, 105212. [Google Scholar] [CrossRef]
- Manca, M.L.; Matricardi, P.; Cencetti, C.; Peris, J.E.; Melis, V.; Carbone, C.; Escribano, E.; Zaru, M.; Fadda, A.M.; Manconi, M. Combination of argan oil and phospholipids for the development of an effective liposome-like formulation able to improve skin hydration and allantoin dermal delivery. Int. J. Pharm. 2016, 505, 204–211. [Google Scholar] [CrossRef]
- Song, F.; Tian, S.; Yang, G.; Sun, X. Effect of phospholipid/flaxseed oil ratio on characteristics, structure change, and storage stability of liposomes. LWT 2022, 157, 113040. [Google Scholar] [CrossRef]
- Zu, Y.; Sun, W.; Zhao, X.; Wang, W.; Li, Y.; Ge, Y.; Liu, Y.; Wang, K. Preparation and characterization of amorphous amphotericin B nanoparticles for oral administration through liquid antisolvent precipitation. Eur. J. Pharm. Sci. 2014, 53, 109–117. [Google Scholar] [CrossRef] [PubMed]
- Patel, R.R.; Khan, G.; Chaurasia, S.; Kumar, N.; Mishra, B. Rationally developed core–shell polymeric-lipid hybrid nanoparticles as a delivery vehicle for cromolyn sodium: Implications of lipid envelop on in vitro and in vivo behaviour of nanoparticles upon oral administration. RSC Adv. 2015, 5, 76491–76506. [Google Scholar] [CrossRef]
- Gajra, B.; Dalwadi, C.; Patel, R. Formulation and optimization of itraconazole polymeric lipid hybrid nanoparticles (Lipomer) using box behnken design. DARU J. Pharm. Sci. 2015, 23, 3. [Google Scholar] [CrossRef] [PubMed] [Green Version]
- Jain, D.; Athawale, R.; Bajaj, A.; Shrikhande, S.; Goel, P.N.; Gude, R.P. Studies on stabilization mechanism and stealth effect of poloxamer 188 onto PLGA nanoparticles. Colloids Surf. B Biointerfaces 2013, 109, 59–67. [Google Scholar] [CrossRef]
- Danaei, M.; Kalantari, M.; Raji, M.; Fekri, H.S.; Saber, R.; Asnani, G.P.; Mortazavi, S.M.; Mozafari, M.R.; Rasti, B.; Taheriazam, A. Probing nanoliposomes using single particle analytical techniques: Effect of excipients, solvents, phase transition and zeta potential. Heliyon 2018, 4, e01088. [Google Scholar] [CrossRef]
- Bajaj, A.; Rao, M.R.P.; Pardeshi, A.; Sali, D. Nanocrystallization by evaporative antisolvent technique for solubility and bioavailability enhancement of telmisartan. AAPS PharmSciTech 2012, 13, 1331–1340. [Google Scholar] [CrossRef] [Green Version]
- Demir, B.; Barlas, F.B.; Guler, E.; Gumus, P.Z.; Can, M.; Yavuz, M.; Coskunol, H.; Timur, S. Gold nanoparticle loaded phytosomal systems: Synthesis, characterization and in vitro investigations. RSC Adv. 2014, 4, 34687–34695. [Google Scholar] [CrossRef]
- Deleu, M.; Vaca-Medina, G.; Fabre, J.-F.; Roïz, J.; Valentin, R.; Mouloungui, Z. Interfacial properties of oleosins and phospholipids from rapeseed for the stability of oil bodies in aqueous medium. Colloids Surf. B Biointerfaces 2010, 80, 125–132. [Google Scholar] [CrossRef]
- Kumar, A.B.; Habbu, P.; Hullatti, P.; Kumar, R.S. Phytosomes as novel drug delivery system for herbal medicine-a review. Syst. Rev. Pharm. 2017, 8, 5. [Google Scholar]
- Angelico, R.; Ceglie, A.; Sacco, P.; Colafemmina, G.; Ripoli, M.; Mangia, A. Phyto-liposomes as nanoshuttles for water-insoluble silybin–phospholipid complex. Int. J. Pharm. 2014, 471, 173–181. [Google Scholar] [CrossRef]
- Suryawanshi, J.S. Phytosome: An emerging trend in herbal drug treatment. J. Med. Genet. Genom. 2011, 3, 109–114. [Google Scholar]
- Vu, H.T.H.; Hook, S.M.; Siqueira, S.D.; Müllertz, A.; Rades, T.; McDowell, A. Are phytosomes a superior nanodelivery system for the antioxidant rutin? Int. J. Pharm. 2018, 548, 82–91. [Google Scholar] [CrossRef]
- Yu, F.; Li, Y.; Chen, Q.; He, Y.; Wang, H.; Yang, L.; Guo, S.; Meng, Z.; Cui, J.; Xue, M. Monodisperse microparticles loaded with the self-assembled berberine-phospholipid complex-based phytosomes for improving oral bioavailability and enhancing hypoglycemic efficiency. Eur. J. Pharm. Biopharm. 2016, 103, 136–148. [Google Scholar] [CrossRef] [PubMed]
- Permana, A.D.; Utami, R.N.; Courtenay, A.J.; Manggau, M.A.; Donnelly, R.F.; Rahman, L. Phytosomal nanocarriers as platforms for improved delivery of natural antioxidant and photoprotective compounds in propolis: An approach for enhanced both dissolution behaviour in biorelevant media and skin retention profiles. J. Photochem. Photobiol. B Biol. 2020, 205, 111846. [Google Scholar] [CrossRef]
- Liu, Y.; Pan, J.; Feng, S.-S. Nanoparticles of lipid monolayer shell and biodegradable polymer core for controlled release of paclitaxel: Effects of surfactants on particles size, characteristics and in vitro performance. Int. J. Pharm. 2010, 395, 243–250. [Google Scholar] [CrossRef]
- Maleki Dizaj, S.; Lotfipour, F.; Barzegar-Jalali, M.; Zarrintan, M.-H.; Adibkia, K. Application of Box–Behnken design to prepare gentamicin-loaded calcium carbonate nanoparticles. Artif. Cells Nanomed. Biotechnol. 2016, 44, 1475–1481. [Google Scholar] [CrossRef] [PubMed]
- Gao, Q.; Liang, Q.; Yu, F.; Xu, J.; Zhao, Q.; Sun, B. Synthesis and characterization of novel amphiphilic copolymer stearic acid-coupled F127 nanoparticles for nano-technology based drug delivery system. Colloids Surf. B Biointerfaces 2011, 88, 741–748. [Google Scholar] [CrossRef]
- Wu, G.; Khant, H.A.; Chiu, W.; Lee, K.Y.C. Effects of bilayer phases on phospholipid-poloxamer interactions. Soft Matter 2009, 5, 1496–1503. [Google Scholar] [CrossRef]
- Venugopal, V.; Kumar, K.J.; Muralidharan, S.; Parasuraman, S.; Raj, P.V.; Kumar, K.V. Optimization and in-vivo evaluation of isradipine nanoparticles using Box-Behnken design surface response methodology. OpenNano 2016, 1, 1–15. [Google Scholar] [CrossRef] [Green Version]
- Zhang, L.; Yang, X.; Li, S.; Gao, W. Preparation, physicochemical characterization and in vitro digestibility on solid complex of maize starches with quercetin. LWT—Food Sci. Technol. 2011, 44, 787–792. [Google Scholar] [CrossRef]
- Satapathy, D.; Biswas, D.; Behera, B.; Sagiri, S.S.; Pal, K.; Pramanik, K. Sunflower-oil-based lecithin organogels as matrices for controlled drug delivery. J. Appl. Polym. Sci. 2013, 129, 585–594. [Google Scholar] [CrossRef]
- Gurdeniz, G.; Tokatli, F.; Ozen, B. Differentiation of mixtures of monovarietal olive oils by mid-infrared spectroscopy and chemometrics. Eur. J. Lipid Sci. Technol. 2007, 109, 1194–1202. [Google Scholar] [CrossRef] [Green Version]
- Fang, J.-Y.; Fang, C.-L.; Liu, C.-H.; Su, Y.-H. Lipid nanoparticles as vehicles for topical psoralen delivery: Solid lipid nanoparticles (SLN) versus nanostructured lipid carriers (NLC). Eur. J. Pharm. Biopharm. 2008, 70, 633–640. [Google Scholar] [CrossRef] [PubMed]
- Li, J.; Liu, P.; Liu, J.-P.; Yang, J.-K.; Zhang, W.-L.; Fan, Y.-Q.; Kan, S.-L.; Cui, Y.; Zhang, W.-J. Bioavailability and foam cells permeability enhancement of Salvianolic acid B pellets based on drug–phospholipids complex technique. Eur. J. Pharm. Biopharm. 2013, 83, 76–86. [Google Scholar] [CrossRef]
- Lu, M.; Qiu, Q.; Luo, X.; Liu, X.; Sun, J.; Wang, C.; Lin, X.; Deng, Y.; Song, Y. Phyto-phospholipid complexes (phytosomes): A novel strategy to improve the bioavailability of active constituents. Asian J. Pharm. Sci. 2019, 14, 265–274. [Google Scholar] [CrossRef]
- Semalty, A.; Semalty, M.; Rawat, M.S.M.; Franceschi, F. Supramolecular phospholipids–polyphenolics interactions: The PHYTOSOME® strategy to improve the bioavailability of phytochemicals. Fitoterapia 2010, 81, 306–314. [Google Scholar] [CrossRef] [PubMed]
- Elmowafy, M.; Shalaby, K.; Badran, M.M.; Ali, H.M.; Abdel-Bakky, M.S.; Ibrahim, H.M. Multifunctional carbamazepine loaded nanostructured lipid carrier (NLC) formulation. Int. J. Pharm. 2018, 550, 359–371. [Google Scholar] [CrossRef]
- Armengol, X.; Estelrich, J. Physical stability of different liposome compositions obtained by extrusion method. J. Microencapsul. 1995, 12, 525–535. [Google Scholar] [CrossRef]
- Began, G.; Sudharshan, E.; Udaya Sankar, K.; Appu Rao, A.G. Interaction of curcumin with phosphatidylcholine: A spectrofluorometric study. J. Agric. Food Chem. 1999, 47, 4992–4997. [Google Scholar] [CrossRef] [PubMed]
- Singh, R.P.; Gangadharappa, H.V.; Mruthunjaya, K. Phytosome complexed with chitosan for gingerol delivery in the treatment of respiratory infection: In vitro and in vivo evaluation. Eur. J. Pharm. Sci. 2018, 122, 214–229. [Google Scholar] [CrossRef]
- Alhakamy, N.A.; Badr-Eldin, S.M.; Fahmy, U.A.; Alruwaili, N.K.; Awan, Z.A.; Caruso, G.; Alfaleh, M.A.; Alaofi, A.L.; Arif, F.O.; Ahmed, O.A.A. Thymoquinone-loaded soy-phospholipid-based phytosomes exhibit anticancer potential against human lung cancer cells. Pharmaceutics 2020, 12, 761. [Google Scholar] [CrossRef] [PubMed]
- Costa, P.; Lobo, J.M.S. Modeling and comparison of dissolution profiles. Eur. J. Pharm. Sci. 2001, 13, 123–133. [Google Scholar] [CrossRef] [PubMed]
- Suvakanta, D.; Padala, N.M.; Lilakanta, N.; Prasanta, C. Kinetic modeling on drug release from controlled drug delivery systems. Acta Pol. Pharm. 2010, 67, 217–223. [Google Scholar]
- Münch, S.; Wohlrab, J.; Neubert, R.H.H. Dermal and transdermal delivery of pharmaceutically relevant macromolecules. Eur. J. Pharm. Biopharm. 2017, 119, 235–242. [Google Scholar] [CrossRef]
- Elmowafy, M. Skin penetration/permeation success determinants of nanocarriers: Pursuit of a perfect formulation. Colloids Surf. B Biointerfaces 2021, 203, 111748. [Google Scholar] [CrossRef]
- Bouwstra, J.A.; Hofland, H.E.J.; Spies, F.; Gooris, G.S.; Junginger, H.E. Changes in the structure of the human stratum corneum induced by liposomes. In Liposome Dermatics; Springer: Berlin/Heidelberg, Germany, 1992; pp. 121–136. [Google Scholar]
- Dhawan, B.; Aggarwal, G.; Harikumar, S.L. Enhanced transdermal permeability of piroxicam through novel nanoemulgel formulation. Int. J. Pharm. Investig. 2014, 4, 65. [Google Scholar]
- Fang, J.-Y.; Hong, C.-T.; Chiu, W.-T.; Wang, Y.-Y. Effect of liposomes and niosomes on skin permeation of enoxacin. Int. J. Pharm. 2001, 219, 61–72. [Google Scholar] [CrossRef]
- Fiume, Z. Final report on the safety assessment of Lecithin and Hydrogenated Lecithin. Int. J. Toxicol. 2001, 20, 21–45. [Google Scholar]
- Van Hoogevest, P.; Fahr, A. Phospholipids in Cosmetic Carriers. In Nanocosmetics; Springer: Cham, Switzerland, 2019; pp. 95–140. [Google Scholar]
- Traul, K.A.; Driedger, A.; Ingle, D.L.; Nakhasi, D. Review of the toxicologic properties of medium-chain triglycerides. Food Chem. Toxicol. 2000, 38, 79–98. [Google Scholar] [CrossRef]
- Muller, R.H.; Shegokar, R.; Keck, C.M. 20 Years of Lipid Nanoparticles (SLN & NLC): Present State of Development & Industrial Applications. Curr. Drug Discov. Technol. 2011, 8, 207–227. [Google Scholar] [CrossRef]
- Danby, S.G.; AlEnezi, T.; Sultan, A.; Lavender, T.; Chittock, J.; Brown, K.; Cork, M.J. Effect of olive and sunflower seed oil on the adult skin barrier: Implications for neonatal skin care. Pediatr. Dermatol. 2013, 30, 42–50. [Google Scholar] [CrossRef] [PubMed]
- Singh, R.P.; Gangadharappa, H.V.; Mruthunjaya, K. Phospholipids: Unique carriers for drug delivery systems. J. Drug Deliv. Sci. Technol. 2017, 39, 166–179. [Google Scholar] [CrossRef]


| Factor | Process Parameter | Levels | ||
|---|---|---|---|---|
| Low | Medium | High | ||
| (−1) | (0) | (1) | ||
| Independent variables | ||||
| A | Olive oil/PC ratio | 1:10 | 1:5 | 1:2 |
| B | QC/PC ratio | 2:1 | 1:1 | 1:2 |
| C | Concentration of surfactant | 0.5% | 1% | 2% |
| Responses | Desired outcome | |||
| Y1 | Particle diameter | Decrease | ||
| Y2 | Surface charge | Increase | ||
| Y3 | Encapsulation efficiency % | Increase | ||
| STD | Run | Olive Oil/PC Ratio | QC/PC Ratio | Concentration of Surfactant (% w/v) |
|---|---|---|---|---|
| 8 | 1 | 0.5 | 1.25 | 2 |
| 13 | 2 | 0.3 | 1.25 | 1.25 |
| 9 | 3 | 0.3 | 0.5 | 0.5 |
| 14 | 4 | 0.3 | 1.25 | 1.25 |
| 11 | 5 | 0.3 | 0.5 | 2 |
| 10 | 6 | 0.3 | 2 | 0.5 |
| 5 | 7 | 0.1 | 1.25 | 0.5 |
| 7 | 8 | 0.1 | 1.25 | 2 |
| 16 | 9 | 0.3 | 1.25 | 1.25 |
| 3 | 10 | 0.1 | 2 | 1.25 |
| 2 | 11 | 0.5 | 0.5 | 1.25 |
| 17 | 12 | 0.3 | 1.25 | 1.25 |
| 12 | 13 | 0.3 | 2 | 2 |
| 1 | 14 | 0.1 | 0.5 | 1.25 |
| 4 | 15 | 0.5 | 2 | 1.25 |
| 15 | 16 | 0.3 | 1.25 | 1.25 |
| 6 | 17 | 0.5 | 1.25 | 0.5 |
| Particle Size | ||||||||
|---|---|---|---|---|---|---|---|---|
| Source | SD | R2 | Adjusted R2 | Predicted R2 | p-Value | Lack of Fit | Remark | |
| F-Value | p-Value | |||||||
| Linear | 17.66 | 0.4968 | 0.3806 | 0.0260 | 0.0263 | 20.23 | 0.0054 | |
| 2FI | 13.74 | 0.7657 | 0.6252 | 0.1263 | 0.0462 | 13.77 | 0.0120 | |
| Quadratic | 6.45 | 0.9638 | 0.9173 | 0.5774 | 0.0032 | 3.13 | 0.1499 | Suggested |
| Zeta Potential | ||||||||
| Linear | 2.28 | 0.2844 | 0.1193 | −0.4114 | 0.2115 | 9.37 | 0.0228 | |
| 2FI | 1.80 | 0.6599 | 0.4559 | −0.3876 | 0.0509 | 6.33 | 0.0478 | |
| Quadratic | 1.39 | 0.8579 | 0.6753 | −0.8055 | 0.0900 | 4.51 | 0.0897 | Suggested |
| EE% | ||||||||
| Linear | 3.39 | 0.5122 | 0.3996 | 0.0379 | 0.0217 | 24.86 | 0.0037 | |
| 2FI | 3.43 | 0.6171 | 0.3874 | −0.7218 | 0.4688 | 29.13 | 0.0029 | |
| Quadratic | 1.20 | 0.9672 | 0.9251 | 0.5995 | 0.0004 | 3.77 | 0.1164 | Suggested |
| Run | Particle Diameter (nm) | Zeta Potential (mV) | EE% |
|---|---|---|---|
| 1 | 236 | −27.8 | 87.2 |
| 2 | 221.6 | −26.9 | 84.4 |
| 3 | 258.3 | −28.6 | 80.7 |
| 4 | 228 | −29.3 | 85.9 |
| 5 | 237.3 | −27.6 | 86.5 |
| 6 | 247.3 | −26.5 | 84.5 |
| 7 | 237.7 | −26.3 | 80.6 |
| 8 | 210.8 | −25 | 83.7 |
| 9 | 234 | −28.1 | 85.4 |
| 10 | 208.5 | −25.1 | 82.5 |
| 11 | 256.7 | −24.6 | 76.9 |
| 12 | 231.5 | −27.9 | 83.9 |
| 13 | 210.9 | −26.1 | 92.1 |
| 14 | 287.9 | −33 | 80.8 |
| 15 | 268.9 | −25.8 | 78.9 |
| 16 | 229.4 | −27.6 | 84.5 |
| 17 | 268.9 | −21.4 | 72.9 |
| Formula | Independent Variables | Dependent Variables | Desirability | ||||
|---|---|---|---|---|---|---|---|
| Level of Factor A | Level of Factor B | Level of Factor C | Particle Size (nm) | Zeta Potential (mV) | EE% | ||
| Predicted | 0.1664 | 1.95 | 1.61 | 203.635 | −25.3123 | 86.427 | 1 |
| Actual | 0.1664 | 1.95 | 1.61 | 206.7 | −26.3 | 85.3 | --- |
| Assessment Criteria | Storage Condition | Freshly Prepared | 1st Month | 2nd Month | 3rd Month | ||||
|---|---|---|---|---|---|---|---|---|---|
| F0 | Optimized Formulation | F0 | Optimized Formulation | F0 | Optimized Formulation | F0 | Optimized Formulation | ||
| Particle size (nm) | At 25 ± 2 °C | 211.8 ± 21.6 | 206.7 ± 15.8 | 229.9 ± 11.5 | 210.3 ± 11.5 | 238.1 ± 17.6 | 217.8 ± 22.1 | 256.8 ± 15.6 | 228.1 ± 12.4 |
| At 4 °C | 211.8 ± 21.6 | 211.8 ± 18.8 | 237.6 ± 18.6 | 216.8 ± 14.1 | 259.4 ± 16.2 | 231.6 ± 11.7 | 295.7 ± 18.7 | 243.8 ± 16.4 | |
| PI | At 25 ± 2 °C | 0.23 ± 0.02 | 0.25 ± 0.03 | 0.24 ± 0.01 | 0.25 ± 0.02 | 0.26 ± 0.05 | 0.26 ± 0.04 | 0.28 ± 0.06 | 0.26 ± 0.02 |
| At 4 °C | 0.23 ± 0.02 | 0.25 ± 0.03 | 0.25 ± 0.03 | 0.27 ± 0.05 | 0.31 ± 0.06 | 0.28 ± 0.05 | 0.36 ± 0.05 | 0.30 ± 0.04 | |
| Zeta potential (mV) | At 25 ± 2 °C | −35.5 ± 4.8 | −26.3 ± 7.1 | −33.6 ± 9.5 | −27.1 ± 8.9 | −32.6 ± 1.9 | −25.2 ± 5.1 | −32.9 ± 6.9 | −26.2 ± 3.6 |
| At 4 °C | −35.5 ± 4.8 | −26.3 ± 7.1 | −32.1 ± 7.3 | −25.3 ± 8.1 | −33.5 ± 7.3 | −24.9 ± 6.2 | −32.3 ± 3.8 | −25.9 ± 7.5 | |
| EE% | At 25 ± 2 °C | 85.1 ± 7.9 | 85.3 ± 12.5 | 84.6 ± 6.5 | 86.7 ± 7.5 | 83.4 ± 11.5 | 85.7 ± 4.5 | 81.1 ± 10.5 | 84.7 ± 13.3 |
| At 4 °C | 85.1 ± 7.9 | 85.3 ± 12.5 | 83.2 ± 8.5 | 84.3 ± 10.9 | 81.9 ± 5.8 | 83.6 ± 7.1 | 80.4 ± 13.7 | 83.3 ± 11.8 | |
| Code | Zero Order Kinetics | First Order Kinetics | Higuchi Model | Hixson-Crowell | Korsmeyer-Peppas | ||||||||||
|---|---|---|---|---|---|---|---|---|---|---|---|---|---|---|---|
| R2 | t1/2 | K | R2 | t1/2 | K | R2 | t1/2 | K | R2 | t1/2 | K | R2 | t1/2 | K | |
| Optimized formulation | 0.80 | 4.88 | 10.23 | 0.95 | 4.05 | 0.17 | 0.96 | 4.26 | 24.2 | 0.92 | 4.2 | 0.049 | 0.97 | 4.3 | 22.08 |
| F0 | 0.75 | 6.4 | 7.8 | 0.89 | 6.2 | 0.11 | 0.97 | 7.2 | 18.6 | 0.86 | 6.2 | 0.03 | 0.98 | 7.1 | 17.9 |
| Formula Code | Flux, Jss (µg/cm2/h) | Permeability Coefficient Kp × 10−2 (cm2/h) | Enhancement Ratio (ER) |
|---|---|---|---|
| Optimized formulation | 12.52 ± 0.68 | 6.25 ± 0.50 | 1.9 |
| F0 | 8.83 ± 0.63 | 4.41 ± 0.25 | 1.3 |
| QC dispersion | 6.71 ± 0.42 | 3.35 ± 0.37 | --- |
Disclaimer/Publisher’s Note: The statements, opinions and data contained in all publications are solely those of the individual author(s) and contributor(s) and not of MDPI and/or the editor(s). MDPI and/or the editor(s) disclaim responsibility for any injury to people or property resulting from any ideas, methods, instructions or products referred to in the content. |
© 2023 by the authors. Licensee MDPI, Basel, Switzerland. This article is an open access article distributed under the terms and conditions of the Creative Commons Attribution (CC BY) license (https://creativecommons.org/licenses/by/4.0/).
Share and Cite
Hendawy, O.M.; Al-Sanea, M.M.; Elbargisy, R.M.; Rahman, H.U.; Gomaa, H.A.M.; Mohamed, A.A.B.; Ibrahim, M.F.; Kassem, A.M.; Elmowafy, M. Development of Olive Oil Containing Phytosomal Nanocomplex for Improving Skin Delivery of Quercetin: Formulation Design Optimization, In Vitro and Ex Vivo Appraisals. Pharmaceutics 2023, 15, 1124. https://doi.org/10.3390/pharmaceutics15041124
Hendawy OM, Al-Sanea MM, Elbargisy RM, Rahman HU, Gomaa HAM, Mohamed AAB, Ibrahim MF, Kassem AM, Elmowafy M. Development of Olive Oil Containing Phytosomal Nanocomplex for Improving Skin Delivery of Quercetin: Formulation Design Optimization, In Vitro and Ex Vivo Appraisals. Pharmaceutics. 2023; 15(4):1124. https://doi.org/10.3390/pharmaceutics15041124
Chicago/Turabian StyleHendawy, Omnia M., Mohammad M. Al-Sanea, Rehab Mohammed Elbargisy, Hidayat Ur Rahman, Hesham A. M. Gomaa, Ahmed A. B. Mohamed, Mohamed F. Ibrahim, Abdulsalam M. Kassem, and Mohammed Elmowafy. 2023. "Development of Olive Oil Containing Phytosomal Nanocomplex for Improving Skin Delivery of Quercetin: Formulation Design Optimization, In Vitro and Ex Vivo Appraisals" Pharmaceutics 15, no. 4: 1124. https://doi.org/10.3390/pharmaceutics15041124