
Fast and Simple Liquid Chromatography-Isotope Dilution Tandem Mass Spectrometry Method for Therapeutic Drug Monitoring of Dalbavancin in Long-Term Treatment of Subacute and/or Chronic Infections

 , , ,
, , , 
Abstract
:1. Introduction
2. Materials and Methods
2.1. Chemical and Reagents
2.2. Stock Solutions, Standards and Quality Controls
- -
- Low QC (LQC) = 7 mg/L;
- -
- Medium QC (MQC) = 70 mg/L;
- -
- High QC (HQC) = 280 mg/L.
2.3. Instrumentation
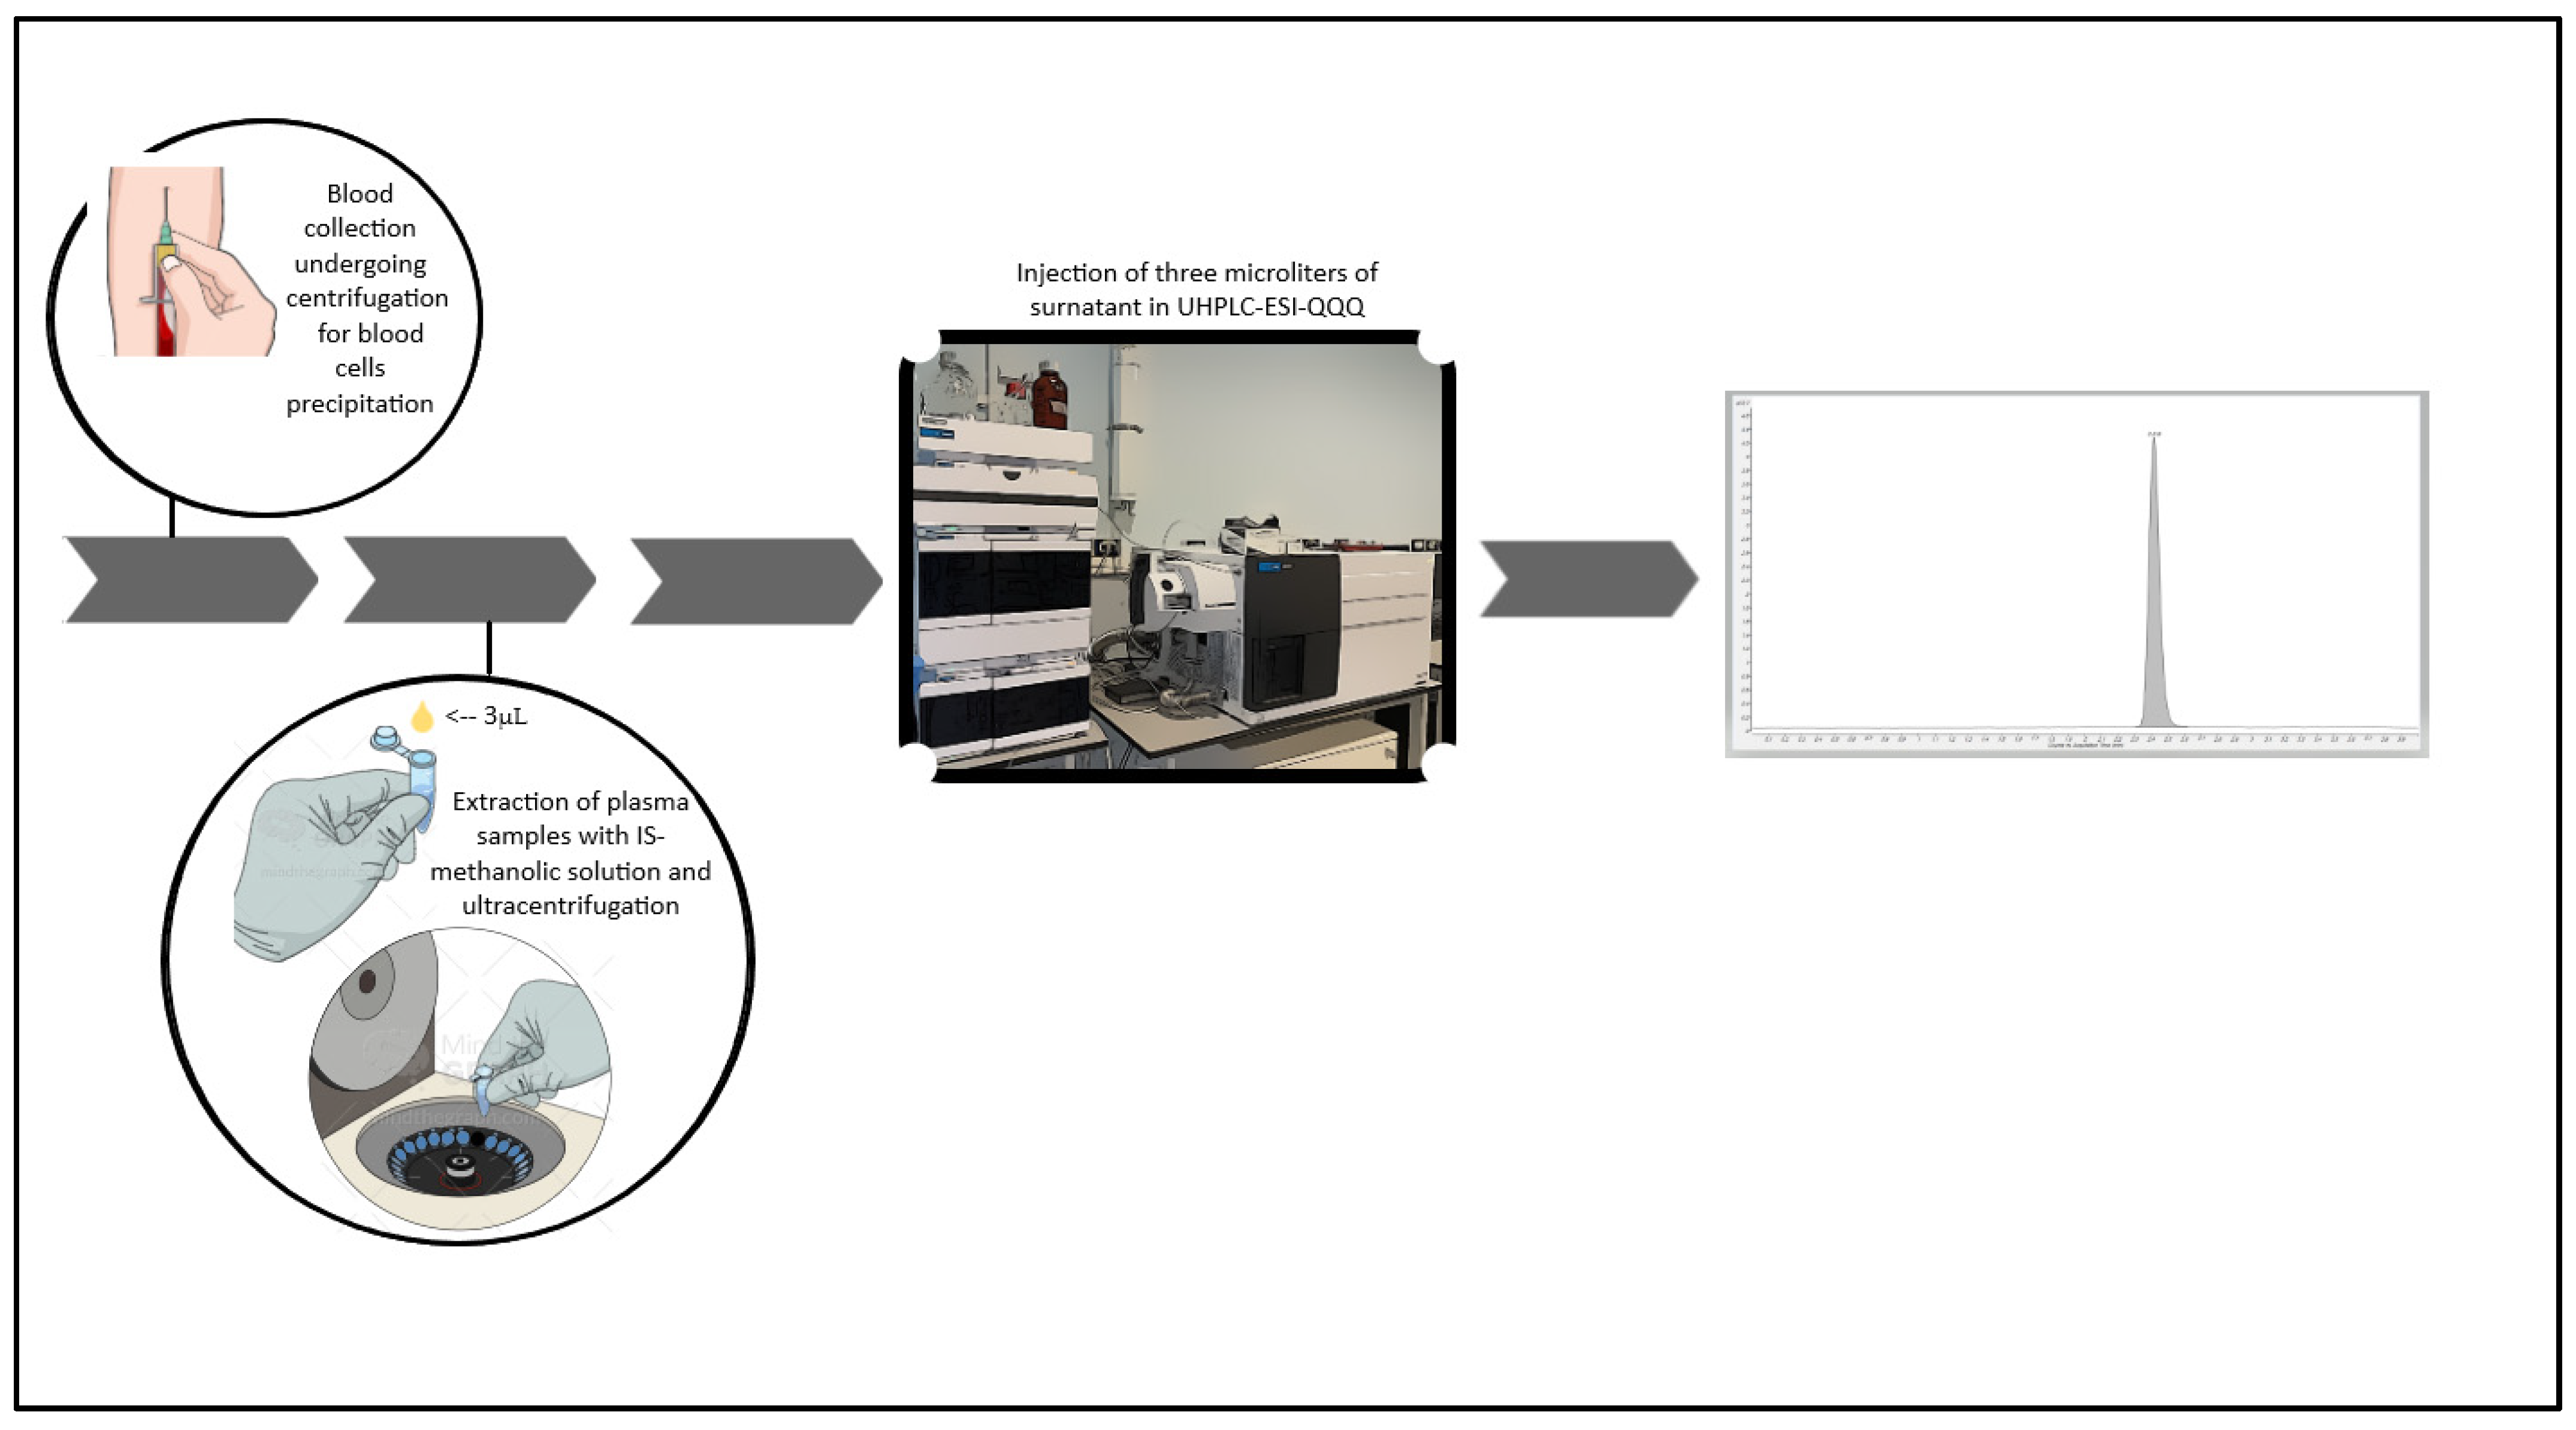
2.4. Sample Pre-Treatment
2.5. Method Validation
2.5.1. Selectivity
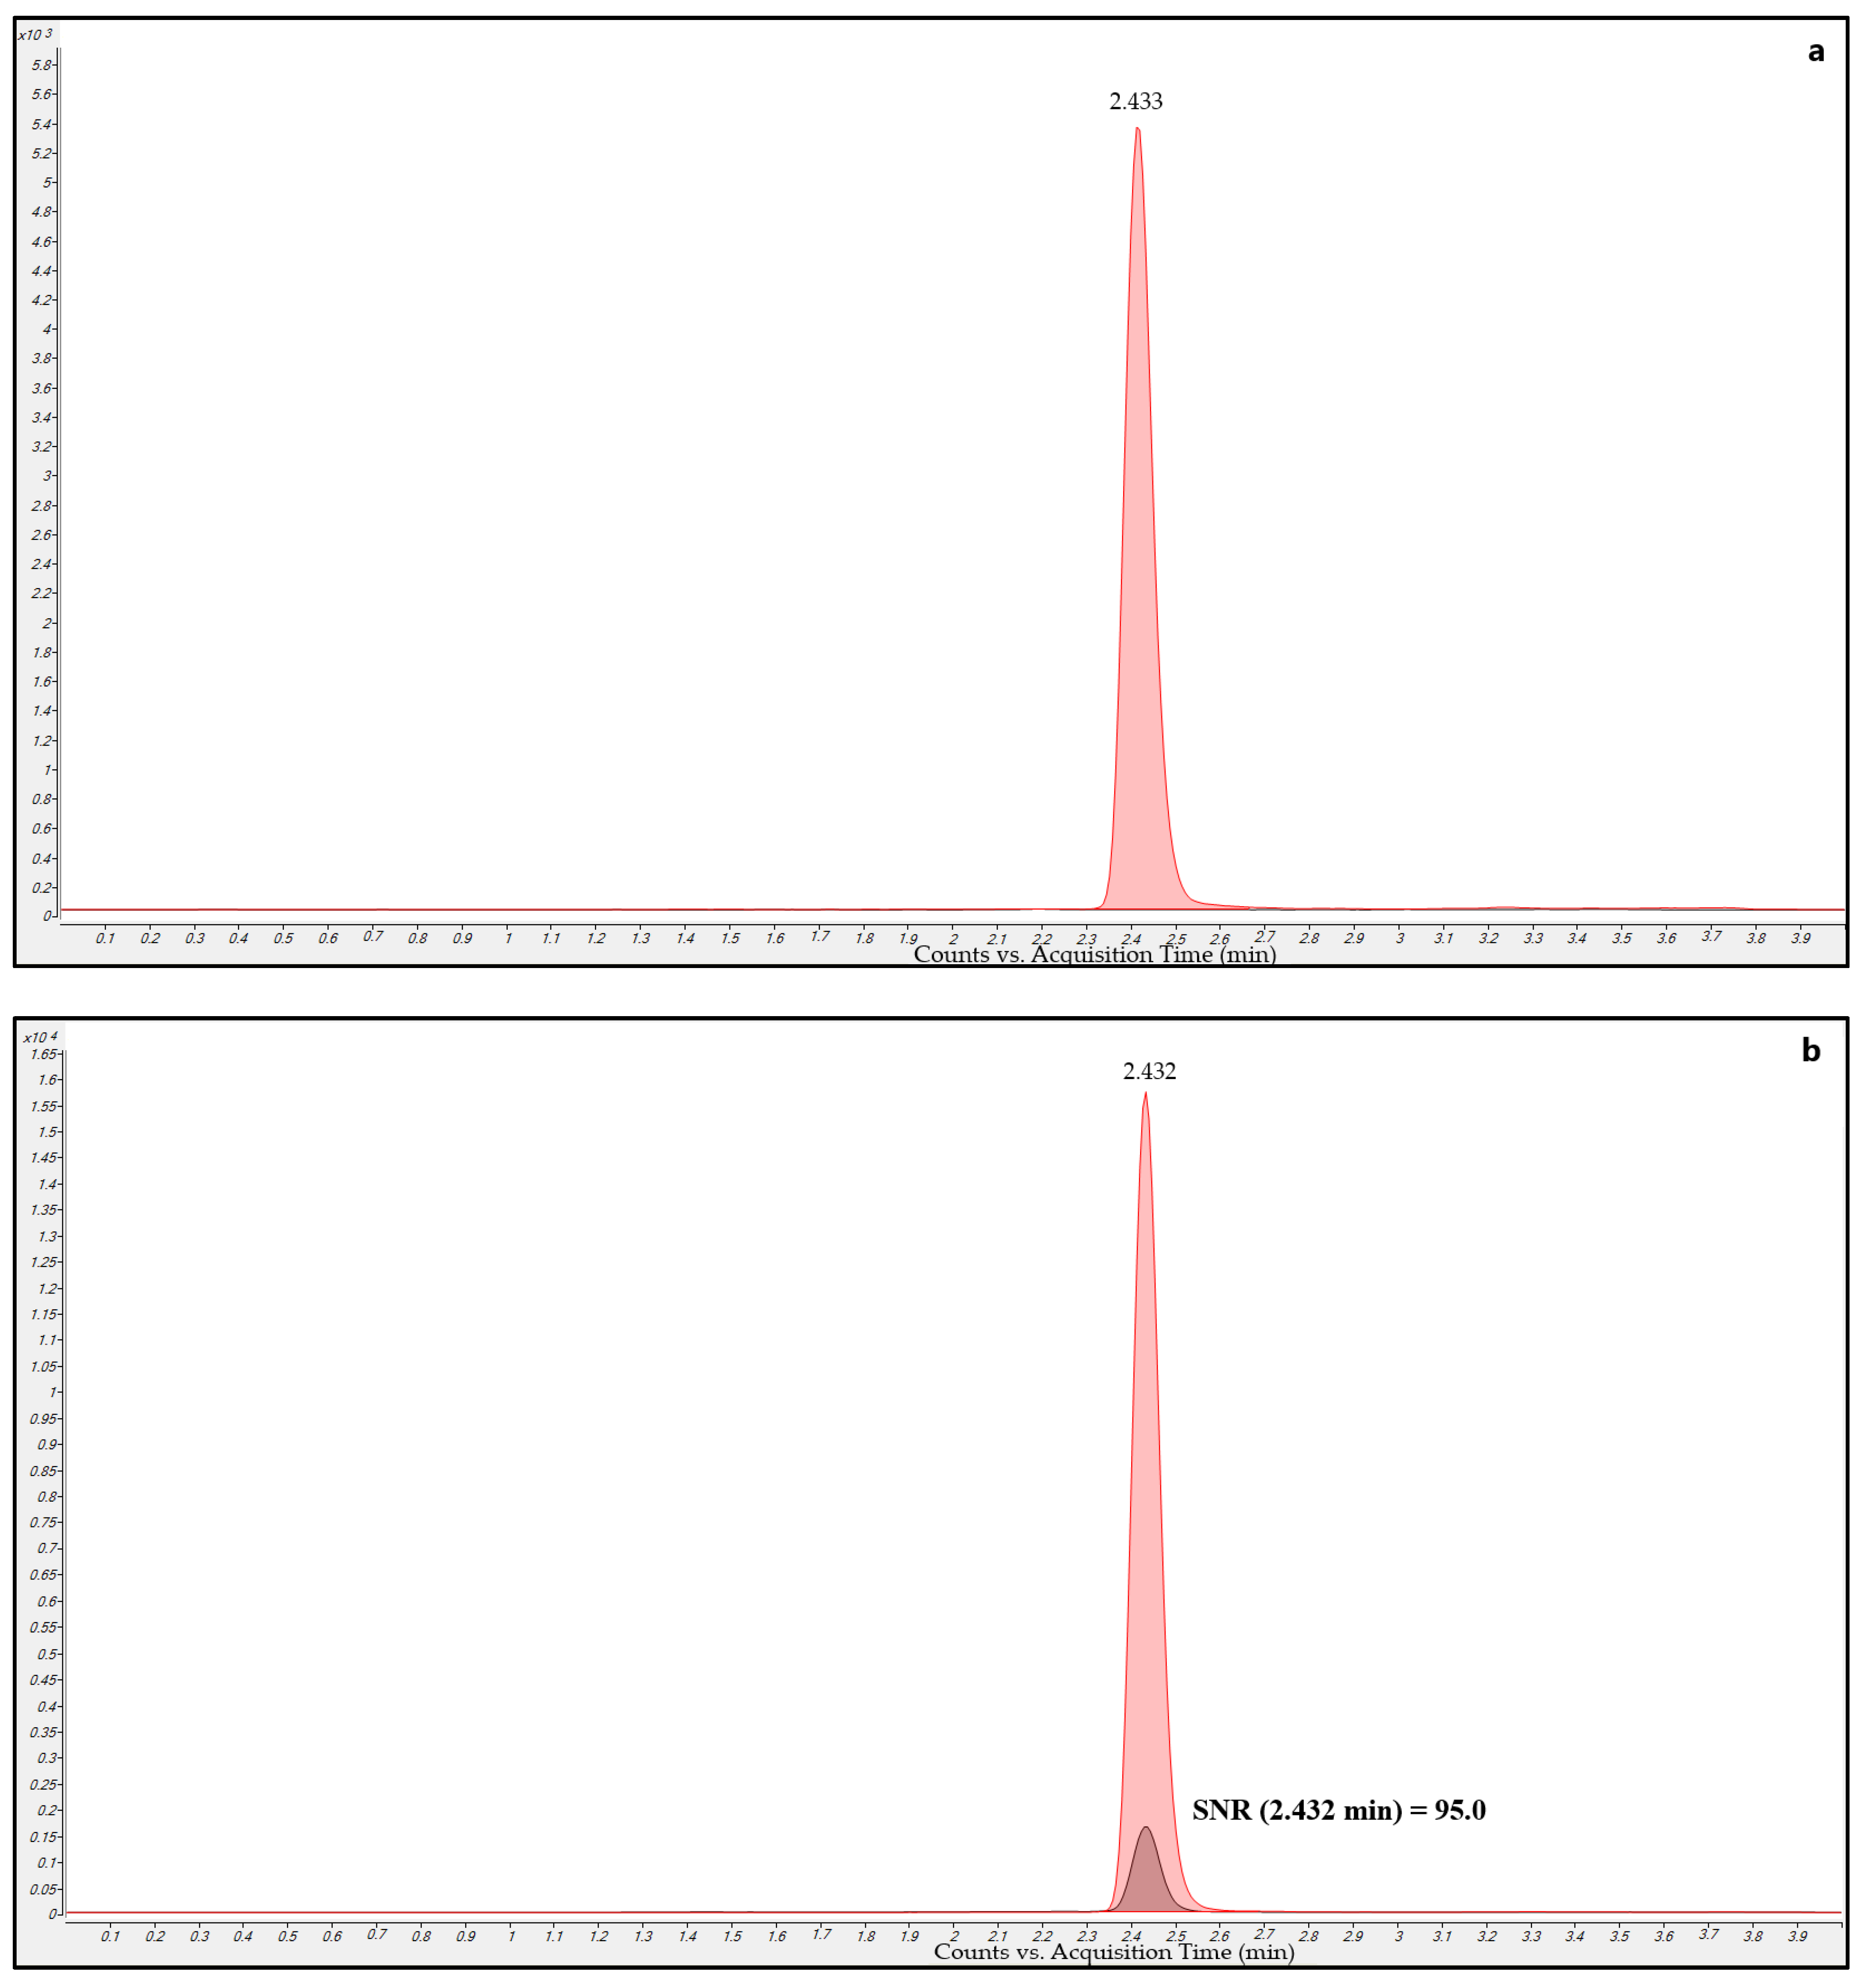
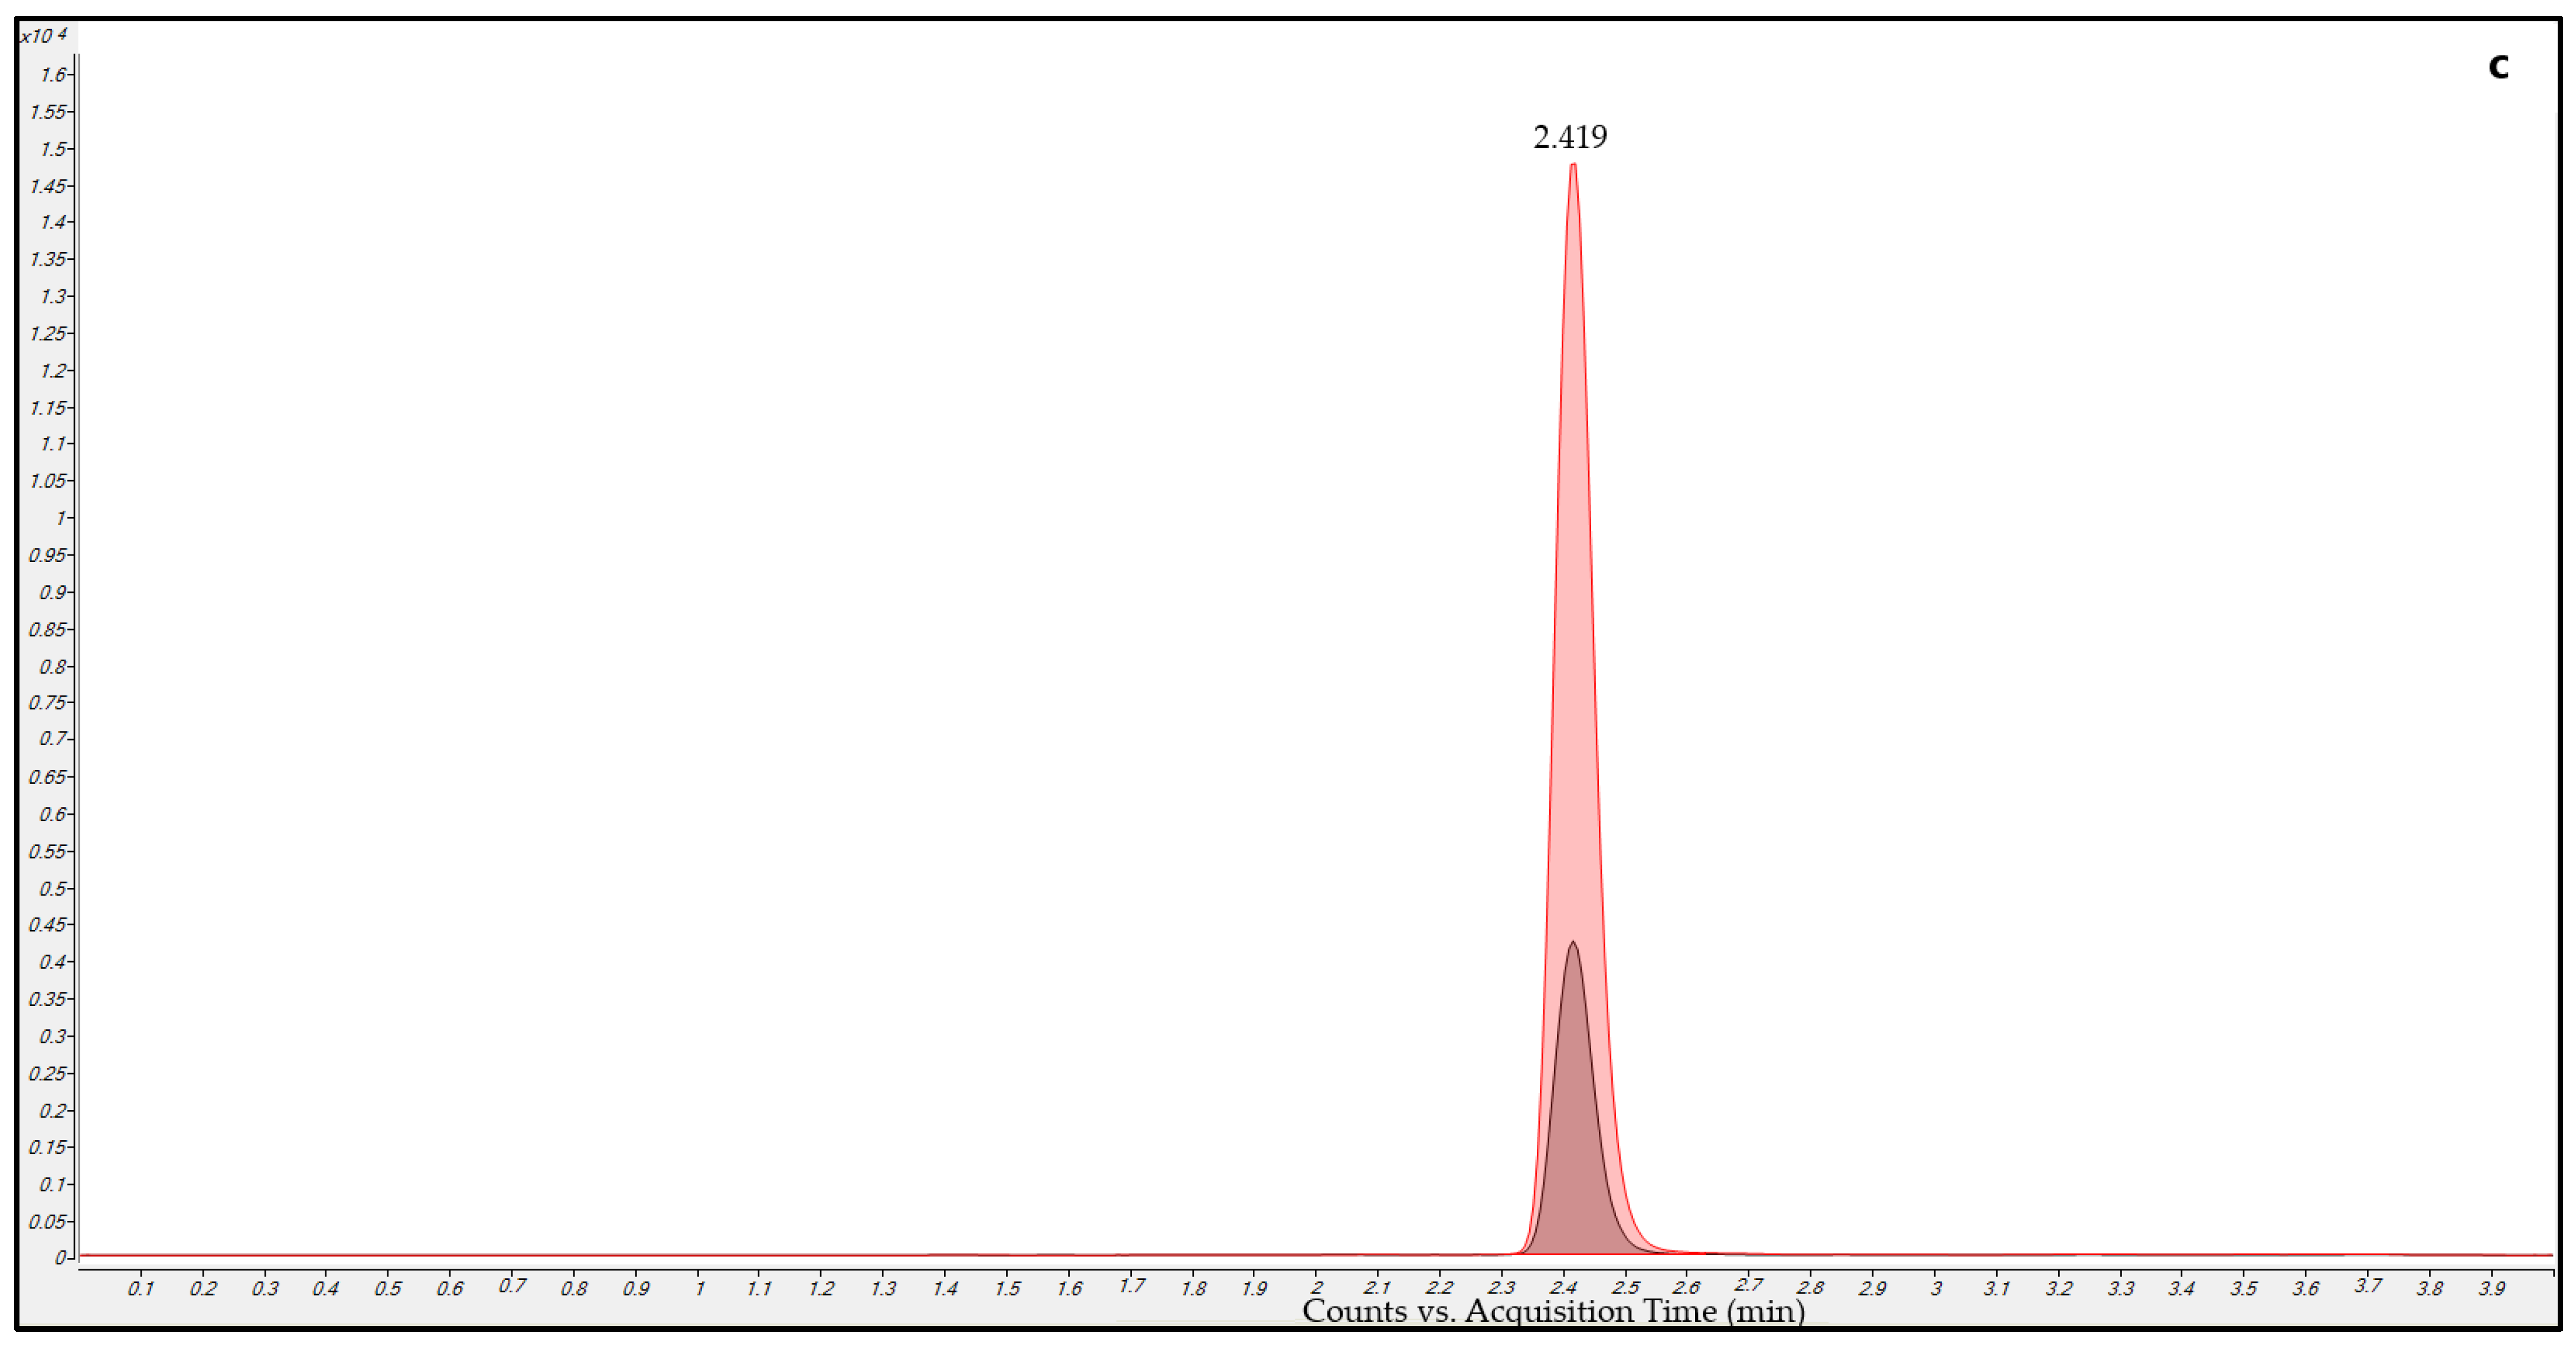
2.5.2. Carry-Over
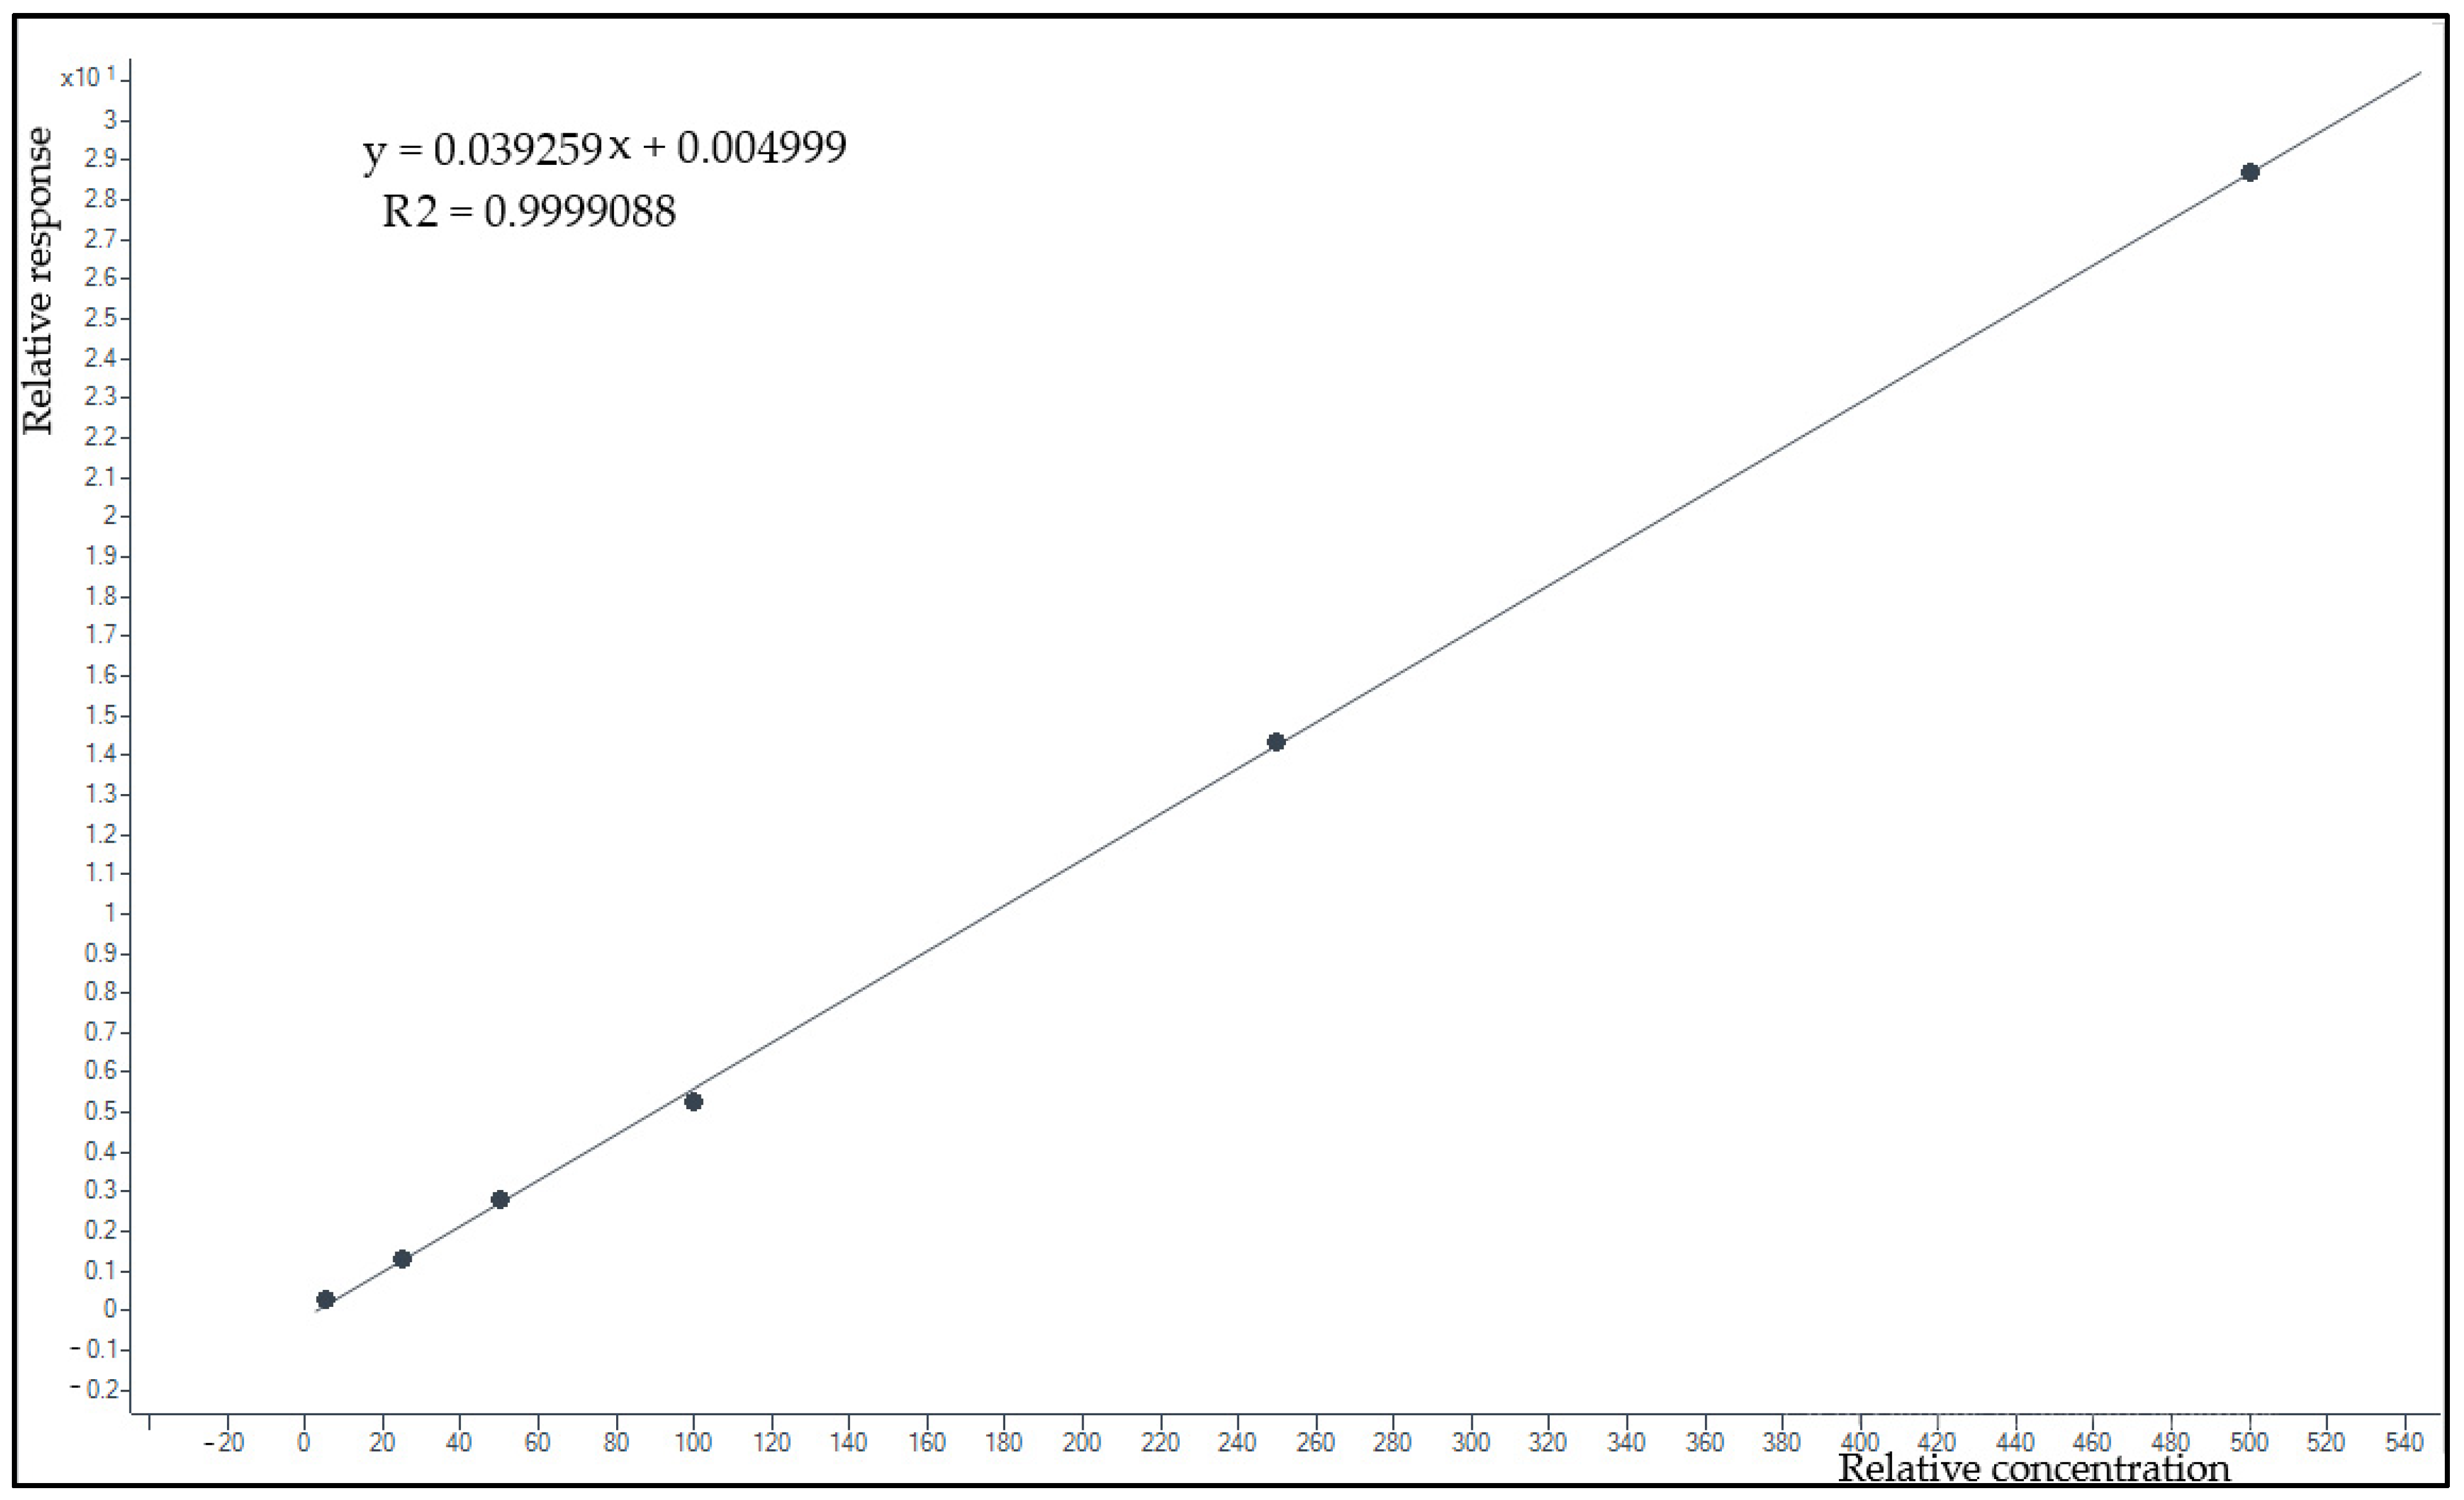
2.5.3. Linearity and Lower Limit of Quantification
2.5.4. Precision and Accuracy
2.5.5. Matrix Effect and Extraction Recovery
2.5.6. Stability
- sample extracts kept on board at 10 °C for 24 h and frozen at −80 °C for 24 h;
- plasma samples analyzed after three complete freeze and thaw cycles (from −80 °C to 25 °C).
2.6. Clinical Application
3. Results
3.1. Optimization of LC-MS/MS Conditions
3.2. Method Validation
3.2.1. Selectivity
3.2.2. Carry-Over
3.2.3. Lower Limit of Quantification and Linearity
3.2.4. Precision and Accuracy
3.2.5. Matrix Effect and Extraction Recovery
3.2.6. Stability
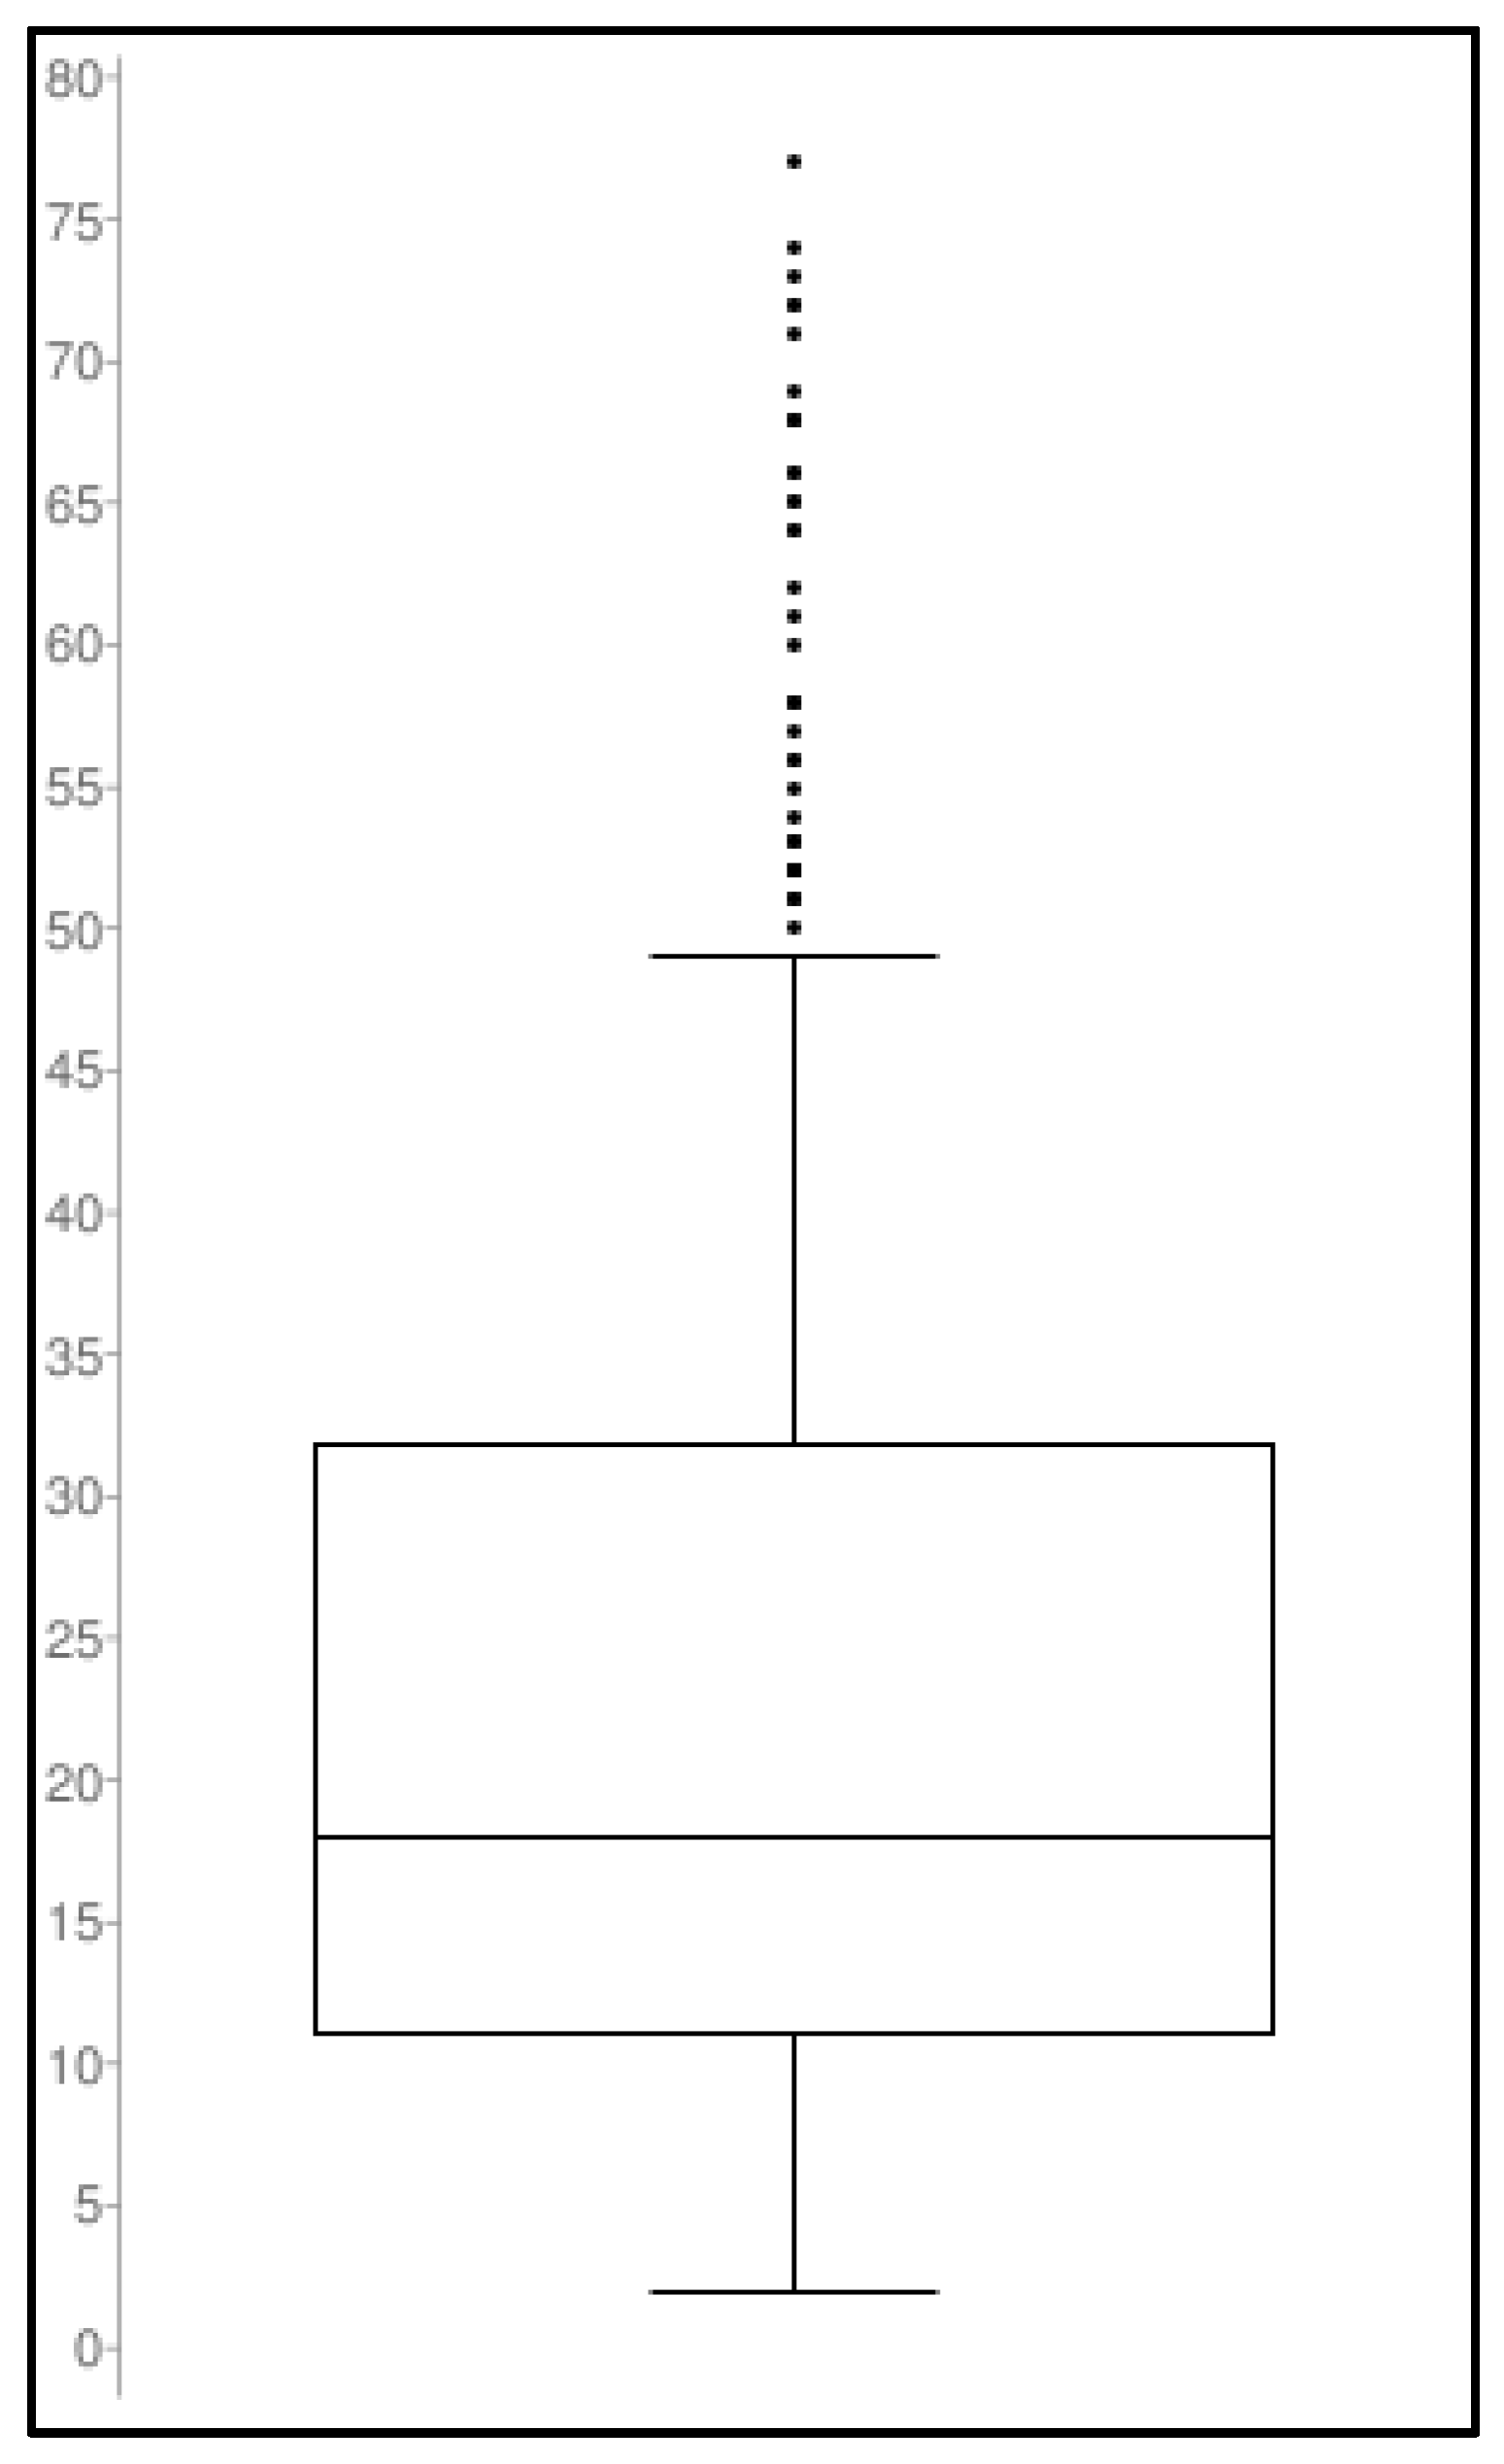
3.3. Clinical Application
4. Discussion
5. Conclusions
Author Contributions
Funding
Institutional Review Board Statement
Informed Consent Statement
Data Availability Statement
Conflicts of Interest
References
- Barberán, J.; de la Cuerda, A.; Barberán, L.C. Dalbavancin. Rev. Esp. Quimioter. 2021, 34 (Suppl. 1), 26–28. [Google Scholar] [CrossRef]
- Cojutti, P.G.; Rinaldi, M.; Zamparini, E.; Rossi, N.; Tedeschi, S.; Conti, M.; Pea, F.; Viale, P. Population Pharmacokinetics of Dalbavancin and Dosing Consideration for Optimal Treatment of Adult Patients with Staphylococcal Osteoarticular Infections. Antimicrob. Agents Chemother. 2021, 65, AAC.02260-20. [Google Scholar] [CrossRef]
- Cojutti, P.G.; Tedeschi, S.; Gatti, M.; Zamparini, E.; Meschiari, M.; Siega, P.D.; Mazzitelli, M.; Soavi, L.; Binazzi, R.; Erne, E.M.; et al. Population Pharmacokinetic and Pharmacodynamic Analysis of Dalbavancin for Long-Term Treatment of Subacute and/or Chronic Infectious Diseases: The Major Role of Therapeutic Drug Monitoring. Antibiotics 2022, 11, 996. [Google Scholar] [CrossRef]
- Abdul-Aziz, M.H.; Alffenaar, J.-W.C.; Bassetti, M.; Bracht, H.; Dimopoulos, G.; Marriott, D.; Neely, M.N.; Paiva, J.-A.; Pea, F.; Sjovall, F.; et al. Antimicrobial Therapeutic Drug Monitoring in Critically Ill Adult Patients: A Position Paper. Intensive Care Med. 2020, 46, 1127–1153. [Google Scholar] [CrossRef] [PubMed]
- Kang, J.S.; Lee, M.H. Overview of Therapeutic Drug Monitoring. Korean J. Intern. Med. 2009, 24, 1–10. [Google Scholar] [CrossRef]
- Grześk, G.; Stolarek, W.; Kasprzak, M.; Grześk, E.; Rogowicz, D.; Wiciński, M.; Krzyżanowski, M. Therapeutic Drug Monitoring of Carbamazepine: A 20-Year Observational Study. J. Clin. Med. 2021, 10, 5396. [Google Scholar] [CrossRef]
- Gatti, M.; Andreoni, M.; Pea, F.; Viale, P. Real-World Use of Dalbavancin in the Era of Empowerment of Outpatient Antimicrobial Treatment: A Careful Appraisal Beyond Approved Indications Focusing on Unmet Clinical Needs. Drug Des. Dev. Ther. 2021, 15, 3349–3378. [Google Scholar] [CrossRef]
- Stroffolini, G.; De Nicolò, A.; Gaviraghi, A.; Mula, J.; Cariti, G.; Scabini, S.; Manca, A.; Cusato, J.; Corcione, S.; Bonora, S.; et al. Clinical Effectiveness and Pharmacokinetics of Dalbavancin in Treatment-Experienced Patients with Skin, Osteoarticular, or Vascular Infections. Pharmaceutics 2022, 14, 1882. [Google Scholar] [CrossRef]
- Tey, H.Y.; See, H.H. A Review of Recent Advances in Microsampling Techniques of Biological Fluids for Therapeutic Drug Monitoring. J. Chromatogr. A 2021, 1635, 461731. [Google Scholar] [CrossRef]
- Rincón, J.P.; Meesters, R.J.W. Evaluation of Peripheral Blood Microsampling Techniques in Combination with Liquid Chromatography-High Resolution Mass Spectrometry for the Determination of Drug Pharmacokinetics in Clinical Studies. Drug Test. Anal. 2014, 6, 568–577. [Google Scholar] [CrossRef]
- Ruggiero, C.; Ramirez, S.; Ramazzotti, E.; Mancini, R.; Muratori, R.; Raggi, M.A.; Conti, M. Multiplexed Therapeutic Drug Monitoring of Antipsychotics in Dried Plasma Spots by LC-MS/MS. J. Sep. Sci. 2020, 43, 1440–1449. [Google Scholar] [CrossRef] [PubMed]
- da Silva, A.C.C.; de Lima Feltraco Lizot, L.; Bastiani, M.F.; Venzon Antunes, M.; Brucker, N.; Linden, R. Dried Plasma Spots for Therapeutic Monitoring of Amikacin: Validation of an UHPLC-MS/MS Assay and Pharmacokinetic Application. J. Pharm. Biomed. Anal. 2020, 184, 113201. [Google Scholar] [CrossRef]
- Aboul-Enein, H.Y.; Ali, I. Comparison of the Chiral Resolution of Econazole, Miconazole, and Sulconazole by HPLC Using Normal-Phase Amylose CSPs. Fresenius J. Anal. Chem. 2001, 370, 951–955. [Google Scholar] [CrossRef] [PubMed]
- Aboul-Enein, H.Y.; Ali, I. Studies on the Effect of Alcohols on the Chiral Discrimination Mechanisms of Amylose Stationary Phase on the Enantioseparation of Nebivolol by HPLC. J. Biochem. Biophys. Methods 2001, 48, 175–188. [Google Scholar] [CrossRef] [PubMed]
- Al-Othman, Z.A.; Al-Warthan, A.; Ali, I. Advances in Enantiomeric Resolution on Monolithic Chiral Stationary Phases in Liquid Chromatography and Electrochromatography. J. Sep. Sci. 2014, 37, 1033–1057. [Google Scholar] [CrossRef]
- Ali, I.; Al-Othman, Z.A.; Nagae, N.; Gaitonde, V.D.; Dutta, K.K. Recent Trends in Ultra-Fast HPLC: New Generation Superficially Porous Silica Columns. J. Sep. Sci. 2012, 35, 3235–3249. [Google Scholar] [CrossRef]
- Chiriac, U.; Rau, H.; Frey, O.R.; Röhr, A.C.; Klein, S.; Meyer, A.L.; Morath, B. Validation and Application of an HPLC-UV Method for Routine Therapeutic Drug Monitoring of Dalbavancin. Antibiotics 2022, 11, 541. [Google Scholar] [CrossRef]
- Alebic-Kolbah, T.; Demers, R.; Cojocaru, L. Dalbavancin: Quantification in Human Plasma and Urine by a New Improved High Performance Liquid Chromatography-Tandem Mass Spectrometry Method. J. Chromatogr. B 2011, 879, 2632–2641. [Google Scholar] [CrossRef] [PubMed]
- Avataneo, V.; Antonucci, M.; De Vivo, E.D.; Briozzo, A.; Cusato, J.; Bermond, F.; Vitale, C.; Vitale, F.; Manca, A.; Palermiti, A.; et al. Validation and Clinical Application of a New Liquid Chromatography Coupled to Mass Spectrometry (HPLC-MS) Method for Dalbavancin Quantification in Human Plasma. Separations 2021, 8, 189. [Google Scholar] [CrossRef]
- Zhu, D.; Ping, L.; Hong, Y.; Shen, J.; Weng, Q.; He, Q. Simultaneous Quantification and Pharmacokinetic Study of Five Homologs of Dalbavancin in Rat Plasma Using UHPLC-MS/MS. Molecules 2020, 25, 4100. [Google Scholar] [CrossRef]
- Seraissol, P.; Lanot, T.; Baklouti, S.; Mané, C.; Ruiz, S.; Lavit, M.; De Riols, P.; Garrigues, J.-C.; Gandia, P. Evaluation of 4 Quantification Methods for Monitoring 16 Antibiotics and 1 Beta-Lactamase Inhibitor in Human Serum by High-Performance Liquid Chromatography with Tandem Mass Spectrometry Detection. J. Pharm. Biomed. Anal. 2022, 219, 114900. [Google Scholar] [CrossRef] [PubMed]
- Jurado, J.M.; Alcázar, A.; Muñiz-Valencia, R.; Ceballos-Magaña, S.G.; Raposo, F. Some Practical Considerations for Linearity Assessment of Calibration Curves as Function of Concentration Levels According to the Fitness-for-Purpose Approach. Talanta 2017, 172, 221–229. [Google Scholar] [CrossRef] [PubMed]
- Sullivan, J.O.; Blake, K.; Berntgen, M.; Salmonson, T.; Welink, J. Pharmacokinetics Working Party Overview of the European Medicines Agency’s Development of Product-Specific Bioequivalence Guidelines. Clin. Pharmacol. Ther. 2018, 104, 539–545. [Google Scholar] [CrossRef]
- Deng, F.; Yu, H.; Pan, X.; Hu, G.; Wang, Q.; Peng, R.; Tan, L.; Yang, Z. Ultra-High Performance Liquid Chromatography Tandem Mass Spectrometry for the Determination of Five Glycopeptide Antibiotics in Food and Biological Samples Using Solid-Phase Extraction. J. Chromatogr. A 2018, 1538, 54–59. [Google Scholar] [CrossRef] [PubMed]
- Turner, N.A.; Xu, A.; Zaharoff, S.; Holland, T.L.; Lodise, T.P. Determination of Plasma Protein Binding of Dalbavancin. J. Antimicrob. Chemother. 2022, 77, 1899–1902. [Google Scholar] [CrossRef]
- Veenhof, H.; Koster, R.A.; Junier, L.A.T.; Berger, S.P.; Bakker, S.J.L.; Touw, D.J. Volumetric Absorptive Microsampling and Dried Blood Spot Microsampling vs. Conventional Venous Sampling for Tacrolimus Trough Concentration Monitoring. Clin. Chem. Lab. Med. 2020, 58, 1687–1695. [Google Scholar] [CrossRef]
- Li, W.; Doherty, J.; Favara, S.; Breen, C.; Flarakos, J.; Tse, F.L.S. Evaluation of Plasma Microsampling for Dried Plasma Spots (DPS) in Quantitative LC-MS/MS Bioanalysis Using Ritonavir as a Model Compound. J. Chromatogr. B 2015, 991, 46–52. [Google Scholar] [CrossRef]


| Time (min) | A (%) | B (%) | Flow (mL/min) |
|---|---|---|---|
| 0.00 | 95 | 5 | 0.500 |
| 2.00 | 30 | 70 | 0.500 |
| 2.50 | 5 | 95 | 0.500 |
| 3.00 | 5 | 95 | 0.500 |
| 3.01 | 95 | 5 | 0.500 |
| 4.00 | 95 | 5 | 0.500 |
| Analyte | R T (min) | Precursor Ion (m/z) | Product Ion (m/z) | Dwell Time (ms) | Fragmentator (V) | Collision Energy (V) |
|---|---|---|---|---|---|---|
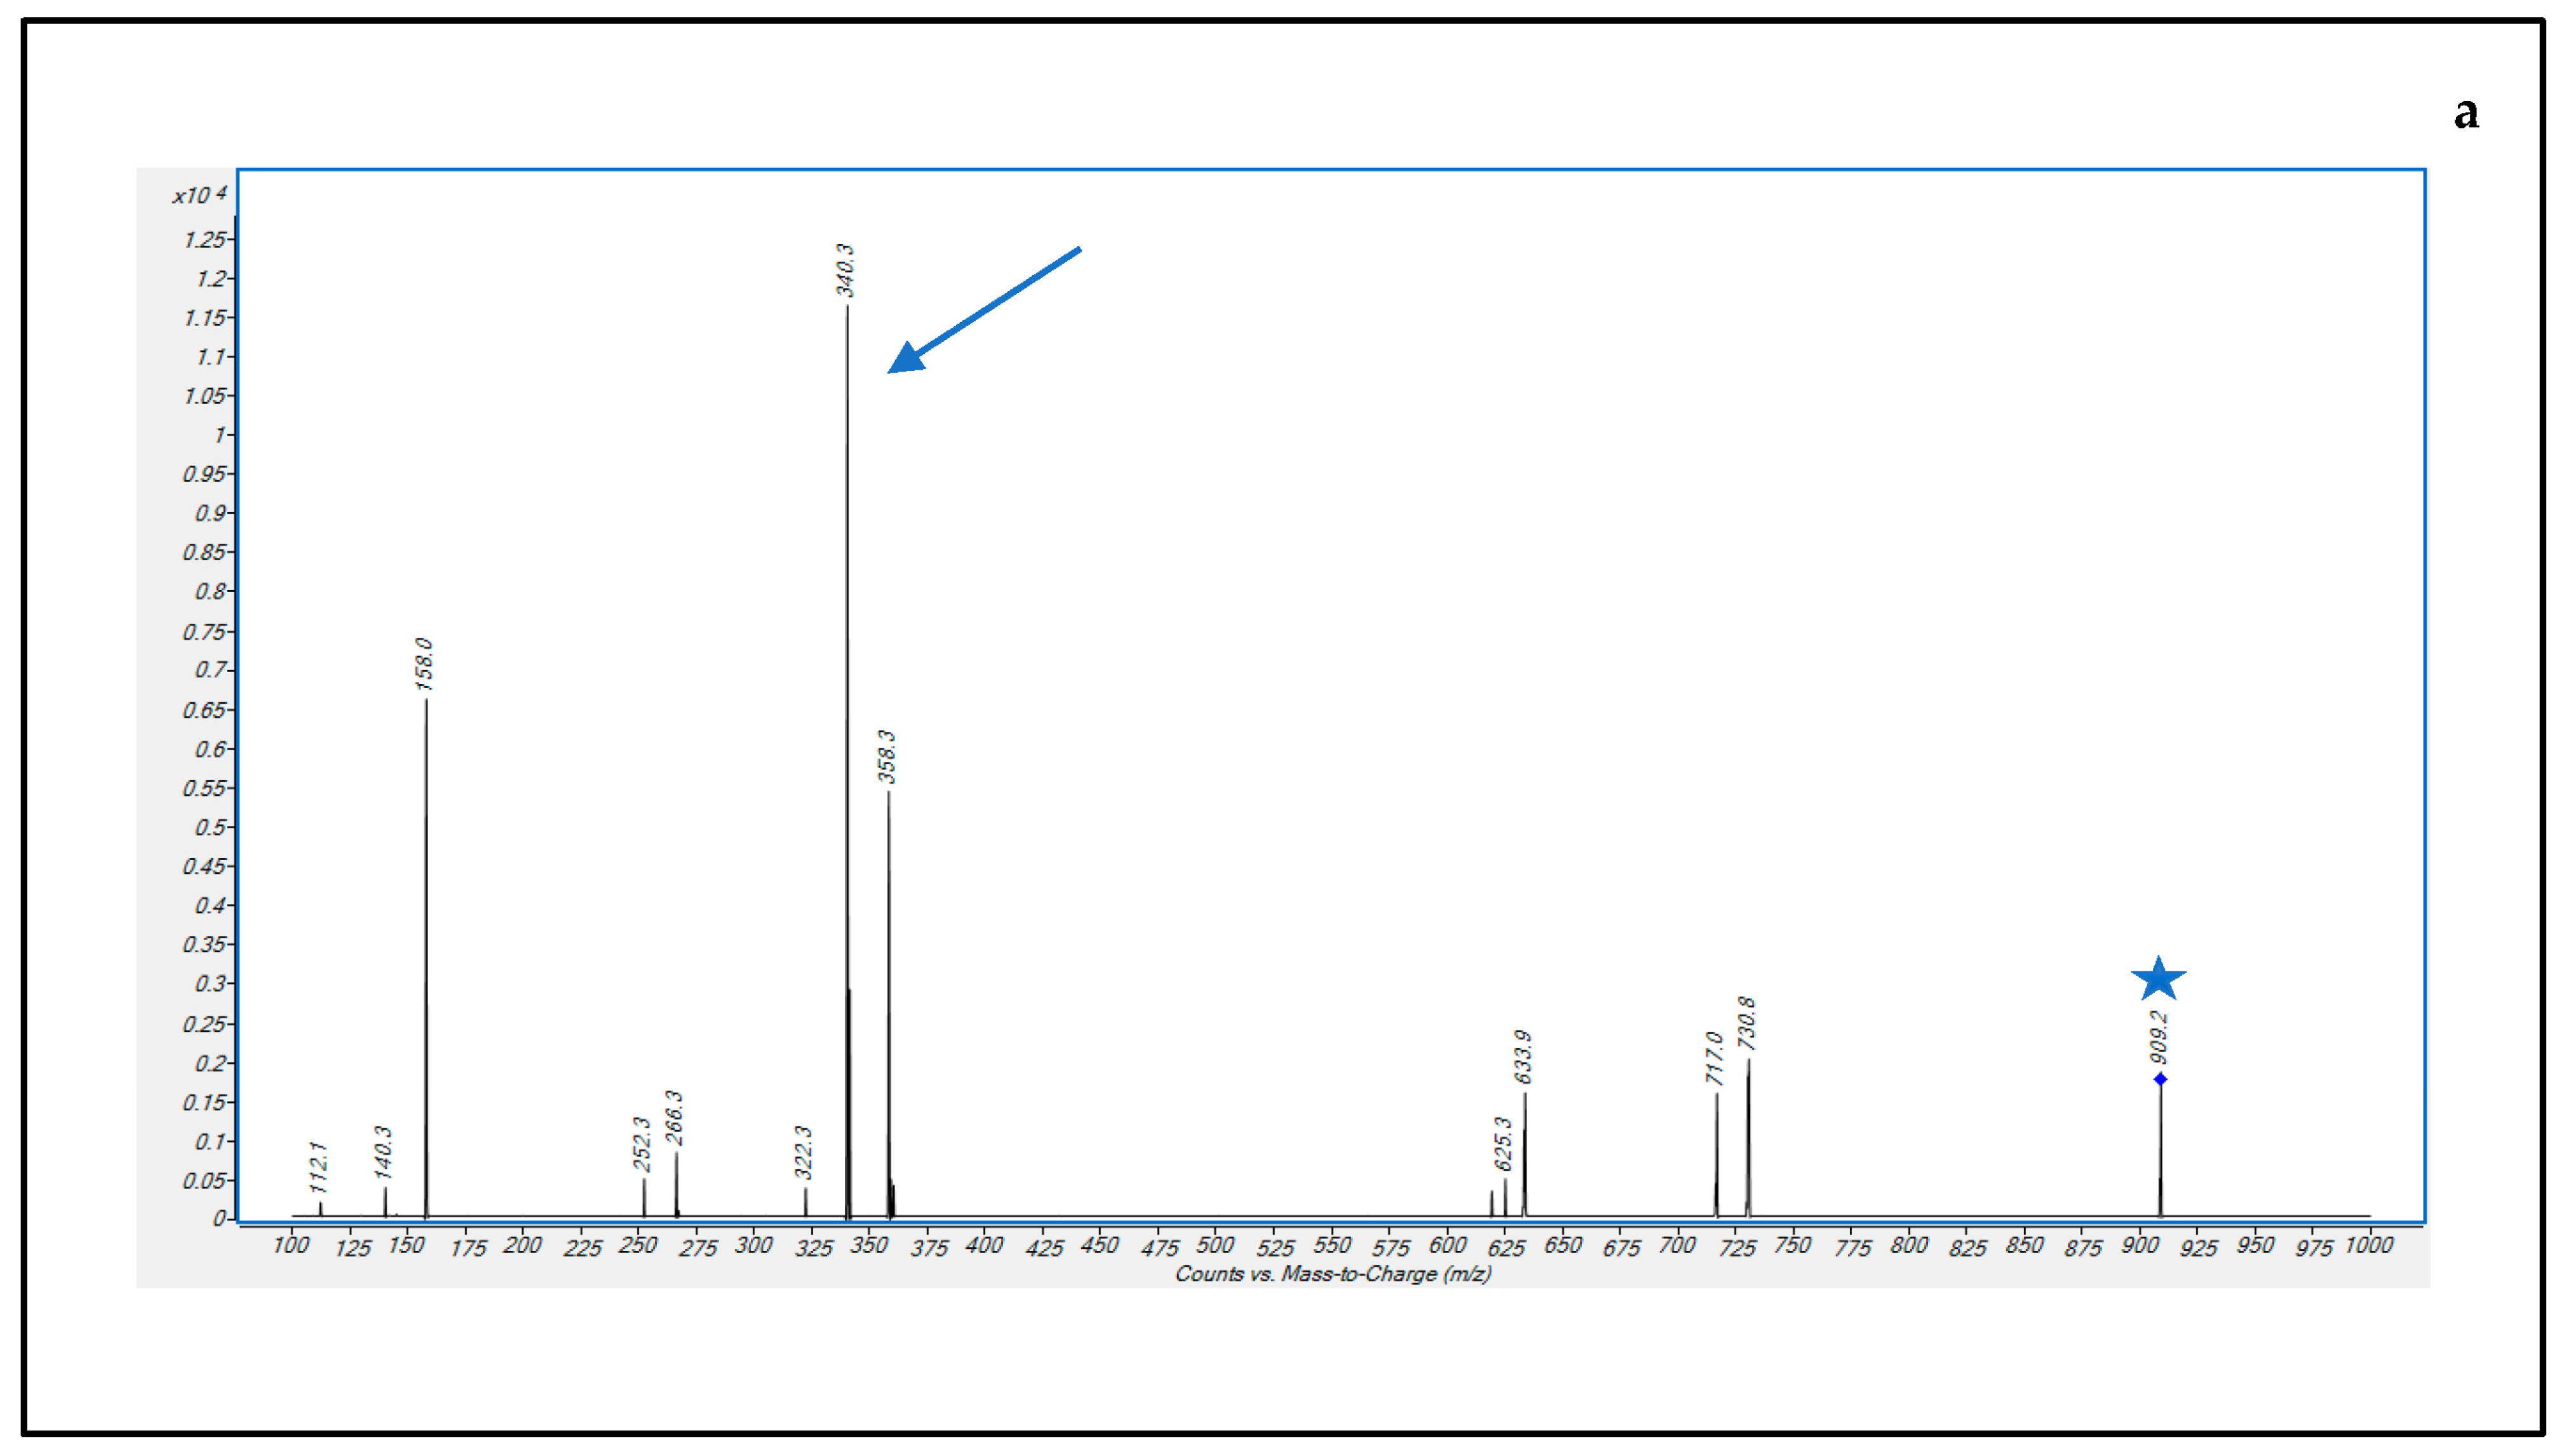
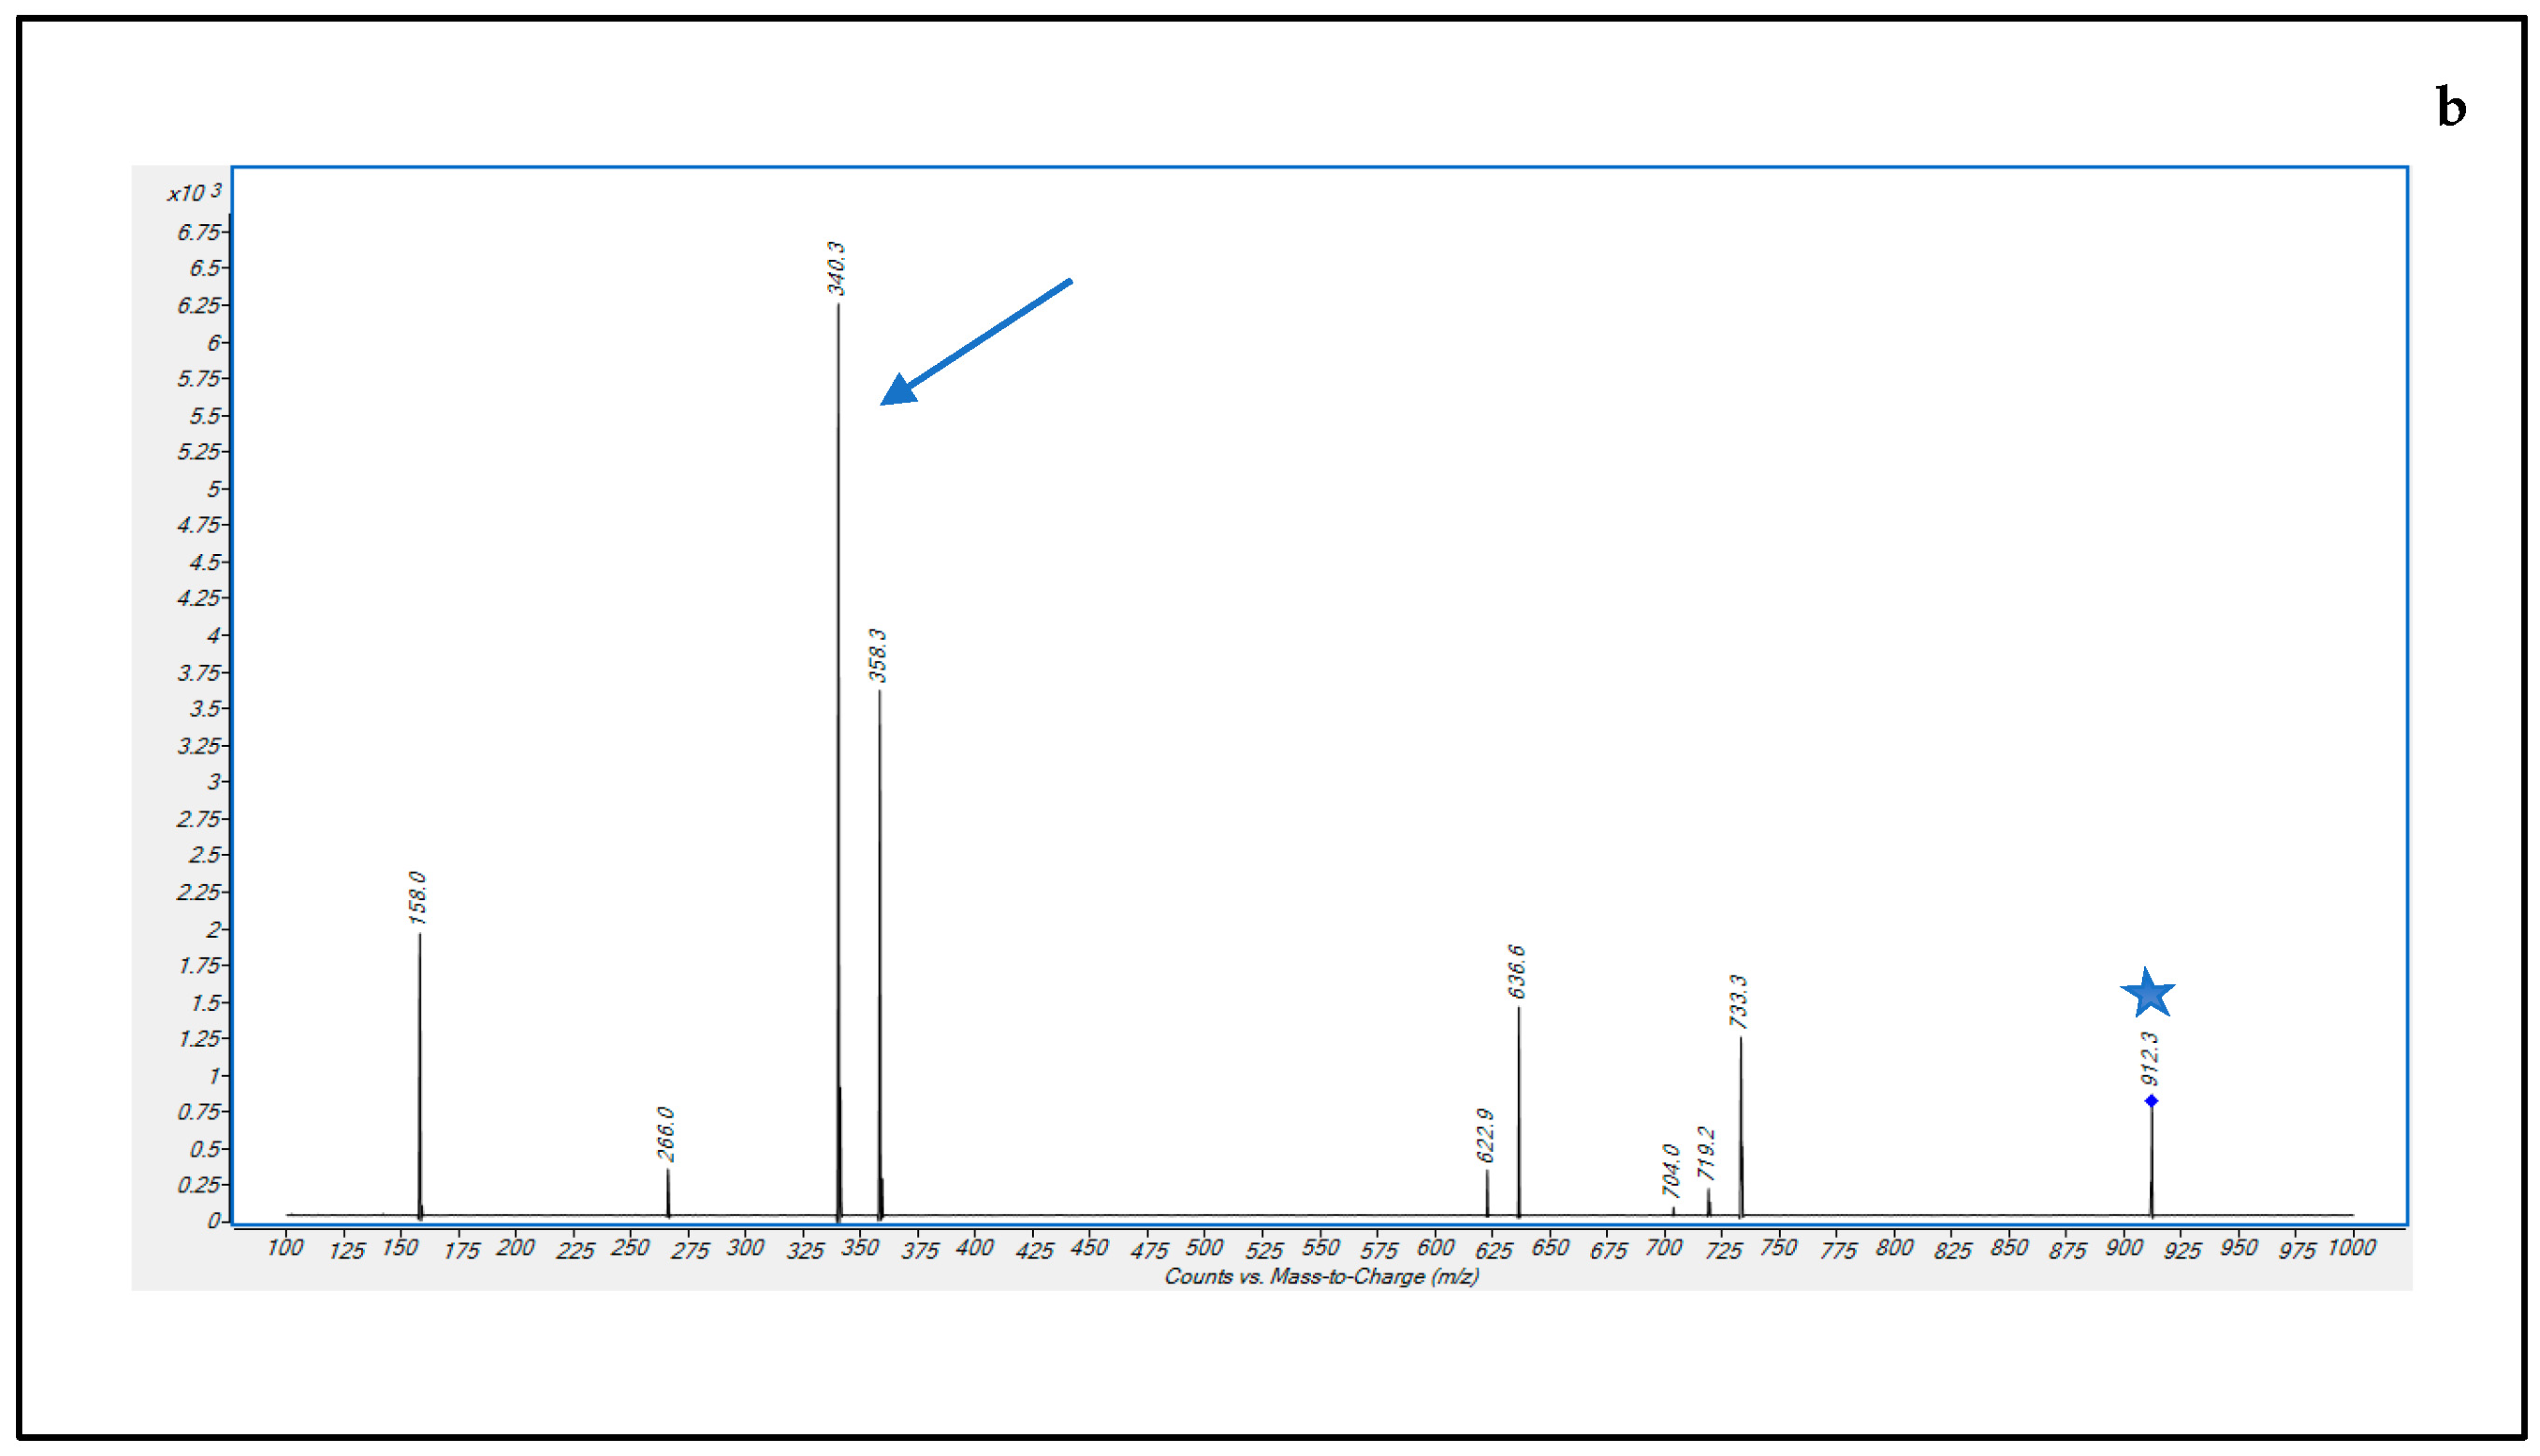
| DBV | 2.40 | 909.3 | 340.2 | 200 | 166 | 28 |
| DBV-d6 | 2.42 | 912.3 | 340.2 | 200 | 166 | 28 |
| Intra-Day (n = 5) | Inter-Day (n = 3) | ||||||
|---|---|---|---|---|---|---|---|
| QC Levels | Nominal Conc. (μg/mL) | Avg Conc. (μg/mL) | Avg Precision (CV%) | Avg Accuracy (Bias%) | Avg Conc. (μg/mL) | Avg Precision (CV%) | Avg Accuracy (Bias%) |
| LLOQ | 0.125 | 0.130 | 12.3 | 4.1 | 0.136 | 13.5 | 7.2 |
| Low | 7 | 6.55 | 10.2 | 9.1 | 6.41 | 7.6 | 9.3 |
| Medium | 70 | 68.3 | 8.4 | 5.8 | 64.9 | 7.0 | 7.9 |
| High | 280 | 252.4 | 11.6 | 9.9 | 241.7 | 13.0 | 13.7 |
| Quality Control Level | N° | Avg Me (%) | Avg IS-Normalized Me (%) | Avg ER (%) |
|---|---|---|---|---|
| LQC | 30 | 109.9 | 114.9 | 86.3 |
| MQC | 30 | 105.7 | 115.5 | 83.5 |
| HQC | 30 | 87.6 | 93.6 | 97.7 |
| Quality Control | Low | Medium | High | |
|---|---|---|---|---|
| Types of Sample | Tested Conditions | Avg Accuracy (Bias%) | Avg Accuracy (Bias%) | Avg Accuracy (Bias%) |
| extract | autosampler post 24 h | 22.1 | 9.4 | 14.8 |
| freezer post 24 h | 16.8 | 6.7 | 12.3 | |
| plasma samples | freeze-thaw stability | |||
| 1 cycle | 14.8 | 8.2 | 11.4 | |
| 2 cycle | 15.1 | 9.3 | 13.6 | |
| 3 cycle | 17.4 | 15.7 | 16.4 | |
Disclaimer/Publisher’s Note: The statements, opinions and data contained in all publications are solely those of the individual author(s) and contributor(s) and not of MDPI and/or the editor(s). MDPI and/or the editor(s) disclaim responsibility for any injury to people or property resulting from any ideas, methods, instructions or products referred to in the content. |
© 2023 by the authors. Licensee MDPI, Basel, Switzerland. This article is an open access article distributed under the terms and conditions of the Creative Commons Attribution (CC BY) license (https://creativecommons.org/licenses/by/4.0/).
Share and Cite
Barone, R.; Conti, M.; Cojutti, P.G.; Gatti, M.; Viale, P.; Pea, F. Fast and Simple Liquid Chromatography-Isotope Dilution Tandem Mass Spectrometry Method for Therapeutic Drug Monitoring of Dalbavancin in Long-Term Treatment of Subacute and/or Chronic Infections. Pharmaceutics 2023, 15, 480. https://doi.org/10.3390/pharmaceutics15020480
Barone R, Conti M, Cojutti PG, Gatti M, Viale P, Pea F. Fast and Simple Liquid Chromatography-Isotope Dilution Tandem Mass Spectrometry Method for Therapeutic Drug Monitoring of Dalbavancin in Long-Term Treatment of Subacute and/or Chronic Infections. Pharmaceutics. 2023; 15(2):480. https://doi.org/10.3390/pharmaceutics15020480
Chicago/Turabian StyleBarone, Rossella, Matteo Conti, Pier Giorgio Cojutti, Milo Gatti, Pierluigi Viale, and Federico Pea. 2023. "Fast and Simple Liquid Chromatography-Isotope Dilution Tandem Mass Spectrometry Method for Therapeutic Drug Monitoring of Dalbavancin in Long-Term Treatment of Subacute and/or Chronic Infections" Pharmaceutics 15, no. 2: 480. https://doi.org/10.3390/pharmaceutics15020480