
Antifungal Combination Eye Drops for Fungal Keratitis Treatment
 , , , , and
Abstract
: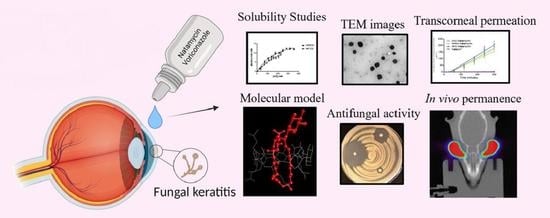
1. Introduction
2. Materials and Methods
2.1. Materials
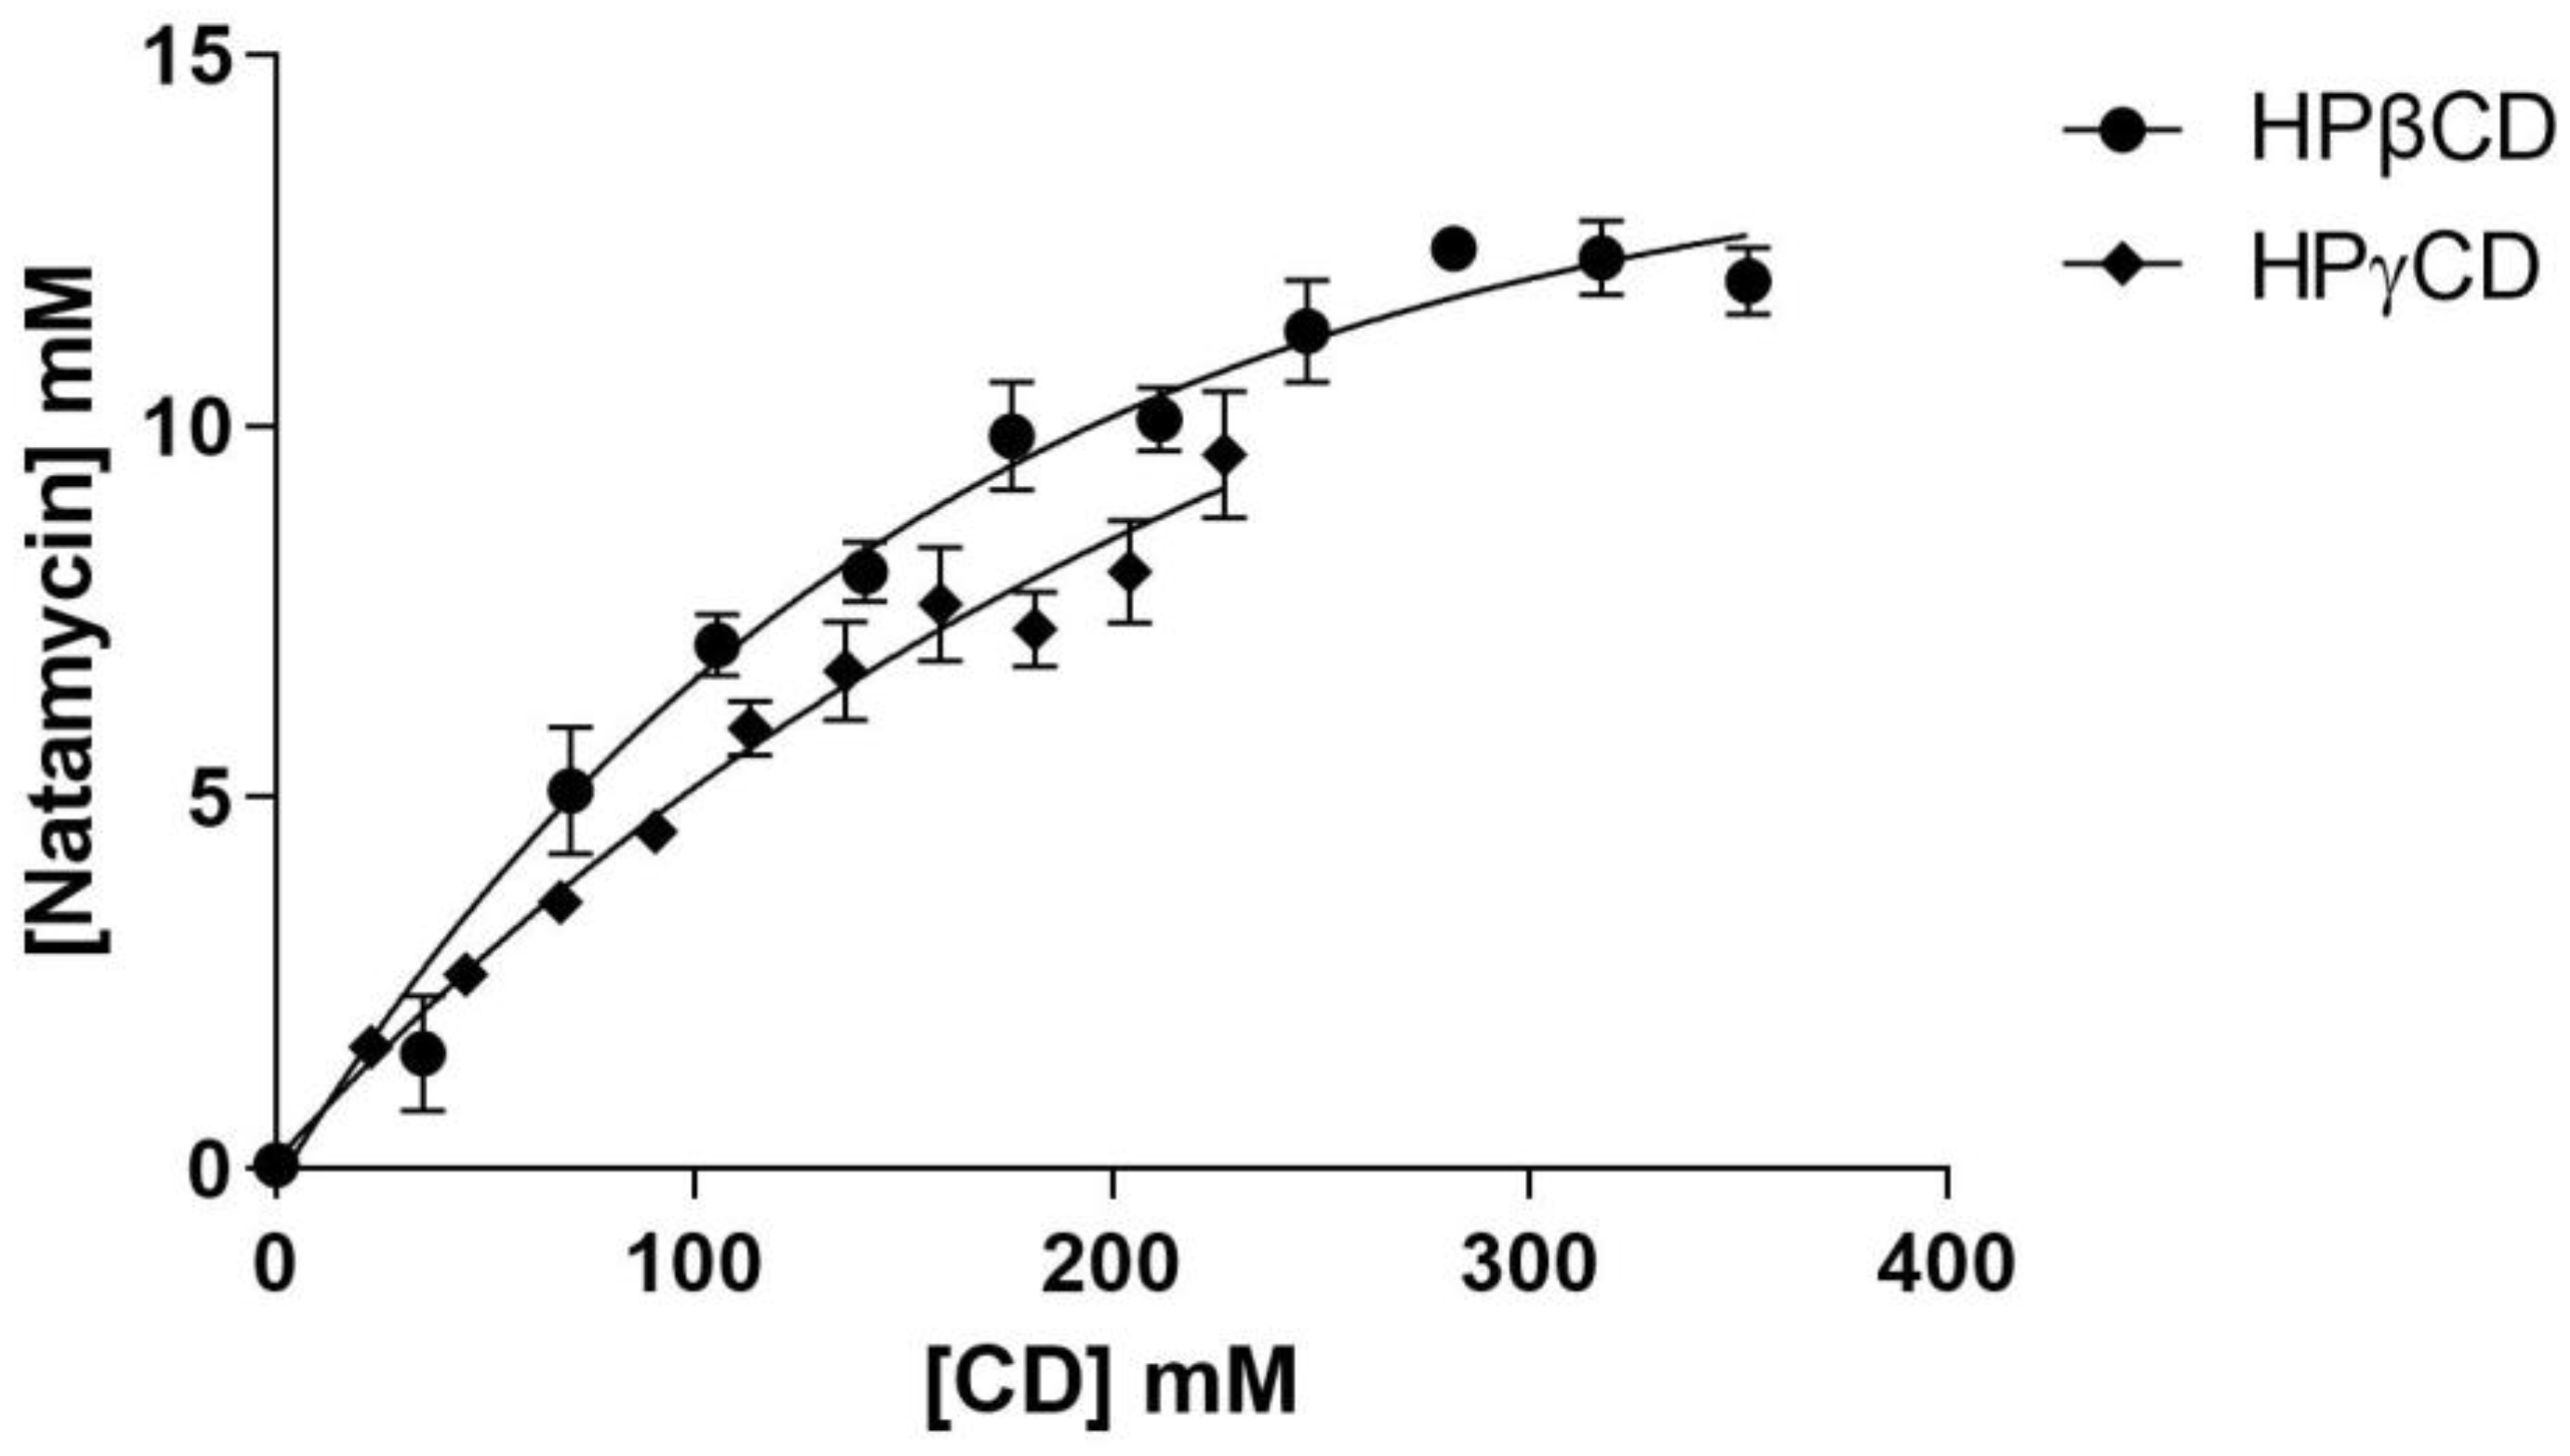
2.2. Phase Solubility Diagrams
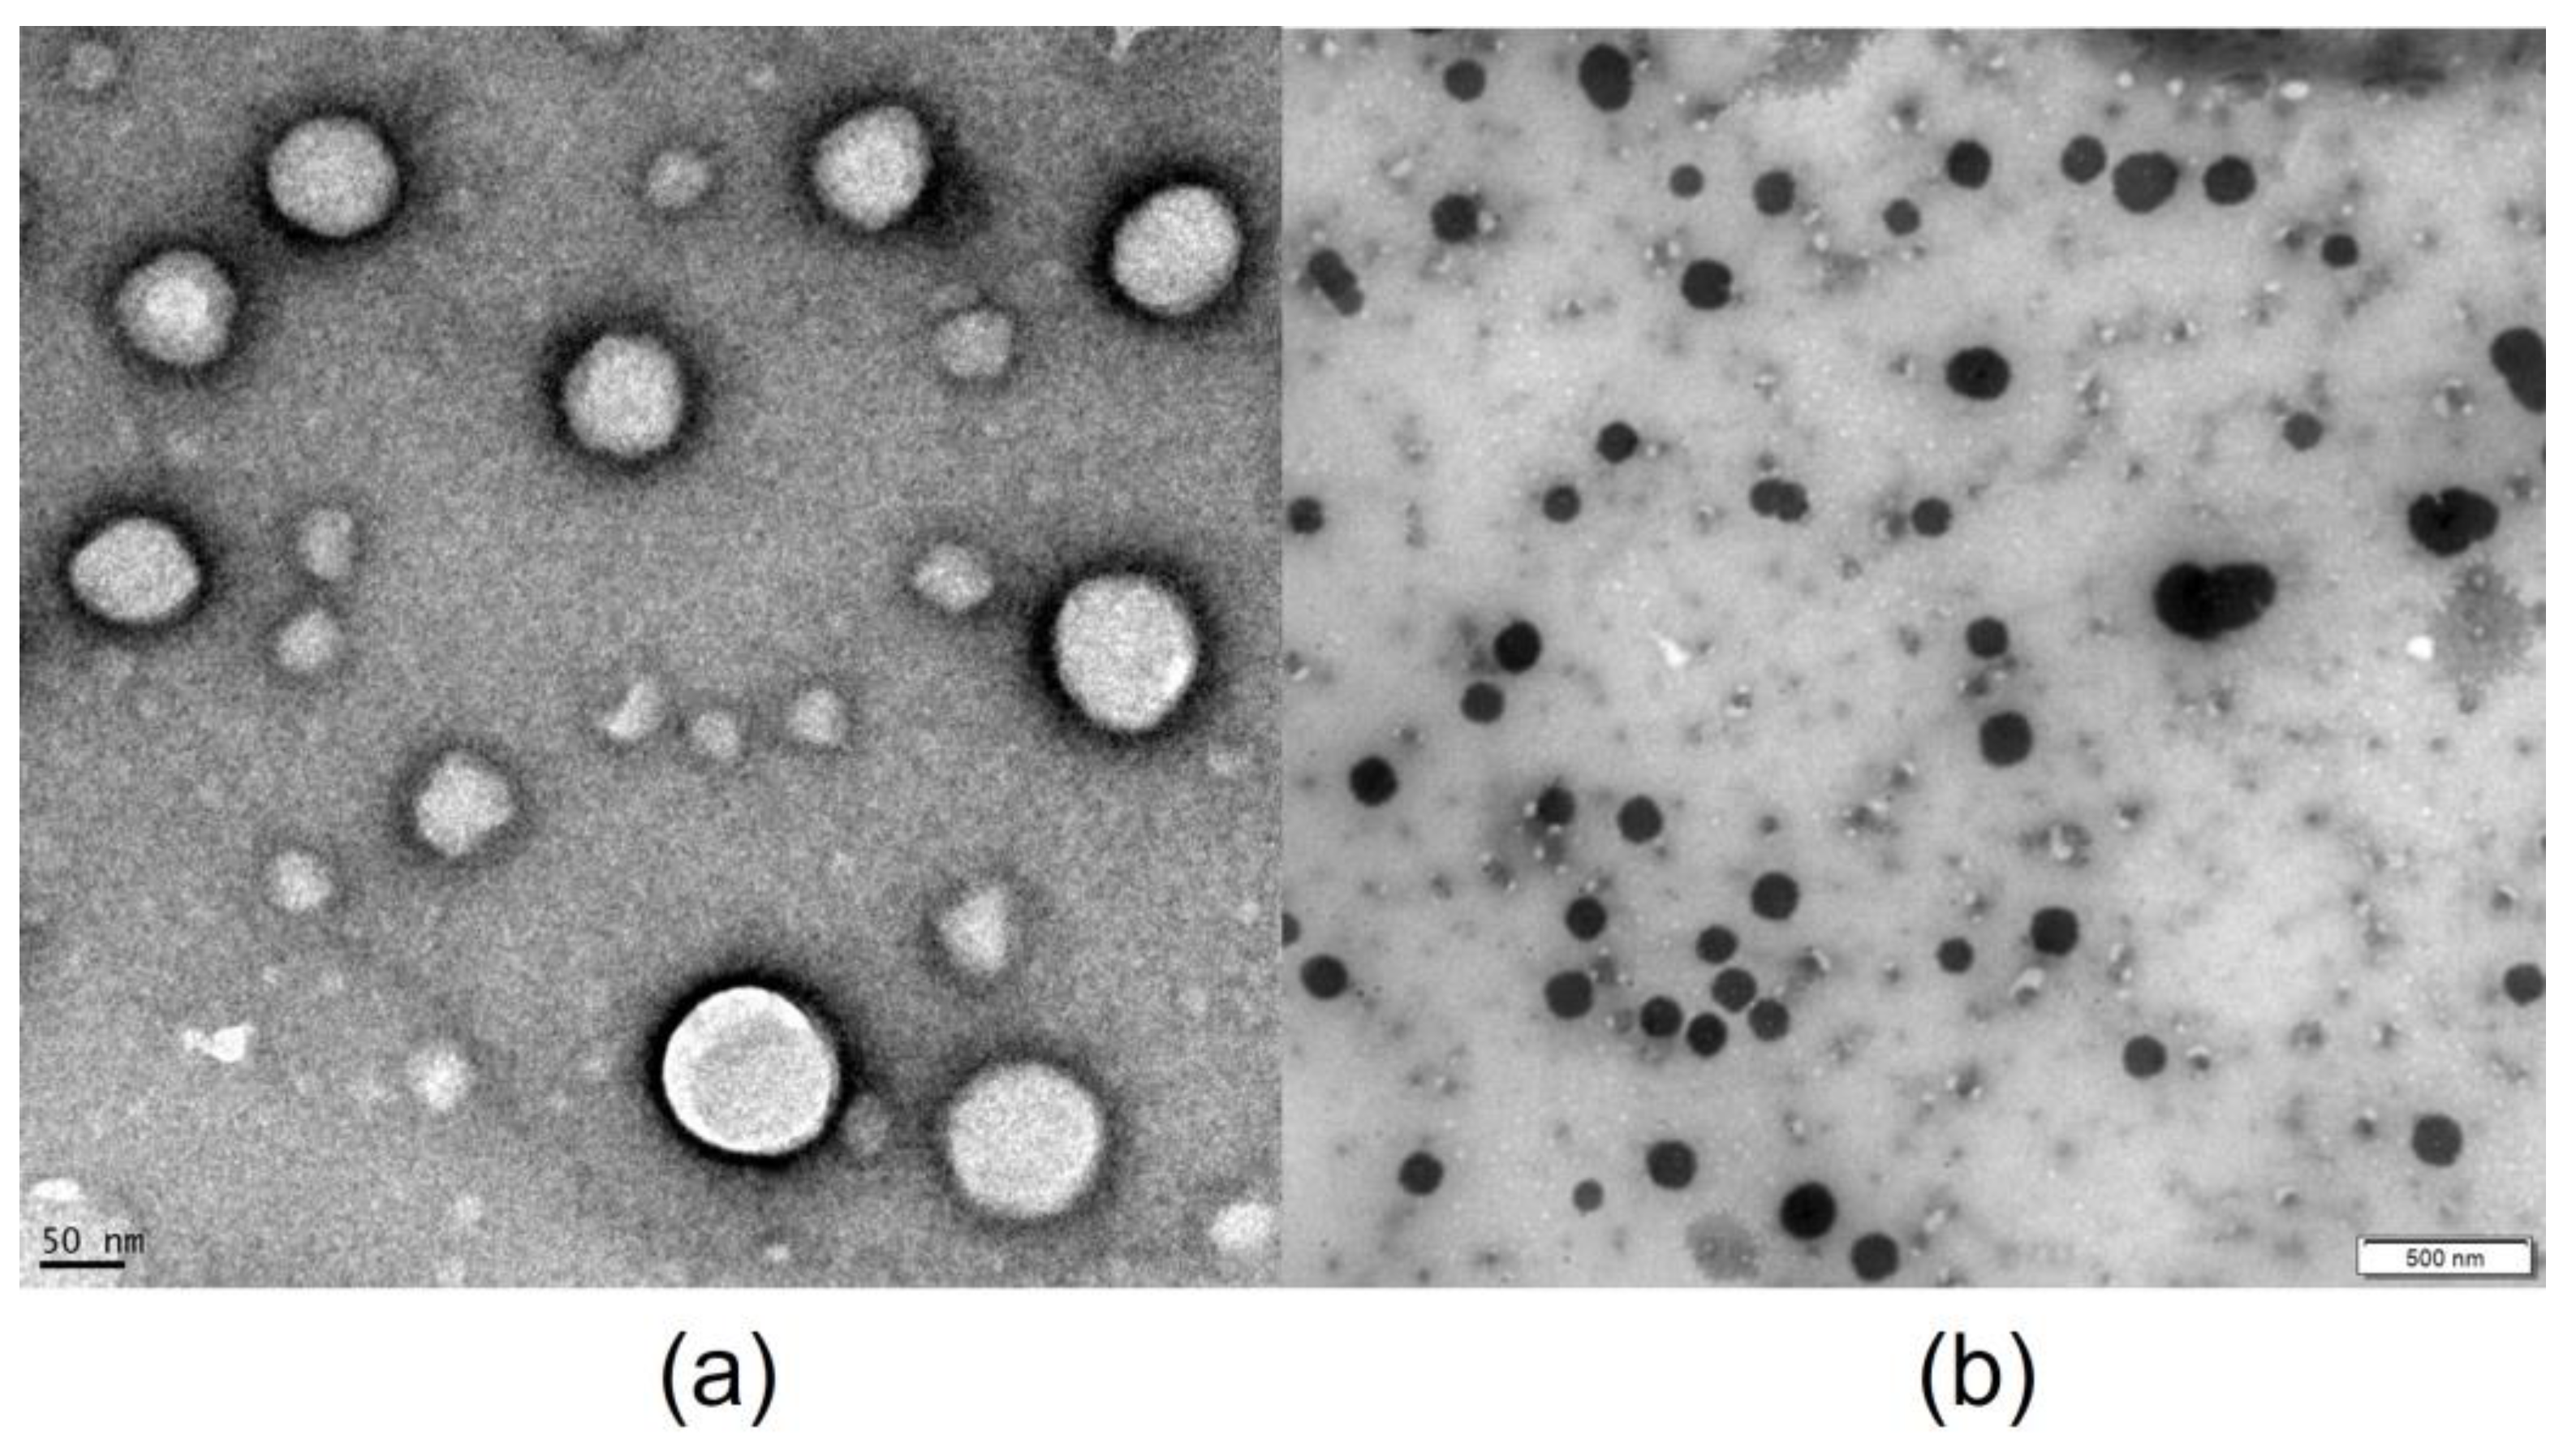
2.3. Morphological Analysis by Transmission Electron Microscopy (TEM)
2.4. Natamycin Solubility with HPβCD and Different Hydrophilic Polymers
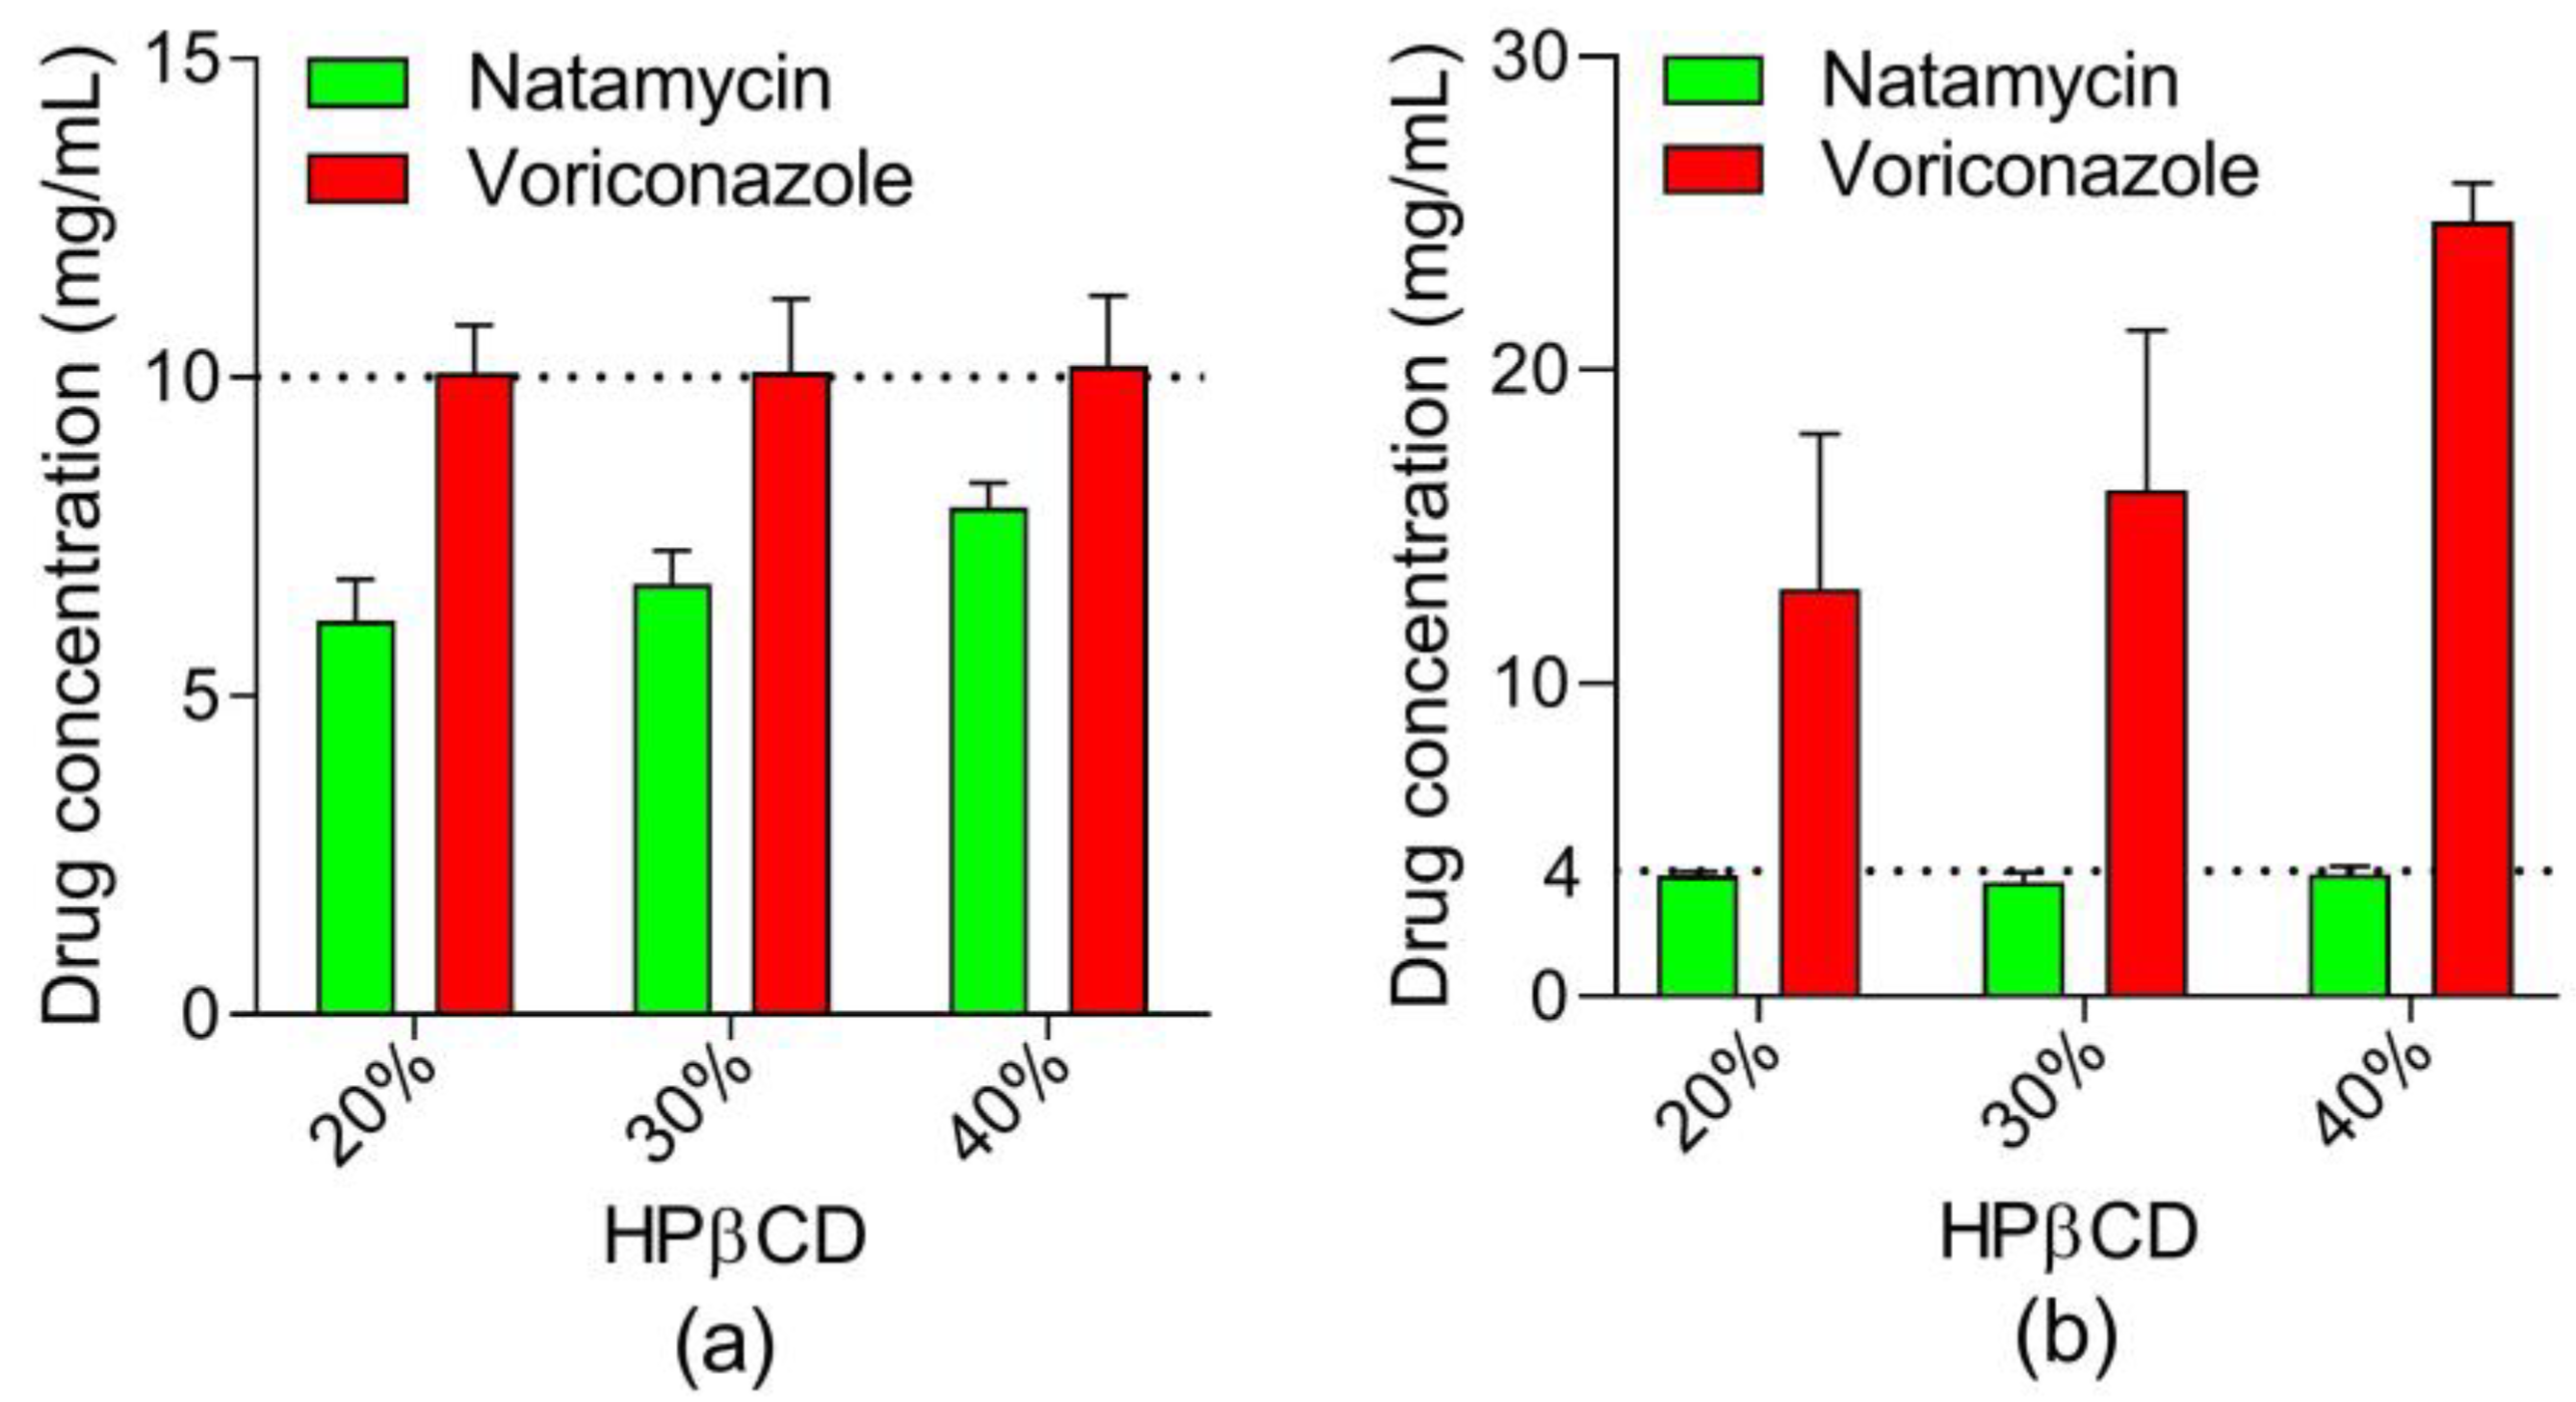
2.5. Natamycin and Voriconazole Solubility with HPβCD
2.6. Nuclear Magnetic Resonance (NMR) Studies
2.7. Preparation of Formulations
2.7.1. Preparation of the Hyaluronic Acid Hydrogel (AHNV)
2.7.2. Preparation of the Polyvinyl Alcohol-Based (Liquifilm®) Hydrogel (LNV)
2.8. Transparency
2.9. Osmolality, pH, and Viscosity Measurements
2.10. Quantitative Analysis: Ultra-High-Performance Liquid Chromatography (UHPLC)
2.11. In Vitro Release Studies
2.12. Ex Vivo Corneal Permeability Studies
2.13. Ocular Irritation Test
2.13.1. Bovine Corneal Opacity and Permeability Assay (BCOP)
Corneal Opacity
Corneal Permeability
Hen’s Egg Test—Chorioallantoic Membrane (HET-CAM)
2.14. Corneal Mucoadhesiveness
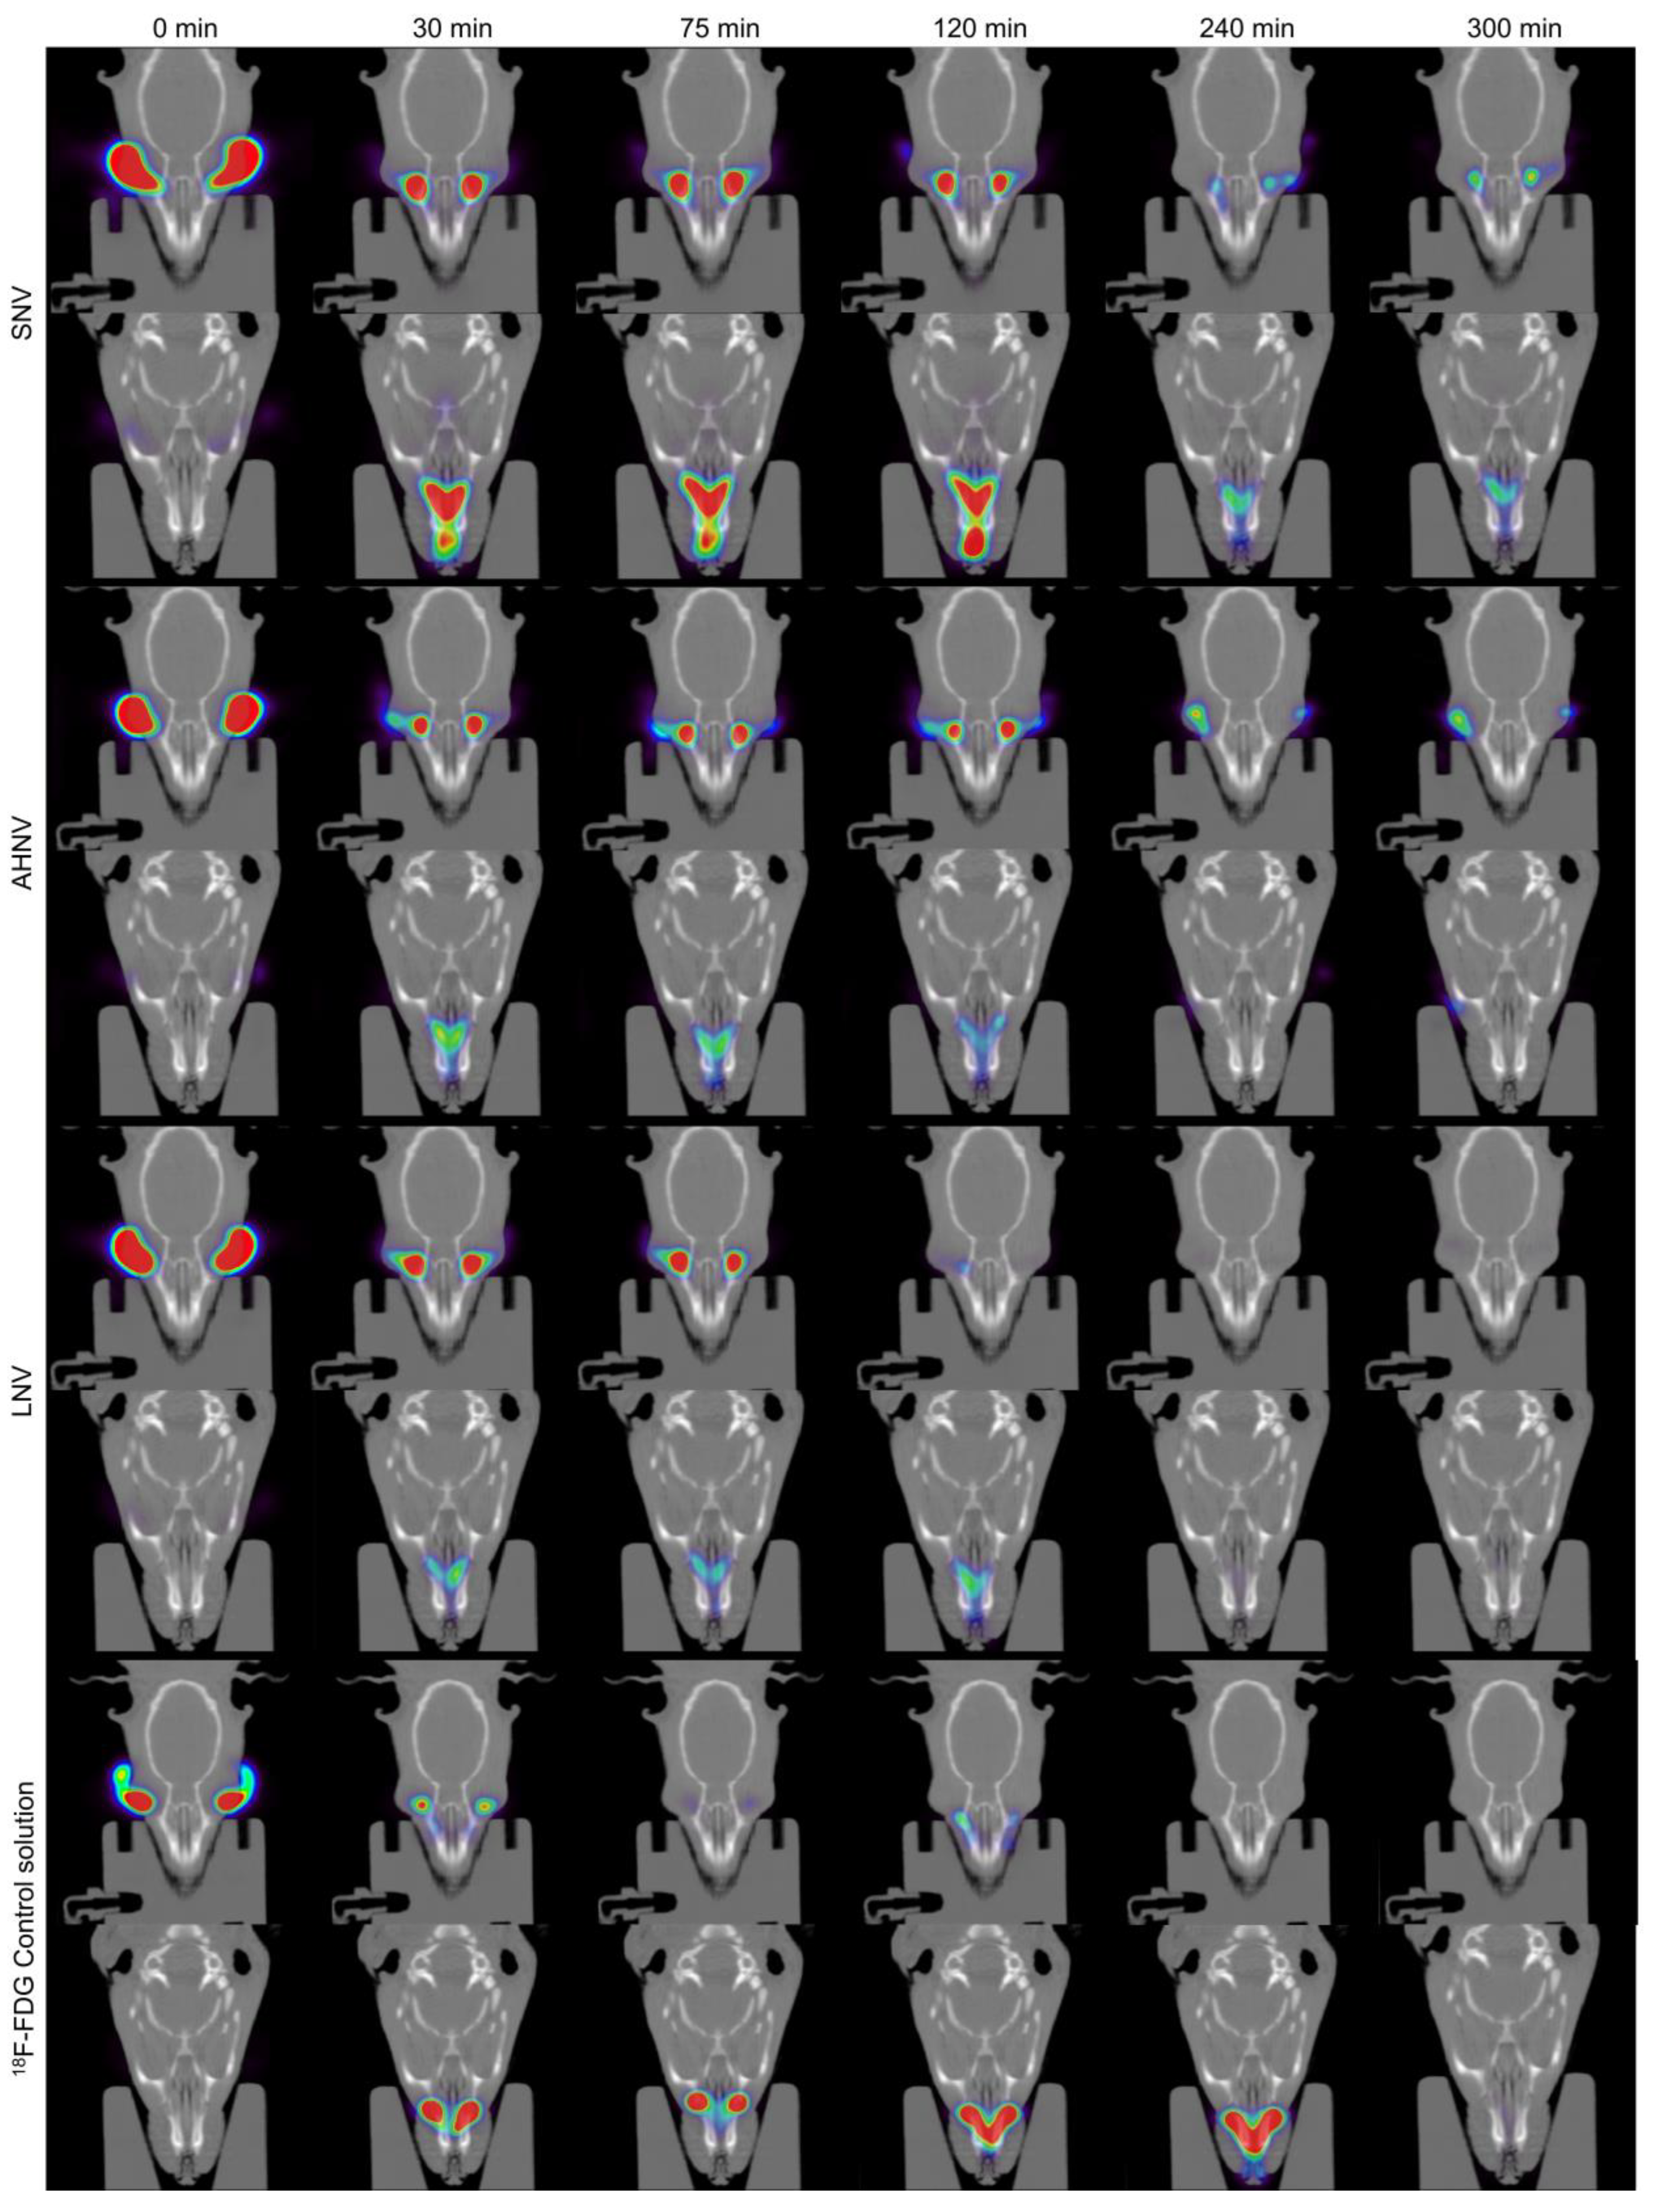
2.15. PET In Vivo Assay: Quantitative Ocular Permanence Study
2.16. Disc Diffusion Method by the Kirby–Bauer Method
3. Results and Discussion
3.1. Phase Solubility Diagrams
3.2. Natamycin Solubility with HPβCD and Different Hydrophilic Polymers
3.3. Natamycin and Voriconazole Solubility with HPβCD and Voriconazole
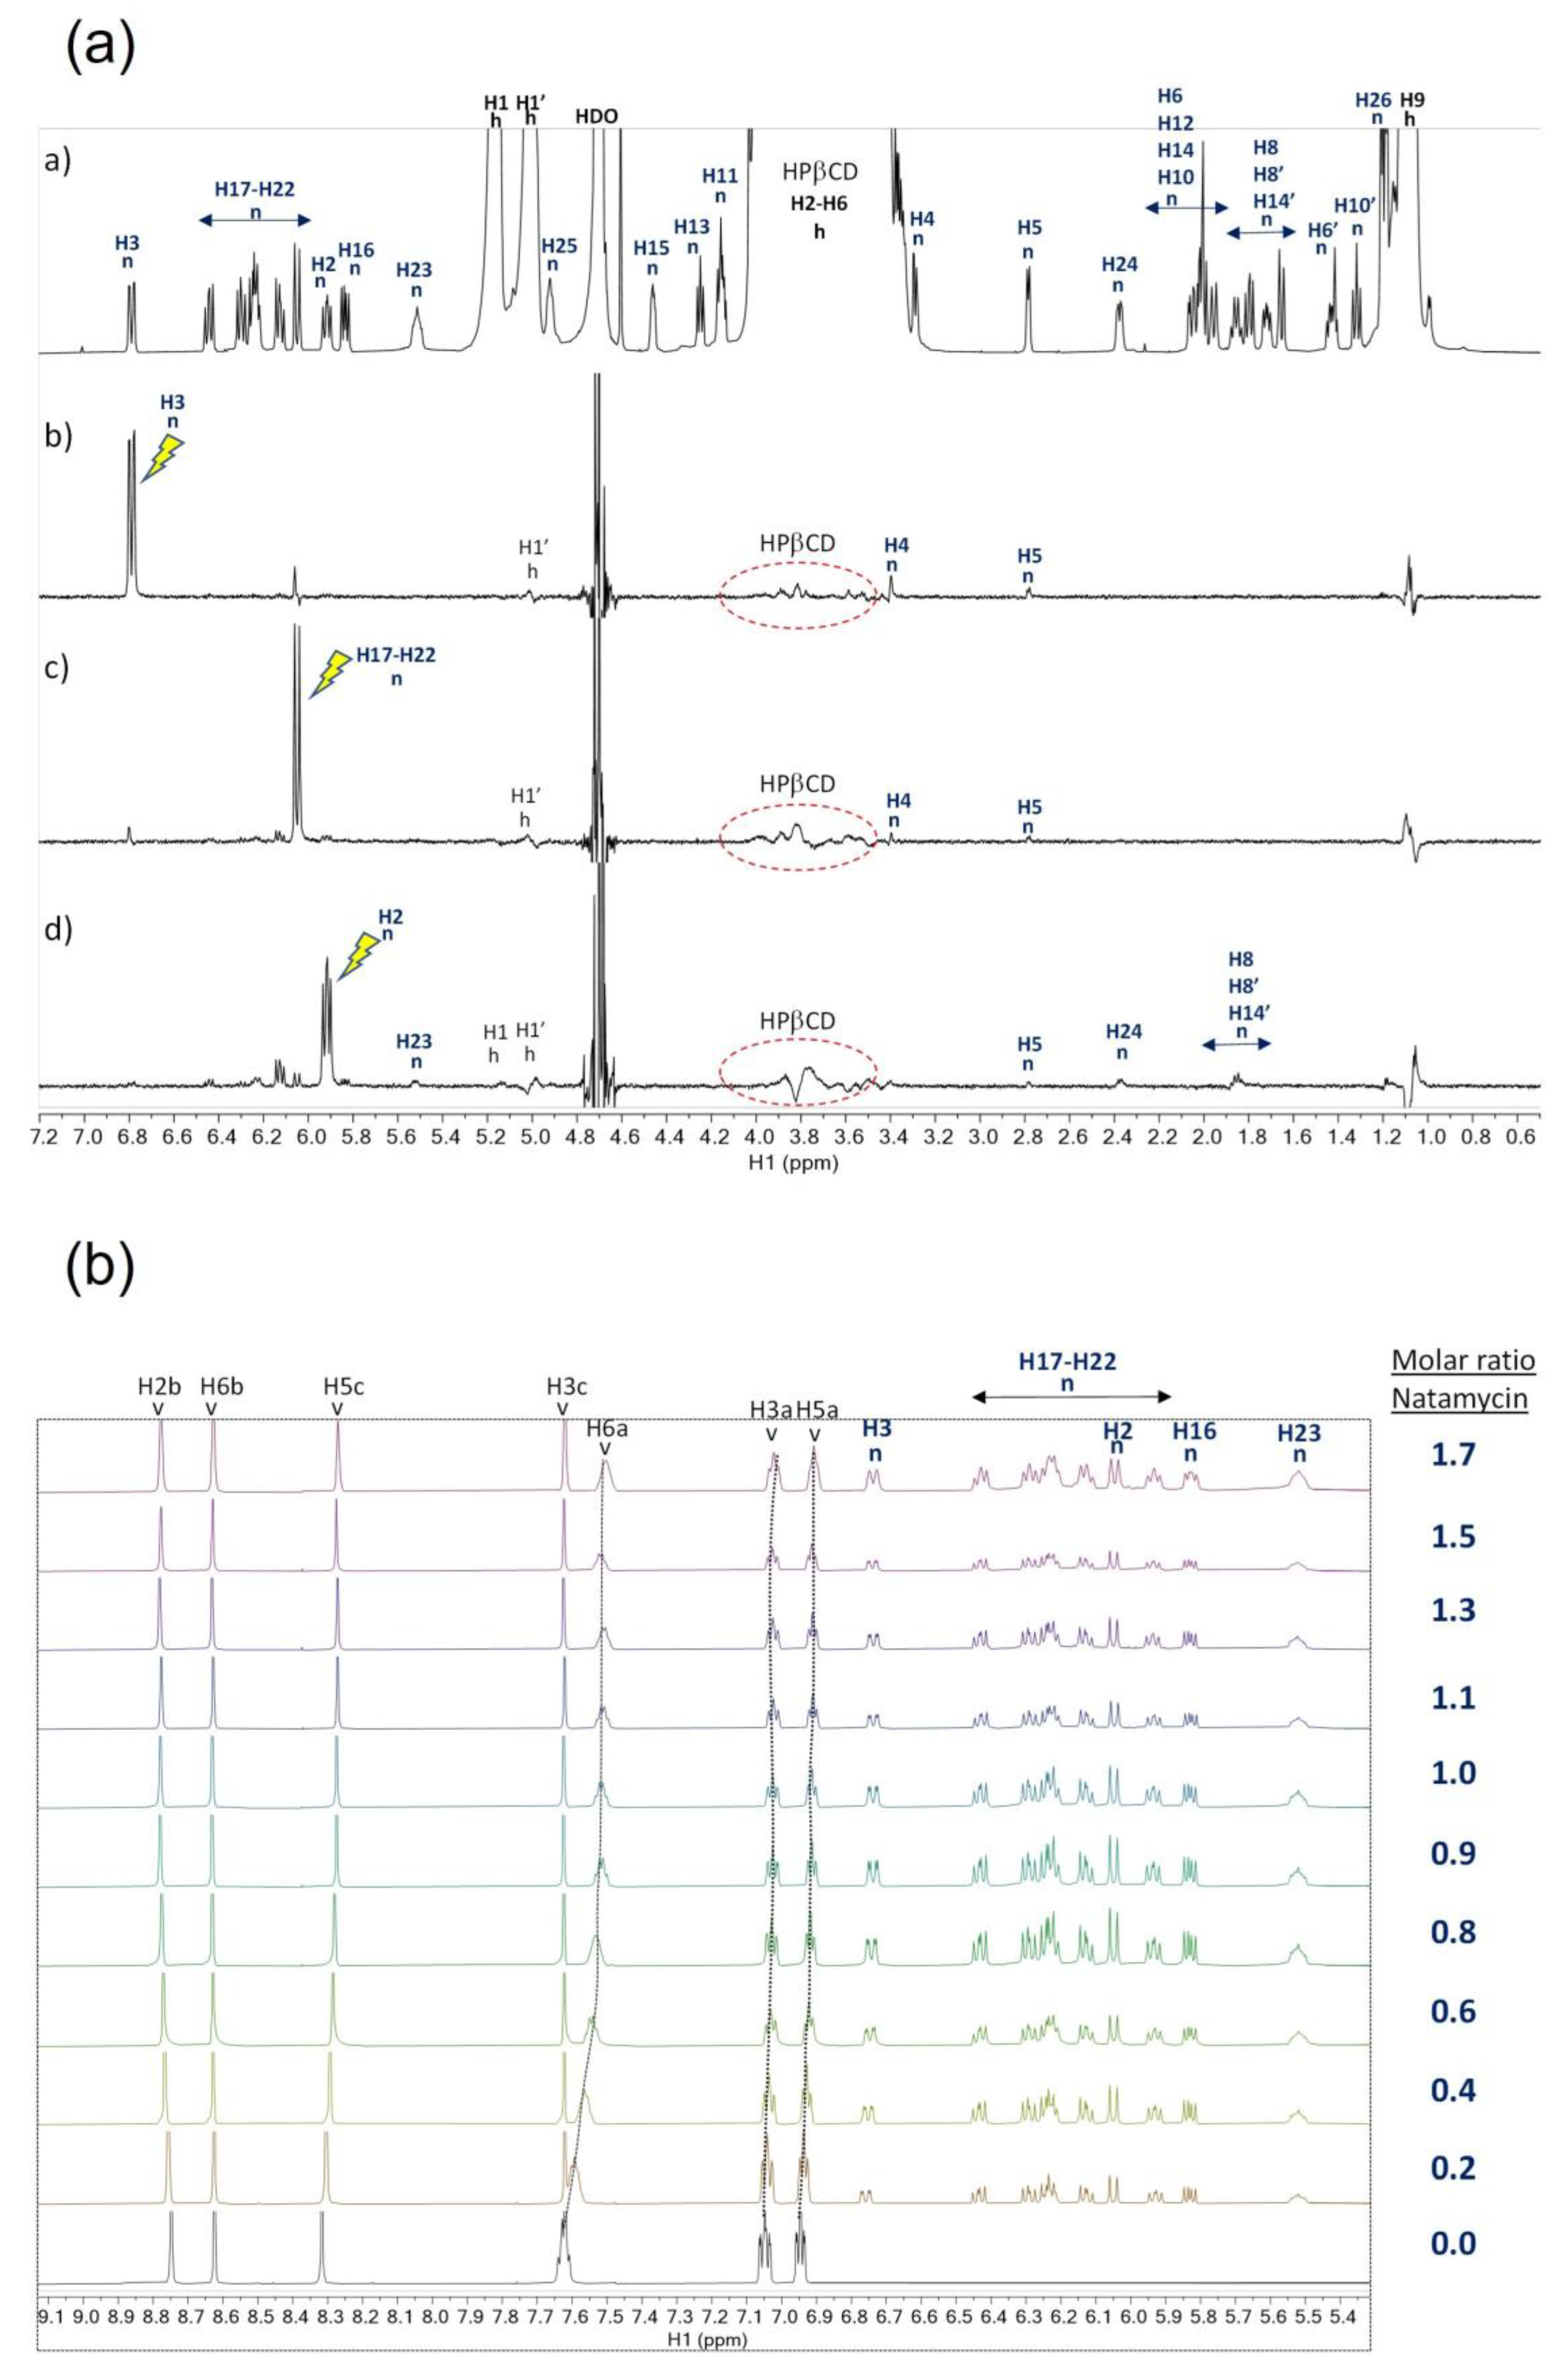
3.4. Nuclear Magnetic Resonance (NMR) Studies
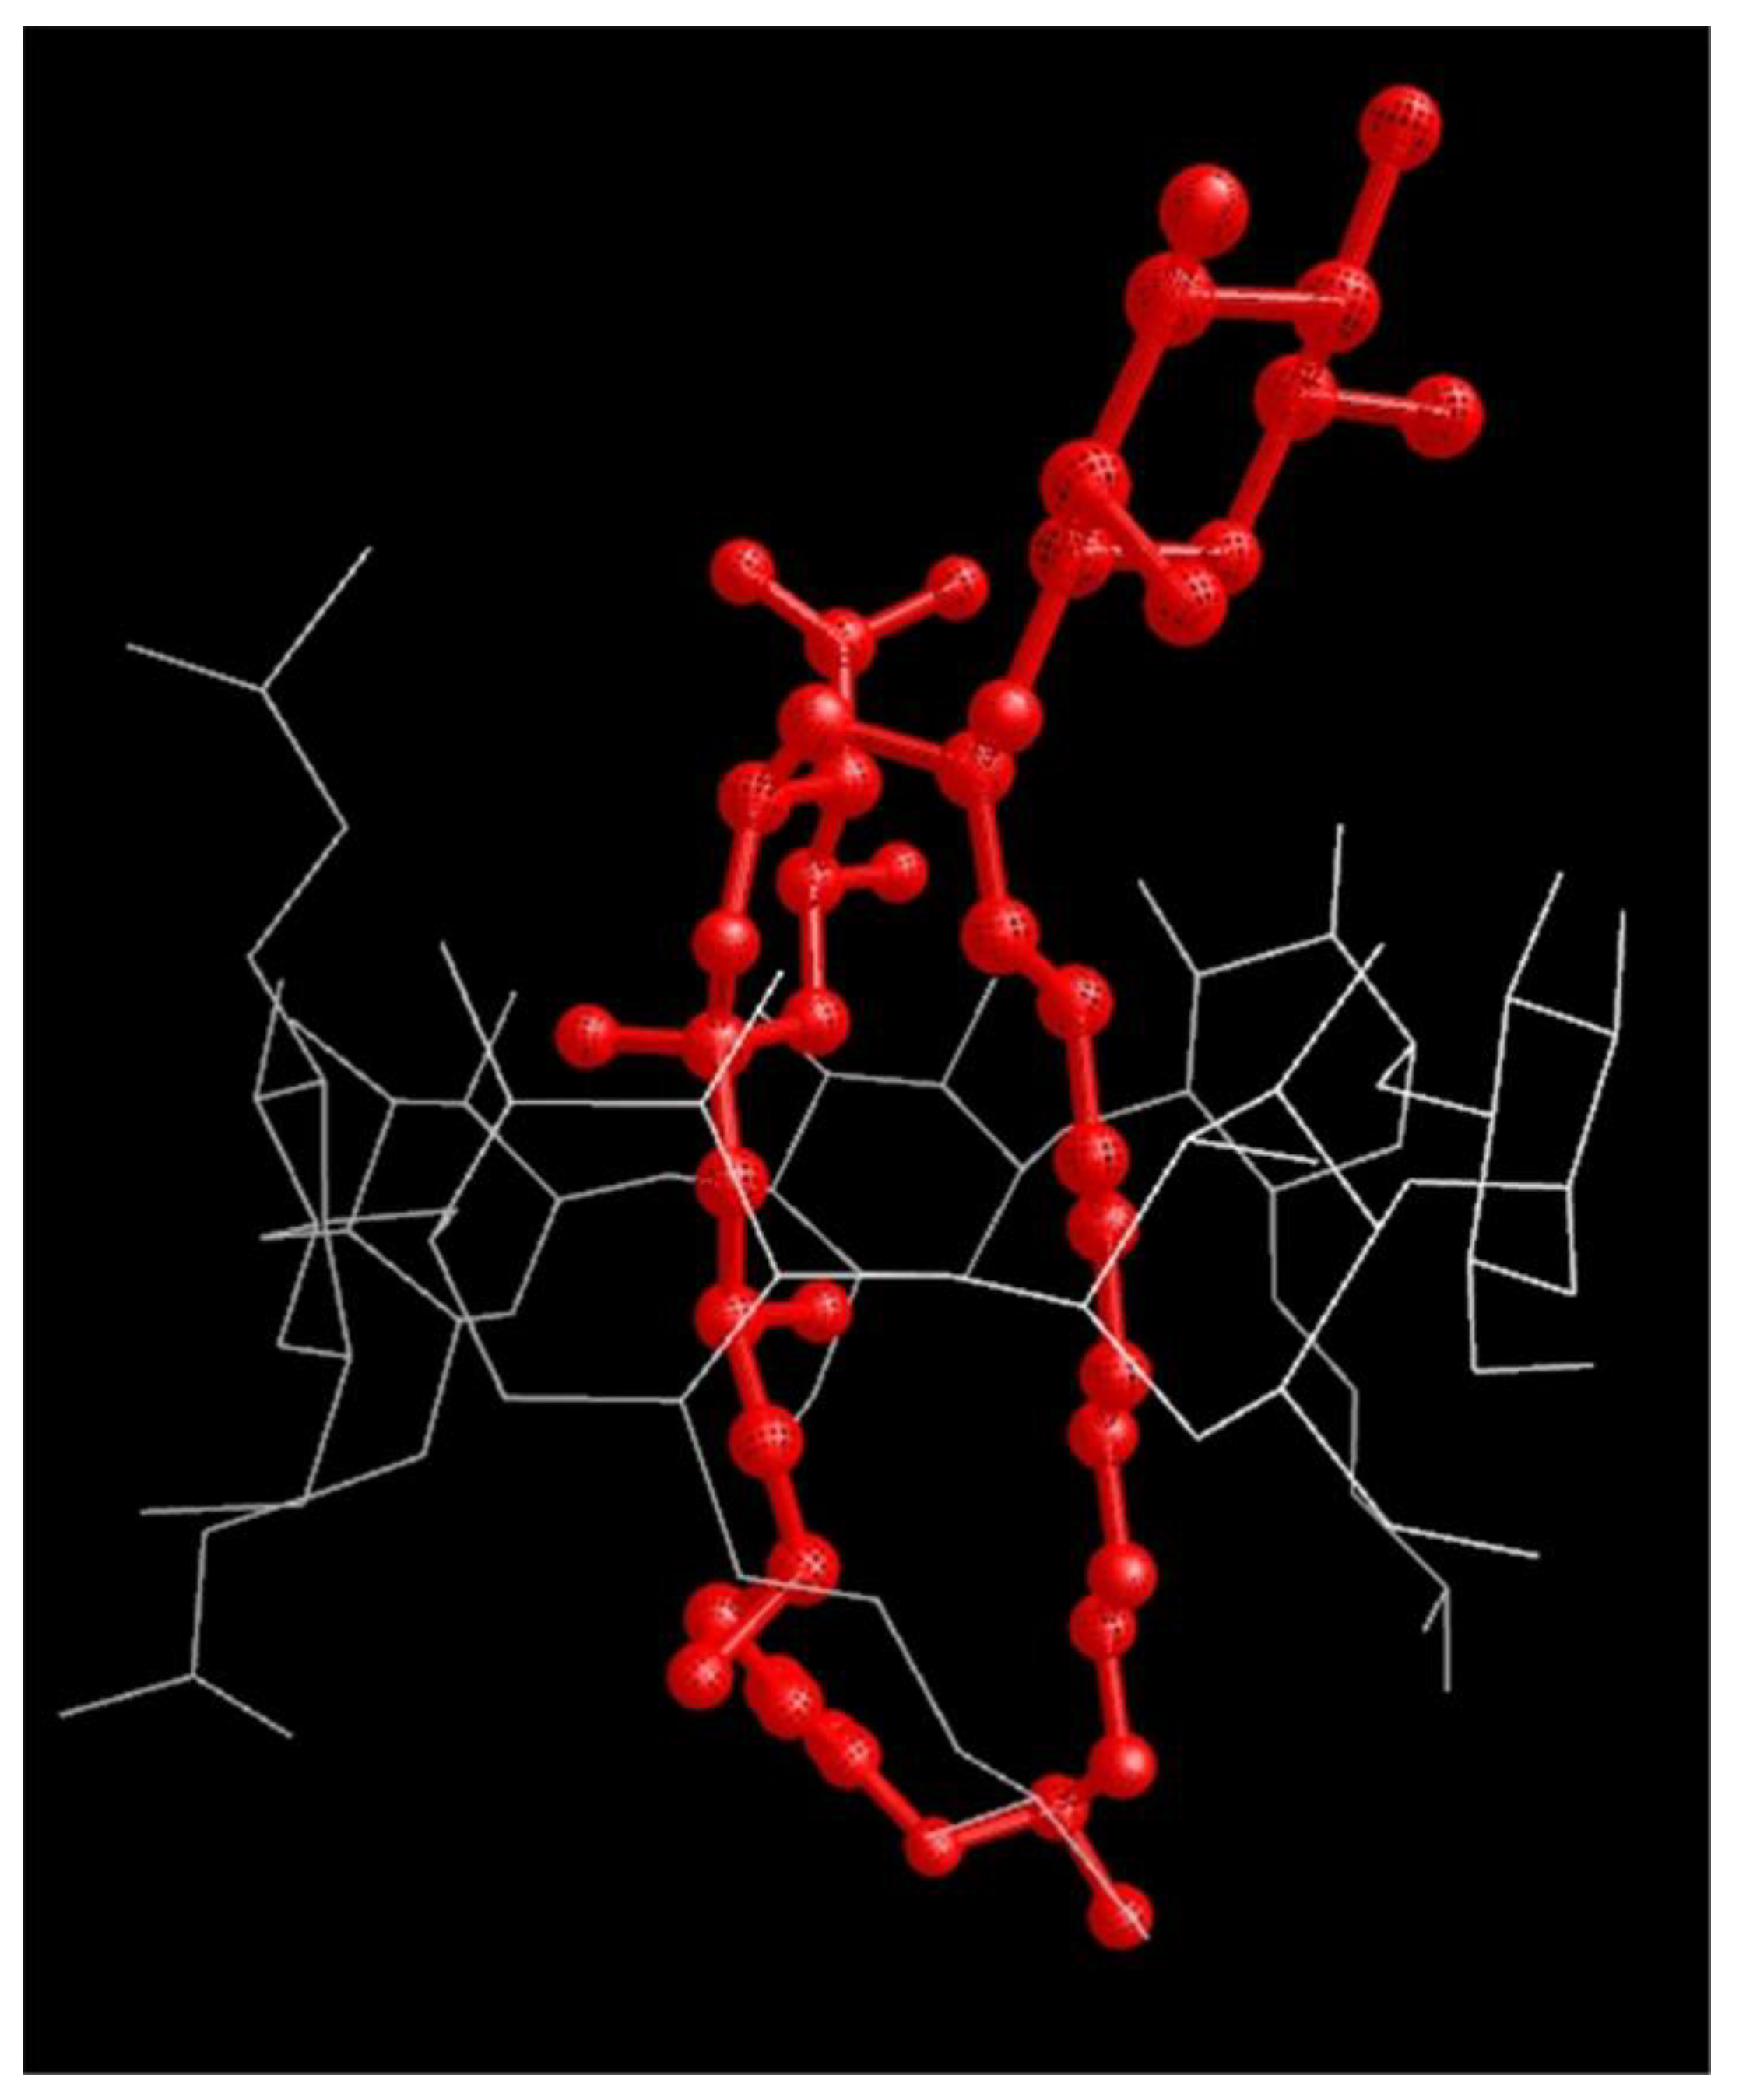
3.4.1. Detection of Binding Interaction between Natamycin and HPβCD
3.4.2. NMR Titration Competition Study of Natamycin and Voriconazole for Binding to HPβCD
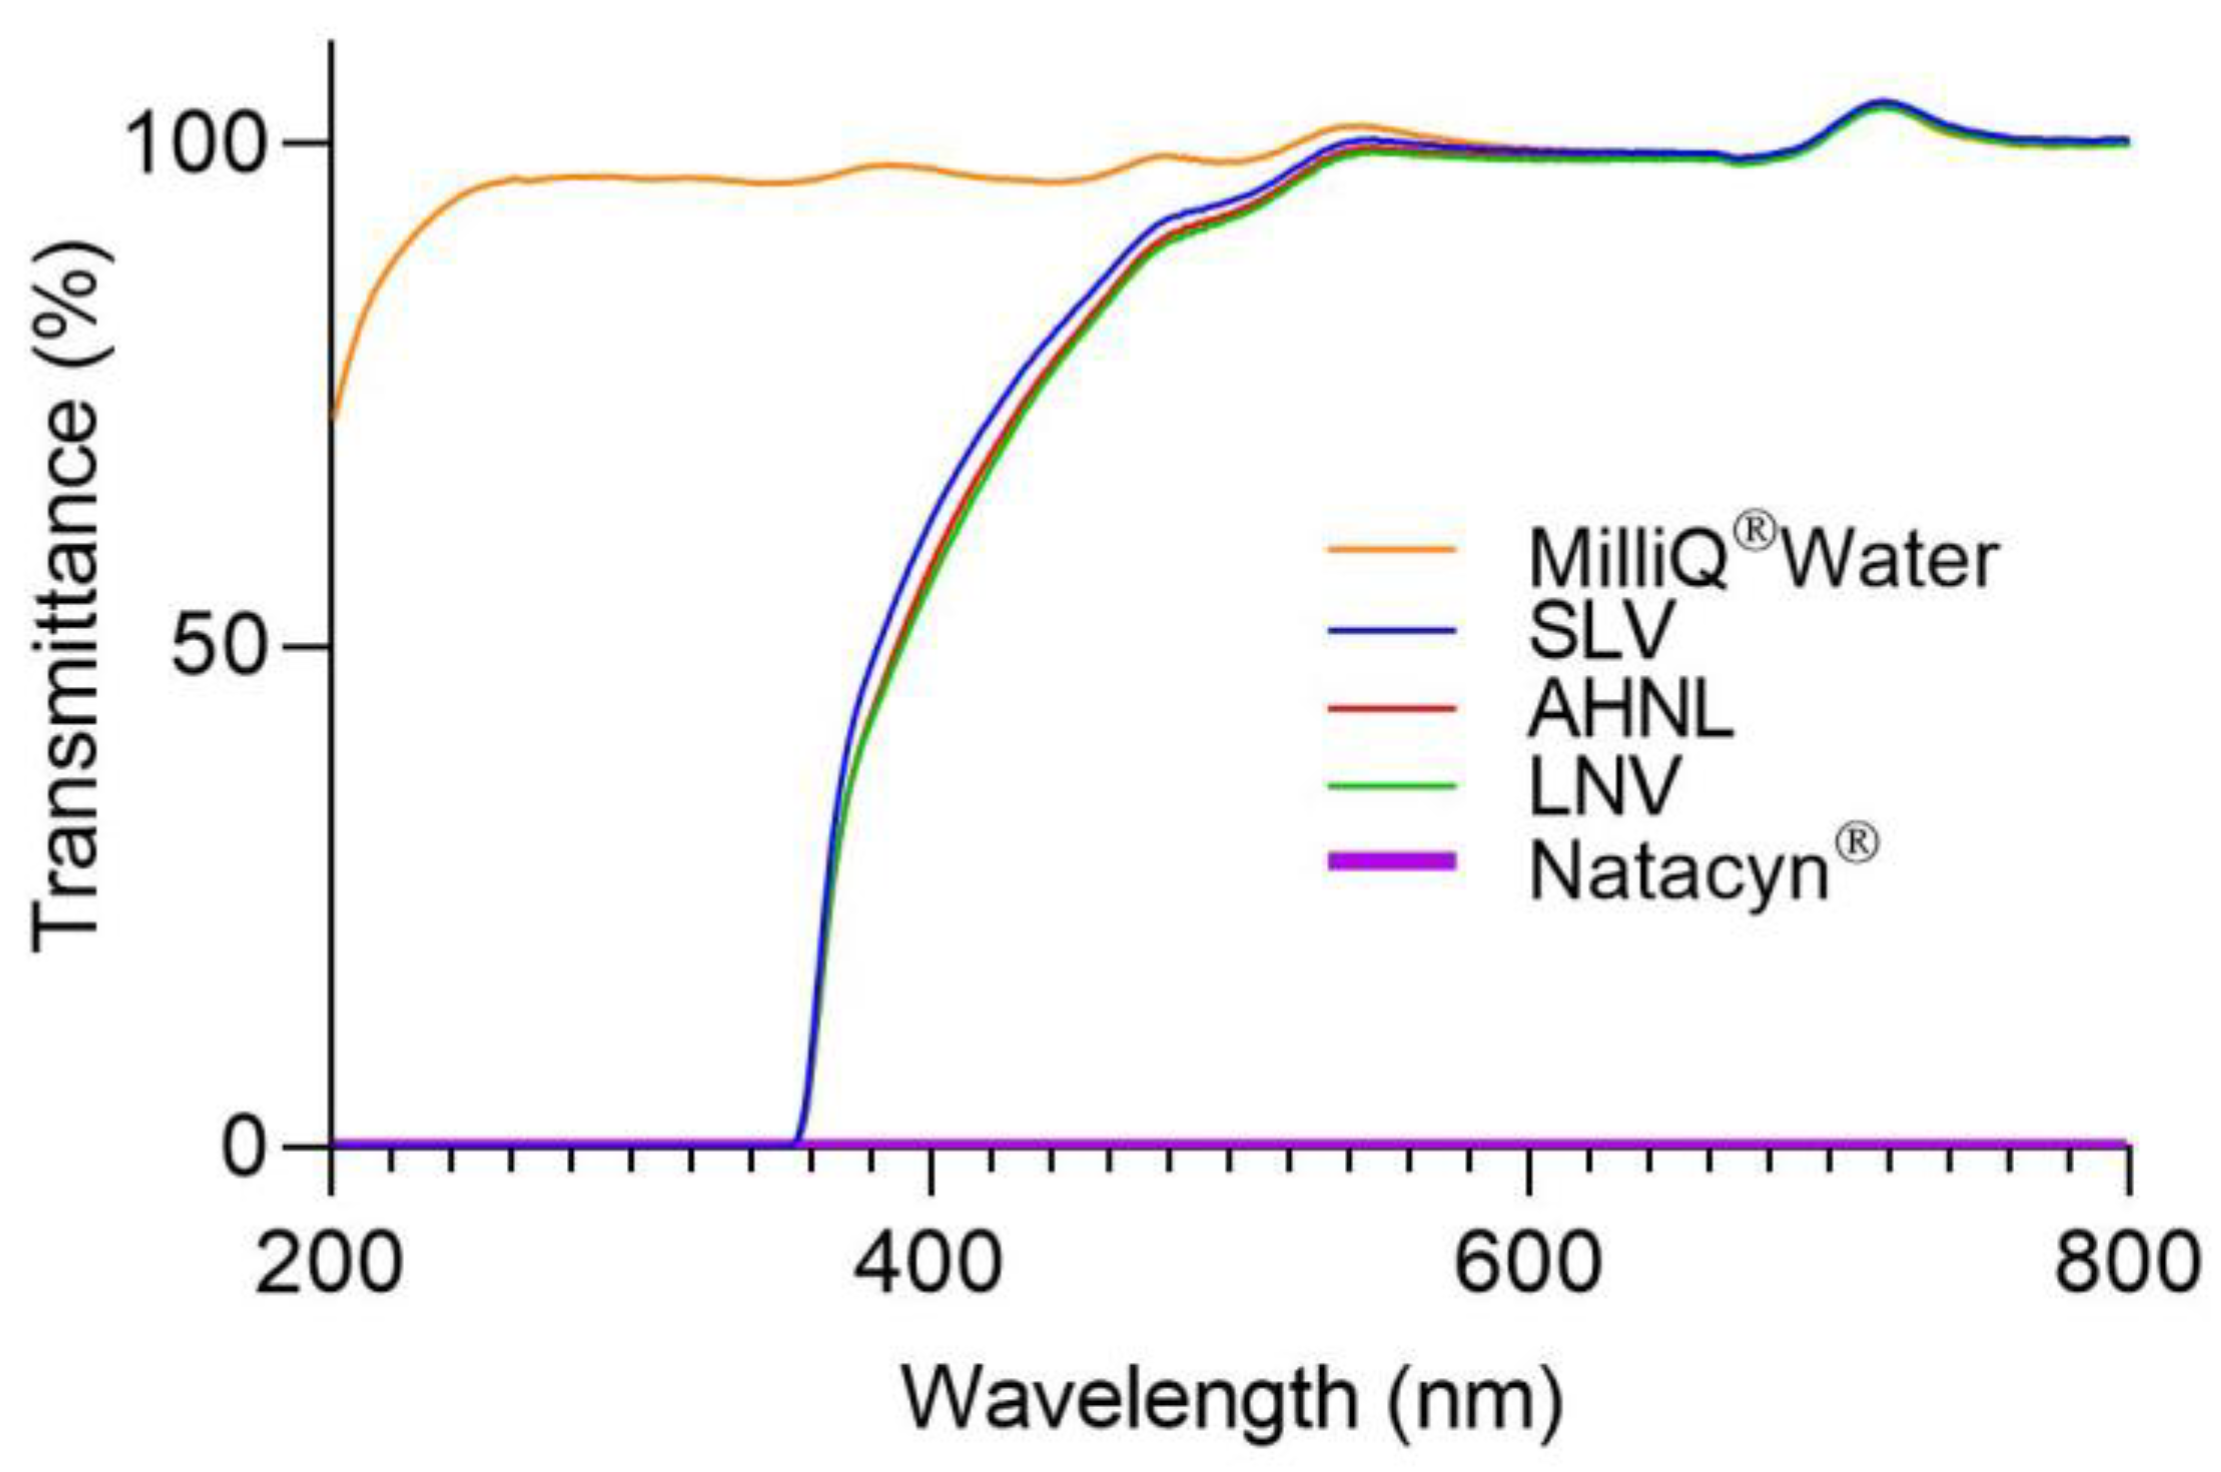
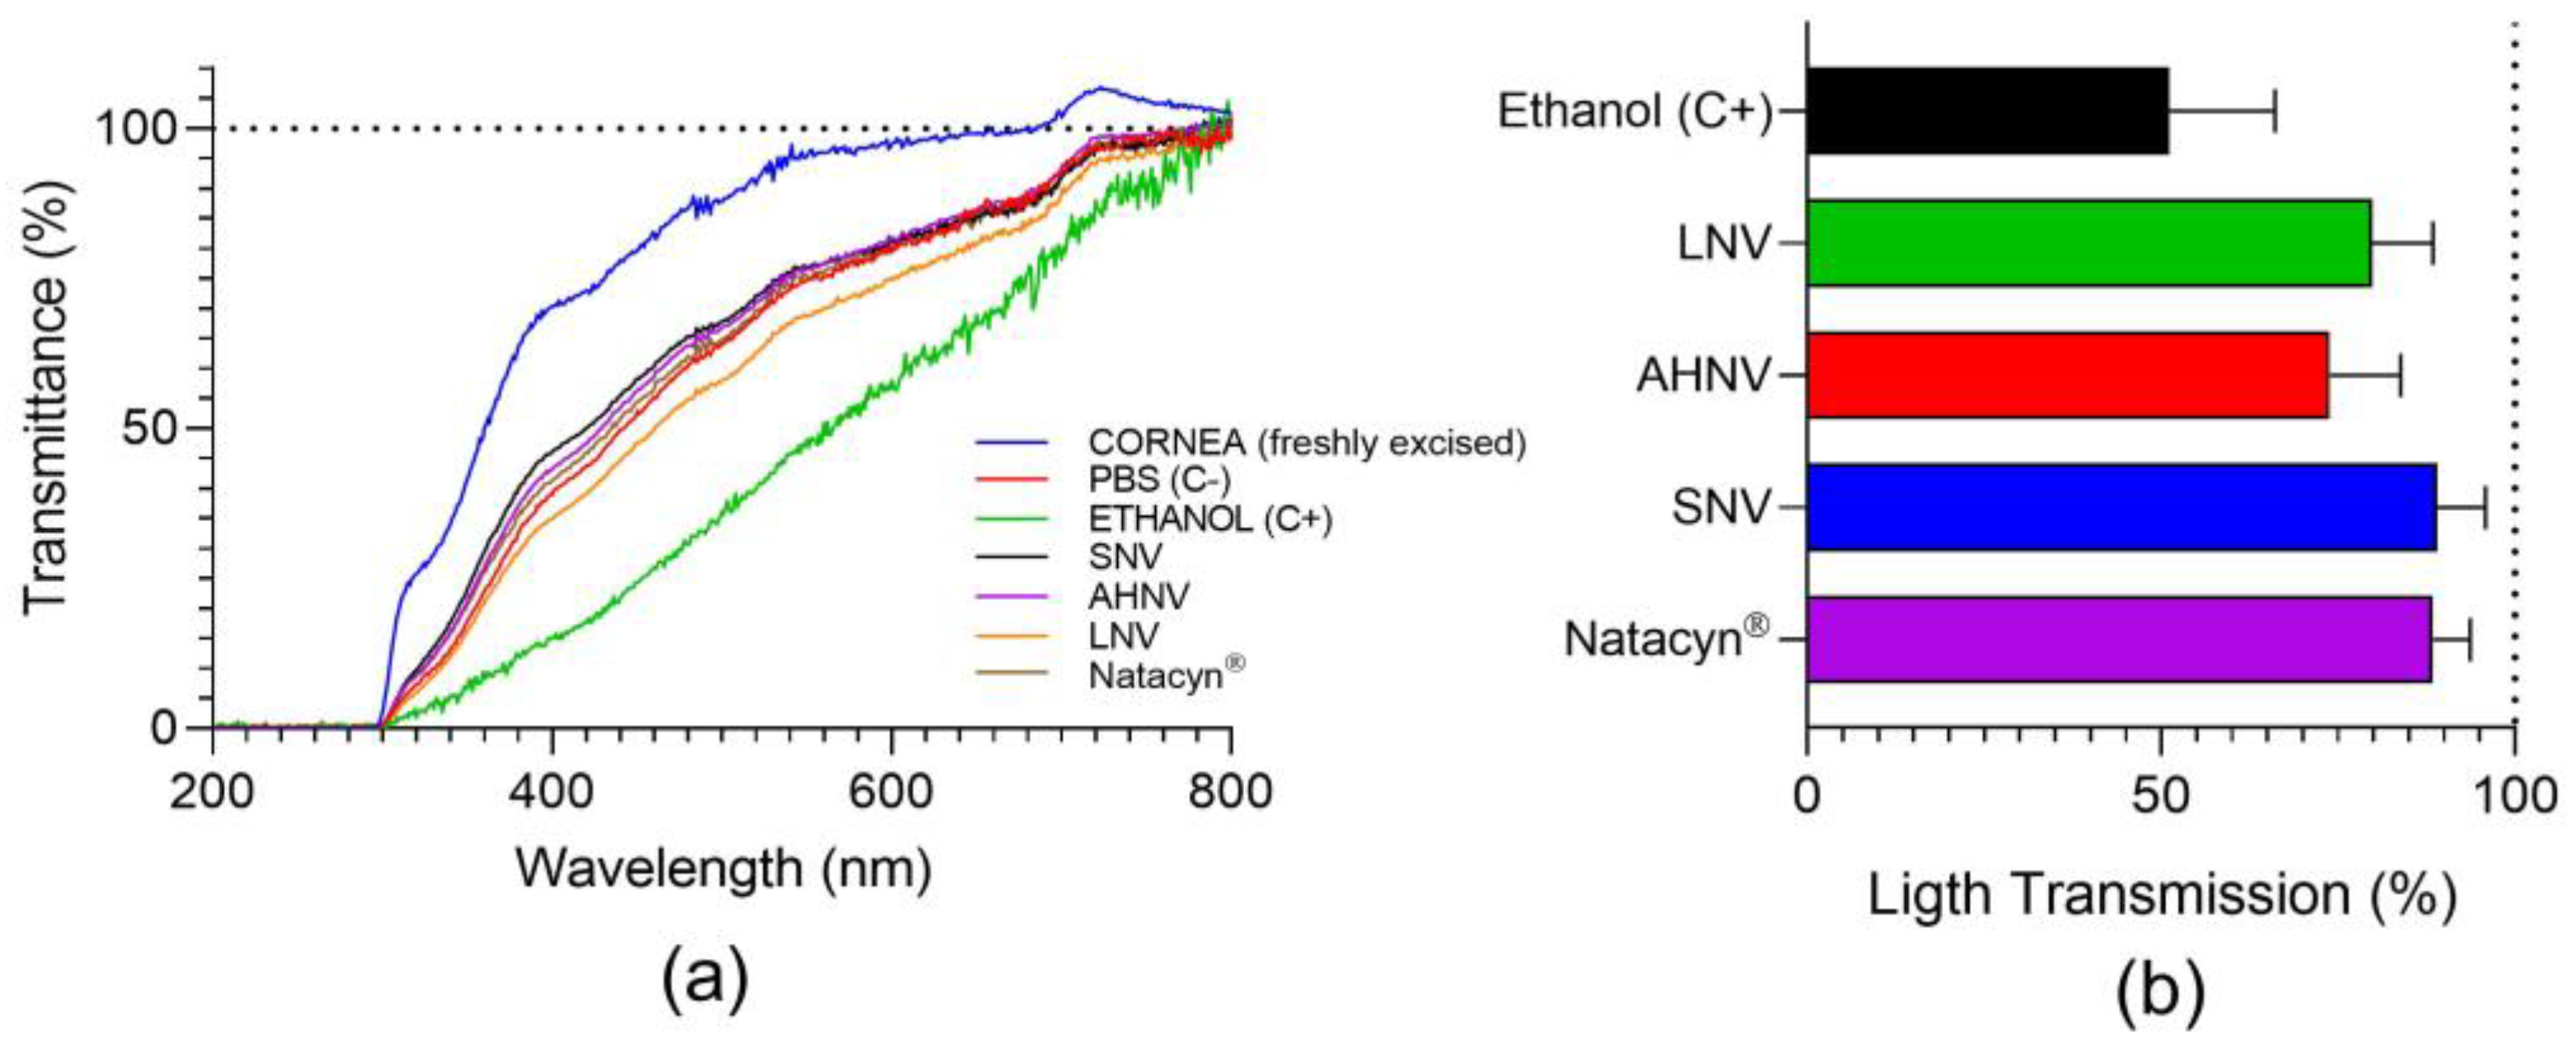
3.5. Transparency
3.6. Osmolality and pH Measurements
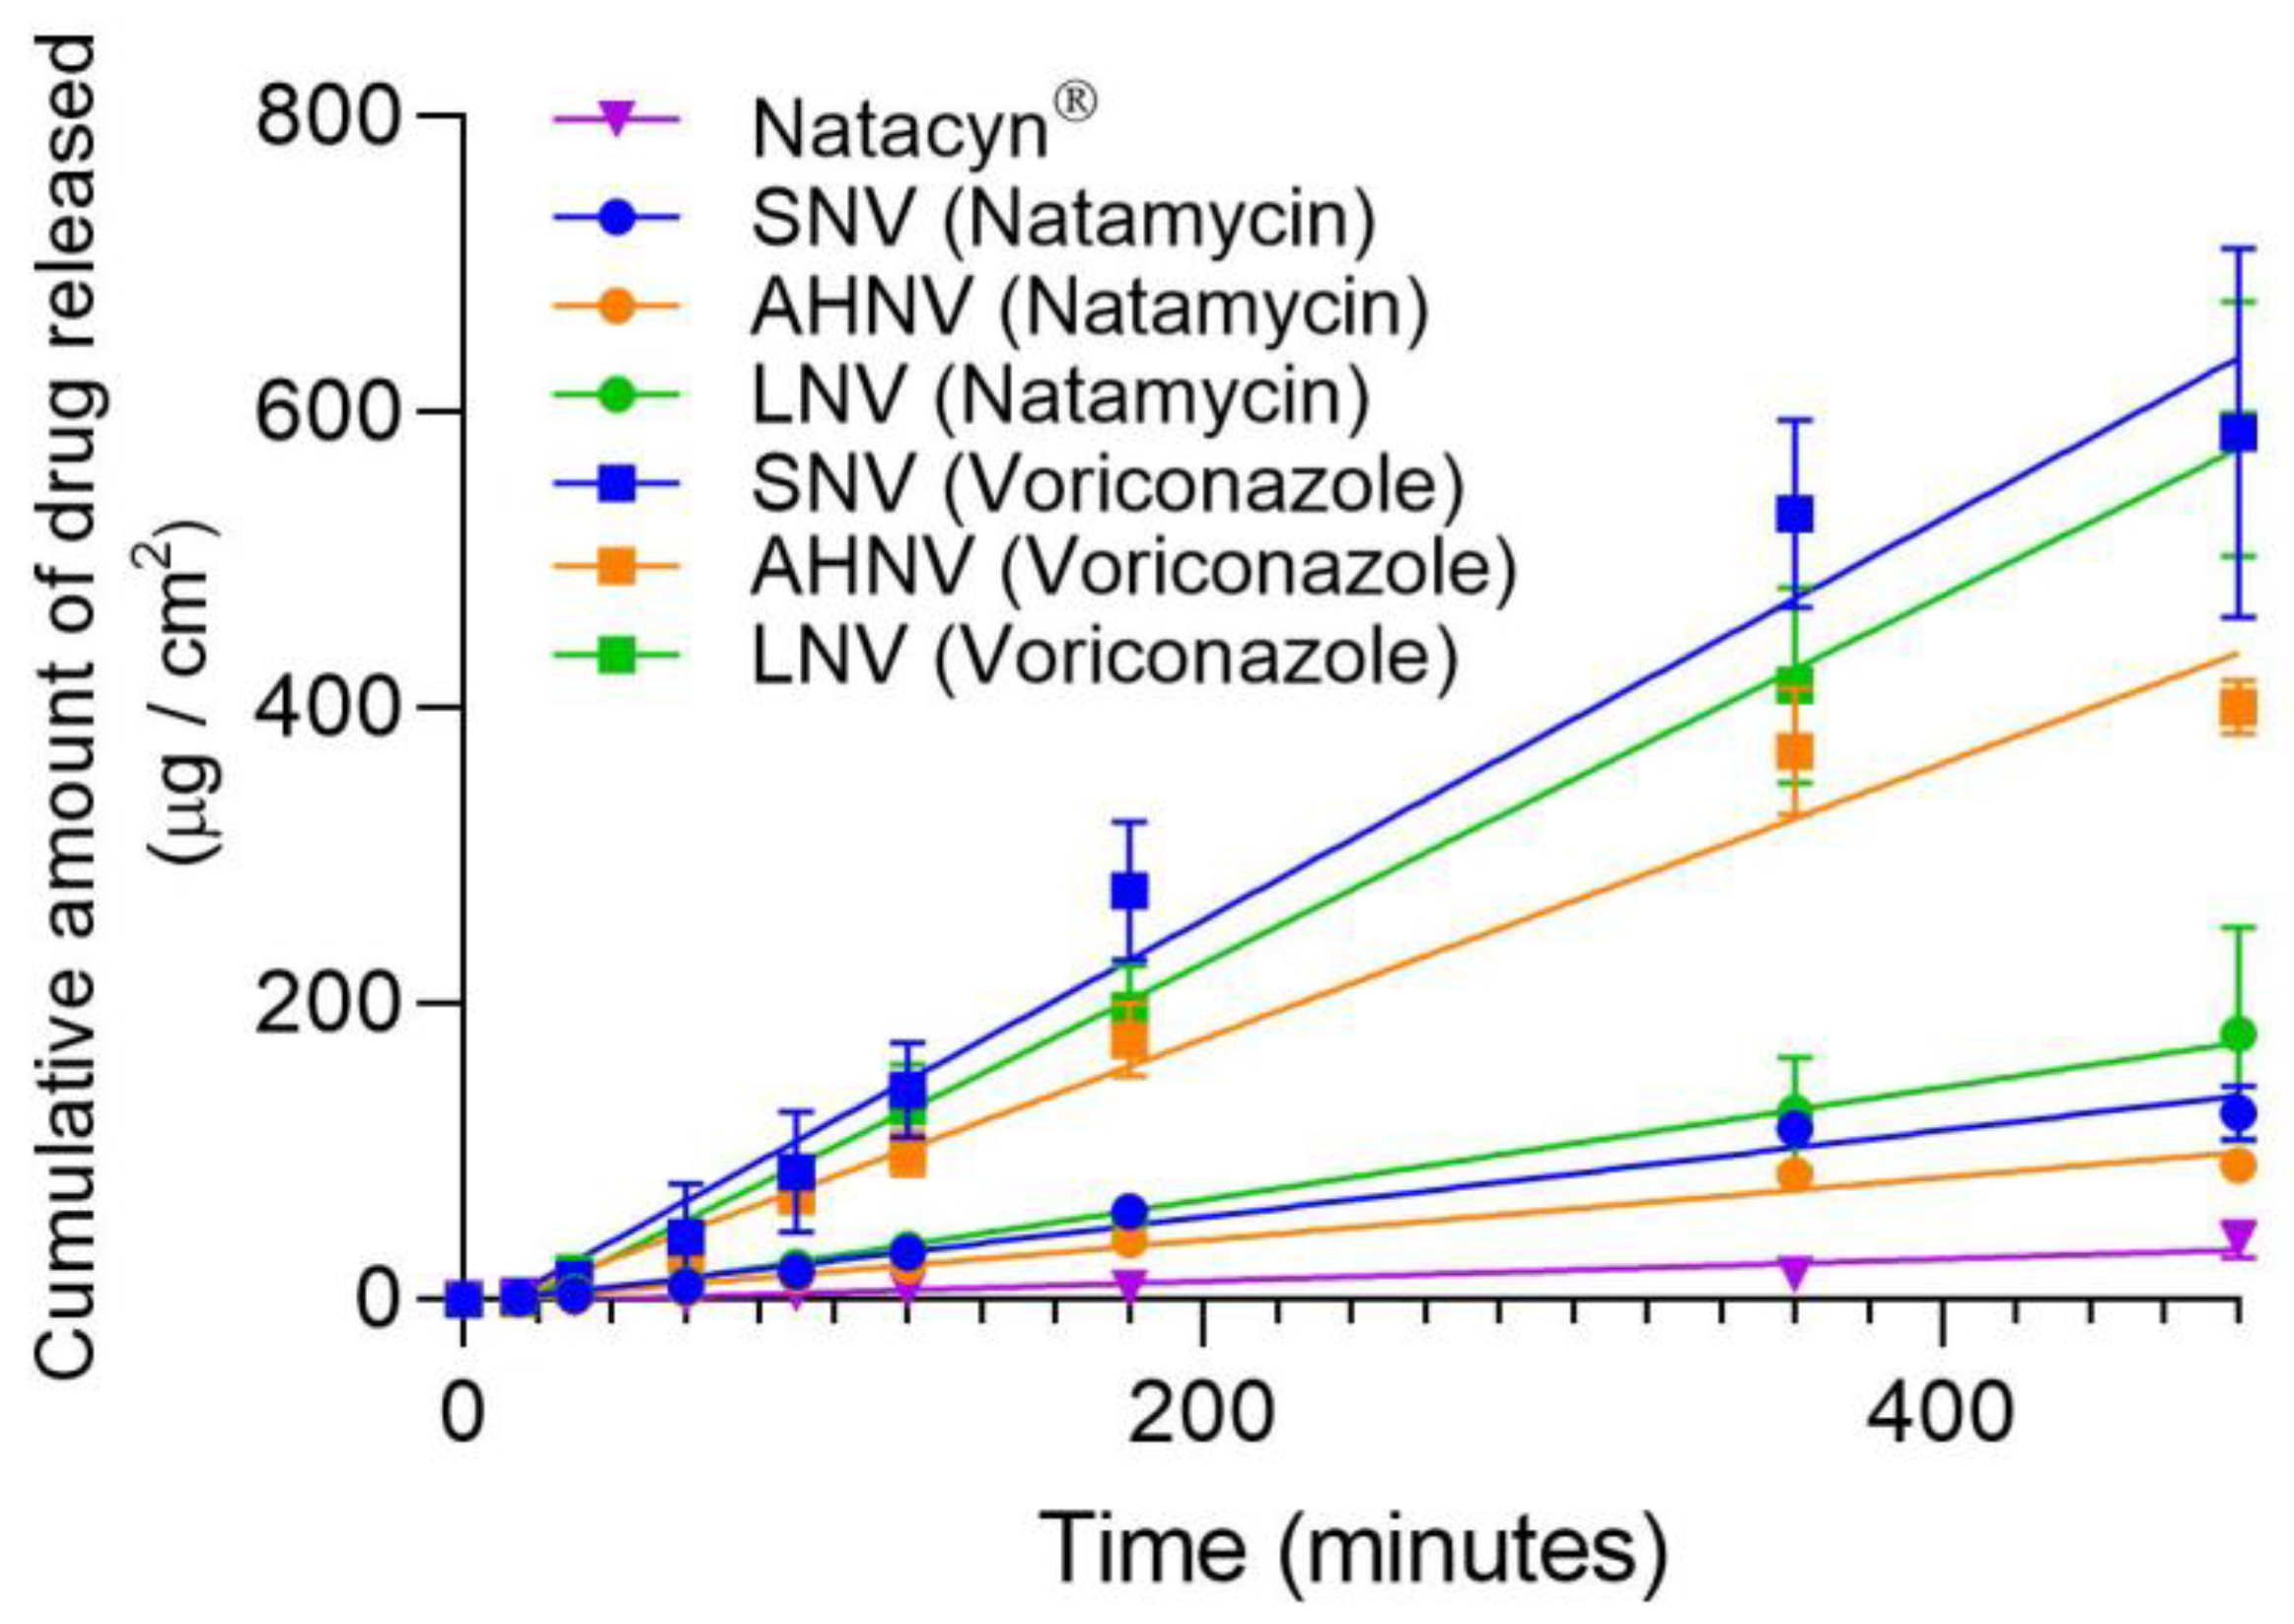
3.7. In Vitro Release Studies
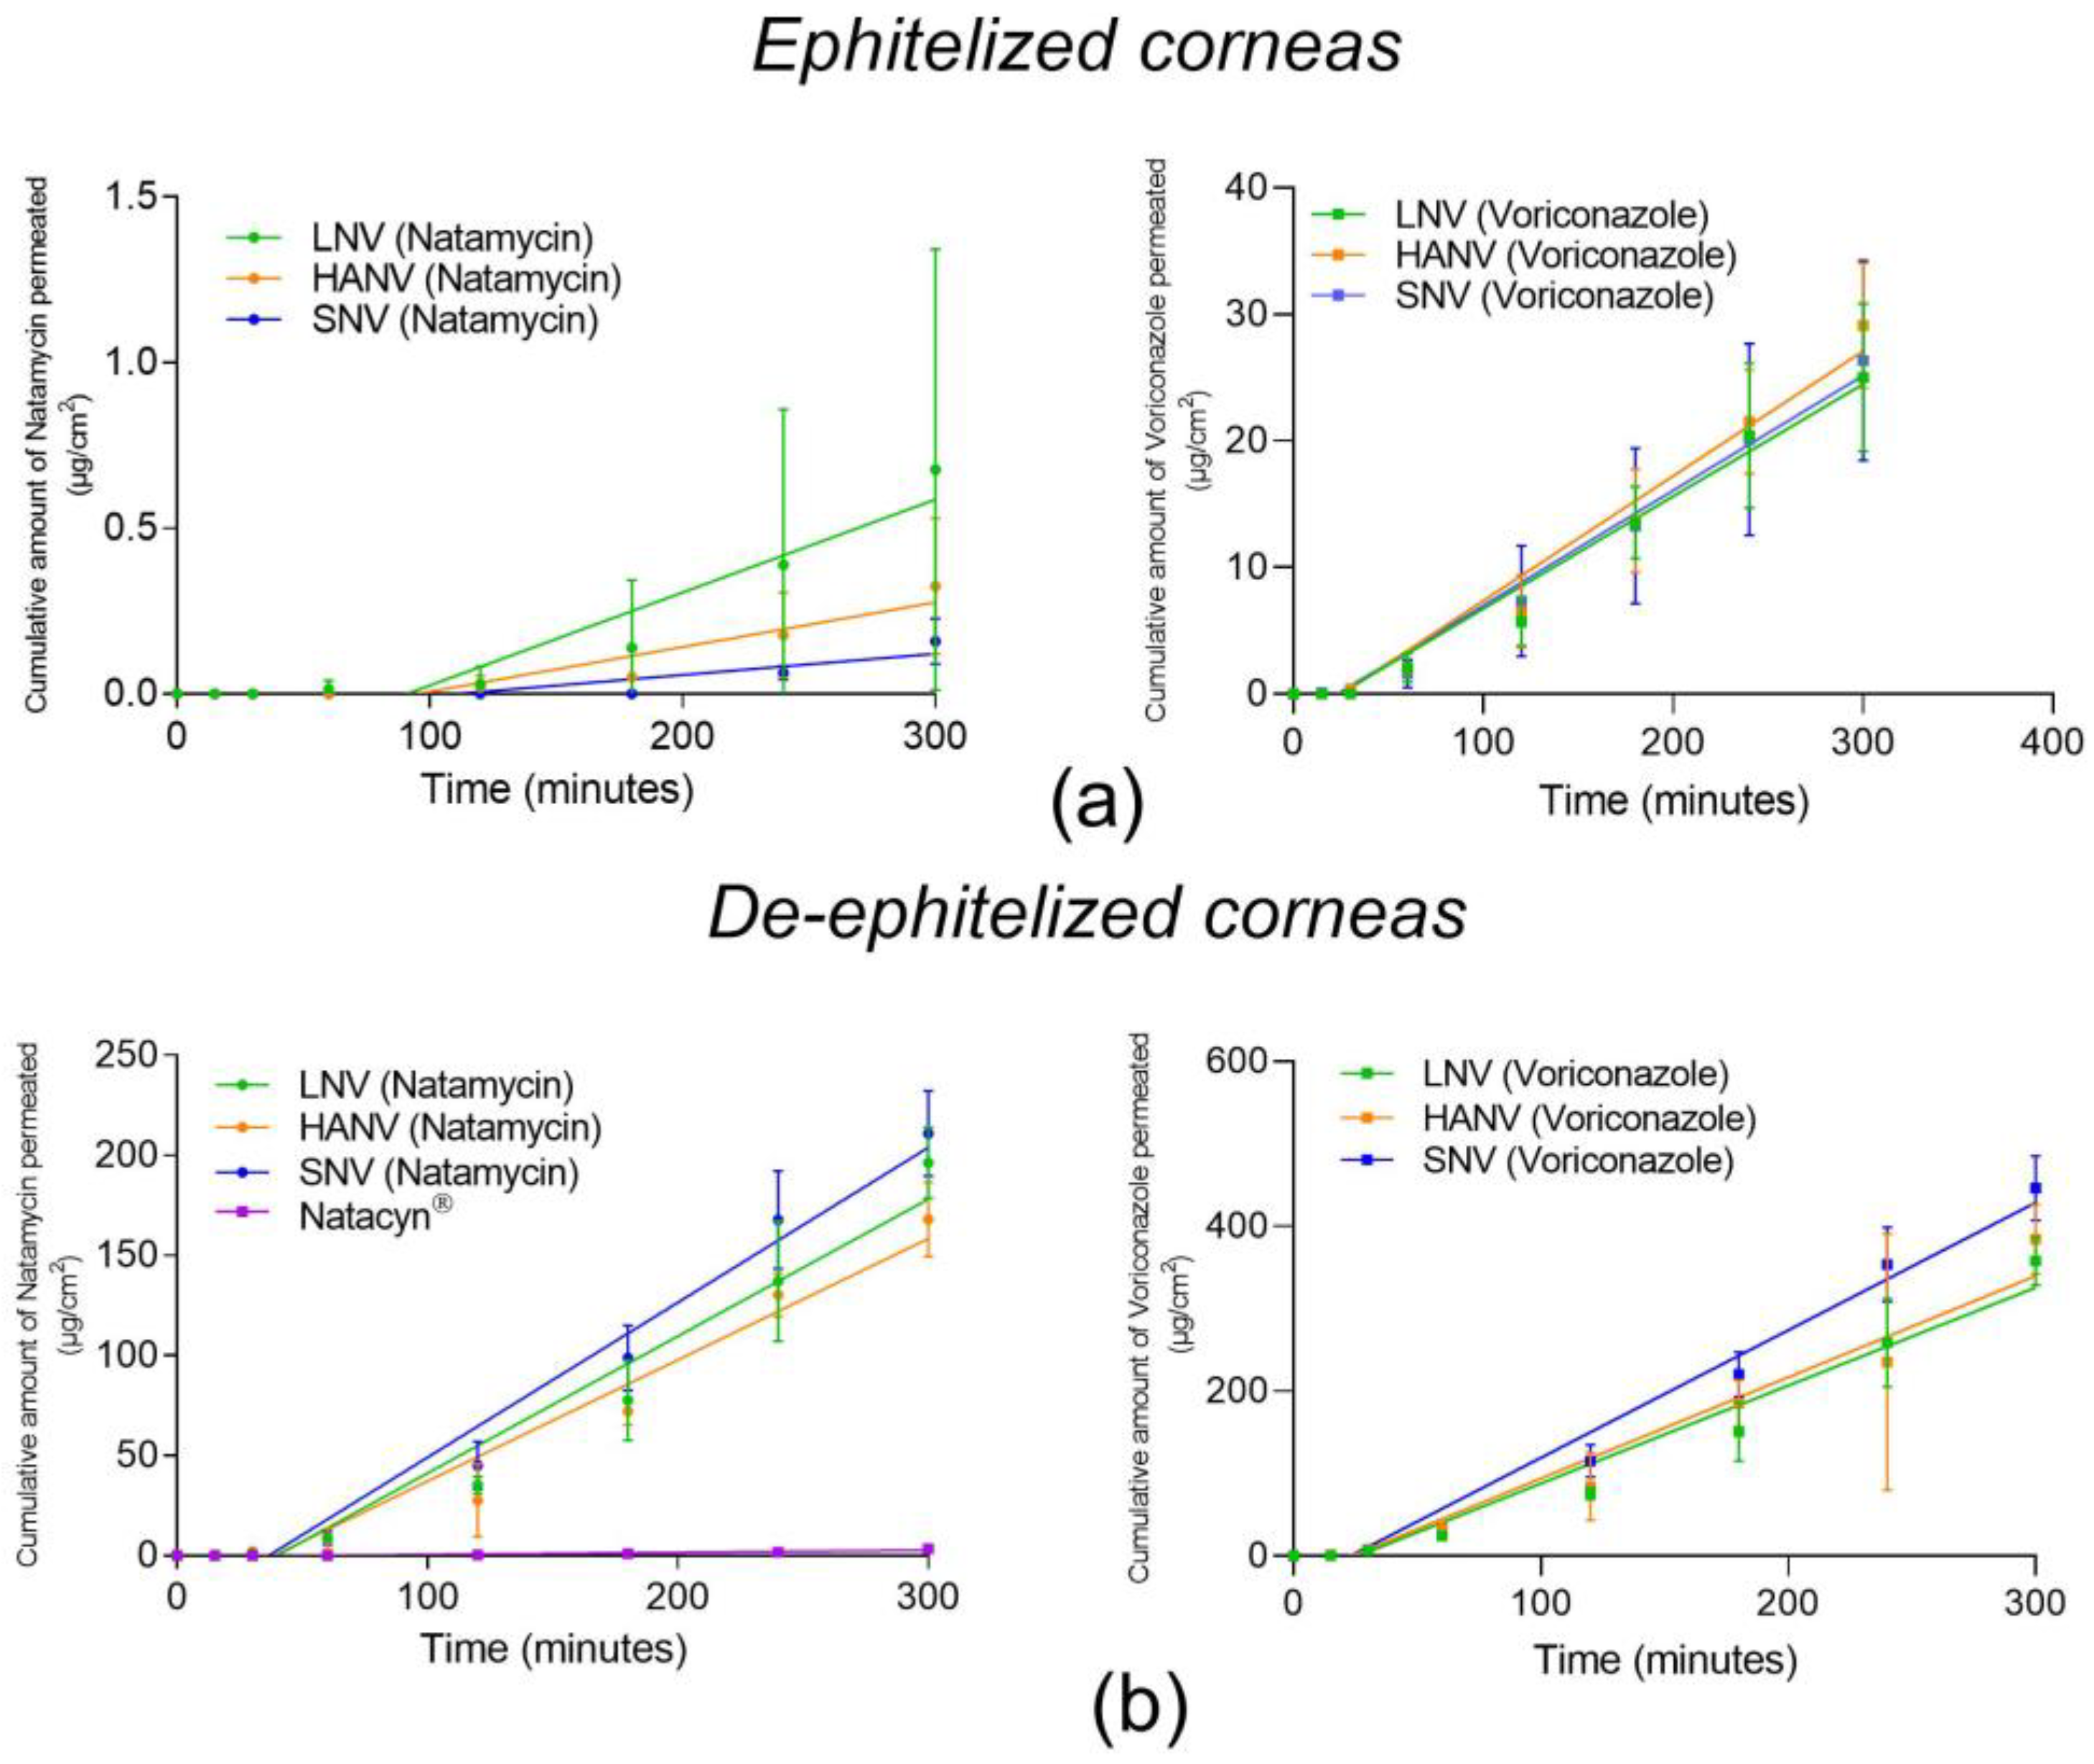
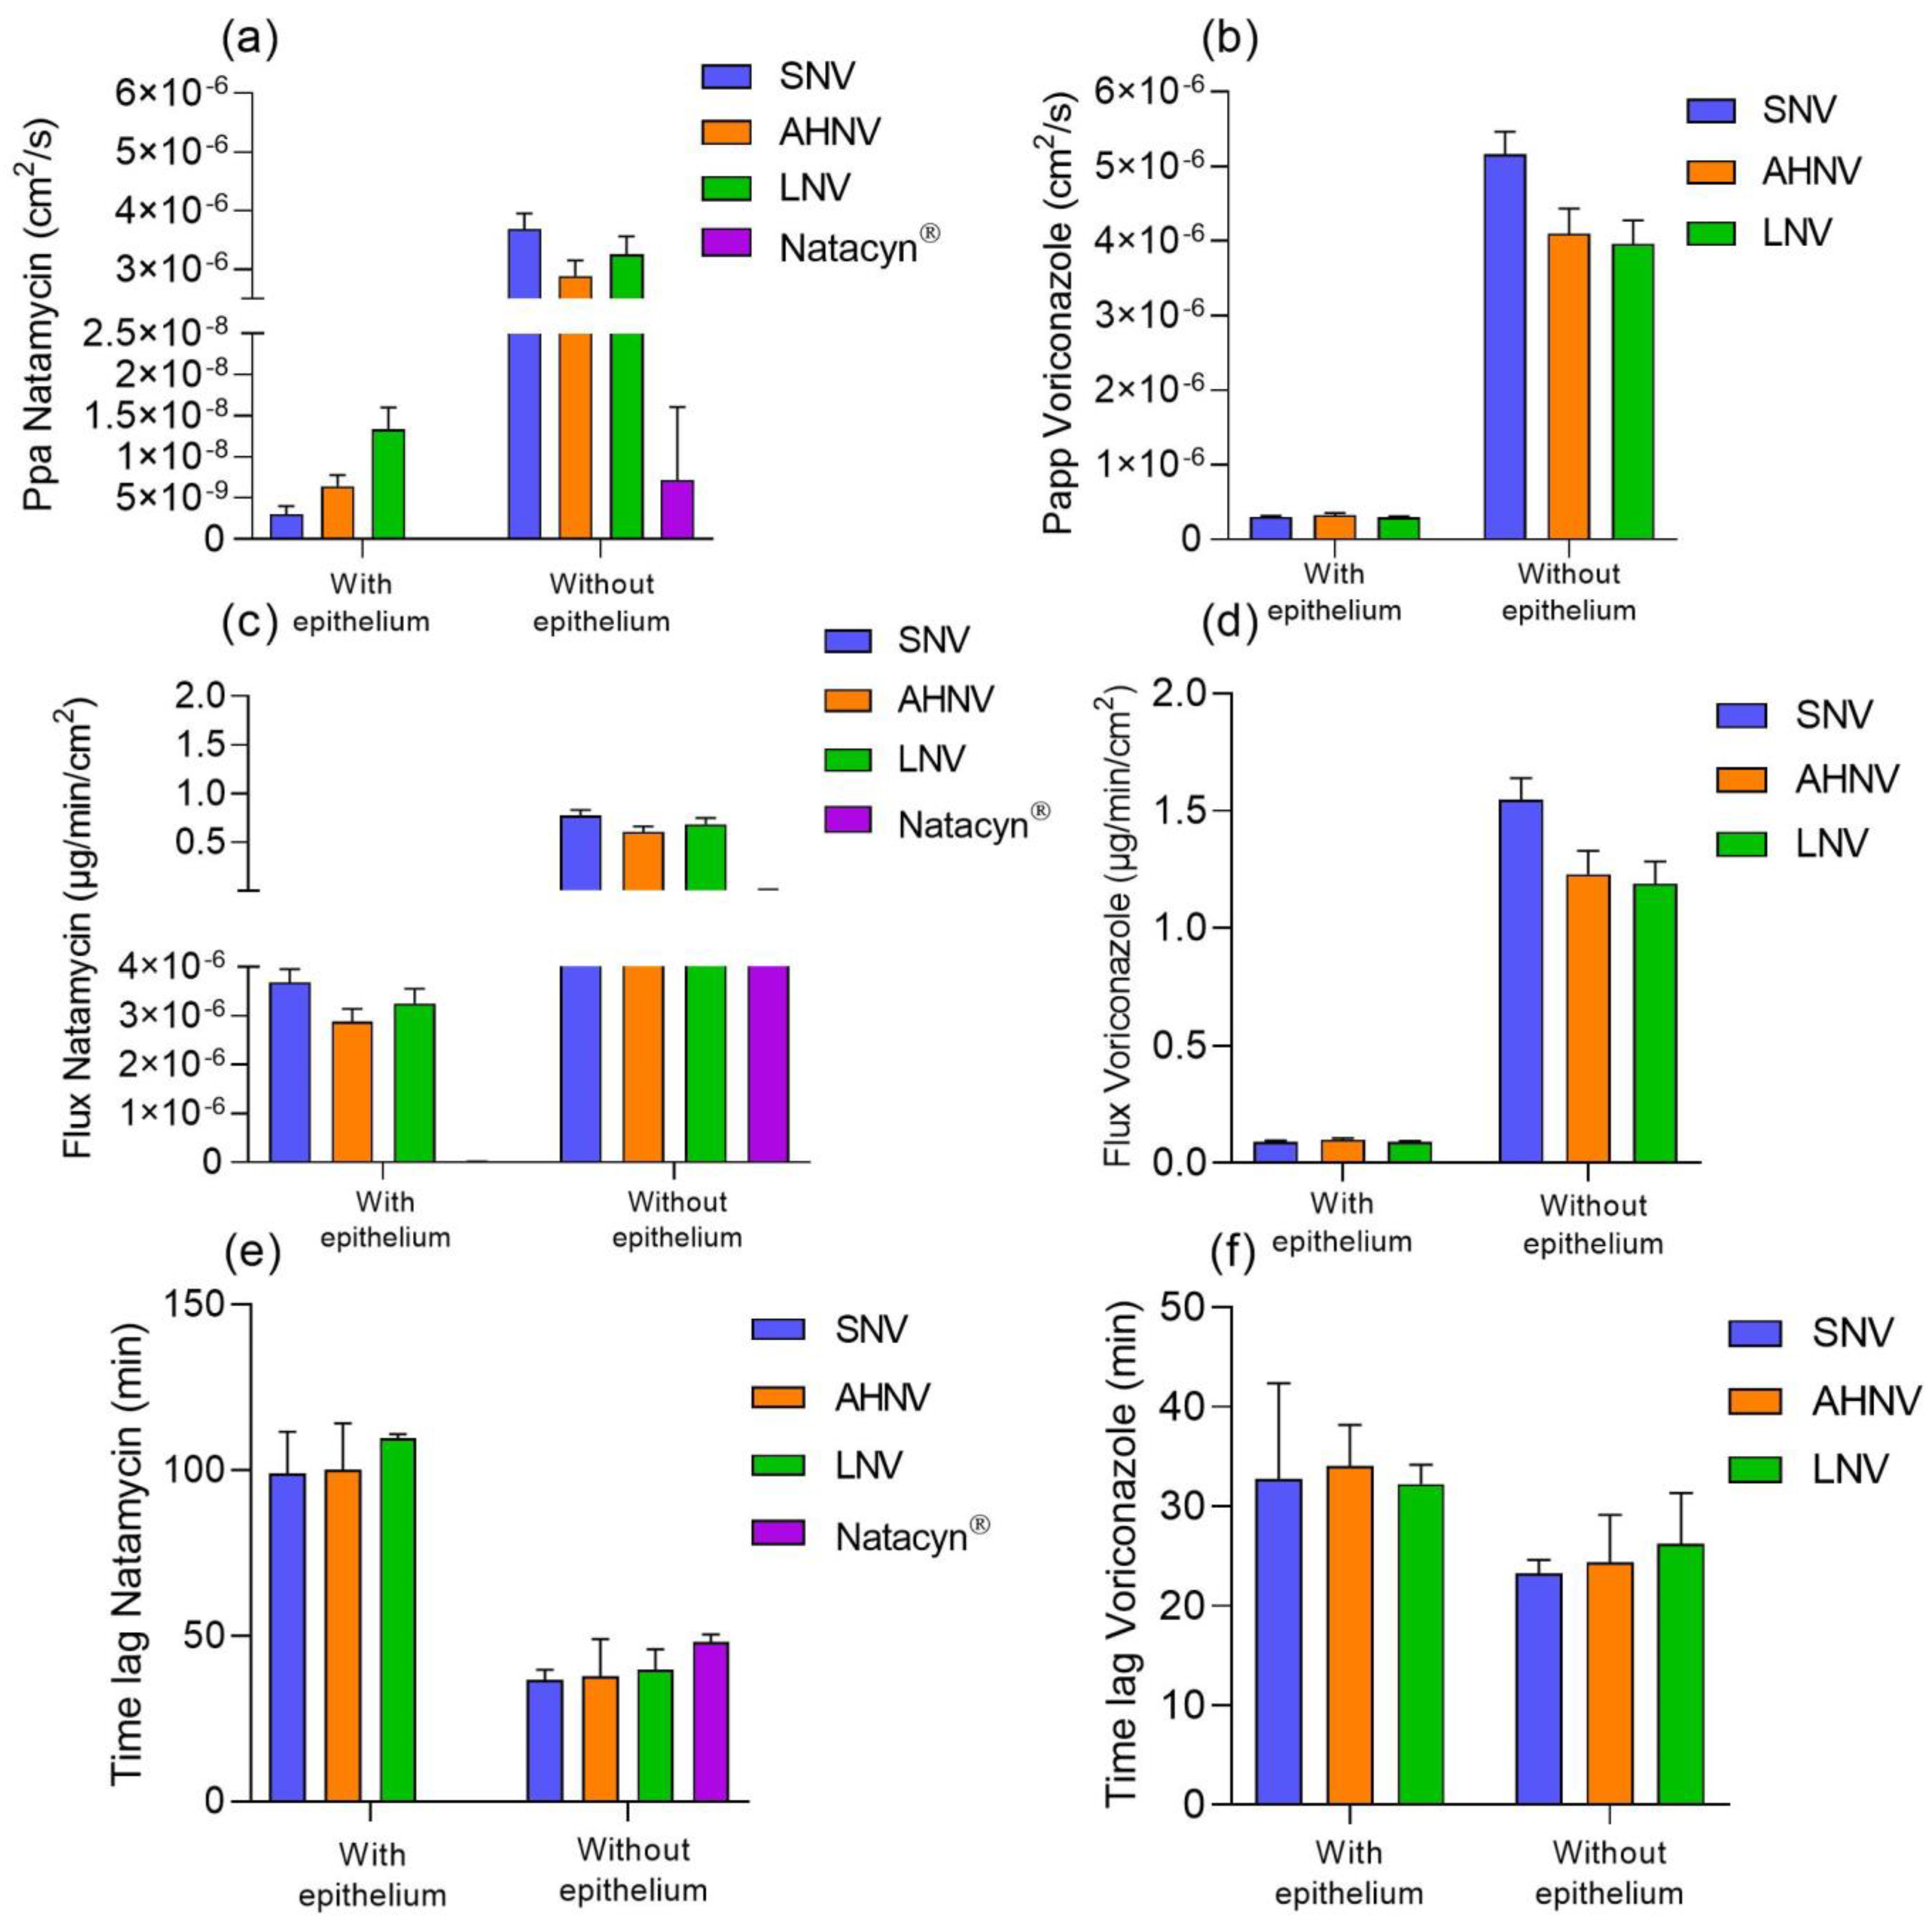
3.8. Ex Vivo Corneal Permeability Studies
3.9. Ocular Irritation Test
3.9.1. Bovine Corneal Opacity and Permeability Assay (BCOP)
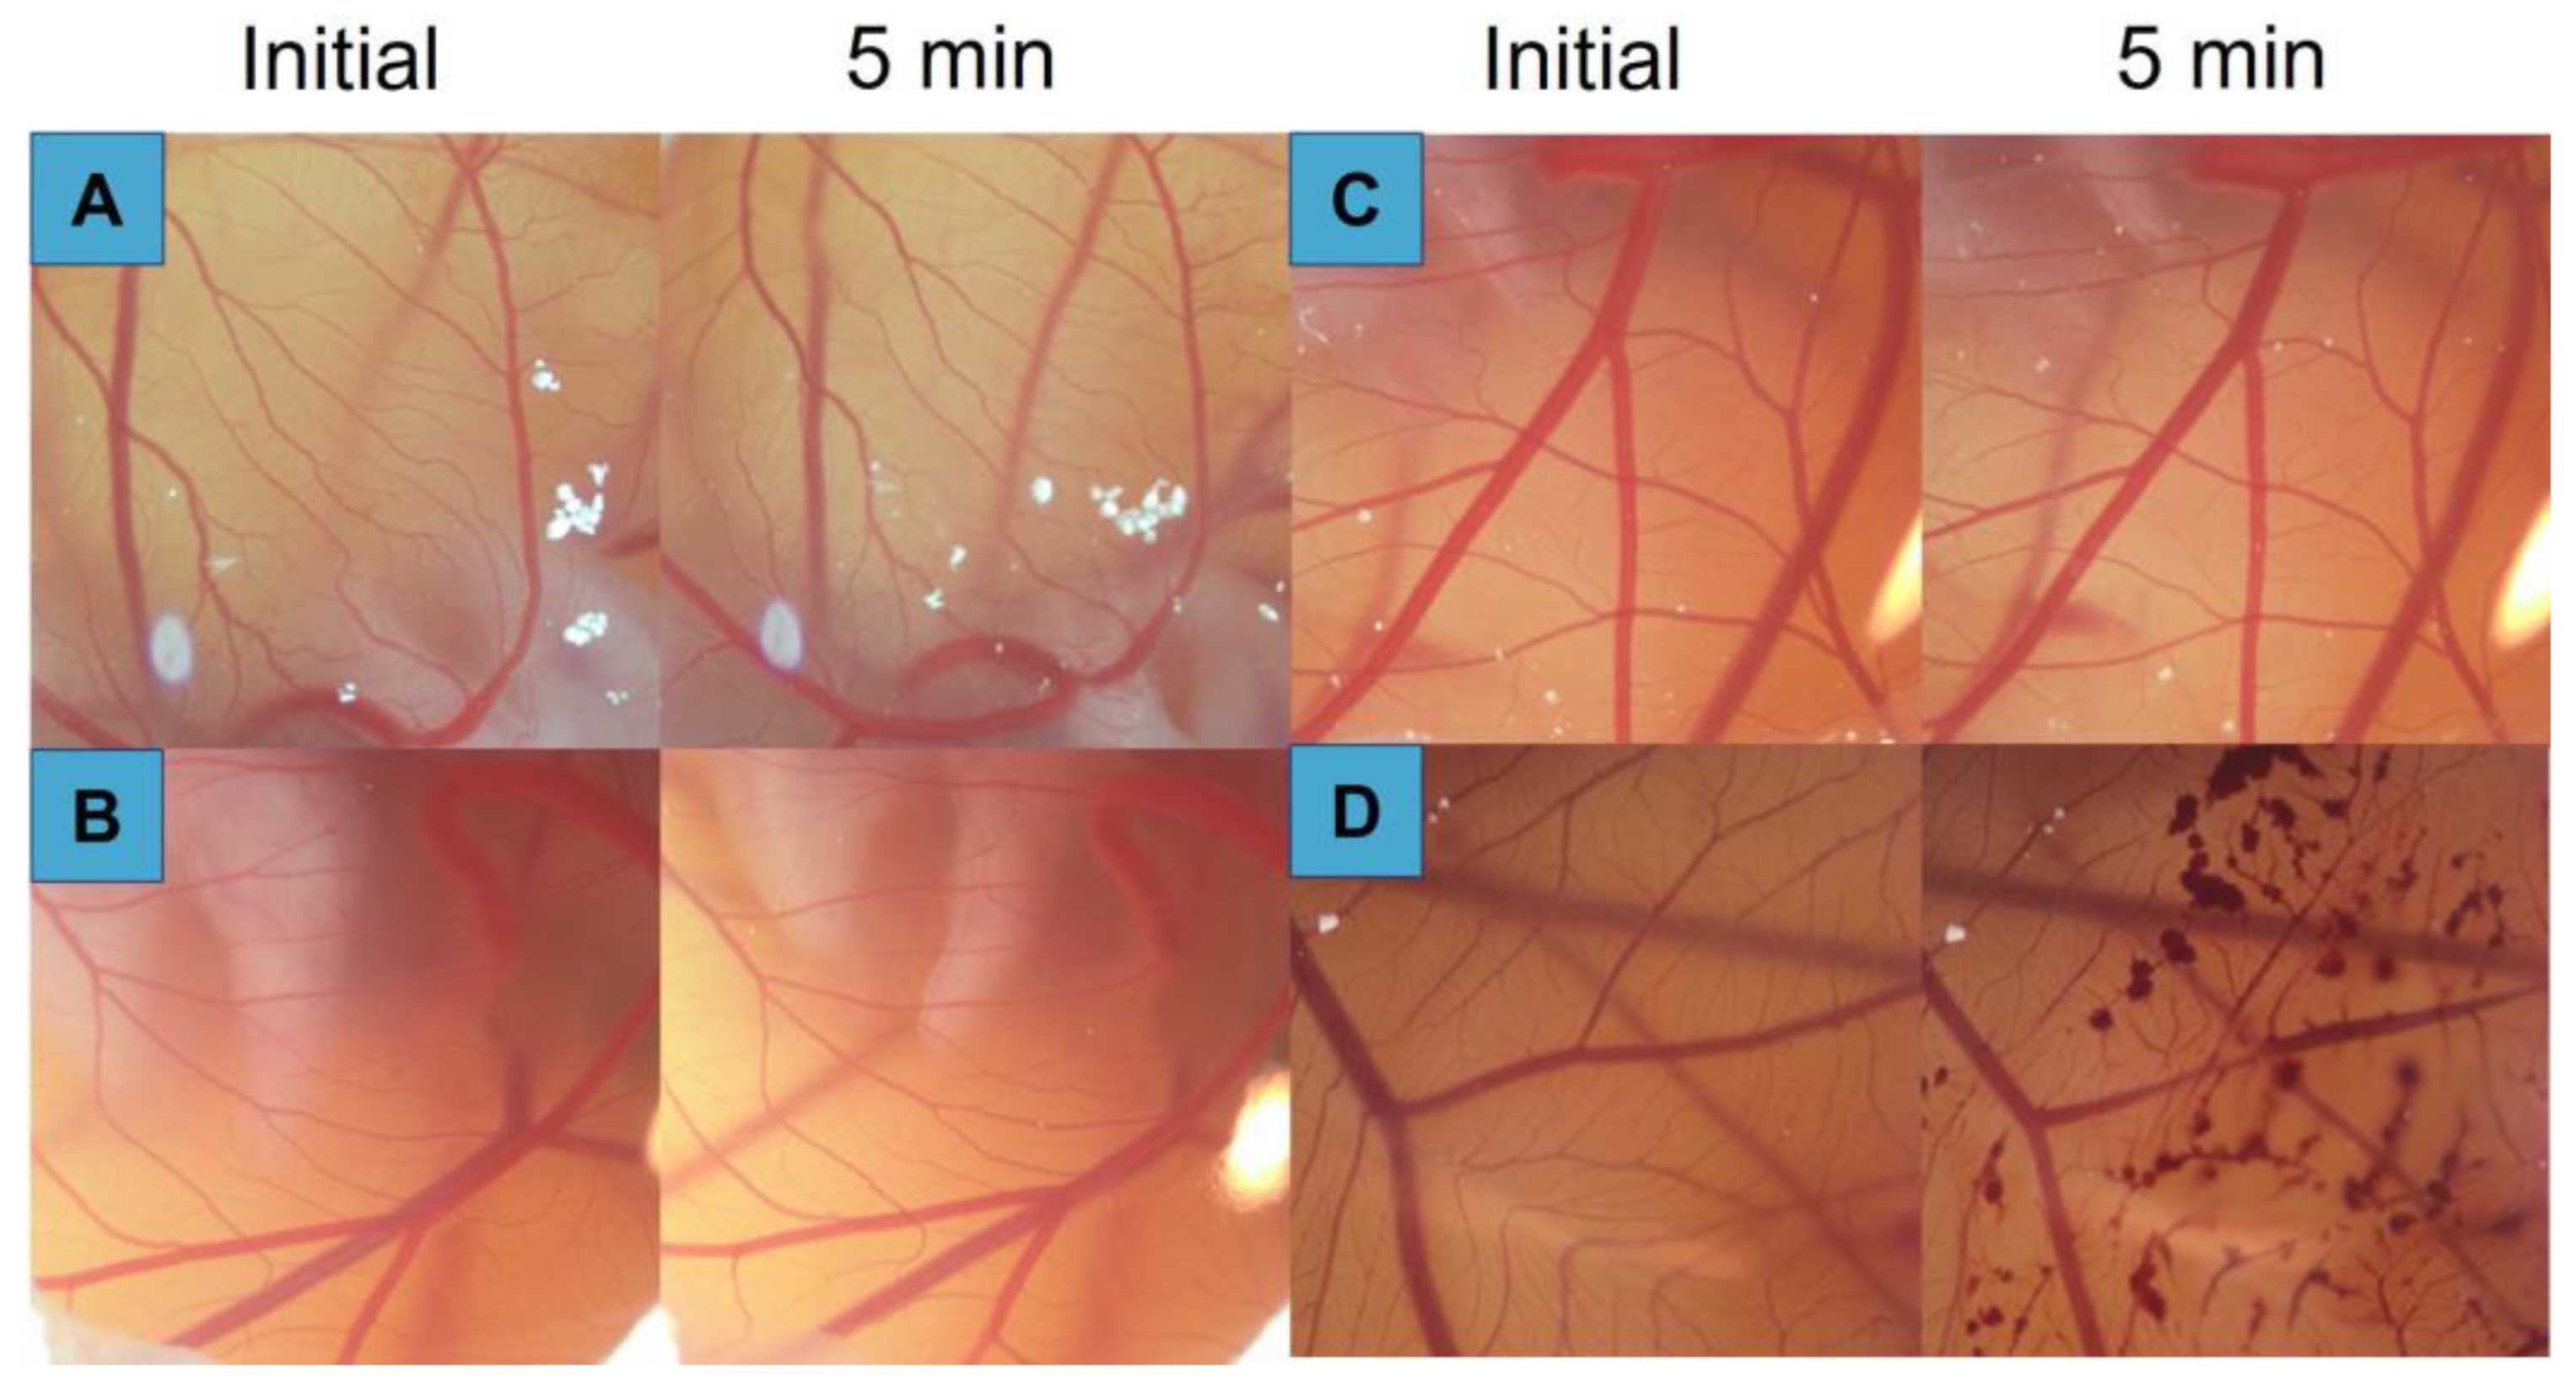
3.9.2. Hen’s Egg Test—Chorioallantoic Membrane (HET-CAM)
3.10. Corneal Mucoadhesiveness
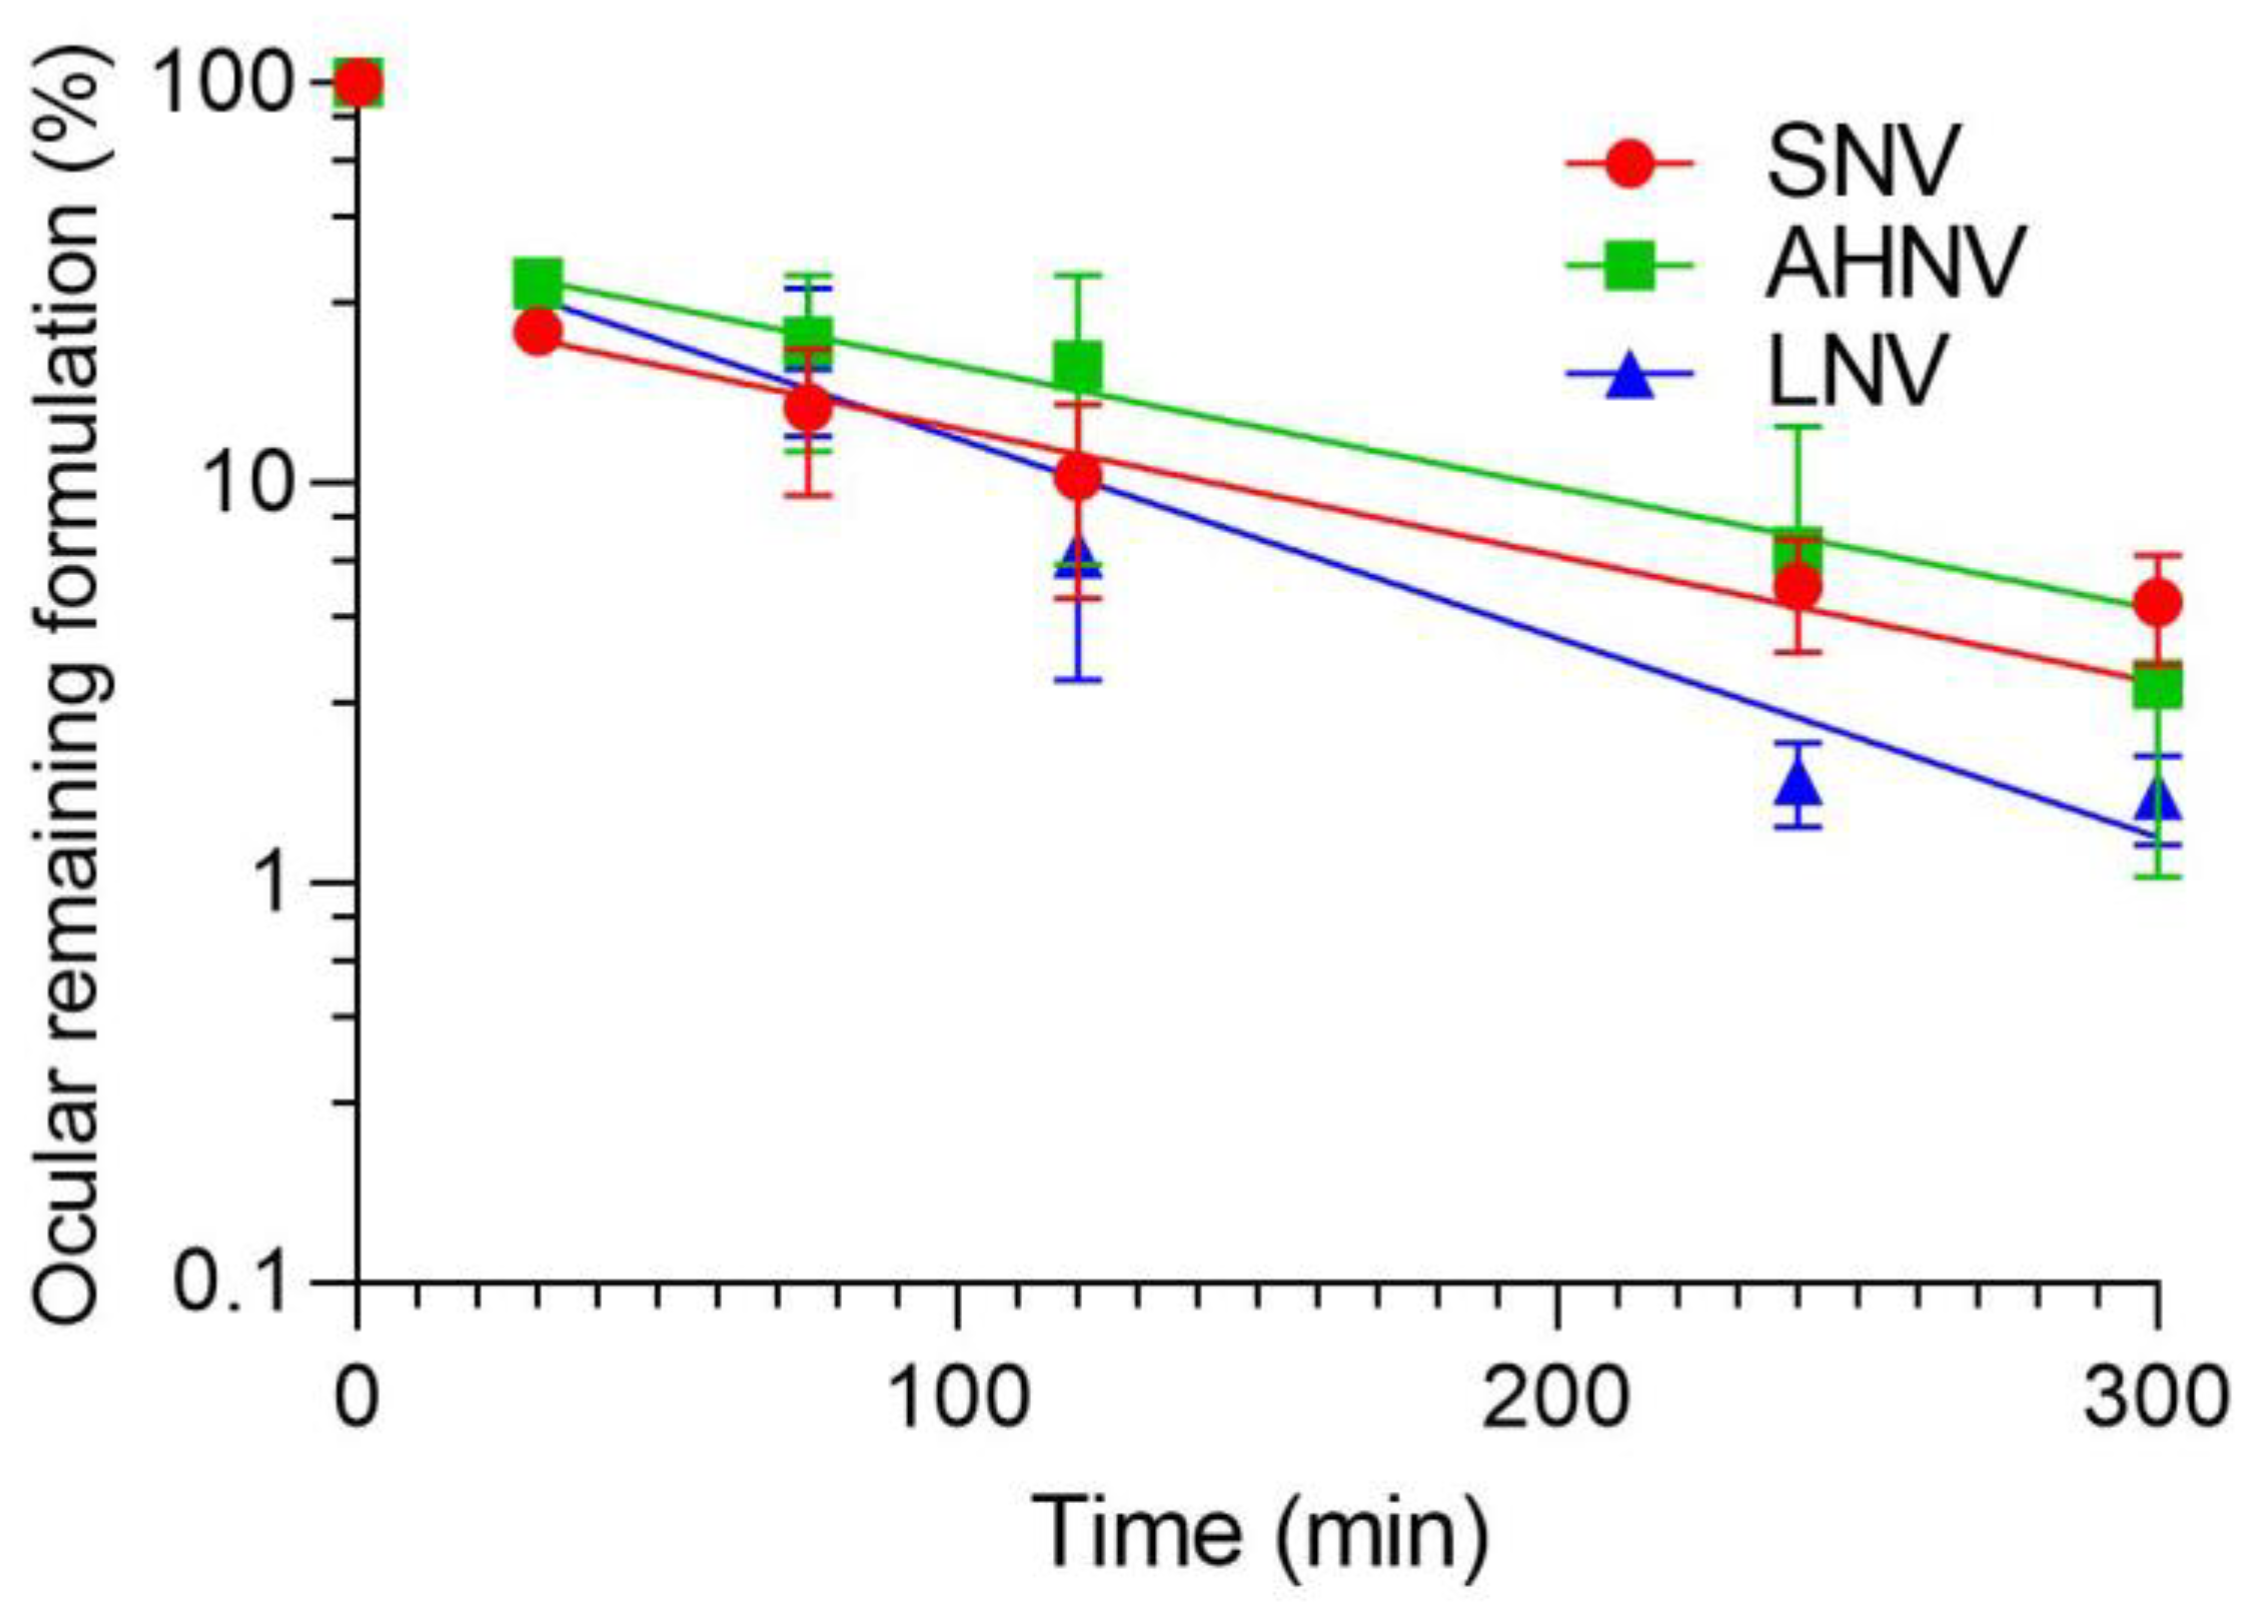
3.11. PET In Vivo Assay: Quantitative Ocular Permanence Study
3.12. Disc Diffusion Method by the Kirby-Bauer Method
4. Conclusions
Supplementary Materials
Author Contributions
Funding
Institutional Review Board Statement
Informed Consent Statement
Data Availability Statement
Acknowledgments
Conflicts of Interest
References
- Rai, M.; Occhiutto, M.L. Mycotic Keratitis; CRC Press: Boca Raton, FL, USA, 2019; ISBN 978-0-429-66455-7. [Google Scholar]
- Taechajongjintana, M.; Kasetsuwan, N.; Reinprayoon, U.; Sawanwattanakul, S.; Pisuchpen, P. Effectiveness of voriconazole and corneal cross-linking on Phialophora verrucosa keratitis: A case report. J. Med. Case Rep. 2018, 12, 225. [Google Scholar] [CrossRef]
- Bourcier, T.; Sauer, A.; Dory, A.; Denis, J.; Sabou, M. Fungal keratitis. J. Fr. Ophtalmol. 2017, 40, e307–e313. [Google Scholar] [CrossRef]
- Lund, O.E.; Miño de Kaspar, H.; Klauss, V. Strategy for examination and therapy of mycotic keratitis. Klin. Monbl. Augenheilkd. 1993, 202, 188–194. [Google Scholar] [CrossRef] [PubMed]
- Saha, S.; Banerjee, D.; Khetan, A.; Sengupta, J. Epidemiological profile of fungal keratitis in urban population of west Bengal, India. Oman. J. Ophthalmol. 2009, 2, 114–118. [Google Scholar] [CrossRef]
- Ogawa, A.; Matsumoto, Y.; Yaguchi, T.; Shimmura, S.; Tsubota, K. Successful treatment of Beauveria bassiana fungal keratitis with topical voriconazole. J. Infect. Chemother. 2016, 22, 257–260. [Google Scholar] [CrossRef] [PubMed]
- Anutarapongpan, O.; Thanathanee, O.; Suwan-Apichon, O. Penicillium keratitis in a HIV-infected patient. BMJ Case Rep. 2016, 2016, bcr2016216139. [Google Scholar] [CrossRef] [PubMed]
- Shukla, P.K.; Kumar, M.; Keshava, G.B.S. Mycotic keratitis: An overview of diagnosis and therapy. Mycoses 2008, 51, 183–199. [Google Scholar] [CrossRef]
- Brown, L.; Leck, A.K.; Gichangi, M.; Burton, M.J.; Denning, D.W. The global incidence and diagnosis of fungal keratitis. Lancet Infect. Dis. 2021, 21, e49–e57. [Google Scholar] [CrossRef]
- Mannis, M.J.; Holland, E.J. Cornea E-Book; Elsevier Health Sciences: Amsterdam, The Netherlands, 2016; ISBN 978-0-323-35758-6. [Google Scholar]
- Lalitha, P.; Vijaykumar, R.; Prajna, N.V.; Fothergill, A.W. In vitro natamycin susceptibility of ocular isolates of Fusarium and Aspergillus species: Comparison of commercially formulated natamycin eye drops to pharmaceutical-grade powder. J. Clin. Microbiol. 2008, 46, 3477–3478. [Google Scholar] [CrossRef] [Green Version]
- Aparicio, J.F.; Barreales, E.G.; Payero, T.D.; Vicente, C.M.; de Pedro, A.; Santos-Aberturas, J. Biotechnological production and application of the antibiotic pimaricin: Biosynthesis and its regulation. Appl. Microbiol. Biotechnol. 2016, 100, 61–78. [Google Scholar] [CrossRef]
- Pradhan, L.; Sharma, S.; Nalamada, S.; Sahu, S.K.; Das, S.; Garg, P. Natamycin in the treatment of keratomycosis: Correlation of treatment outcome and in vitro susceptibility of fungal isolates. Indian J. Ophthalmol. 2011, 59, 512–514. [Google Scholar] [CrossRef] [PubMed]
- Maschmeyer, G.; Haas, A. Voriconazole: A broad spectrum triazole for the treatment of serious and invasive fungal infections. Future Microbiol. 2006, 1, 365–385. [Google Scholar] [CrossRef] [PubMed]
- Bunya, V.Y.; Hammersmith, K.M.; Rapuano, C.J.; Ayres, B.D.; Cohen, E.J. Topical and oral voriconazole in the treatment of fungal keratitis. Am. J. Ophthalmol. 2007, 143, 151–153. [Google Scholar] [CrossRef] [PubMed]
- Al-Badriyeh, D.; Neoh, C.F.; Stewart, K.; Kong, D.C.M. Clinical utility of voriconazole eye drops in ophthalmic fungal keratitis. Clin. Ophthalmol. 2010, 4, 391–405. [Google Scholar] [PubMed] [Green Version]
- Voriconazole Teva 200 Mg Polvo Para Solución Para Perfusión (EFG). Available online: https://cima.aemps.es/cima/publico/detalle.html?nregistro=80047 (accessed on 24 February 2020).
- EMA Vfend. Available online: https://www.ema.europa.eu/en/medicines/human/EPAR/vfend (accessed on 29 August 2022).
- Johnson, M.D.; MacDougall, C.; Ostrosky-Zeichner, L.; Perfect, J.R.; Rex, J.H. Combination antifungal therapy. Antimicrob. Agents Chemother. 2004, 48, 693–715. [Google Scholar] [CrossRef] [Green Version]
- Al-Hatmi, A.M.S.; Meletiadis, J.; Curfs-Breuker, I.; Bonifaz, A.; Meis, J.F.; De Hoog, G.S. In vitro combinations of natamycin with voriconazole, itraconazole and micafungin against clinical Fusarium strains causing keratitis. J. Antimicrob. Chemother. 2016, 71, 953–955. [Google Scholar] [CrossRef] [Green Version]
- Jiang, T.; Tang, J.; Wu, Z.; Sun, Y.; Tan, J.; Yang, L. The combined utilization of chlorhexidine and voriconazole or natamycin to combat fusarium infections. BMC Microbiol. 2020, 20, 275. [Google Scholar] [CrossRef]
- Sradhanjali, S.; Yein, B.; Sharma, S.; Das, S. In vitro synergy of natamycin and voriconazole against clinical isolates of Fusarium, Candida, Aspergillus and Curvularia spp. Br. J. Ophthalmol. 2018, 102, 142–145. [Google Scholar] [CrossRef]
- Shapiro, B.L.; Lalitha, P.; Fothergill, A.W.; Apakupakul, K.; Srinivasan, M.; Prajna, N.V.; McLeod, S.D.; Acharya, N.R.; Lietman, T.M. Synergy, indifference, or antagonism? In vitro susceptibility of Fusarium and Aspergillus spp isolated from keratitis in south India against combinations of natamycin, voriconazole, and anidulafungin. Investig. Ophthalmol. Vis. Sci. 2011, 52, 5854. [Google Scholar]
- Brewster, M.E.; Loftsson, T. Cyclodextrins as pharmaceutical solubilizers. Adv. Drug Deliv. Rev. 2007, 59, 645–666. [Google Scholar] [CrossRef]
- European Medicines Agency (EMA) Background Review for Cyclodextrins Used as Excipients. 2014. Available online: https://www.ema.europa.eu/en/cyclodextrins (accessed on 17 September 2022).
- Connors, K.A.; Higuchi, T. Phase-solubility techniques. In Advances in Analitycal Chemistry and Instrumentation; Reilly, C.N., Ed.; Interscience: New York, NY, USA, 1965; Volume 4, pp. 117–212. [Google Scholar]
- Loftsson, T.; Brewster, M.E. Cyclodextrins as functional excipients: Methods to enhance complexation efficiency. J. Pharm. Sci. 2012, 101, 3019–3032. [Google Scholar] [CrossRef] [PubMed]
- Loftsson, T.; Masson, M. The effects of water-soluble polymers on cyclodextrins and cyclodextrin solubilization of drugs. J. Drug Deliv. Sci. Technol. 2004, 14, 35–43. [Google Scholar] [CrossRef]
- Selvam, A.P.; Geetha, D. Ultrasonic studies on lamivudine: Beta-cyclodextrin and polymer inclusion complexes. Pak. J. Biol. Sci. 2008, 11, 656–659. [Google Scholar] [CrossRef] [PubMed] [Green Version]
- Mayer, M.; Meyer, B. Mapping the active site of angiotensin-converting enzyme by transferred NOE spectroscopy. J. Med. Chem. 2000, 43, 2093–2099. [Google Scholar] [CrossRef]
- Bertuzzi, S.; Gimeno, A.; Núñez-Franco, R.; Bernardo-Seisdedos, G.; Delgado, S.; Jiménez-Osés, G.; Millet, O.; Jiménez-Barbero, J.; Ardá, A. Unravelling the Time Scale of Conformational Plasticity and Allostery in Glycan Recognition by Human Galectin-1. Chemistry-A European Journal-Wiley Online Library. Available online: https://chemistry-europe.onlinelibrary.wiley.com/doi/full/10.1002/chem.202003212 (accessed on 5 May 2022).
- Díaz-Tomé, V.; García-Otero, X.; Varela-Fernández, R.; Martín-Pastor, M.; Conde-Penedo, A.; Aguiar, P.; González-Barcia, M.; Fernández-Ferreiro, A.; Otero-Espinar, F.J. In situ forming and mucoadhesive ophthalmic voriconazole/HPβCD hydrogels for the treatment of fungal keratitis. Int. J. Pharm. 2021, 597, 120318. [Google Scholar] [CrossRef]
- Luaces-Rodríguez, A.; Díaz-Tomé, V.; González-Barcia, M.; Silva-Rodríguez, J.; Herranz, M.; Gil-Martínez, M.; Rodríguez-Ares, M.T.; García-Mazás, C.; Blanco-Mendez, J.; Lamas, M.J.; et al. Cysteamine polysaccharide hydrogels: Study of extended ocular delivery and biopermanence Time by PET Imaging. Int. J. Pharm. 2017, 528, 714–722. [Google Scholar] [CrossRef]
- Díaz-Tomé, V.; Luaces-Rodríguez, A.; Silva-Rodríguez, J.; Blanco-Dorado, S.; García-Quintanilla, L.; Llovo-Taboada, J.; Blanco-Méndez, J.; García-Otero, X.; Varela-Fernández, R.; Herranz, M.; et al. Ophthalmic econazole hydrogels for the treatment of fungal keratitis. J. Pharm. Sci. 2018, 107, 1342–1351. [Google Scholar] [CrossRef]
- García-Otero, X.; Díaz-Tomé, V.; Varela-Fernández, R.; Martín-Pastor, M.; González-Barcia, M.; Blanco-Méndez, J.; Mondelo-García, C.; Bermudez, M.A.; Gonzalez, F.; Aguiar, P.; et al. Development and characterization of a Tacrolimus/Hydroxypropyl-β-Cyclodextrin eye drop. Pharmaceutics 2021, 13, 149. [Google Scholar] [CrossRef]
- Fernández Ferreiro, A. Formulación Magistral Oftálmica Antiinfecciosa; Sociedad Española de Farmacia Hospitlaria: Madrid, Spain, 2019; ISBN 978-84-09-10764-3. [Google Scholar]
- Sliney, D.H. What is light? The visible spectrum and beyond. Eye 2016, 30, 222–229. [Google Scholar] [CrossRef] [Green Version]
- Ceulemans, J.; Ludwig, A. Optimisation of carbomer viscous eye drops: An in vitro experimental design approach using rheological techniques. Eur. J. Pharm. Biopharm. 2002, 54, 41–50. [Google Scholar] [CrossRef]
- EUR-Lex-02010L0063-20190626-EN-EUR-Lex. Available online: https://eur-lex.europa.eu/legal-content/EN/TXT/?uri=CELEX%3A02010L0063-20190626 (accessed on 26 April 2020).
- OECD. Test No. 437: Bovine Corneal Opacity and Permeability Test Method for Identifying I) Chemicals Inducing Serious Eye Damage and II) Chemicals Not Requiring Classification for Eye Irritation or Serious Eye Damage; Organisation for Economic Co-operation and Development: Paris, France, 2013; ISBN 978-92-64-20384-6. [Google Scholar]
- ICCVAM Recommended Test Method Protocol: Hen’s Egg Test–Chorioallantoic Membrane (HET-CAM) Test Method. Obtained From 2010. Available online: https://ntp.niehs.nih.gov/iccvam/docs/protocols/ivocular-hetcam.pdf (accessed on 25 July 2022).
- Fernández-Ferreiro, A.; Silva-Rodríguez, J.; Otero-Espinar, F.J.; González-Barcia, M.; Lamas, M.J.; Ruibal, A.; Luaces-Rodriguez, A.; Vieites-Prado, A.; Sobrino, T.; Herranz, M.; et al. Positron emission tomography for the development and characterization of corneal permanence of ophthalmic pharmaceutical formulations. Investig. Ophthalmol. Vis. Sci. 2017, 58, 772–780. [Google Scholar] [CrossRef]
- Koontz, J.L.; Marcy, J.E. Formation of natamycin:cyclodextrin inclusion complexes and their characterization. J. Agric. Food Chem. 2003, 51, 7106–7110. [Google Scholar] [CrossRef]
- Malhotra, S.; Khare, A.; Grover, K.; Singh, I.; Pawar, P. Design and evaluation of voriconazole eye drops for the treatment of fungal keratitis. J. Pharm. 2014, 2014, 1–9. [Google Scholar] [CrossRef] [PubMed]
- CIMA: Voltaren 1 Mg/Ml Colirio en Solucion. Available online: https://cima.aemps.es/cima/publico/detalle.html?nregistro=58308 (accessed on 7 October 2021).
- Abdelkader, H.; Fathalla, Z.; Moharram, H.; Ali, T.F.S.; Pierscionek, B. cyclodextrin enhances corneal tolerability and reduces ocular toxicity caused by diclofenac. Oxid. Med. Cell Longev. 2018, 2018, 5260976. [Google Scholar] [CrossRef] [PubMed] [Green Version]
- Loftsson, T.; Stefánsson, E. Cyclodextrins and topical drug delivery to the anterior and posterior segments of the eye. Int. J. Pharm. 2017, 531, 413–423. [Google Scholar] [CrossRef] [PubMed]
- Haimhoffer, Á.; Rusznyák, Á.; Réti-Nagy, K.; Vasvári, G.; Váradi, J.; Vecsernyés, M.; Bácskay, I.; Fehér, P.; Ujhelyi, Z.; Fenyvesi, F. Cyclodextrins in drug delivery systems and their effects on biological barriers. Sci. Pharm. 2019, 87, 33. [Google Scholar] [CrossRef] [Green Version]
- Muankaew, C.; Saokham, P.; Jansook, P.; Loftsson, T. Self-assembly of cyclodextrin complexes: Detection, obstacles and benefits. Die Pharm.-Int. J. Pharm. Sci. 2020, 75, 307–312. [Google Scholar] [CrossRef]
- Loftsson, T.; Hreinsdóttir, D.; Stefánsson, E. Cyclodextrin microparticles for drug delivery to the posterior segment of the eye: Aqueous dexamethasone eye drops. J. Pharm. Pharmacol. 2007, 59, 629–635. [Google Scholar] [CrossRef]
- Jansook, P.; Stefánsson, E.; Thorsteinsdóttir, M.; Sigurdsson, B.B.; Kristjánsdóttir, S.S.; Bas, J.F.; Sigurdsson, H.H.; Loftsson, T. Cyclodextrin solubilization of carbonic anhydrase inhibitor drugs: Formulation of dorzolamide eye drop microparticle suspension. Eur. J. Pharm. Biopharm. 2010, 76, 208–214. [Google Scholar] [CrossRef]
- Muankaew, C.; Jansook, P.; Stefánsson, E.; Loftsson, T. Effect of γ-Cyclodextrin on solubilization and complexation of irbesartan: Influence of PH and excipients. Int. J. Pharm. 2014, 474, 80–90. [Google Scholar] [CrossRef]
- Jóhannsdóttir, S.; Jansook, P.; Stefánsson, E.; Loftsson, T. Development of a cyclodextrin-based aqueous Cyclosporin A eye drop formulations. Int. J. Pharm. 2015, 493, 86–95. [Google Scholar] [CrossRef] [PubMed]
- Phillip Lee, Y.-H.; Sathigari, S.; Jean Lin, Y.-J.; Ravis, W.R.; Chadha, G.; Parsons, D.L.; Rangari, V.K.; Wright, N.; Babu, R.J. Gefitinib–Cyclodextrin inclusion complexes: Physico-chemical characterization and dissolution studies. Drug Dev. Ind. Pharm. 2009, 35, 1113–1120. [Google Scholar] [CrossRef] [PubMed]
- Jambhekar, S.S.; Breen, P. Cyclodextrins in pharmaceutical formulations II: Solubilization, binding constant, and complexation efficiency. Drug Discov. Today 2016, 21, 363–368. [Google Scholar] [CrossRef]
- Jansook, P.; Praphanwittaya, P.; Sripetch, S.; Loftsson, T. Solubilization and in vitro permeation of dovitinib/cyclodextrin complexes and their aggregates. J. Incl. Phenom. Macrocycl. Chem. 2020, 97, 195–203. [Google Scholar] [CrossRef]
- Fielding, L. NMR methods for the determination of protein-ligand dissociation constants. Prog. Nucl. Magn. Reson. Spectrosc. 2007, 3, 219–242. [Google Scholar] [CrossRef]
- Furukawa, A.; Konuma, T.; Yanaka, S.; Sugase, K. Quantitative analysis of protein-ligand interactions by NMR. Prog. Nucl. Magn. Reson. Spectrosc. 2016, 96, 47–57. [Google Scholar] [CrossRef]
- Human Metabolome Database: 1H NMR Spectrum (1D, 800 MHz, D2O, Predicted) (HMDB0014964). Available online: https://hmdb.ca/spectra/nmr_one_d/153327 (accessed on 5 May 2022).
- Human Metabolome Database: 13C NMR Spectrum (1D, 800 MHz, D2O, Predicted) (HMDB0014964). Available online: https://hmdb.ca/spectra/nmr_one_d/153326 (accessed on 5 May 2022).
- Cruz, J.R.; Becker, B.A.; Morris, K.F.; Larive, C.K. NMR characterization of the host-guest inclusion complex between beta-cyclodextrin and doxepin. Magn. Reson. Chem. 2008, 46, 838–845. [Google Scholar] [CrossRef]
- Dutescu, R.M.; Panfil, C.; Schrage, N. Osmolarity of prevalent eye drops, side effects, and therapeutic approaches. Cornea 2015, 34, 560–566. [Google Scholar] [CrossRef]
- Boddu, S.H.S.; Gunda, S.; Earla, R.; Mitra, A.K. Ocular microdialysis: A continuous sampling technique to study pharmacokinetics and pharmacodynamics in the eye. Bioanalysis 2010, 2, 487–507. [Google Scholar] [CrossRef]
- Bravo-Osuna, I.; Andrés-Guerrero, V.; Pastoriza Abal, P.; Molina-Martínez, I.T.; Herrero-Vanrell, R. Pharmaceutical microscale and nanoscale approaches for efficient treatment of ocular diseases. Drug Deliv. Transl. Res. 2016, 6, 686–707. [Google Scholar] [CrossRef]
- Ahmed, L.; Atif, R.; Eldeen, T.; Yahya, I.; Omara, A.; Eltayeb, M. Study the using of nanoparticles as drug delivery system based on mathematical models for controlled release. IJLTEMAS 2019, 8, 52–56. [Google Scholar]
- FlorCruz, N.V.; Evans, J.R. Medical interventions for fungal keratitis. Cochrane Database Syst. Rev. 2015, 4, CD004241. [Google Scholar] [CrossRef] [PubMed]
- O’Day, D.M.; Head, W.S.; Robinson, R.D.; Clanton, J.A. Corneal penetration of topical amphotericin B and natamycin. Curr. Eye Res. 1986, 5, 877–882. [Google Scholar] [CrossRef] [PubMed]
- Moiseev, R.V.; Morrison, P.W.J.; Steele, F.; Khutoryanskiy, V.V. Penetration enhancers in ocular drug delivery. Pharmaceutics 2019, 11, 321. [Google Scholar] [CrossRef] [Green Version]
- Lorenzo-Veiga, B.; Sigurdsson, H.H.; Loftsson, T.; Alvarez-Lorenzo, C. Cyclodextrin−amphiphilic copolymer supramolecular assemblies for the ocular delivery of natamycin. Nanomaterials 2019, 9, 745. [Google Scholar] [CrossRef] [Green Version]
- Snetkov, P.; Zakharova, K.; Morozkina, S.; Olekhnovich, R.; Uspenskaya, M. Hyaluronic acid: The influence of molecular weight on structural, physical, physico-chemical, and degradable properties of biopolymer. Polymers 2020, 12, 1800. [Google Scholar] [CrossRef]
- Chen, T.-Y.; Tseng, C.-L.; Lin, C.-A.; Lin, H.-Y.; Venkatesan, P.; Lai, P.-S. Effects of eye drops containing hyaluronic acid-nimesulide conjugates in a benzalkonium chloride-induced experimental dry eye rabbit model. Pharmaceutics 2021, 13, 1366. [Google Scholar] [CrossRef]
- Hyaluronate Acid-Dependent Protection and Enhanced Corneal Wound Healing against Oxidative Damage in Corneal Epithelial Cells-PubMed. Available online: https://pubmed.ncbi.nlm.nih.gov/27190638/ (accessed on 3 May 2022).
- Marinho, A.; Nunes, C.; Reis, S. Hyaluronic acid: A key ingredient in the therapy of inflammation. Biomolecules 2021, 11, 1518. [Google Scholar] [CrossRef]
- Chang, W.-H.; Liu, P.-Y.; Lin, M.-H.; Lu, C.-J.; Chou, H.-Y.; Nian, C.-Y.; Jiang, Y.-T.; Hsu, Y.-H.H. Applications of hyaluronic acid in ophthalmology and contact lenses. Molecules 2021, 26, 2485. [Google Scholar] [CrossRef]
- Aristizabal, L.S.R.; Castaño, D.M. Metodologias para evaluar in vitro la actividad antibacteriana de compuestos de origen vegetal. Sci. Tech. 2009, 2, 263–268. [Google Scholar]
- Yuan, X.; Wilhelmus, K.R.; Matoba, A.Y.; Alexandrakis, G.; Miller, D.; Huang, A.J.W. Pathogenesis and outcome of Paecilomyces keratitis. Am. J. Ophthalmol. 2009, 147, 691–696. [Google Scholar] [CrossRef] [PubMed]
- Wu, P.-C.; Lai, C.-H.; Tan, H.-Y.; Ma, D.H.; Hsiao, C.-H. The successful medical treatment of a case of Paecilomyces lilacinus keratitis. Cornea 2010, 29, 357–358. [Google Scholar] [CrossRef]
- Hlebová, M.; Hleba, L.; Medo, J.; Kováčik, A.; Čuboň, J.; Ivana, C.; Uzsáková, V.; Božik, M.; Klouček, P. Antifungal and synergistic activities of some selected essential oils on the growth of significant indoor fungi of the genus Aspergillus. J. Environ. Sci. Health A 2021, 56, 1335–1346. [Google Scholar] [CrossRef] [PubMed]
- Kiraz, N.; Dag, I.; Yamac, M.; Kiremitci, A.; Kasifoglu, N.; Oz, Y. Synergistic activities of three triazoles with caspofungin against Candida glabrata isolates determined by time-kill, Etest, and disk diffusion methods. Antimicrob. Agents Chemother. 2010, 54, 2244–2247. [Google Scholar] [CrossRef] [PubMed]


| Solution | HPβCD % (w/v) | Polymer % (w/v) |
|---|---|---|
| I | 20 | - |
| II | 20 | 0.5% PVA |
| III | 20 | 1% PVA |
| IV | 20 | 0.4% HA |
| V | 20 | 0.1% P407 |
| VI | 20 | 0.5% MC |
| Formulation | Composition |
|---|---|
| SV | 40% (w/v) HPβCD + 1% (w/v) voriconazole |
| SN | 40% HPβCD + 0.7% (w/v) natamycin |
| SNV | 40% HPβCD + 0.7% (w/v) natamycin + 1% (w/v) voriconazole |
| VFEND | Vfend® (1% (w/v) voriconazole + 16% (w/v) SBEβCD) |
| NTC | Natacyn® (5% (w/v) natamycin) |
| Inclusion Complex | R2h | K1:1 (M−1) * | CE (M) | S0 (M) | D:CD (mol:mol) |
|---|---|---|---|---|---|
| Natamycin/HPβCD | 0.9717 | 1102.32 ± 89.09 | 0.061 | 5.50·10−5 ± 2.06·10−5 | 1:17.50 |
| Natamycin/HPγCD | 0.9943 | 891.08 ± 26.39 | 0.049 | 5.50·10−5 ± 2.06·10−5 | 1:21.41 |
| HPβCD and Polymers Solutions | Natamycin Concentration (mg/mL) |
|---|---|
| 20% HPβCD | 5.151 ± 0.206 |
| 20% HPβCD + 0.5% PVA | 5.740 ± 0.867 |
| 20% HPβCD + 1% PVA | 5.117 ± 0.484 |
| 20% HPβCD + 0.4% AH | 4.625 ± 0.464 |
| 20% HPβCD + 0.1% P407 | 4.222 ± 0.574 |
| 20% HPβCD + 0.5% MC | 4.181 ± 0.309 |
| Natamycin (mg/mL) | Voriconazole (mg/mL) | |
|---|---|---|
| 20% HPβCD (w/v) | 6.351 | 15.203 |
| 30% HPβCD (w/v) | 7.639 | 22.252 |
| 40% HPβCD (w/v) | 8.372 | 29.301 |
| Formulation | pH | Osmolality (mOsm/kg) | Viscosity (mPa·s) |
|---|---|---|---|
| SNV | 6.10 ± 0.16 | 304 ± 3.46 | 9.853 ± 0.326 |
| AHNV | 6.34 ± 0.08 | 344 ± 3.46 | 265.5 ± 37.56 |
| LNV | 7.09 ± 0.02 | 500 ± 3.46 | 54.29 ± 2.880 |
| Formulation | Papp (cm/s) | SE⋯10−7 | Flux (µg/min) | SE | R2 | n |
|---|---|---|---|---|---|---|
| SNV Natamycin | 1.398·10−6 | 0.8663·10−7 | 0.293 | 0.018 | 0.981 | 0.163 |
| HAV Natamycin | 1.010·10−6 | 0.5985·10−7 | 0.212 | 0.012 | 0.965 | 0.194 |
| LNV Natamycin | 1.810·10−6 | 0.8780·10−7 | 0.380 | 0.018 | 0.998 | 0.053 |
| Natacyn® | 0.050·10−6 | 0.0612·10−7 | 0.075 | 0.009 | 0.971 | 0.629 |
| SNV Voriconazole | 4.52·10−6 | 2.722·10−7 | 1.358 | 0.081 | 0.981 | 0.163 |
| HANV Voriconazole | 3.110·10−6 | 1.800·10−7 | 0.931 | 0.053 | 0.982 | 0.160 |
| LNV Voriconazole | 4.145·10−6 | 1.606·10−7 | 1.243 | 0.048 | 0.998 | 0.064 |
| Formulations | K (Min−1) | t1/2 (Min) | AUC 0∞ (% × Min) | MRT (Min) | R2 | Remaining Formulation at 75 Min (%) | |||||
|---|---|---|---|---|---|---|---|---|---|---|---|
| Mean | SD | Mean | SD | Mean | SD | Mean | SD | Mean | SD | ||
| SNV | 0.010 | 0.007 | 12.02 | 2.23 | 46.77 | 8.19 | 68.47 | 4.45 | 0.96 | 15.42 | 6.107 |
| AHNV | 0.009 | 0.005 | 15.74 | 1.62 | 60.93 | 23.72 | 70.26 | 20.99 | 0.98 | 22.53 | 11.27 |
| LNV | 0.011 | 0.001 | 16.94 | 3.80 | 43.13 | 4.22 | 53.41 | 4.67 | 0.93 | 21.85 | 8.77 |
| Fungal Specie | C.A 90231 | C.A 90028 | AF | PL | FS |
|---|---|---|---|---|---|
| Formulation | |||||
| SV | 72 | 58 | 81 | 68 | 85 |
| SN | 33–35 | 32 | 28 | 0 | 47 |
| SNV | 74–76 | 62 | 72 | 80 | 77 |
| VFEND® | 61 | 61 | 87 | 84 | 103 |
| NTC® | 10 | 14 | 12 | 0 | 26 |
Disclaimer/Publisher’s Note: The statements, opinions and data contained in all publications are solely those of the individual author(s) and contributor(s) and not of MDPI and/or the editor(s). MDPI and/or the editor(s) disclaim responsibility for any injury to people or property resulting from any ideas, methods, instructions or products referred to in the content. |
© 2022 by the authors. Licensee MDPI, Basel, Switzerland. This article is an open access article distributed under the terms and conditions of the Creative Commons Attribution (CC BY) license (https://creativecommons.org/licenses/by/4.0/).
Share and Cite
Díaz-Tomé, V.; Bendicho-Lavilla, C.; García-Otero, X.; Varela-Fernández, R.; Martín-Pastor, M.; Llovo-Taboada, J.; Alonso-Alonso, P.; Aguiar, P.; González-Barcia, M.; Fernández-Ferreiro, A.; et al. Antifungal Combination Eye Drops for Fungal Keratitis Treatment. Pharmaceutics 2023, 15, 35. https://doi.org/10.3390/pharmaceutics15010035
Díaz-Tomé V, Bendicho-Lavilla C, García-Otero X, Varela-Fernández R, Martín-Pastor M, Llovo-Taboada J, Alonso-Alonso P, Aguiar P, González-Barcia M, Fernández-Ferreiro A, et al. Antifungal Combination Eye Drops for Fungal Keratitis Treatment. Pharmaceutics. 2023; 15(1):35. https://doi.org/10.3390/pharmaceutics15010035
Chicago/Turabian StyleDíaz-Tomé, Victoria, Carlos Bendicho-Lavilla, Xurxo García-Otero, Rubén Varela-Fernández, Manuel Martín-Pastor, José Llovo-Taboada, Pilar Alonso-Alonso, Pablo Aguiar, Miguel González-Barcia, Anxo Fernández-Ferreiro, and et al. 2023. "Antifungal Combination Eye Drops for Fungal Keratitis Treatment" Pharmaceutics 15, no. 1: 35. https://doi.org/10.3390/pharmaceutics15010035