
Development and Characterization of Novel In-Situ-Forming Oleogels


Abstract
:
1. Introduction
2. Materials and Methods
2.1. Materials
2.2. Pretests
2.3. Sample Preparation
2.4. Preparation Methods
- (a)
- Organogel: The 12-HSA and matrix were weighed, heated, and mixed (ethanol and NMP-free systems);
- (b)
- Melted ISFO: The 12-HSA and the solvent were weighed, heated, mixed, and cooled to room temperature. Polytetrafluoroethylene septa were added to the lids to prevent evaporation. The liquid lipid matrix was added and the entire formulation was mixed;
- (c)
- Cryomilled ISFO: The 12-HSA flakes were cryomilled using a cryogenic mill (Cryomill, Retsch, Haan Germany). After precooling for 3 min at 1 Hz, the 12-HSA was cryomilled in three cycles for 1.5 min each at 30 Hz with intermediate pauses for 1 min each at 5 Hz. The cryomilled 12-HSA and solvent were weighed and mixed, the liquid lipid was added, and the final formulation was mixed again.
2.5. Preparation of the Wafers
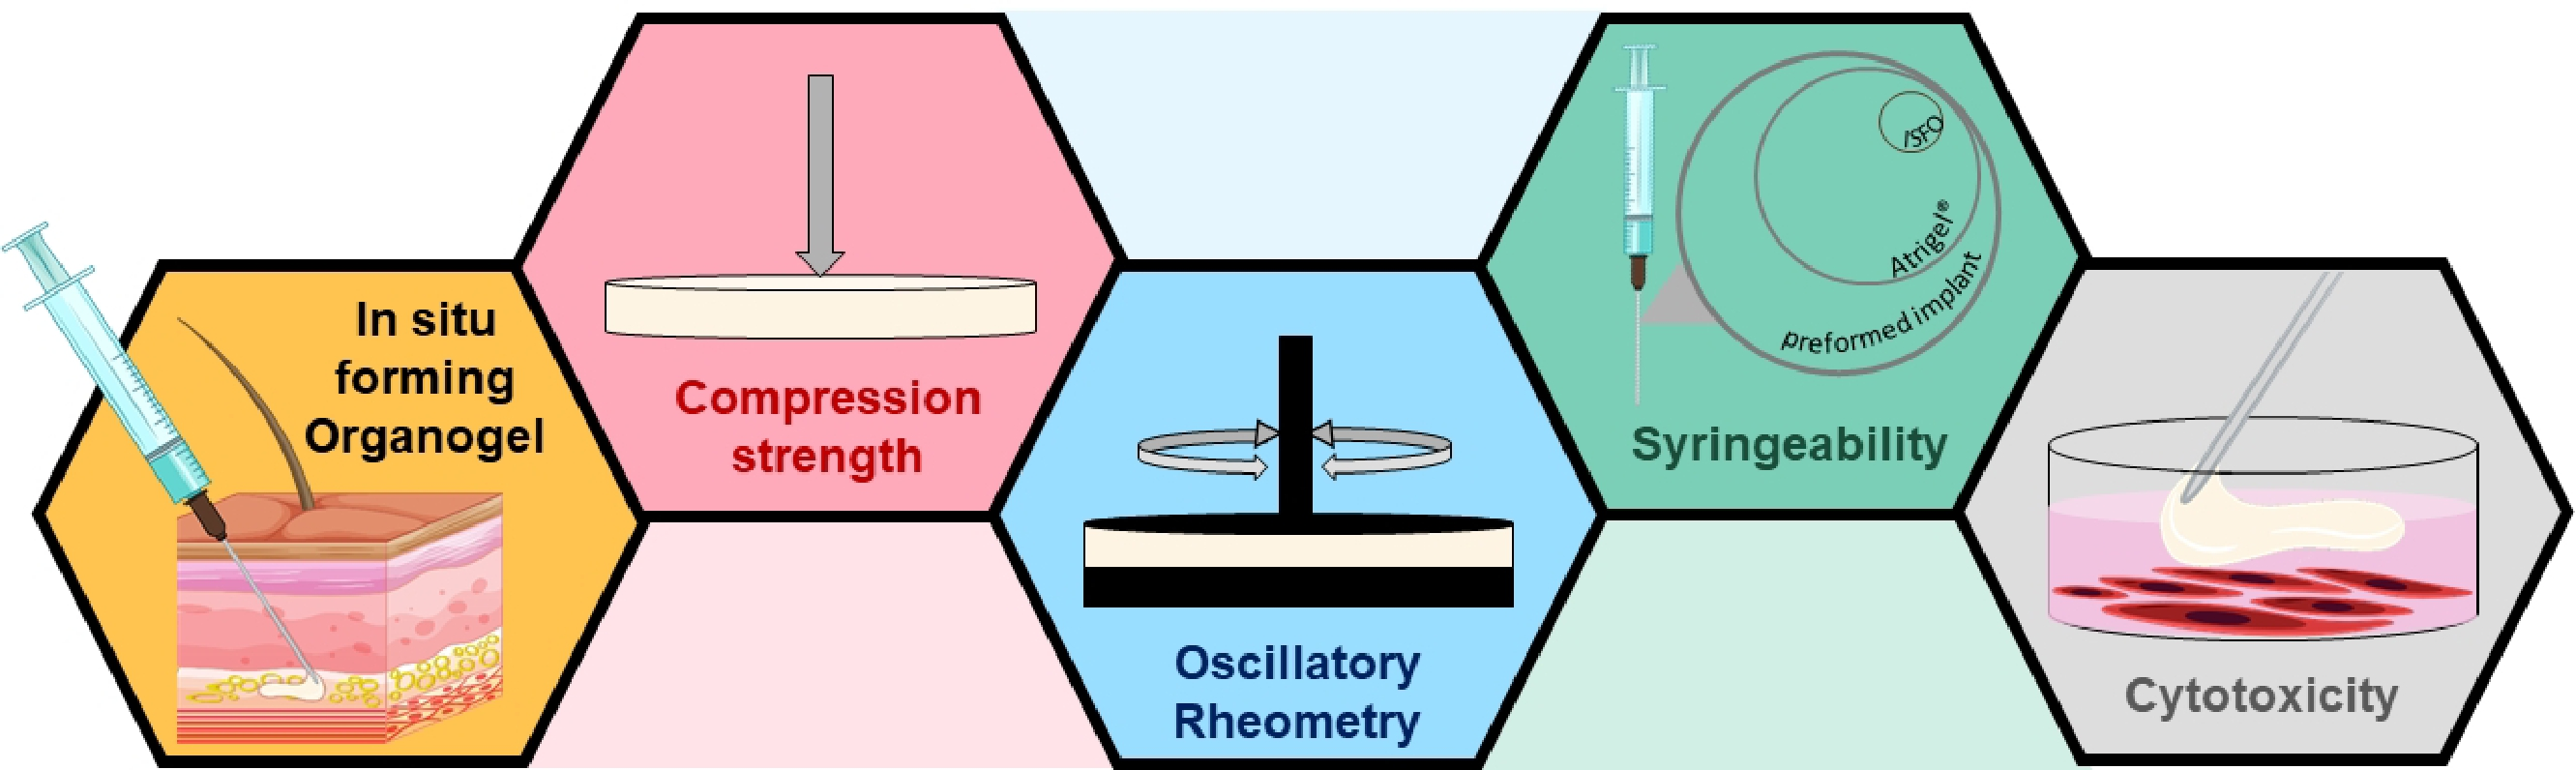
2.6. Characterization of the Solid Gel Wafer
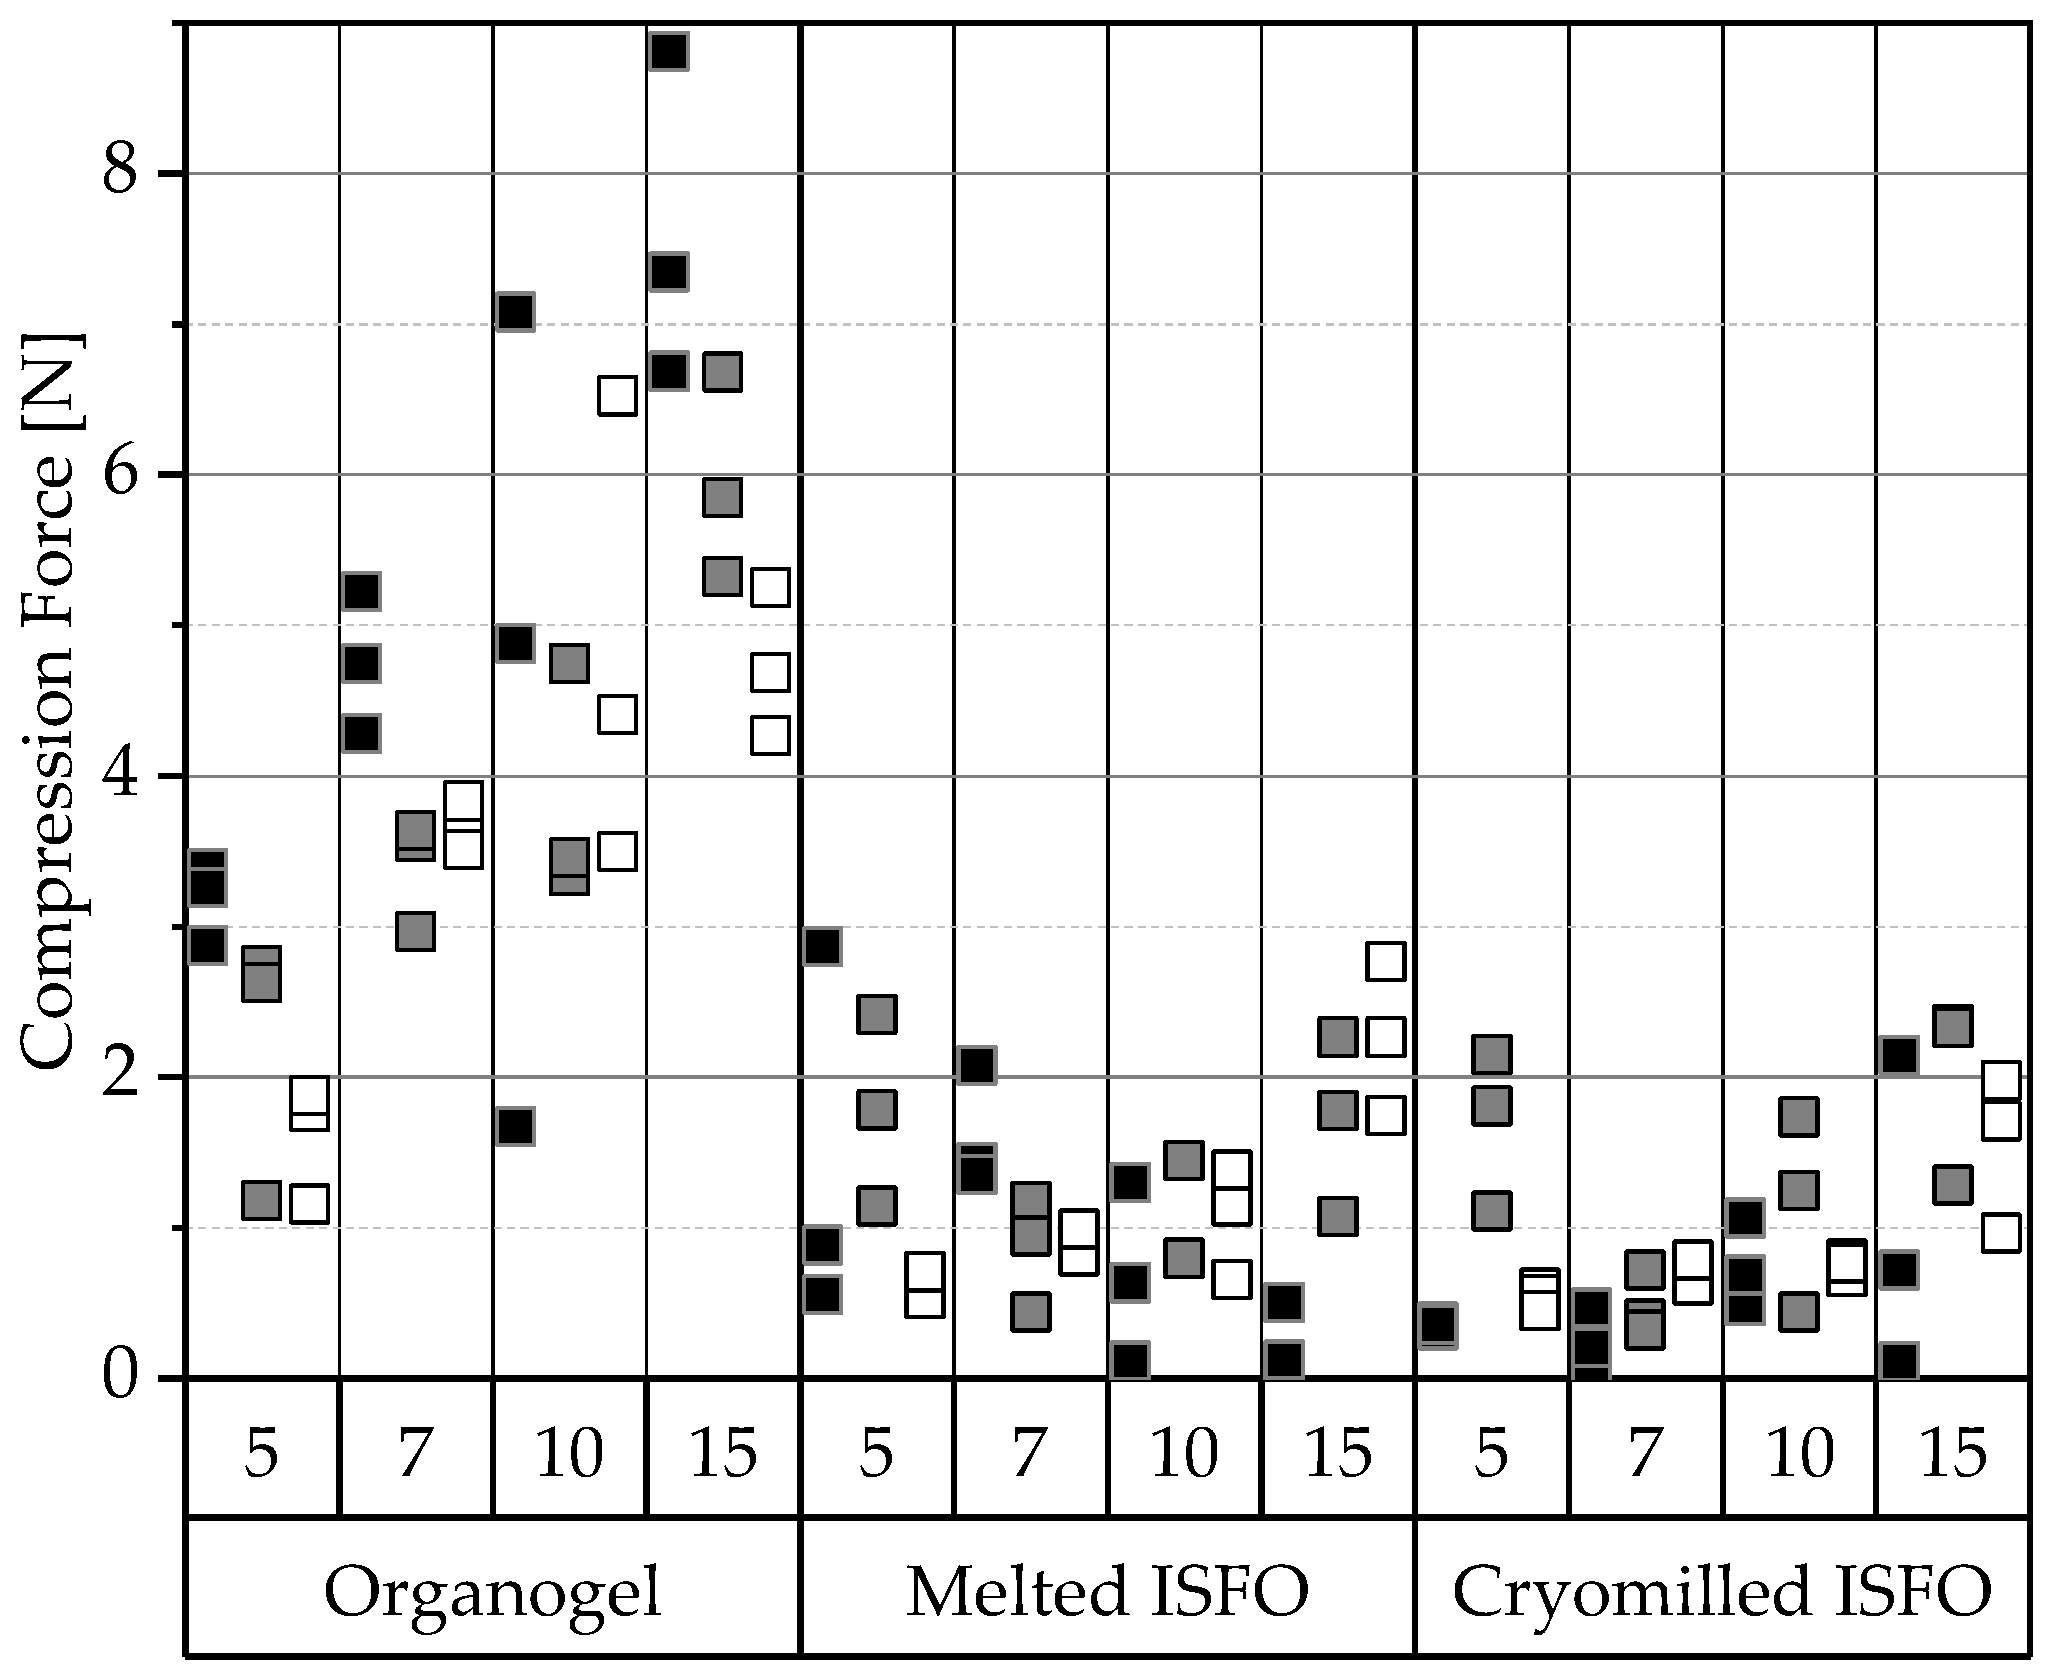
2.6.1. Compression of Gel Wafers
2.6.2. Oscillatory Rheometry
2.7. Characterization of the Solution
2.8. Syringeability
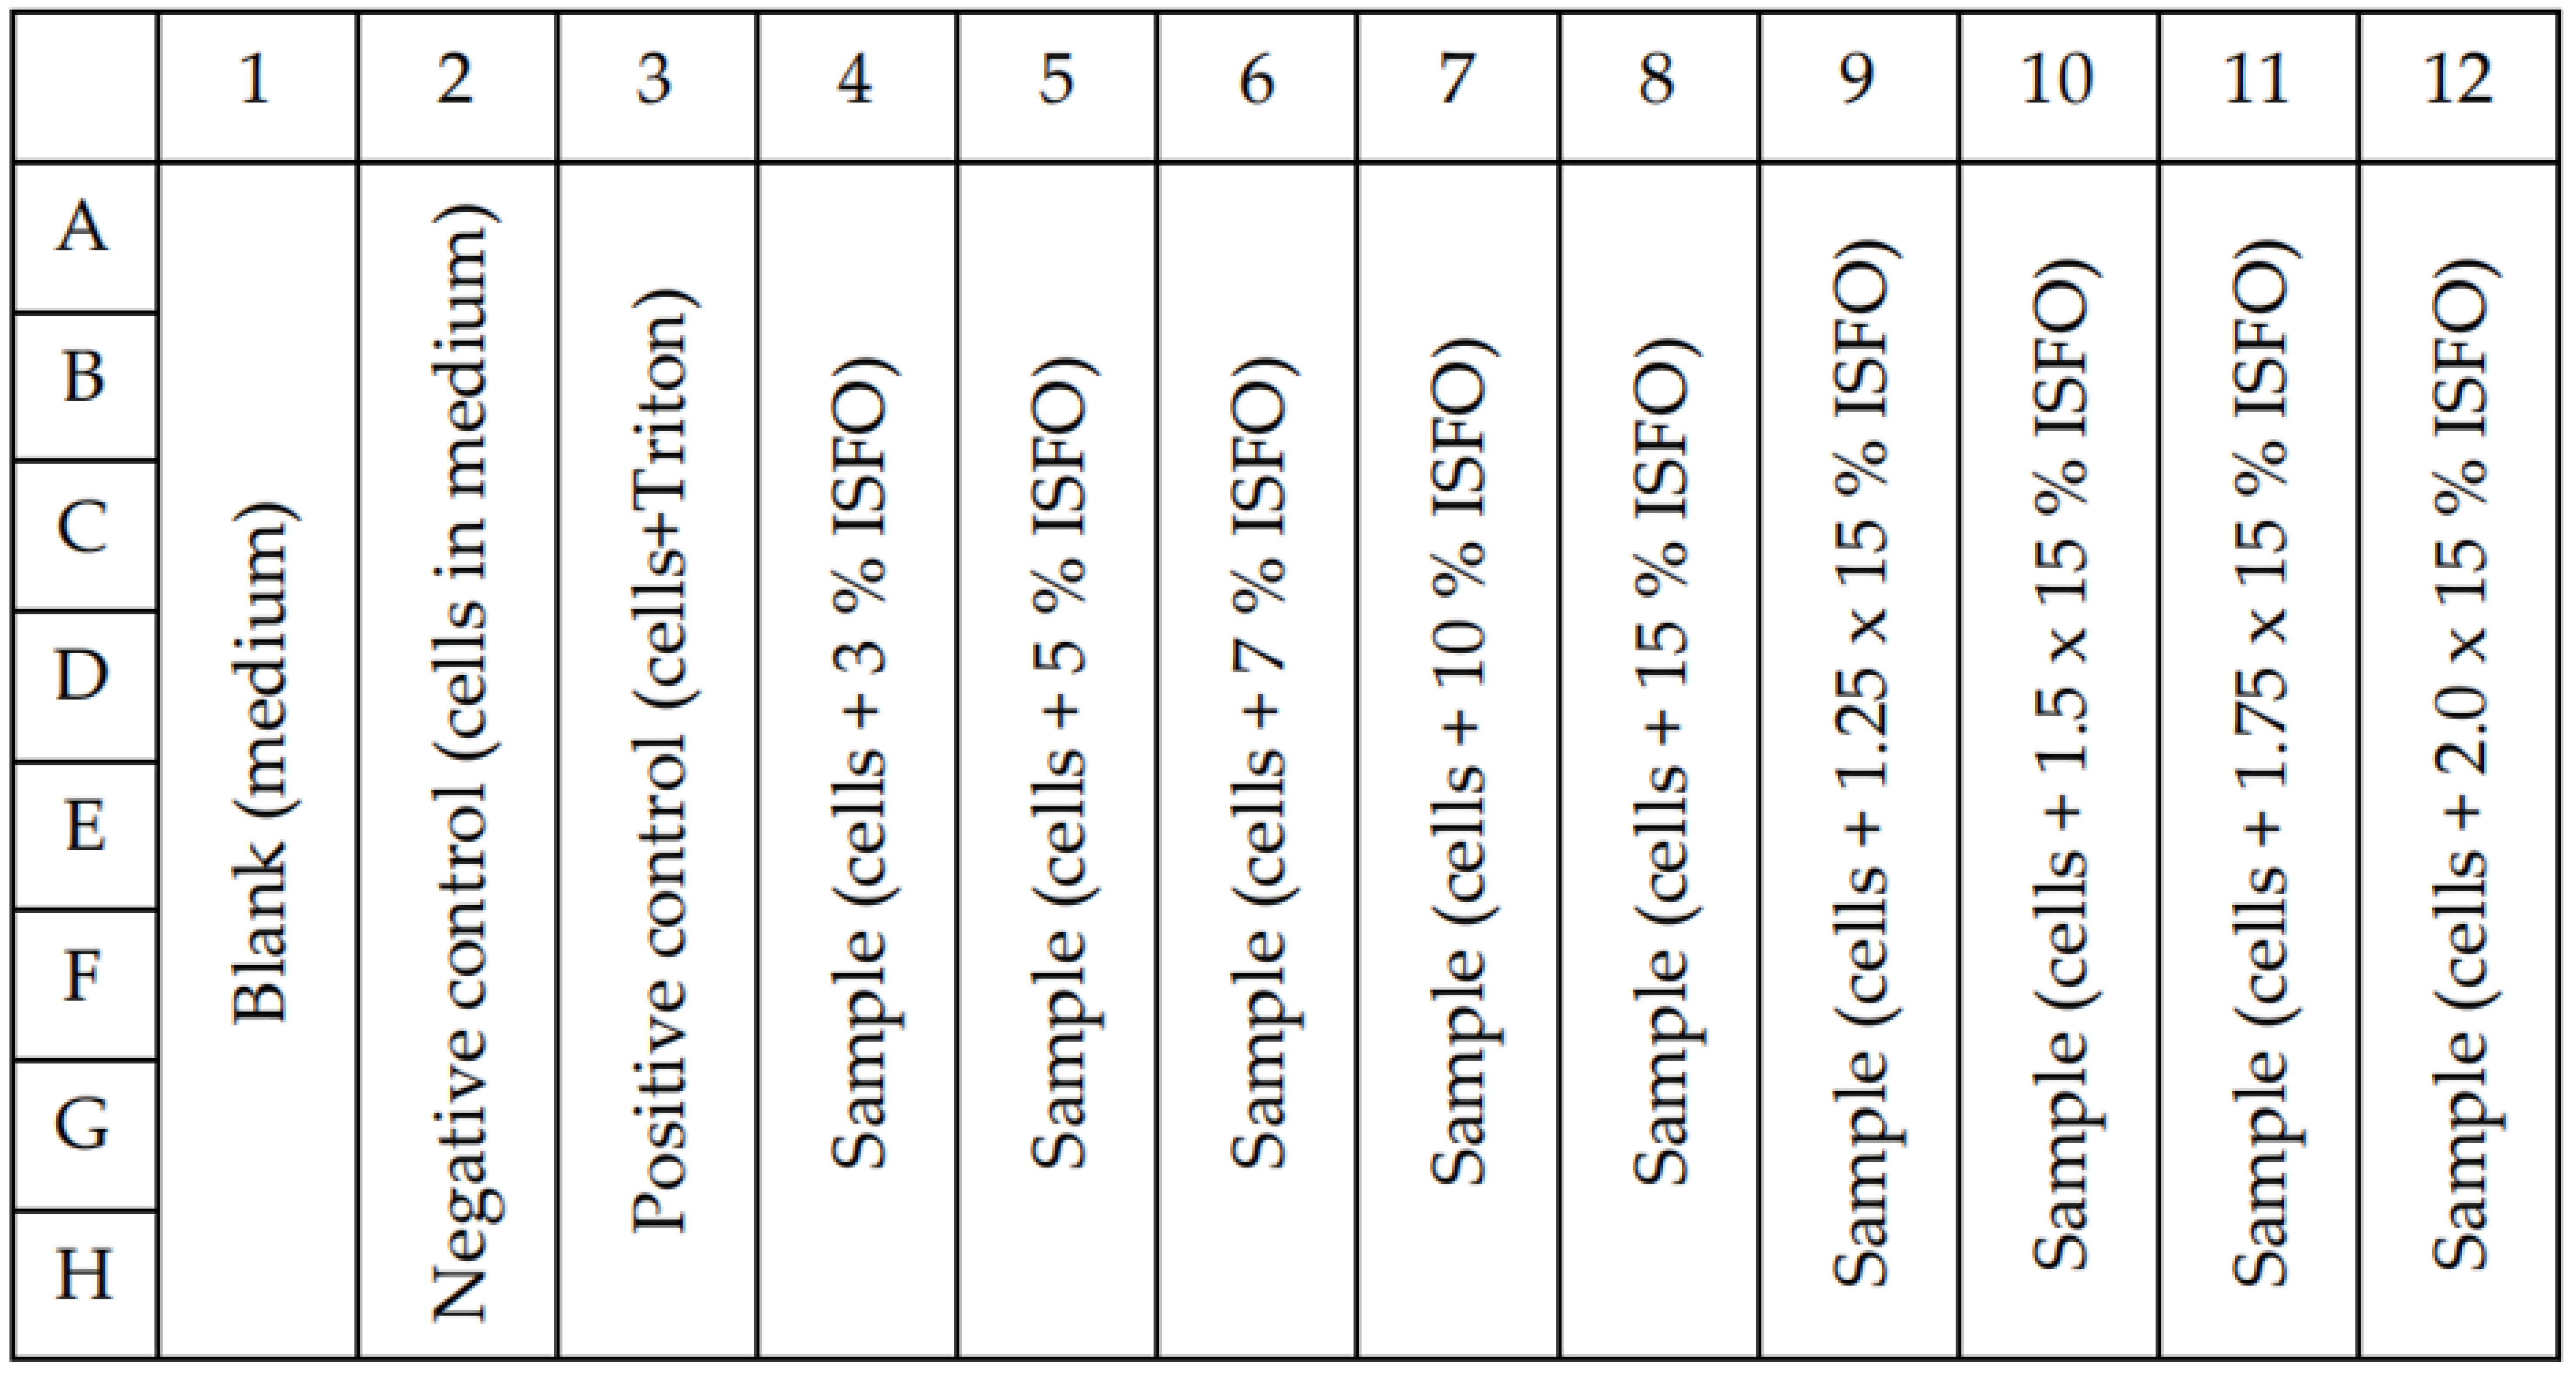
2.9. Cytotoxicity Studies
3. Results
3.1. Pretests
3.2. Characterization of the Solid Gel Wafer
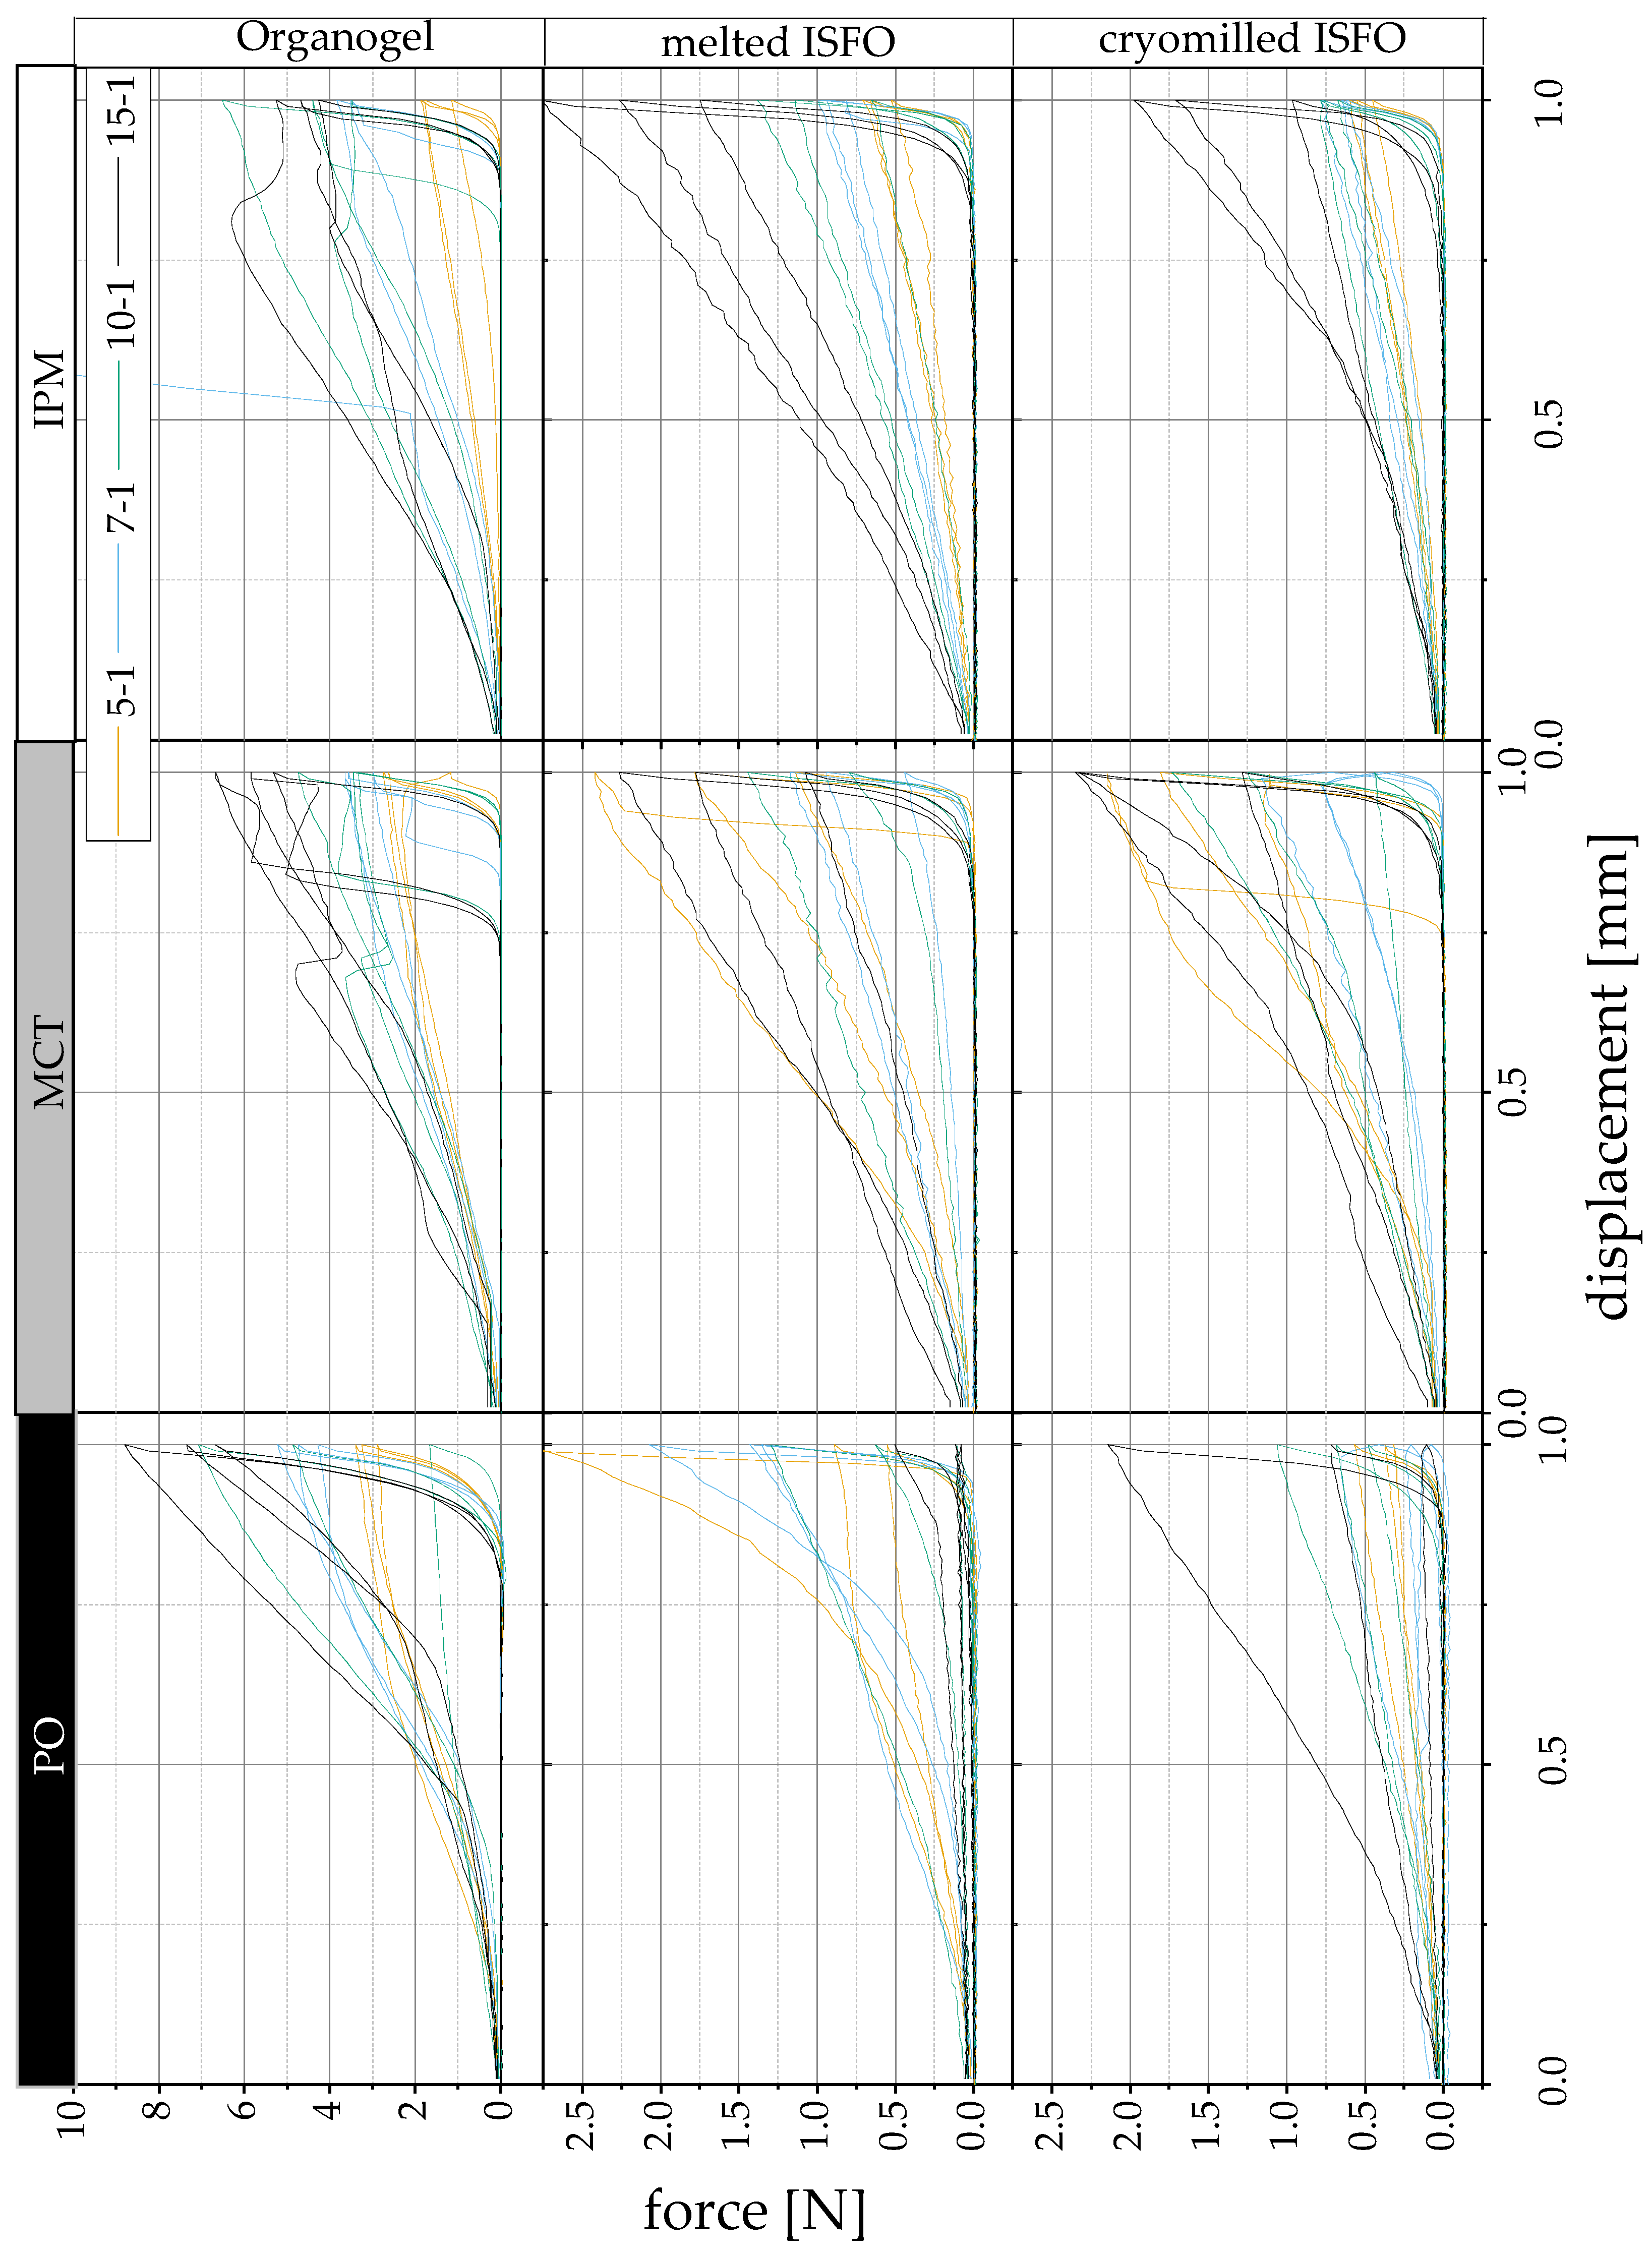
3.2.1. Compression of Gel Wafers
3.2.2. Oscillatory Rheology
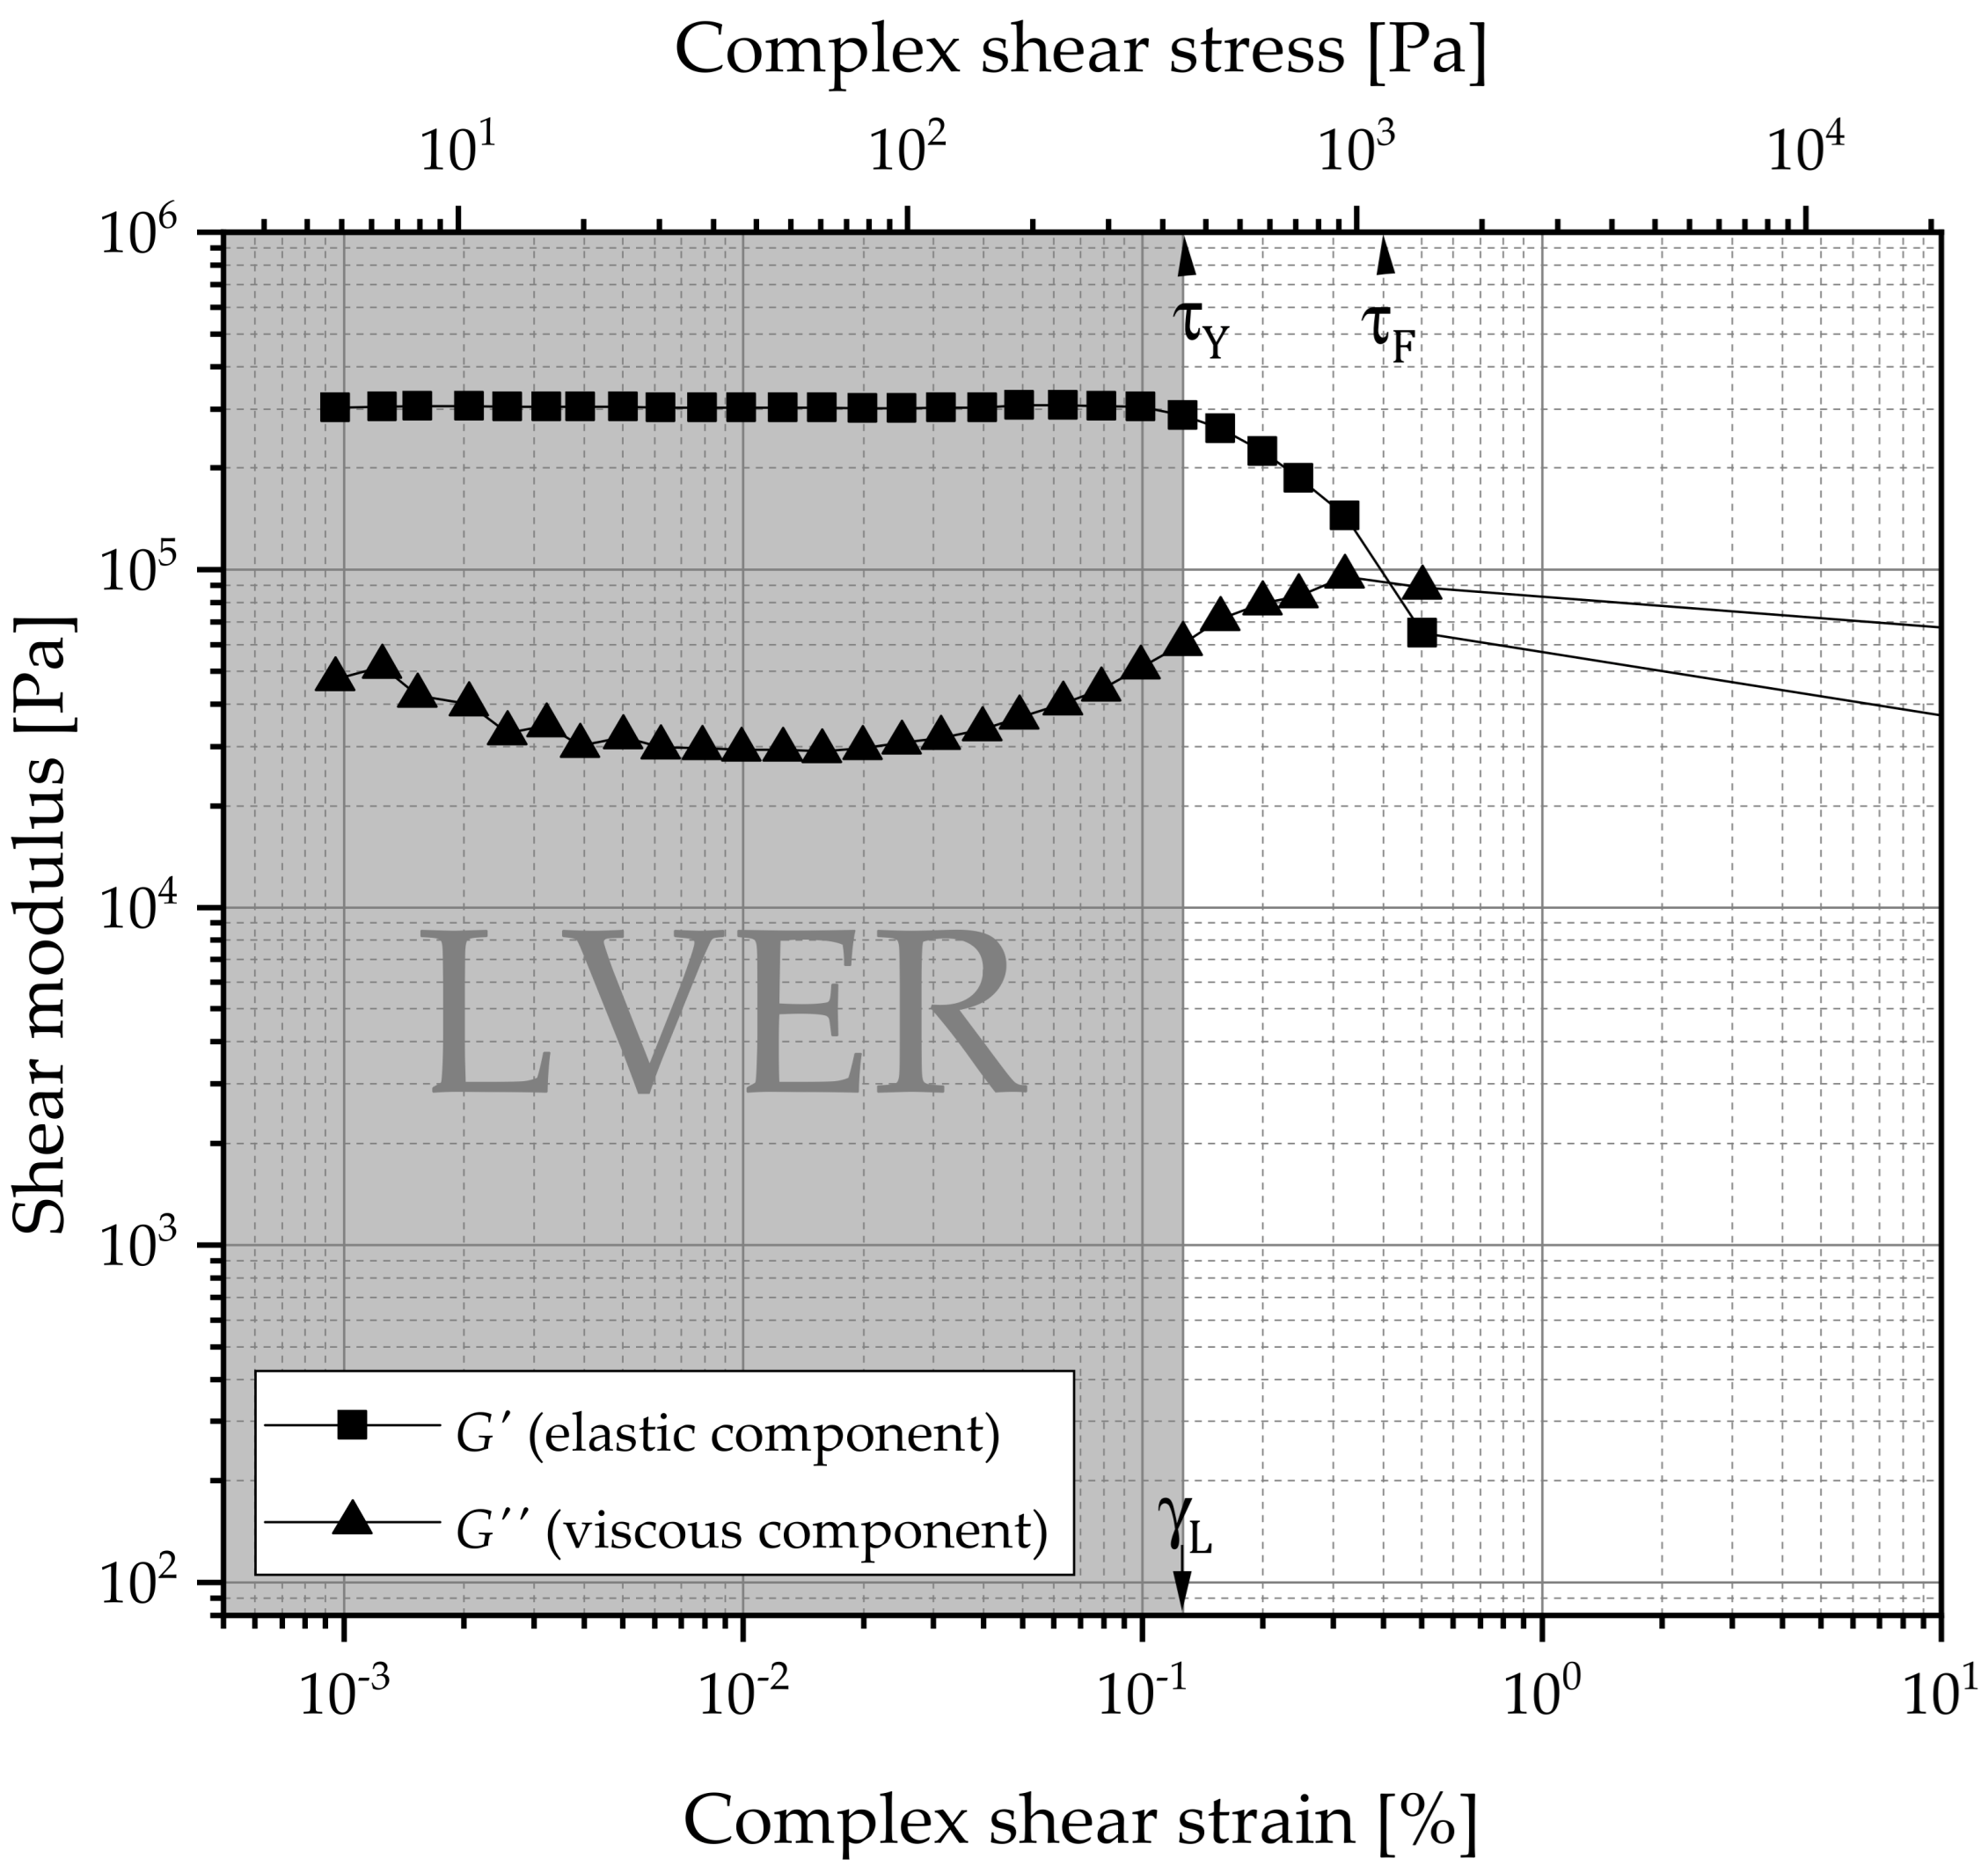
Amplitude Sweep
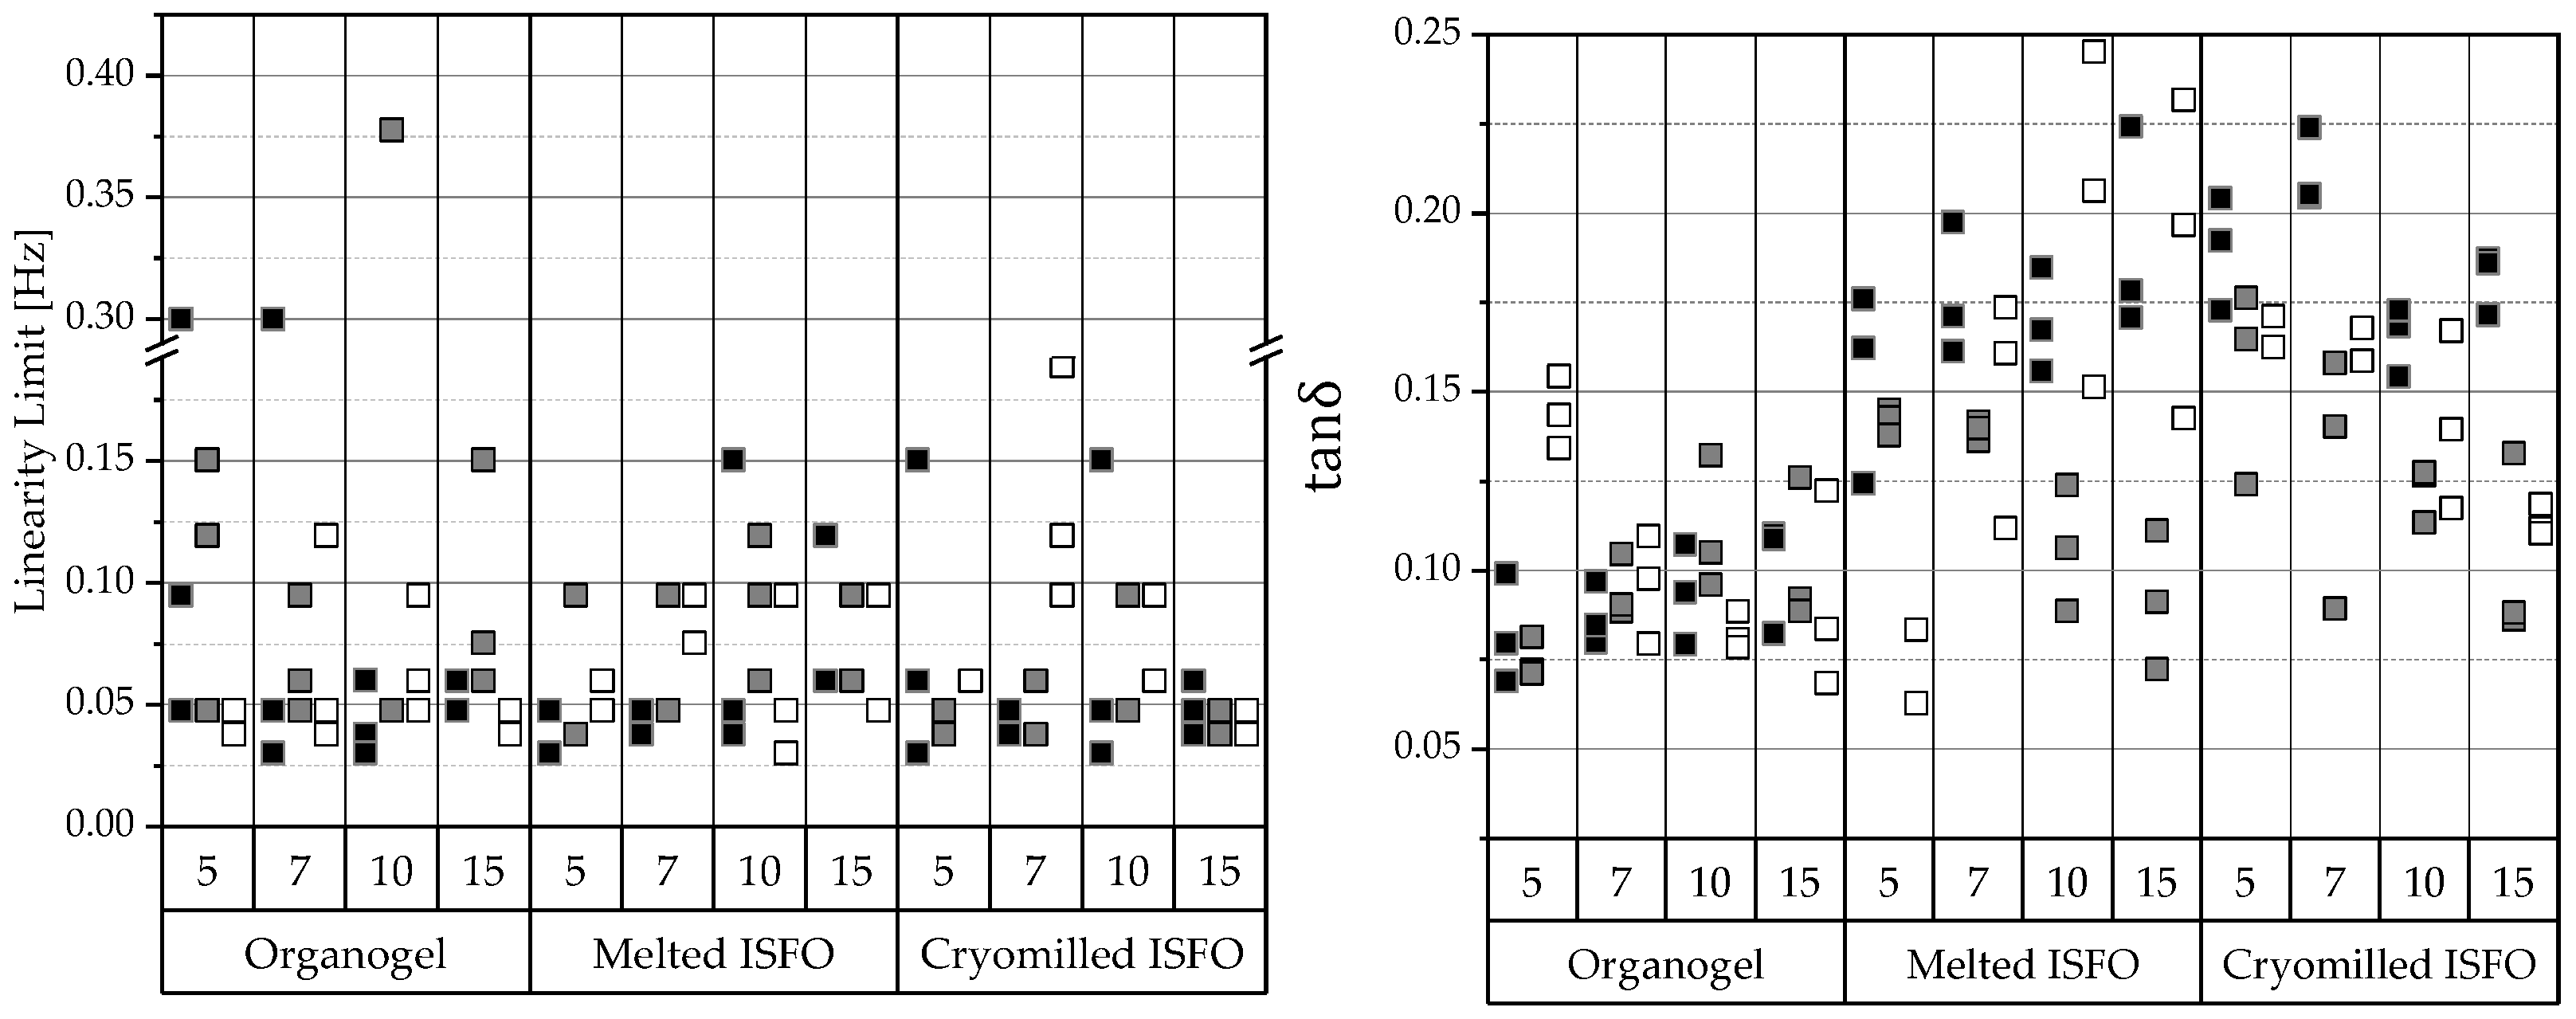
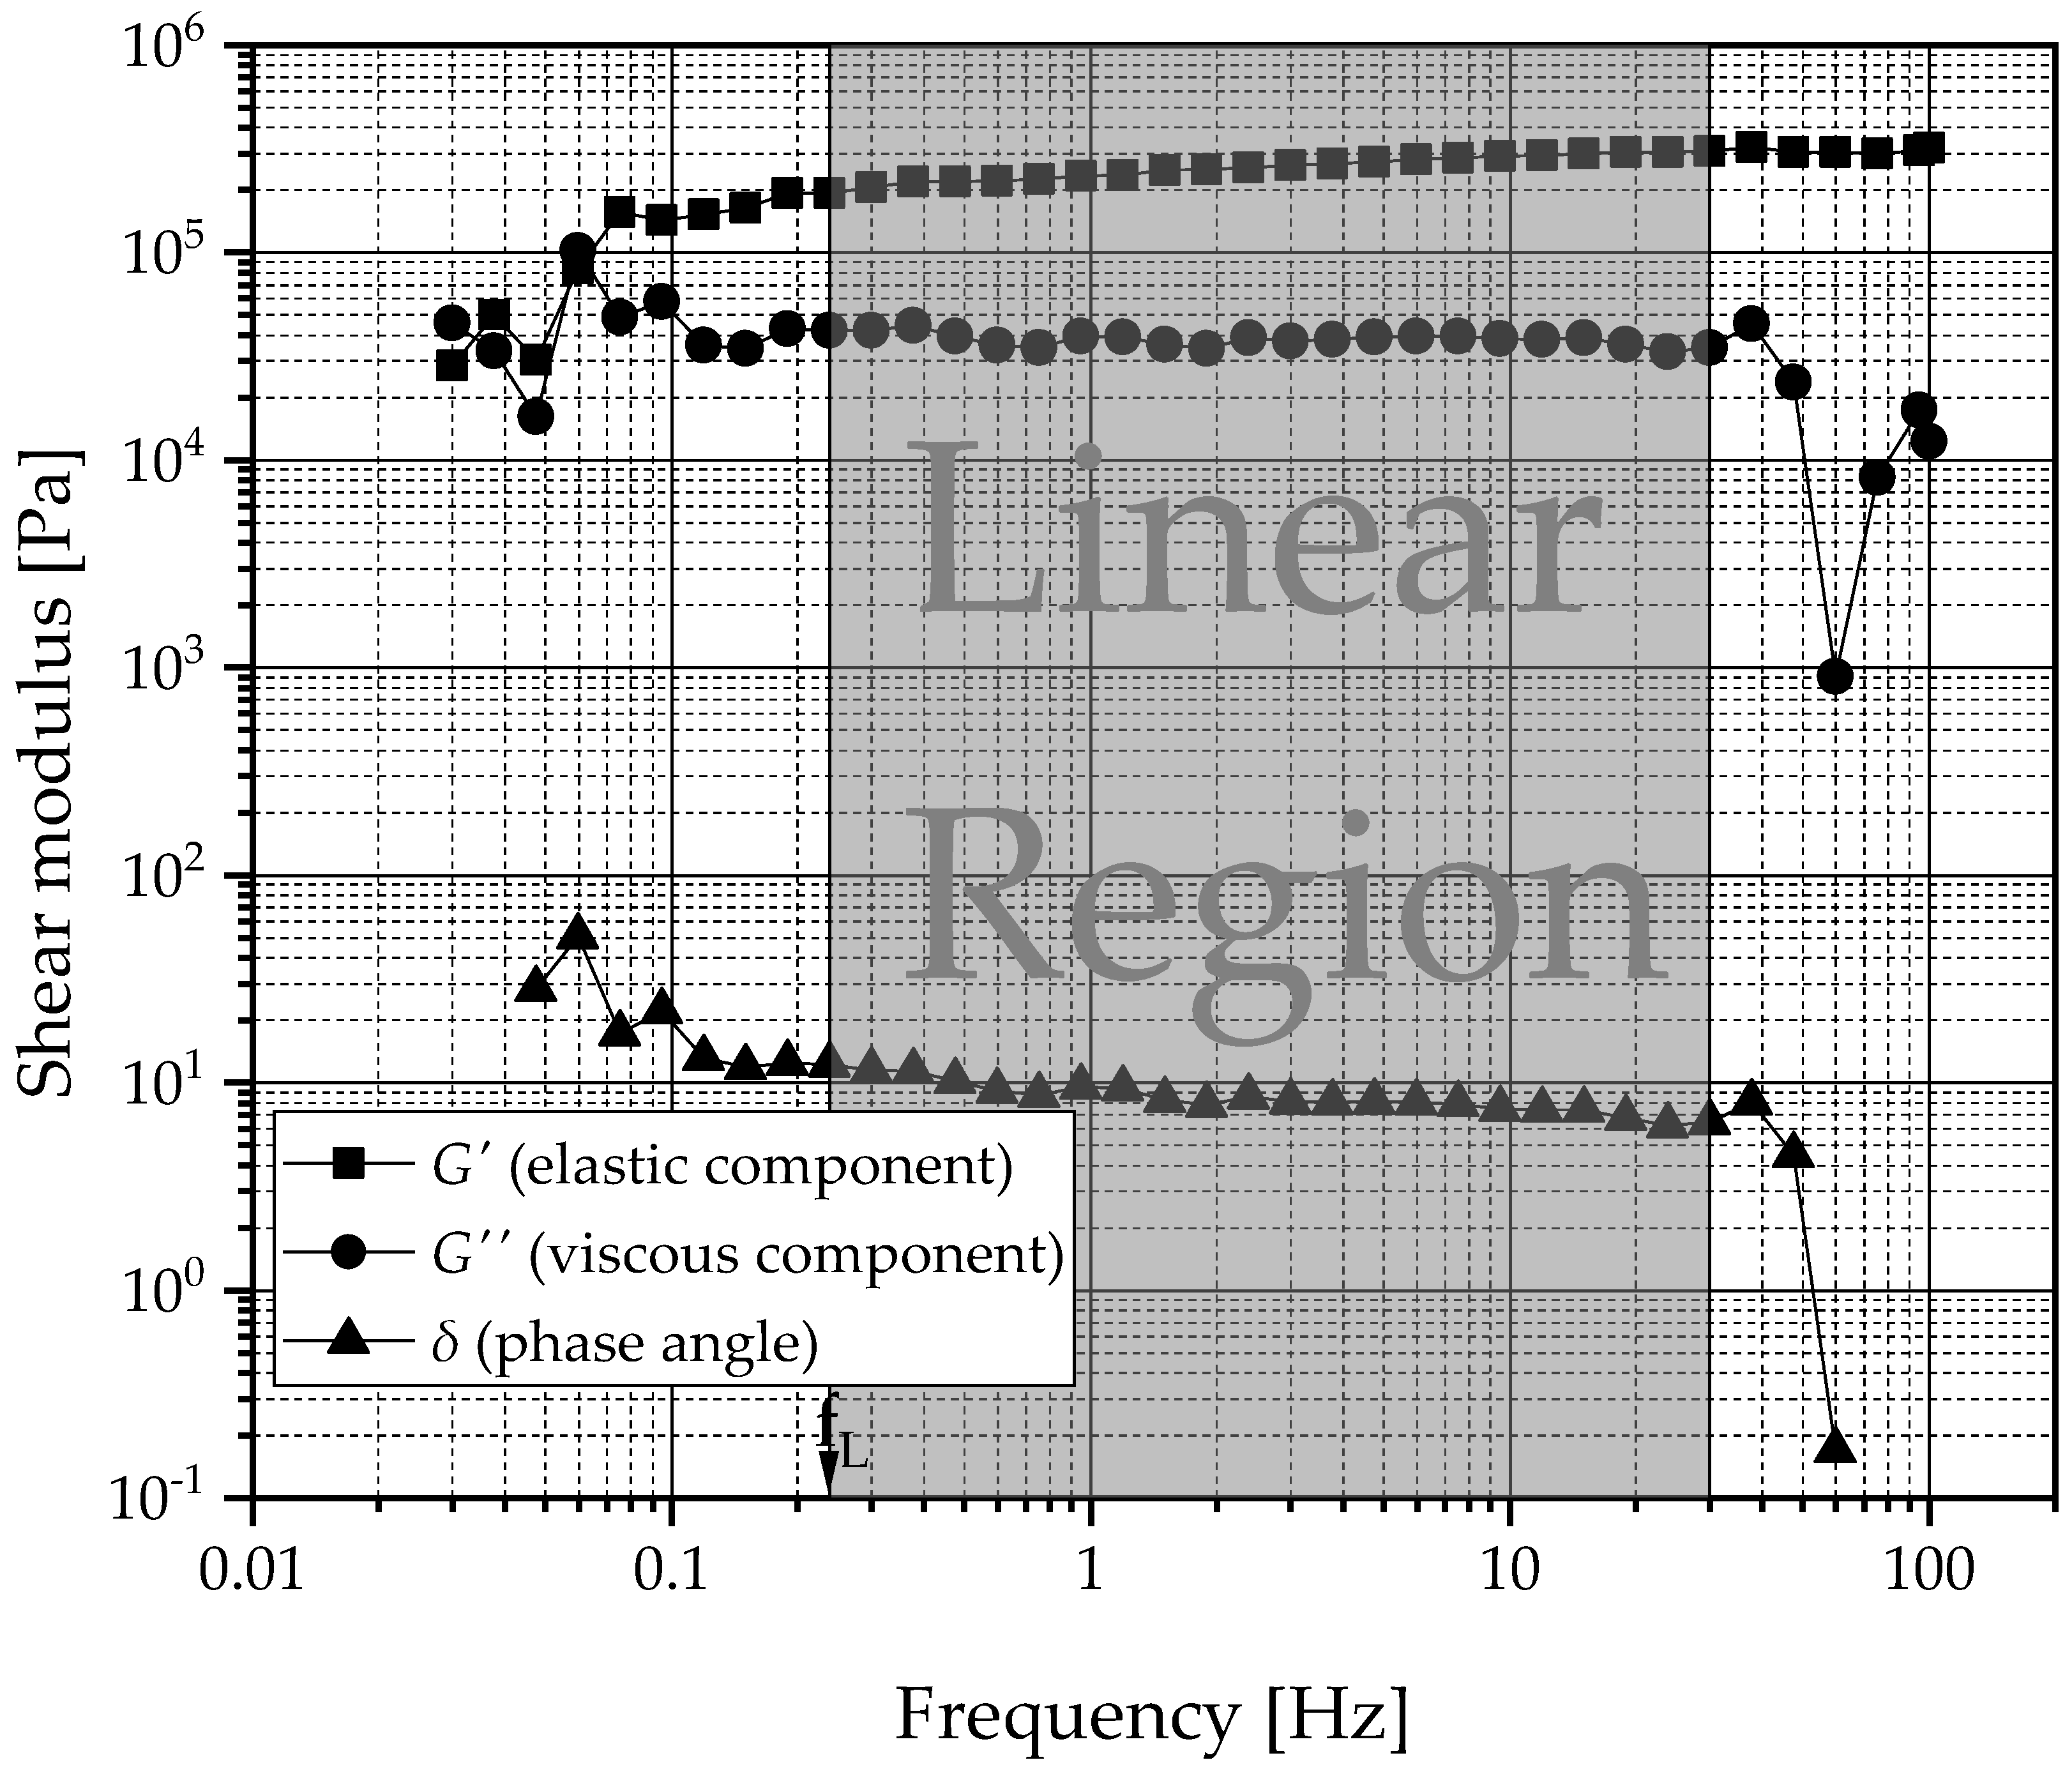
Frequency Sweep
3.3. Characterization of the Solution
3.3.1. Syringeability
3.3.2. Cytotoxicity Studies
4. Discussion
- Avoidance of highly acidic degradation products;
- Lower amounts of organic solvents required;
- Low toxicity;
- Low injection forces involved even with small needle sizes (28 G).
Author Contributions
Funding
Institutional Review Board Statement
Informed Consent Statement
Data Availability Statement
Acknowledgments
Conflicts of Interest
Appendix A

| Initial 12-HSA-conc. [%] 1 | Final 12-HSA-conc. [%] 2 | Liquid Lipid | Solvent | Preparation Method | |
|---|---|---|---|---|---|
| 5-PO-organogel | 5 | 5 | PO | NMP | Organogel |
| 7-PO-organogel | 7 | 7 | PO | NMP | Organogel |
| 10-PO-organogel | 10 | 10 | PO | NMP | Organogel |
| 15-PO-organogel | 15 | 15 | PO | NMP | Organogel |
| melted 5-PO-ISFO | 4.5 | 5 | PO | NMP | melted ISFO |
| melted 7-PO-ISFO | 6.0 | 7 | PO | NMP | melted ISFO |
| melted 10-PO-ISFO | 8.1 | 10 | PO | NMP | melted ISFO |
| melted 15-PO-ISFO | 11.2 | 15 | PO | NMP | melted ISFO |
| cryomilled 5-PO-ISFO | 4.5 | 5 | PO | NMP | cryomilled ISFO |
| cryomilled 7-PO-ISFO | 6.0 | 7 | PO | NMP | cryomilled ISFO |
| cryomilled 10-PO-ISFO | 8.1 | 10 | PO | NMP | cryomilled ISFO |
| cryomilled 15-PO-ISFO | 11.2 | 15 | PO | NMP | cryomilled ISFO |
| 5-MCT-organogel | 5 | 5 | MCT | ethanol | Organogel |
| 7-MCT-organogel | 7 | 7 | MCT | ethanol | Organogel |
| 10-MCT-organogel | 10 | 10 | MCT | ethanol | Organogel |
| 15-MCT-organogel | 15 | 15 | MCT | ethanol | Organogel |
| melted 5-MCT-ISFO | 4.4 | 5 | MCT | ethanol | melted ISFO |
| melted 7-MCT-ISFO | 5.9 | 7 | MCT | ethanol | melted ISFO |
| melted 10-MCT-ISFO | 7.8 | 10 | MCT | ethanol | melted ISFO |
| melted 15-MCT-ISFO | 10.6 | 15 | MCT | ethanol | melted ISFO |
| cryomilled 5-MCT-ISFO | 4.4 | 5 | MCT | ethanol | cryomilled ISFO |
| cryomilled 7-MCT-ISFO | 5.9 | 7 | MCT | ethanol | cryomilled ISFO |
| cryomilled 10-MCT-ISFO | 7.8 | 10 | MCT | ethanol | cryomilled ISFO |
| cryomilled 15-MCT-ISFO | 10.6 | 15 | MCT | ethanol | cryomilled ISFO |
| 5-IPM-organogel | 5 | 5 | IPM | ethanol | Organogel |
| 7-IPM-organogel | 7 | 7 | IPM | ethanol | Organogel |
| 10-IPM-organogel | 10 | 10 | IPM | ethanol | Organogel |
| 15-IPM-organogel | 15 | 15 | IPM | ethanol | Organogel |
| melted 5-IPM-ISFO | 4.4 | 5 | IPM | ethanol | melted ISFO |
| melted 7-IPM-ISFO | 5.9 | 7 | IPM | ethanol | melted ISFO |
| melted 10-IPM-ISFO | 7.8 | 10 | IPM | ethanol | melted ISFO |
| melted 15-IPM-ISFO | 10.6 | 15 | IPM | ethanol | melted ISFO |
| cryomilled 5-IPM-ISFO | 4.4 | 5 | IPM | ethanol | cryomilled ISFO |
| cryomilled 7-IPM-ISFO | 5.9 | 7 | IPM | ethanol | cryomilled ISFO |
| cryomilled 10-IPM-ISFO | 7.8 | 10 | IPM | ethanol | cryomilled ISFO |
| cryomilled 15-IPM-ISFO | 10.6 | 15 | IPM | ethanol | cryomilled ISFO |


 , MCT
, MCT  , IPM
, IPM  ).
, MCT , IPM ).
).
, MCT , IPM ).
References
- Chaudhary, K.; Patel, M.M.; Mehta, P.J. Long-acting injectables: Current perspectives and future promise. Crit. Rev. Ther. Drug Carrier Syst. 2019, 36, 137–181. [Google Scholar] [CrossRef] [PubMed]
- Ringe, J.D.; Farahmand, P. Improved real-life adherence of 6-monthly denosumab injections due to positive feedback based on rapid 6-month BMD increase and good safety profile. Rheumatol. Int. 2014, 34, 727–732. [Google Scholar] [CrossRef]
- Poulos, C.; Kinter, E.; Yang, J.C.; Bridges, J.F.P.; Posner, J.; Reder, A.T. Patient Preferences for Injectable Treatments for Multiple Sclerosis in the United States: A Discrete-Choice Experiment. Patient 2016, 9, 171–180. [Google Scholar] [CrossRef] [Green Version]
- Sabaté, E.; World Health Organization. Adherence to Long-Term Therapies: Evidence for Action; World Health Organization: Geneva, Switzerland, 2003; ISBN 9241545992. [Google Scholar]
- Esfahani, G.; Häusler, O.; Mäder, K. Controlled release starch-lipid implant for the therapy of severe malaria. Int. J. Pharm. 2022, 622, 121879. [Google Scholar] [CrossRef]
- Althobaiti, A.A.; Ashour, E.A.; Almutairi, M.; Almotairy, A.; Al Yahya, M.; Repka, M.A. Formulation Development of Curcumin-piperine solid dispersion via hot-melt extrusion. J. Drug Deliv. Sci. Technol. 2022, 76, 103753. [Google Scholar] [CrossRef]
- Steiner, J.; Alaneed, R.; Kressler, J.; Mäder, K. Fatty acid-modified poly(glycerol adipate) microparticles for controlled drug delivery. J. Drug Deliv. Sci. Technol. 2020, 61, 102206. [Google Scholar] [CrossRef]
- Sivasankaran, S.; Jonnalagadda, S. Levonorgestrel loaded biodegradable microparticles for injectable contraception: Preparation, characterization and modelling of drug release. Int. J. Pharm. 2022, 624, 121994. [Google Scholar] [CrossRef]
- Thakur, R.R.S.; McMillan, H.L.; Jones, D.S. Solvent induced phase inversion-based in situ forming controlled release drug delivery implants. J. Control. Release 2014, 176, 8–23. [Google Scholar] [CrossRef] [PubMed]
- Hui, J.; Wong, M.; Pei, R.; Tan, T.; Chang, J.J.; Qi, B.; Chan, Y.; Zhao, X.; Jian, J.; Cheng, W.; et al. Injectable Hybrid-Crosslinked Hydrogels as Fatigue-Resistant and Shape-Stable Skin Depots. Biomacromolecules 2022, 23, 3698–3712. [Google Scholar] [CrossRef]
- Vintiloiu, A.; Lafleur, M.; Bastiat, G.; Leroux, J.C. In situ-forming oleogel implant for rivastigmine delivery. Pharm. Res. 2008, 25, 845–852. [Google Scholar] [CrossRef] [PubMed]
- Kempe, S.; Mäder, K. In situ forming implants—An attractive formulation principle for parenteral depot formulations. J. Control. Release 2012, 161, 668–679. [Google Scholar] [CrossRef] [PubMed]
- Mäder, K.; Gallez, B.; Liu, K.J.; Swartz, H.M. Non-invasive in vivo characterization of release processes in biodegradable polymers by low-frequency electron paramagnetic resonance spectroscopy. Biomaterials 1996, 17, 457–461. [Google Scholar] [CrossRef] [PubMed]
- Fu, K.; Pack, D.W.; Klibanov, A.M.; Langer, R. Visual Evidence of Acidic Environment Within Degrading. Pharm. Res. 2000, 17, 100–106. [Google Scholar] [CrossRef]
- Zolnik, B.S.; Burgess, D.J. Effect of acidic pH on PLGA microsphere degradation and release. J. Control. Release 2007, 122, 338–344. [Google Scholar] [CrossRef]
- Houchin, M.L.; Topp, E.M. Chemical Degradation of Peptides and Proteins in PLGA: A Review of Reactions and Mechanisms; John Wiley and Sons Inc.: Hoboken, NJ, USA, 2008; Volume 97, pp. 2395–2404. [Google Scholar]
- Zlomke, C.; Barth, M.; Mäder, K. Polymer degradation induced drug precipitation in PLGA implants—Why less is sometimes more. Eur. J. Pharm. Biopharm. 2019, 139, 142–152. [Google Scholar] [CrossRef] [PubMed]
- Sax, G.; Kessler, B.; Wolf, E.; Winter, G. In-vivo biodegradation of extruded lipid implants in rabbits. J. Control. Release 2012, 163, 195–202. [Google Scholar] [CrossRef] [PubMed]
- Vollrath, M.; Engert, J.; Winter, G. Long-term release and stability of pharmaceutical proteins delivered from solid lipid implants. Eur. J. Pharm. Biopharm. 2017, 117, 244–255. [Google Scholar] [CrossRef]
- Mäder, K.; Windorf, M.; Kutza, J. Injectable Depot Formulations for the Controlled Release of Active Agents. WO2015062571A1, 29 October 2014. [Google Scholar]
- Esposito, C.L.; Kirilov, P.; Roullin, V.G. Organogels, promising drug delivery systems: An update of state-of-the-art and recent applications. J. Control. Release 2018, 271, 1–20. [Google Scholar] [CrossRef]
- Esposito, C.L.; Tardif, V.; Sarrazin, M.; Kirilov, P.; Roullin, V.G. Preparation and characterization of 12-HSA-based organogels as injectable implants for the controlled delivery of hydrophilic and lipophilic therapeutic agents. Mater. Sci. Eng. C 2020, 114, 110999. [Google Scholar] [CrossRef]
- Rahnfeld, L.; Luciani, P. Injectable Lipid-Based Depot Formulations: Where Do We Stand? Pharmaceutics 2020, 12, 567. [Google Scholar] [CrossRef]
- Zlomke, C.; Albrecht, J.; Mäder, K. Nicardipine Loaded Solid Phospholipid Extrudates for the Prevention of Cerebral Vasospasms: In Vitro Characterization. Pharmaceutics 2020, 12, 817. [Google Scholar] [CrossRef] [PubMed]
- Jouyban, A.; Fakhree, M.A.A.; Shayanfar, A. Review of pharmaceutical applications of N-methyl-2-pyrrolidone. J. Pharm. Pharm. Sci. 2010, 13, 524–535. [Google Scholar] [CrossRef] [PubMed] [Green Version]
- Rowe, R.C.; Sheskey, P.J.; Owen, S.C. Handbook of Pharmaceutical Excipients, 5th ed.; Pharmaceutical Press: London, UK; Grayslake, IL, USA; American Pharmacists Association: Washington, DC, USA, 2006. [Google Scholar]
- Meek, M.E.; Walker, M.; Beauchamp, R.; Canada, H. Concise International Chemical Assessment Document 35: N-Methyl-2-Pyrrolidone; World Health Organization: Geneva, Switzerland, 2001. [Google Scholar]
- Winchell, C.J.; Hertz, S.H. Summary Review: Sublocade® (Buprenorphine). Application Number: 209819Orig1s000; Center Drug Evaluation Research of the Food and Drug Administration: Silver Spring, MD, USA, 2017. [CrossRef] [Green Version]
- Strickley, R.G. Solubilizing Excipients in Oral and Injectable Formulations. Pharm. Res. 2004, 21, 201–230. [Google Scholar] [CrossRef] [PubMed]
- Tolmar Pharmaceuticals, Inc. Highlights of Prescribing Information—ELIGARD®; Tolmar Pharmaceuticals, Inc.: Fort Collins, CO, USA, 2018. [Google Scholar]
- Indivior UK Limited. Highlights of Prescribing Information—PerserisTM; Indivior UK Limited: Hull, UK, 2018. [Google Scholar]
- Indivior UK Limited. Highlights of Prescribing Information—SublocadeTM; Indivior UK Limited: Hull, UK, 2017. [Google Scholar]
- Jiang, Z.; Lu, X.; Geng, S.; Ma, H.; Liu, B. Structuring of sunflower oil by stearic acid derivatives: Experimental and molecular modelling studies. Food Chem. 2020, 324, 126801. [Google Scholar] [CrossRef]
- Gelderblom, H.; Verweij, J.; Nooter, K.; Sparreboom, A. Cremophor EL: The drawbacks and advantages of vehicle selection for drug formulation. Eur. J. Cancer 2001, 37, 1590–1598. [Google Scholar] [CrossRef]
- Europe, P.; Keyword, E.Y.; Print, E.; License, S.; Velagaleti, R. Solutol HS15 as a Novel Excipient Solutol HS15 as a Novel Excipient. Pharm. Technol. 2011, 1, 4–7. [Google Scholar]
- Windorf, M. 12-Hydroxystearic Acid-Based In Situ Forming Organogels: Development and Characterization; Institute of Pharmacy, Martin-Luther-University Halle-Wittenberg: Halle (Saale), Germany, 2017. [Google Scholar]
- Lampp, L.; Rogozhnikova, O.Y.; Trukhin, D.V.; Tormyshev, V.M.; Bowman, M.K.; Devasahayam, N.; Krishna, M.C.; Mäder, K.; Imming, P. A radical containing injectable in-situ-oleogel and emulgel for prolonged in-vivo oxygen measurements with CW EPR. Free Radic. Biol. Med. 2019, 130, 120–127. [Google Scholar] [CrossRef]
- Kaparthi, R.; Chari, K.S. Solubilities of vegetable oils in aqueous ethanol and ethanol-hexane mixtures. J. Am. Oil Chem. Soc. 1959, 36, 77–80. [Google Scholar] [CrossRef]
- Jeong, B.; Lee, D.S.; Shon, J.; Bae, Y.H.; Kim, S.W. Thermoreversible Gelation of Poly (Ethylene Oxide ). J. Polym. Sci. Part A Polym. Chem. 1998, 37, 751–760. [Google Scholar] [CrossRef]
- Vintiloiu, A.; Leroux, J.C. Organogels and their use in drug delivery—A review. J. Control. Release 2008, 125, 179–192. [Google Scholar] [CrossRef]
- Fameau, A.L.; Rogers, M.A. The curious case of 12-hydroxystearic acid—The Dr. Jekyll & Mr. Hyde of molecular gelators. Curr. Opin. Colloid Interface Sci. 2020, 45, 68–82. [Google Scholar] [CrossRef]
- Burkhardt, M.; Kinzel, S.; Gradzielski, M. Macroscopic properties and microstructure of HSA based organogels: Sensitivity to polar additives. J. Colloid Interface Sci. 2009, 331, 514–521. [Google Scholar] [CrossRef] [PubMed]
- Lan, Y.; Rogers, M.A. 12-Hydroxystearic acid SAFiNs in aliphatic diols-a molecular oddity. CrystEngComm 2015, 17, 8031–8038. [Google Scholar] [CrossRef]
- Markov, P.A.; Khramova, D.S.; Shumikhin, K.V.; Nikitina, I.R.; Beloserov, V.S.; Martinson, E.A.; Litvinets, S.G.; Popov, S.V. Mechanical properties of the pectin hydrogels and inflammation response to their subcutaneous implantation. J. Biomed. Mater. Res. Part A 2019, 107, 2088–2098. [Google Scholar] [CrossRef]
- Kashyap, N.; Viswanad, B.; Sharma, G.; Bhardwaj, V.; Ramarao, P.; Ravi Kumar, M.N.V. Design and evaluation of biodegradable, biosensitive in situ gelling system for pulsatile delivery of insulin. Biomaterials 2007, 28, 2051–2060. [Google Scholar] [CrossRef]
- Wijarnprecha, K.; Fuhrmann, P.; Gregson, C.; Sillick, M.; Sonwai, S.; Rousseau, D. Temperature-dependent properties of fat in adipose tissue from pork, beef and lamb. Part 2: Rheology and texture. Food Funct. 2022, 13, 7132–7143. [Google Scholar] [CrossRef] [PubMed]
- Dexter, M.B.; Shott, M.J. The evaluation of the force to expel oily injection vehicles from syringes. J. Pharm. Pharmacol. 1979, 31, 497–500. [Google Scholar] [CrossRef]
- Cilurzo, F.; Selmin, F.; Minghetti, P.; Adami, M.; Bertoni, E.; Lauria, S.; Montanari, L. Injectability Evaluation: An Open Issue. AAPS PharmSciTech 2011, 12, 604–609. [Google Scholar] [CrossRef]
- Robinson, T.E.; Hughes, E.A.B.; Bose, A.; Cornish, E.A.; Teo, J.Y.; Eisenstein, N.M.; Grover, L.M.; Cox, S.C. Filling the Gap: A Correlation between Objective and Subjective Measures of Injectability. Adv. Healthc. Mater. 2020, 9, 1901521. [Google Scholar] [CrossRef]
- Watt, R.P.; Khatri, H.; Dibble, A.R.G. Injectability as a function of viscosity and dosing materials for subcutaneous administration. Int. J. Pharm. 2019, 554, 376–386. [Google Scholar] [CrossRef] [PubMed]
- Rungseevijitprapa, W.; Bodmeier, R. Injectability of biodegradable in situ forming microparticle systems (ISM). Eur. J. Pharm. Sci. 2009, 36, 524–531. [Google Scholar] [CrossRef] [PubMed]
- Kuete, V.; Karaosmanoğlu, O.; Sivas, H. Anticancer Activities of African Medicinal Spices and Vegetables. In Medicinal Spices and Vegetables from Africa; Academic Press: Cambridge, MA, USA, 2017; pp. 271–297. [Google Scholar] [CrossRef]
- Tada, H.; Takamura, M.; Kawashiri, M.A. Genomics of hypertriglyceridemia. Adv. Clin. Chem. 2020, 97, 141–169. [Google Scholar] [CrossRef] [PubMed]
- Zawistowski, J.; Kopeć, A. Effect of functional food ingredients on nutrient absorption and digestion. In Nutrition and Functional Foods in Boosting Digestion, Metabolism and Immune Health; Academic Press: Cambridge, MA, USA, 2022; pp. 173–189. [Google Scholar] [CrossRef]
- Zheng, F.; Wang, S.; Hou, W.; Xiao, Y.; Liu, P.; Shi, X.; Shen, M. Comparative study of resazurin reduction and MTT assays for cytocompatibility evaluation of nanofibrous materials. Anal. Methods 2019, 11, 483–489. [Google Scholar] [CrossRef]
- Prabst, K.; Engelhardt, H.; Ringgeler, S.; Hubner, H.; Ates, G.; Vanhaeke, T.; Rogiers, V.; Rodrigues, R.; Chan, L.L.-Y.; McCulley, K.J.; et al. Cell Viability Assays; Humana Press: Totowa, NJ, USA, 2017; Volume 1601, ISBN 978-1-4939-6959-3. [Google Scholar]
, MCT , IPM ).
, MCT , IPM ).
 ) and viscous component values (G″:
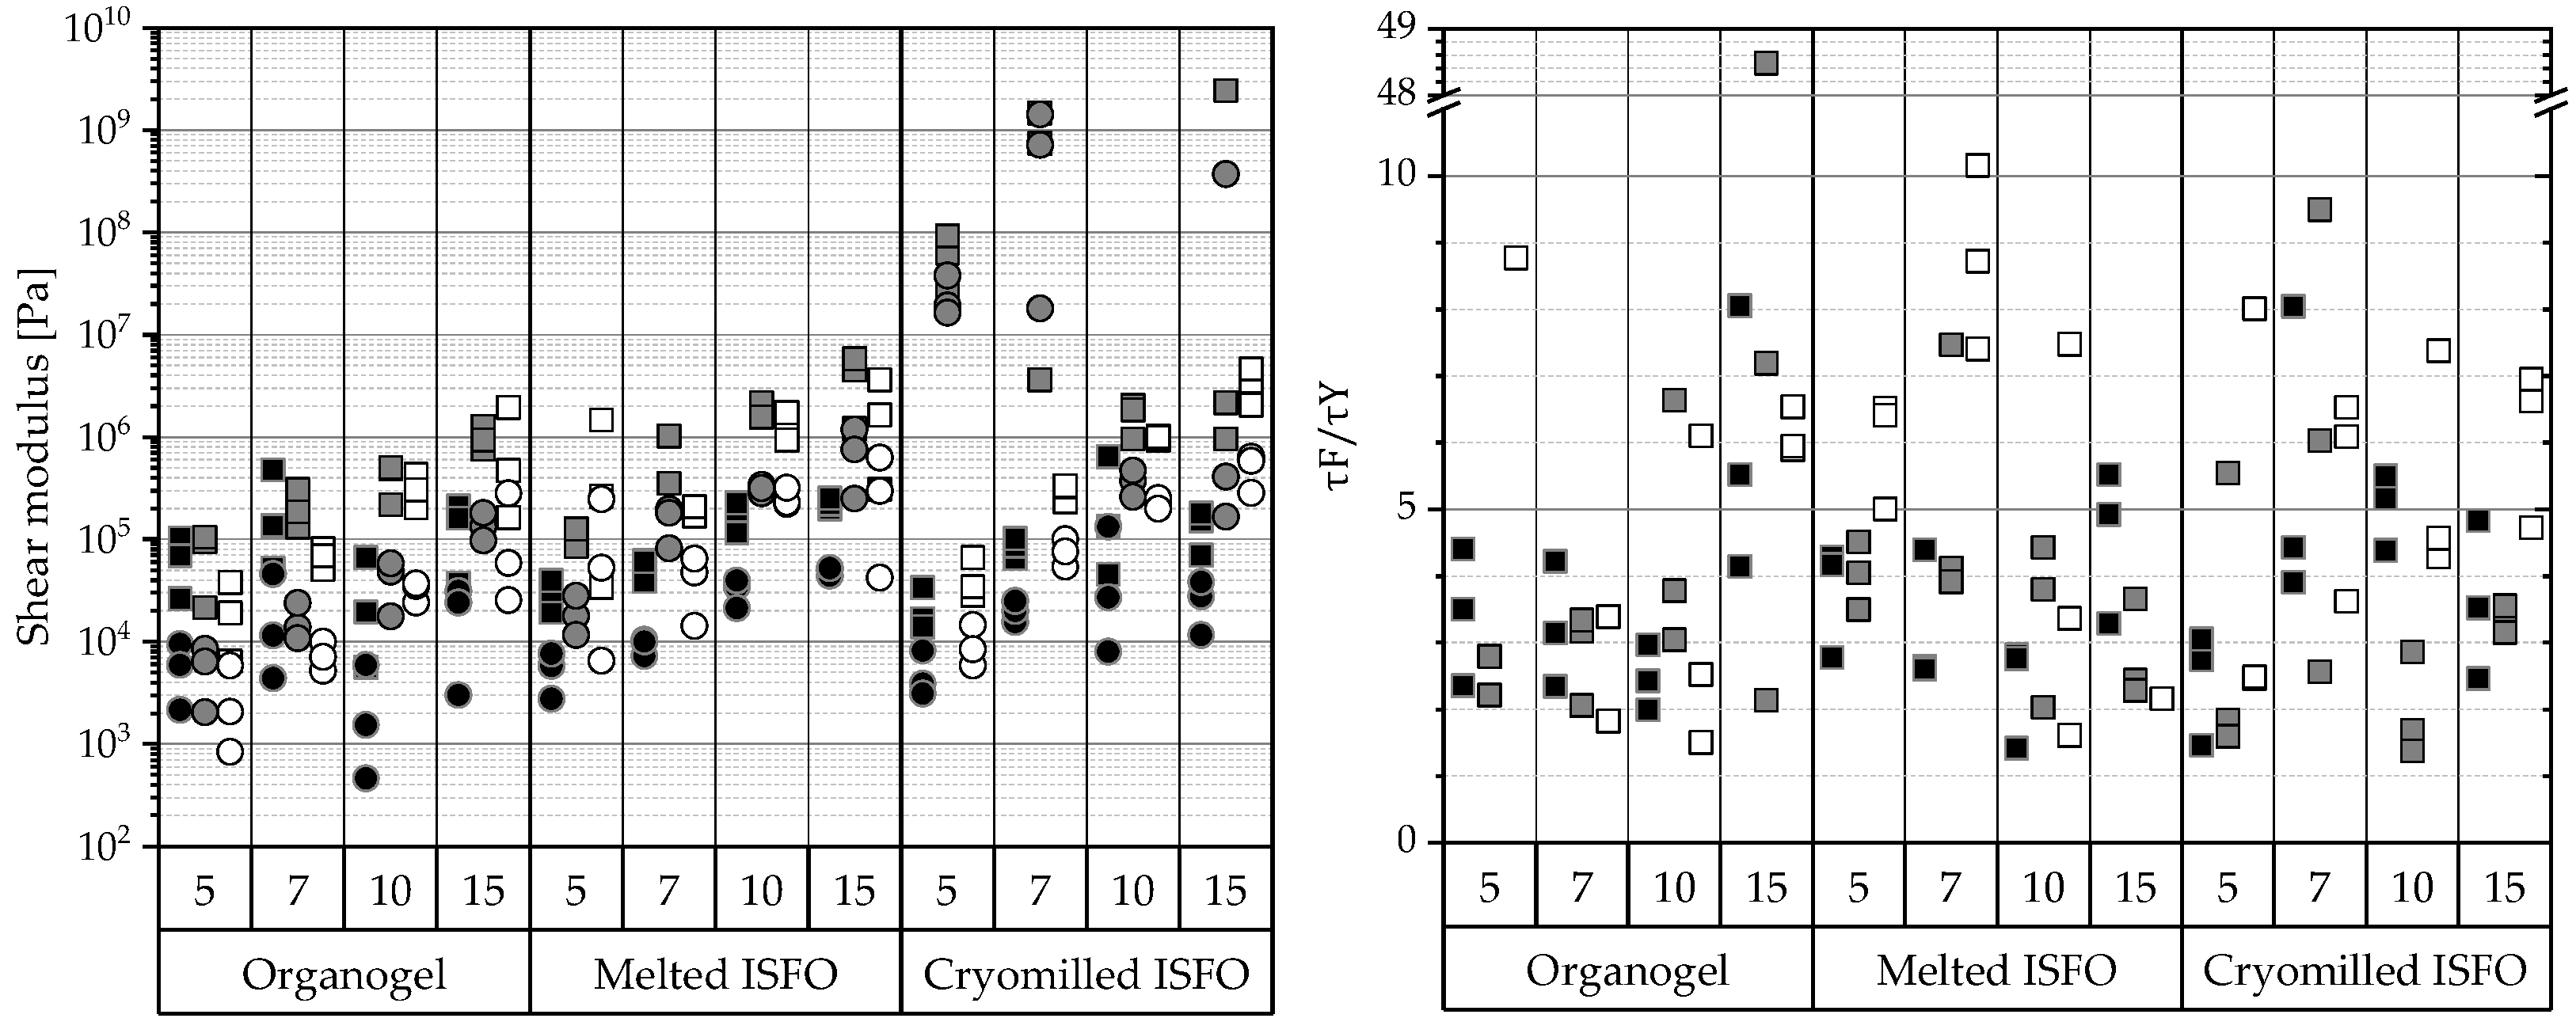
  ). Right: Ratios of the flow point () and the yield point ( ). From amplitude sweeps acquired via oscillating rheometry, the shear moduli of G′ and G″ within the LVER and flow ( ) and yield point ( ) were extracted. The data are categorized by the manufacturing technique and 12-HSA concentration. The compositions of the gels are coded based on the liquid lipid (PO , MCT , IPM ).
) and viscous component values (G″: ). Right: Ratios of the flow point () and the yield point ( ). From amplitude sweeps acquired via oscillating rheometry, the shear moduli of G′ and G″ within the LVER and flow ( ) and yield point ( ) were extracted. The data are categorized by the manufacturing technique and 12-HSA concentration. The compositions of the gels are coded based on the liquid lipid (PO , MCT , IPM ).
). Right: Ratios of the flow point () and the yield point ( ). From amplitude sweeps acquired via oscillating rheometry, the shear moduli of G′ and G″ within the LVER and flow ( ) and yield point ( ) were extracted. The data are categorized by the manufacturing technique and 12-HSA concentration. The compositions of the gels are coded based on the liquid lipid (PO , MCT , IPM ).
) and viscous component values (G″: ). Right: Ratios of the flow point () and the yield point ( ). From amplitude sweeps acquired via oscillating rheometry, the shear moduli of G′ and G″ within the LVER and flow ( ) and yield point ( ) were extracted. The data are categorized by the manufacturing technique and 12-HSA concentration. The compositions of the gels are coded based on the liquid lipid (PO , MCT , IPM ). , MCT , IPM ).
, MCT , IPM ).
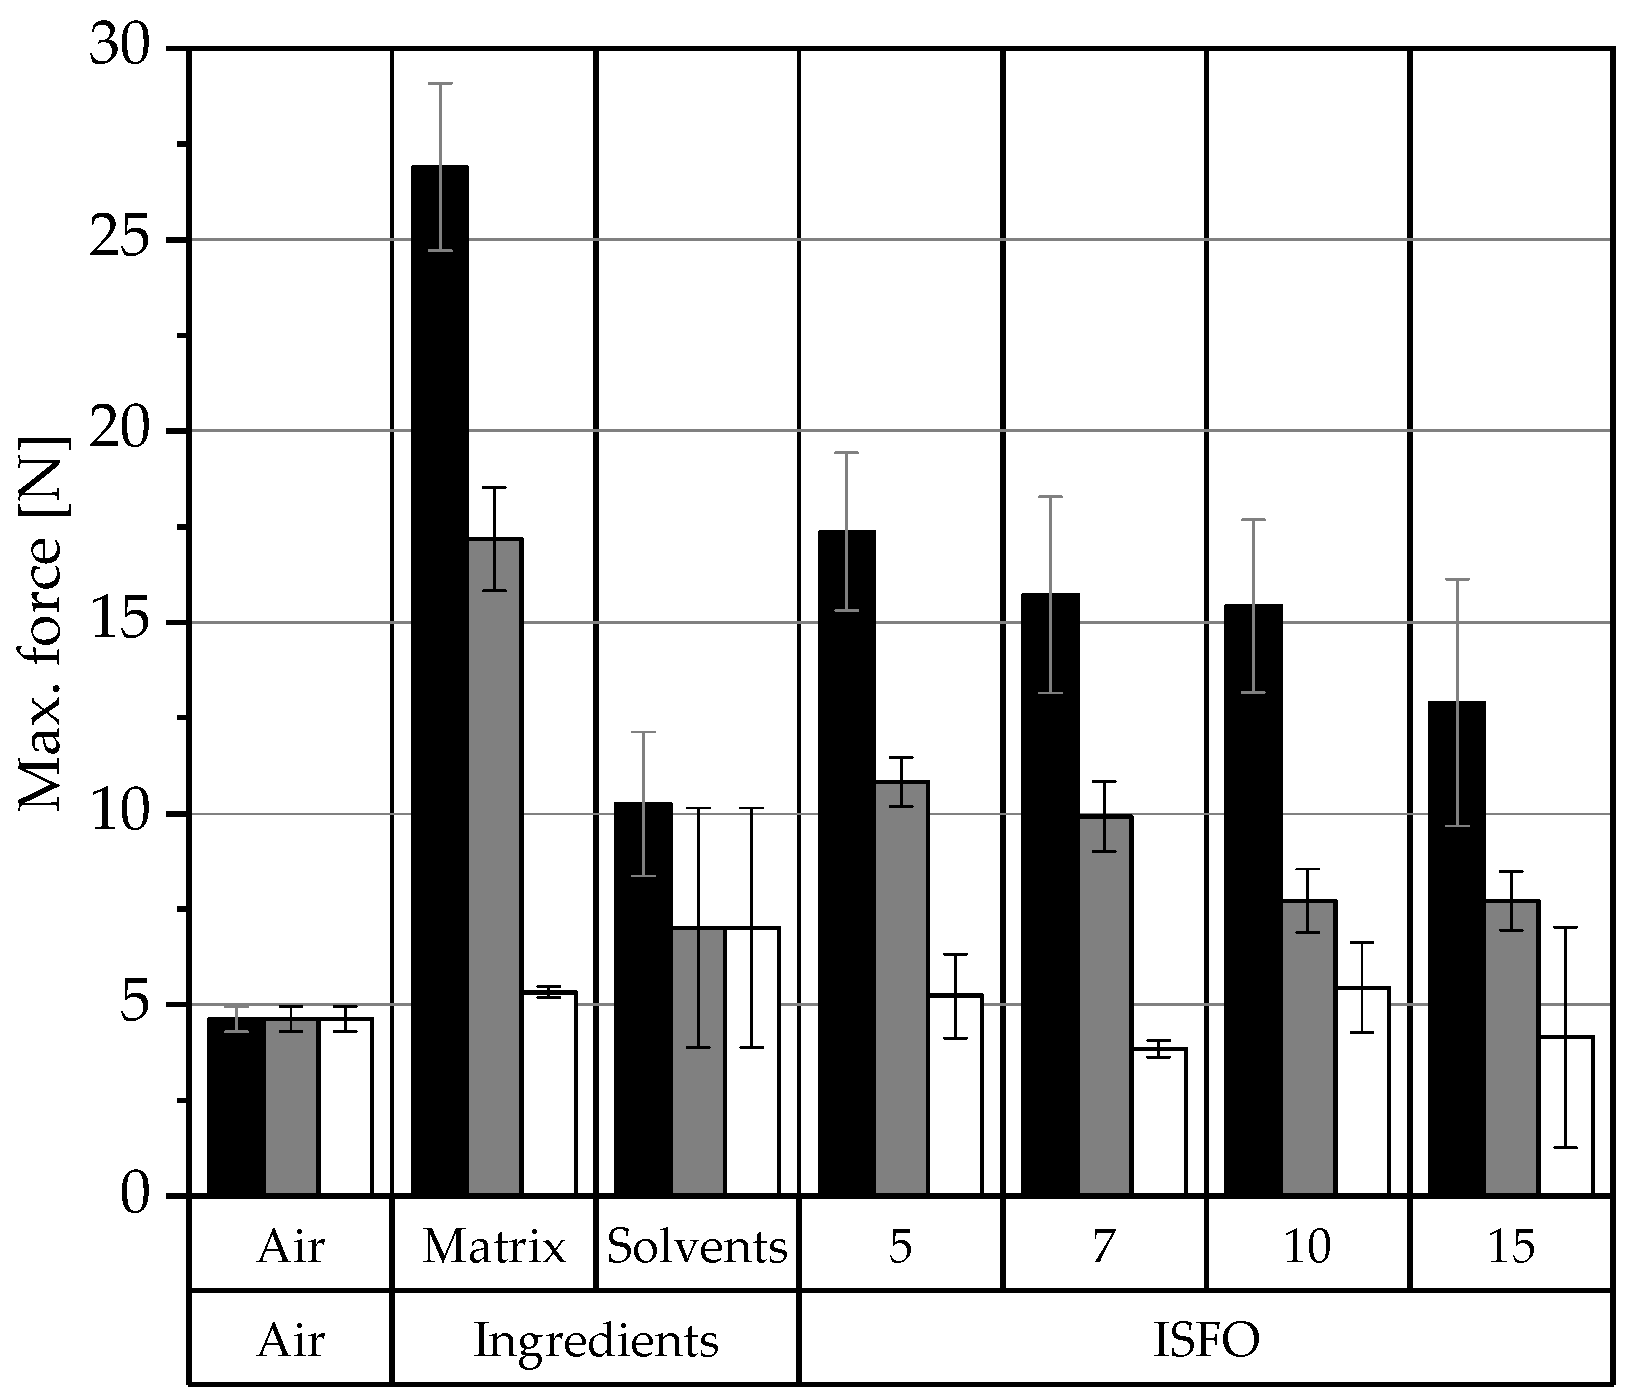
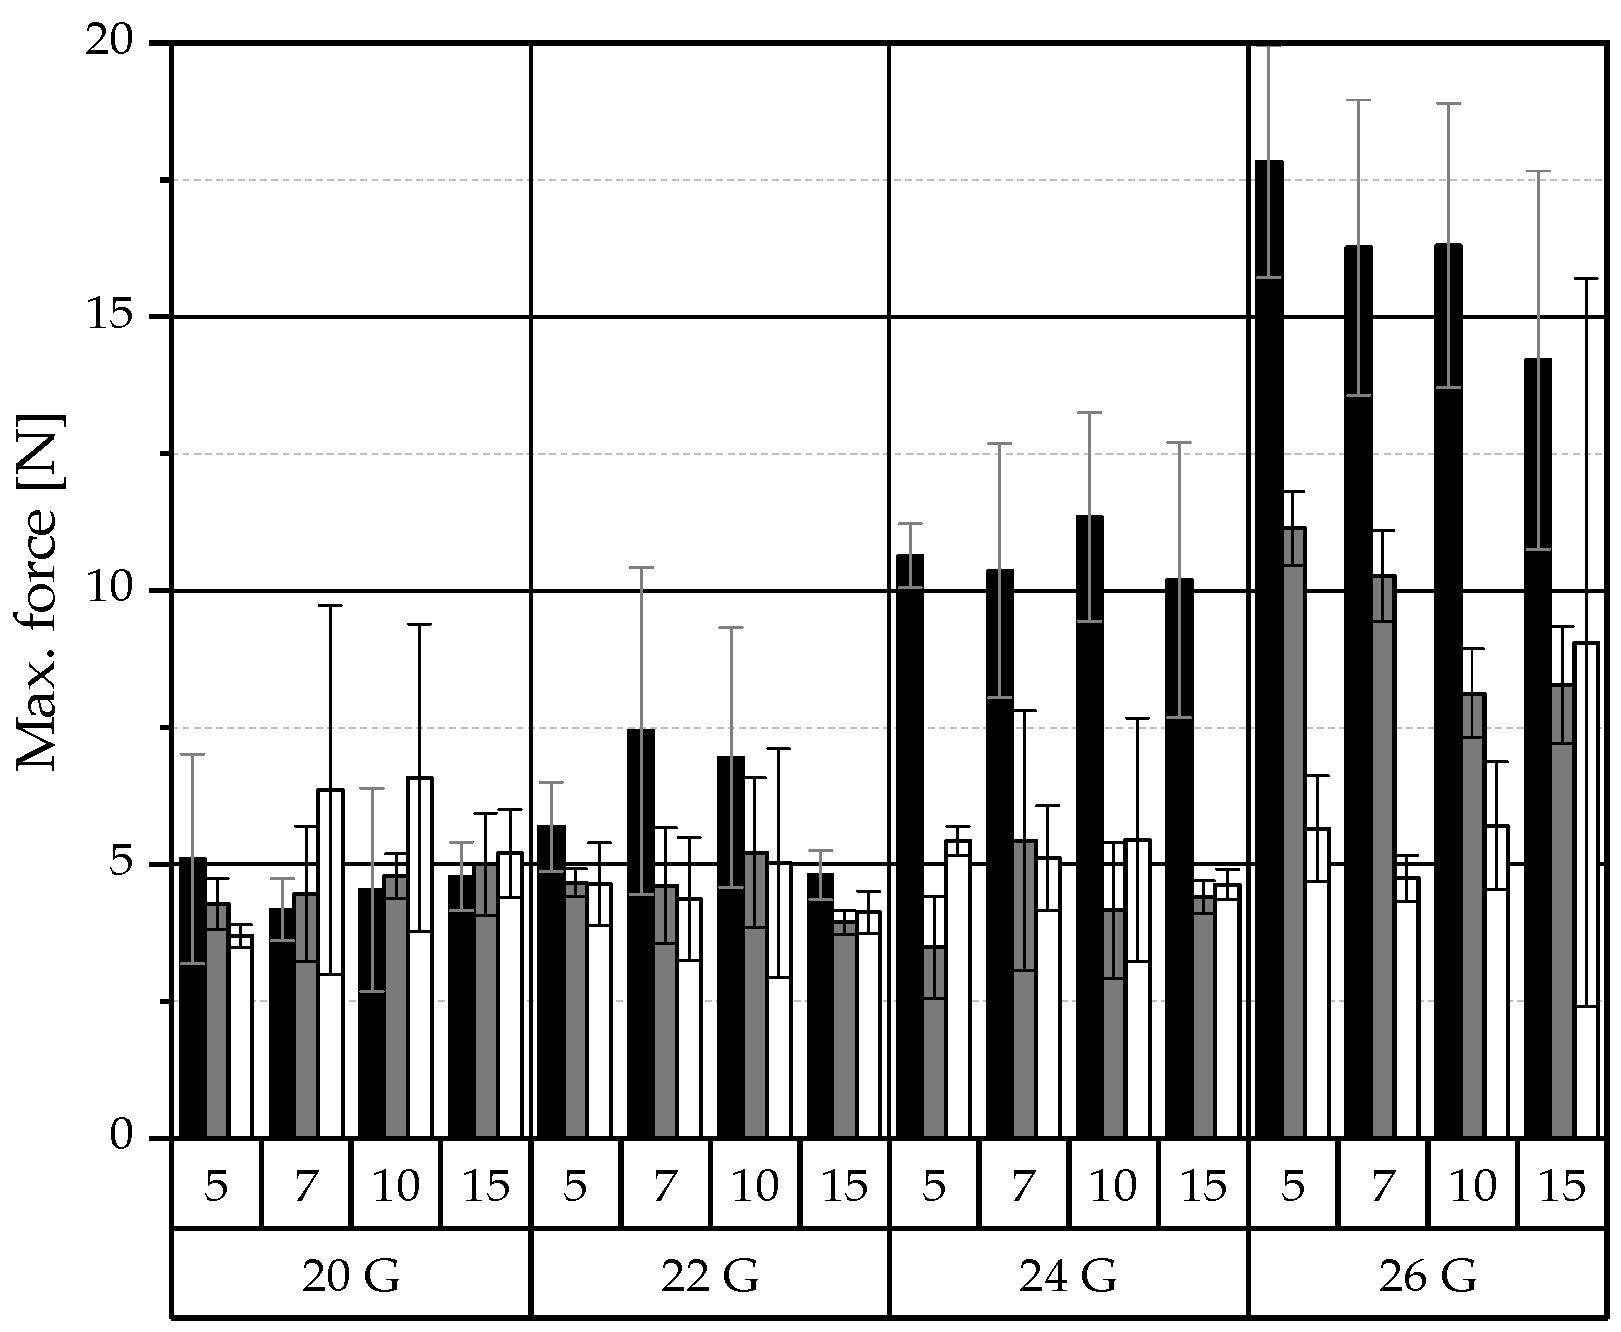
, MCT , IPM ). , MCT , IPM ). The pure liquid lipid and solvents were also ejected for comparison.
, MCT , IPM ). The pure liquid lipid and solvents were also ejected for comparison.
, MCT , IPM ). The pure liquid lipid and solvents were also ejected for comparison.
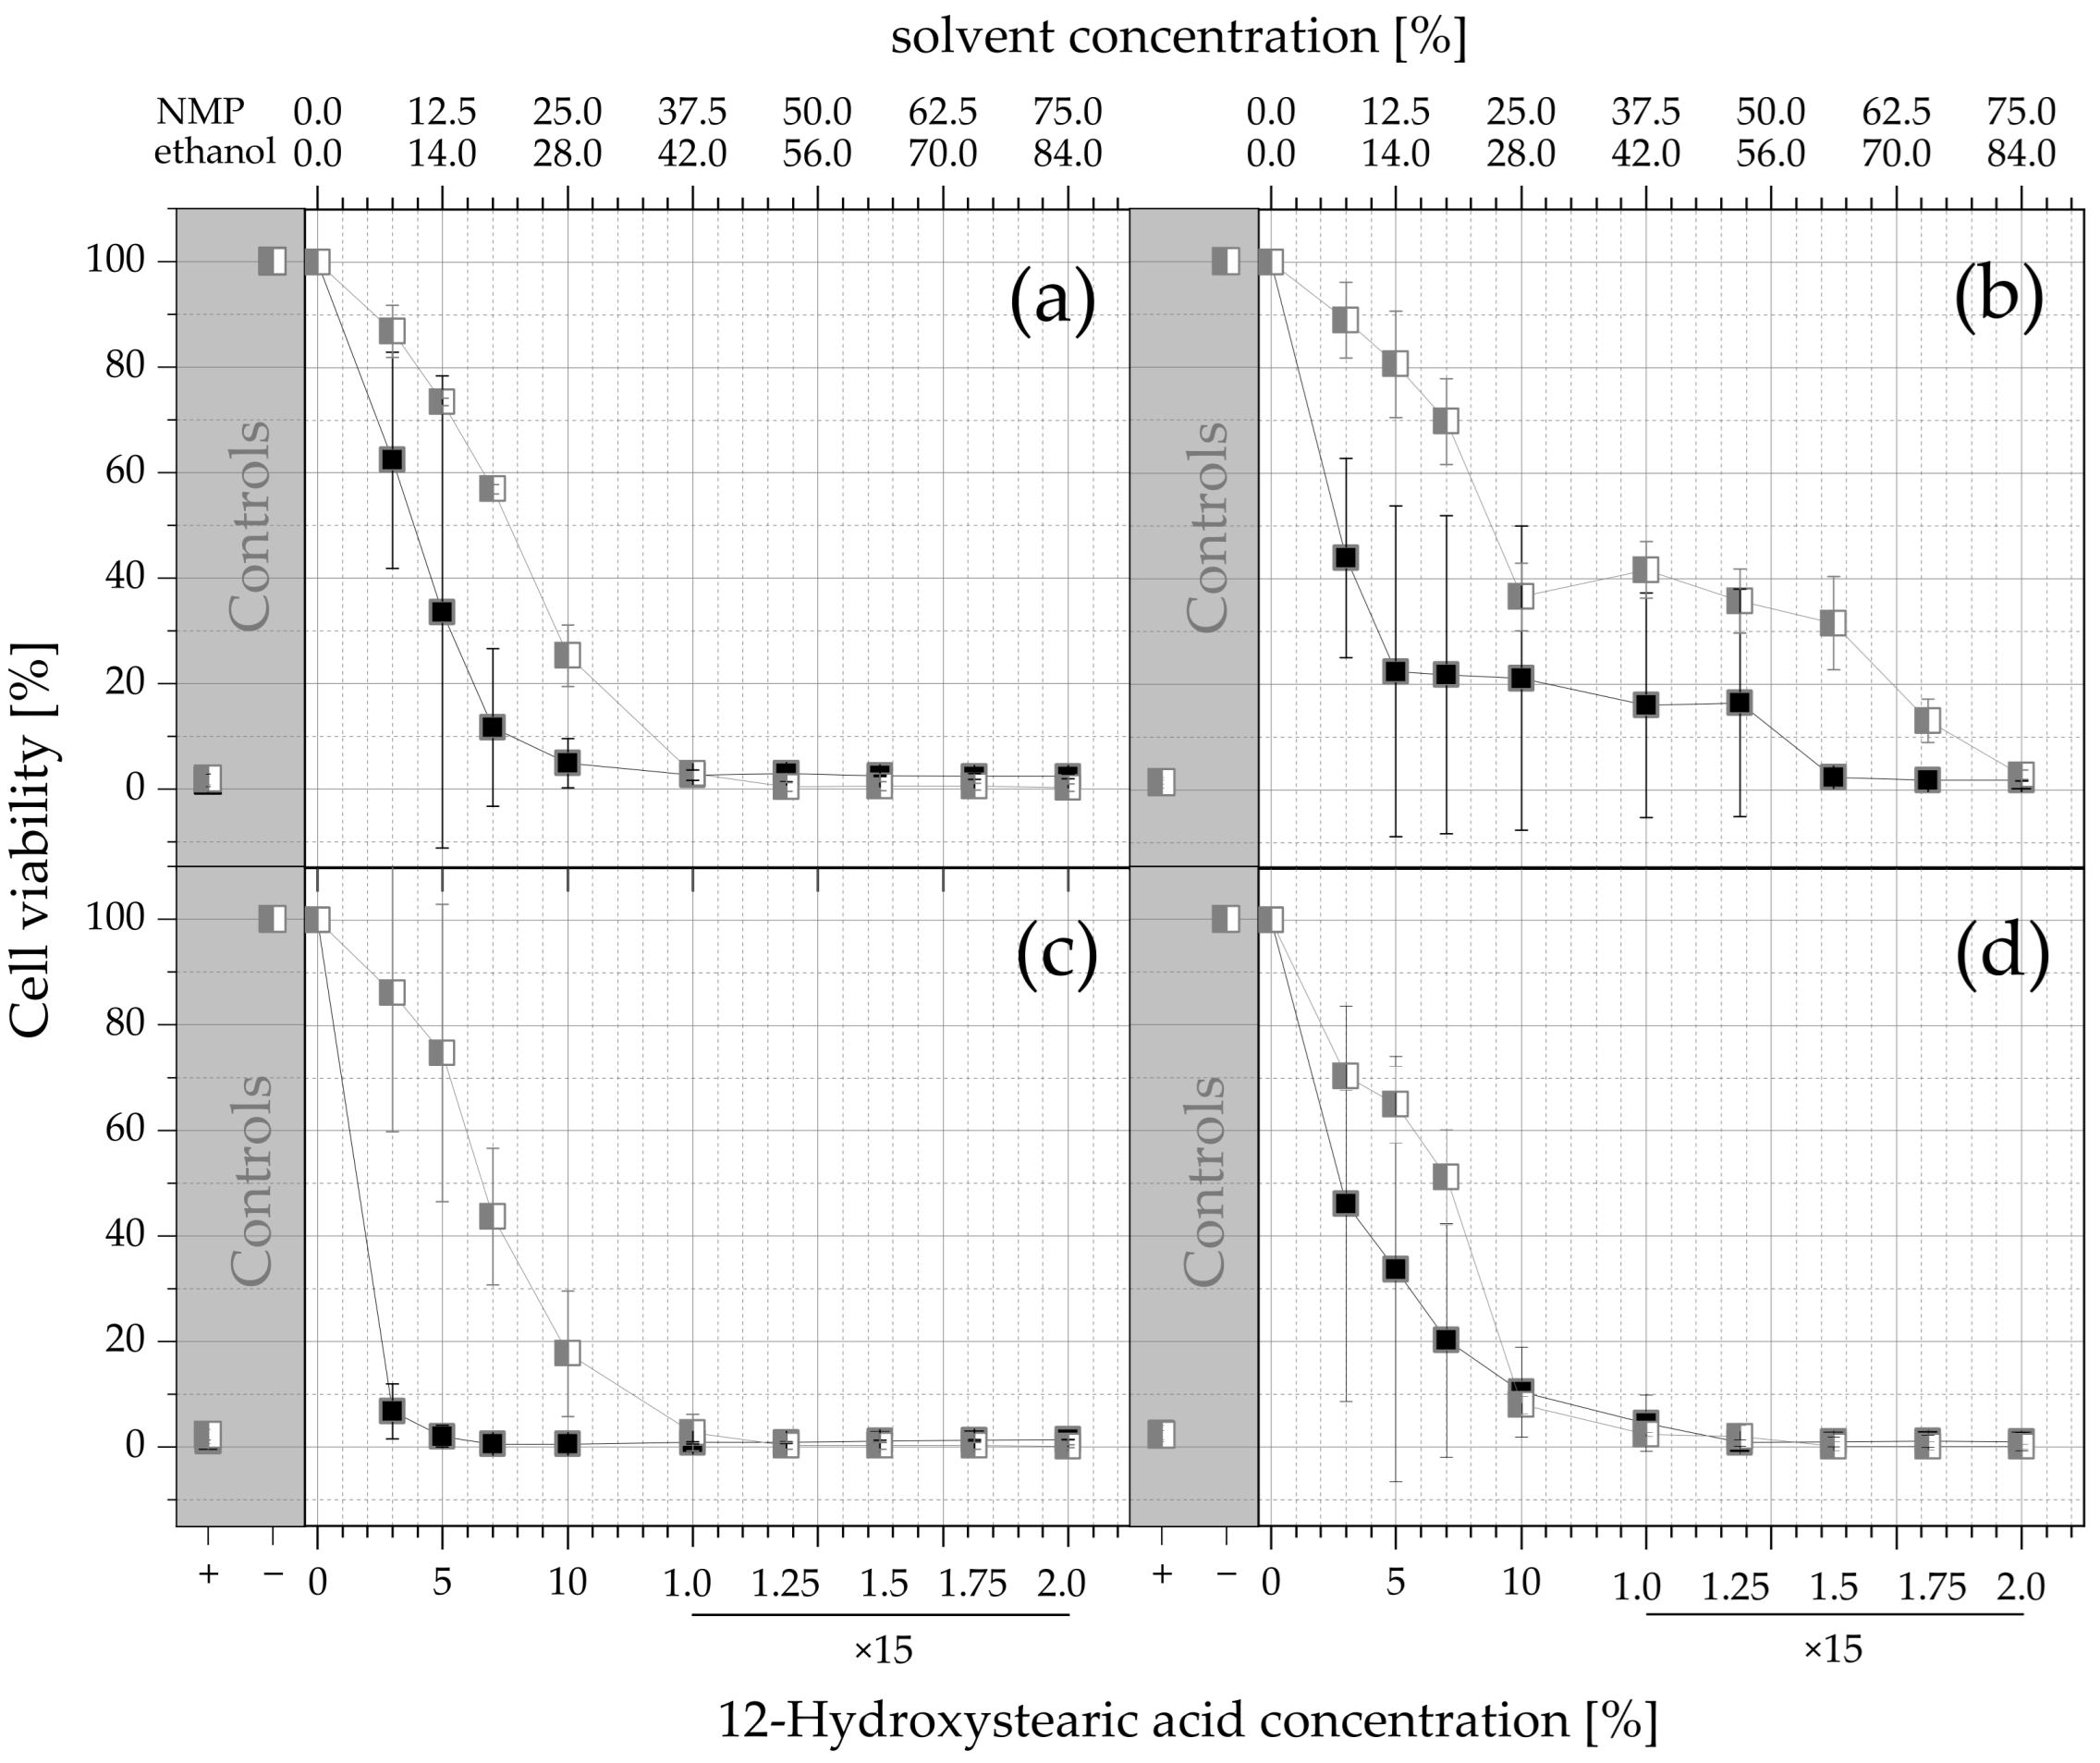
 and ethanol (MCT and IPM ISFOs)
  . The viability values are given as a function of the solvent concentration and the corresponding 12-HSA concentration, and as arithmetic mean ± SD; n = 3. Since no higher 12-HSA concentrations than 15% were tested, the amount of ISFO injected into the extraction medium was increased for the last 4 datapoints (250, 300, 350, and 400 µL into 800 µL of medium; for all other datapoints 200 µL was injected into 800 µL).
and ethanol (MCT and IPM ISFOs) . The viability values are given as a function of the solvent concentration and the corresponding 12-HSA concentration, and as arithmetic mean ± SD; n = 3. Since no higher 12-HSA concentrations than 15% were tested, the amount of ISFO injected into the extraction medium was increased for the last 4 datapoints (250, 300, 350, and 400 µL into 800 µL of medium; for all other datapoints 200 µL was injected into 800 µL).
. The viability values are given as a function of the solvent concentration and the corresponding 12-HSA concentration, and as arithmetic mean ± SD; n = 3. Since no higher 12-HSA concentrations than 15% were tested, the amount of ISFO injected into the extraction medium was increased for the last 4 datapoints (250, 300, 350, and 400 µL into 800 µL of medium; for all other datapoints 200 µL was injected into 800 µL).
and ethanol (MCT and IPM ISFOs) . The viability values are given as a function of the solvent concentration and the corresponding 12-HSA concentration, and as arithmetic mean ± SD; n = 3. Since no higher 12-HSA concentrations than 15% were tested, the amount of ISFO injected into the extraction medium was increased for the last 4 datapoints (250, 300, 350, and 400 µL into 800 µL of medium; for all other datapoints 200 µL was injected into 800 µL).
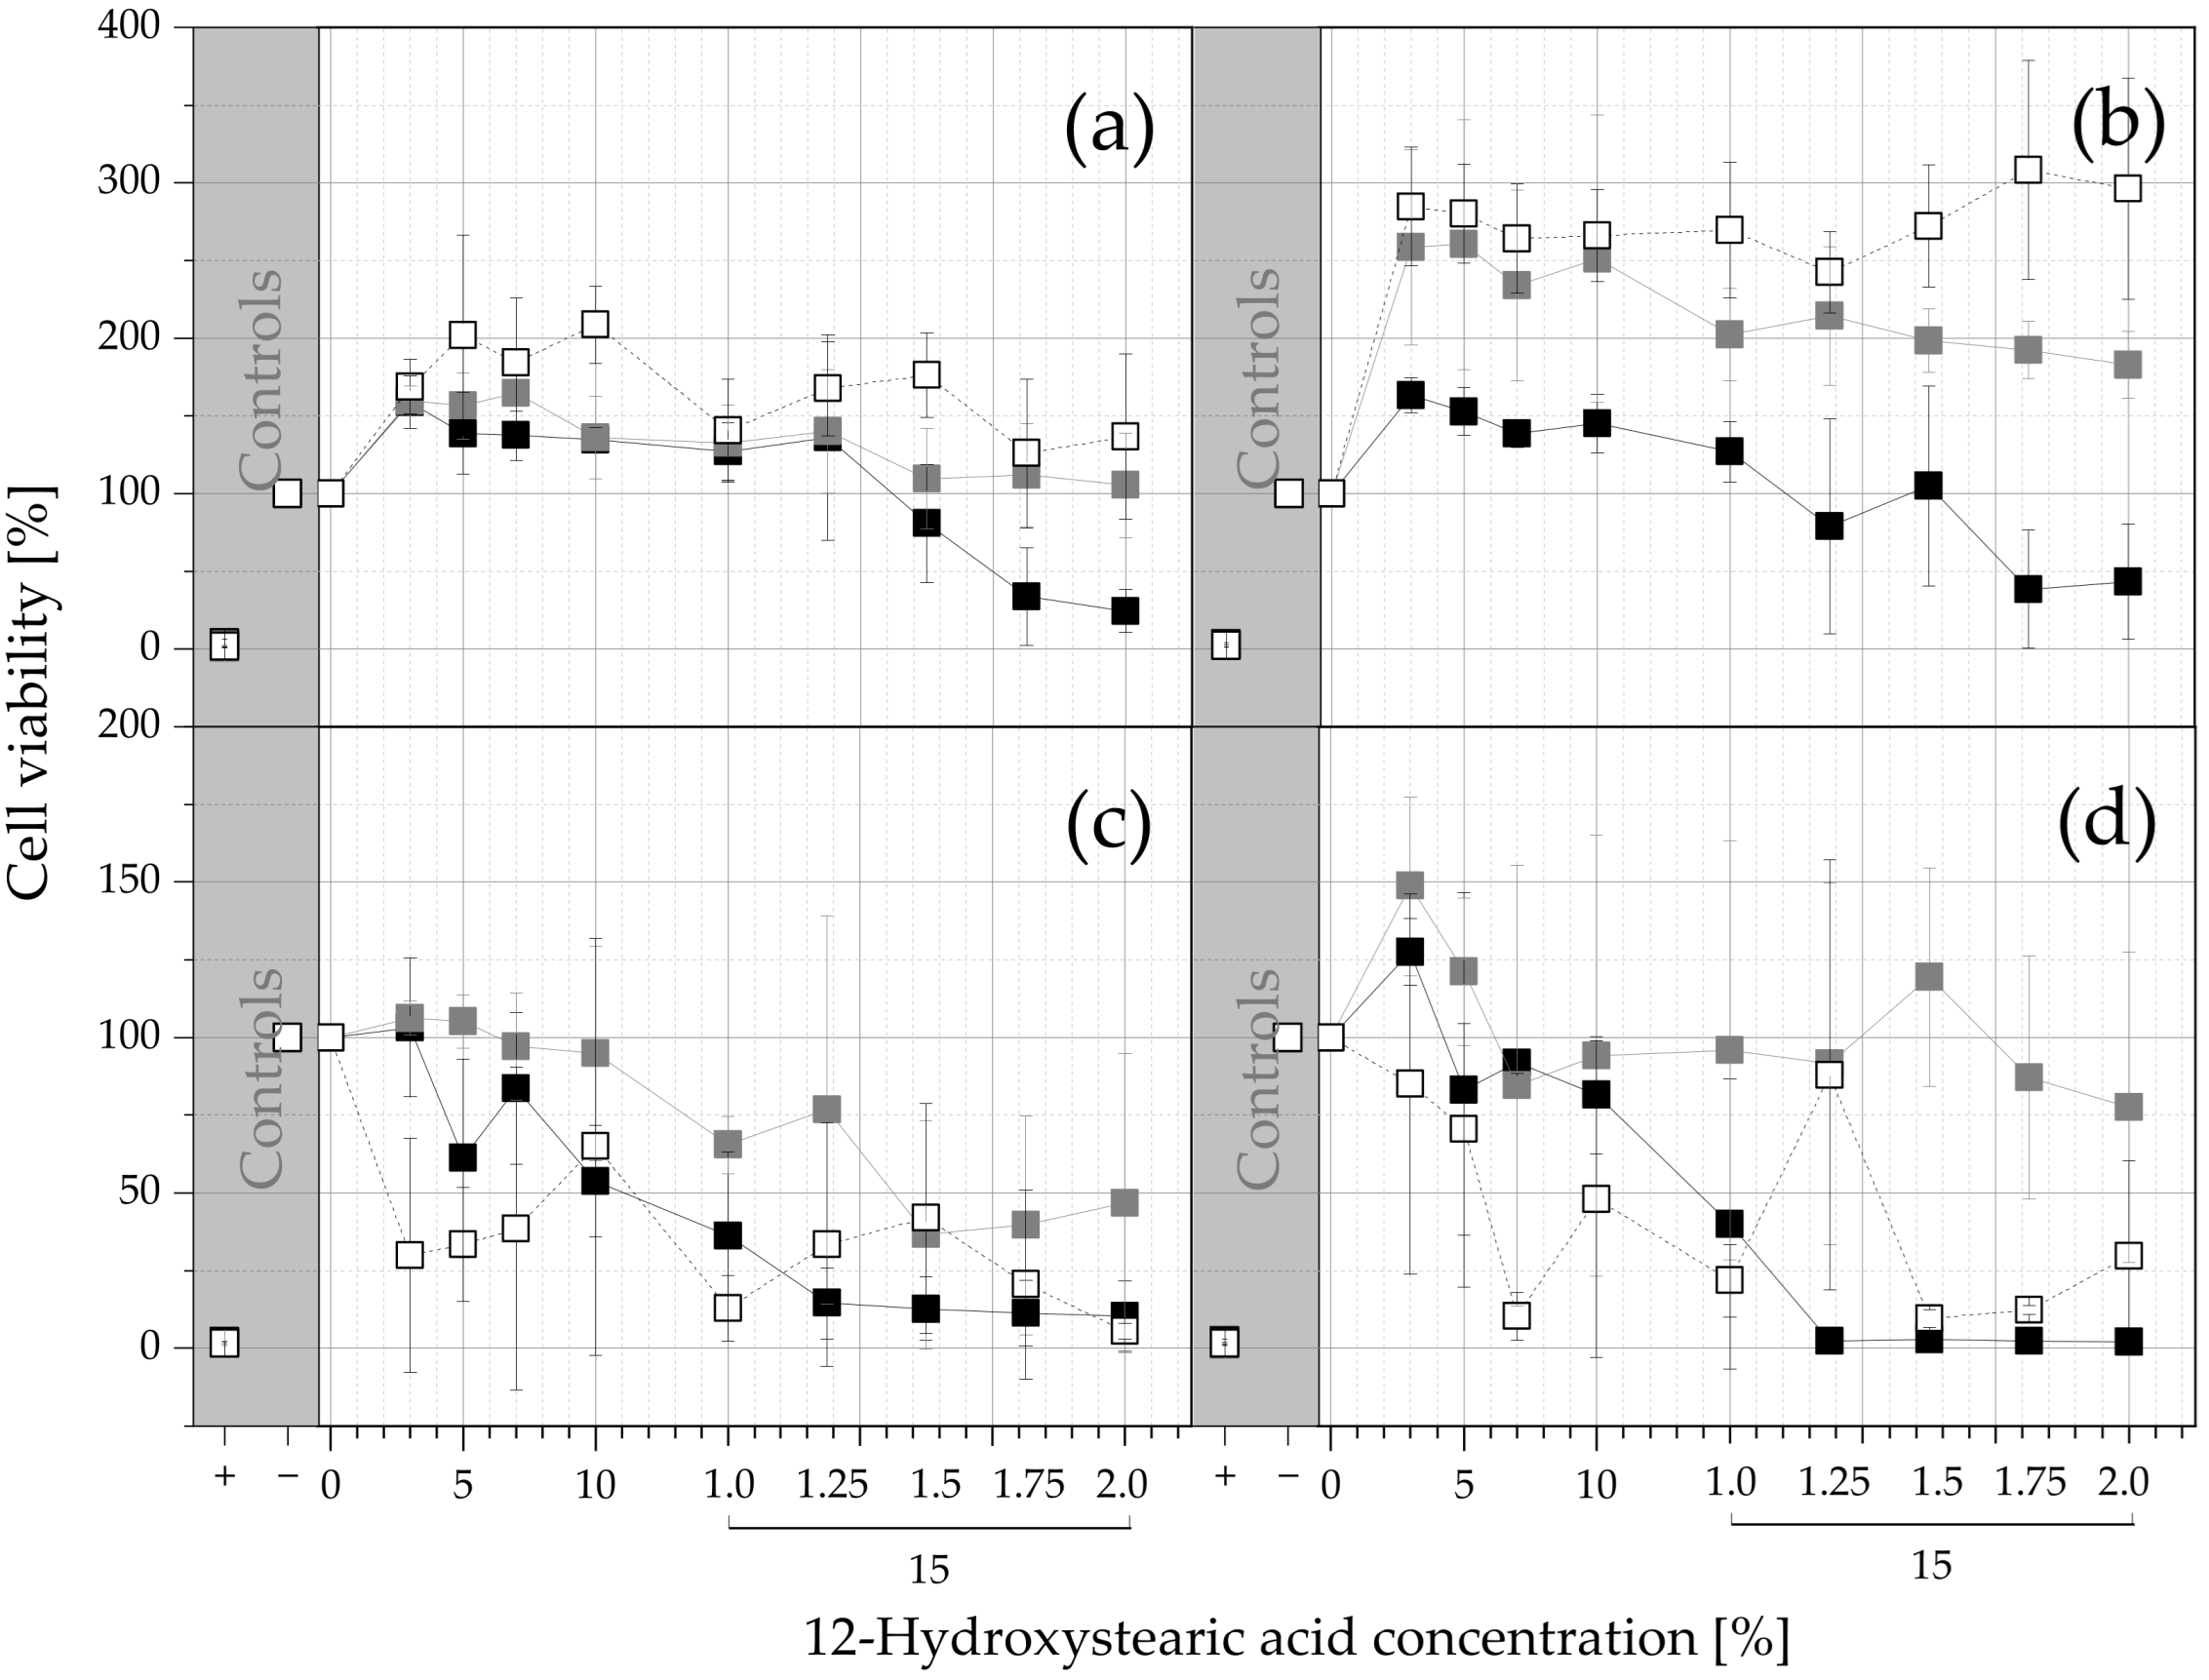
 ), MCT-ISFO extracts (
 ), and IPM ISFO extracts (
 ). The viability values are given as a function of the 12-HSA concentrations as arithmetic means ± SD; n = 3. Since no higher 12-HSA concentrations than 15% were tested, the amount of ISFO injected into the extraction medium was increased for the last 4 datapoints (250, 300, 350, and 400 µL into 800 µL of medium; for all other datapoints 200 µL was injected into 800 µL).
), MCT-ISFO extracts (), and IPM ISFO extracts (). The viability values are given as a function of the 12-HSA concentrations as arithmetic means ± SD; n = 3. Since no higher 12-HSA concentrations than 15% were tested, the amount of ISFO injected into the extraction medium was increased for the last 4 datapoints (250, 300, 350, and 400 µL into 800 µL of medium; for all other datapoints 200 µL was injected into 800 µL).
). The viability values are given as a function of the 12-HSA concentrations as arithmetic means ± SD; n = 3. Since no higher 12-HSA concentrations than 15% were tested, the amount of ISFO injected into the extraction medium was increased for the last 4 datapoints (250, 300, 350, and 400 µL into 800 µL of medium; for all other datapoints 200 µL was injected into 800 µL).
), MCT-ISFO extracts (), and IPM ISFO extracts (). The viability values are given as a function of the 12-HSA concentrations as arithmetic means ± SD; n = 3. Since no higher 12-HSA concentrations than 15% were tested, the amount of ISFO injected into the extraction medium was increased for the last 4 datapoints (250, 300, 350, and 400 µL into 800 µL of medium; for all other datapoints 200 µL was injected into 800 µL).
| m% | PO | MCT | IPM | |||||||||
|---|---|---|---|---|---|---|---|---|---|---|---|---|
| nomenclature | 5 | 7 | 10 | 15 | 5 | 7 | 10 | 15 | 5 | 7 | 10 | 15 |
| 12-HSA | 4.5 | 6.0 | 8.1 | 11.2 | 4.4 | 5.9 | 7.8 | 10.6 | 4.4 | 5.9 | 7.8 | 10.6 |
| liquid lipid | 85.2 | 80.1 | 73.2 | 63.2 | 83.3 | 77.8 | 70.3 | 59.9 | 83.3 | 77.8 | 70.3 | 59.9 |
| solvent | 10.3 | 13.9 | 18.7 | 25.7 | 12.3 | 16.4 | 21.9 | 29.6 | 12.3 | 16.4 | 21.9 | 29.6 |
| Cell Line | 3T3 V [mL] | NHDF V [mL] |
|---|---|---|
| DMEM with Na-Pyruvate | 500 | - |
| DMEM without Na-Pyruvate | - | 500 |
| FCS (f.c. 10%) | 55 | 55 |
| Penicillin–streptomycin solution (100×) | 5.5 | 5.5 |
| m% | PO | MCT | IPM |
|---|---|---|---|
| Critical gelling concentration | 2.91 | 3.85 | 4.75 |
| m% | NMP | ethanol | |
| Solubility of 12-HSA | 28.57 | 26.47 | |
| Formulation | PO (NMP) | MCT/IPM (ethanol) | ||
|---|---|---|---|---|
| Cell Type | 3T3 | NHDF | 3T3 | NHDF |
| 24 h incubation | ||||
| Solvent conc. [%] | 9.65 ± 3.15 | 6.675 ± 0.625 | 21.42 ± 0.728 | 24.584 ± 1.792 |
| 12-HSA-conc. [%] | 3.86 ± 1.26 | 2.67 ± 0.25 | 7.65 ± 0.26 | 8.78 ± 0.64 |
| 96 h incubation | ||||
| Solvent-conc. [%] | 4.025 ± 0.1 | 6.95 ± 1.3 | 18.452 ± 3.808 | 20.104 ± 1.624 |
| 12-HSA-conc. [%] | 1.61 ± 0.04 | 2.78 ± 0.52 | 6.59 ± 1.36 | 7.18 ± 0.58 |
| PO | MCT | IPM | ||||
|---|---|---|---|---|---|---|
| Cell Type | 3T3 | NHDF | 3T3 | NHDF | 3T3 | NHDF |
| 24 h | 24.95 ± 1.30 | 25.59 ± 0.65 | >30.00 | >30.00 | >30.00 | >30.00 |
| 96 h | 19.94 ± 2.56 | 13.01 ± 1.99 | 21.25 ± 1.25 | >30.00 | 2.14 ± 0.40 | 5.68 ± 1.18 |
| 0 Points | 1 Point | 2 Points | 3 Points | |
|---|---|---|---|---|
| Assessment | Very poor | Poor | Moderate | Good |
| Gel strength under compression (relative standard deviation *) | >50% | <50% | <30% | <10% |
| Gel strength under oscillation (LVER-G′ of amplitude sweep) | >108 Pa | 9.3 × 10⁵– 108 Pa | <104 Pa | 104– 9.3 × 10⁵ Pa |
| Risk of brittle fracture (τF/τγ of amplitude sweep) | 1–2.5 | 2.5–5 | 5–10 | >10 |
| Tendency to syneresis ( of frequency sweep) | 0–0.1 | 0.1–0.15 | 0.15–0.2 | 0.2–0.3 |
| Gel Strength under Compression | Gel Strength under Oscillation | Risk of Brittle Fracture | Tendency to Syneresis | Mean over All Categories | ||||||||||||
|---|---|---|---|---|---|---|---|---|---|---|---|---|---|---|---|---|
| PO | MCT | IPM | PO | MCT | IPM | PO | MCT | IPM | PO | MCT | IPM | PO | MCT | IPM | ||
| Melted | 5 | 0 | 1 | 2 | 3 | 3 | 1 | 1 | 1 | 2 | 1 | 1 | 0 | 1.25 | 1.5 | 1.25 |
| 7 | 2 | 1 | 3 | 3 | 1 | 3 | 1 | 1 | 2 | 2 | 1 | 1 | 2 | 1 | 2.25 | |
| 10 | 0 | 1 | 1 | 3 | 1 | 1 | 0 | 0 | 0 | 2 | 0 | 2 | 1.25 | 0.5 | 1 | |
| 15 | 0 | 1 | 2 | 3 | 1 | 1 | 1 | 0 | 0 | 2 | 0 | 1 | 1.5 | 0.5 | 1 | |
| Cryomilled | 5 | 2 | 1 | 2 | 3 | 0 | 3 | 0 | 0 | 0 | 2 | 1 | 2 | 1.75 | 0.5 | 1.75 |
| 7 | 0 | 1 | 2 | 3 | 0 | 3 | 1 | 1 | 1 | 3 | 0 | 2 | 1.75 | 0.5 | 2 | |
| 10 | 1 | 0 | 3 | 3 | 1 | 1 | 1 | 0 | 1 | 2 | 1 | 1 | 1.75 | 0.5 | 1.5 | |
| 15 | 0 | 1 | 1 | 3 | 0 | 1 | 0 | 1 | 1 | 2 | 0 | 1 | 1.25 | 0.5 | 1 | |
Disclaimer/Publisher’s Note: The statements, opinions and data contained in all publications are solely those of the individual author(s) and contributor(s) and not of MDPI and/or the editor(s). MDPI and/or the editor(s) disclaim responsibility for any injury to people or property resulting from any ideas, methods, instructions or products referred to in the content. |
© 2023 by the authors. Licensee MDPI, Basel, Switzerland. This article is an open access article distributed under the terms and conditions of the Creative Commons Attribution (CC BY) license (https://creativecommons.org/licenses/by/4.0/).
Share and Cite
Dümichen, A.; Lucas, H.; Trutschel, M.-L.; Mäder, K. Development and Characterization of Novel In-Situ-Forming Oleogels. Pharmaceutics 2023, 15, 254. https://doi.org/10.3390/pharmaceutics15010254
Dümichen A, Lucas H, Trutschel M-L, Mäder K. Development and Characterization of Novel In-Situ-Forming Oleogels. Pharmaceutics. 2023; 15(1):254. https://doi.org/10.3390/pharmaceutics15010254
Chicago/Turabian StyleDümichen, Anne, Henrike Lucas, Marie-Luise Trutschel, and Karsten Mäder. 2023. "Development and Characterization of Novel In-Situ-Forming Oleogels" Pharmaceutics 15, no. 1: 254. https://doi.org/10.3390/pharmaceutics15010254