
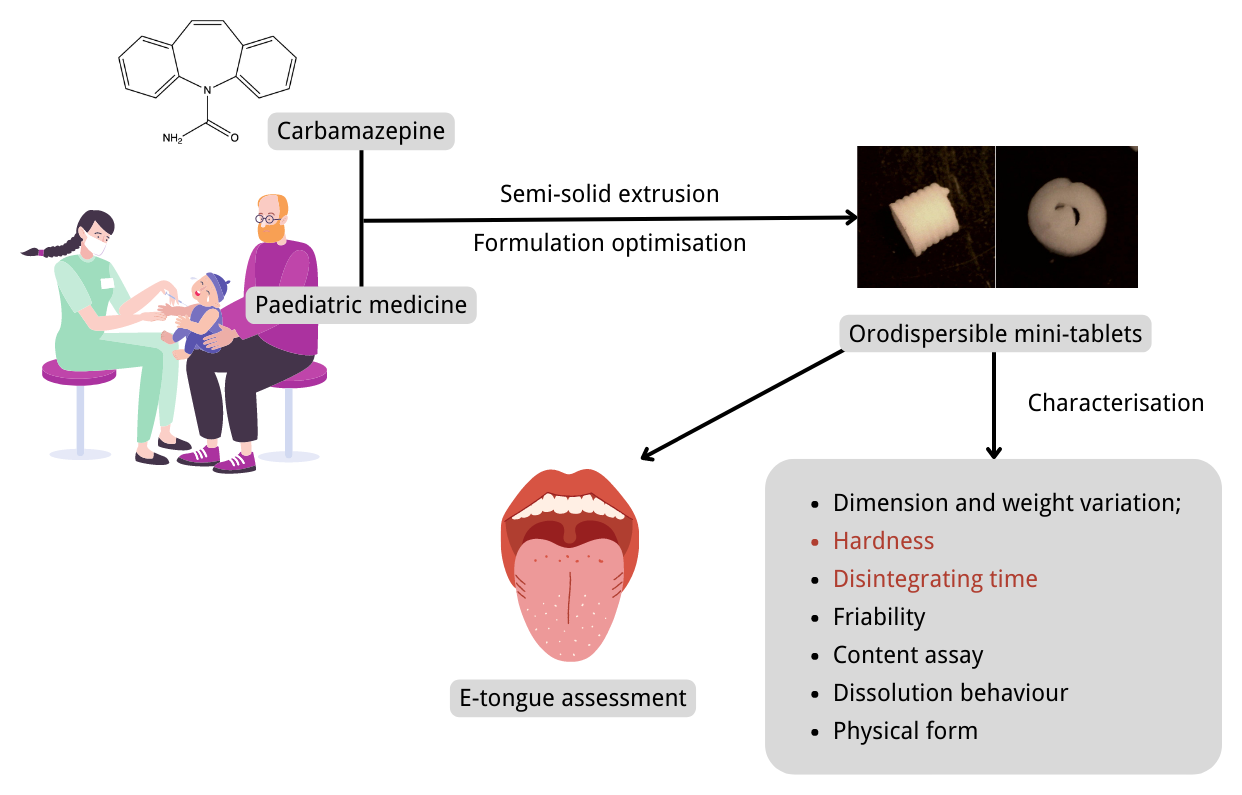
Formulation and Characterisation of Carbamazepine Orodispersible 3D-Printed Mini-Tablets for Paediatric Use


Abstract
:
1. Introduction
2. Materials and Methods
2.1. Materials
2.2. Methods
2.2.1. Preparation of the ODMT Formulation Based on Design of Experiment (DoE)
2.2.2. Fabrication of the ODMT Formulations via SSE
2.2.3. Characterisation of ODMTs
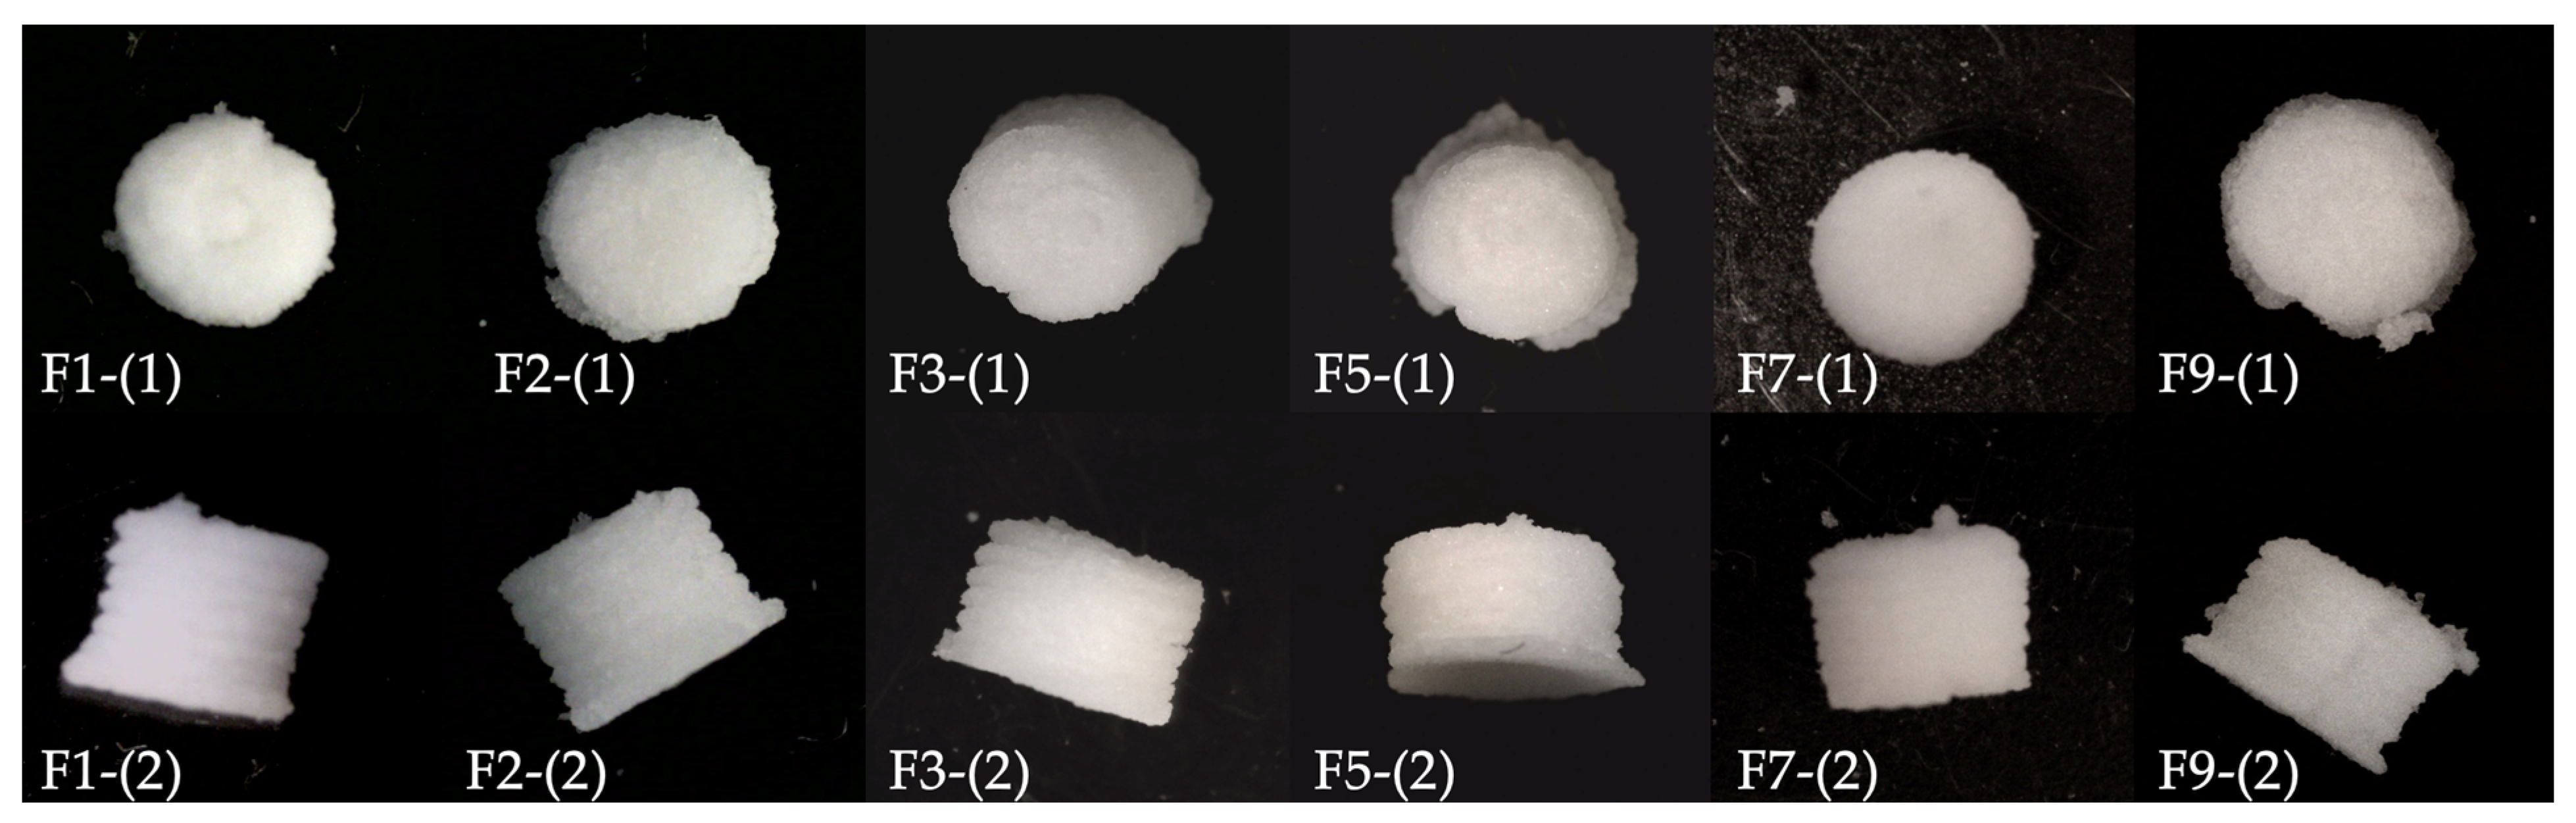
Appearance and Dimension Measurements
Weight Variation
Hardness
Disintegrating Time
Friability
Content Assay
In Vitro Dissolution Test
Fourier Transform Infrared (FTIR) Spectroscopy
X-ray Diffraction (XRD)
Differential Scanning Calorimeter (DSC)
2.2.4. Electronic Taste Sensing System Measurement of CBZ ODMTs
Dose Response Curve of CBZ
Taste-Assessment of CBZ ODMTs
3. Results and Discussion
3.1. Fabrication, Characterisation and Optimisation of ODMT Formulation via DoE
3.1.1. Fabrication of ODMT Formulation in DoE
3.1.2. Characterisation of ODMT Formulation in DoE
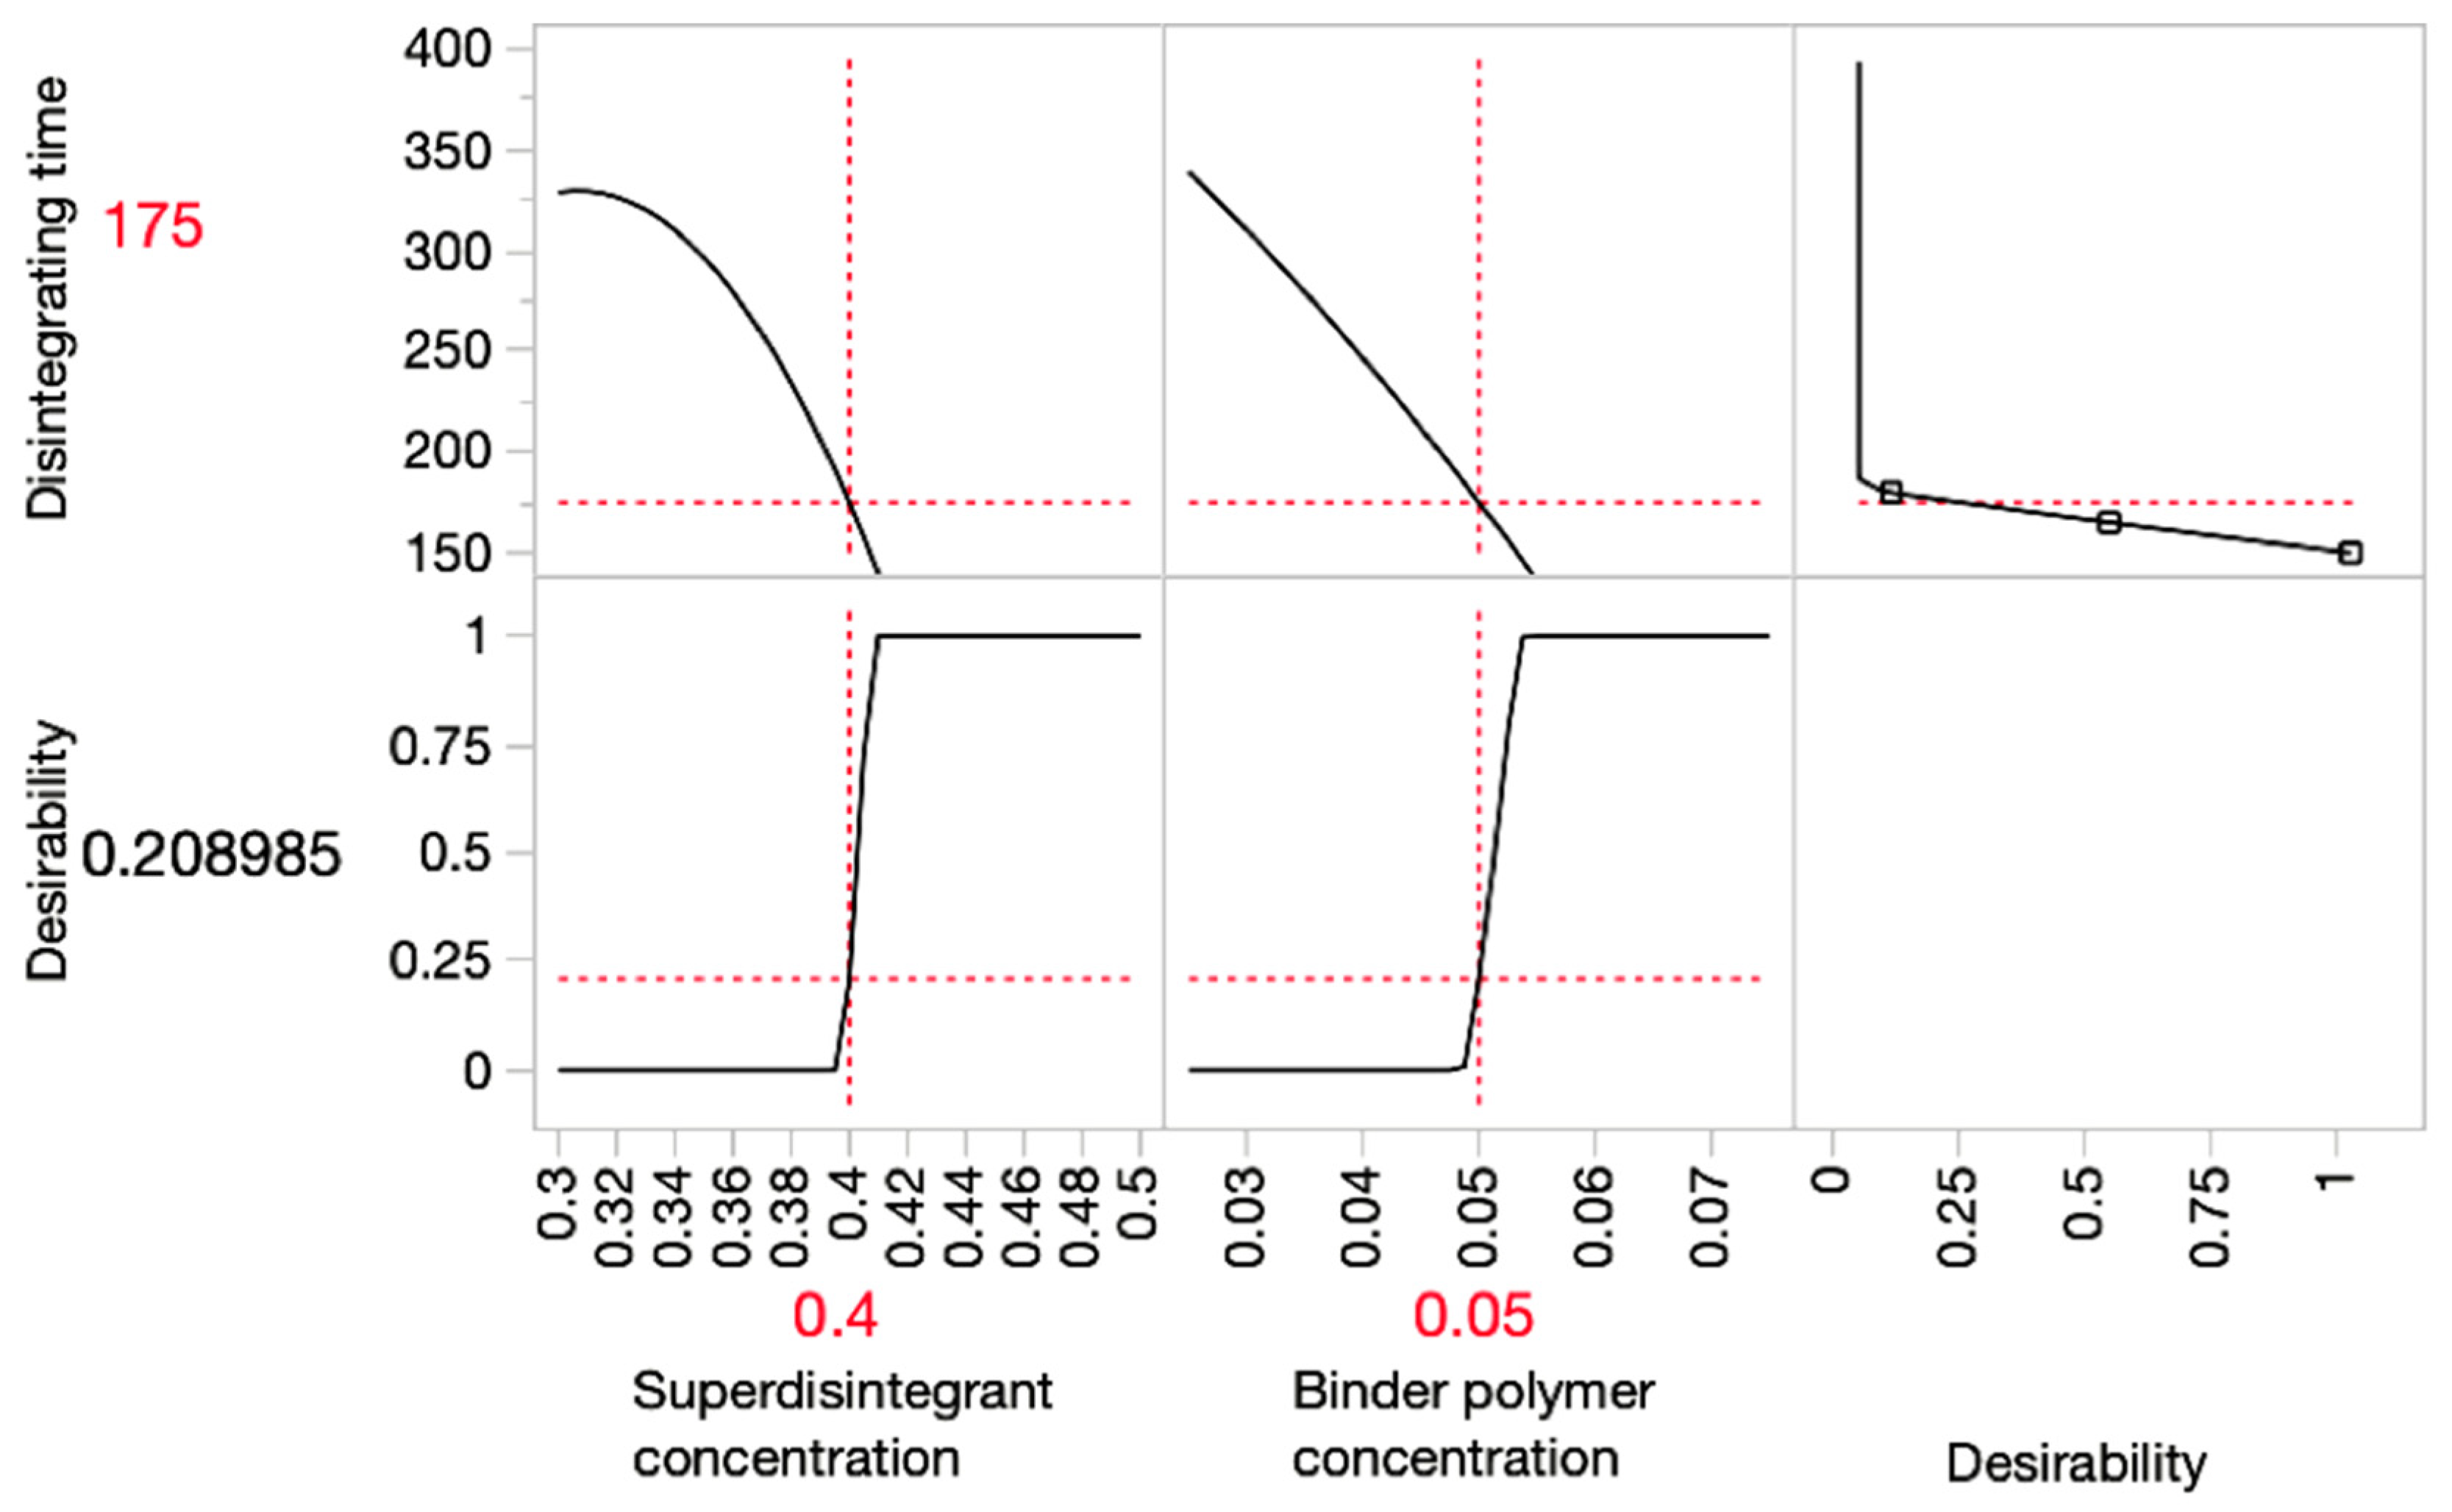
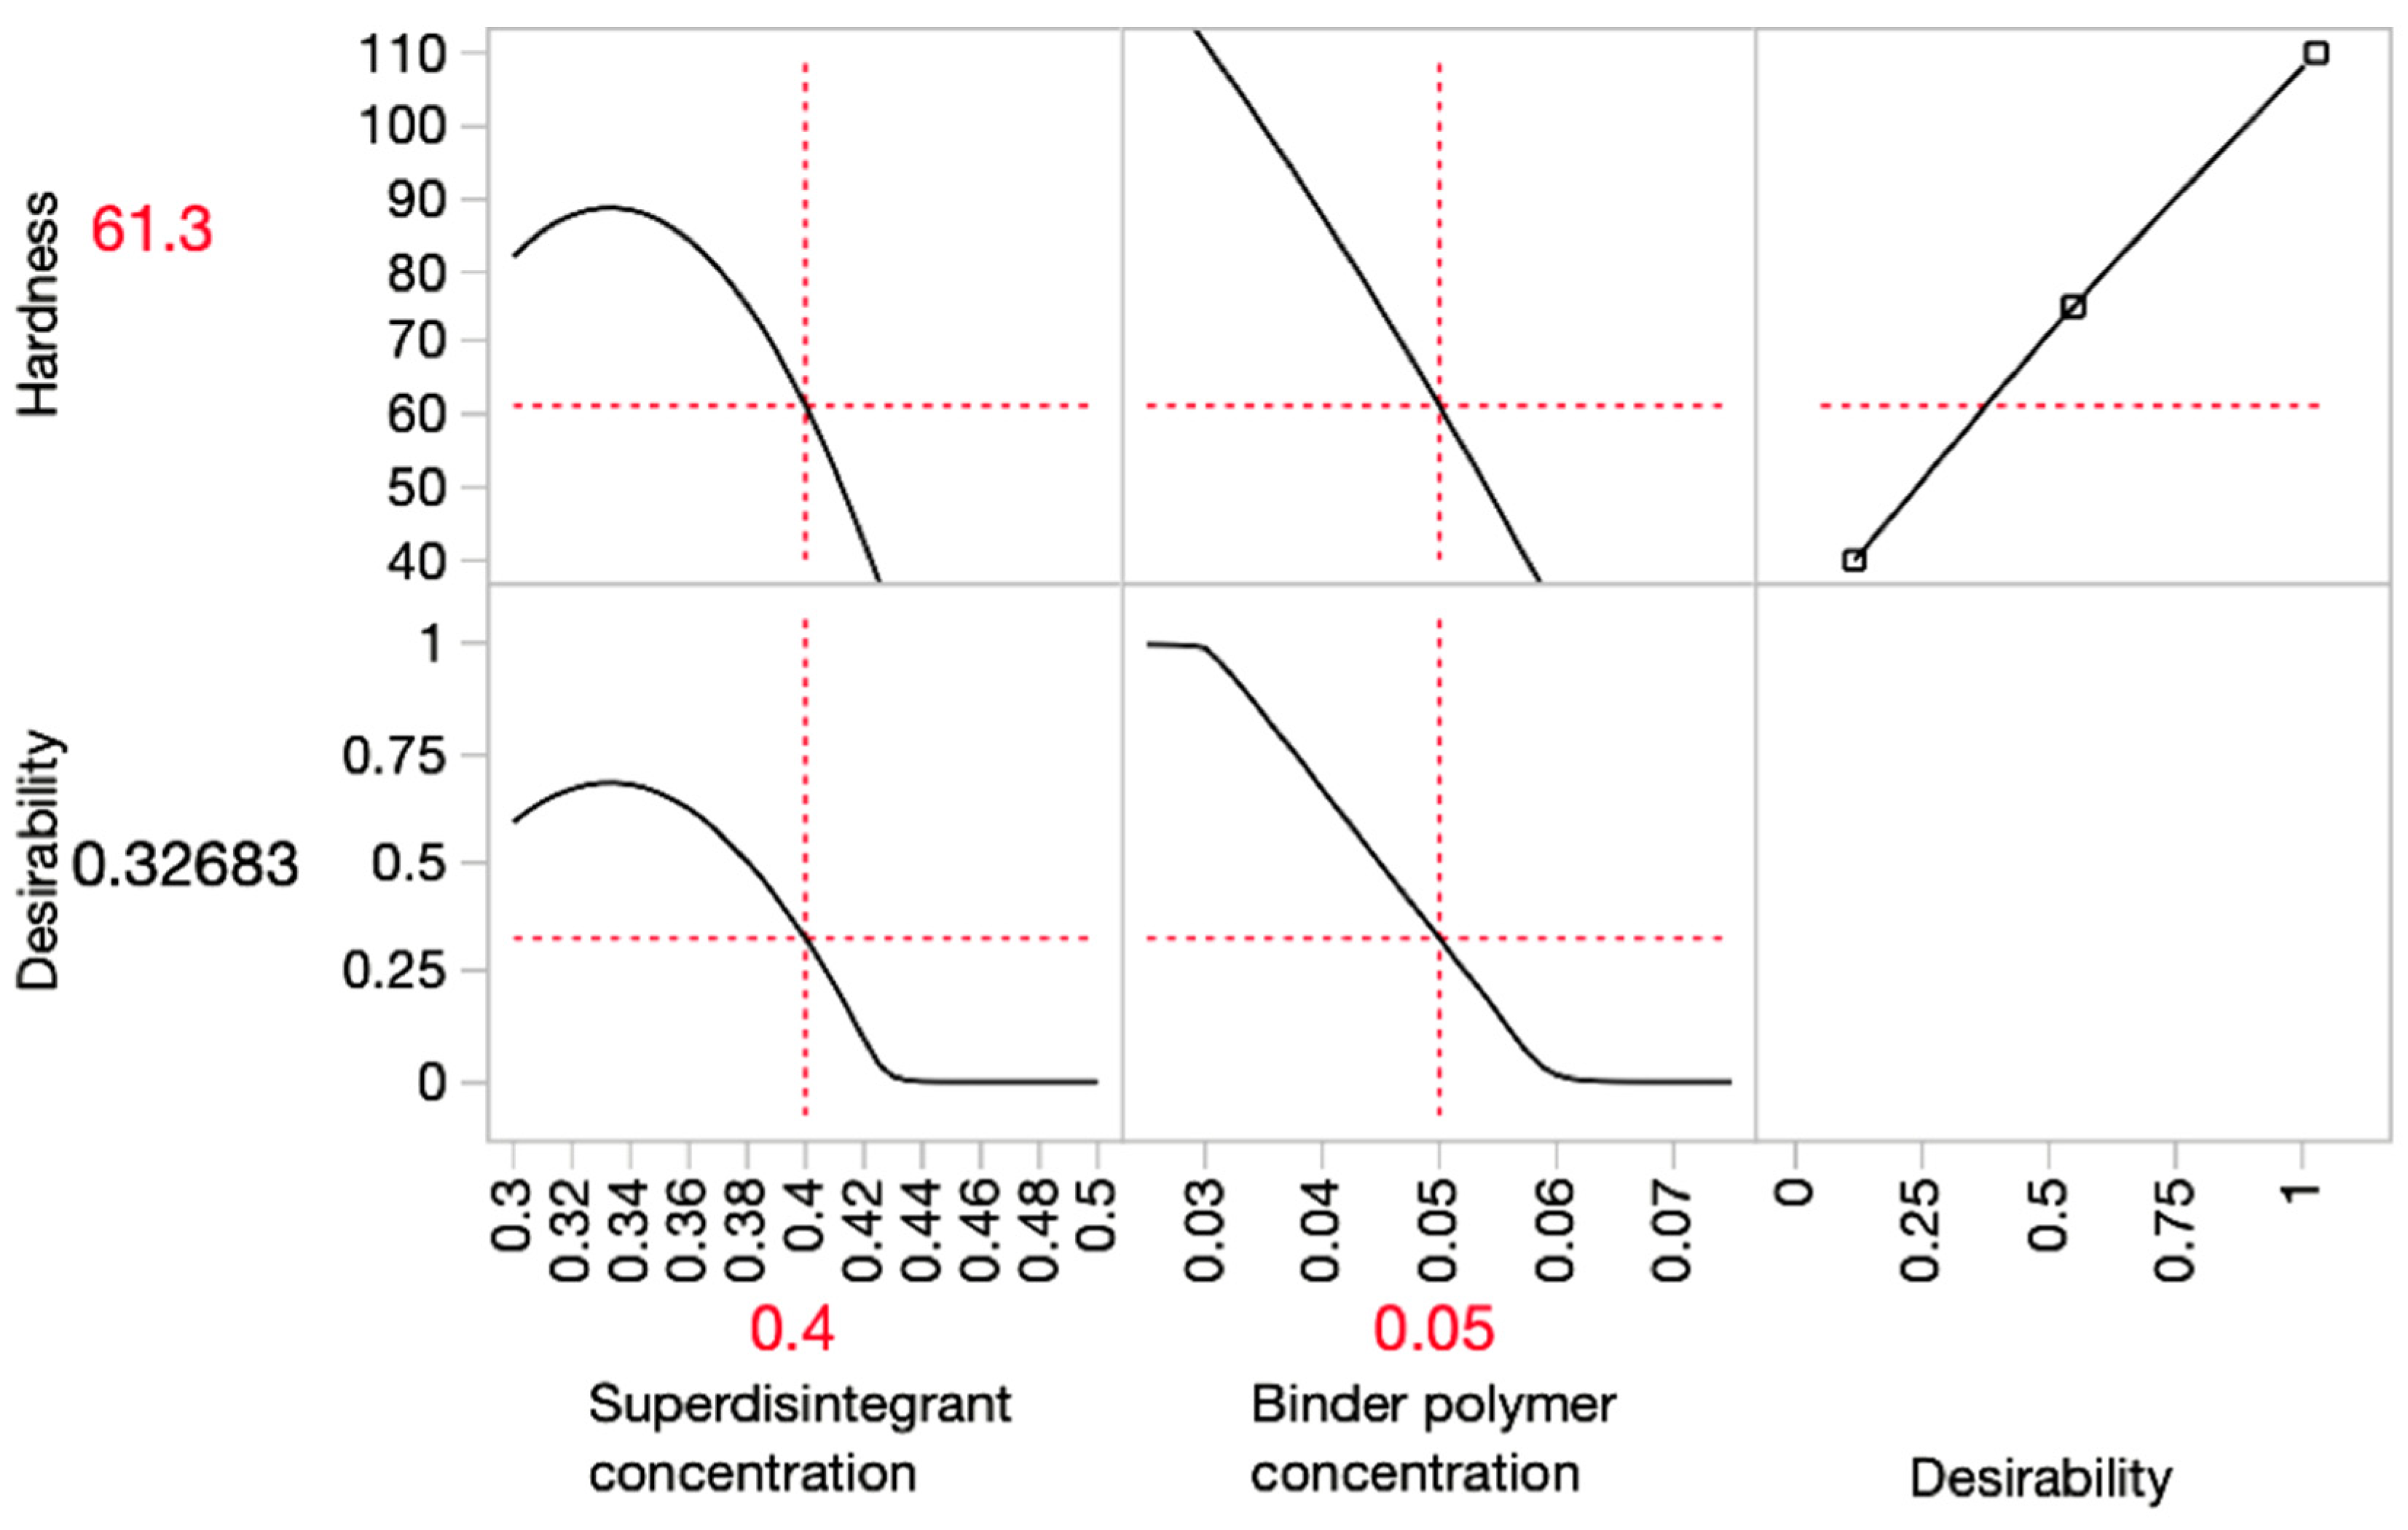
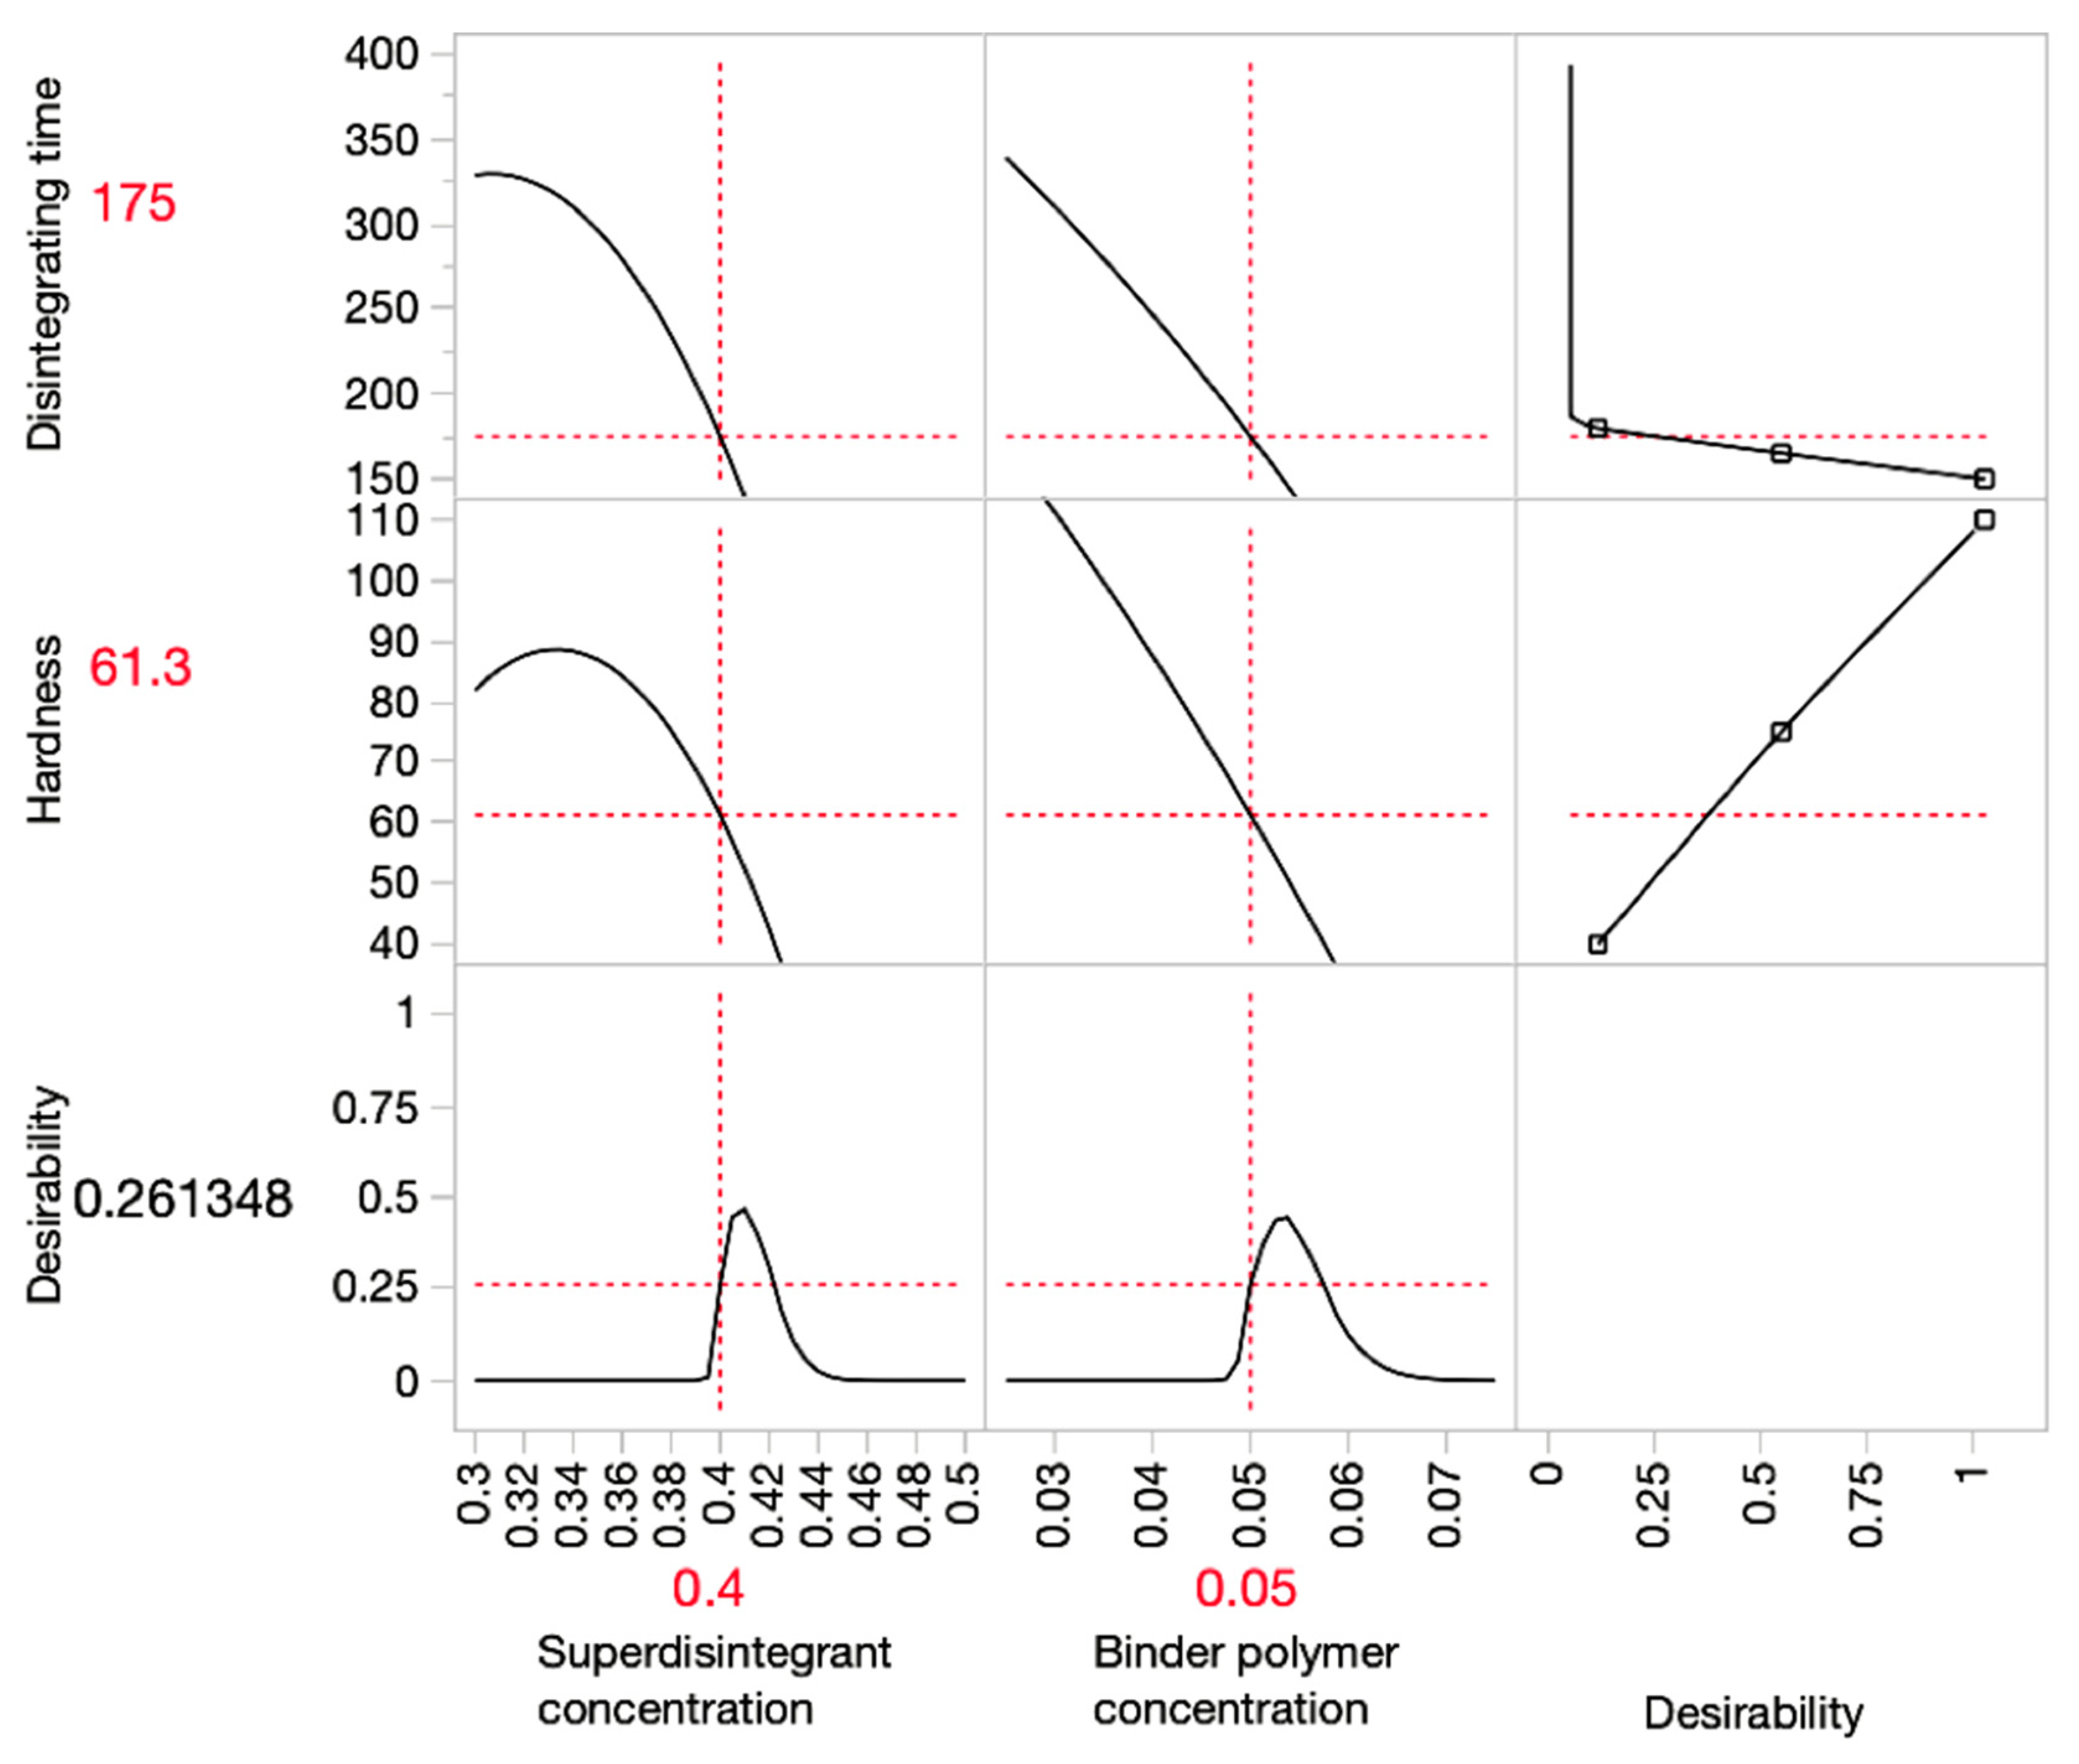
3.1.3. DoE Analysis and Optimisation of ODMT Formulation
3.2. Characterisation of Optimised CBZ ODMTs
3.2.1. Characterisation Compared with Blank Formulation
3.2.2. Further Characterisation of Drug-Loaded ODMTs
Friability
Content Assay
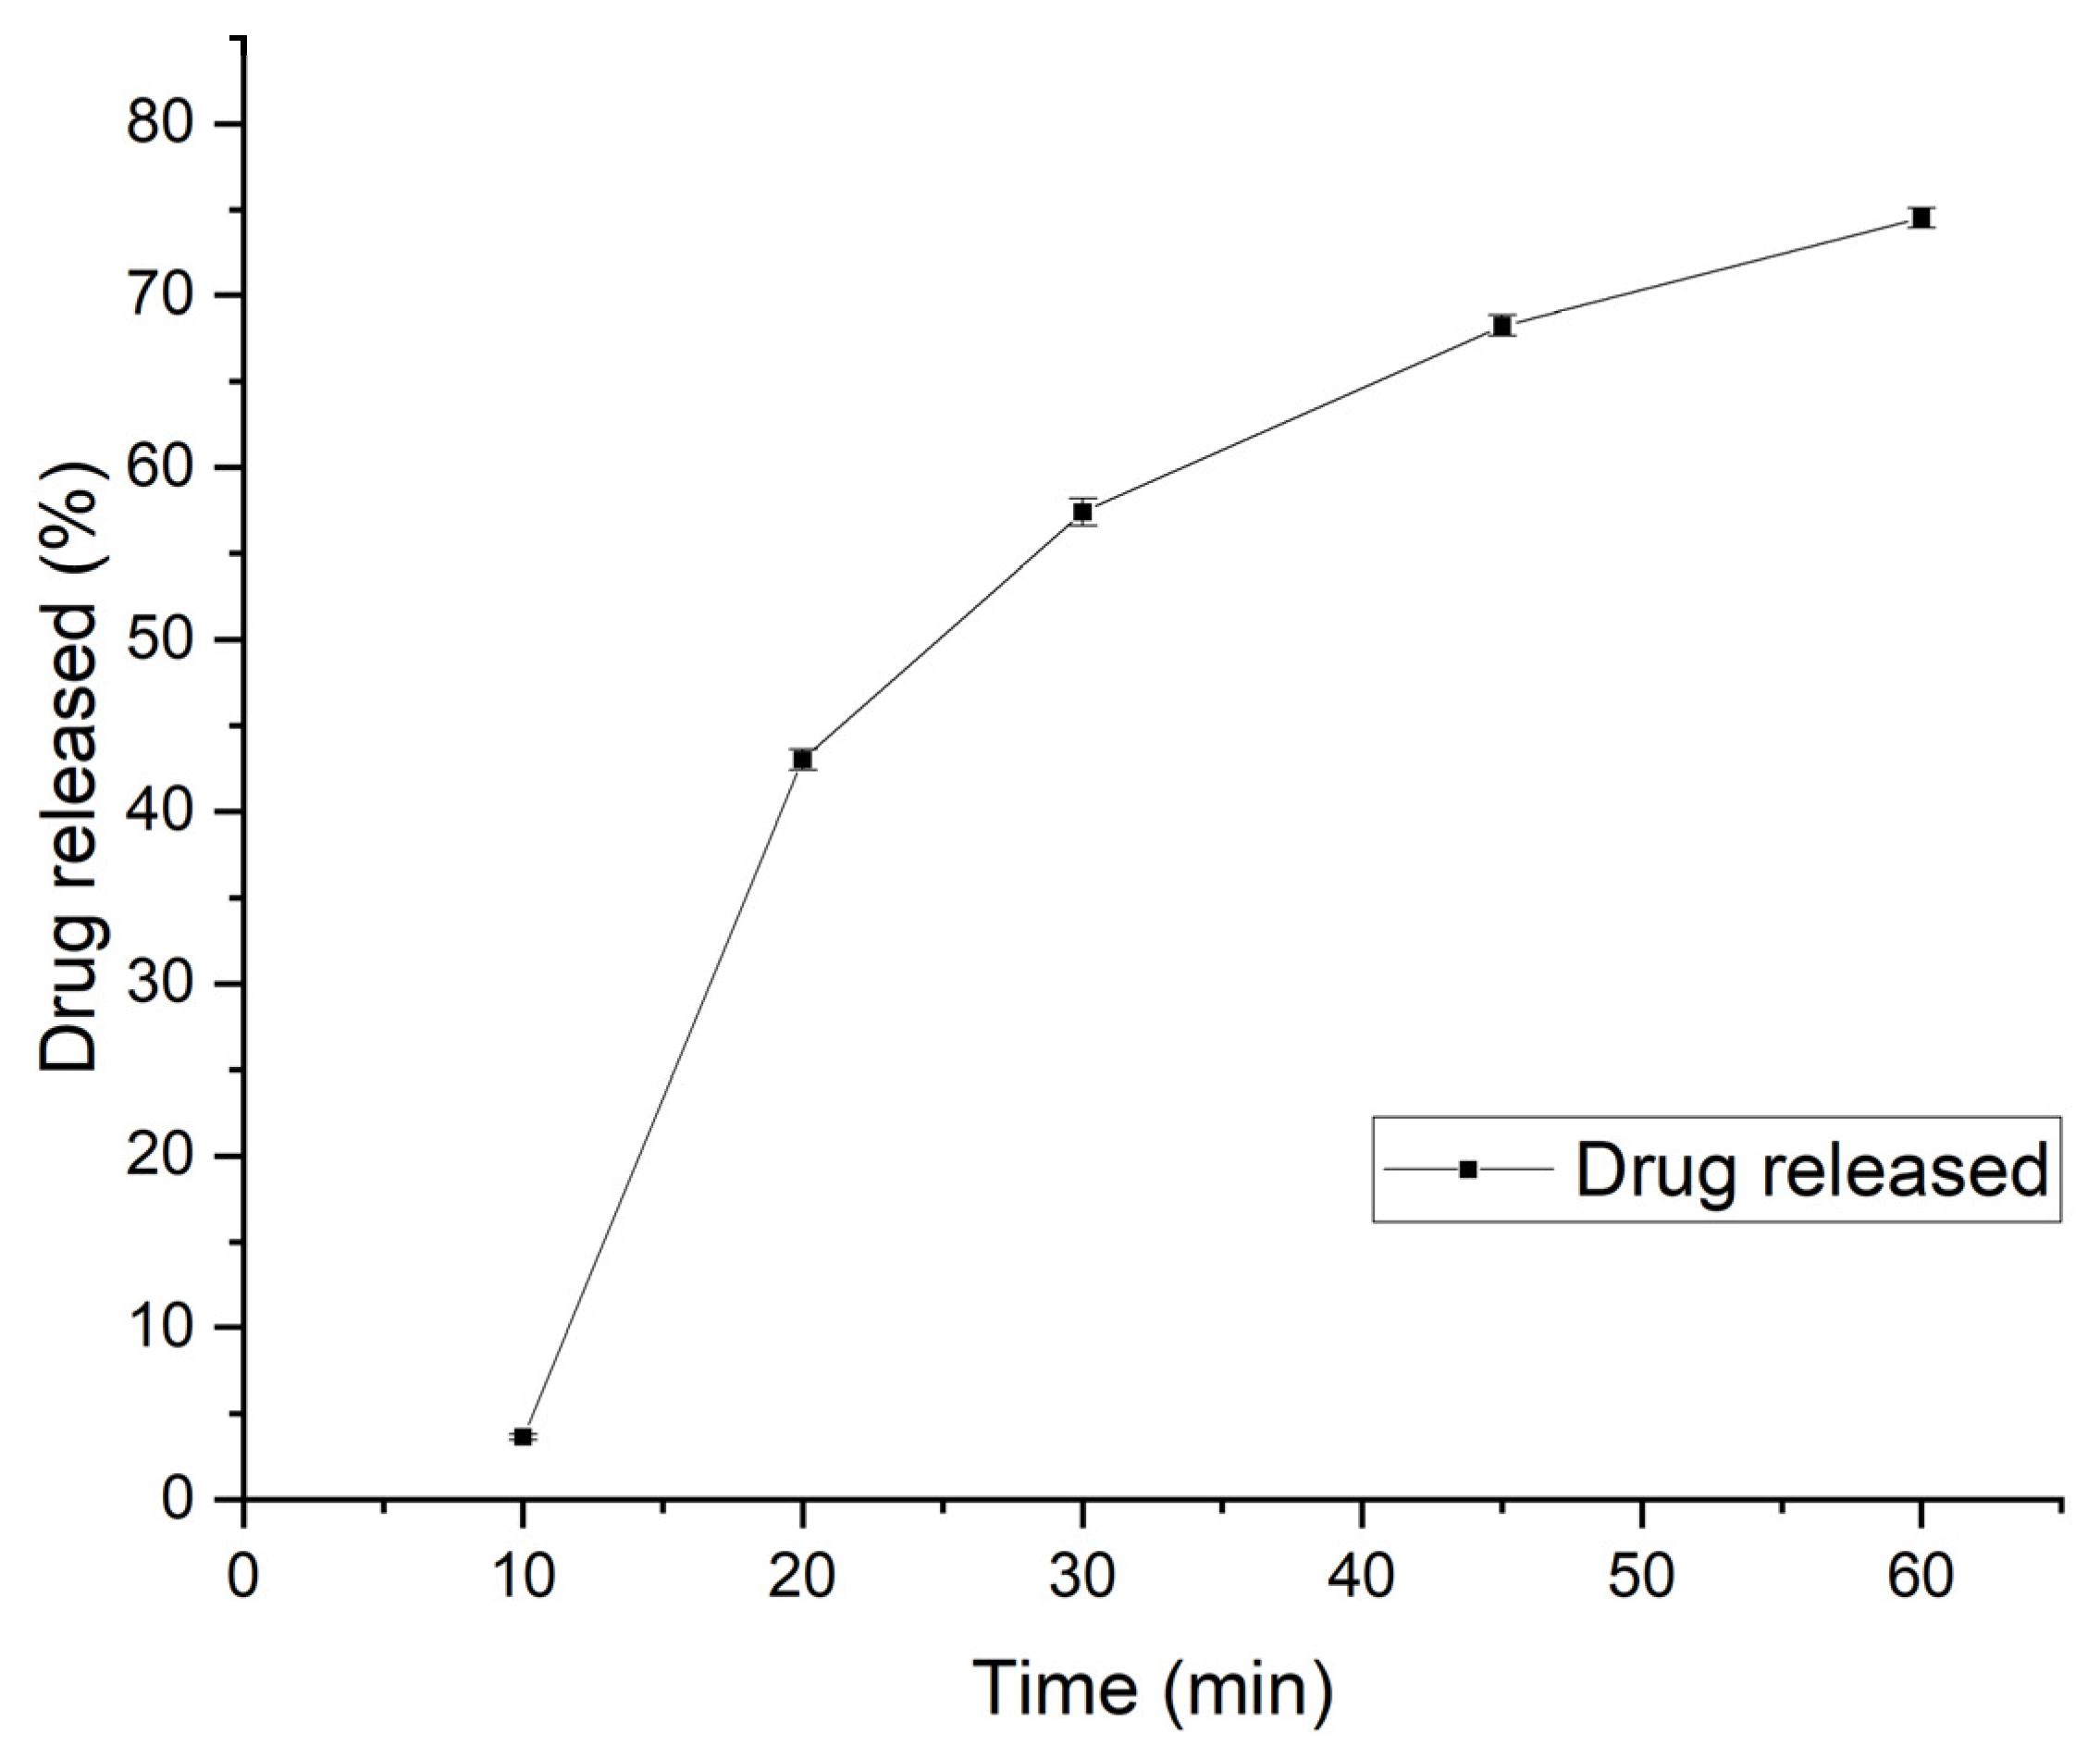
Dissolution Profile
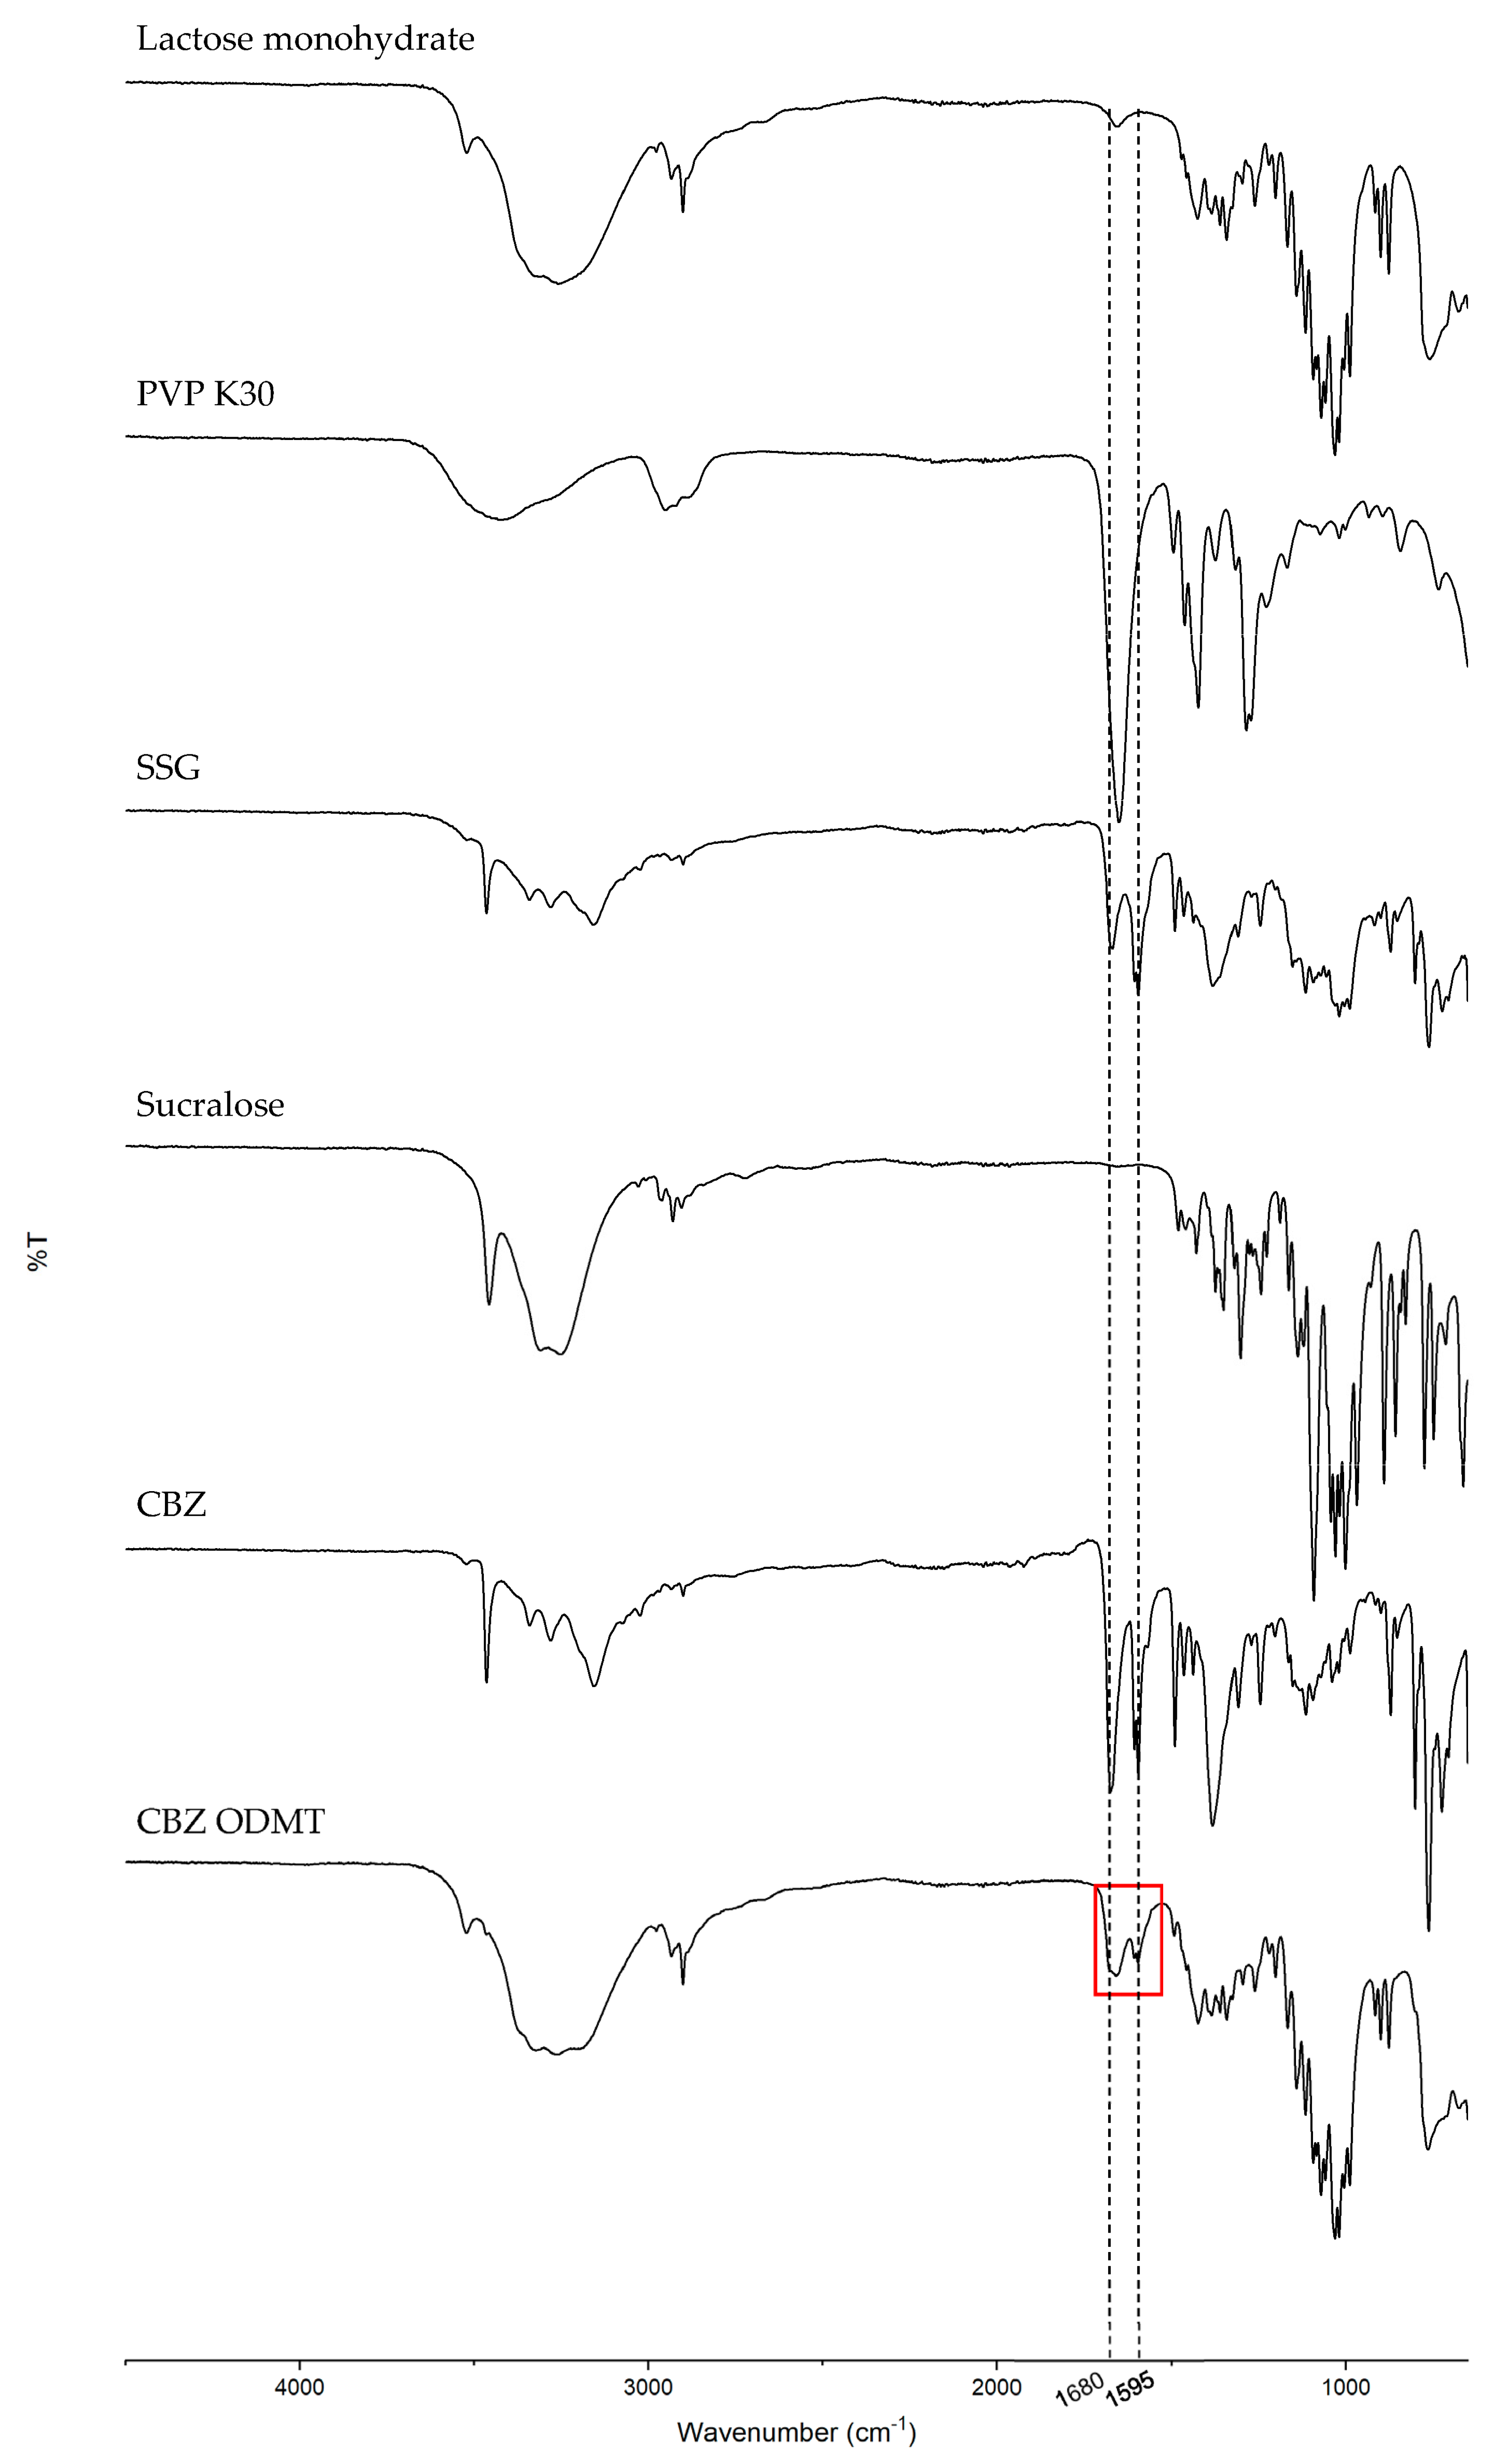
FTIR
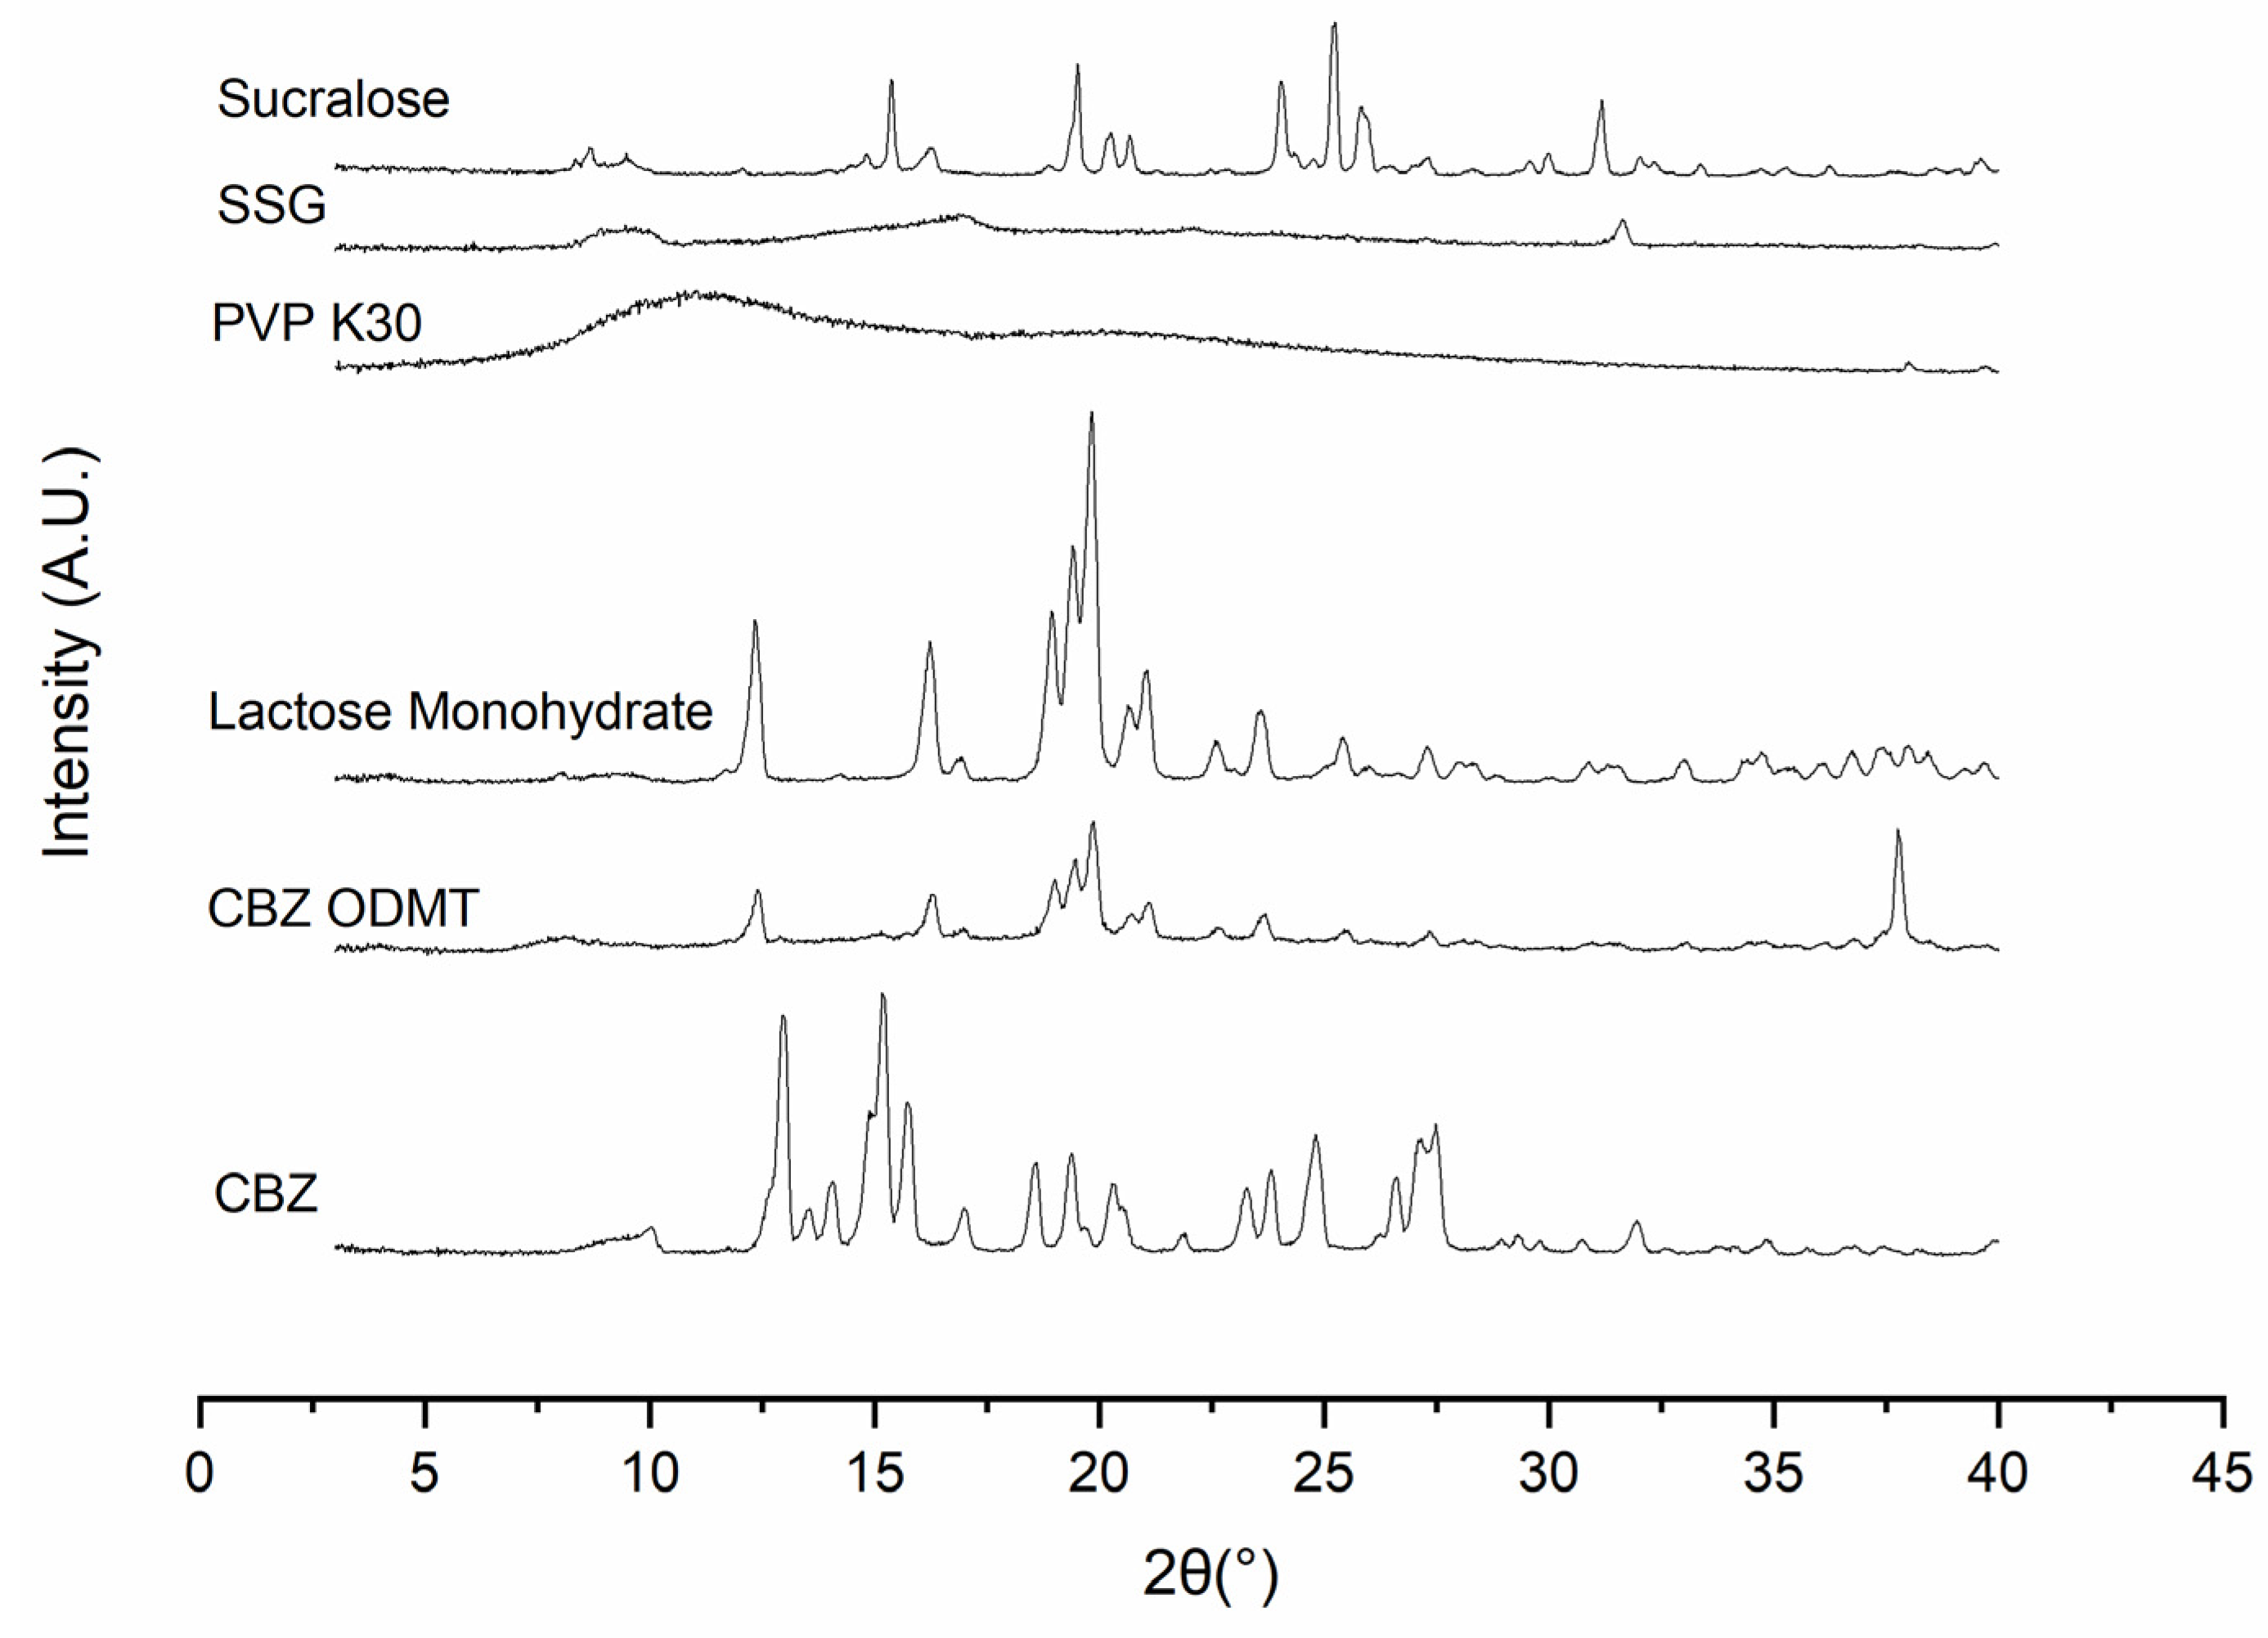
XRD
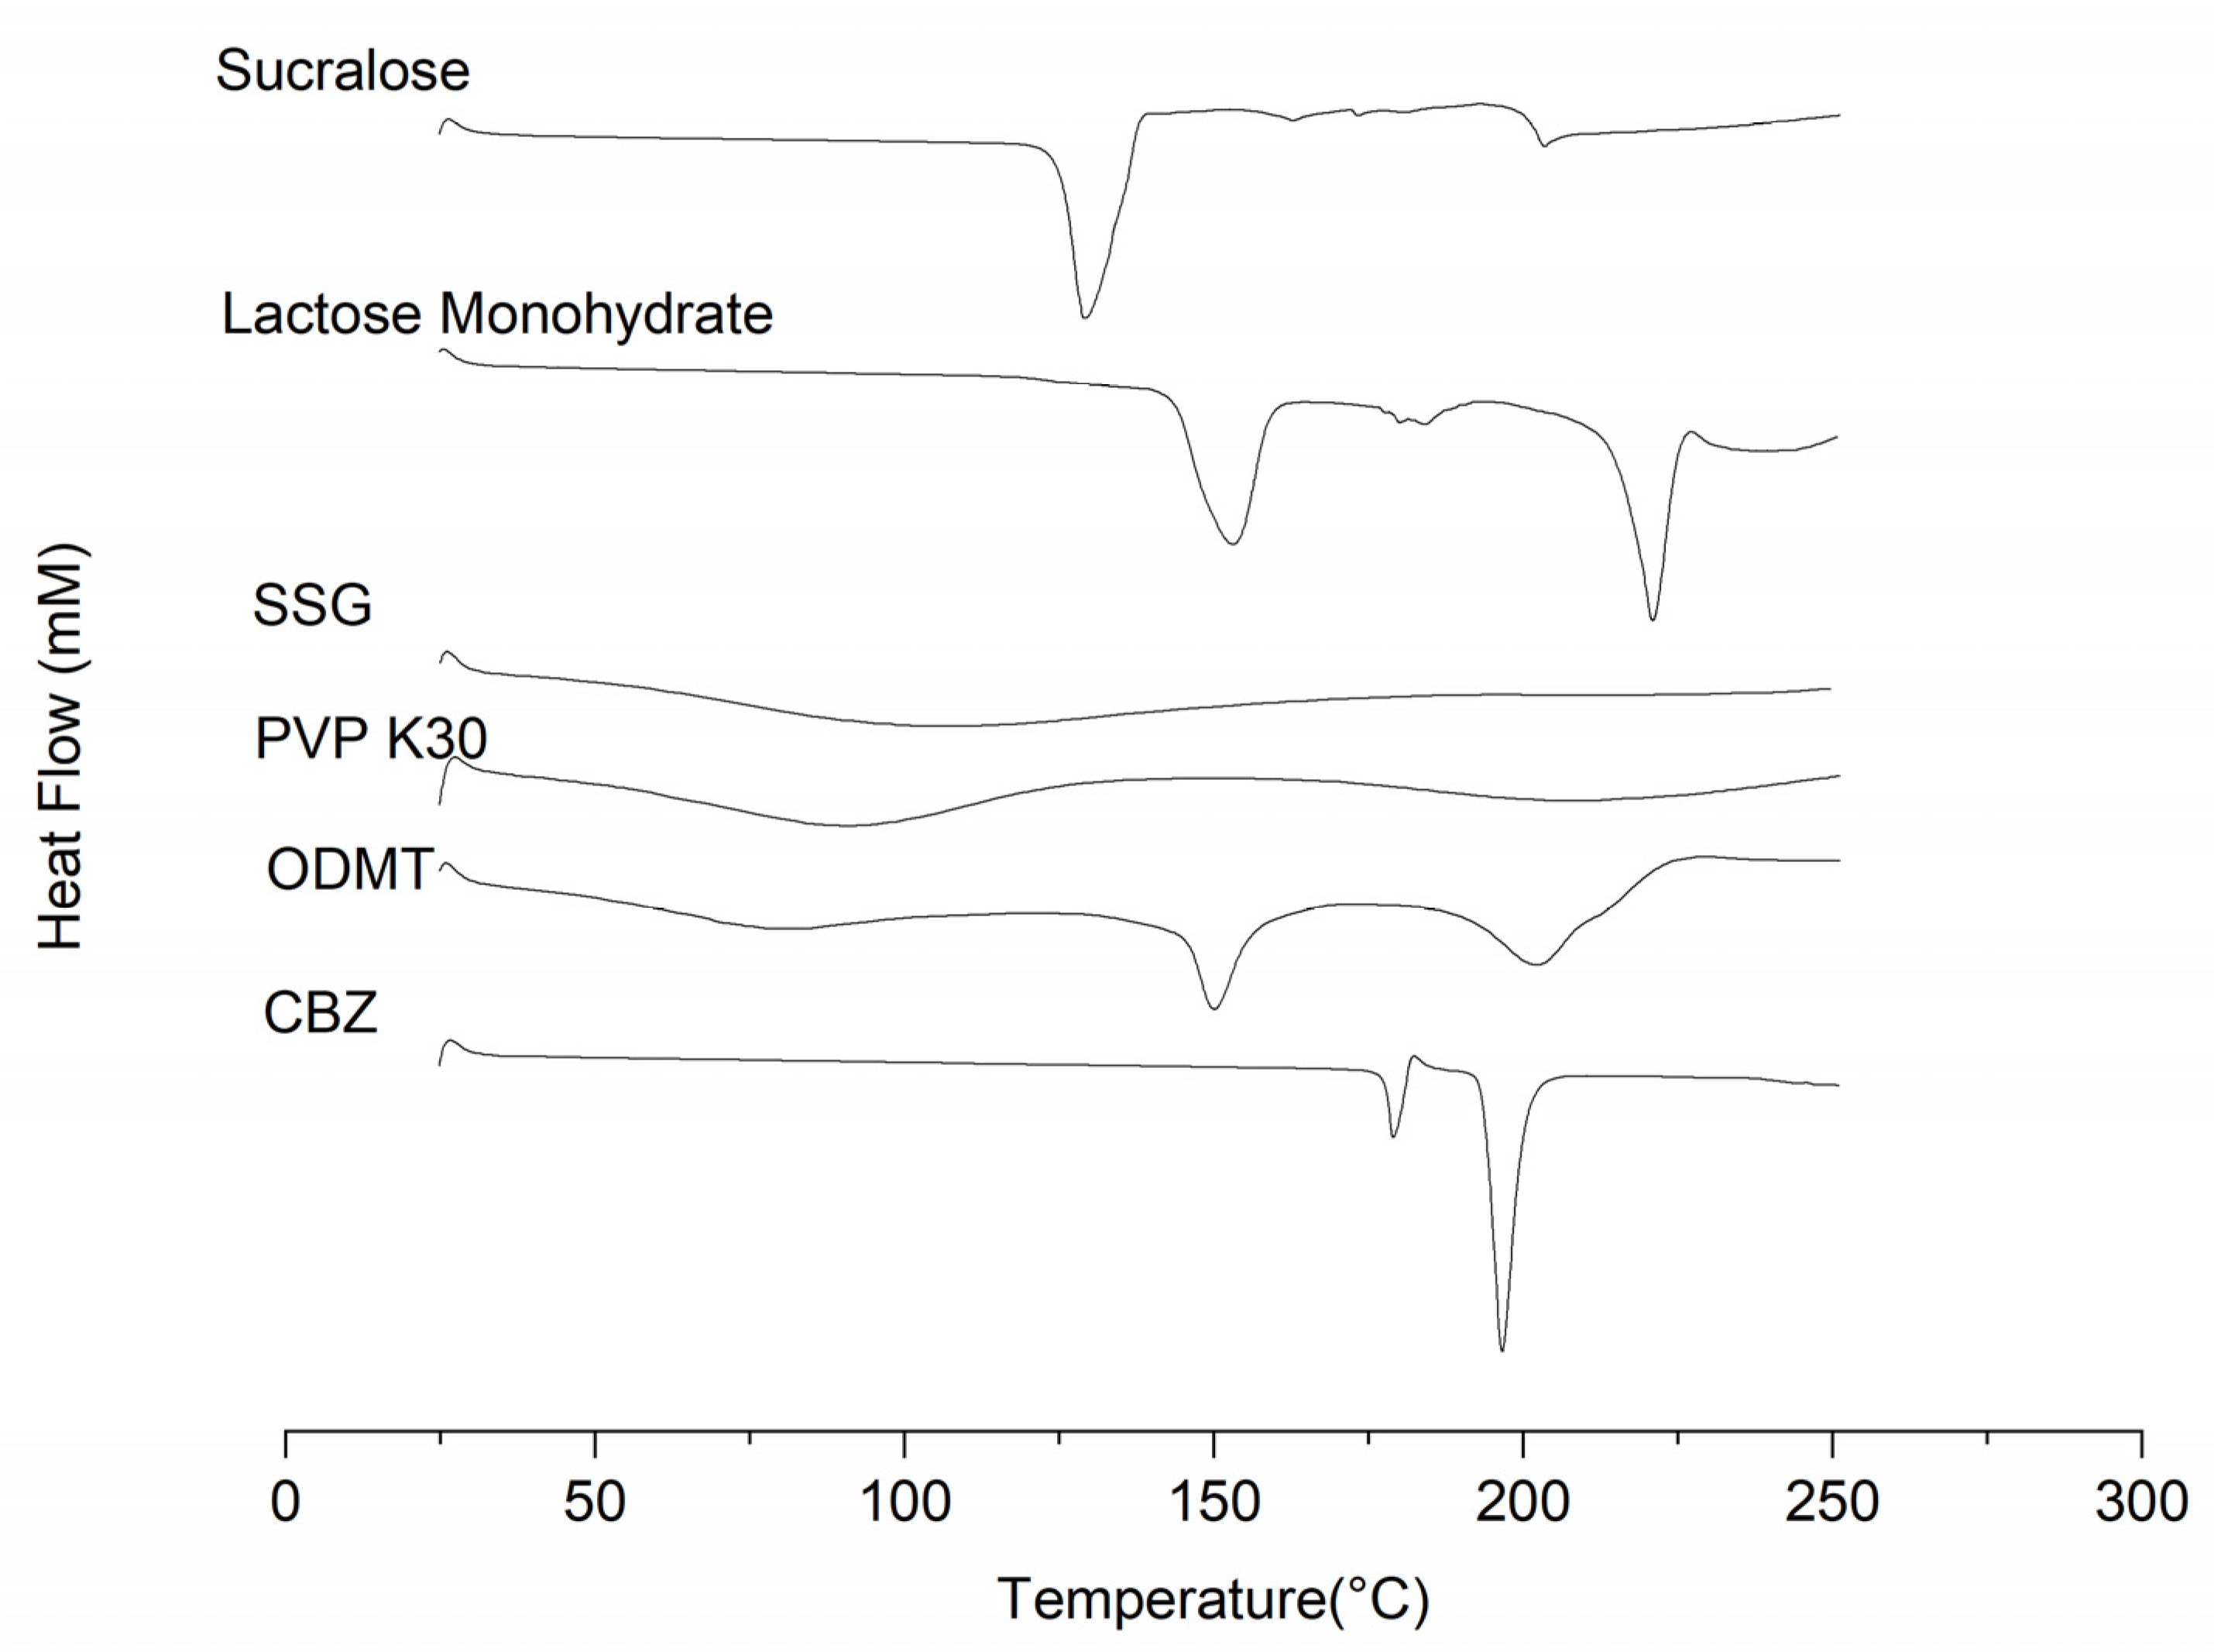
DSC
3.3. Electronic Taste Sensing System Measurement of CBZ ODMTs
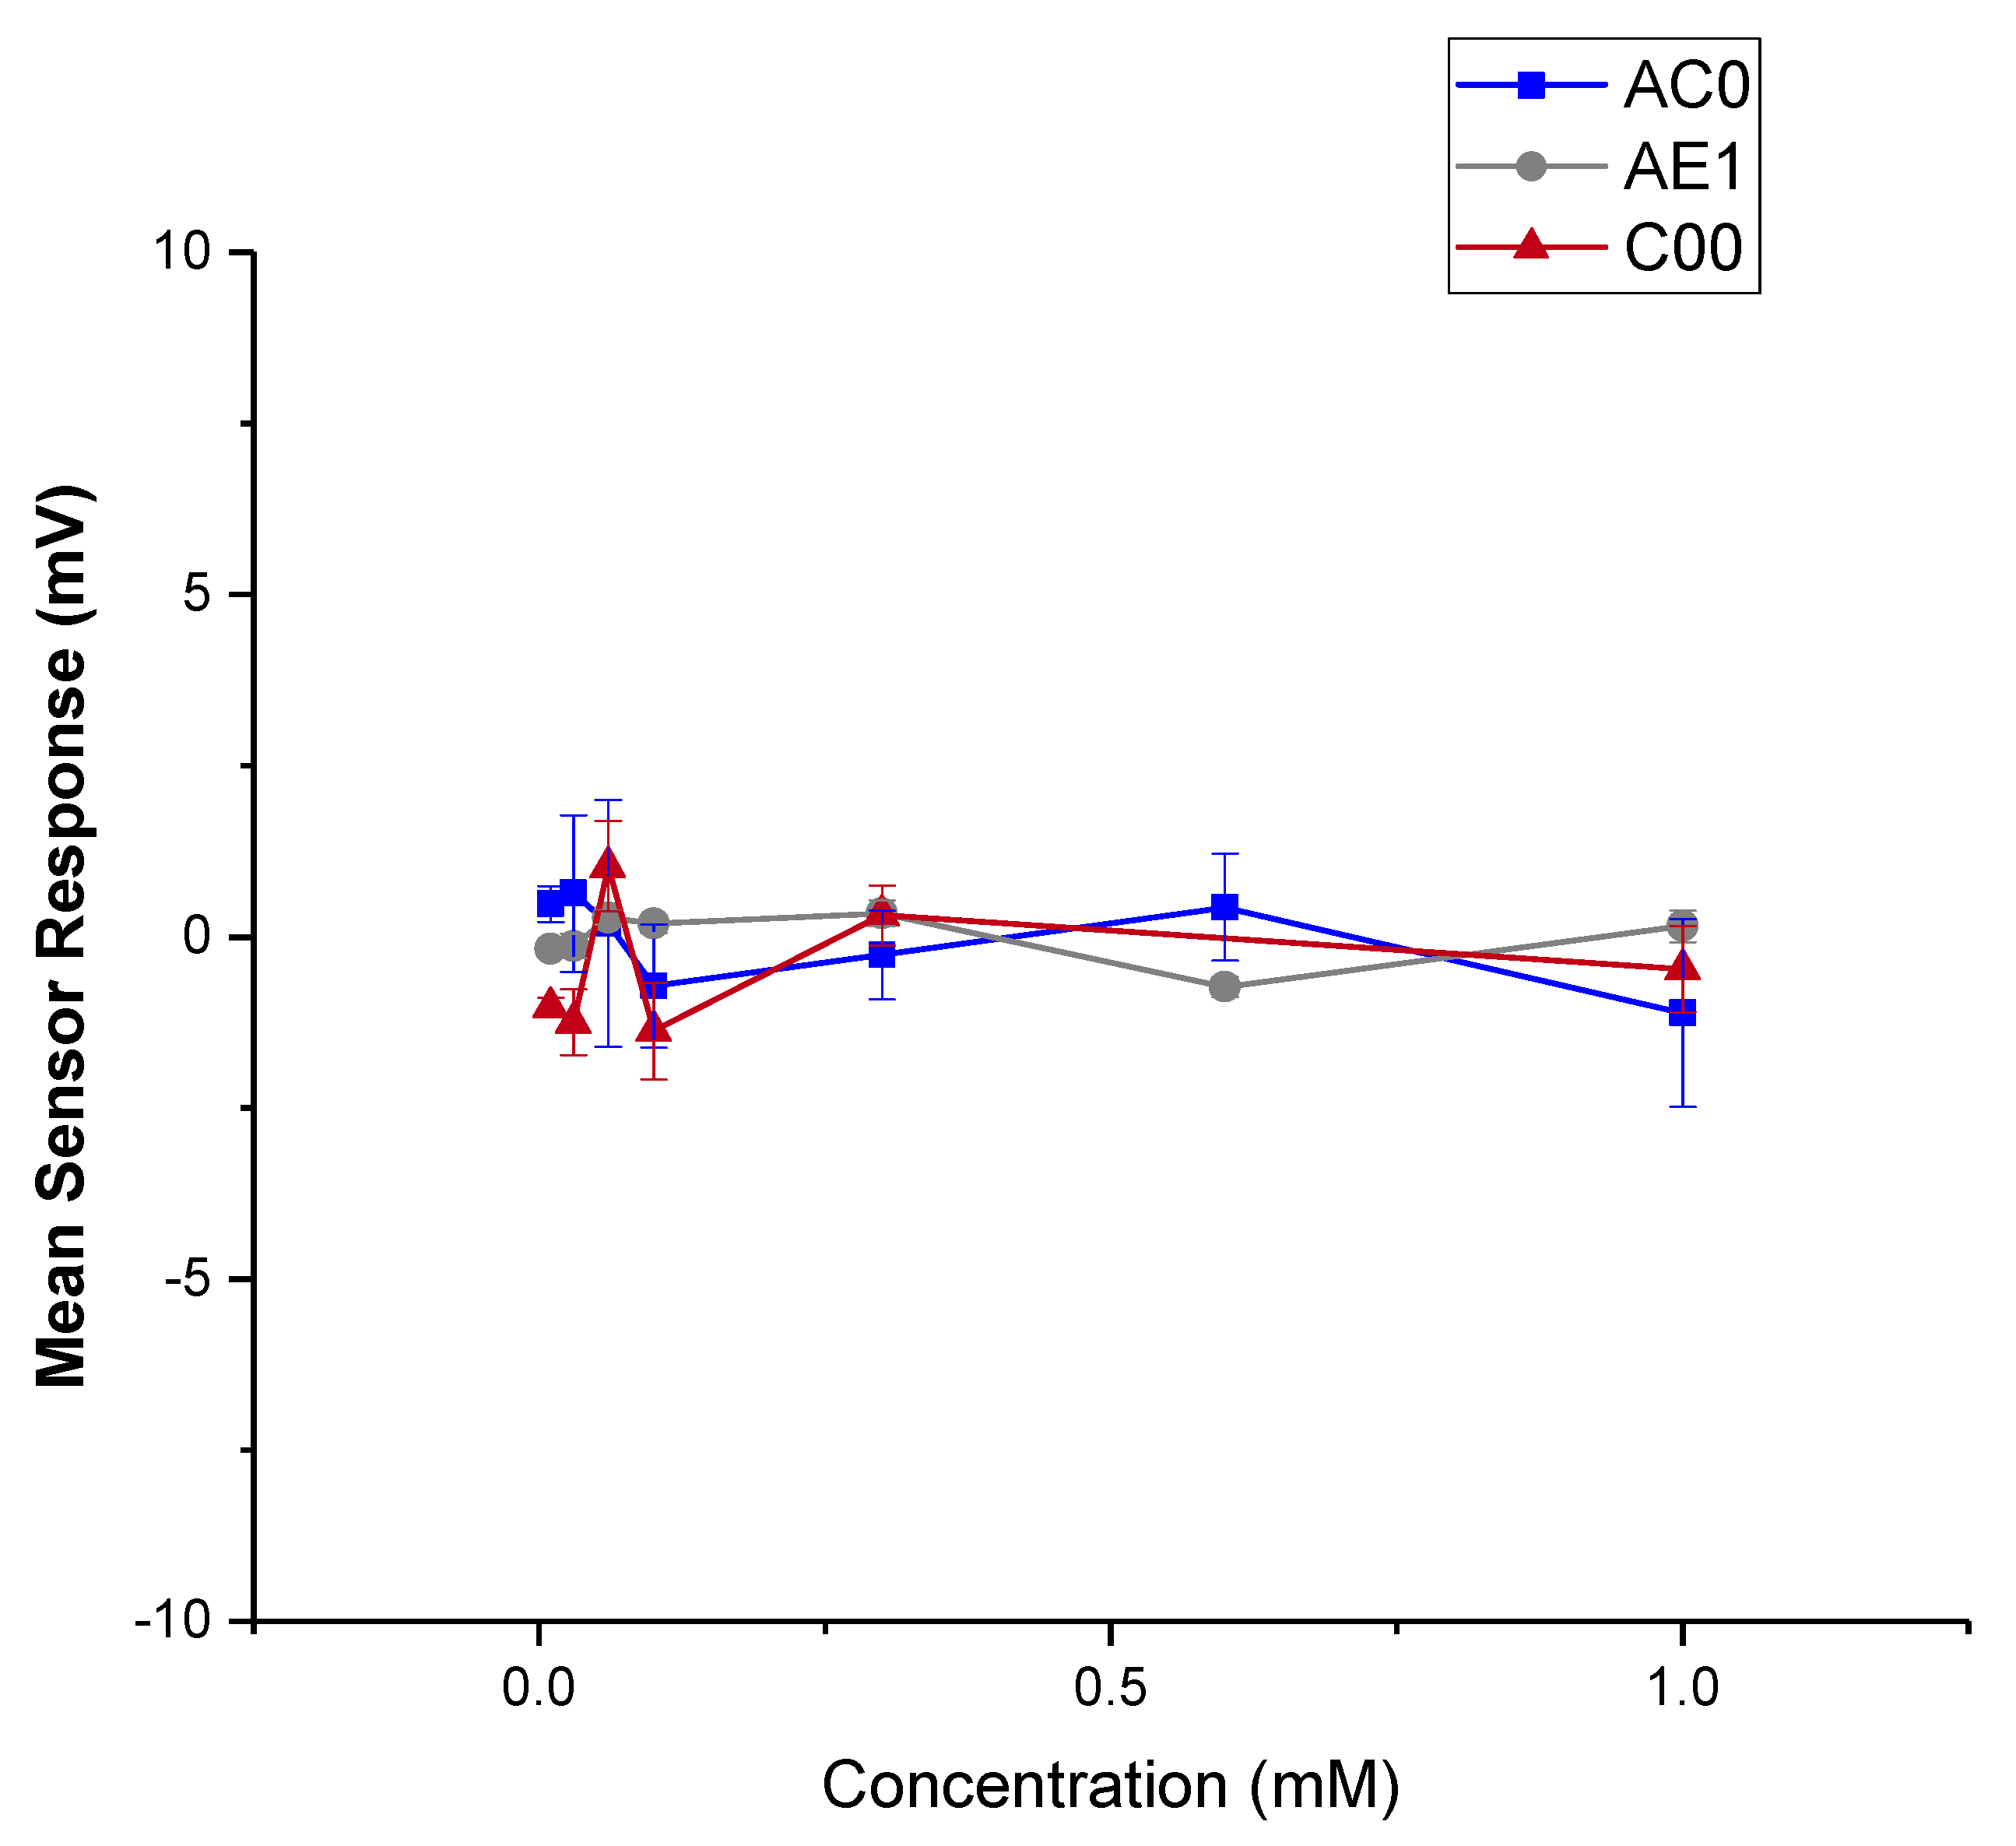
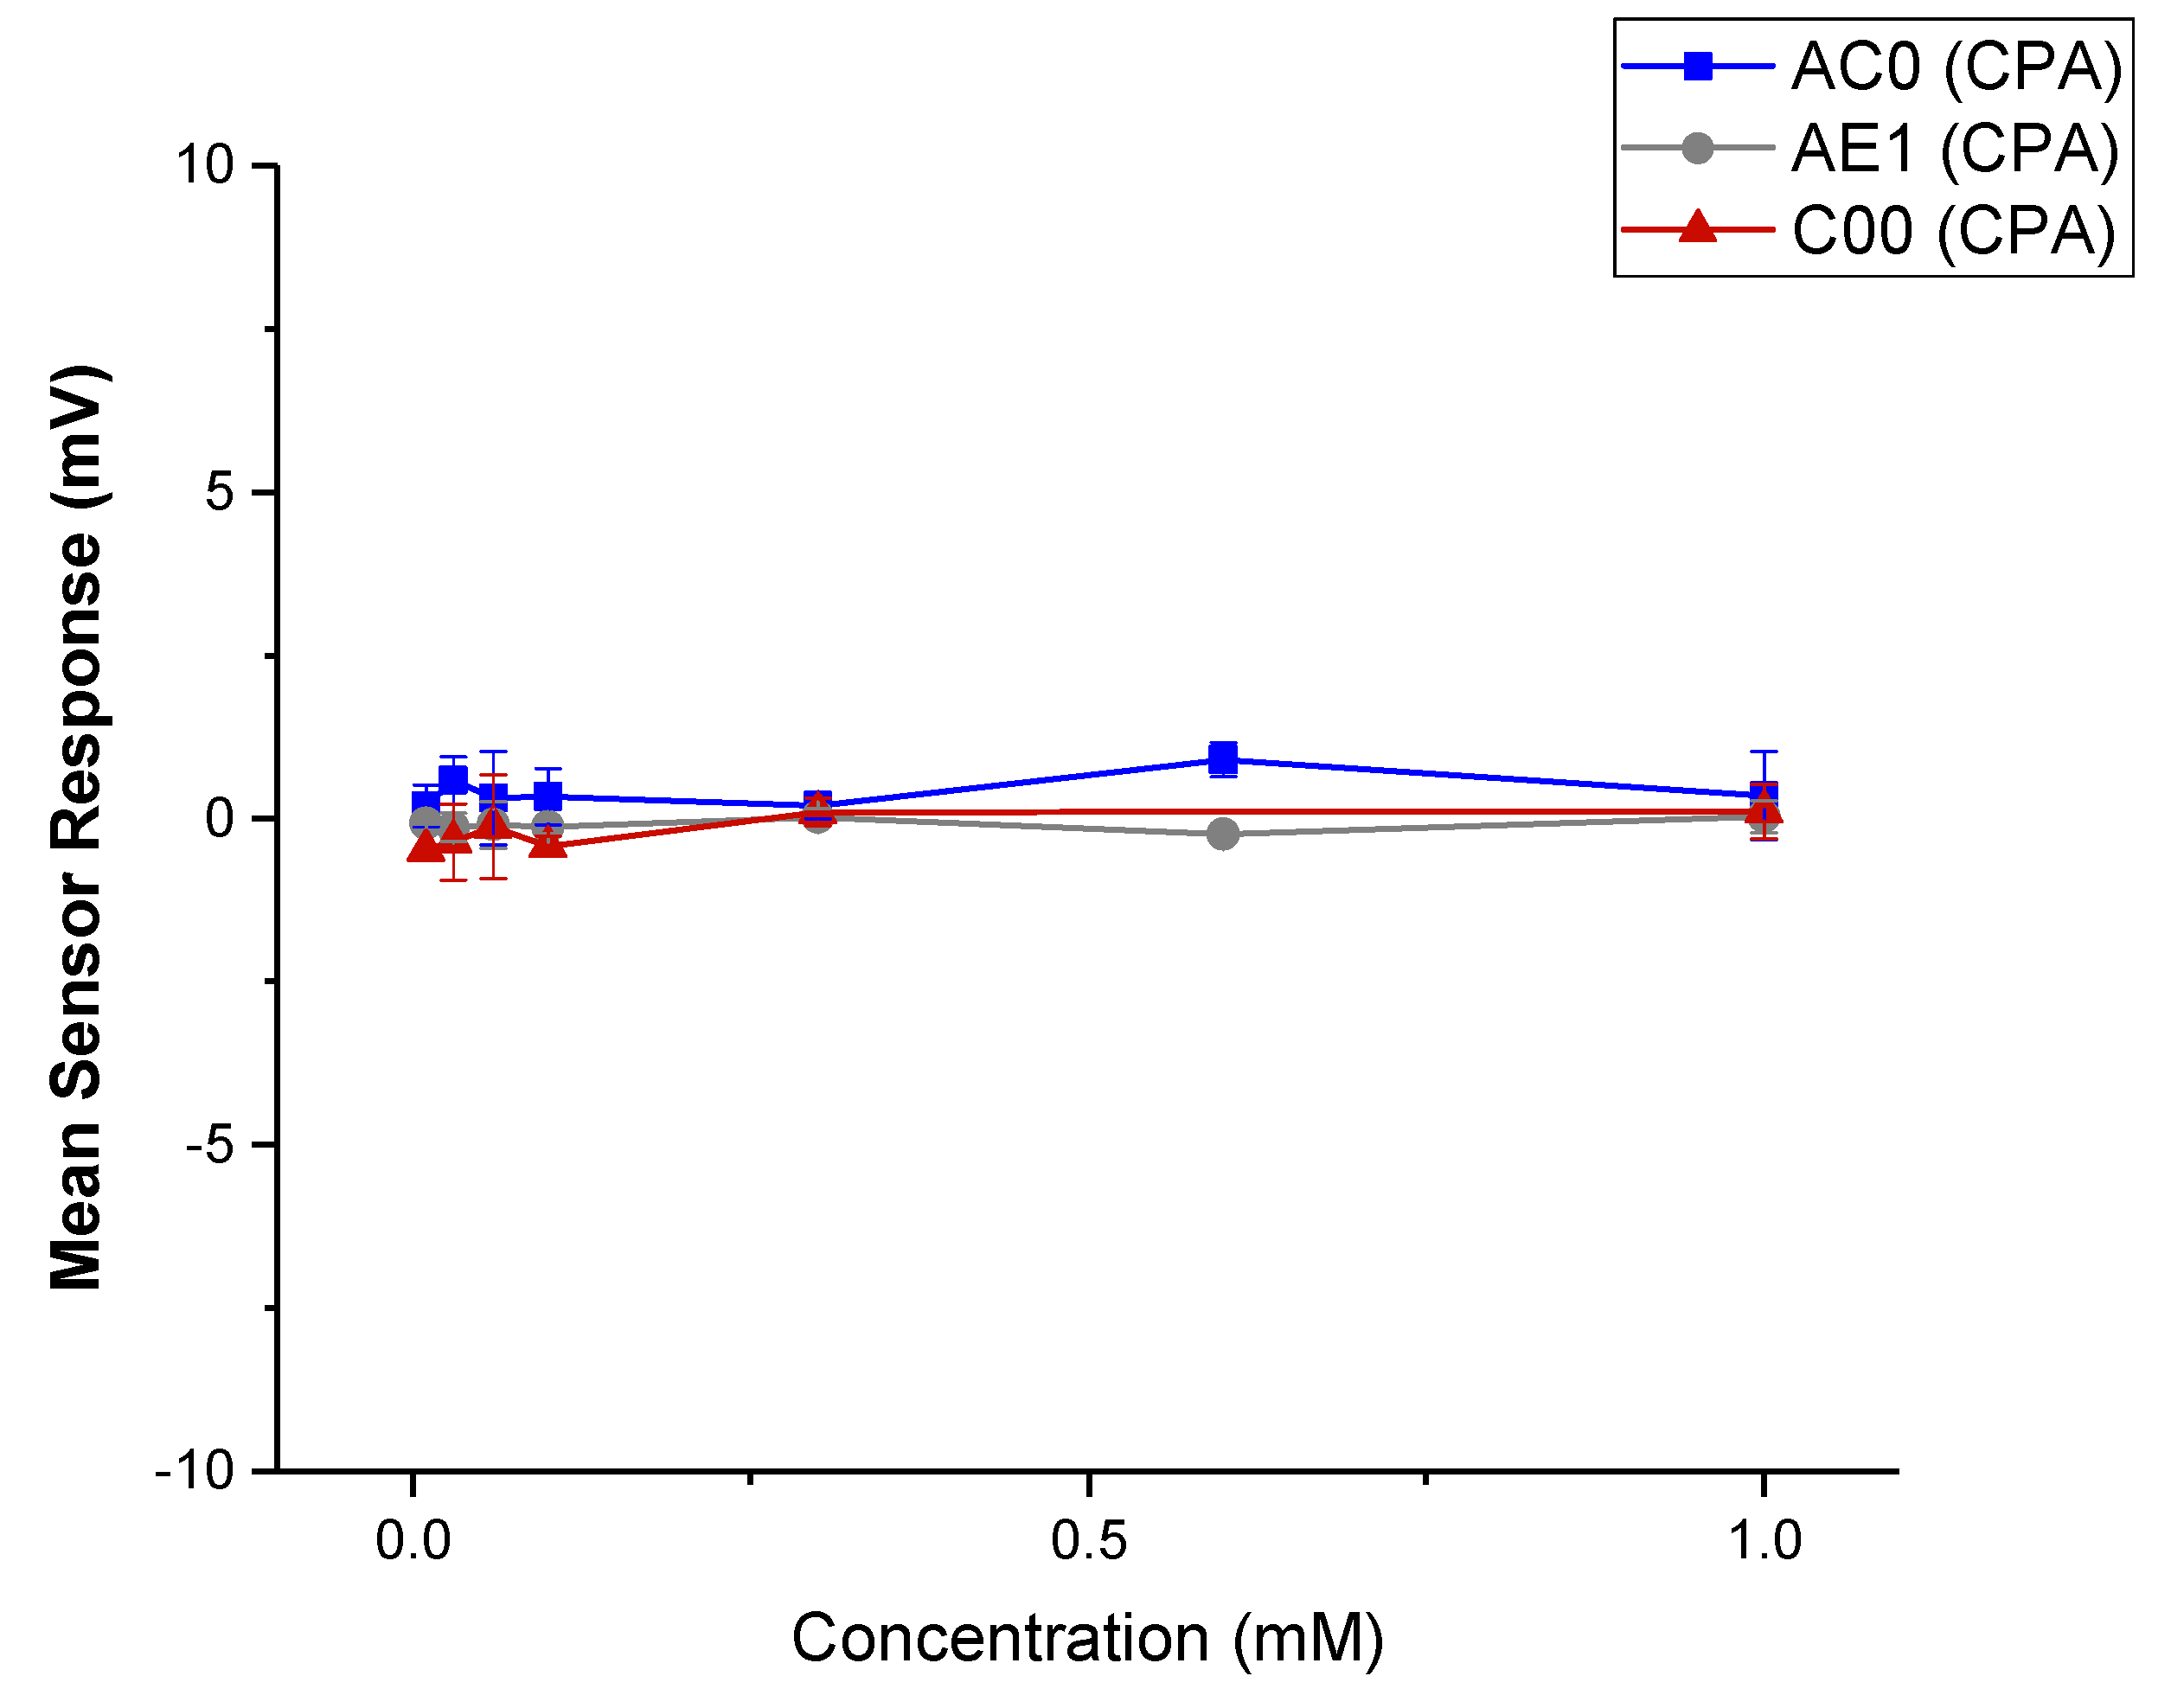
3.3.1. Dose Response Curve of CBZ
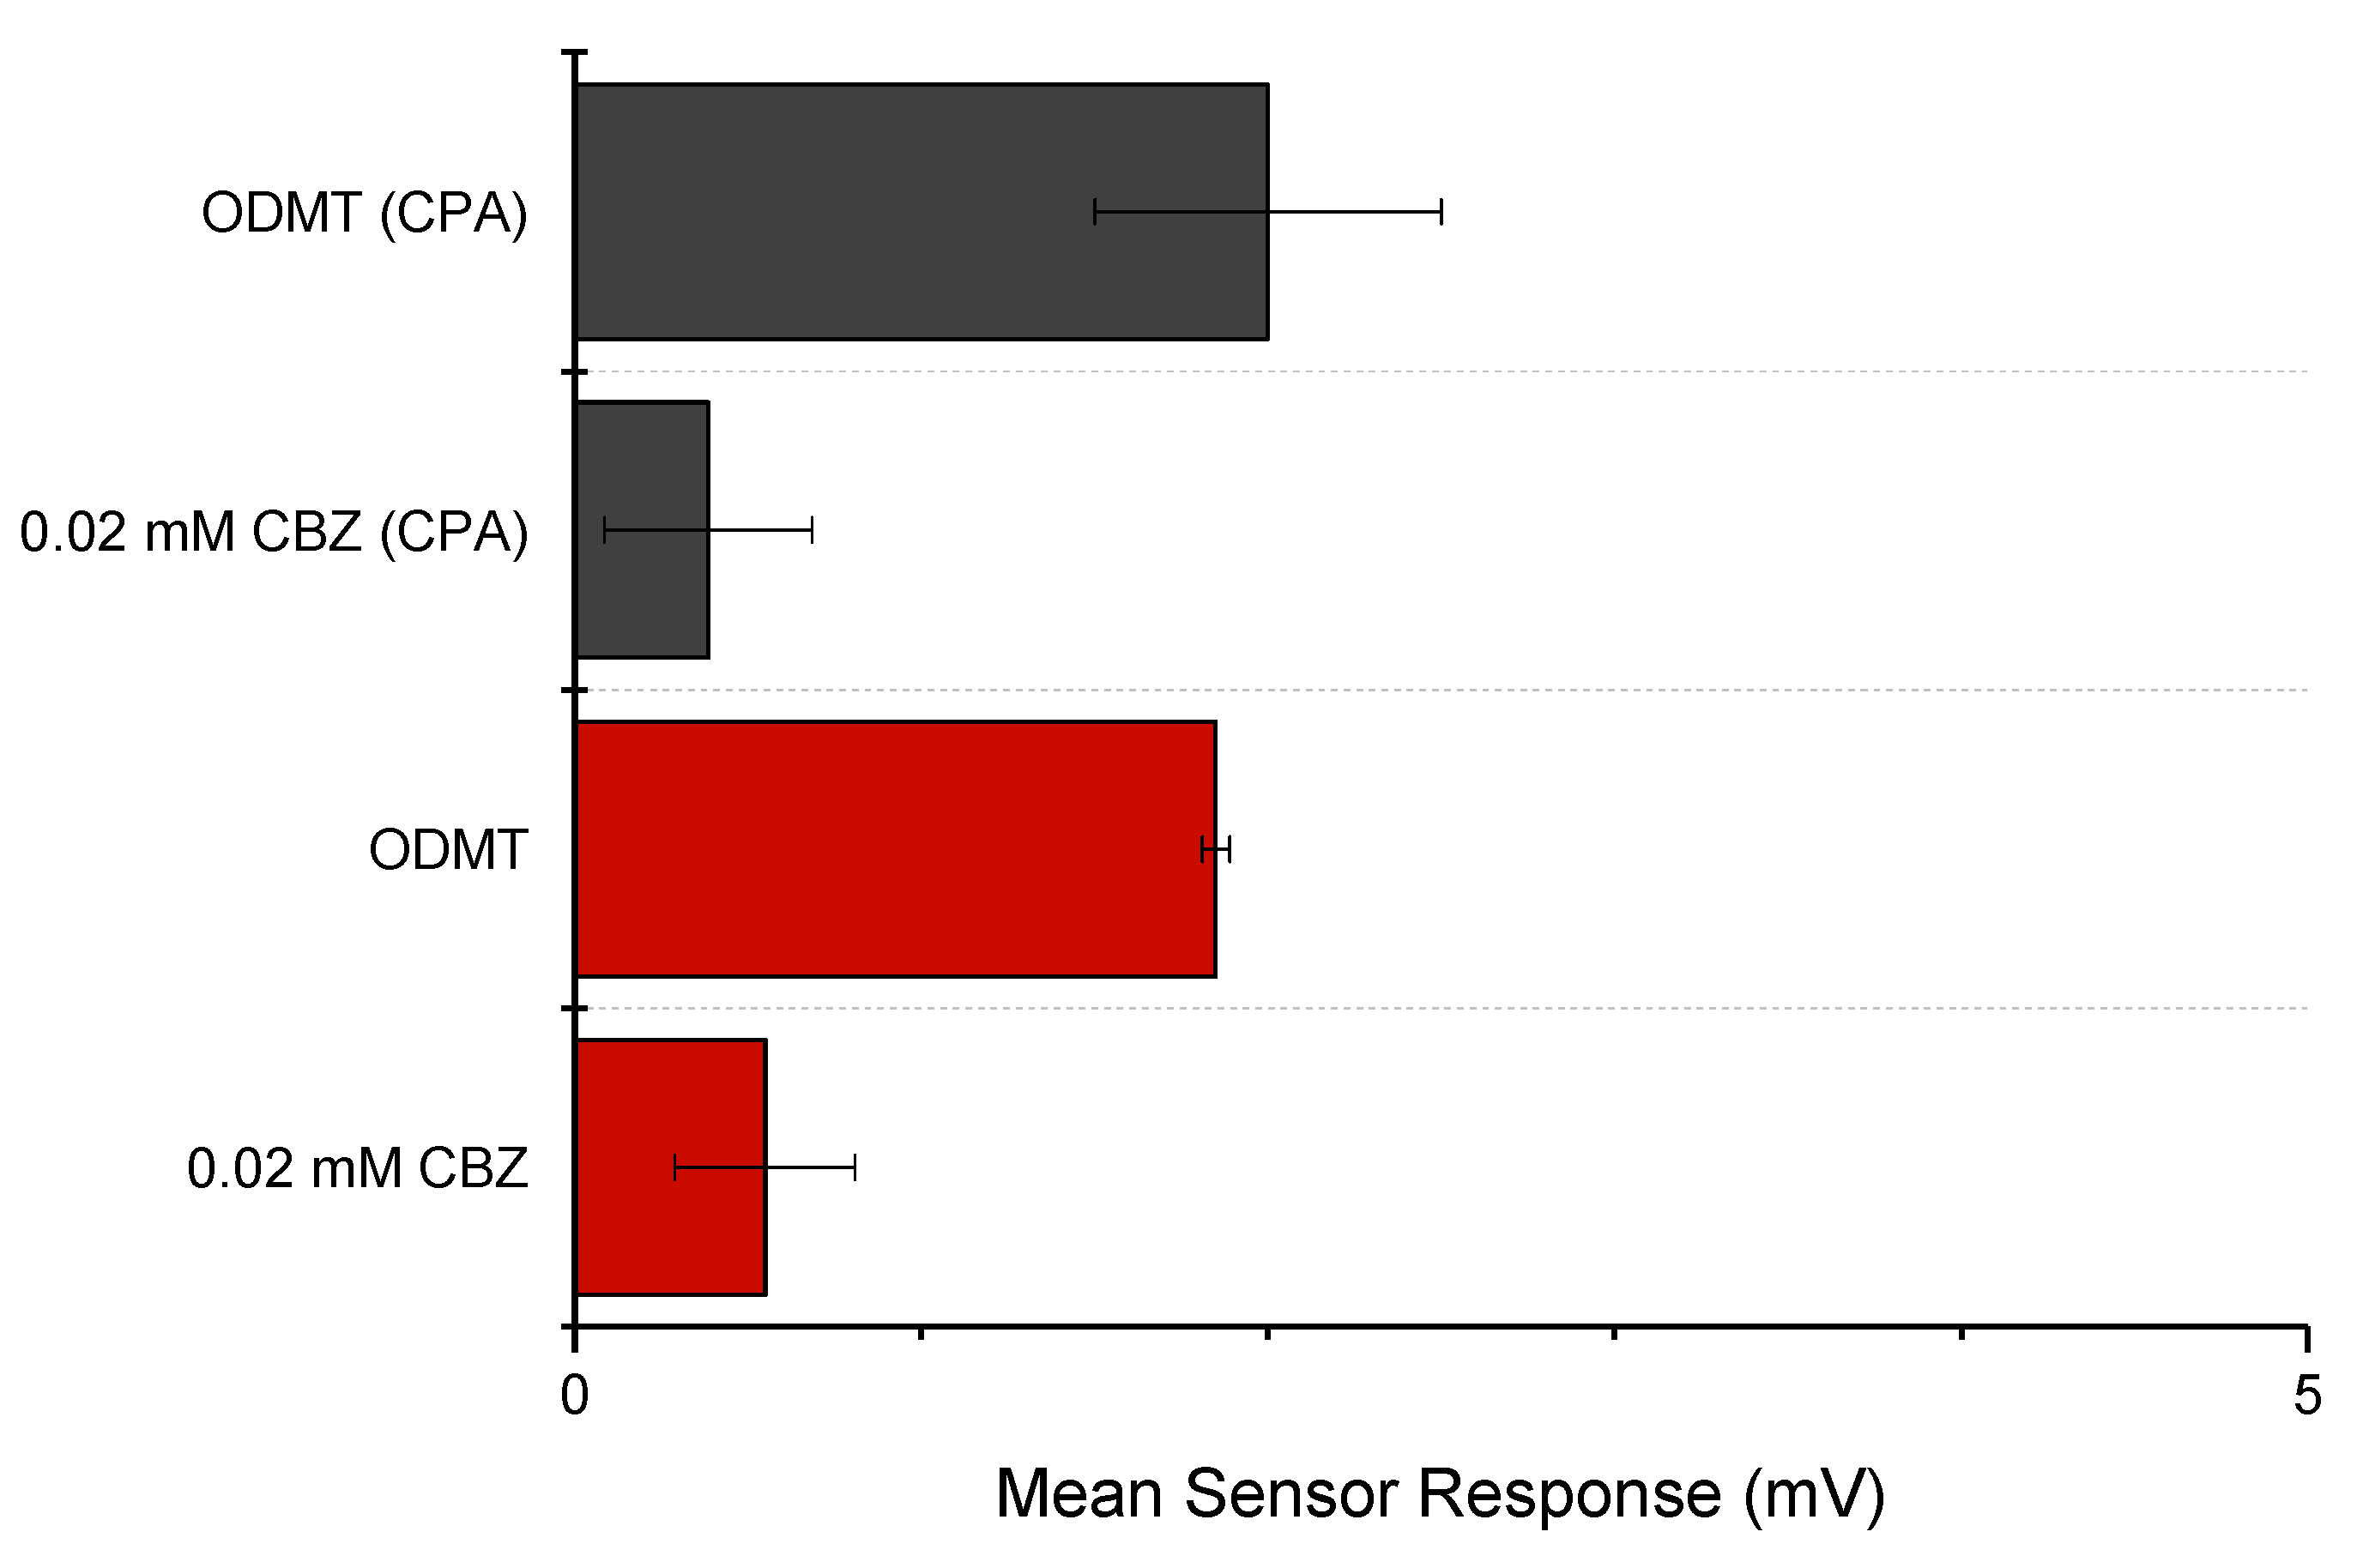
3.3.2. Taste-Assessment of CBZ ODMTs
4. Conclusions
Author Contributions
Funding
Institutional Review Board Statement
Informed Consent Statement
Data Availability Statement
Conflicts of Interest
Appendix A

| Solution Name | Preparation |
|---|---|
| Washing solution (−) | 150 mL ethanol mixed with 250 mL deionised water and 50 mL 1 M HCl, then diluted with deionised water to 500 mL |
| Washing solution (+) | 250 mL 0.2 M KCl, 150 mL ethanol and 5 mL 1 M KOH diluted with deionised water to 500 mL |
| Internal solution | 10 mg AgCl dissolved in 1 L 3.33 M KCl |
| 3.33 M KCl solution | 3.33 M KCl solution |
| Standard reference solution | 0.045 g tartaric acid and 2.25 g KCl dissolved in 1 L deionised water |
| Sensor | Preconditioning Procedure |
|---|---|
| Lipid sensors | Inner cavity filled with 200 μL internal solution; soaked in standard solution for 24 h |
| Reference sensors | Inner cavity filled with 200 μL internal solution; soaked in 3.33 M KCl solution for 24 h |
References
- European Medicines Agency. Guideline on Pharmaceutical Development of Medicines for Paediatric Use. Available online: https://www.ema.europa.eu/en/documents/scientific-guideline/guideline-pharmaceutical-development-medicines-paediatric-use_en.pdf (accessed on 22 August 2022).
- European Medicines Agency. Rewards and Incentives for Paediatric Medicines. Available online: https://www.ema.europa.eu/en/human-regulatory/research-development/paediatric-medicines/rewards-incentives-paediatric-medicines (accessed on 22 August 2022).
- European Medicines Agency. Paediatric Investigation Plans. Available online: https://www.ema.europa.eu/en/human-regulatory/research-development/paediatric-medicines/paediatric-investigation-plans (accessed on 22 August 2022).
- Comoglu, T.; Dilek Ozyilmaz, E. Orally disintegrating tablets and orally disintegrating mini tablets—Novel dosage forms for pediatric use. Pharm. Dev. Technol. 2019, 24, 902–914. [Google Scholar] [CrossRef]
- Van Riet-Nales, D.A.; Kozarewicz, P.; Aylward, B.; de Vries, R.; Egberts, T.C.G.; Rademaker, C.M.A.; Schobben, A.F.A.M. Paediatric drug development and formulation design-a European perspective. AAPS PharmSciTech 2017, 18, 241–249. [Google Scholar] [CrossRef] [Green Version]
- Liu, F.; Ranmal, S.; Batchelor, H.K.; Orlu-Gul, M.; Ernest, T.B.; Thomas, I.W.; Flanagan, T.; Tuleu, C. Patient-centered pharmaceutical design to improve acceptability of medicines: Similarities and differences in paediatric and geriatric populations. Drugs 2014, 74, 1871–1889. [Google Scholar] [CrossRef] [PubMed] [Green Version]
- Thabet, Y.; Klingmann, V.; Breitkreutz, J. Drug formulations: Standards and novel strategies for drug administration in pediatrics. J. Clin. Pharmacol. 2018, 58, S26–S35. [Google Scholar] [CrossRef] [PubMed] [Green Version]
- Stoltenberg, I.; Breitkreutz, J. Orally disintegrating mini-tablets (ODMTs)—A novel solid oral dosage form for paediatric use. Eur. J. Pharm. Biopharm. 2011, 78, 462–469. [Google Scholar] [CrossRef] [PubMed]
- Dey, P.; Maiti, S. Orodispersible tablets: A new trend in drug delivery. J. Nat. Sci. Biol. Med. 2010, 1, 2–5. [Google Scholar] [CrossRef] [Green Version]
- Bandari, S.; Mittapalli, R.K.; Gannu, R. Orodispersible tablets: An overview. Asian J. Pharm. 2014, 2. [Google Scholar] [CrossRef]
- El-Say, K.M.; Ahmed, T.A.; Abdelbary, M.F.; Ali, B.E.; Aljaeid, B.M.; Zidan, A.S. Risperidone oral disintegrating mini-tablets: A robust-product for pediatrics. Acta Pharm. 2015, 65, 365–382. [Google Scholar] [CrossRef] [Green Version]
- Kotłowska, H.; Sznitowska, M. Development of orodispersible minitablets with lorazepam using Gamlen Tablet Press. Int. J. Pharm. 2018, 536, 502. [Google Scholar] [CrossRef]
- Wasilewska, K.; Ciosek-Skibińska, P.; Lenik, J.; Srčič, S.; Basa, A.; Winnicka, K. Utilization of ethylcellulose microparticles with rupatadine fumarate in designing orodispersible minitablets with taste masking effect. Materials 2020, 13, 2715. [Google Scholar] [CrossRef]
- Latha, R.S.; Lakshmi, P.K. Electronic tongue: An analytical gustatory tool. J. Adv. Pharm. Technol. Res. 2012, 3, 3–8. [Google Scholar] [PubMed]
- Newman, J.; O’Riordan, D.; Jacquier, J.C.; O’Sullivan, M. Masking of bitterness in dairy protein hydrolysates: Comparison of an electronic tongue and a trained sensory panel as means of directing the masking strategy. LWT—Food Sci. Technol. 2015, 63, 751–757. [Google Scholar] [CrossRef]
- Electronic Medicines Compendium. Tegretol 100 mg Tablets—Summary of Product Characteristics (SmPC). Available online: https://www.medicines.org.uk/emc/product/1040/smpc (accessed on 22 August 2022).
- Djordjevic, N.; Jankovic, S.M.; Milovanovic, J.R. Pharmacokinetics and pharmacogenetics of carbamazepine in children. Eur. J. Drug Metab. Pharm. 2017, 42, 729–744. [Google Scholar] [CrossRef] [PubMed]
- Beydoun, A.; DuPont, S.; Zhou, D.; Matta, M.; Nagire, V.; Lagae, L. Current role of carbamazepine and oxcarbazepine in the management of epilepsy. Seizure 2020, 83, 251–263. [Google Scholar] [CrossRef] [PubMed]
- van Dijkman, S.C.; Rauwé, W.M.; Danhof, M.; Della Pasqua, O. Pharmacokinetic interactions and dosing rationale for antiepileptic drugs in adults and children. Br. J. Clin. Pharmacol. 2018, 84, 97–111. [Google Scholar] [CrossRef] [Green Version]
- Díaz-Torres, E.; Santoveña-Estévez, A.; Fariña, J.B. A micro-extrusion 3D printing platform for fabrication of orodispersible printlets for pediatric use. Int. J. Pharm. 2021, 605, 120854. [Google Scholar]
- Panraksa, P.; Zhang, B.; Rachtanapun, P.; Jantanasakulwong, K.; Qi, S.; Jantrawut, P. ‘Tablet-in-syringe’: A novel dosing mechanism for dysphagic patients containing fast-disintegrating tablets fabricated using semisolid extrusion 3D printing. Pharmaceutics 2022, 14, 443. [Google Scholar] [CrossRef]
- Chatzitaki, A.T.; Mystiridou, E.; Bouropoulos, N.; Ritzoulis, C.; Karavasili, C.; Fatouros, D.G. Semi-solid extrusion 3D printing of starch-based soft dosage forms for the treatment of paediatric latent tuberculosis infection. J. Pharm. Pharmacol. 2022, 74, 1498–1506. [Google Scholar] [CrossRef]
- Yu, L.X.; Amidon, G.; Khan, M.A.; Hoag, S.W.; Polli, J.; Raju, G.K.; Woodcock, J. Understanding Pharmaceutical Quality by Design. AAPS J. 2014, 16, 771–783. [Google Scholar] [CrossRef] [Green Version]
- Bhattacharya, S. Central composite design for response surface methodology and its application in pharmacy. In Response Surface Methodology in Engineering Science; Kayaroganam, P., Ed.; IntechOpen: London, UK, 2021. [Google Scholar] [CrossRef]
- JMP. The Prediction Profiler. Available online: https://www.jmp.com/support/help/en/16.2/index.shtml#page/jmp/the-prediction-profiler.shtml (accessed on 22 August 2022).
- British Pharmacopoeia Commission. British Pharmacopoeia 2021; The Stationery Office on behalf of the MHRA: London, UK, 2020. [Google Scholar]
- United States Pharmacopoeial Convention. The United States Pharmacopoeia: The National Formulary; United States Pharmacopoeial Convention: Rockville, MD, USA, 2019. [Google Scholar]
- Poller, B.; Strachan, C.; Broadbent, R.; Walker, G.F. A minitablet formulation made from electrospun nanofibers. Eur. J. Pharm. Biopharm. 2017, 114, 213–220. [Google Scholar] [CrossRef]
- Jung, H.; Milán, R.C.; Girard, M.E.; León, F.; Montoya, M.A. Bioequivalence study of carbamazepine tablets: In vitro/in vivo correlation. Int. J. Pharm. 1997, 152, 37–44. [Google Scholar] [CrossRef]
- Abdelhakim, H.E.; Coupe, A.; Tuleu, C.; Edirisinghe, M.; Craig, D.Q. Utilising co-axial electrospinning as a taste-masking technology for paediatric drug delivery. Pharmaceutics 2021, 13, 1665. [Google Scholar] [CrossRef] [PubMed]
- Abdelhakim, H.E.; Coupe, A.; Tuleu, C.; Edirisinghe, M.; Craig, D.Q.M. Electrospinning optimization of Eudragit E PO with and without chlorpheniramine maleate using a design of experiment approach. Mol. Pharm. 2019, 16, 2557–2568. [Google Scholar] [CrossRef] [PubMed] [Green Version]
- Cui, M.; Li, Y.; Wang, S.; Chai, Y.; Lou, J.; Chen, F.; Li, Q.; Pan, W.; Ding, P. Exploration and preparation of a dose-flexible regulation system for levetiracetam tablets via novel semi-solid extrusion three-dimensional printing. J. Pharm. Sci. 2019, 108, 977–986. [Google Scholar] [CrossRef]
- Seoane-Viaño, I.; Januskaite, P.; Alvarez-Lorenzo, C.; Basit, A.B.; Goyanes, A. Semi-solid extrusion 3D printing in drug delivery and biomedicine: Personalised solutions for healthcare challenges. J. Control. Release 2021, 332, 367–389. [Google Scholar] [CrossRef]
- Arora, P.; Sethi, V.A. Orodispersible tablets: A comprehensive review. Int. J. Res. Dev. Pharm. Life Sci. 2013, 2, 270–284. [Google Scholar]
- British National Formulary for Children. Carbamazepine. Available online: https://bnfc.nice.org.uk/drugs/carbamazepine/ (accessed on 22 August 2022).
- Díaz-Torres, E.; Rodríguez-Pombo, L.; Ong, J.J.; Basit, A.W.; Santoveña-Estévez, A.; Fariña, J.B.; Alvarez-Lorenzo, C.; Goyanes, A. Integrating Pressure Sensor Control into Semi-Solid Extrusion 3D Printing to Optimize Medicine Manufacturing. Int. J. Pharm. 2022, 4, 100133. [Google Scholar] [CrossRef]
- Xu, C.; Zou, M.; Wang, Y.; Liu, Y.; Yan, J.; Wu, Y.; Cheng, G. Discriminatory dissolution method for quality control measurements of carbamazepine immediate release tablets based on in vitro–in vivo investigations. Drug Dev. Ind. Pharm. 2012, 38, 679–688. [Google Scholar] [CrossRef]
- Thermo Fisher Scientific. FTIR Basic Organic Functional Group Reference Chart. Available online: http://www.thermoscientific.com/content/dam/tfs/ATG/CAD/CAD%20Documents/Application%20%26%20Technical%20Notes/Molecular%20Spectroscopy/FTIR/FTIR%20Spectrometers/XX51346-E-0215M-OrganicFunctionalChart.pdf (accessed on 22 August 2022).
- Cullity, B.D.; Stock, S.R. Elements of X-ray Diffraction, 3rd ed.; Prentice Hall: Hoboken, NJ, USA, 2001. [Google Scholar]
- Speakman, S.A. Introduction to X-ray Powder Diffraction Data Analysis. Ph.D. Thesis, Center for Materials Science and Engineering at MIT, Cambridge, MA, USA, 2013. [Google Scholar]
- Alzoubi, T.; Martin, G.P.; Barlow, D.J.; Royall, P.G. Stability of α-lactose monohydrate: The discovery of dehydration triggered solid-state epimerization. Int. J. Pharm. 2021, 604, 120715. [Google Scholar] [CrossRef]
- Guo, T.; Kong, L.; Xu, J.; Geng, Y.; Zhang, R.; Pan, Y.; Xiao, H. Intermolecular interactions between β-cyclodextrin and water. RSC Adv. 2021, 11, 24807–24815. [Google Scholar] [CrossRef]
- Tawfik, E.A.; Scarpa, M.; Abdelhakim, H.E.; Bukhary, H.A.; Craig, D.Q.M.; Barker, S.A.; Orlu, M. A potential alternative orodispersible formulation to prednisolone sodium phosphate orally disintegrating tablets. Pharmaceutics 2021, 13, 120. [Google Scholar] [CrossRef]
- Kobayashi, Y.; Habara, M.; Ikezazki, H.; Chen, R.; Naito, Y.; Toko, K. Advanced taste sensors based on artificial lipids with global selectivity to basic taste qualities and high correlation to sensory scores. Sensors 2010, 10, 3411–3443. [Google Scholar] [CrossRef]
- National Center for Biotechnology Information. PubChem Compound Summary for CID 2554, Carbamazepine. Available online: https://pubchem.ncbi.nlm.nih.gov/compound/2554 (accessed on 22 August 2022).


| Variables | Specification |
|---|---|
| Input factor X1: Superdisintegrant concentration (w/w) | Lowest level: 30%; Medium level: 40%; Highest level: 50% |
| Input factor X2: Binder concentration (w/w) | Lowest level: 2.5%; Medium level:5%; Highest level: 7.5% |
| Output factor Y1: Disintegrating time (s) | Maximum: 300 s; No minimum value; Optimal: minimise |
| Output factor Y2: Hardness | Optimal: maximise |
| Formulation Code | Superdisintegrant Concentration (w/w) | Binder Concentration (w/w) |
|---|---|---|
| F1 | 30% | 2.5% |
| F2 | 40% | 5% |
| F3 | 35% | 2.5% |
| F4 | 40% | 2.5% |
| F5 | 30% | 5% |
| F6 | 35% | 5% |
| F7 | 30% | 7.5% |
| F8 | 35% | 5% |
| F9 | 35% | 7.5% |
| F10 | 40% | 7.5% |
| Formulation Code | Ac-Di-Sol (w/w) | Kollidon 30 (w/w) | Lactose Monohydrate (w/w) | Sucralose (w/w) | Water (mL) |
|---|---|---|---|---|---|
| F1 | 30% | 2.5% | 62.5% | 5% | 5 |
| F2 | 40% | 5% | 50% | 5% | 5 |
| F3 | 35% | 2.5% | 57.5% | 5% | 5 |
| F4 | 40% | 2.5% | 52.5% | 5% | 5 |
| F5 | 30% | 5% | 60% | 5% | 5 |
| F6 | 35% | 5% | 55% | 5% | 5 |
| F7 | 30% | 7.5% | 57.5% | 5% | 5 |
| F8 | 35% | 5% | 55% | 5% | 5 |
| F9 | 35% | 7.5% | 52.5% | 5% | 5 |
| F10 | 40% | 7.5% | 47.5% | 5% | 5 |
| Parameter | Value |
|---|---|
| Paste container | 3 mL syringe |
| Printing substrate | Petri dish |
| Nozzle diameter | 0.41 mm |
| Temperature | 25 °C |
| Pressure | Minimum value for printing, no more than 200 kPa |
| Speed | 5 mm/s |
| Infill pattern | Concentric |
| Infill density | 50% |
| Sensor | Information |
|---|---|
| C00 | Positively charged membrane, testing acidic bitterness |
| AE1 | Positively charged membrane, testing astringency |
| AC0 | Negatively charged membrane, testing basic bitterness |
| Formulation Code | Minimum Pressure Required for SSE Printing (kPa) |
|---|---|
| F1 | 100 |
| F2 | 190 |
| F3 | 170 |
| F4 | >200 1 |
| F5 | 100 |
| F6 | >200 |
| F7 | 200 |
| F8 | >200 |
| F9 | 200 |
| F10 | >200 |
| Formulation Code | Diameter (mm) | Height (mm) | Weight (mg) | Fidelity Factor | Hardness (N) | Disintegrating Time (s) |
|---|---|---|---|---|---|---|
| F1 | 3.003 ± 0.210 1 | 2.258 ± 0.163 | 7.96 ± 1.65 | 0.760 ± 0.132 | 49.6 ± 12.31 | 228 ± 22.77 |
| F2 | 3.027 ± 0.181 | 2.239 ± 0.124 | 9.62 ± 1.66 | 0.765 ± 0.111 | 61.3 ± 14.35 | 175 ± 8.11 |
| F3 | 3.320 ± 0.262 | 2.518 ± 0.195 | 15.30 ± 2.15 | 1.034 ± 0.183 | 101.2 ± 13.20 | 328 ± 18.54 |
| F5 | 3.342 ± 0.117 | 2.362 ± 0.121 | 15.38 ± 1.25 | 0.977 ± 0.064 | 81.9 ± 10.65 | 329 ± 12.54 |
| F7 | 3.514 ± 0.231 | 2.664 ± 0.119 | 17.58 ± 2.02 | 1.222 ± 0.154 | 98.7 ± 5.18 | 380 ± 18.87 |
| F9 | 2.792 ± 0.152 | 2.226 ± 0.072 | 8.56 ± 1.33 | 0.645 ± 0.078 | 57.1 ± 8.14 | 215 ± 23.85 |
| Response | R Square | Mean of Response | Observations |
|---|---|---|---|
| Disintegrating time | 1 | 275.8333 | 6 |
| Hardness | 1 | 74.96667 | 6 |
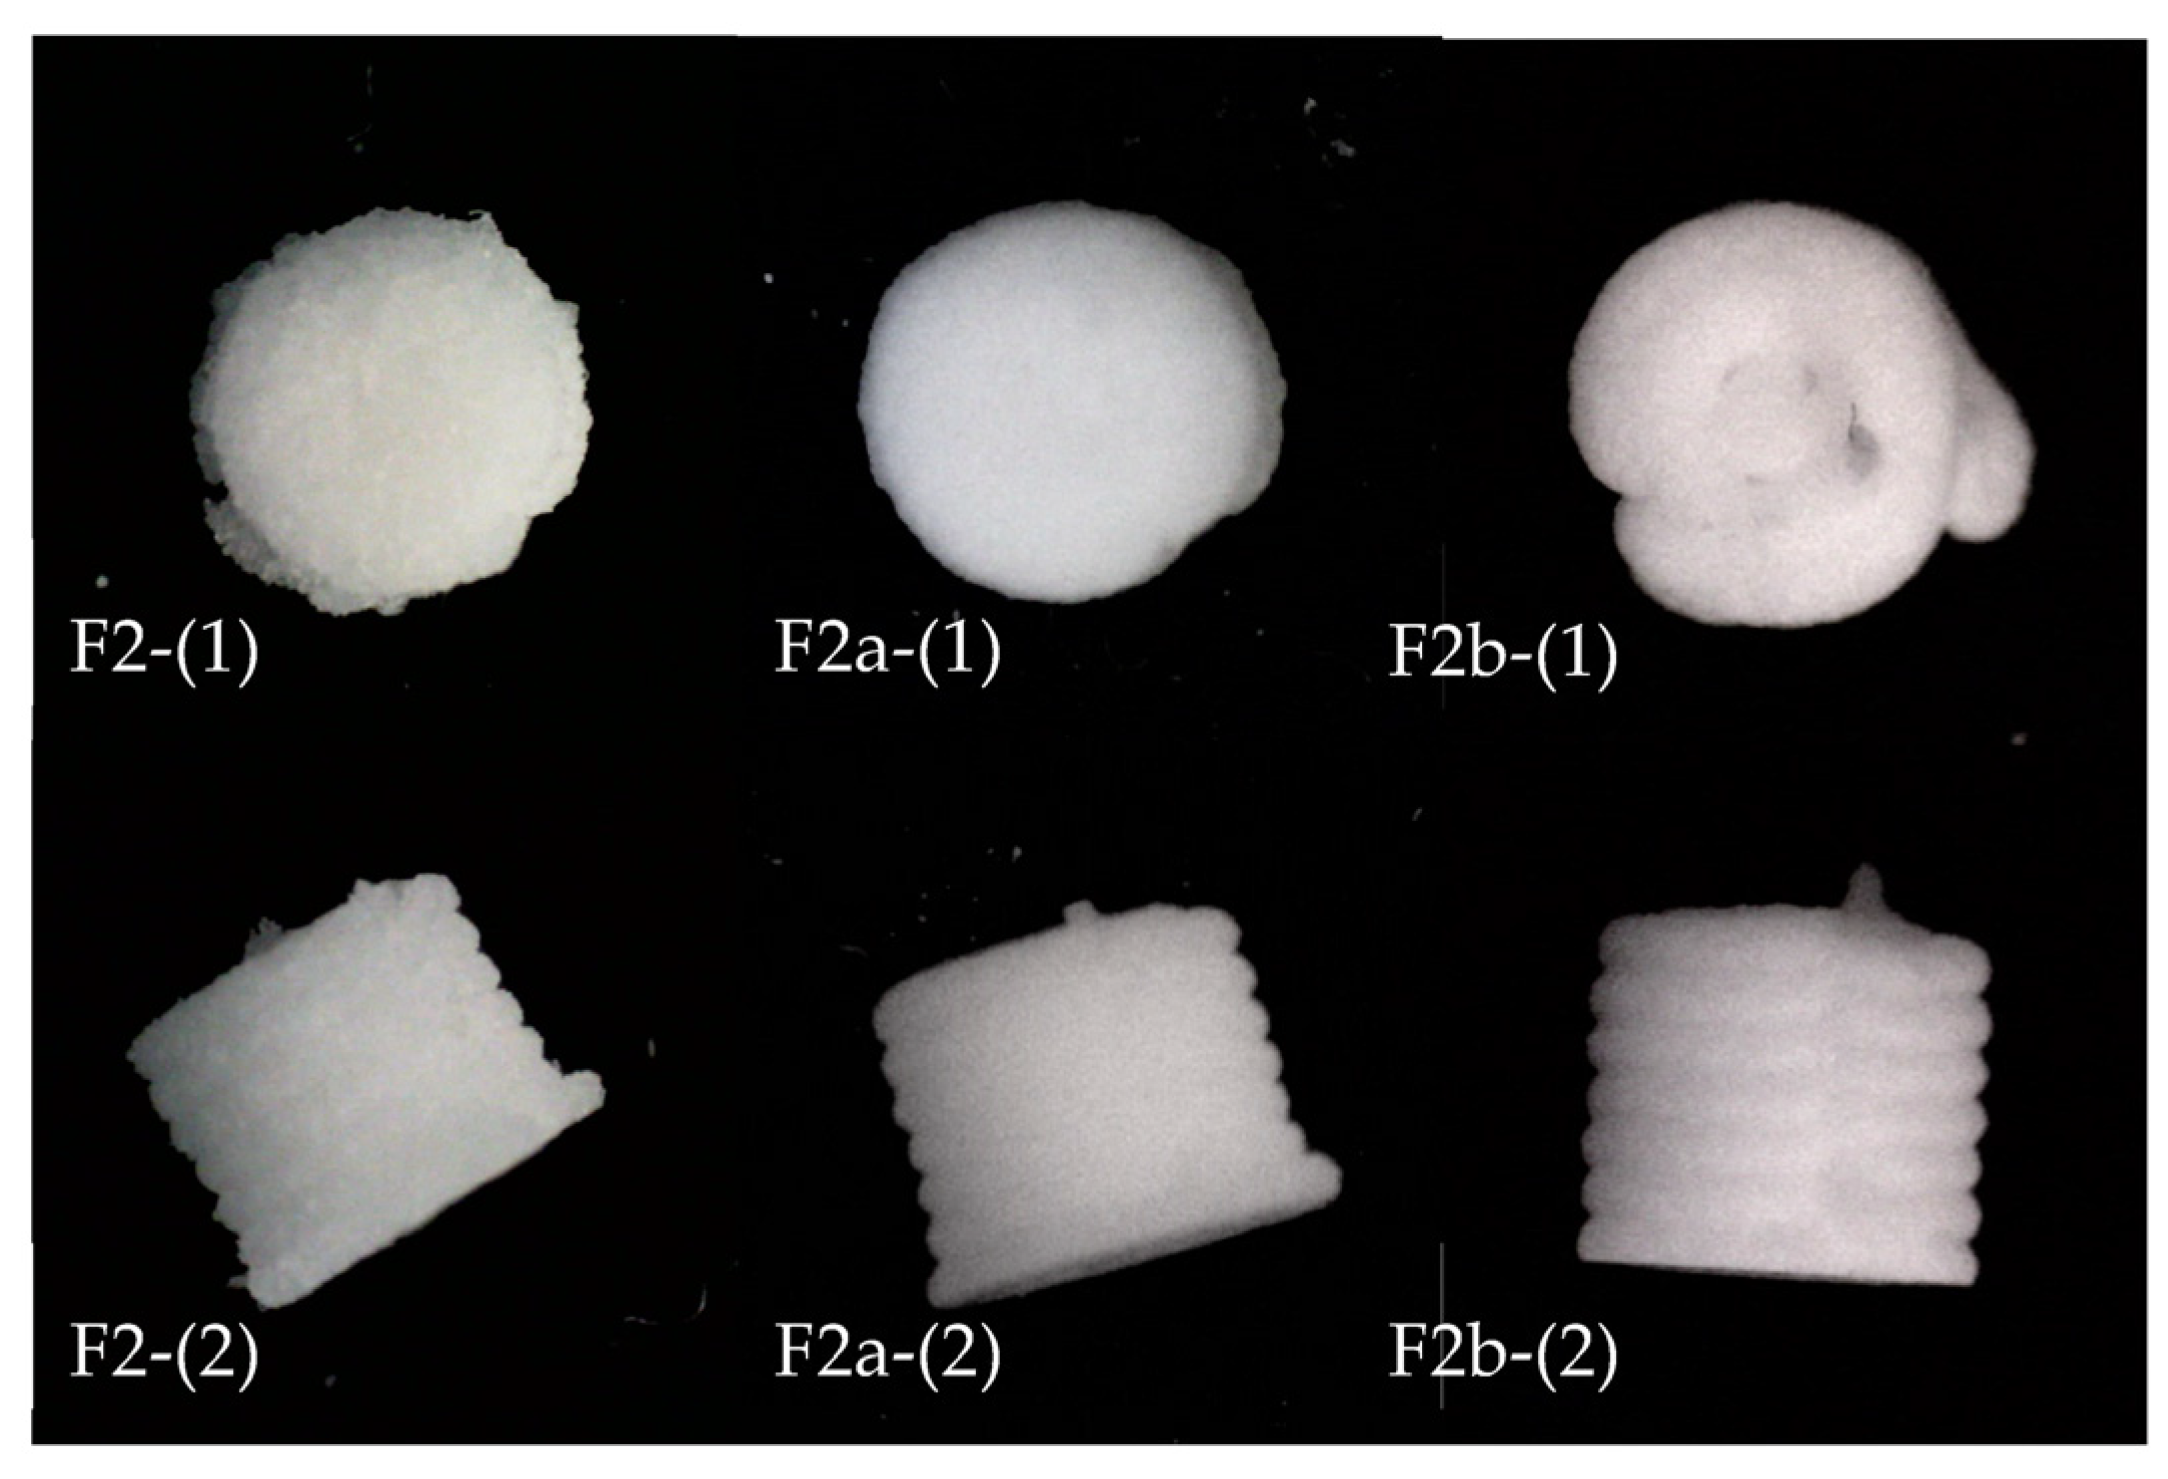
| Formulation Code | Superdisintegrant | Solid:Liquid Ratio in Paste | Extrusion Pressure |
|---|---|---|---|
| F2 | Ac-Di-Sol (40% w/w) | 2 mg solid:5 mL water | 190 kPa |
| F2a | SSG (40% w/w) | 2 mg solid:2.6 mL water | 170 kPa |
| F2b | D-Mannitol (30% w/w) + SSG (10% w/w) | 4 mg solid:2.1 mL water | 150 kPa |
| Formulation Code | Diameter (mm) | Height (mm) | Fidelity Factor | Weight (mg) | Hardness (N) | Disintegrating Time (s) |
|---|---|---|---|---|---|---|
| F2 | 3.027 ± 0.181 1 | 2.239 ± 0.124 | 0.765 ± 0.111 | 9.62 ± 1.66 | 61.3 ± 14.35 | 175 ± 8.11 |
| F2a | 3.341 ± 0.107 | 2.804 ± 0.064 | 1.161 ± 0.075 | 19.63 ± 1.39 | 53.3 ± 6.65 | 80 ± 8.22 |
| F2b | 3.136 ± 0.321 | 2.870 ± 0.089 | 1.056 ± 0.169 | 21.23 ± 1.25 | 39.2 ± 8.00 | 86 ± 9.38 |
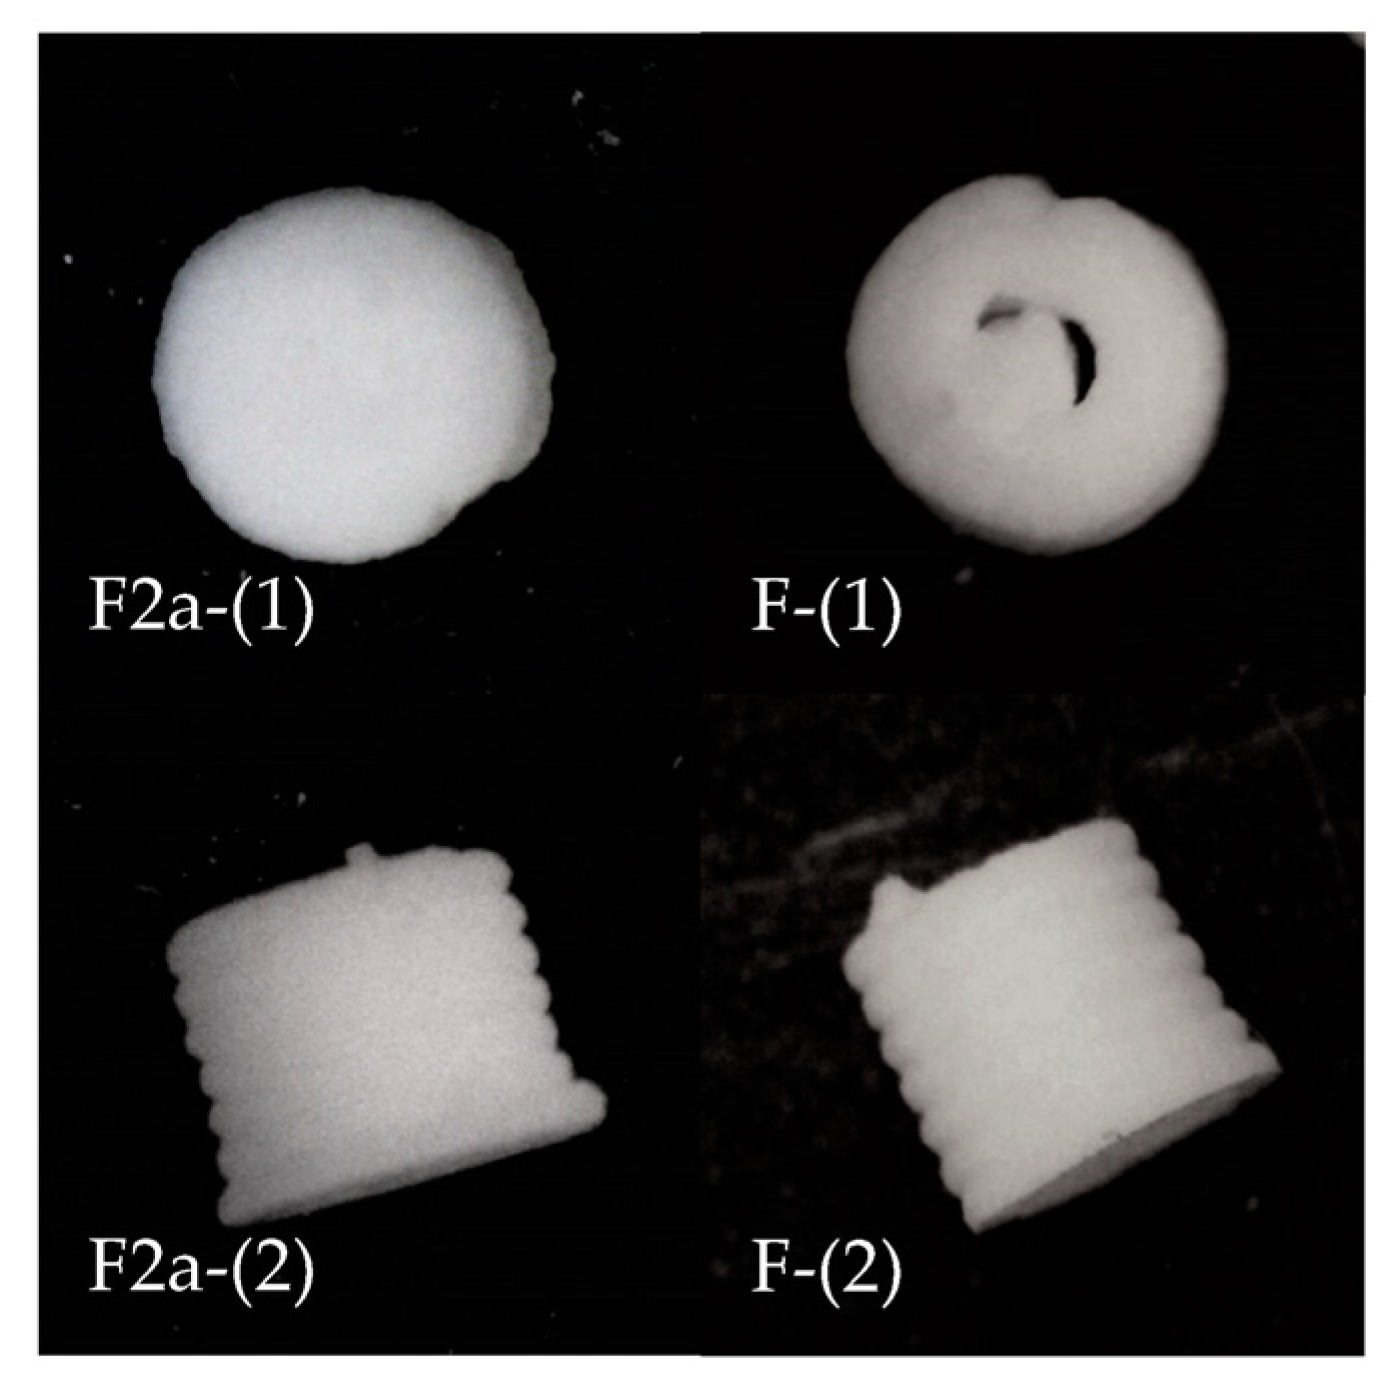
| Formulation Code | Composition | Solid:Liquid Ratio in Paste | Extrusion Pressure |
|---|---|---|---|
| F2a | - | 2 mg solid:2.6 mL water | 170 kPa |
| F | F2a + 100 mg CBZ | 2.1 mg solid:2.6 mL water | 110 kPa |
| Formulation Code | Diameter (mm) | Height (mm) | Fidelity Factor | Weight (mg) | Hardness (N) | Disintegrating Time (s) |
|---|---|---|---|---|---|---|
| F2a | 3.341 ± 0.107 1 | 2.804 ± 0.064 | 1.161 ± 0.075 | 19.63 ± 1.39 | 53.3 ± 6.65 | 80 ± 8.22 |
| F | 2.490 ± 0.081 | 2.465 ± 0.060 | 0.567 ± 0.043 | 10.71 ± 0.50 | 18.5 ± 3.61 | 84 ± 3.40 |
| Sample | Mass of ODMT Powder (mg) | Amount of Drug (mg) | Composition of Drug in the Powder (% w/w) | Drug-Loading (%) |
|---|---|---|---|---|
| 1 | 10.7 | 0.4594 | 4.29 | 90.16 |
| 2 | 11.2 | 0.4835 | 4.31 | 90.66 |
| 3 | 10.5 | 0.4543 | 4.33 | 90.86 |
| Mean ± SD | 0.4657 ± 0.01 | 4.31 ± 0.02 | 90.56 ± 0.29 |
Disclaimer/Publisher’s Note: The statements, opinions and data contained in all publications are solely those of the individual author(s) and contributor(s) and not of MDPI and/or the editor(s). MDPI and/or the editor(s) disclaim responsibility for any injury to people or property resulting from any ideas, methods, instructions or products referred to in the content. |
© 2023 by the authors. Licensee MDPI, Basel, Switzerland. This article is an open access article distributed under the terms and conditions of the Creative Commons Attribution (CC BY) license (https://creativecommons.org/licenses/by/4.0/).
Share and Cite
Hu, J.; Fitaihi, R.; Abukhamees, S.; Abdelhakim, H.E. Formulation and Characterisation of Carbamazepine Orodispersible 3D-Printed Mini-Tablets for Paediatric Use. Pharmaceutics 2023, 15, 250. https://doi.org/10.3390/pharmaceutics15010250
Hu J, Fitaihi R, Abukhamees S, Abdelhakim HE. Formulation and Characterisation of Carbamazepine Orodispersible 3D-Printed Mini-Tablets for Paediatric Use. Pharmaceutics. 2023; 15(1):250. https://doi.org/10.3390/pharmaceutics15010250
Chicago/Turabian StyleHu, Jiayu, Rawan Fitaihi, Shorooq Abukhamees, and Hend E. Abdelhakim. 2023. "Formulation and Characterisation of Carbamazepine Orodispersible 3D-Printed Mini-Tablets for Paediatric Use" Pharmaceutics 15, no. 1: 250. https://doi.org/10.3390/pharmaceutics15010250