
Two-in-One Nanoparticle Formulation to Deliver a Tyrosine Kinase Inhibitor and microRNA for Targeting Metabolic Reprogramming and Mitochondrial Dysfunction in Gastric Cancer
 ,
,
Abstract
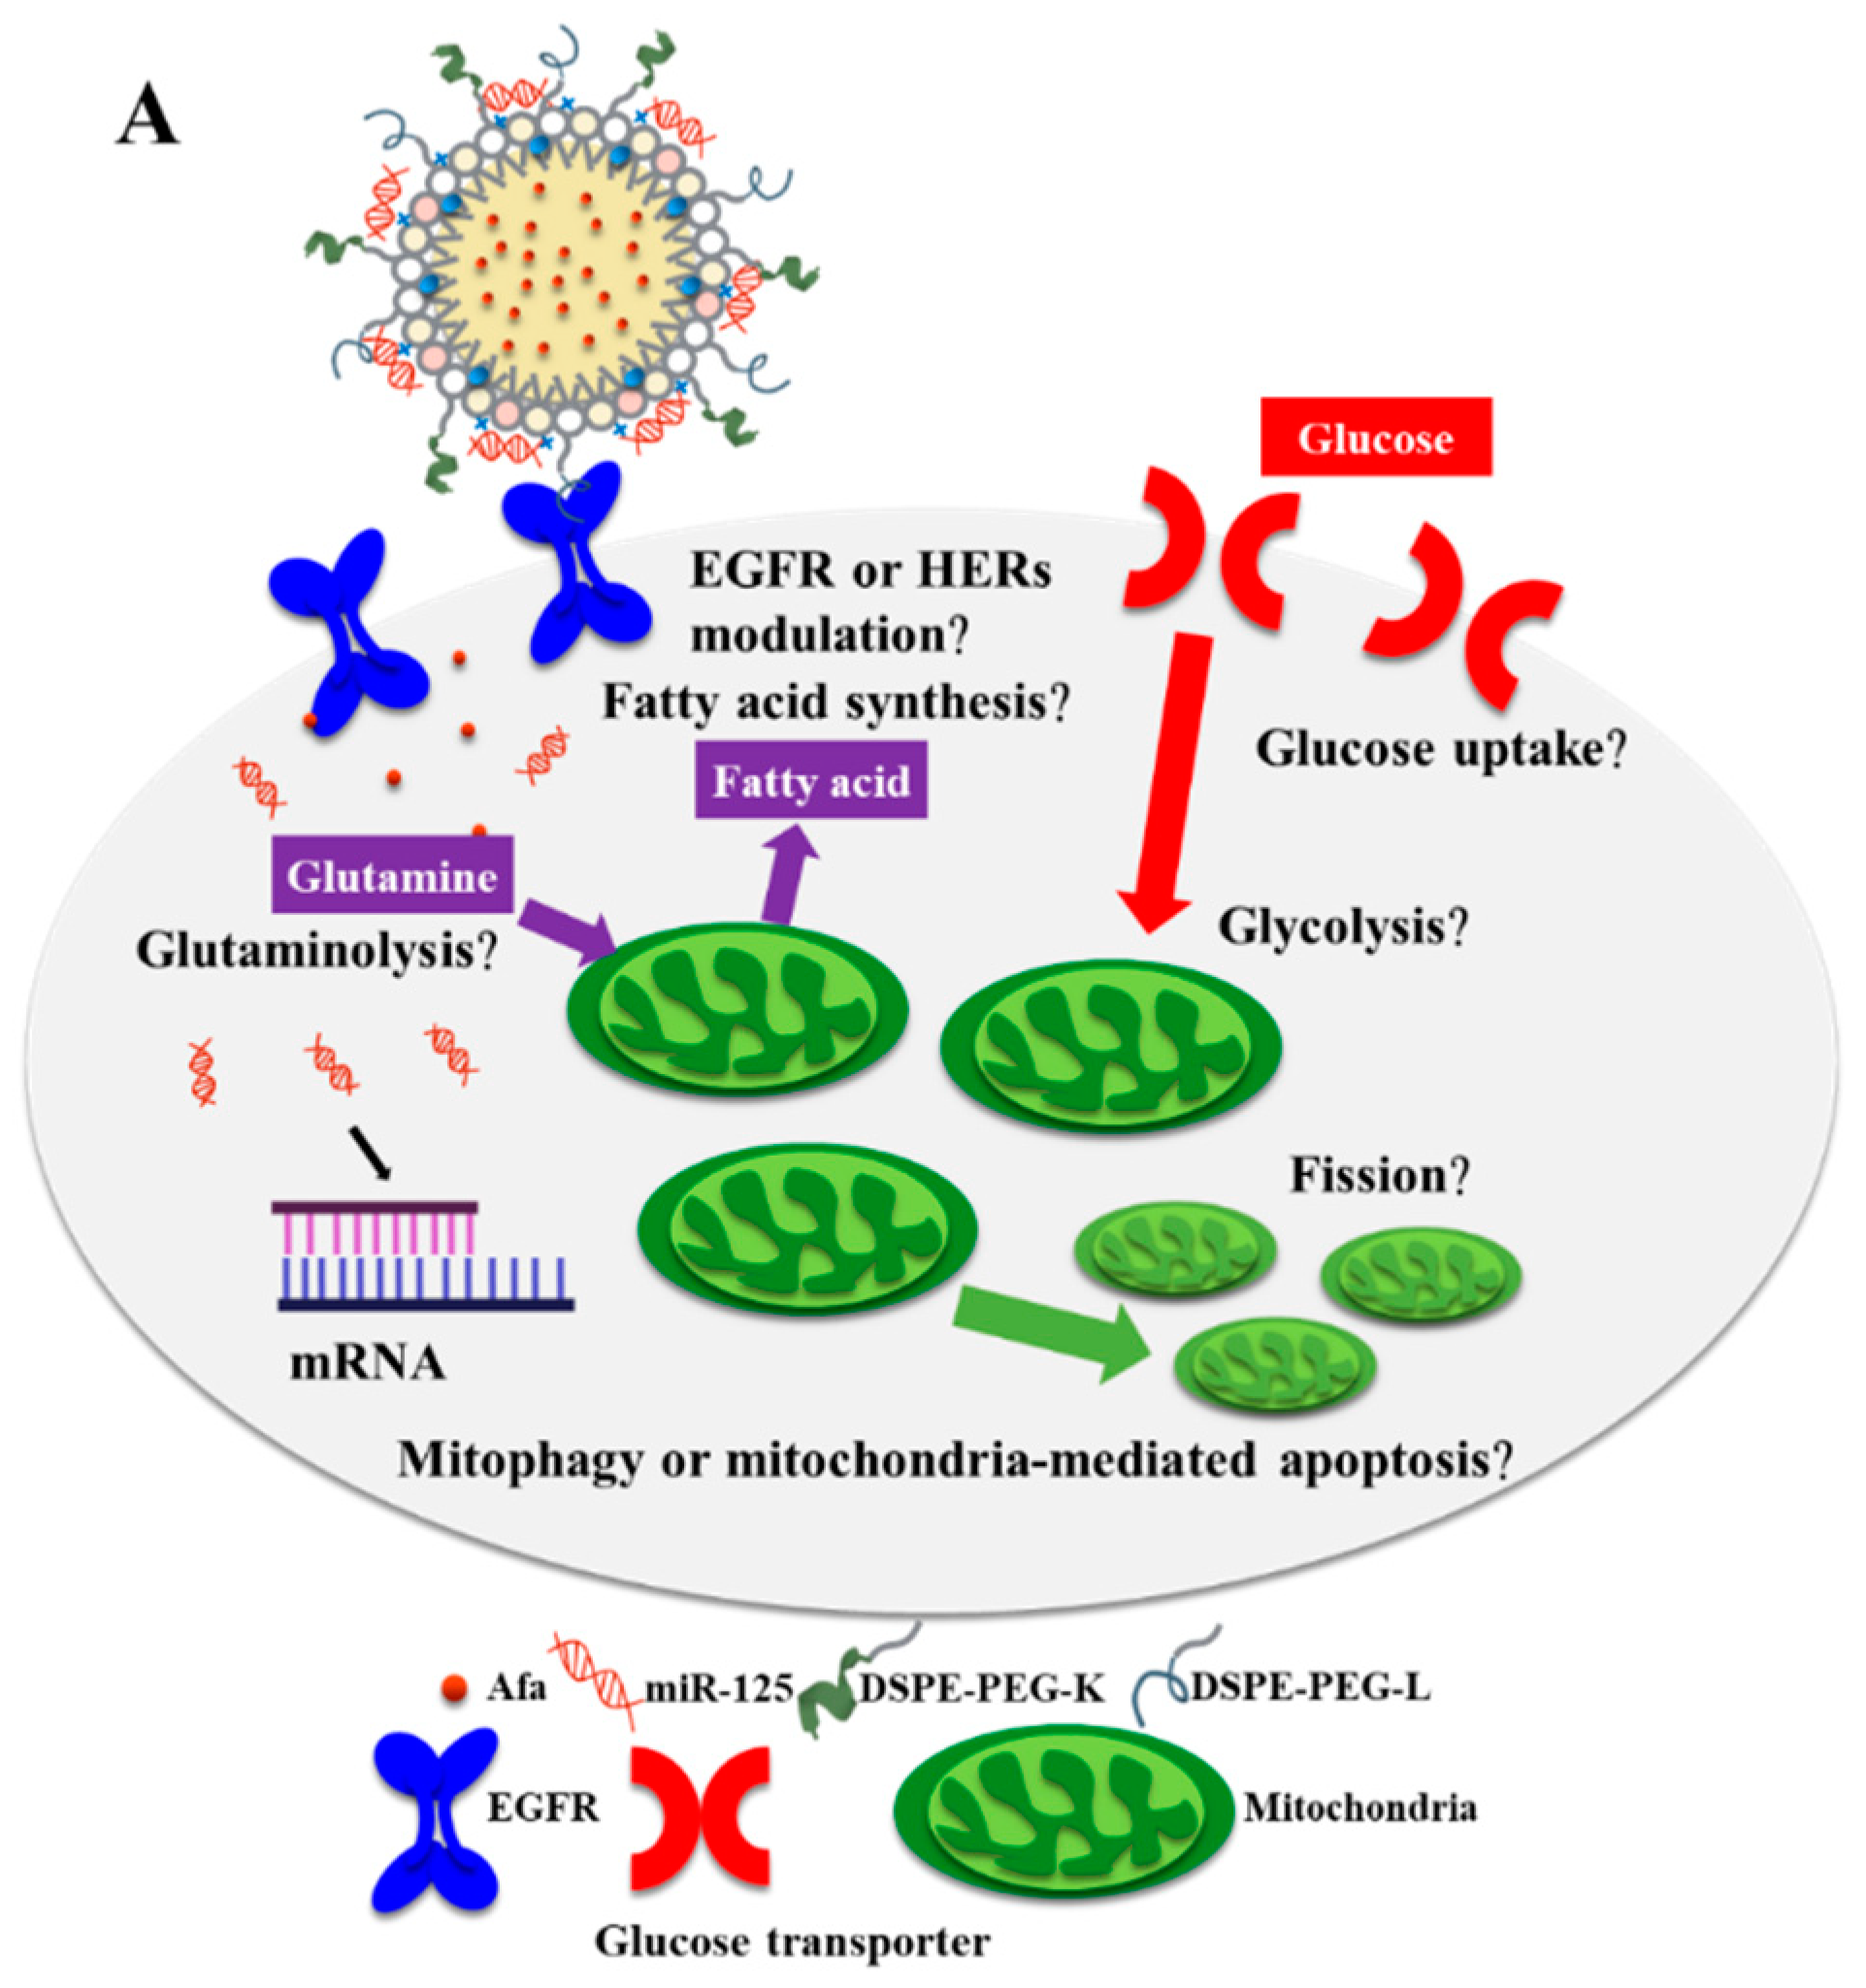
:1. Introduction
2. Materials and Methods
2.1. Materials
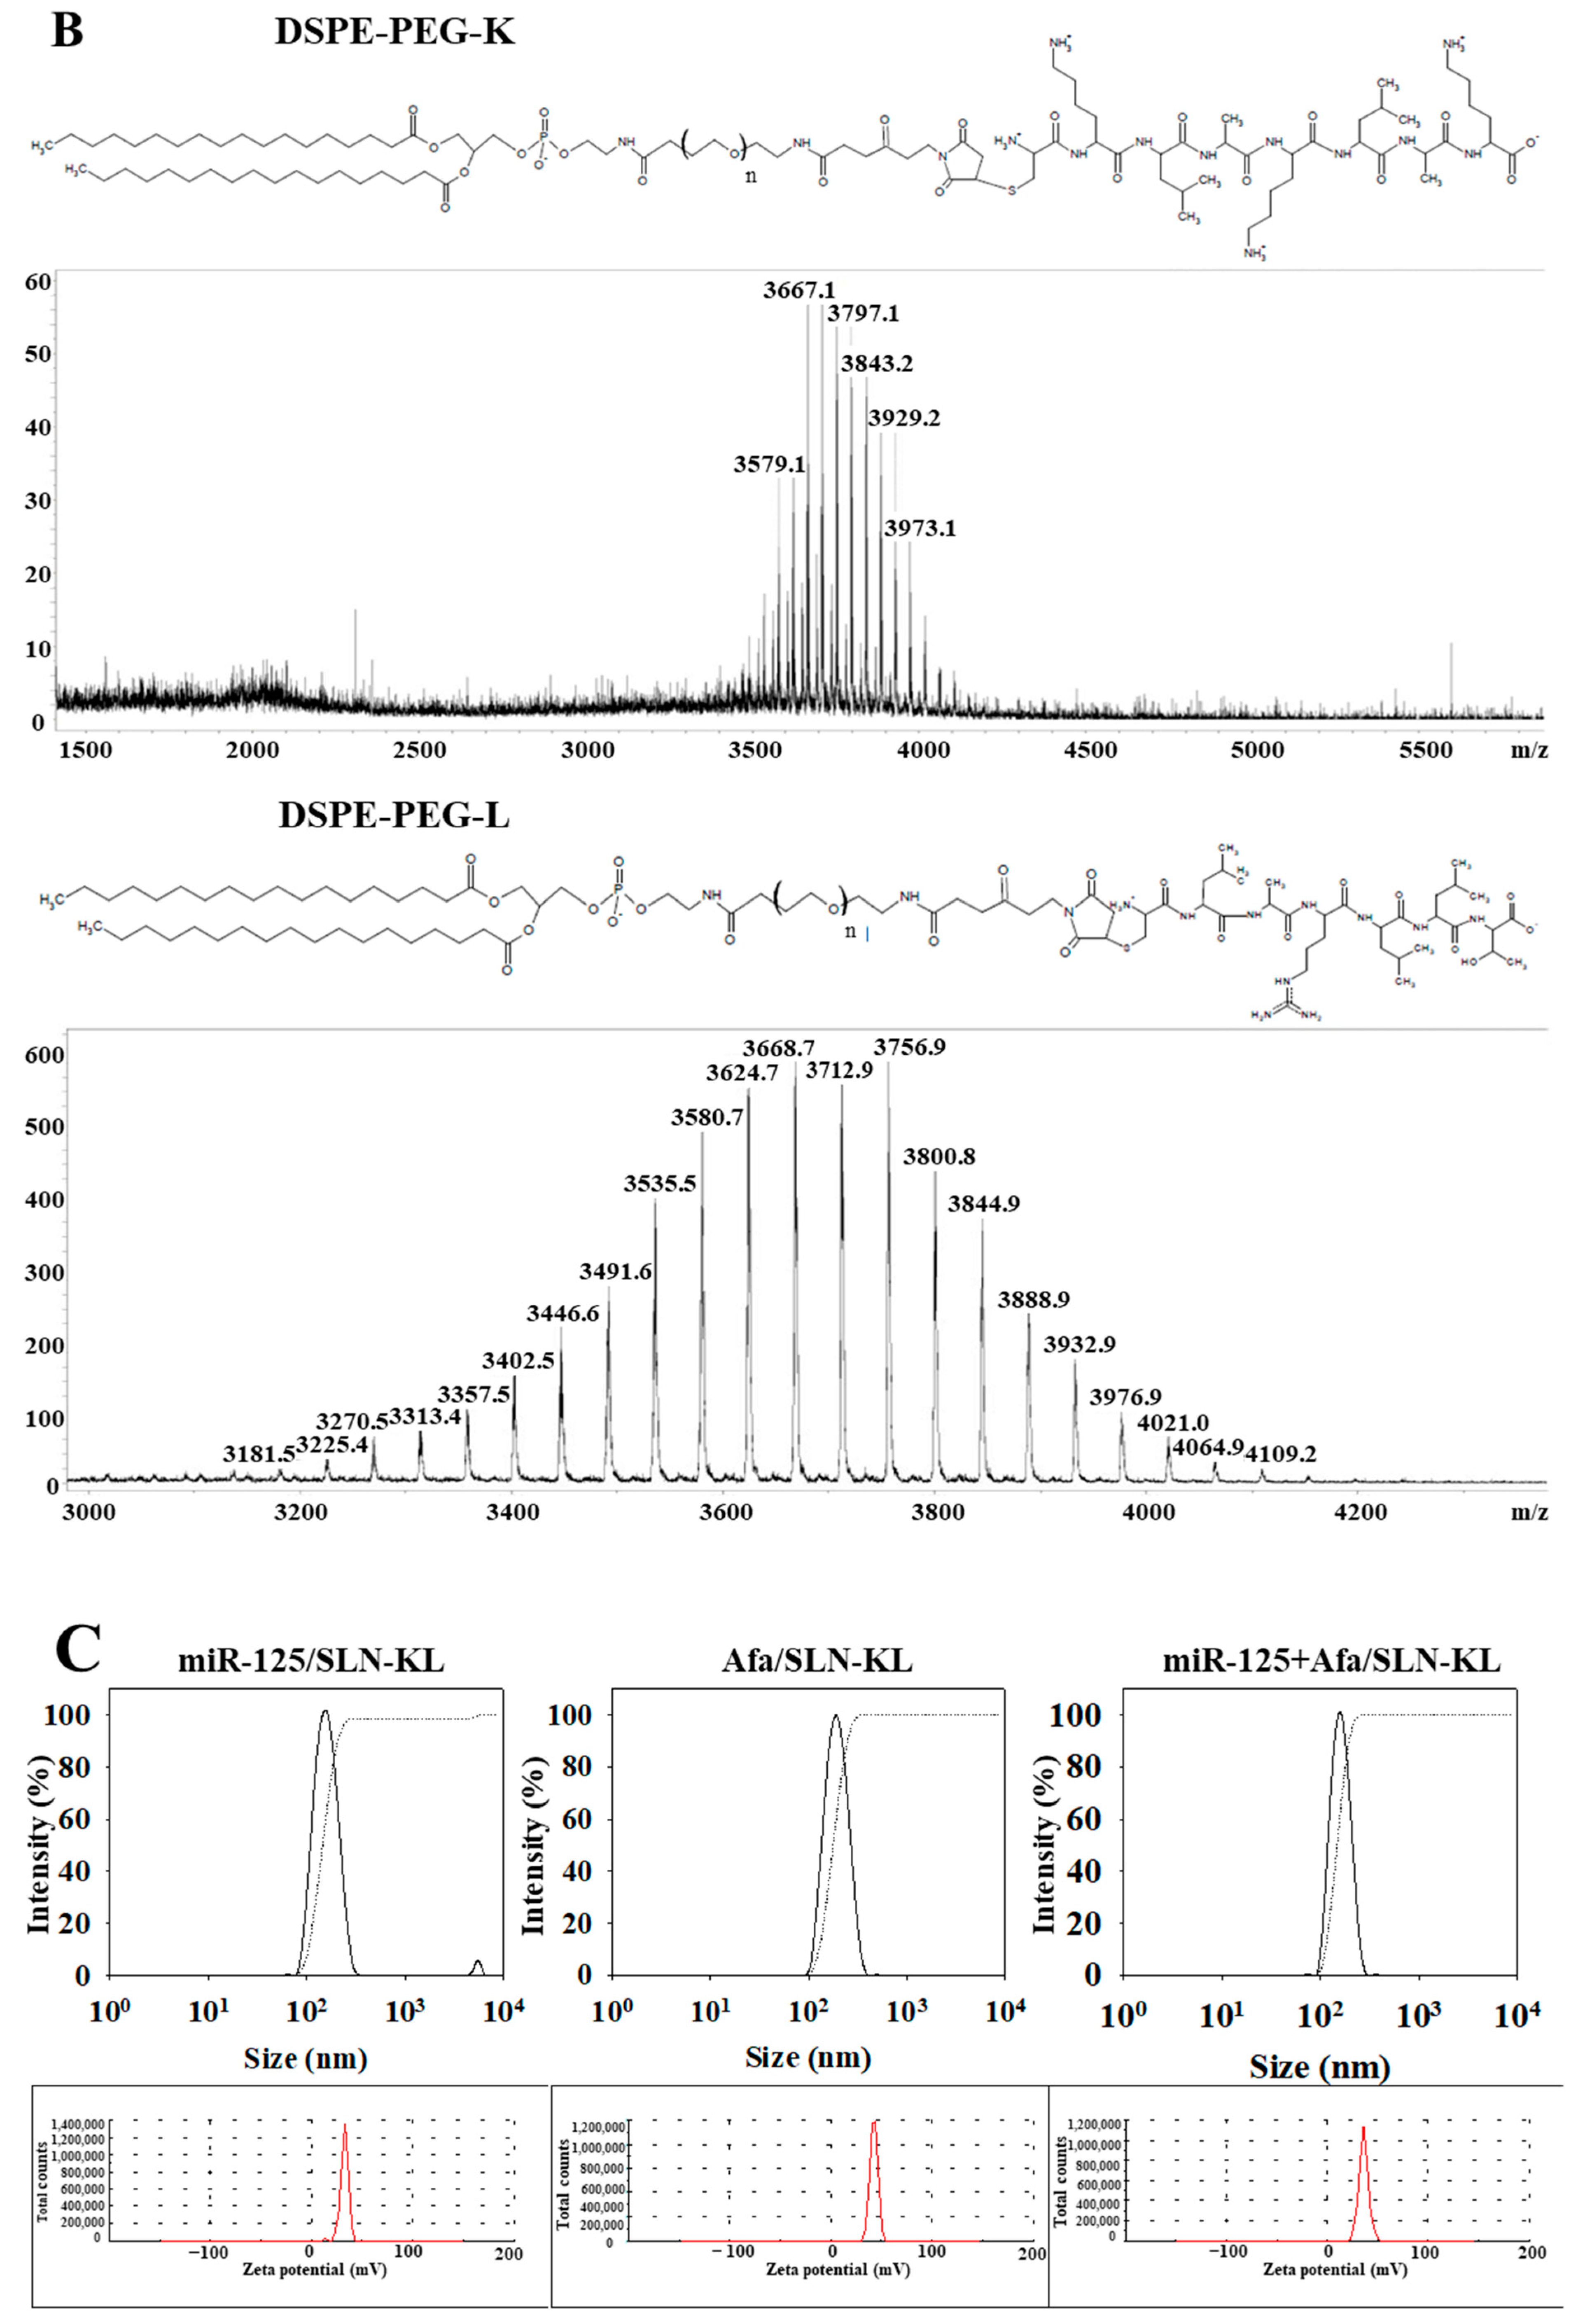
2.2. Synthesis of Lipid-Peptide Conjugates (DSPE-PEG-K and DSPE-PEG-L)
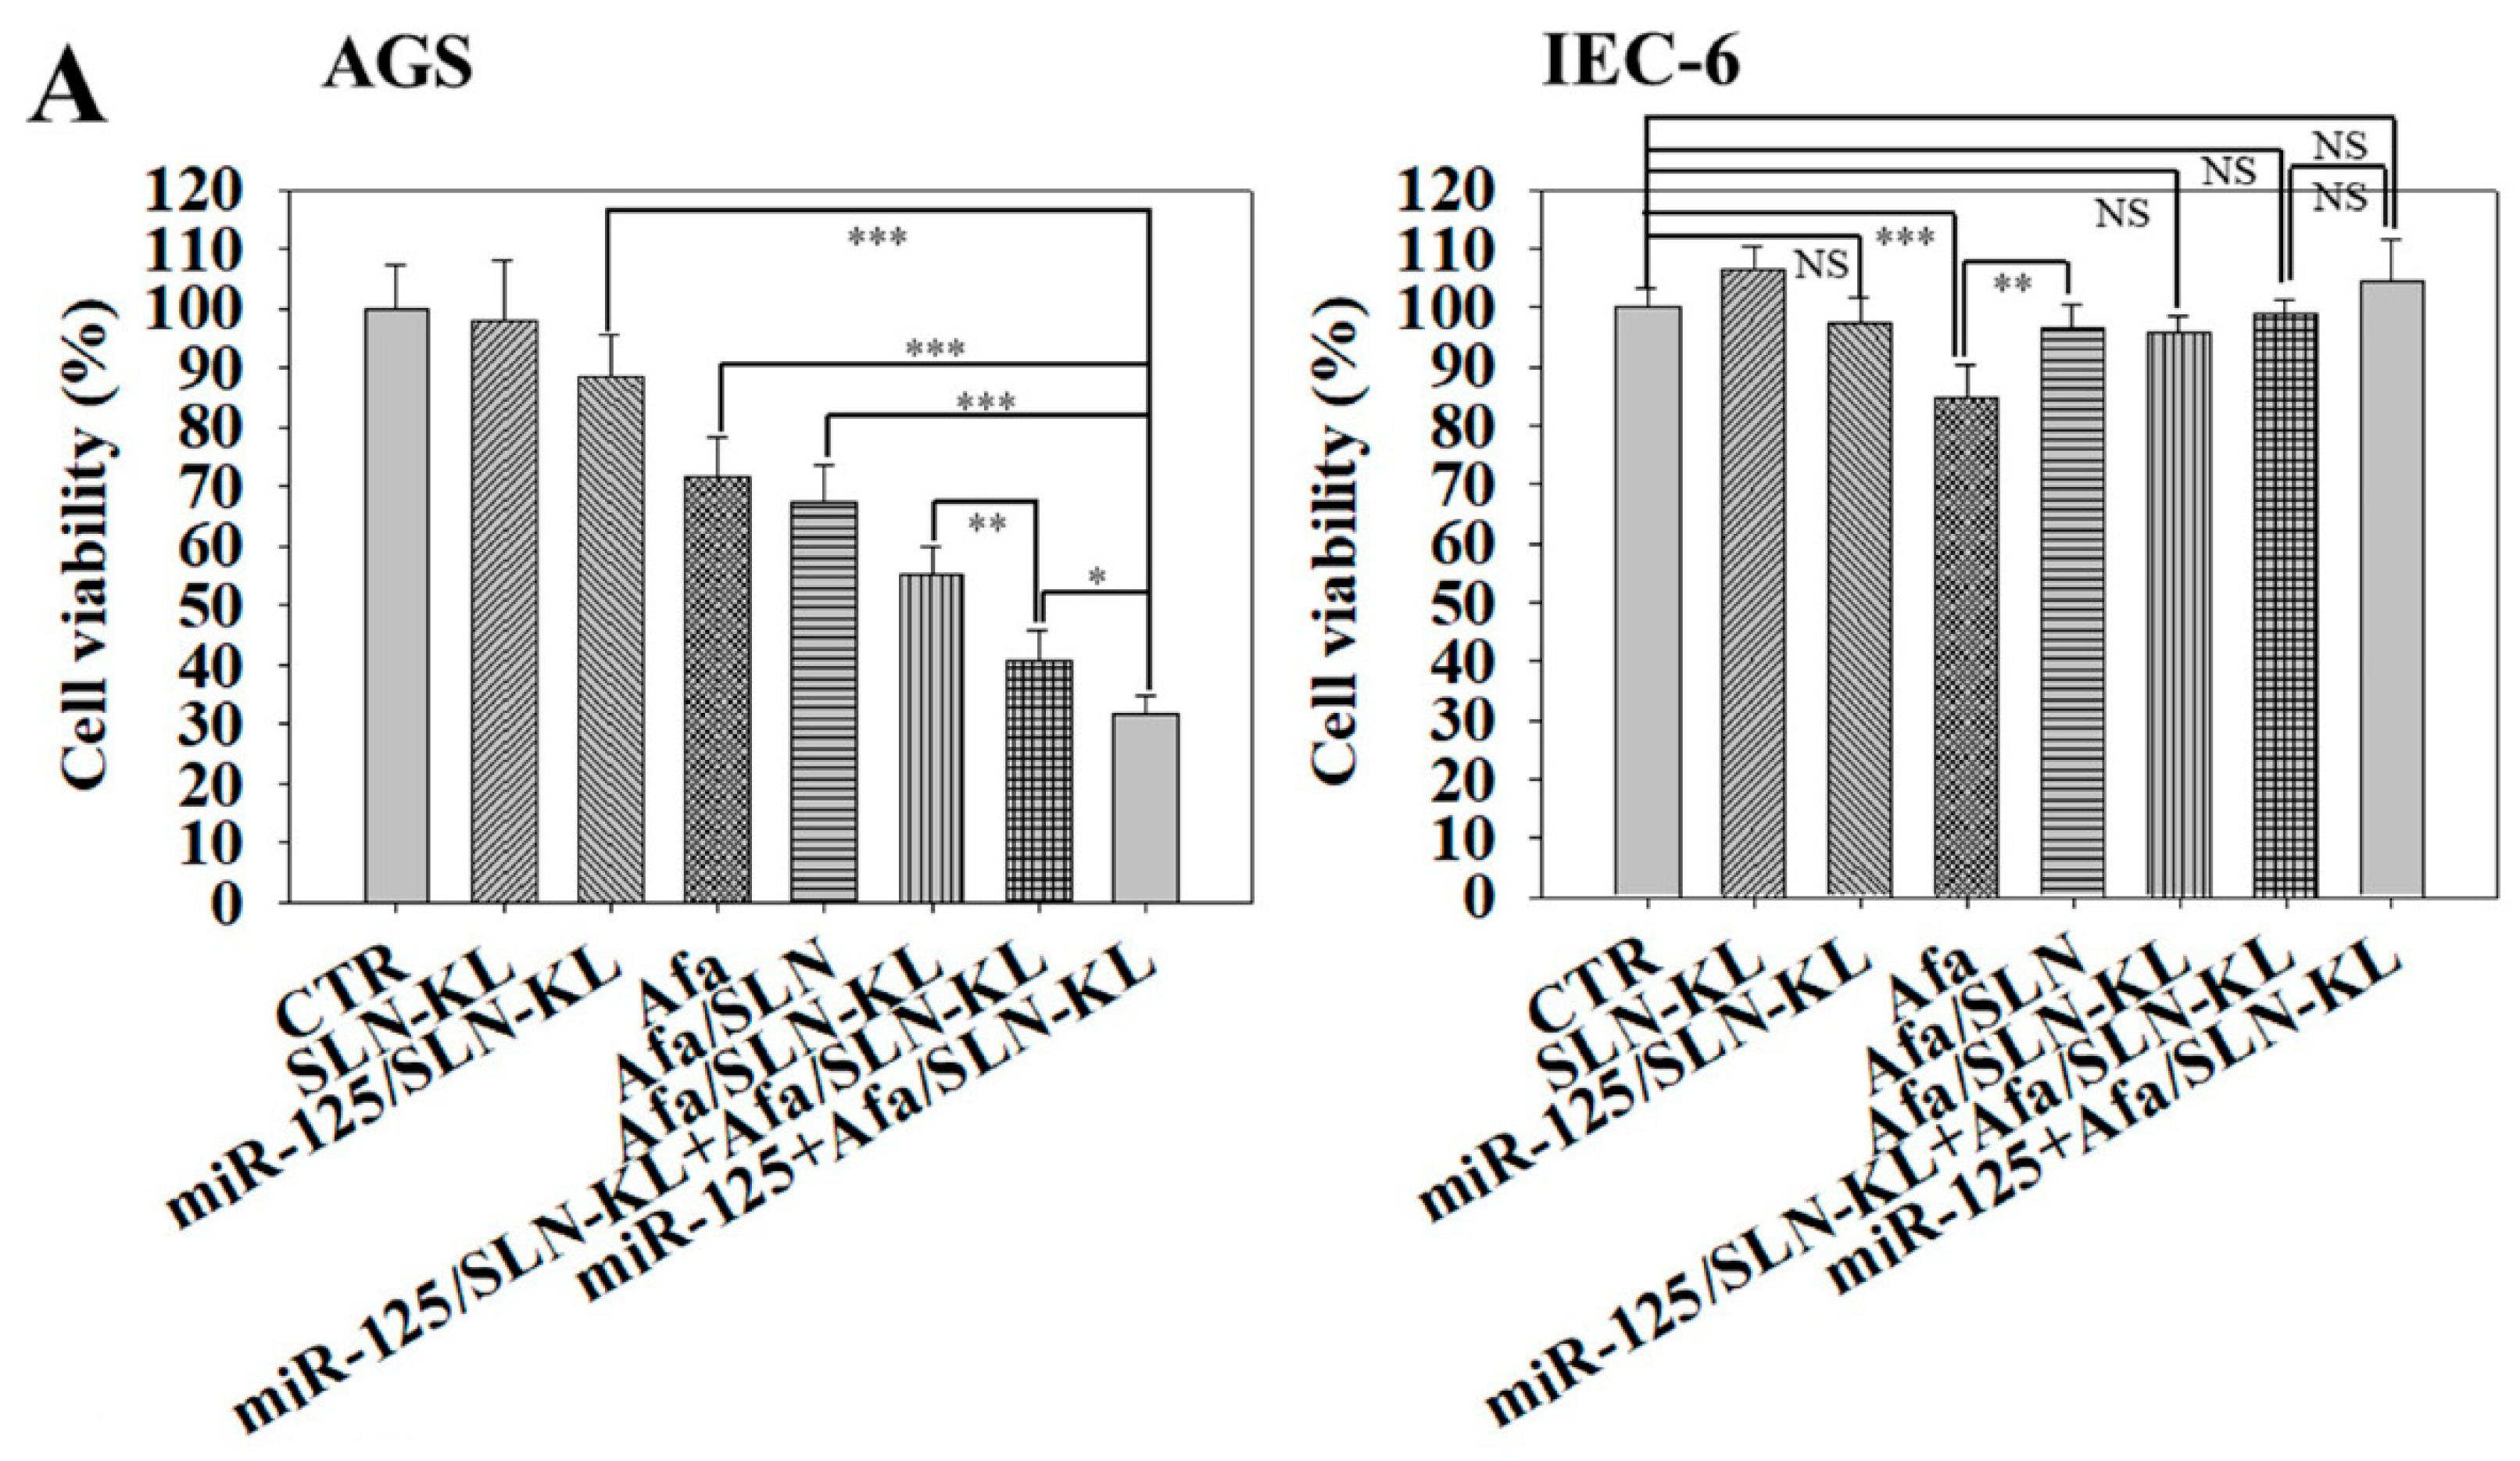
2.3. Preparation of Peptide-Conjugated SLN Loaded with Single or Dual Drugs (miR-125/SLN-KL, Afa/SLN-KL, or miR-125 + Afa/SLN-KL)
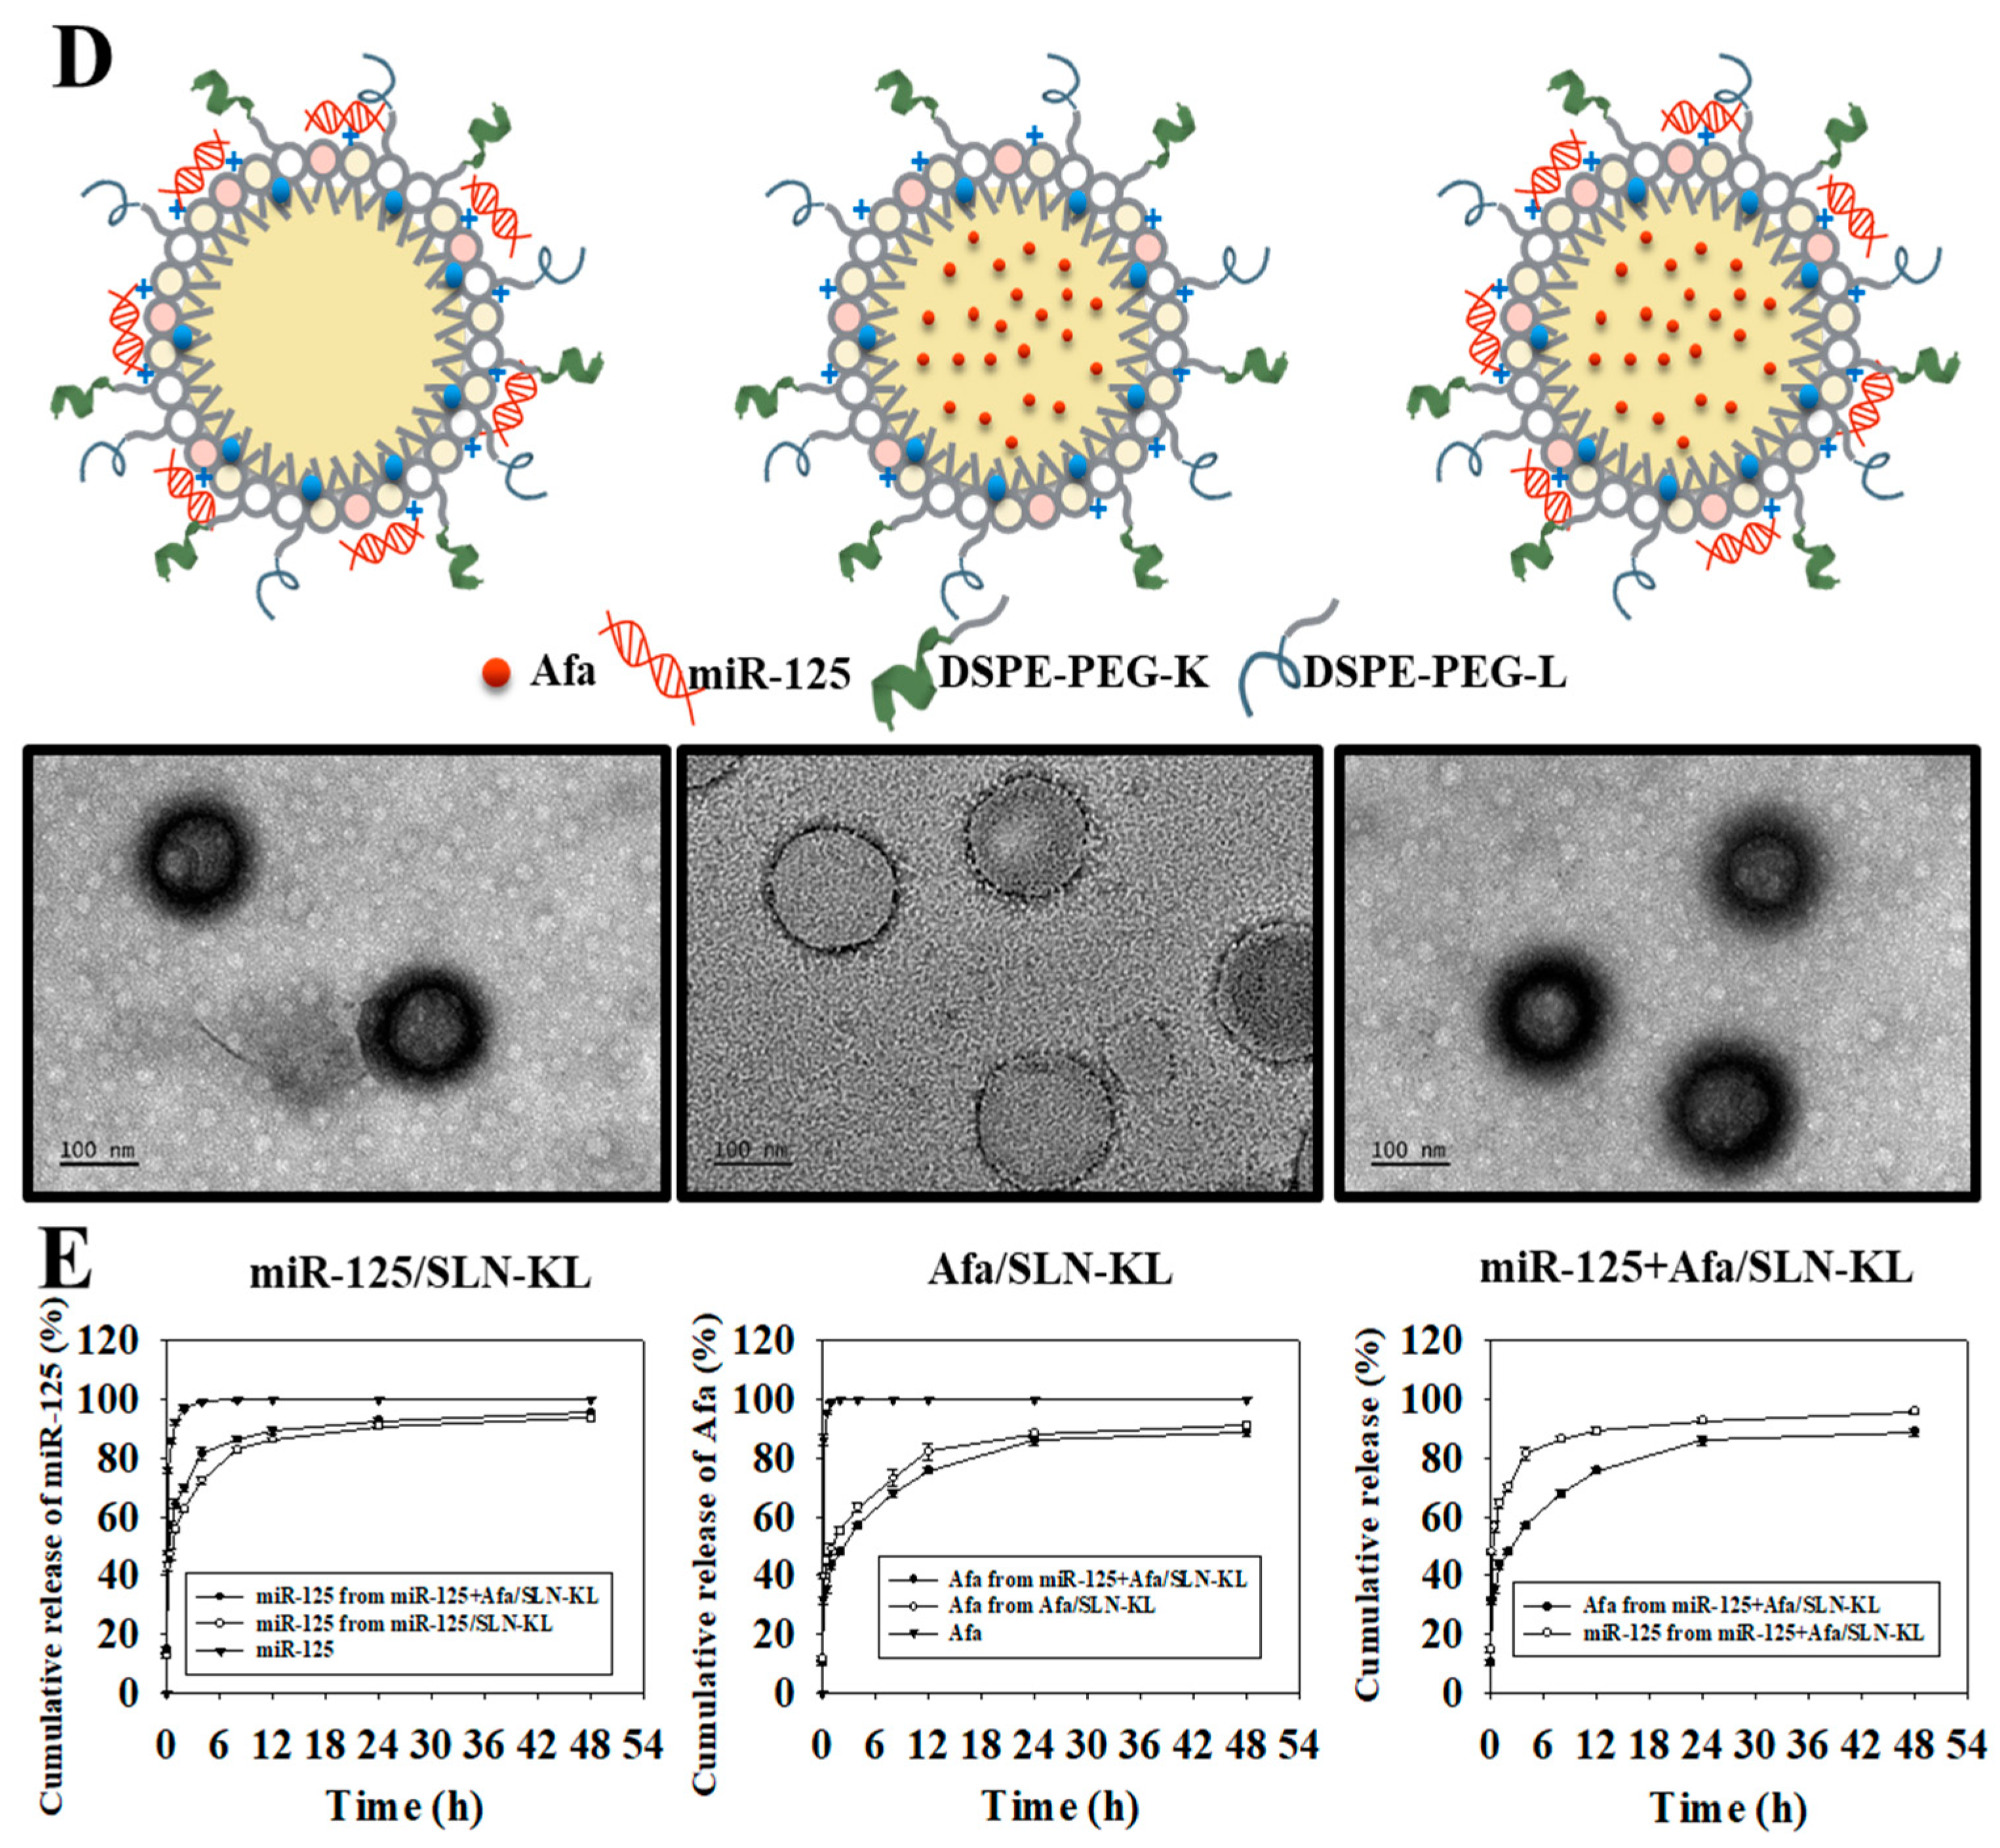
2.4. Evaluation of Particle Size, Zeta Potential, and Morphology of Nanoparticles
2.5. Encapsulation Efficiency (EE%) and Drug Loading Capacity (DL%)
2.6. Drug Release Study
2.7. Cell Lines
2.8. Cell Viability by SRB Assay and the Calculation of Combination Index (CI)
2.9. Cellular Uptake and Intracellular Localization of miR-125 and Afa in AGS Cells
2.10. Western Blot
2.11. Migration Analysis
2.12. Measurement of Glutamate, Glucose Uptake, and Lipid Accumulation
2.13. Seahorse Assay
2.14. Measurement of Acetyl-CoA, Lactate, and ATP
2.15. Measurement of Mitochondrial Membrane Potential
2.16. Measurement of Mitochondrial ROS
2.17. Observation of Mitophagy and Mitochondrial Morphology
2.18. Measurement of Apoptosis
2.19. Establishment of AGS-Bearing Mouse Model
2.20. Antitumor Efficacy
2.21. Positron Emission Tomography/Computed Tomography (PET/CT)
2.22. Biochemical Tests
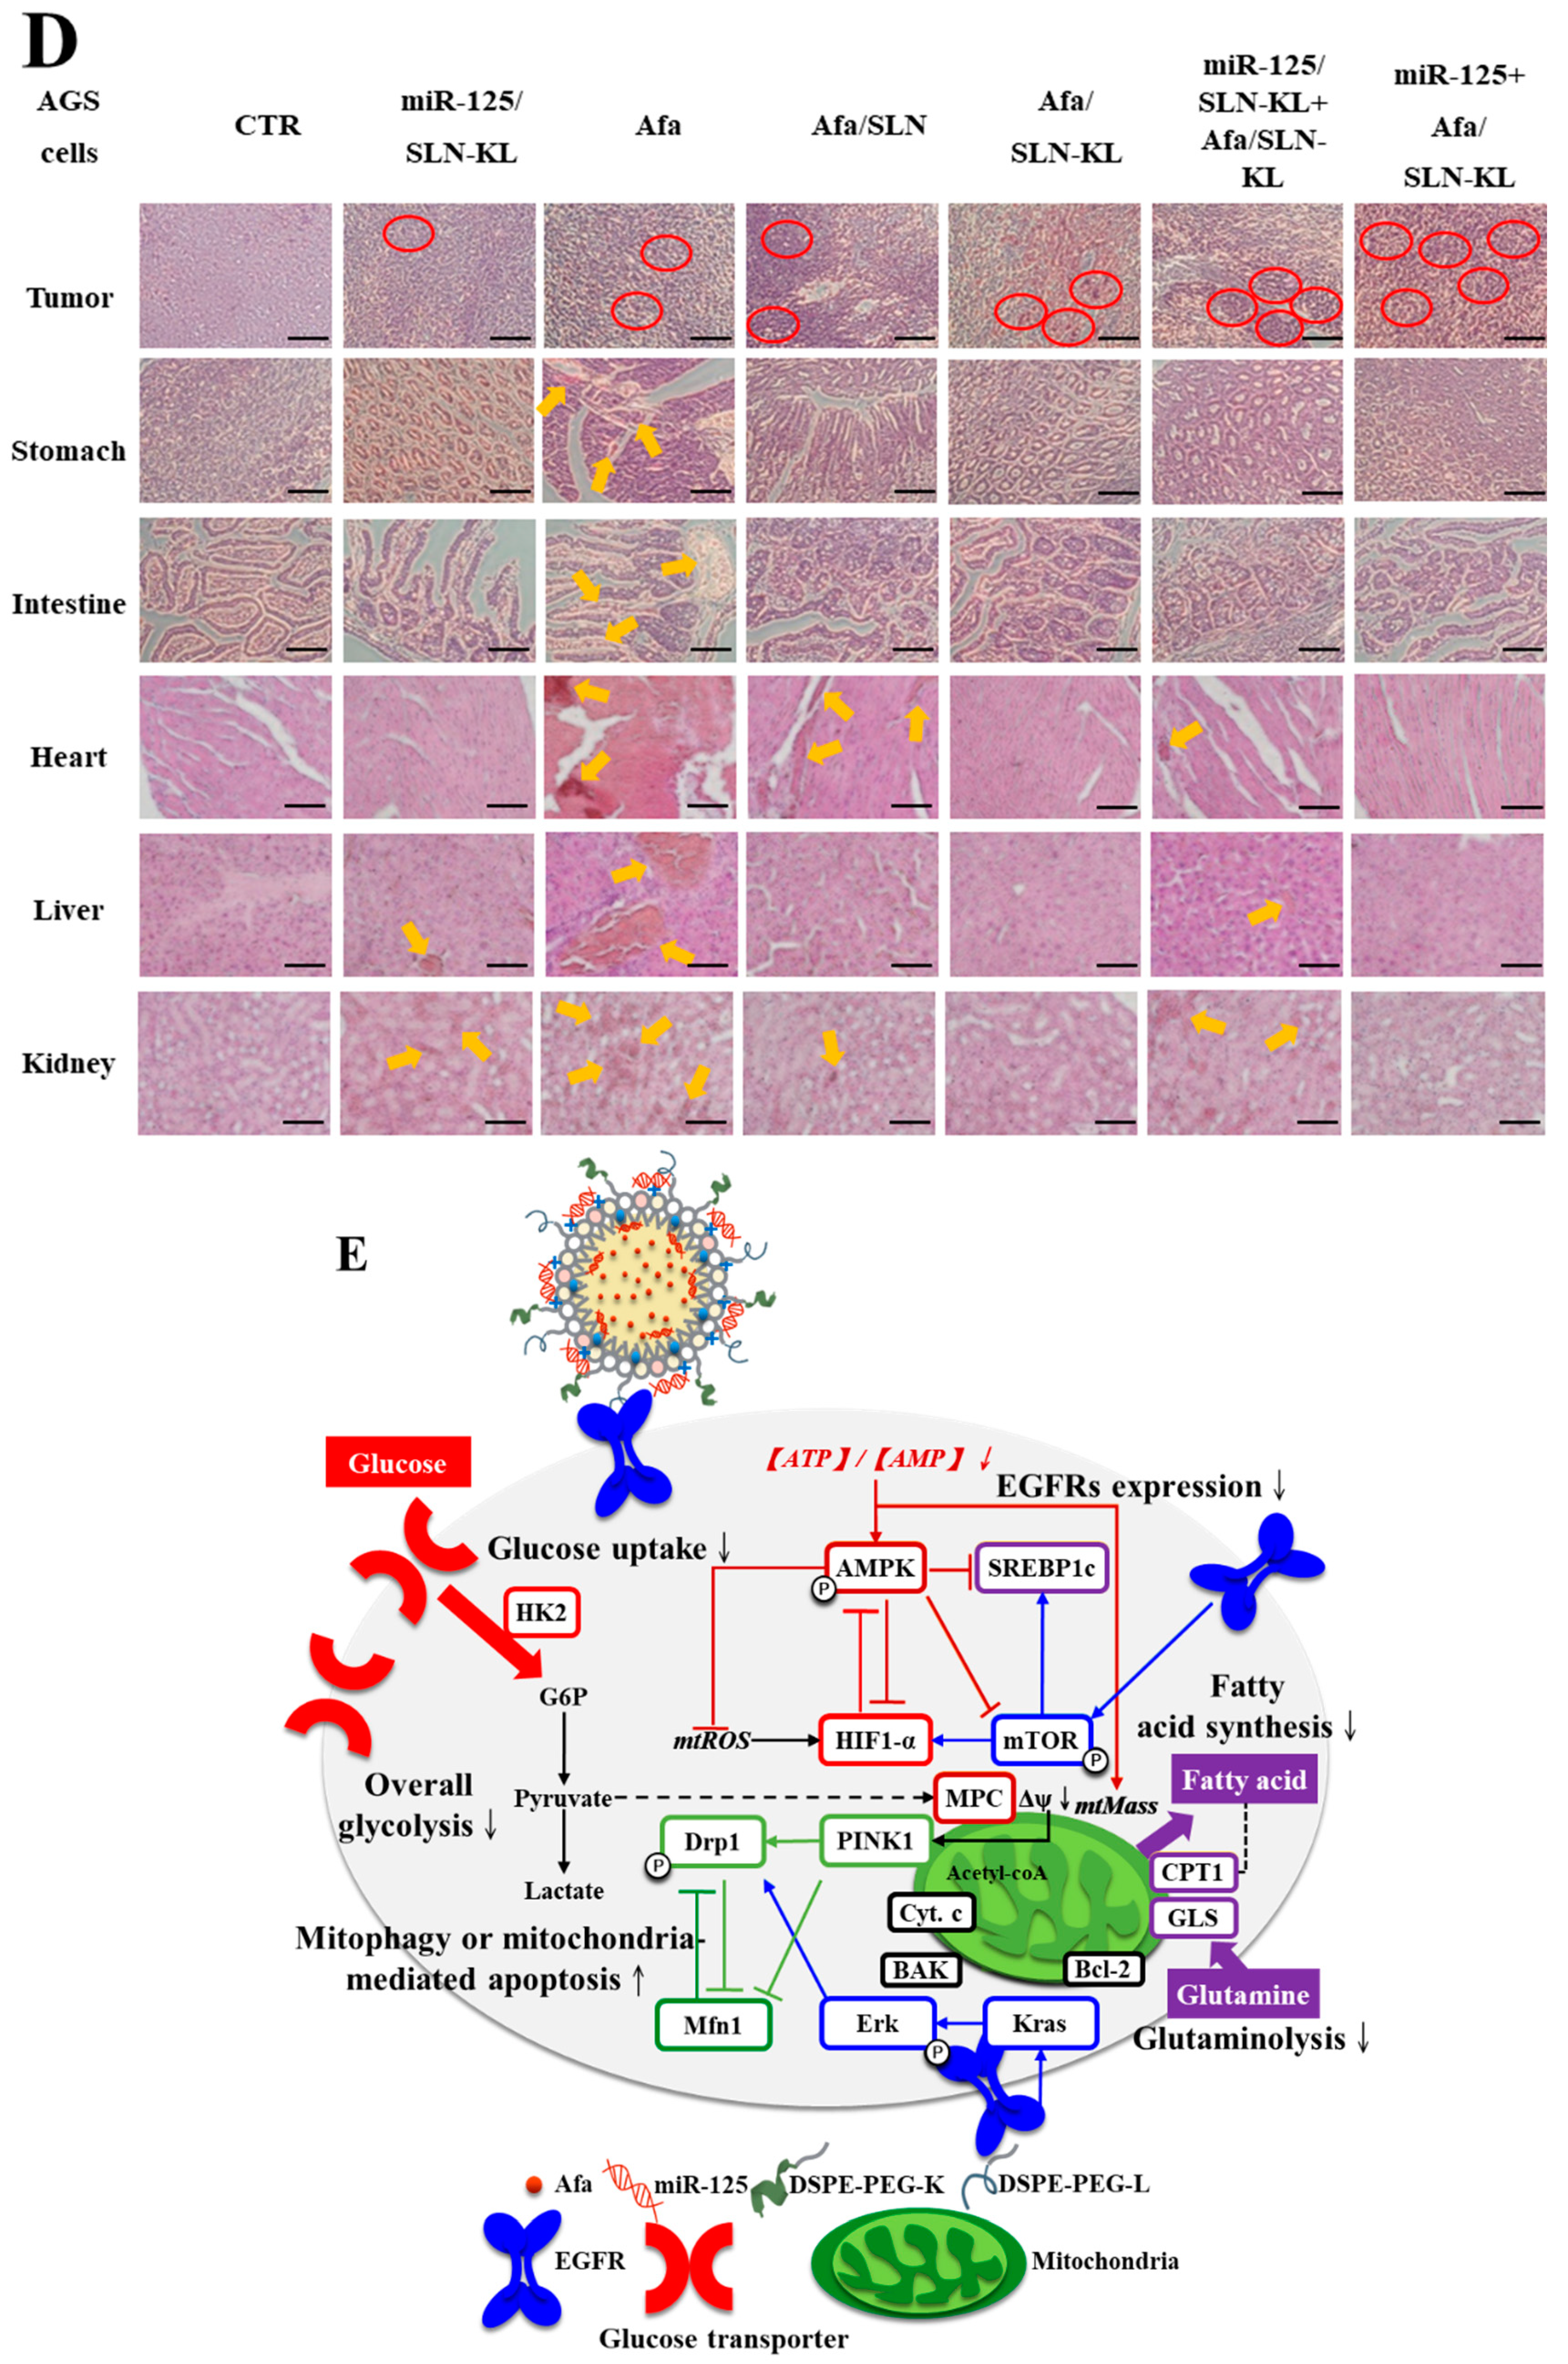
2.23. Terminal Deoxynucleotidyl Transferase-Mediated dUTP Nick End Labeling (TUNEL) Assay and Hematoxylin and Eosin (H&E) Staining
2.24. Biodistribution
2.25. Statistical Analysis
3. Results and Discussion
3.1. Physicochemical Characterization of Different miR-125 and/or Afa Formulations
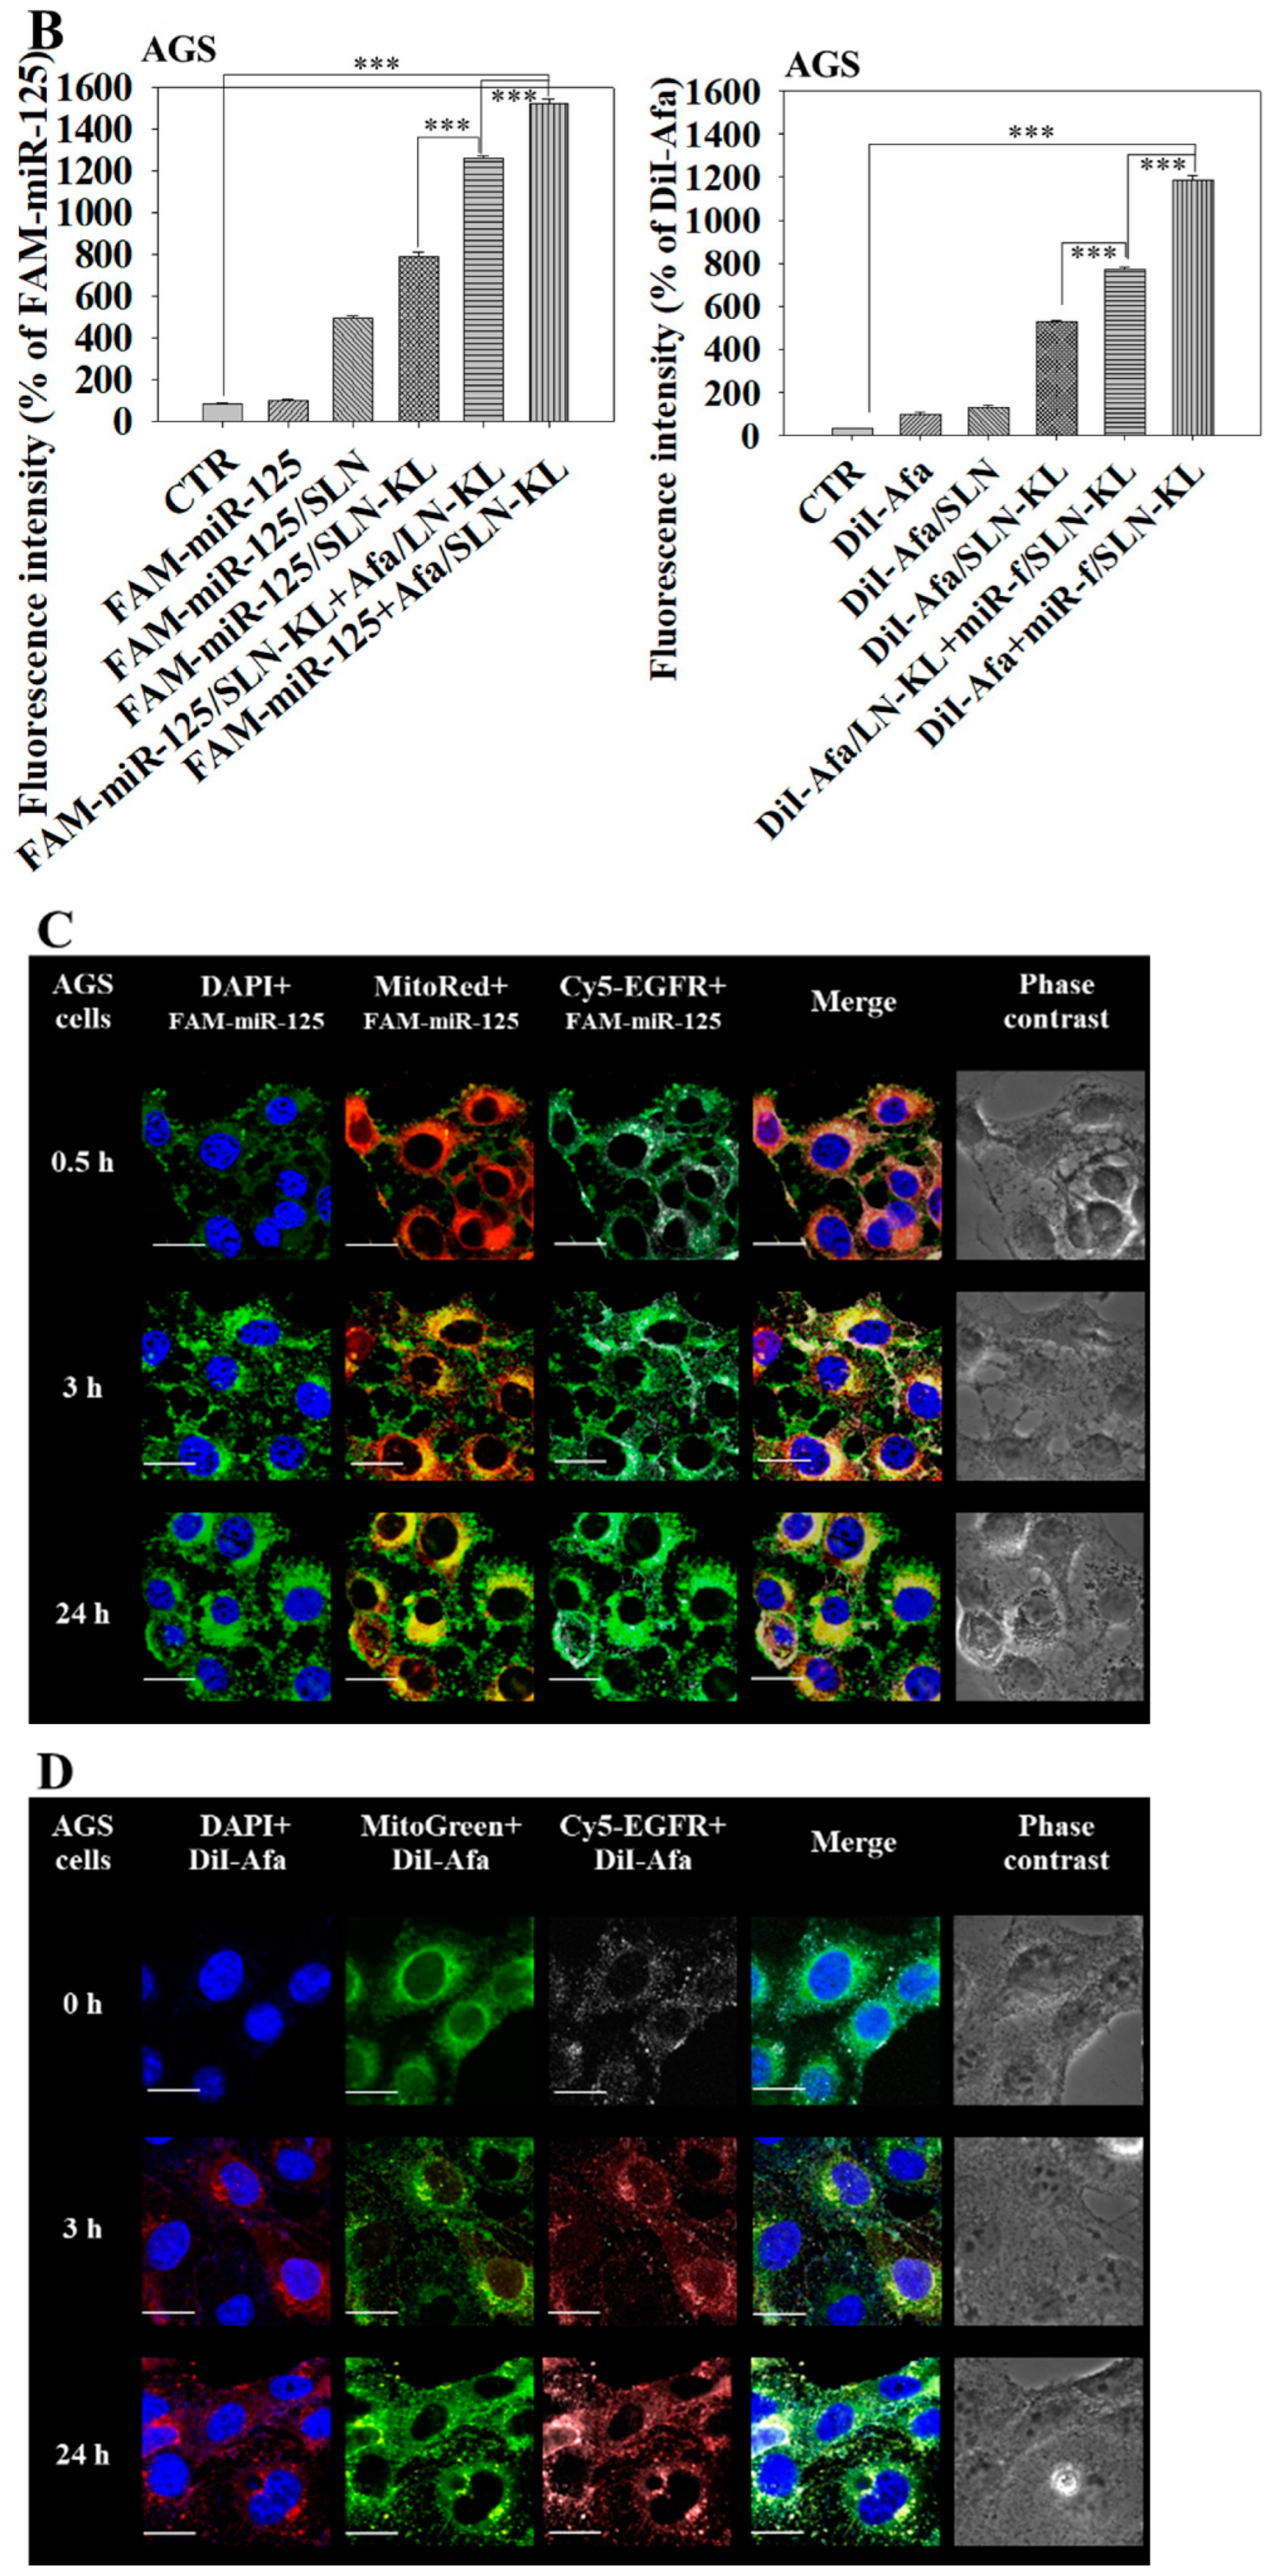
3.2. Cytotoxicity, Cellular Uptake, Transfection Efficacy, and Intracellular Trafficking of Different miR-125 and/or Afa Formulations
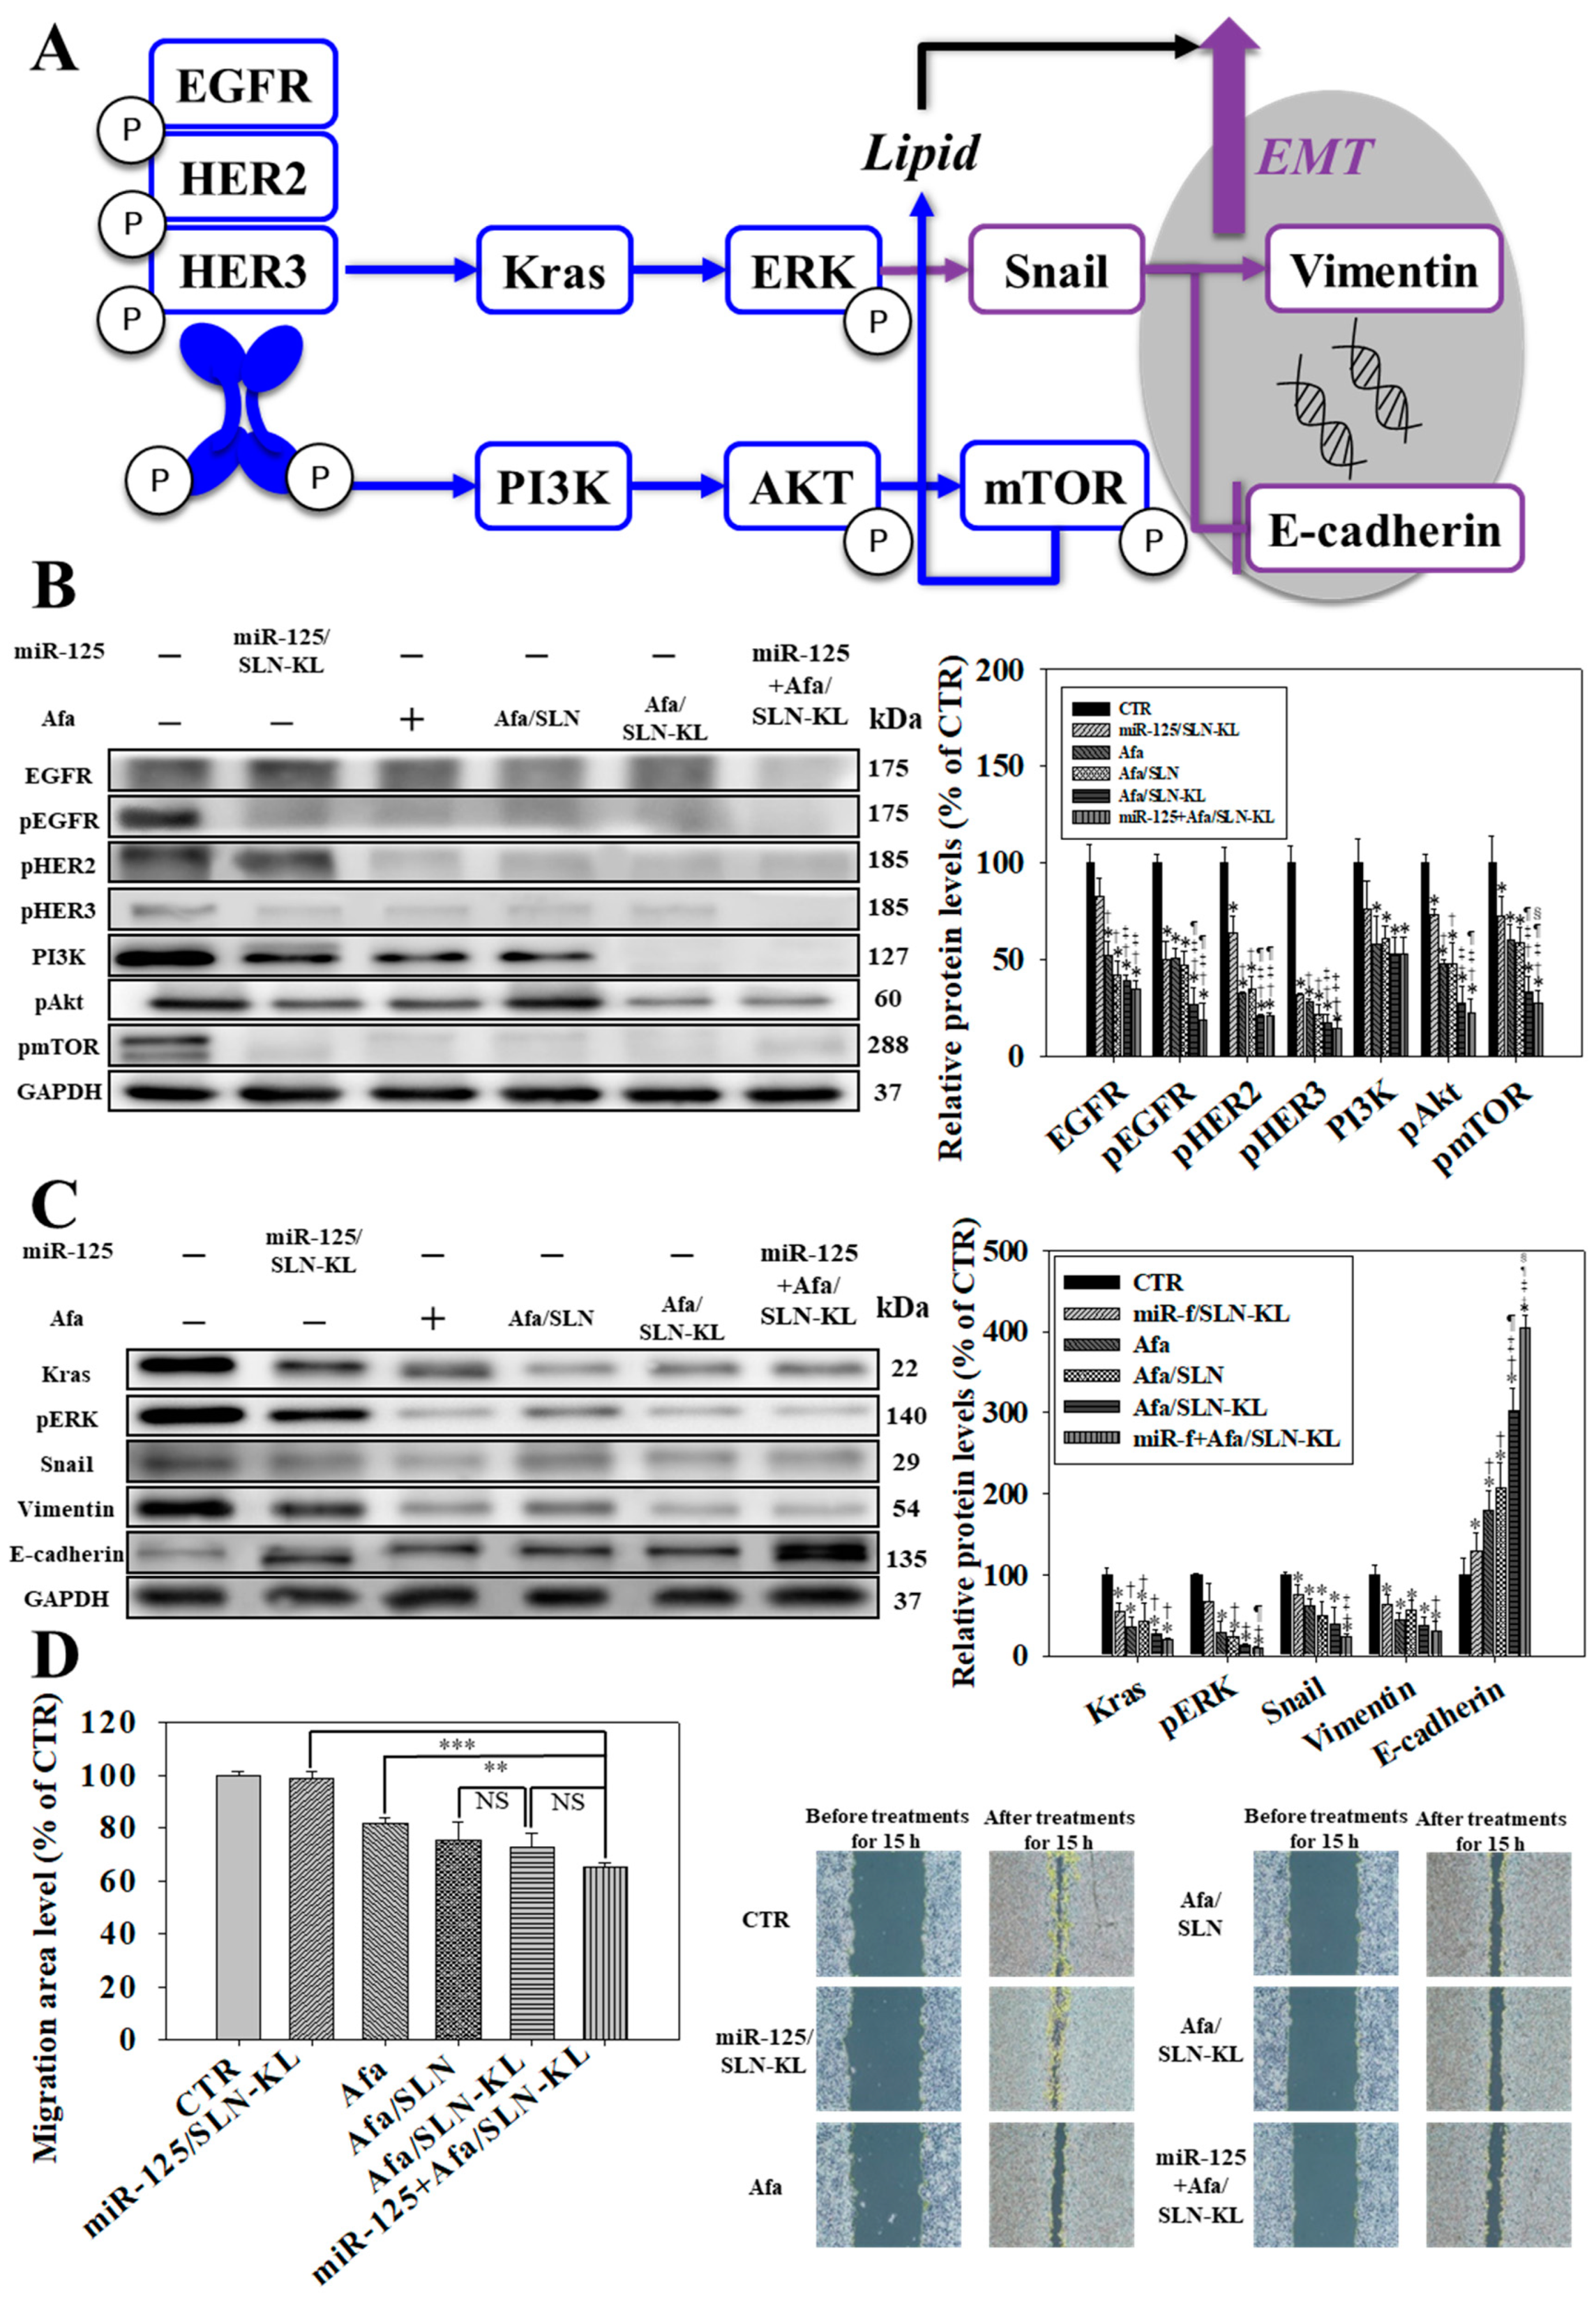
3.3. Effects of Various miR-125 and/or Afa Formulations on ErbBs/PI3K/mTOR, Kras/Erk, and Epithelial–Mesenchymal Transition (EMT) Pathways
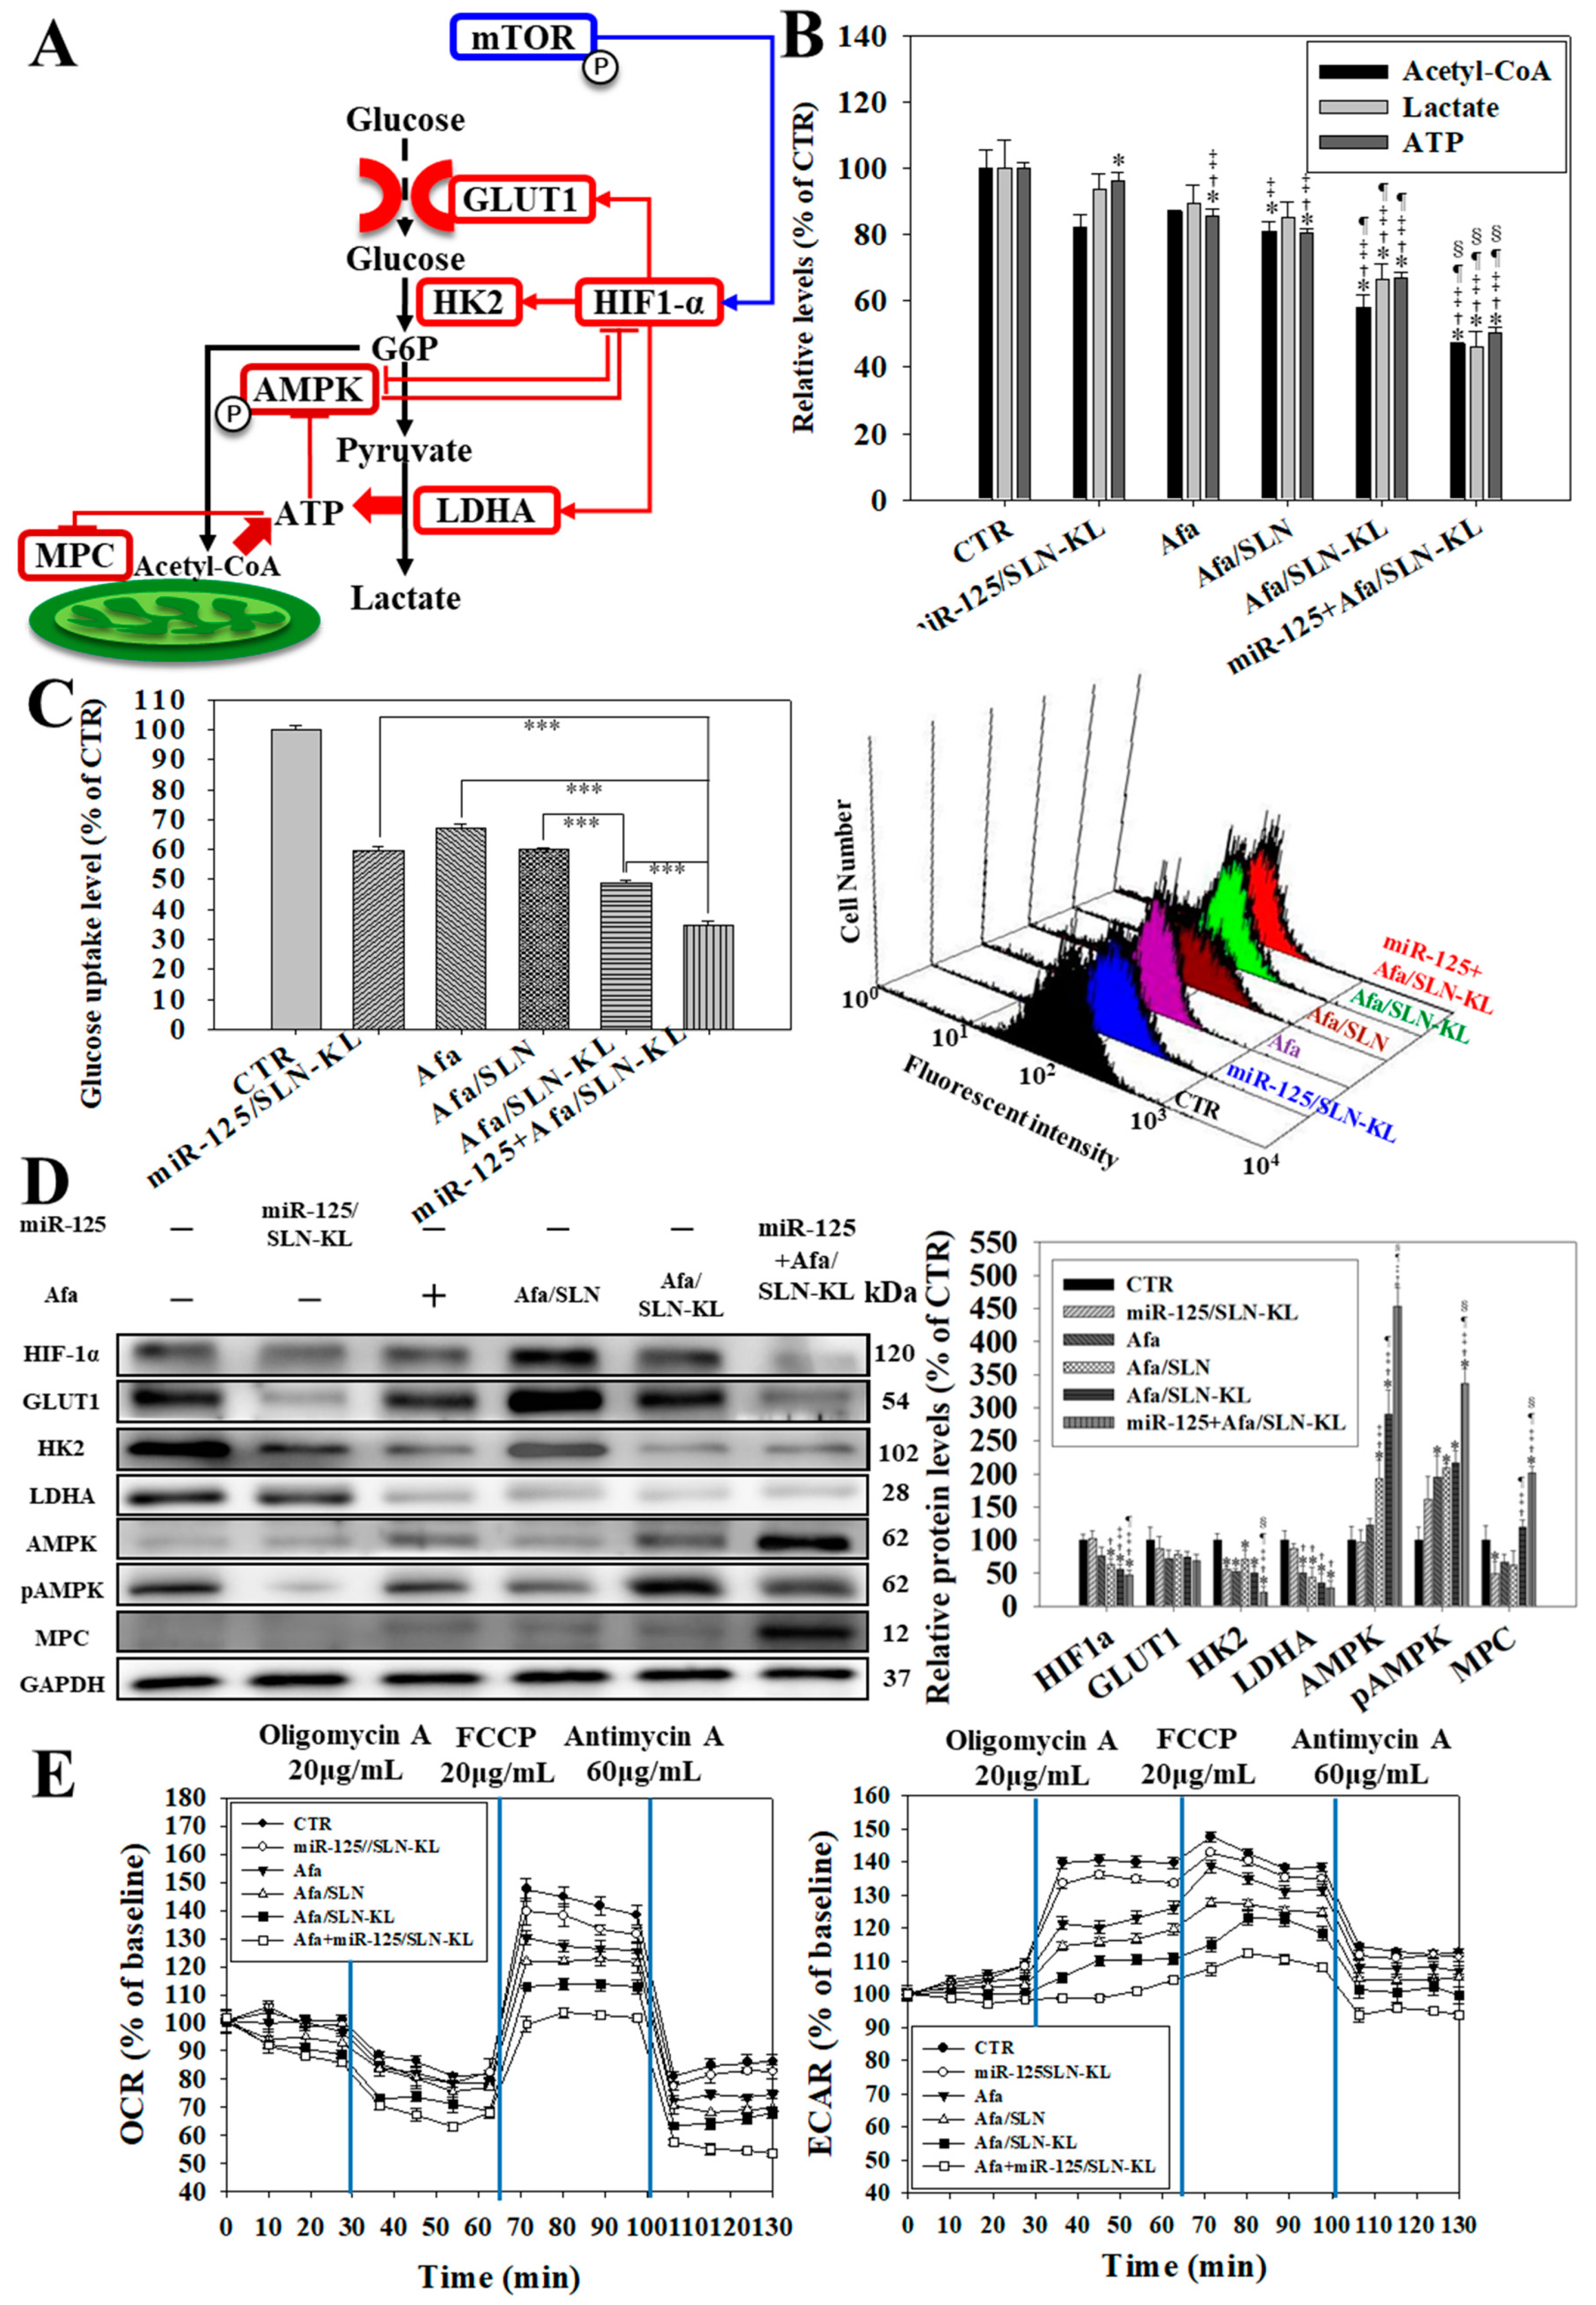
3.4. Effects of Various miR-125 and/or Afa Formulations on Aerobic and Anaerobic Glycolysis Pathways
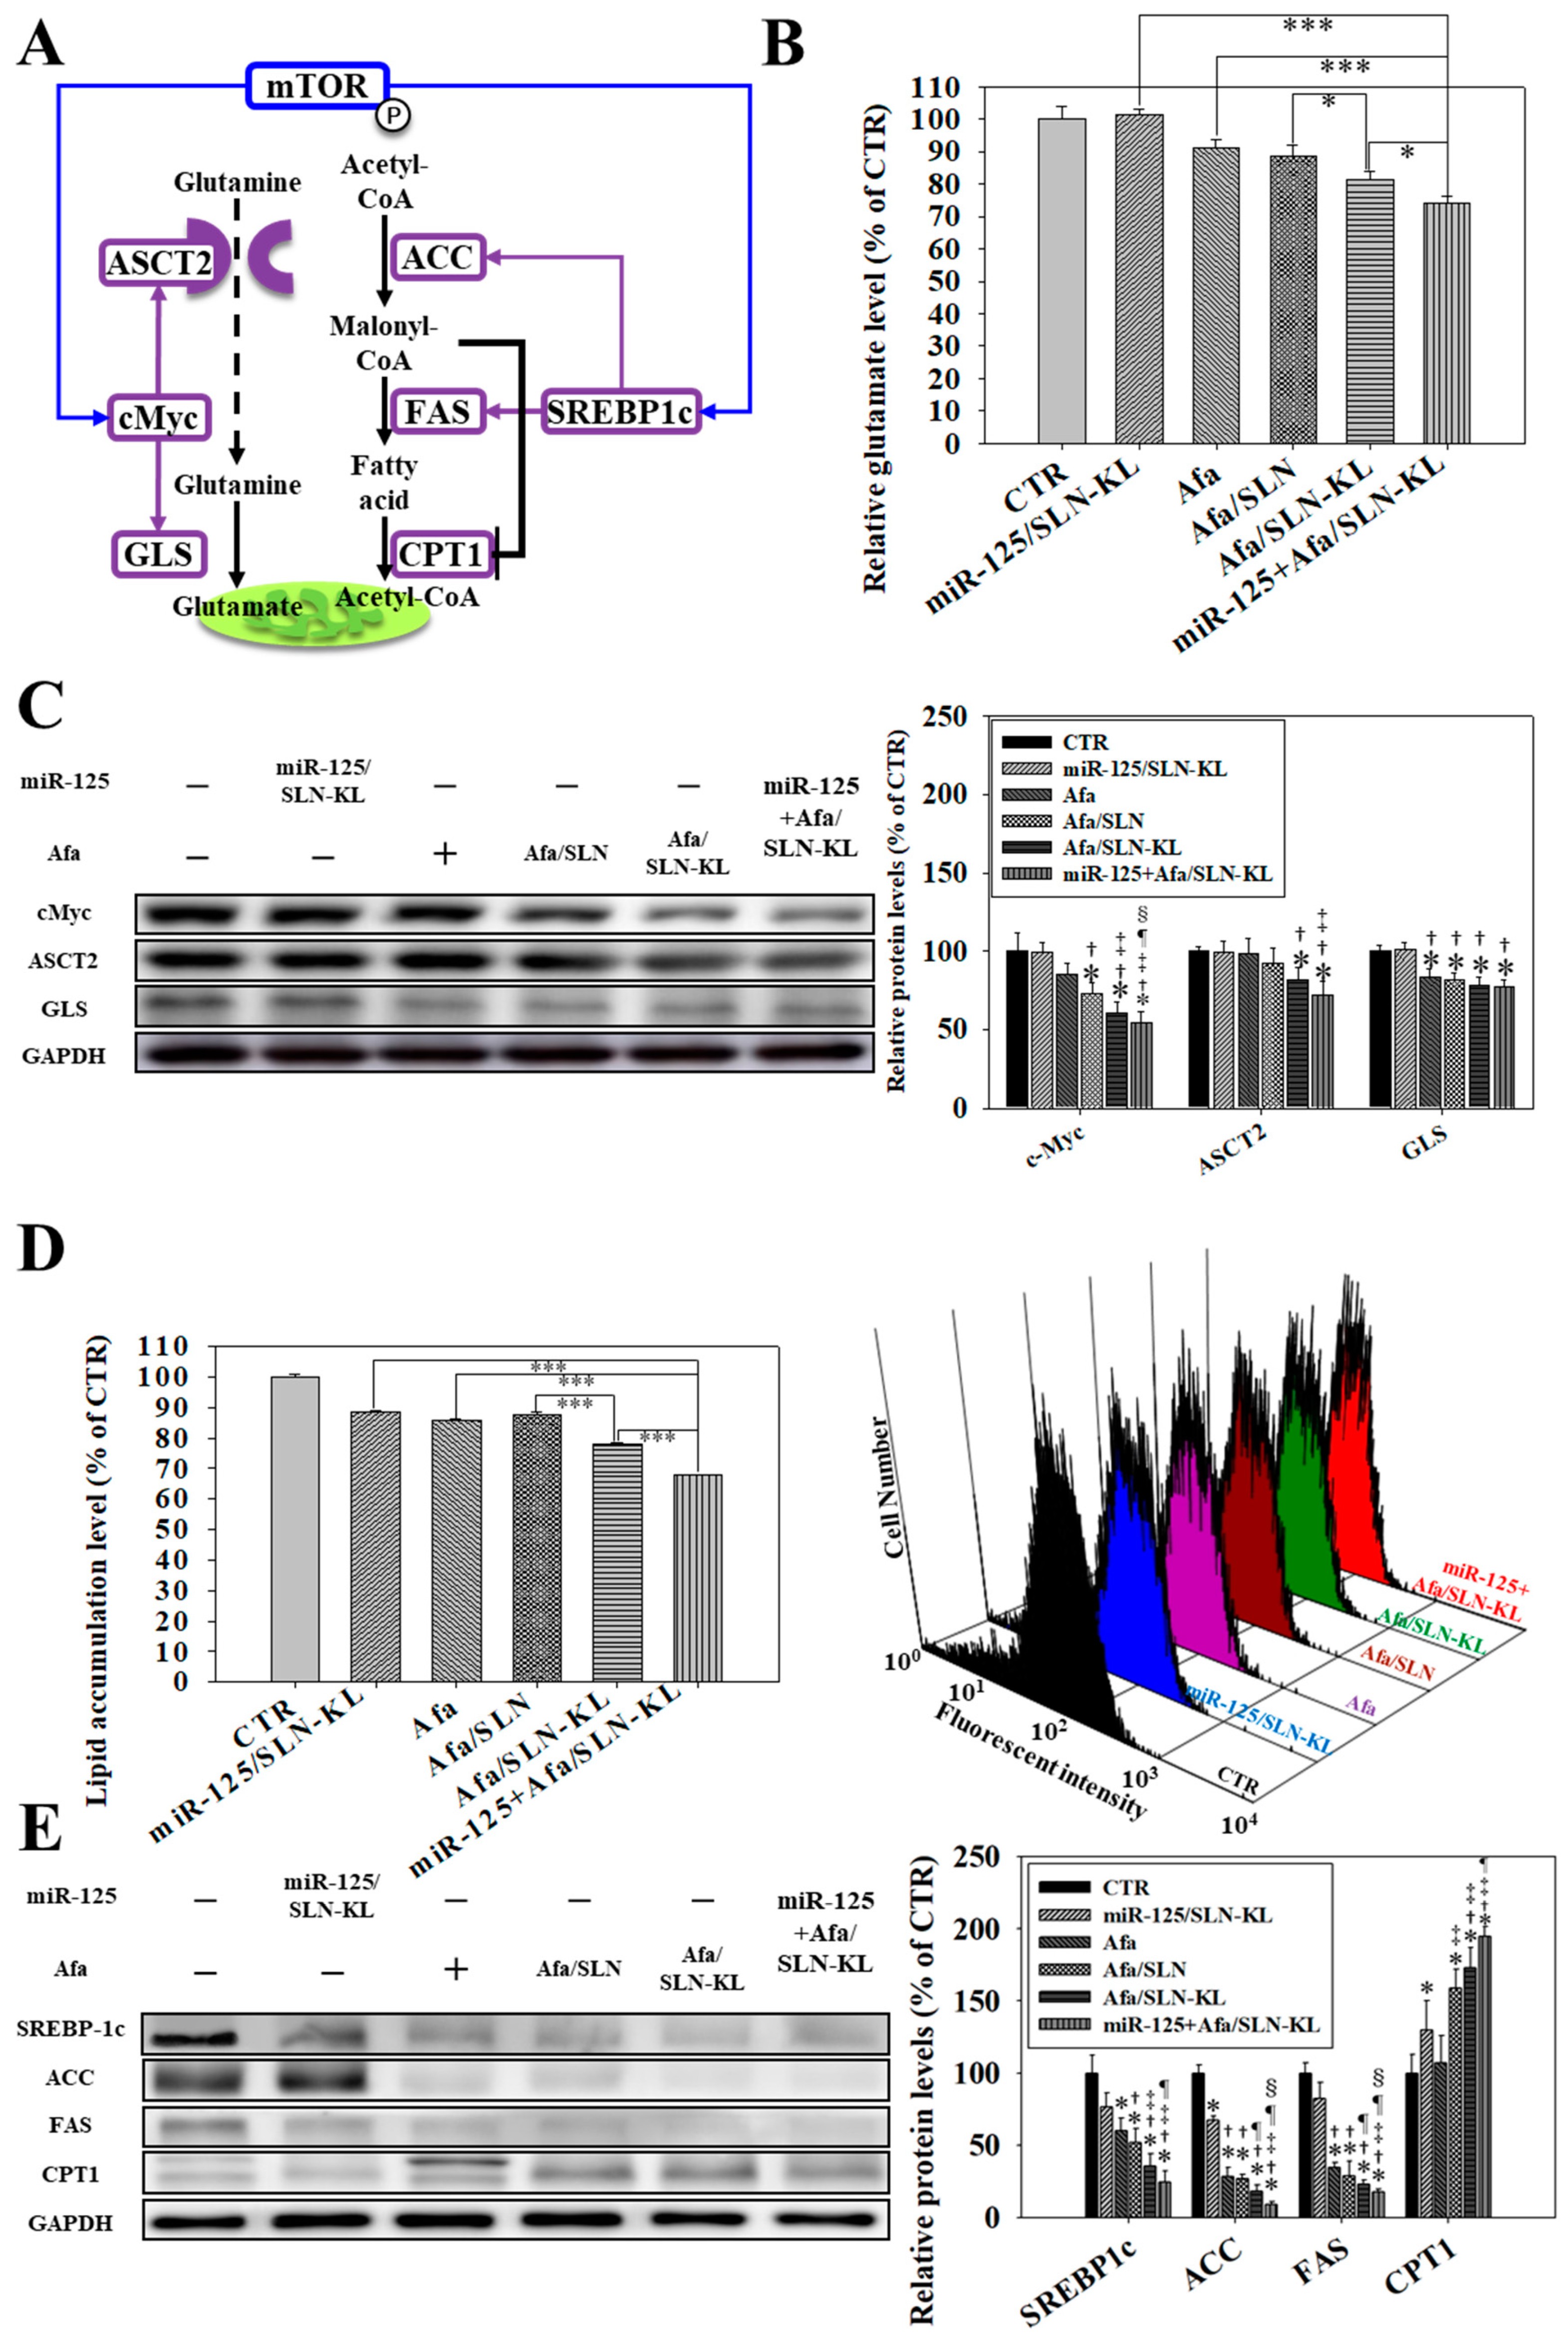
3.5. Effects of Various miR-125 and/or Afa Formulations on the Pathways of Glutaminolysis and Fatty Acid Metabolism
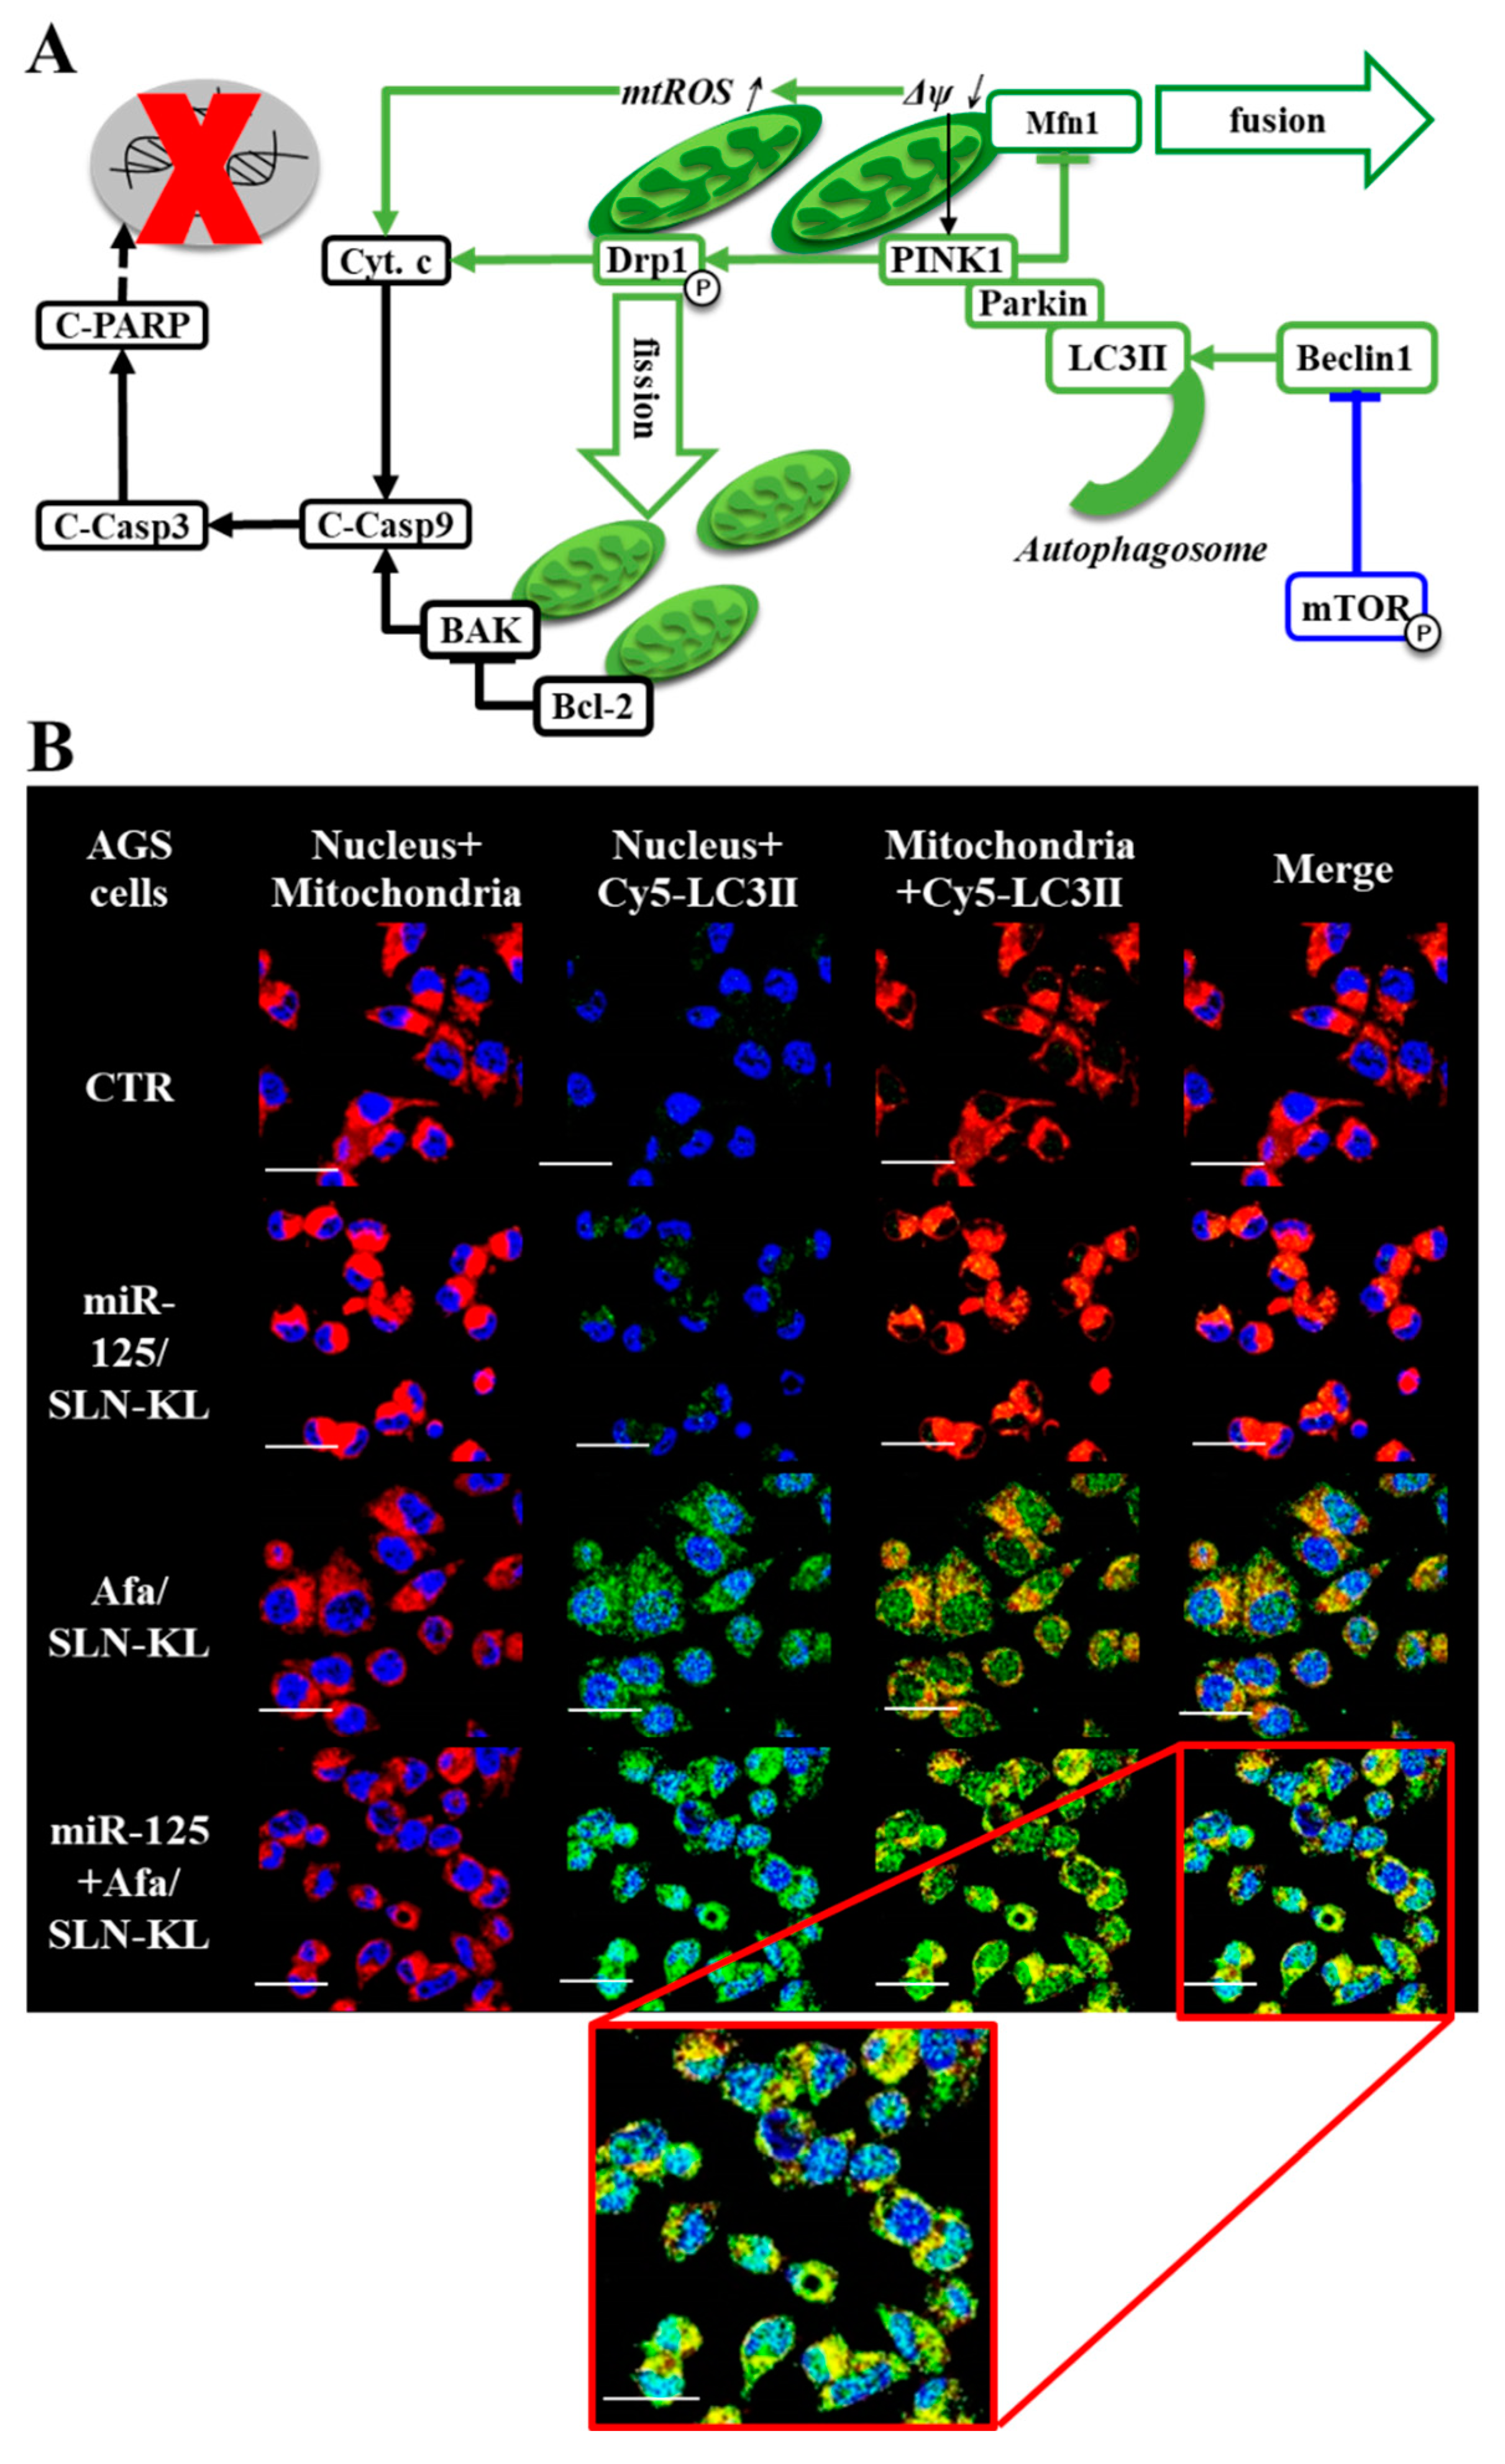
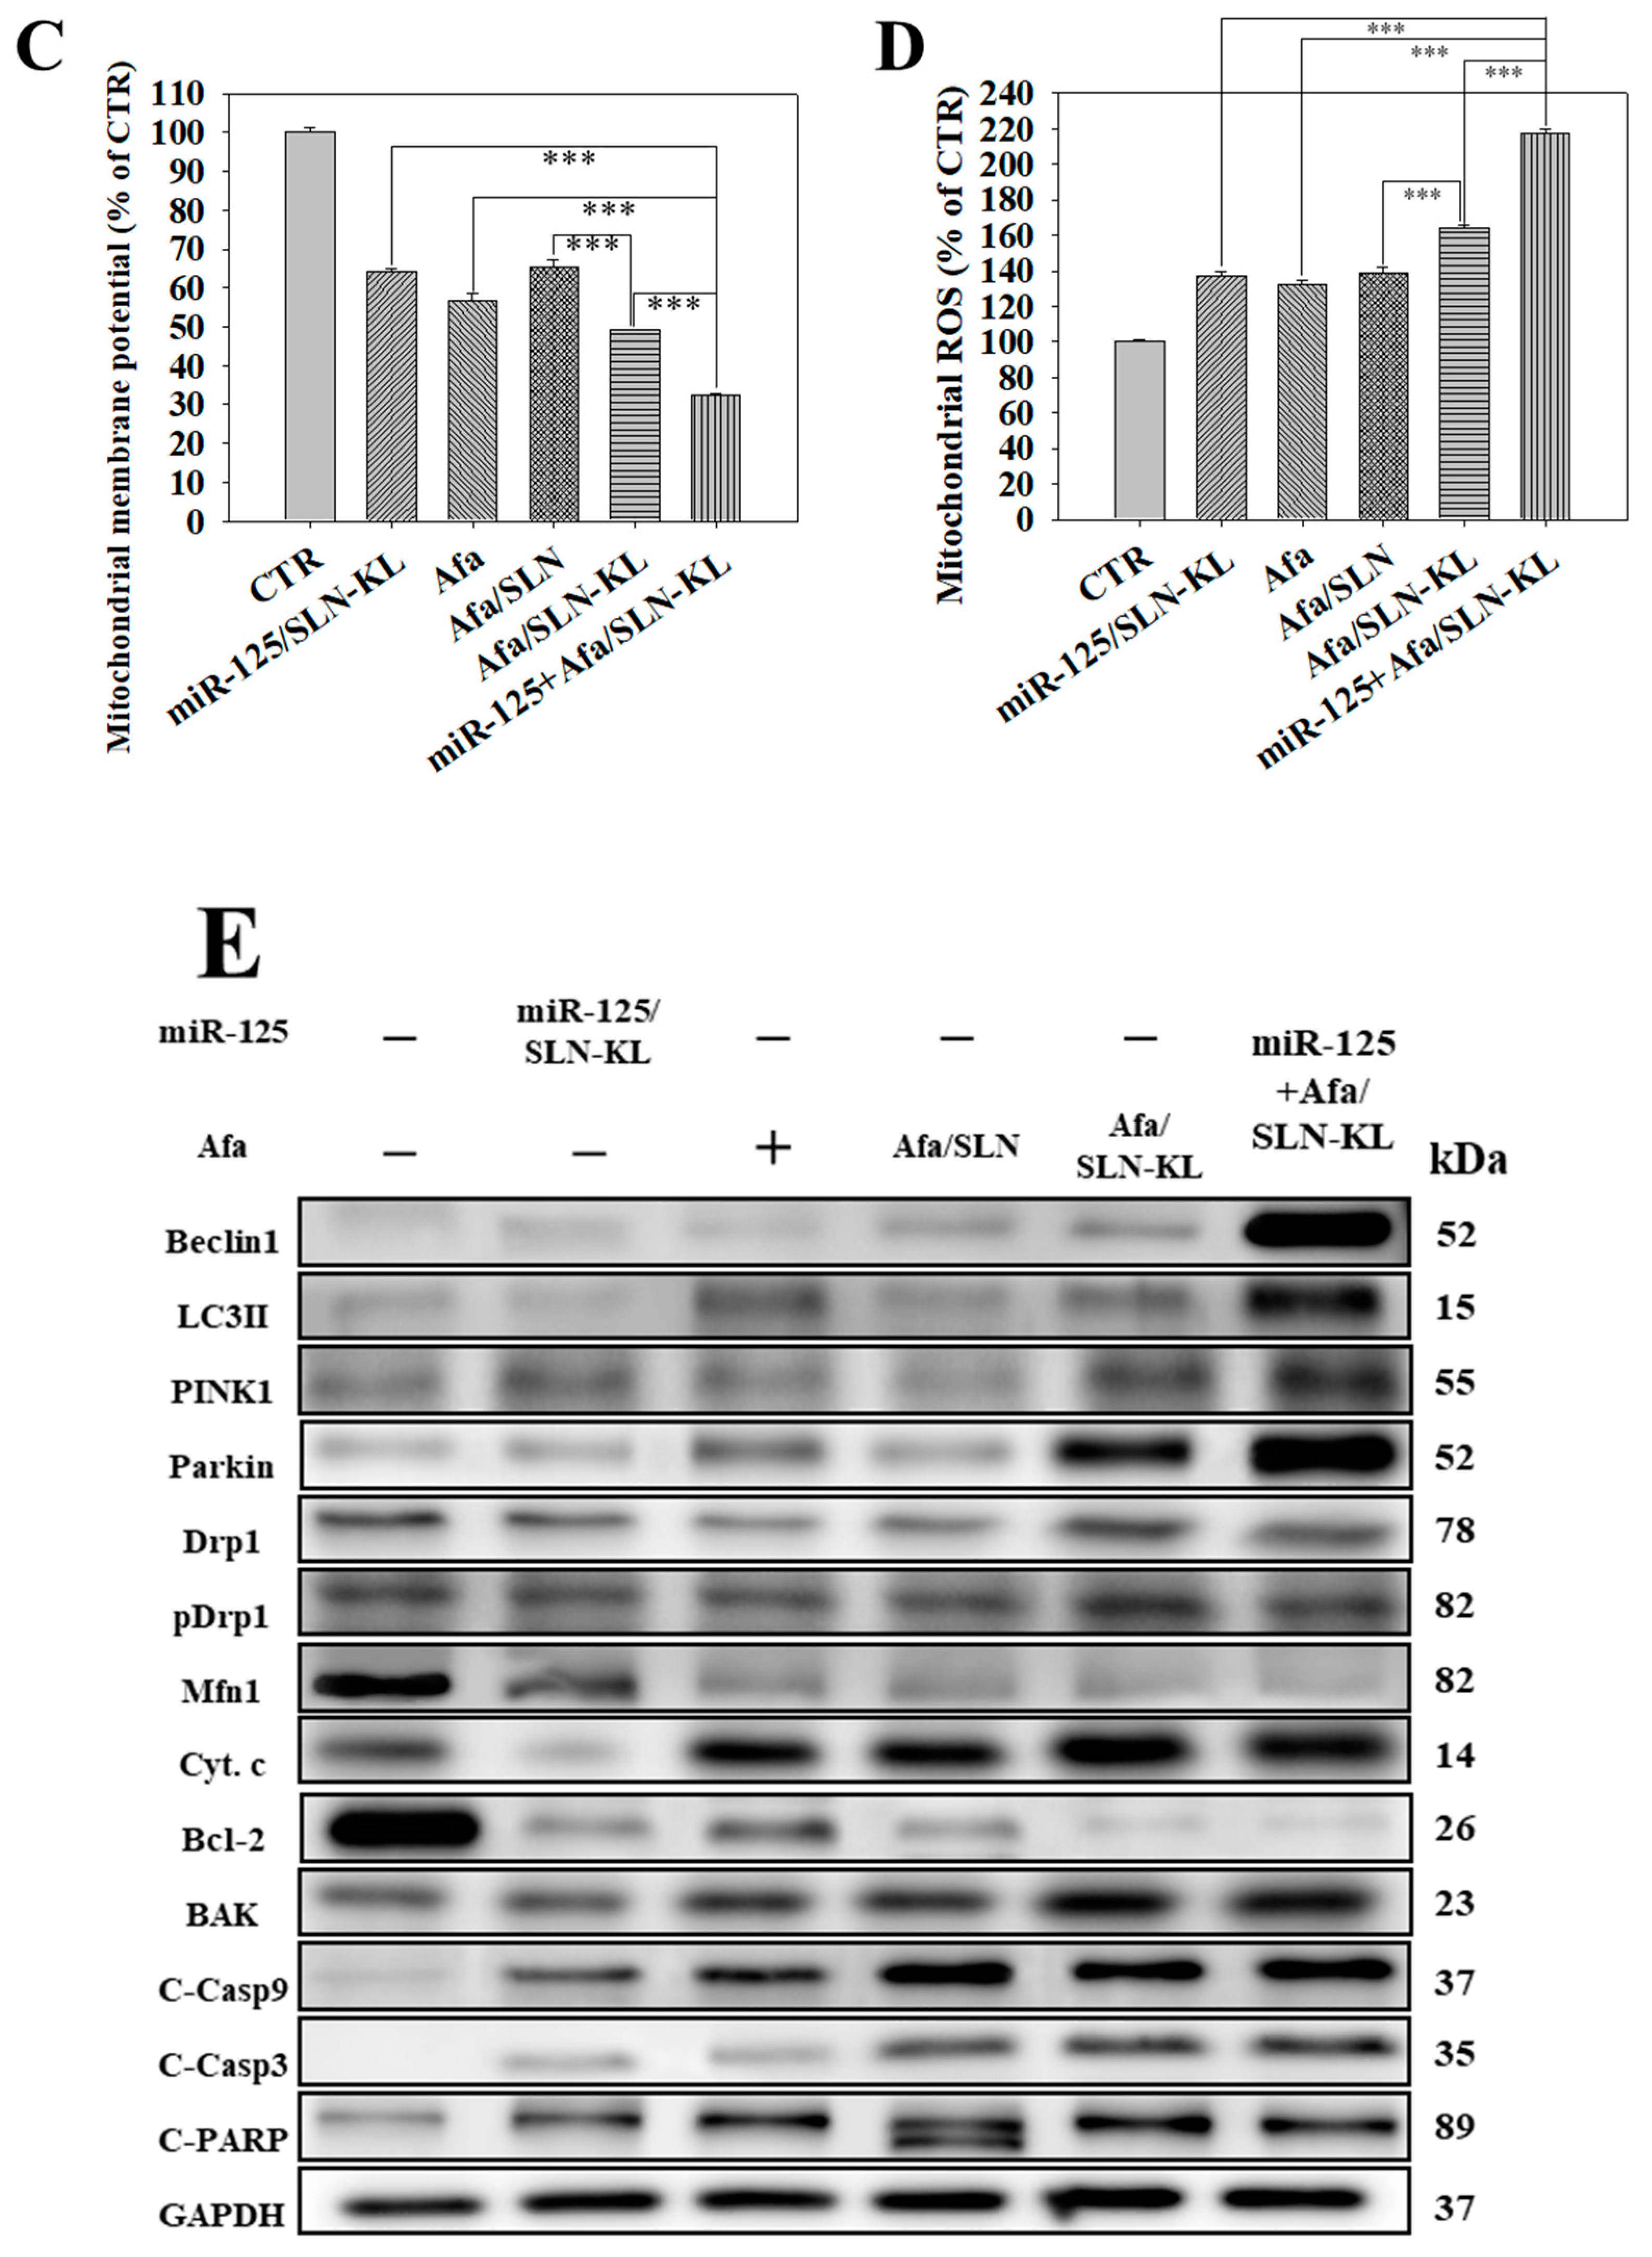
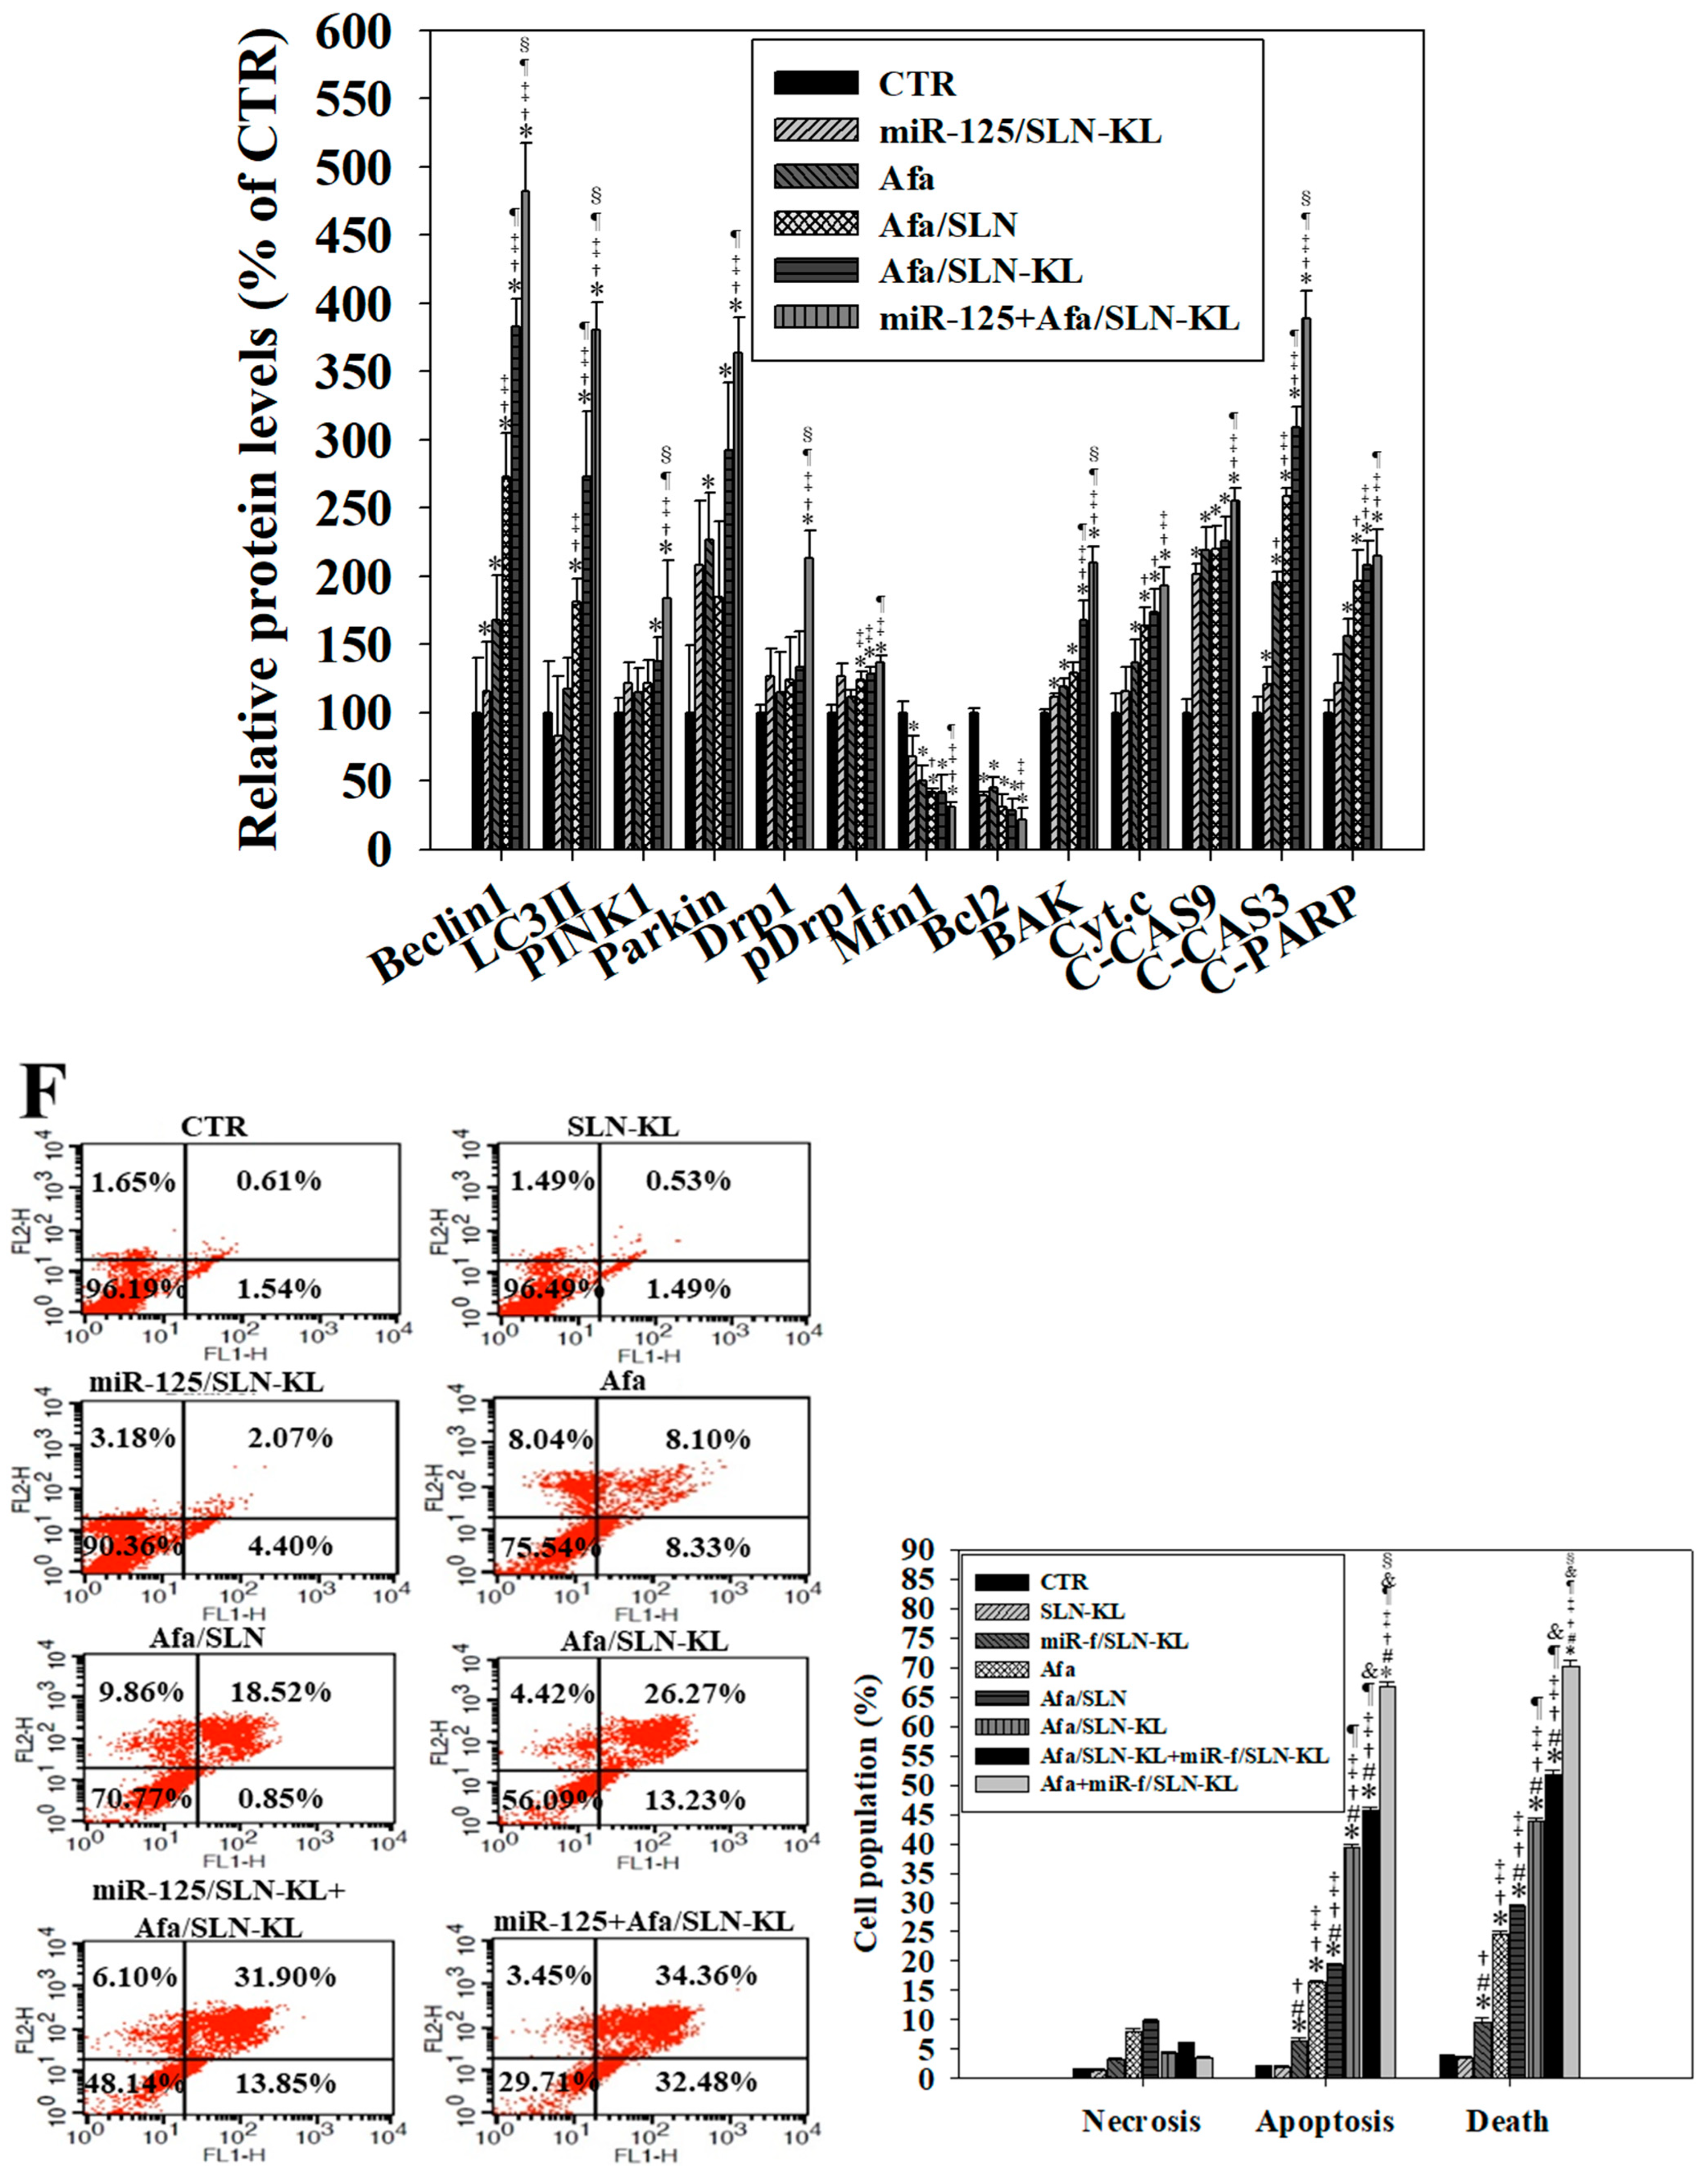
3.6. Effects of Various miR-125 and/or Afa Formulations on Mitophagy or Mitochondrion-Mediated Apoptosis Pathway
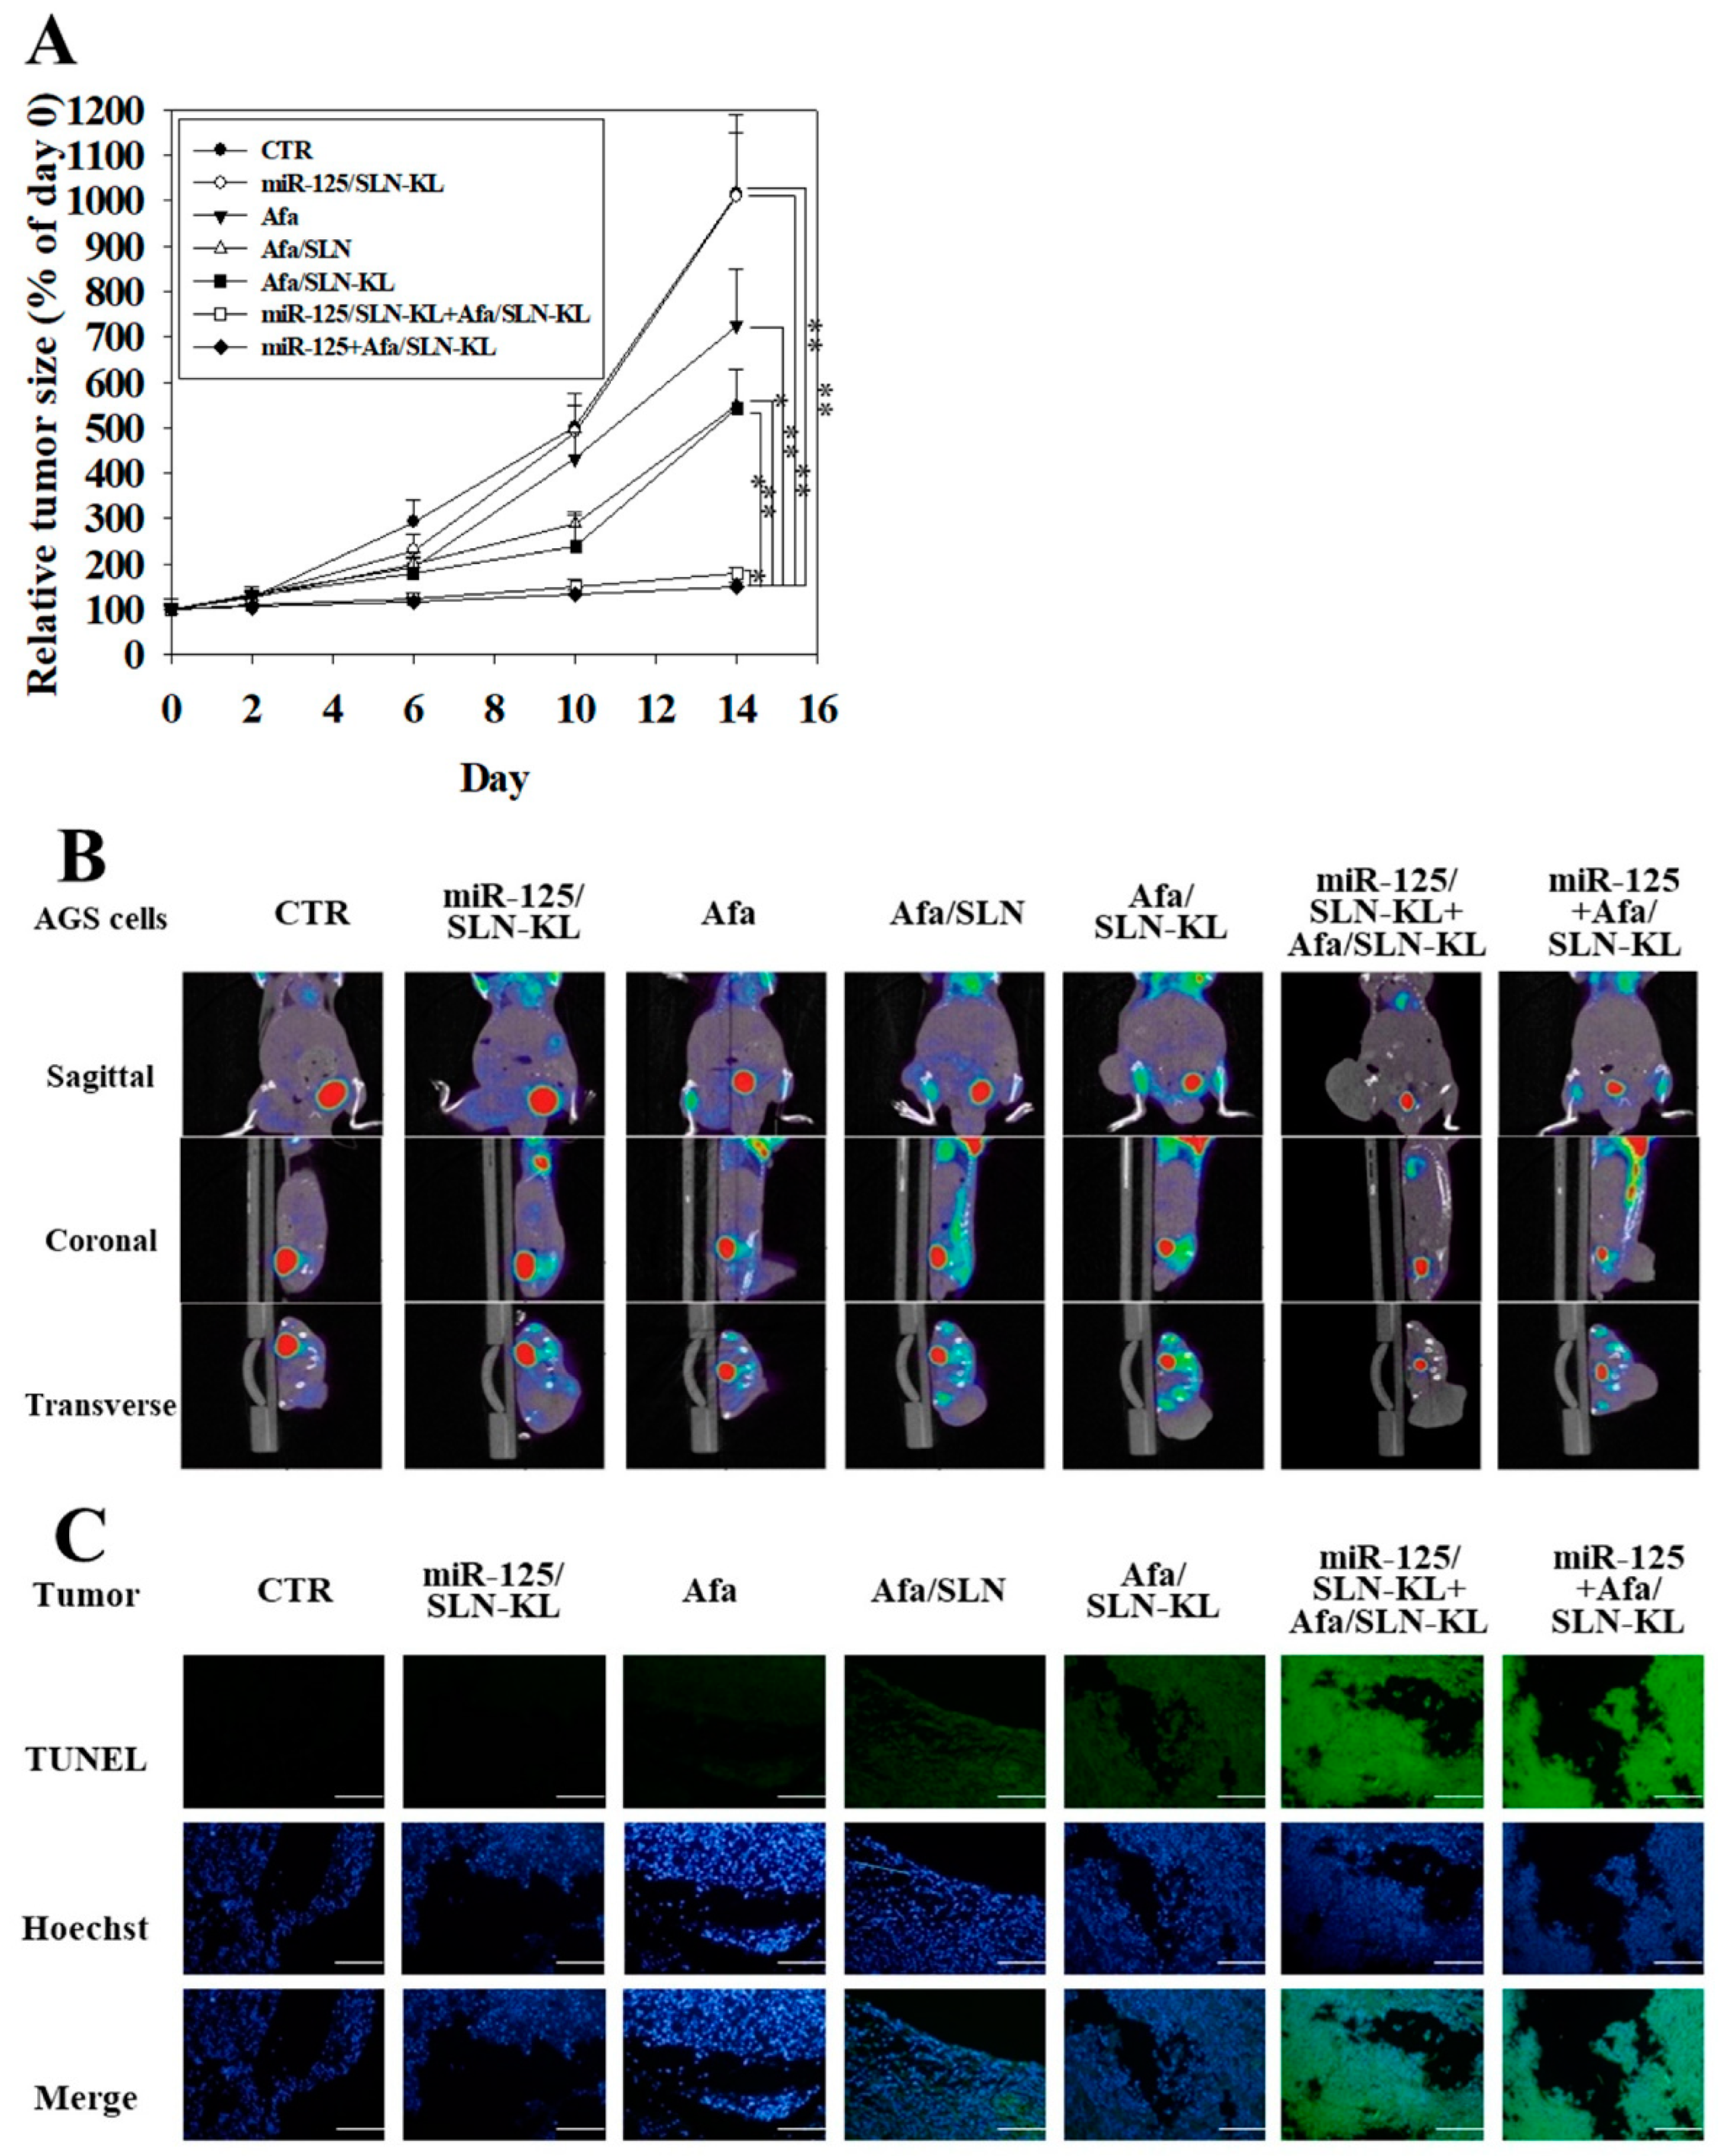
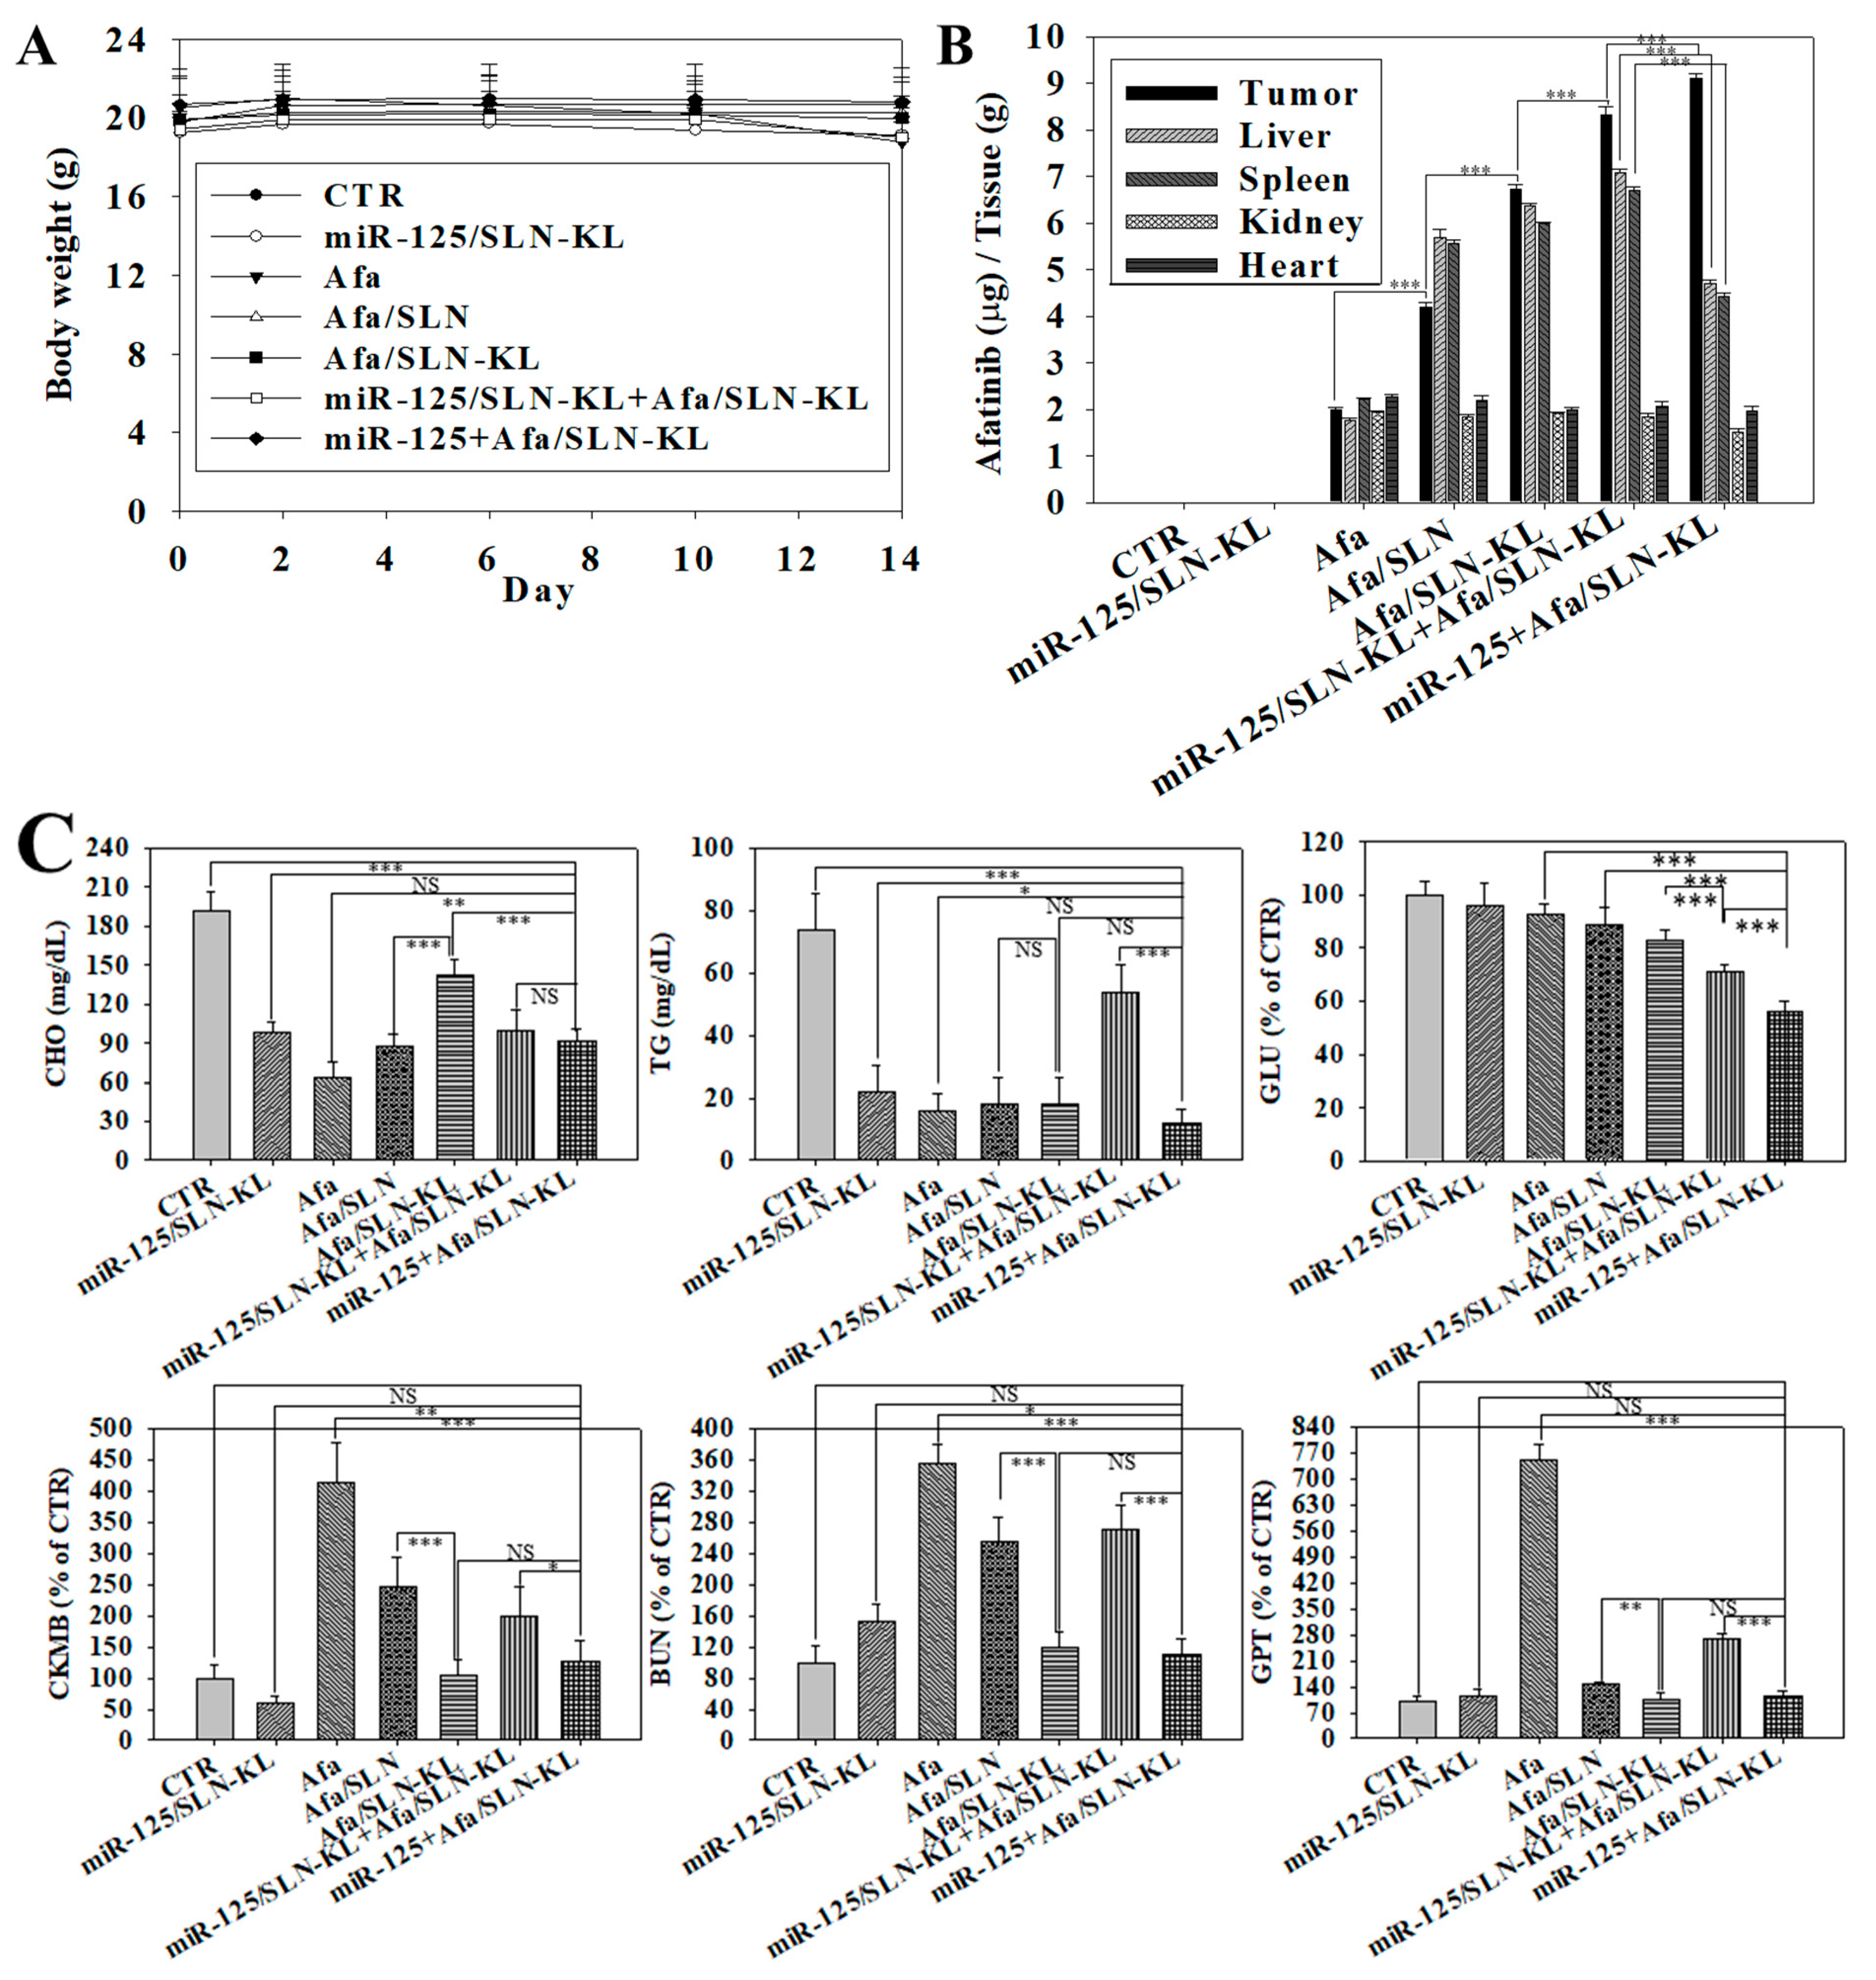
3.7. In Vivo Antitumor Efficacy and PET/CT Imaging Studies of Different Afa and/or miR-125 Formulations
3.8. Biosafety Issues and Biodistribution Studies of Various Afa and/or miR-125 Formulations
4. Conclusions
Supplementary Materials
Author Contributions
Funding
Institutional Review Board Statement
Informed Consent Statement
Data Availability Statement
Acknowledgments
Conflicts of Interest
References
- Ebert, K.; Zwingenberger, G.; Barbaria, E.; Keller, S.; Heck, C.; Arnold, R.; Hollerieth, V.; Mattes, J.; Geffers, R.; Raimúndez, E.; et al. Determining the effects of trastuzumab, cetuximab and afatinib by phosphoprotein, gene expression and phenotypic analysis in gastric cancer cell lines. BMC Cancer 2020, 20, 1039. [Google Scholar]
- Corso, S.; Pietrantonio, F.; Apicella, M.; Migliore, C.; Conticelli, D.; Petrelli, A.; D’Errico, L.; Durando, S.; Moya-Rull, D.; Bellomo, S.E.; et al. Optimized EGFR blockade strategies in EGFR addicted gastroesophageal adenocarcinomas. Clin. Cancer Res. 2021, 27, 3126–3140. [Google Scholar] [CrossRef] [PubMed]
- Liu, Z.; Shi, M.; Li, X.; Song, S.; Liu, N.; Du, H.; Ye, J.; Li, H.; Zhang, Z.; Zhang, L. HER2 copy number as predictor of disease-free survival in HER2-positive resectable gastric adenocarcinoma. J. Cancer Res. Clin. Oncol. 2021, 147, 1315–1324. [Google Scholar] [CrossRef]
- Ricci, A.D.; Rizzo, A.; Rojas Llimpe, F.L.; Di Fabio, F.; De Biase, D.; Rihawi, K. Novel HER2-Directed Treatments in Advanced Gastric Carcinoma: AnotHER Paradigm Shift. Cancers 2021, 13, 1664. [Google Scholar] [CrossRef] [PubMed]
- Chen, Z.; Liu, Z.; Zhang, M.; Huang, W.; Li, Z.; Wang, S.; Zhang, C.; Dong, B.; Gao, J.; Shen, L. EPHA2 blockade reverses acquired resistance to afatinib induced by EPHA2-mediated MAPK pathway activation in gastric cancer cells and avatar mice. Int. J. Cancer 2019, 145, 2440–2449. [Google Scholar] [CrossRef] [PubMed]
- Li, C.; Zhang, J.; Zhou, Y.; Li, B. Long non-coding RNA CASC9 promotes the progression and development of gastric cancer via regulating miR-370/EGFR axis. Dig. Liver Dis. 2021, 53, 509–516. [Google Scholar] [CrossRef] [PubMed]
- Tan, F.H.; Bai, Y.; Saintigny, P.; Darido, C. mTOR Signalling in Head and Neck Cancer: Heads Up. Cells 2019, 8, 333. [Google Scholar] [CrossRef]
- Rodríguez-Hernández, M.A.; Cruz-Ojeda, P.; López-Grueso, M.J.; Navarro-Villarán, E.; Requejo-Aguilar, R.; Castejón-Vega, B.; Negrete, M.; Gallego, P.; Vega-Ochoa, Á.; Victor, V.M.; et al. Integrated molecular signaling involving mitochondrial dysfunction and alteration of cell metabolism induced by tyrosine kinase inhibitors in cancer. Redox. Biol. 2020, 36, 101510. [Google Scholar] [CrossRef]
- Nowosad, A.; Jeannot, P.; Callot, C.; Creff, J.; Perchey, R.T.; Joffre, C.; Codogno, P.; Manenti, S.; Besson, A. p27 controls Ragulator and mTOR activity in amino acid-deprived cells to regulate the autophagy-lysosomal pathway and coordinate cell cycle and cell growth. Nat. Cell Biol. 2020, 22, 1076–1090. [Google Scholar] [CrossRef]
- Yoshioka, T.; Shien, K.; Takeda, T.; Takahashi, Y.; Kurihara, E.; Ogoshi, Y.; Namba, K.; Torigoe, H.; Sato, H.; Tomida, S.; et al. Acquired resistance mechanisms to afatinib in HER2-amplified gastric cancer cells. Cancer Sci. 2019, 110, 2549–2557. [Google Scholar] [CrossRef]
- Martin, N.; Isambert, N.; Gomez-Roca, C.; Goeldner, R.G.; Zanetta, S.; Sadrolhefazi, B.; de Mont-Serrat, H.; Campone, M.; Delord, J.P. Phase I trial of afatinib and 3-weekly trastuzumab with optimal anti-diarrheal management in patients with HER2-positive metastatic cancer. Cancer Chemother. Pharmacol. 2018, 82, 979–986. [Google Scholar] [CrossRef] [PubMed]
- Lo, Y.-L.; Lin, H.-C.; Hong, S.-T.; Chang, C.-H.; Wang, C.-S.; Lin, A.M.-Y. Lipid polymeric nanoparticles modified with tight junction-modulating peptides promote afatinib delivery across a blood–brain barrier model. Cancer Nanotechnol. 2021, 12, 13–32. [Google Scholar] [CrossRef]
- Tang, W.K.; Odzorig, T.; Jin, W.; Xia, D. Structural Basis of p97 Inhibition by the Site-Selective Anticancer Compound CB-5083. Mol. Pharmacol. 2019, 95, 286–293. [Google Scholar] [CrossRef] [PubMed]
- Wang, X.; Plachetzki, D.C.; Cote, R.H. The N termini of the inhibitory gamma-subunits of phosphodiesterase-6 (PDE6) from rod and cone photoreceptors differentially regulate transducin-mediated PDE6 activation. J. Biol. Chem. 2019, 294, 8351–8360. [Google Scholar] [CrossRef] [PubMed]
- Licini, C.; Avellini, C.; Picchiassi, E.; Mensà, E.; Fantone, S.; Ramini, D.; Tersigni, C.; Tossetta, G.; Castellucci, C.; Tarquini, F.; et al. Pre-eclampsia predictive ability of maternal miR-125b: A clinical and experimental study. Transl. Res. 2021, 228, 13–27. [Google Scholar] [CrossRef]
- Fassan, M.; Pizzi, M.; Realdon, S.; Balistreri, M.; Guzzardo, V.; Zagonel, V.; Castoro, C.; Mastracci, L.; Farinati, F.; Nitti, D.; et al. The HER2-miR125a5p/miR125b loop in gastric and esophageal carcinogenesis. Hum. Pathol. 2013, 44, 1804–1810. [Google Scholar] [CrossRef]
- Zhang, C.; Zhang, C.D.; Ma, M.H.; Dai, D.Q. Three-microRNA signature identified by bioinformatics analysis predicts prognosis of gastric cancer patients. World J. Gastroenterol. 2018, 24, 1206–1215. [Google Scholar] [CrossRef]
- Fu, Q.; Tan, X.; Tang, H.; Liu, J. CCL21 activation of the MALAT1/SRSF1/mTOR axis underpins the development of gastric carcinoma. J. Transl. Med. 2021, 19, 210. [Google Scholar] [CrossRef]
- Zhang, J.; Chen, G.; Gao, Y.; Liang, H. HOTAIR/miR-125 axis-mediated Hexokinase 2 expression promotes chemoresistance in human glioblastoma. J. Cell Mol. Med. 2020, 24, 5707–5717. [Google Scholar] [CrossRef]
- Chang, W.; Xiao, D.; Ao, X.; Li, M.; Xu, T.; Wang, J. Increased Dynamin-Related Protein 1-Dependent Mitochondrial Fission Contributes to High-Fat-Diet-Induced Cardiac Dysfunction and Insulin Resistance by Elevating Tafazzin in Mouse Hearts. Mol. Nutr. Food Res. 2019, 63, e1801322. [Google Scholar] [CrossRef]
- Lo, Y.L.; Chang, C.H.; Wang, C.S.; Yang, M.H.; Lin, A.M.; Hong, C.J.; Tseng, W.H. PEG-coated nanoparticles detachable in acidic microenvironments for the tumor-directed delivery of chemo- and gene therapies for head and neck cancer. Theranostics 2020, 10, 6695–6714. [Google Scholar] [CrossRef] [PubMed]
- Steiner, D.; Bunjes, H. Influence of process and formulation parameters on the preparation of solid lipid nanoparticles by dual centrifugation. Int. J. Pharm. X 2021, 3, 100085. [Google Scholar] [CrossRef] [PubMed]
- Lo, Y.L.; Wang, C.S.; Chen, Y.C.; Wang, T.Y.; Chang, Y.H.; Chen, C.J.; Yang, C.P. Mitochondrion-Directed Nanoparticles Loaded with a Natural Compound and a microRNA for Promoting Cancer Cell Death via the Modulation of Tumor Metabolism and Mitochondrial Dynamics. Pharmaceutics 2020, 12, 756. [Google Scholar] [CrossRef]
- Meschenmoser, K.; Kim, Y.; Franken, S.; Nowak, M.; Feldmann, G.; Bendas, G.; Wolfgarten, M.; Messmer, D.; Schmidt-Wolf, I.G. Targeting cancer with a bi-functional peptide: In vitro and in vivo results. In Vivo 2013, 27, 431–442. [Google Scholar] [PubMed]
- Han, C.Y.; Yue, L.L.; Tai, L.Y.; Zhou, L.; Li, X.Y.; Xing, G.H.; Yang, X.G.; Sun, M.S.; Pan, W.S. A novel small peptide as an epidermal growth factor receptor targeting ligand for nanodelivery in vitro. Int. J. Nanomed. 2013, 8, 1541–1549. [Google Scholar]
- Kaufman, N.E.M.; Meng, Q.; Griffin, K.E.; Singh, S.S.; Dahal, A.; Zhou, Z.; Fronczek, F.R.; Mathis, J.M.; Jois, S.D.; Vicente, M.G.H. Synthesis, Characterization, and Evaluation of Near-IR Boron Dipyrromethene Bioconjugates for Labeling of Adenocarcinomas by Selectively Targeting the Epidermal Growth Factor Receptor. J. Med. Chem. 2019, 62, 3323–3335. [Google Scholar] [CrossRef] [PubMed]
- Bazylinska, U.; Pietkiewicz, J.; Rossowska, J.; Chodaczek, G.; Gamian, A.; Wilk, K.A. Polyelectrolyte Oil-Core Nanocarriers for Localized and Sustained Delivery of Daunorubicin to Colon Carcinoma MC38 Cells: The Case of Polysaccharide Multilayer Film in Relation to PEG-ylated Shell. Macromol. Biosci. 2017, 17, 1600356. [Google Scholar] [CrossRef]
- Lee, S.W.L.; Paoletti, C.; Campisi, M.; Osaki, T.; Adriani, G.; Kamm, R.D.; Mattu, C.; Chiono, V. MicroRNA delivery through nanoparticles. J. Control Release 2019, 313, 80–95. [Google Scholar] [CrossRef]
- Juang, V.; Chang, C.H.; Wang, C.S.; Wang, H.E.; Lo, Y.L. pH-responsive PEG-shedding and targeting peptide-modified nanoparticles for dual-delivery of irinotecan and microRNA to enhance tumor-specific therapy. Small 2019, 15, e1903296. [Google Scholar] [CrossRef]
- Chou, T.C. Drug combination studies and their synergy quantification using the Chou-Talalay method. Cancer Res. 2010, 70, 440–446. [Google Scholar] [CrossRef]
- Hong, S.T.; Lin, H.; Wang, C.S.; Chang, C.H.; Lin, A.M.; Yang, J.C.; Lo, Y.L. Improving the anticancer effect of afatinib and microRNA by using lipid polymeric nanoparticles conjugated with dual pH-responsive and targeting peptides. J. Nanobiotechnol. 2019, 17, 89. [Google Scholar] [CrossRef] [PubMed]
- Deb, S.; Boknäs, N.; Sjöström, C.; Tharmakulanathan, A.; Lotfi, K.; Ramström, S. Varying effects of tyrosine kinase inhibitors on platelet function-A need for individualized CML treatment to minimize the risk for hemostatic and thrombotic complications? Cancer Med. 2020, 9, 313–323. [Google Scholar] [CrossRef] [PubMed]
- Baniak, N.; Senger, J.L.; Ahmed, S.; Kanthan, S.C.; Kanthan, R. Gastric biomarkers: A global review. World J. Surg. Oncol. 2016, 14, 212. [Google Scholar] [CrossRef] [PubMed]
- Zhao, T.; Yang, T.; Zhang, J.; Hao, H.; Wang, D.; Afirifa, J.; Cai, M.; Cui, X.; Bai, J.; Fu, S.; et al. The promoter methylation drives down-regulation mode of HIC1 in gastric cancer, its molecular characteristics and downstream functional pathways. Gene 2022, 824, 146380. [Google Scholar] [CrossRef]
- Song, Y.; Ye, M.; Zhou, J.; Wang, Z.; Zhu, X. Targeting E-cadherin expression with small molecules for digestive cancer treatment. Am. J. Transl. Res. 2019, 11, 3932–3944. [Google Scholar]
- Serasinghe, M.N.; Wieder, S.Y.; Renault, T.T.; Elkholi, R.; Asciolla, J.J.; Yao, J.L.; Jabado, O.; Hoehn, K.; Kageyama, Y.; Sesaki, H.; et al. Mitochondrial division is requisite to RAS-induced transformation and targeted by oncogenic MAPK pathway inhibitors. Mol. Cell 2015, 57, 521–536. [Google Scholar] [CrossRef]
- Guo, J.Y.; Chen, H.Y.; Mathew, R.; Fan, J.; Strohecker, A.M.; Karsli-Uzunbas, G.; Kamphorst, J.J.; Chen, G.; Lemons, J.M.; Karantza, V.; et al. Activated Ras requires autophagy to maintain oxidative metabolism and tumorigenesis. Genes Dev. 2011, 25, 460–470. [Google Scholar] [CrossRef]
- Schiliro, C.; Firestein, B.L. Mechanisms of Metabolic Reprogramming in Cancer Cells Supporting Enhanced Growth and Proliferation. Cells 2021, 10, 1056. [Google Scholar] [CrossRef]
- Holloway, R.W.; Marignani, P.A. Targeting mTOR and Glycolysis in HER2-Positive Breast Cancer. Cancers 2021, 13, 2922. [Google Scholar] [CrossRef]
- Choi, Y.R.; Shim, J.; Kim, M.J. Genistin: A Novel Potent Anti-Adipogenic and Anti-Lipogenic Agent. Molecules 2020, 25, 2042. [Google Scholar] [CrossRef] [PubMed]
- Choi, I.; Son, H.; Baek, J.H. Tricarboxylic Acid (TCA) Cycle Intermediates: Regulators of Immune Responses. Life 2021, 11, 69. [Google Scholar] [CrossRef] [PubMed]
- Jia, D.; Lu, M.; Jung, K.H.; Park, J.H.; Yu, L.; Onuchic, J.N.; Kaipparettu, B.A.; Levine, H. Elucidating cancer metabolic plasticity by coupling gene regulation with metabolic pathways. Proc. Natl. Acad. Sci. USA 2019, 116, 3909–3918. [Google Scholar] [CrossRef] [PubMed]
- Jin, L.; Alesi, G.N.; Kang, S. Glutaminolysis as a target for cancer therapy. Oncogene 2016, 35, 3619–3625. [Google Scholar] [CrossRef]
- Duran, R.V.; Oppliger, W.; Robitaille, A.M.; Heiserich, L.; Skendaj, R.; Gottlieb, E.; Hall, M.N. Glutaminolysis activates Rag-mTORC1 signaling. Mol. Cell 2012, 47, 349–358. [Google Scholar] [CrossRef] [PubMed]
- Cluntun, A.A.; Lukey, M.J.; Cerione, R.A.; Locasale, J.W. Glutamine Metabolism in Cancer: Understanding the Heterogeneity. Trends Cancer 2017, 3, 169–180. [Google Scholar] [CrossRef]
- Qu, Q.; Zeng, F.; Liu, X.; Wang, Q.J.; Deng, F. Fatty acid oxidation and carnitine palmitoyltransferase I: Emerging therapeutic targets in cancer. Cell Death Dis. 2016, 7, e2226. [Google Scholar] [CrossRef]
- Munoz-Pinedo, C.; El Mjiyad, N.; Ricci, J.E. Cancer metabolism: Current perspectives and future directions. Cell Death Dis. 2012, 3, e248. [Google Scholar] [CrossRef]
- Fado, R.; Rodriguez-Rodriguez, R.; Casals, N. The return of malonyl-CoA to the brain: Cognition and other stories. Prog. Lipid. Res. 2021, 81, 101071. [Google Scholar] [CrossRef]
- Mancias, J.D.; Kimmelman, A.C. Mechanisms of Selective Autophagy in Normal Physiology and Cancer. J. Mol. Biol. 2016, 428, 1659–1680. [Google Scholar] [CrossRef]
- Li, J.; Chang, X.; Shang, M.; Niu, S.; Zhang, W.; Li, Y.; Sun, Z.; Wu, T.; Kong, L.; Zhang, T.; et al. The crosstalk between DRP1-dependent mitochondrial fission and oxidative stress triggers hepatocyte apoptosis induced by silver nanoparticles. Nanoscale 2021, 13, 12356–12369. [Google Scholar] [CrossRef]
- Wang, C.S.; Chang, C.H.; Tzeng, T.Y.; Lin, A.M.; Lo, Y.L. Gene-editing by CRISPR-Cas9 in combination with anthracycline therapy via tumor microenvironment-switchable, EGFR-targeted, and nucleus-directed nanoparticles for head and neck cancer suppression. Nanoscale Horiz. 2021, 6, 729–743. [Google Scholar] [CrossRef] [PubMed]
- Jin, C.; Zhong, Y.; Han, J.; Zhu, J.; Liu, Q.; Sun, D.; Xia, X.; Peng, X. Drp1-mediated mitochondrial fission induced autophagy attenuates cell apoptosis caused by 3-chlorpropane-1,2-diol in HEK293 cells. Food Chem. Toxicol. 2020, 145, 111740. [Google Scholar] [CrossRef] [PubMed]
- Ko, H.J.; Tsai, C.Y.; Chiou, S.J.; Lai, Y.L.; Wang, C.H.; Cheng, J.T.; Chuang, T.H.; Huang, C.F.; Kwan, A.L.; Loh, J.K.; et al. The Phosphorylation Status of Drp1-Ser637 by PKA in Mitochondrial Fission Modulates Mitophagy via PINK1/Parkin to Exert Multipolar Spindles Assembly during Mitosis. Biomolecules 2021, 11. [Google Scholar] [CrossRef] [PubMed]
- Gao, F.; Reynolds, M.B.; Passalacqua, K.D.; Sexton, J.Z.; Abuaita, B.H.; O’Riordan, M.X.D. The Mitochondrial Fission Regulator DRP1 Controls Post-Transcriptional Regulation of TNF-α. Front. Cell Infect. Microbiol. 2020, 10, 593805. [Google Scholar] [CrossRef] [PubMed]
- Xu, Z.; Han, X.; Ou, D.; Liu, T.; Li, Z.; Jiang, G.; Liu, J.; Zhang, J. Targeting PI3K/AKT/mTOR-mediated autophagy for tumor therapy. Appl. Microbiol. Biotechnol. 2020, 104, 575–587. [Google Scholar] [CrossRef]
- Dudoignon, D.; Pattison, D.A.; Legallois, D.; Hicks, R.J.; Aide, N. The utility of pharmacological and radiological interventions to optimize diagnostic information from PET/CT. Cancer Imaging 2020, 20, 68. [Google Scholar] [CrossRef]
- Colino, C.I.; Lanao, J.M.; Gutierrez-Millan, C. Targeting of Hepatic Macrophages by Therapeutic Nanoparticles. Front. Immunol. 2020, 11, 218. [Google Scholar] [CrossRef]


| miR-125/SLN-KL | Afa/SLN-KL | miR-125 + Afa/SLN-KL | |
|---|---|---|---|
| Size (nm) | 156.07 ± 1.76 | 170.87 ± 4.02 | 177.87 ± 6.02 |
| PDI a | 0.22 ± 0.02 | 0.17 ± 0.04 | 0.24 ± 0.03 |
| Zeta potential (mV) | 32.20 ± 0.20 | 39.30 ± 2.80 | 35.97 ± 0.44 |
| EE% b of Afa | -- | 89.03 ± 0.06 | 91.37 ± 0.05 |
| EE% of miR-125 | 88.67 ± 0.04 | -- | 86.71 ± 0.03 |
| DL% c of Afa | -- | 17.22 ± 0.01 | 18.34 ± 0.01 |
| DL% of miR-125 | 16.64 ± 0.06 | -- | 14.63 ± 0.02 |
Publisher’s Note: MDPI stays neutral with regard to jurisdictional claims in published maps and institutional affiliations. |
© 2022 by the authors. Licensee MDPI, Basel, Switzerland. This article is an open access article distributed under the terms and conditions of the Creative Commons Attribution (CC BY) license (https://creativecommons.org/licenses/by/4.0/).
Share and Cite
Lo, Y.-L.; Wang, T.-Y.; Chen, C.-J.; Chang, Y.-H.; Lin, A.M.-Y. Two-in-One Nanoparticle Formulation to Deliver a Tyrosine Kinase Inhibitor and microRNA for Targeting Metabolic Reprogramming and Mitochondrial Dysfunction in Gastric Cancer. Pharmaceutics 2022, 14, 1759. https://doi.org/10.3390/pharmaceutics14091759
Lo Y-L, Wang T-Y, Chen C-J, Chang Y-H, Lin AM-Y. Two-in-One Nanoparticle Formulation to Deliver a Tyrosine Kinase Inhibitor and microRNA for Targeting Metabolic Reprogramming and Mitochondrial Dysfunction in Gastric Cancer. Pharmaceutics. 2022; 14(9):1759. https://doi.org/10.3390/pharmaceutics14091759
Chicago/Turabian StyleLo, Yu-Li, Tse-Yuan Wang, Chun-Jung Chen, Yih-Hsin Chang, and Anya Maan-Yuh Lin. 2022. "Two-in-One Nanoparticle Formulation to Deliver a Tyrosine Kinase Inhibitor and microRNA for Targeting Metabolic Reprogramming and Mitochondrial Dysfunction in Gastric Cancer" Pharmaceutics 14, no. 9: 1759. https://doi.org/10.3390/pharmaceutics14091759