
Predicting Throughput and Melt Temperature in Pharmaceutical Hot Melt Extrusion


Abstract
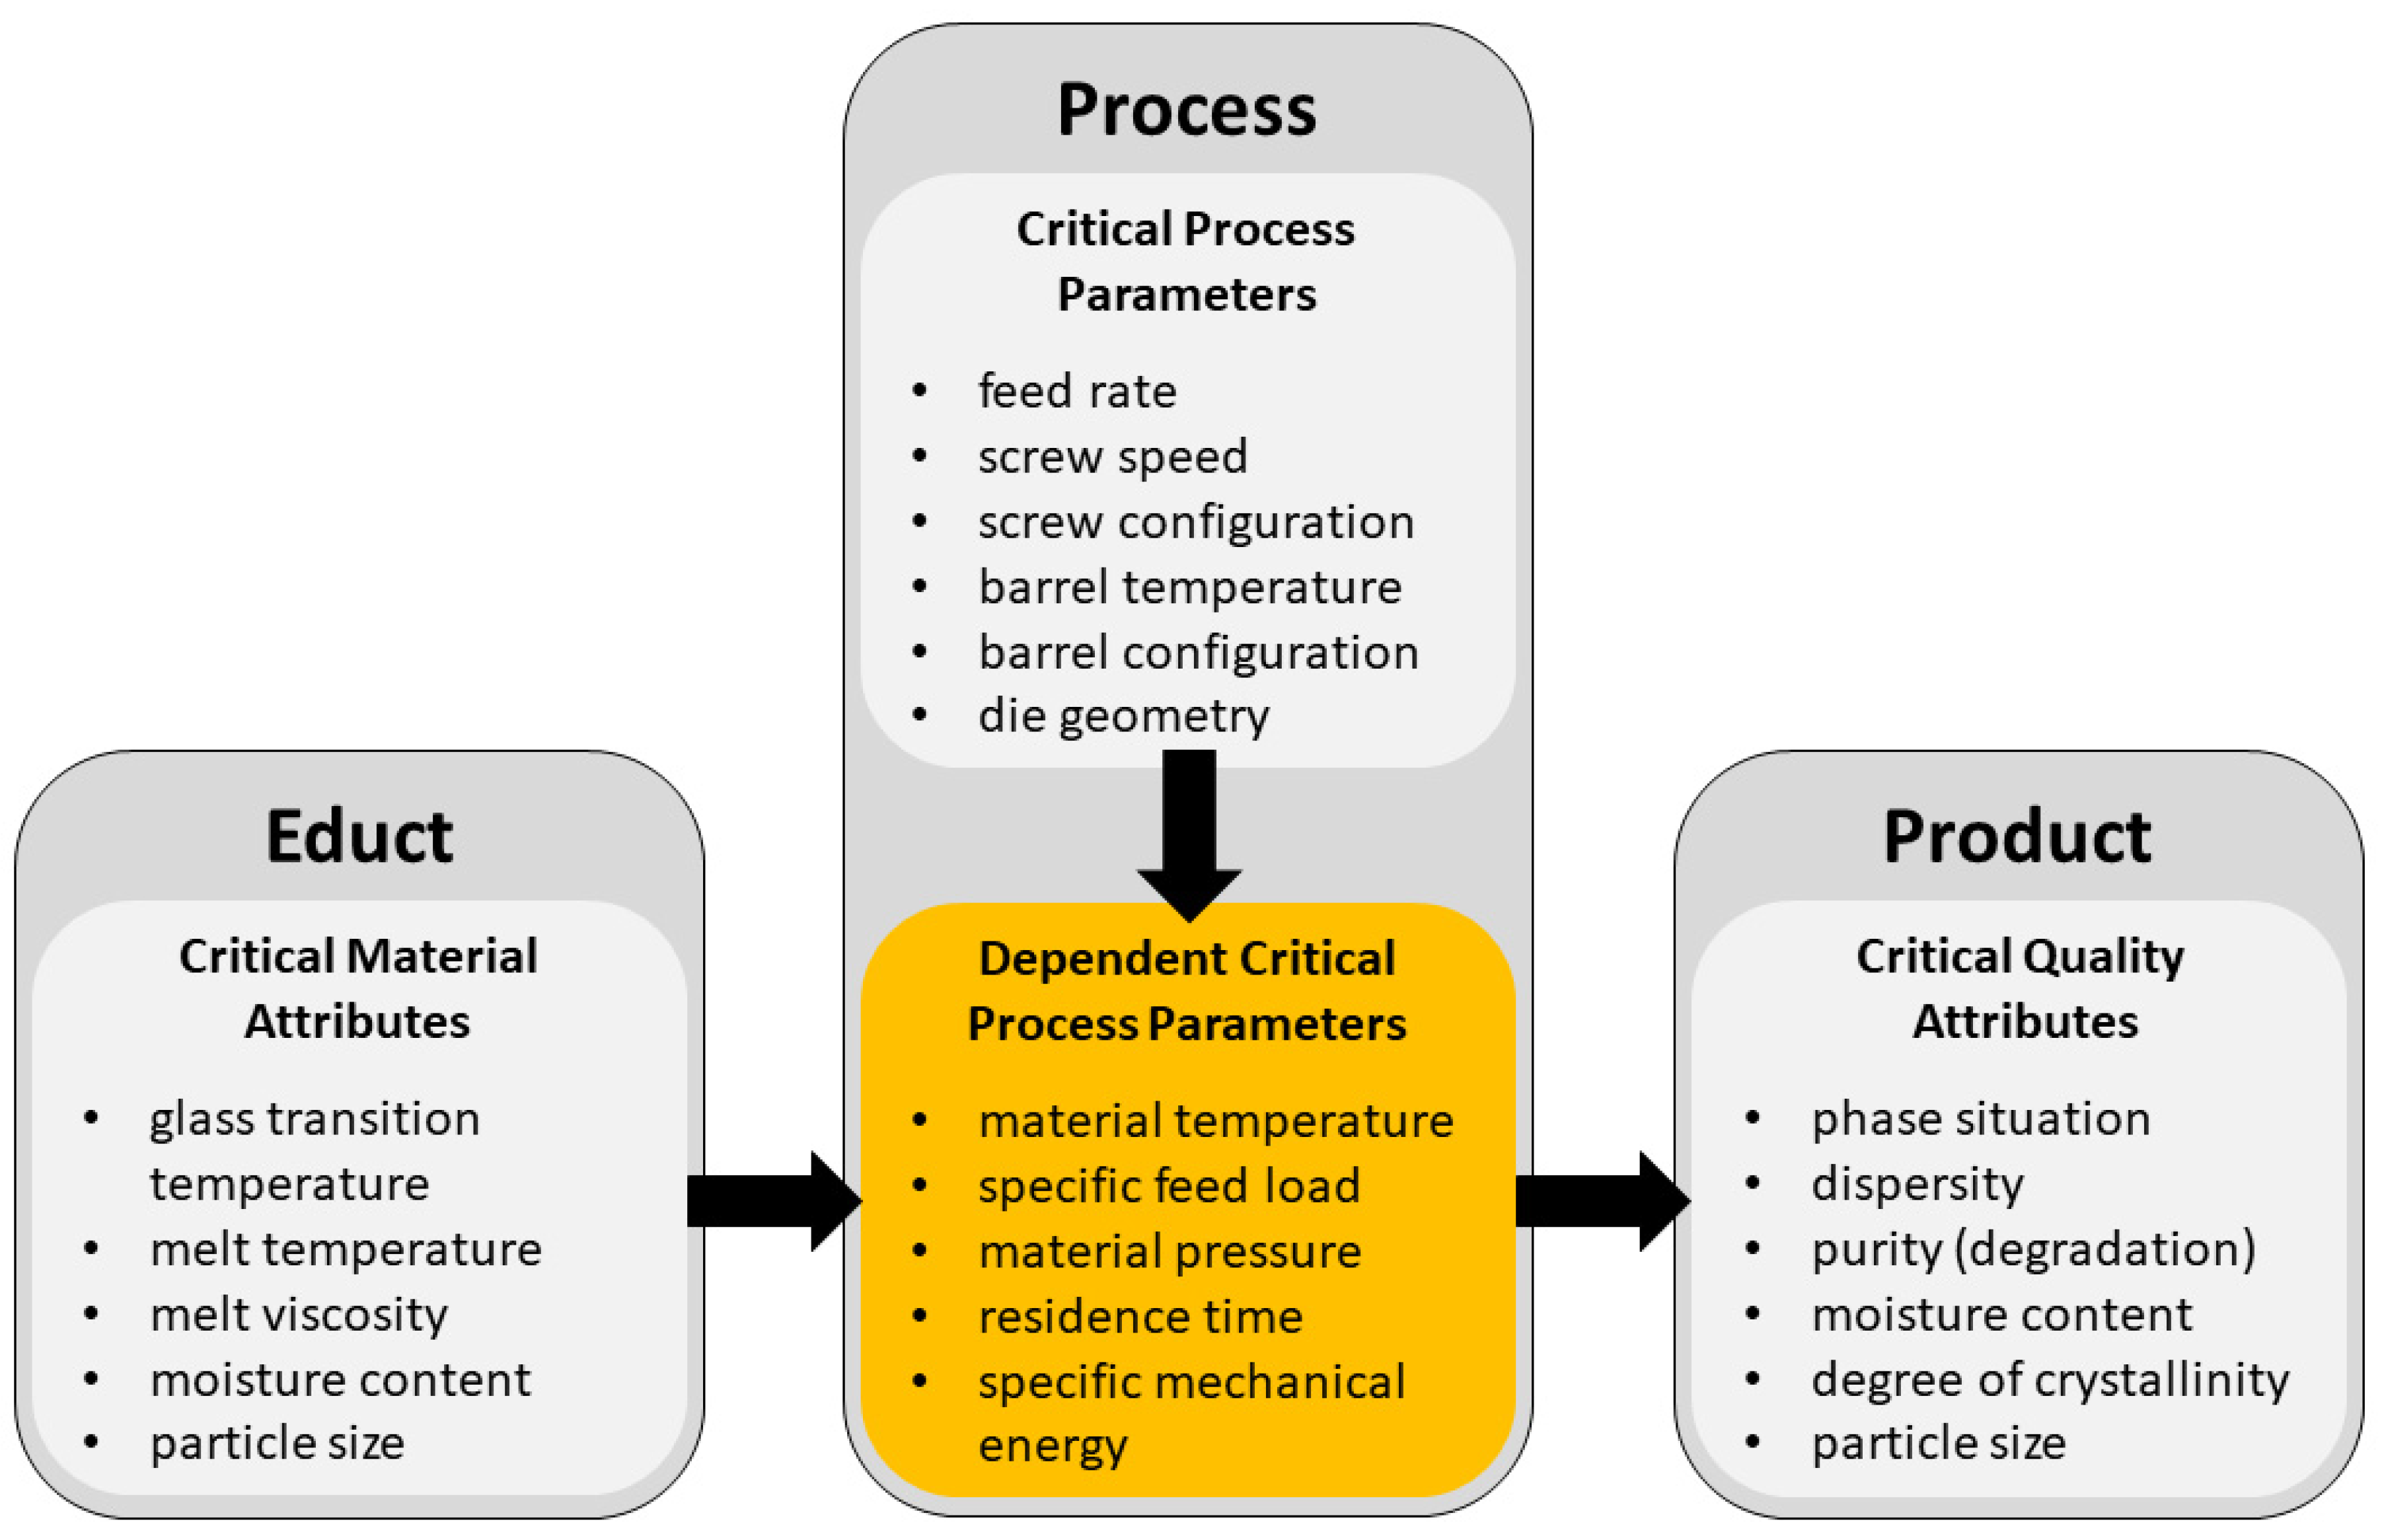
:1. Introduction
2. Materials and Methods
2.1. Materials
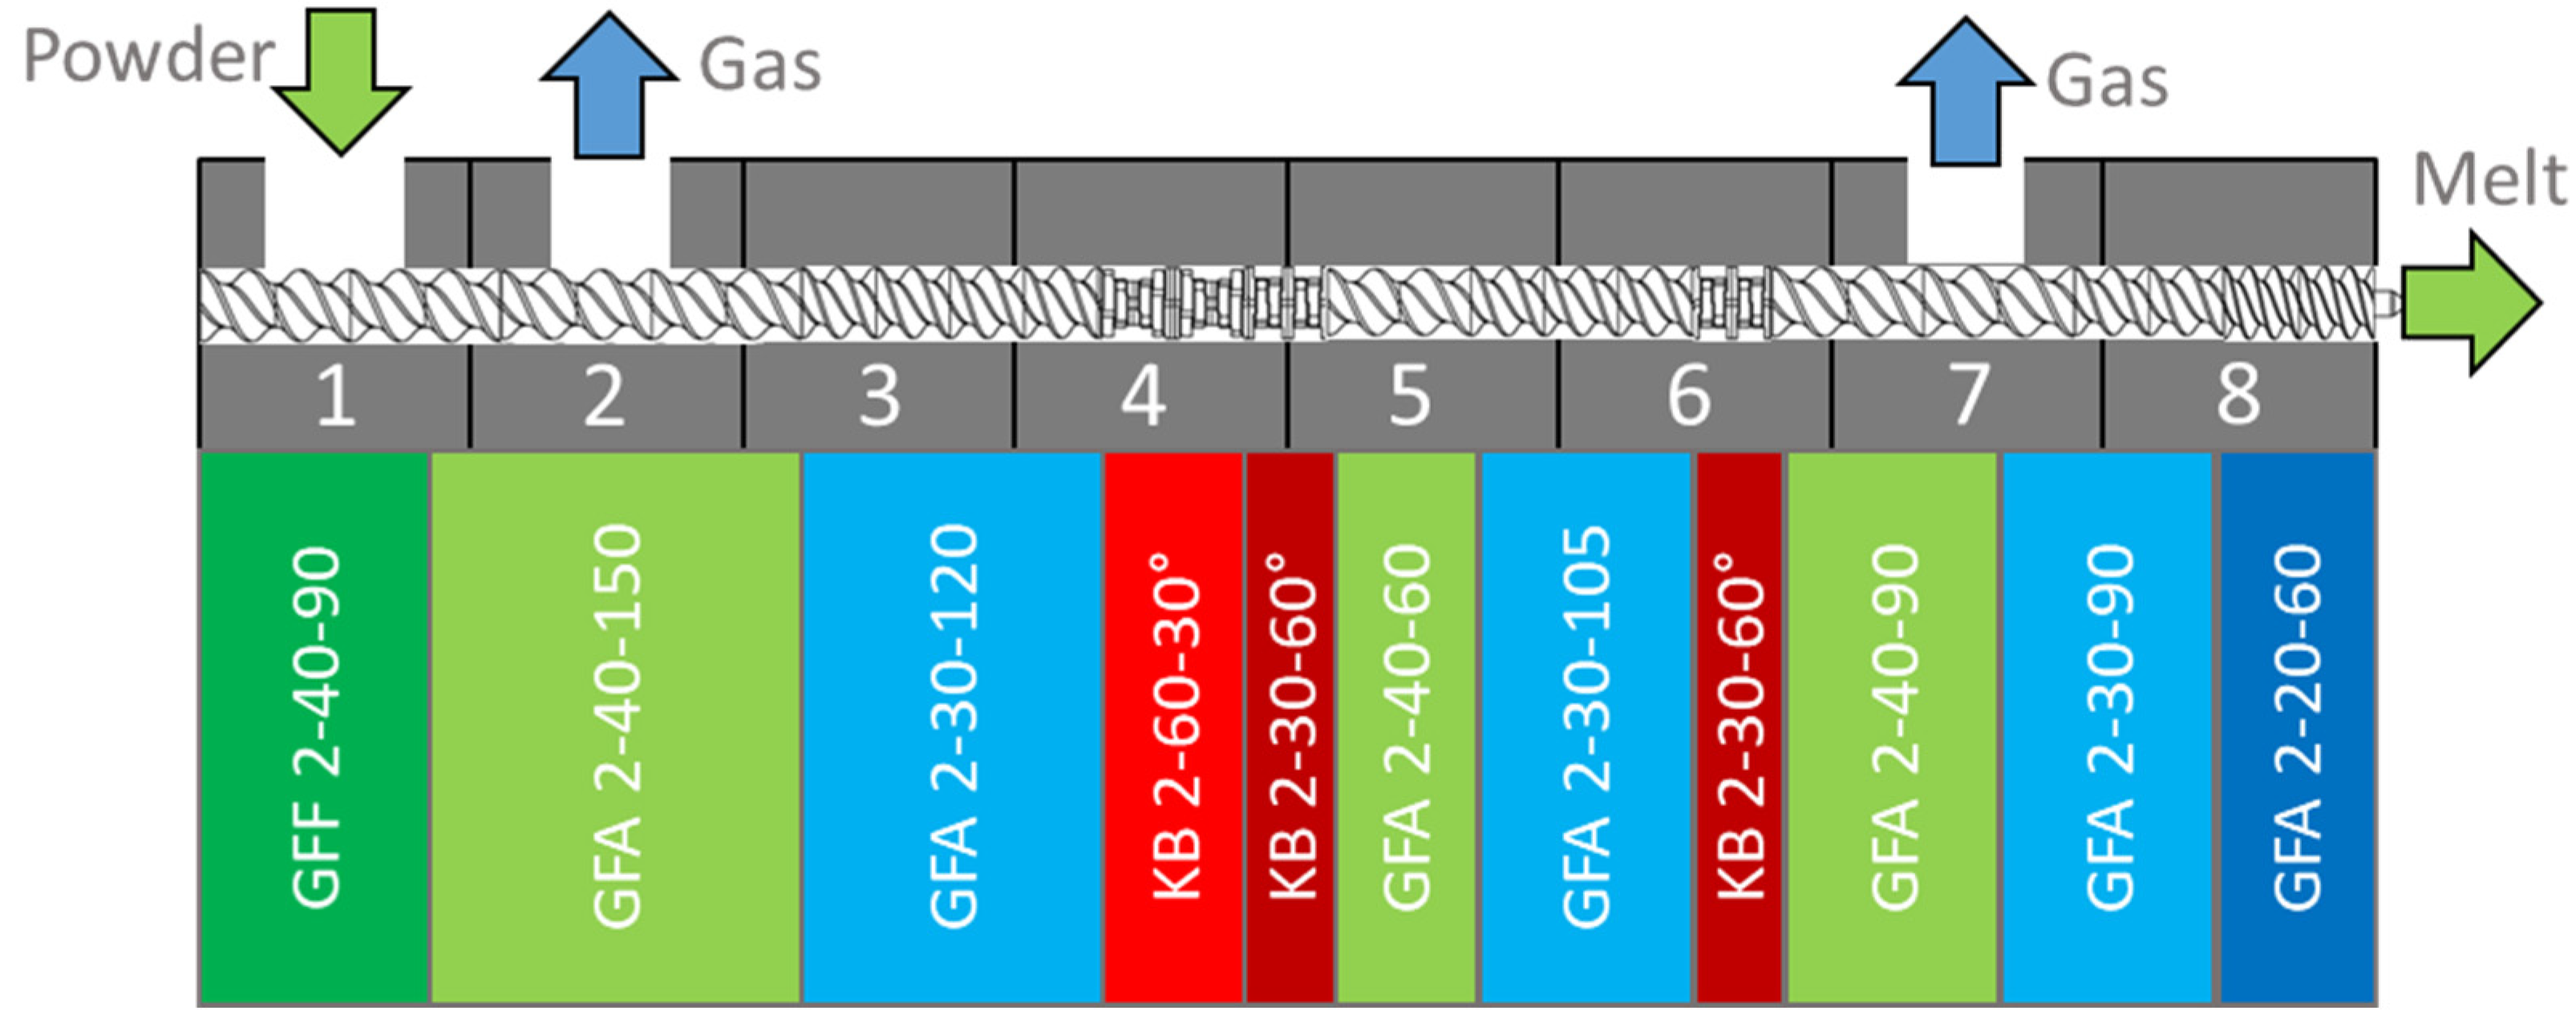
2.2. Hot Melt Extrusion
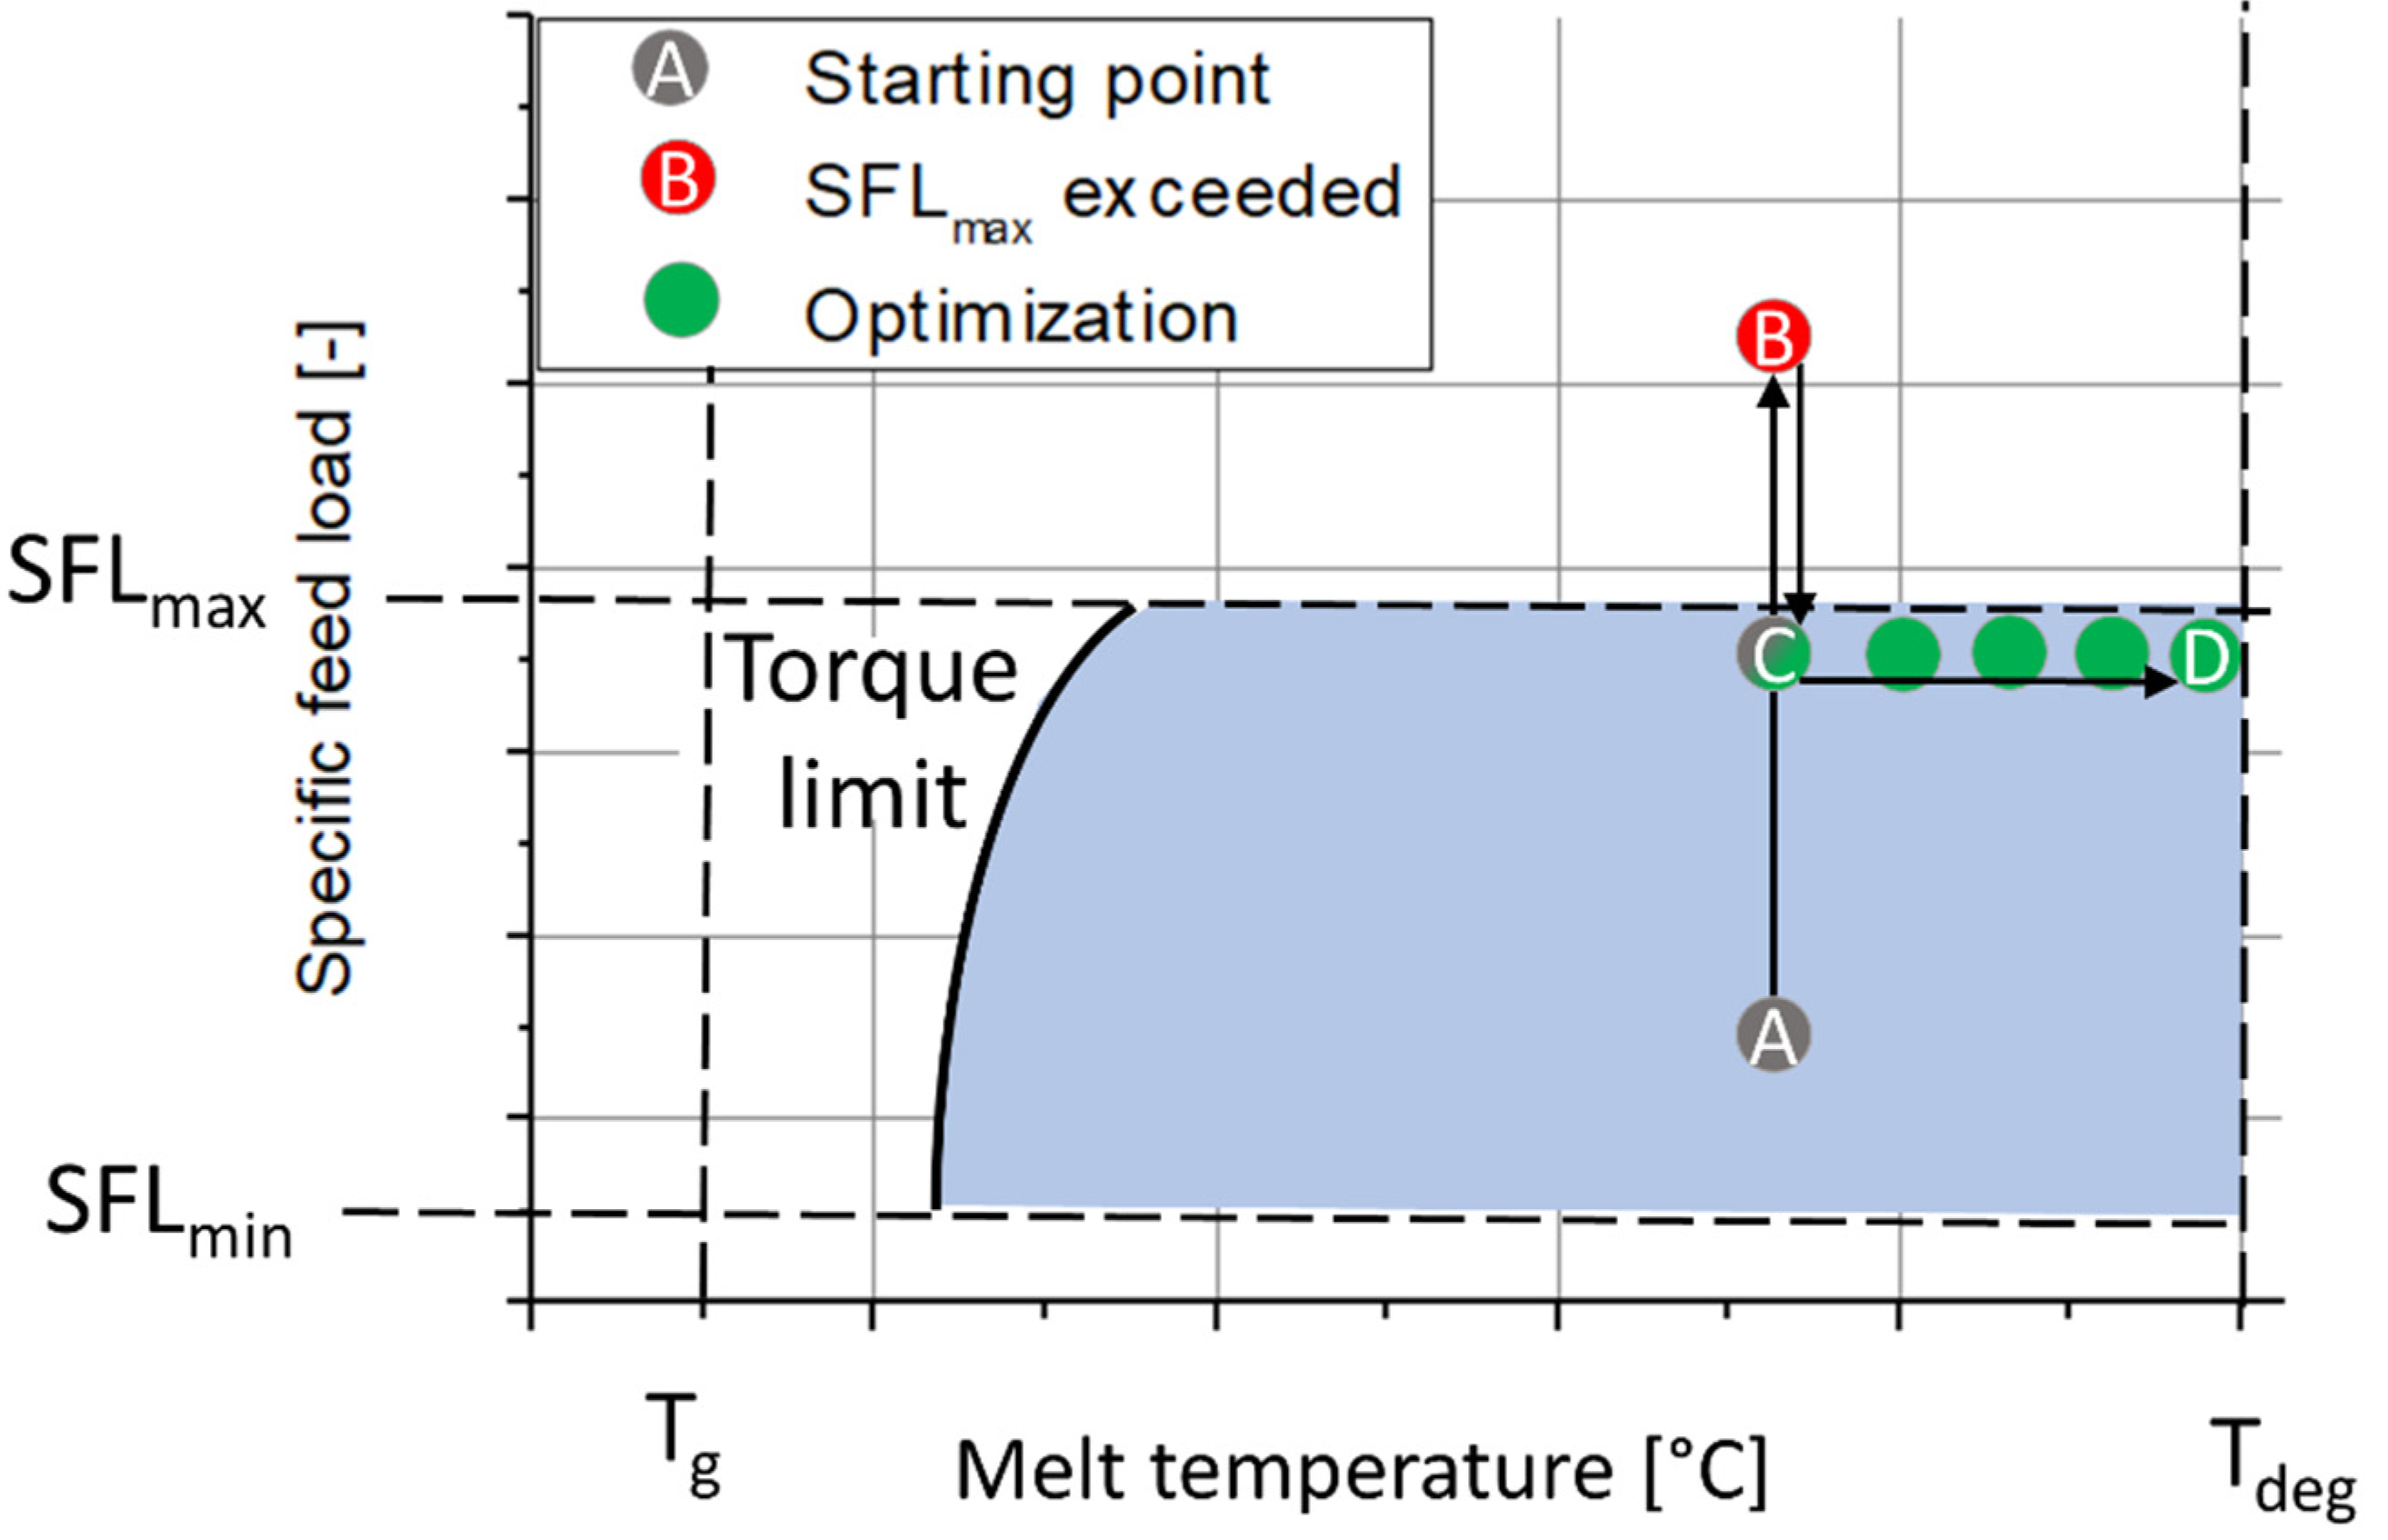
2.3. Scale-Independent Optimization Strategy
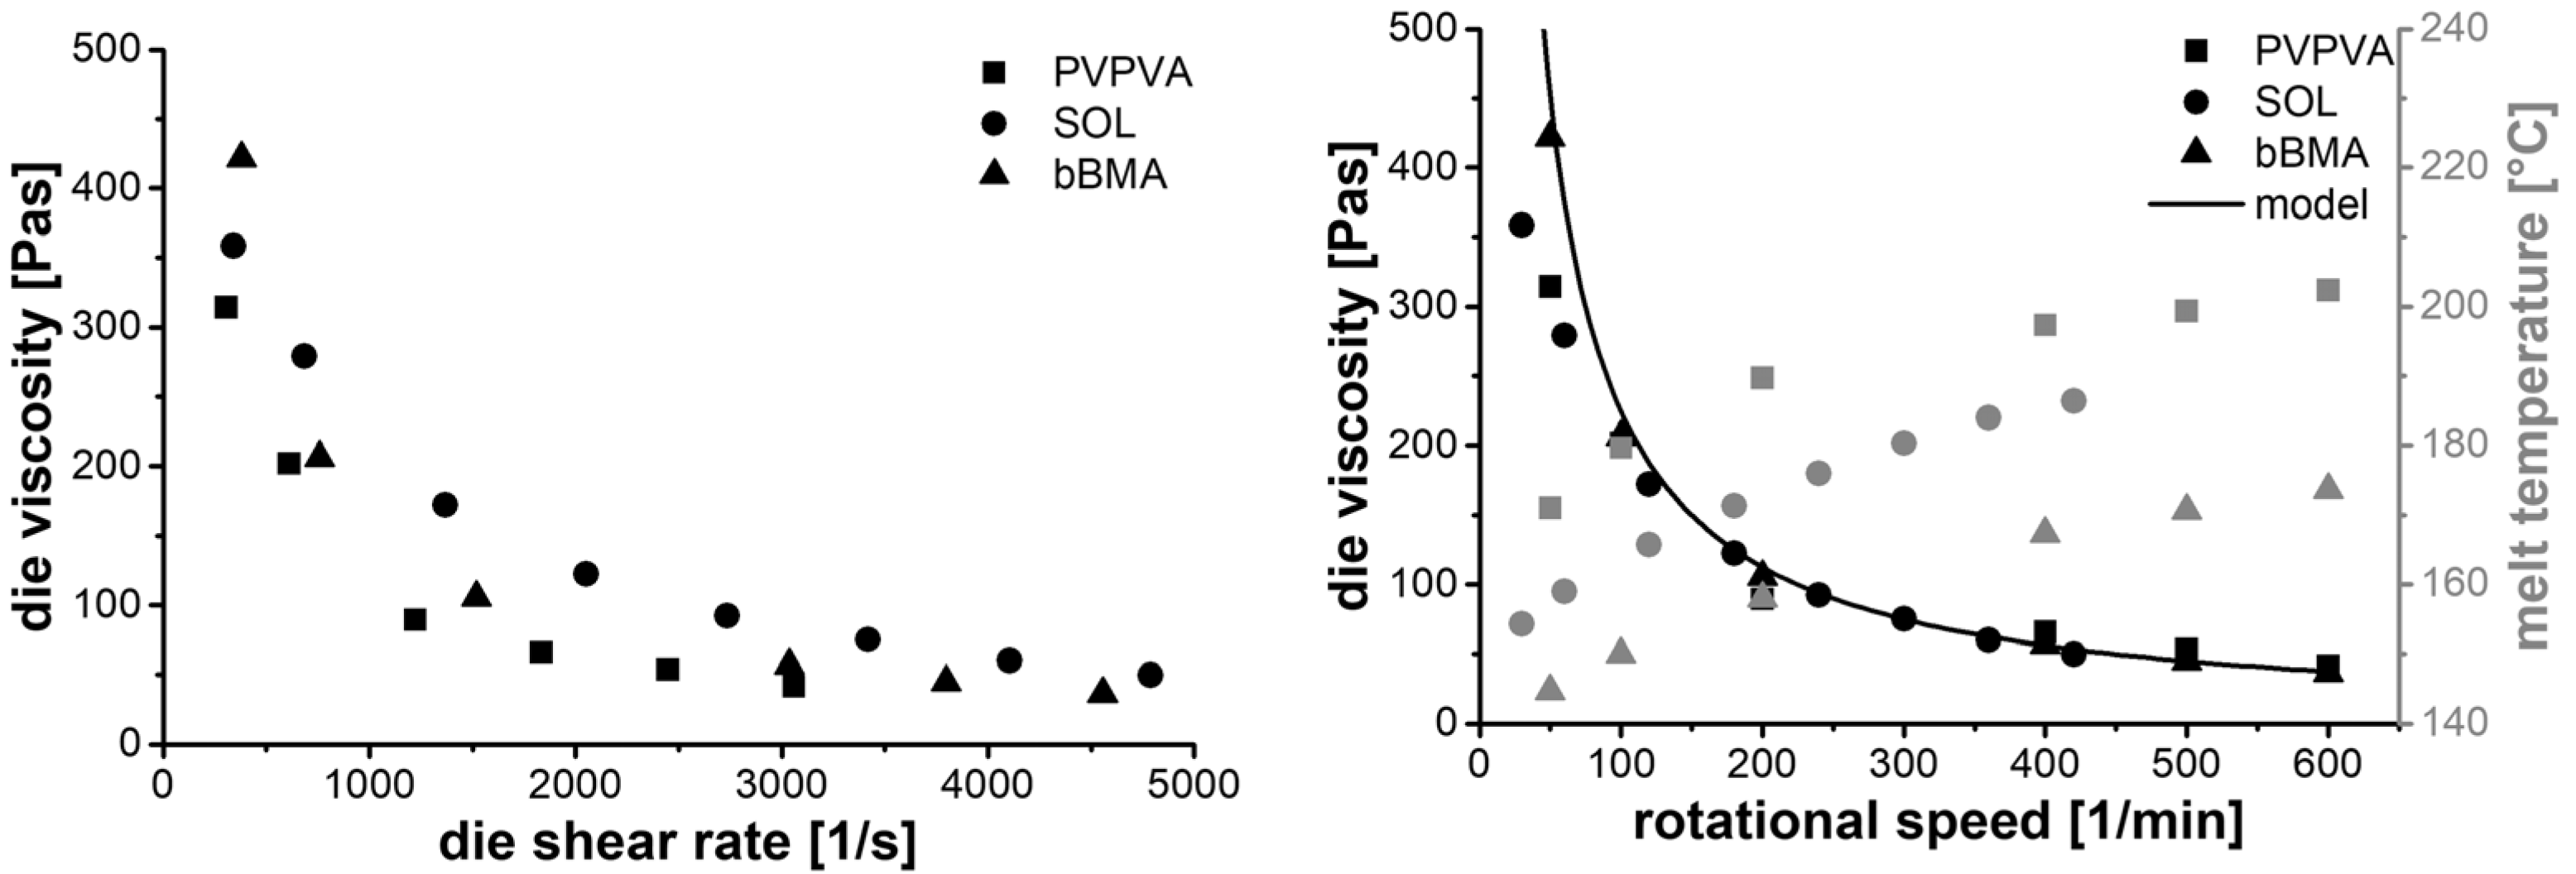
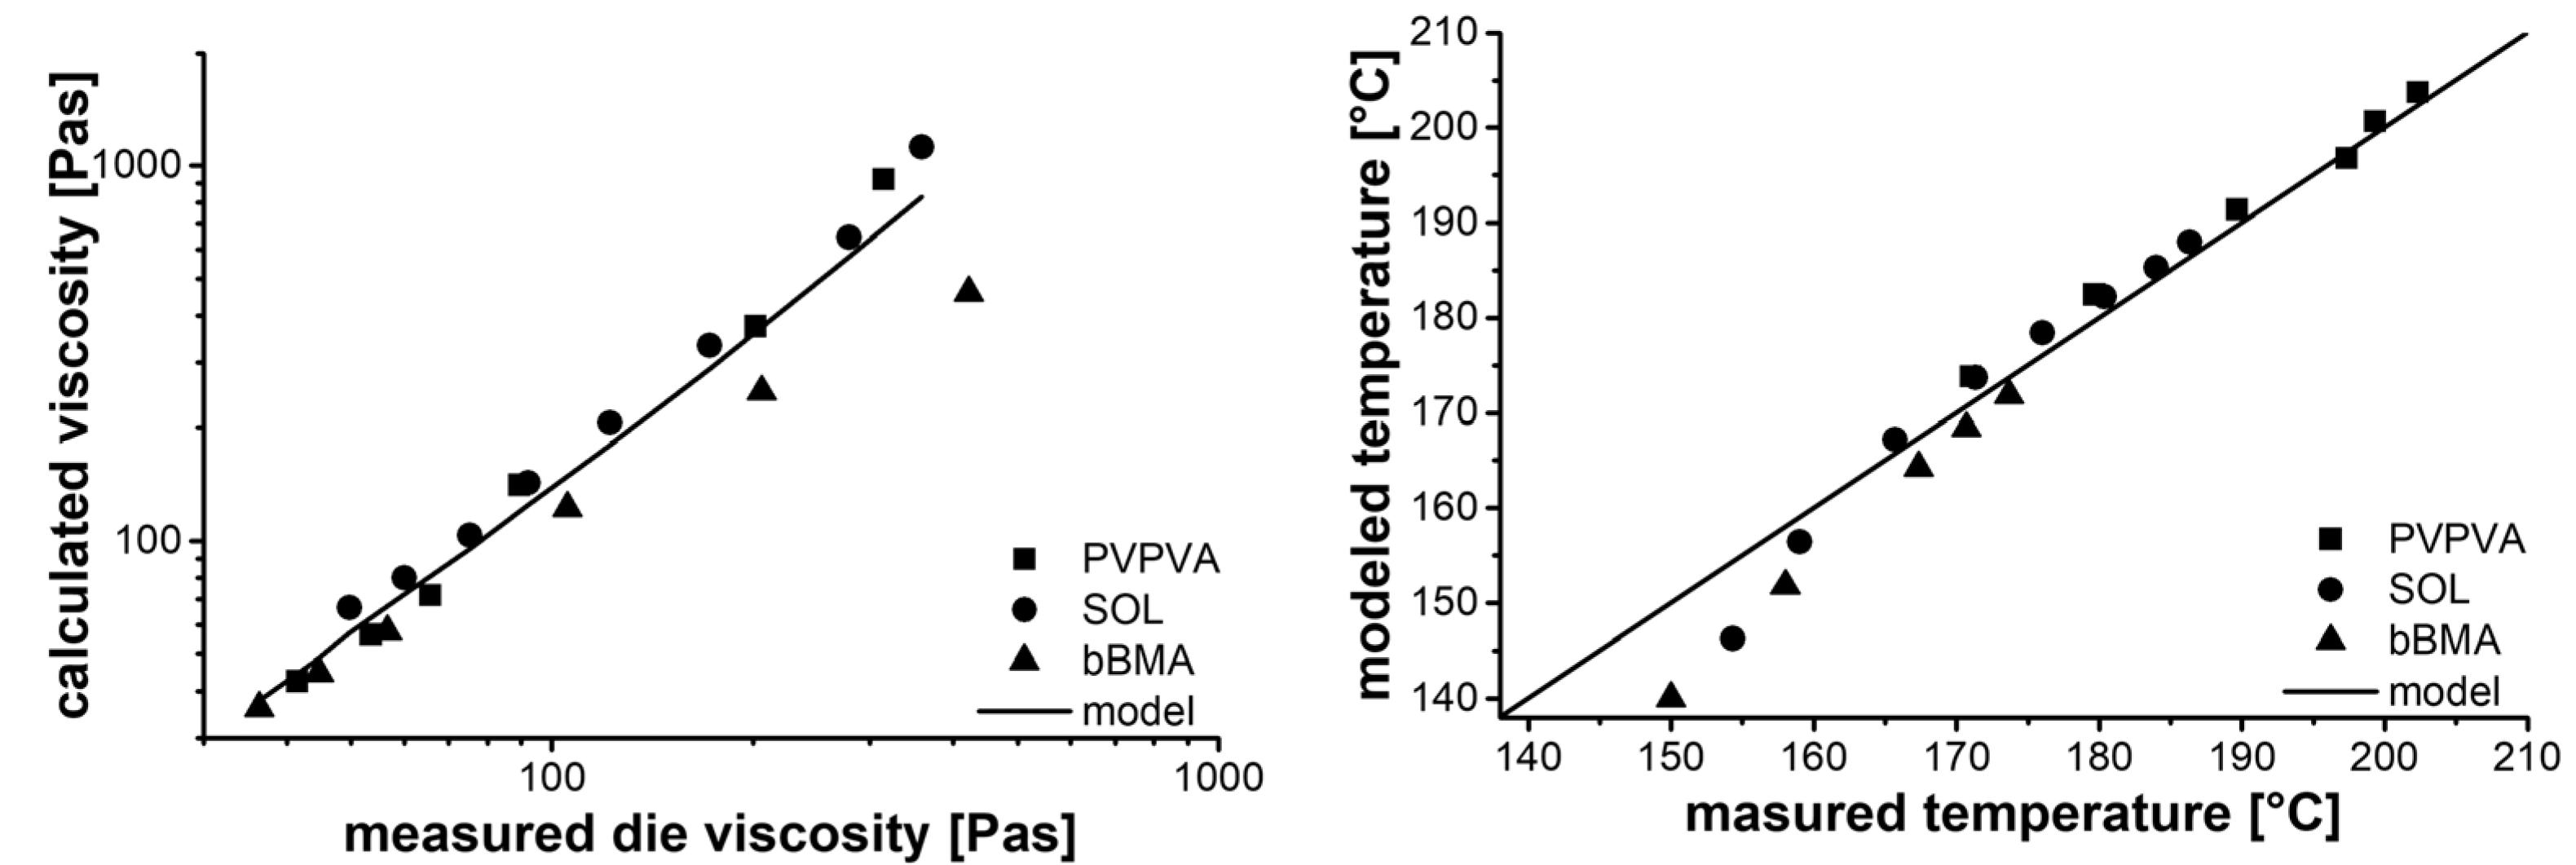
2.4. Rheological Investigation
- The temperatures used for rheology measurements were close to the extrusion temperatures.
- Oscillation rheology measurements covered the high shear rate range relevant for extrusion.
- Dried polymers were utilized due to the plasticizing effect of the water on the polymers.
- Sample preparation via “MeltPrep” technology was preferred to minimize the air bubbles in the molten polymer.
- Repetitive measurements were made to enable confidence in the data.
3. Results and Discussion
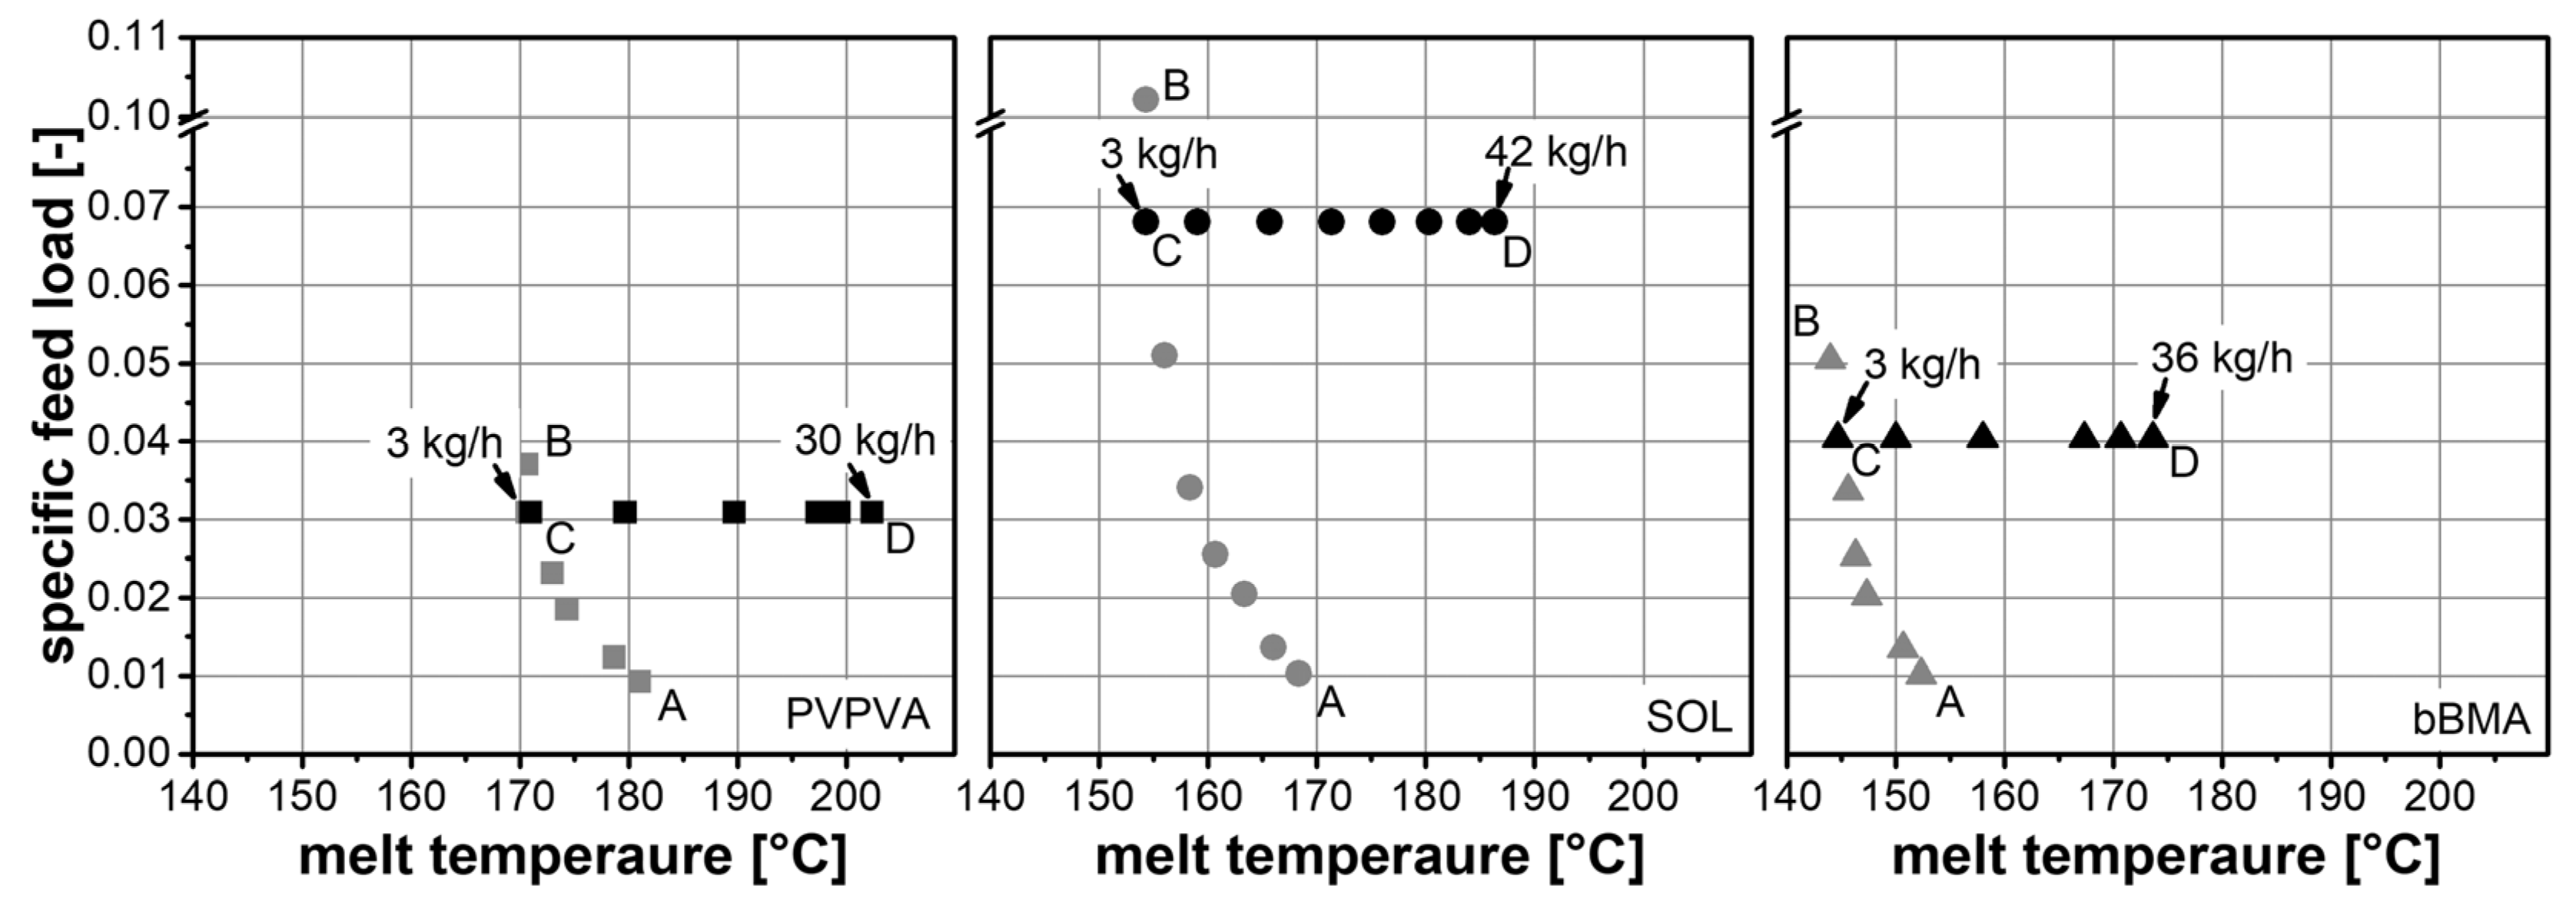
3.1. SIOS for Different Polymers
3.2. Maximum Barrel Load
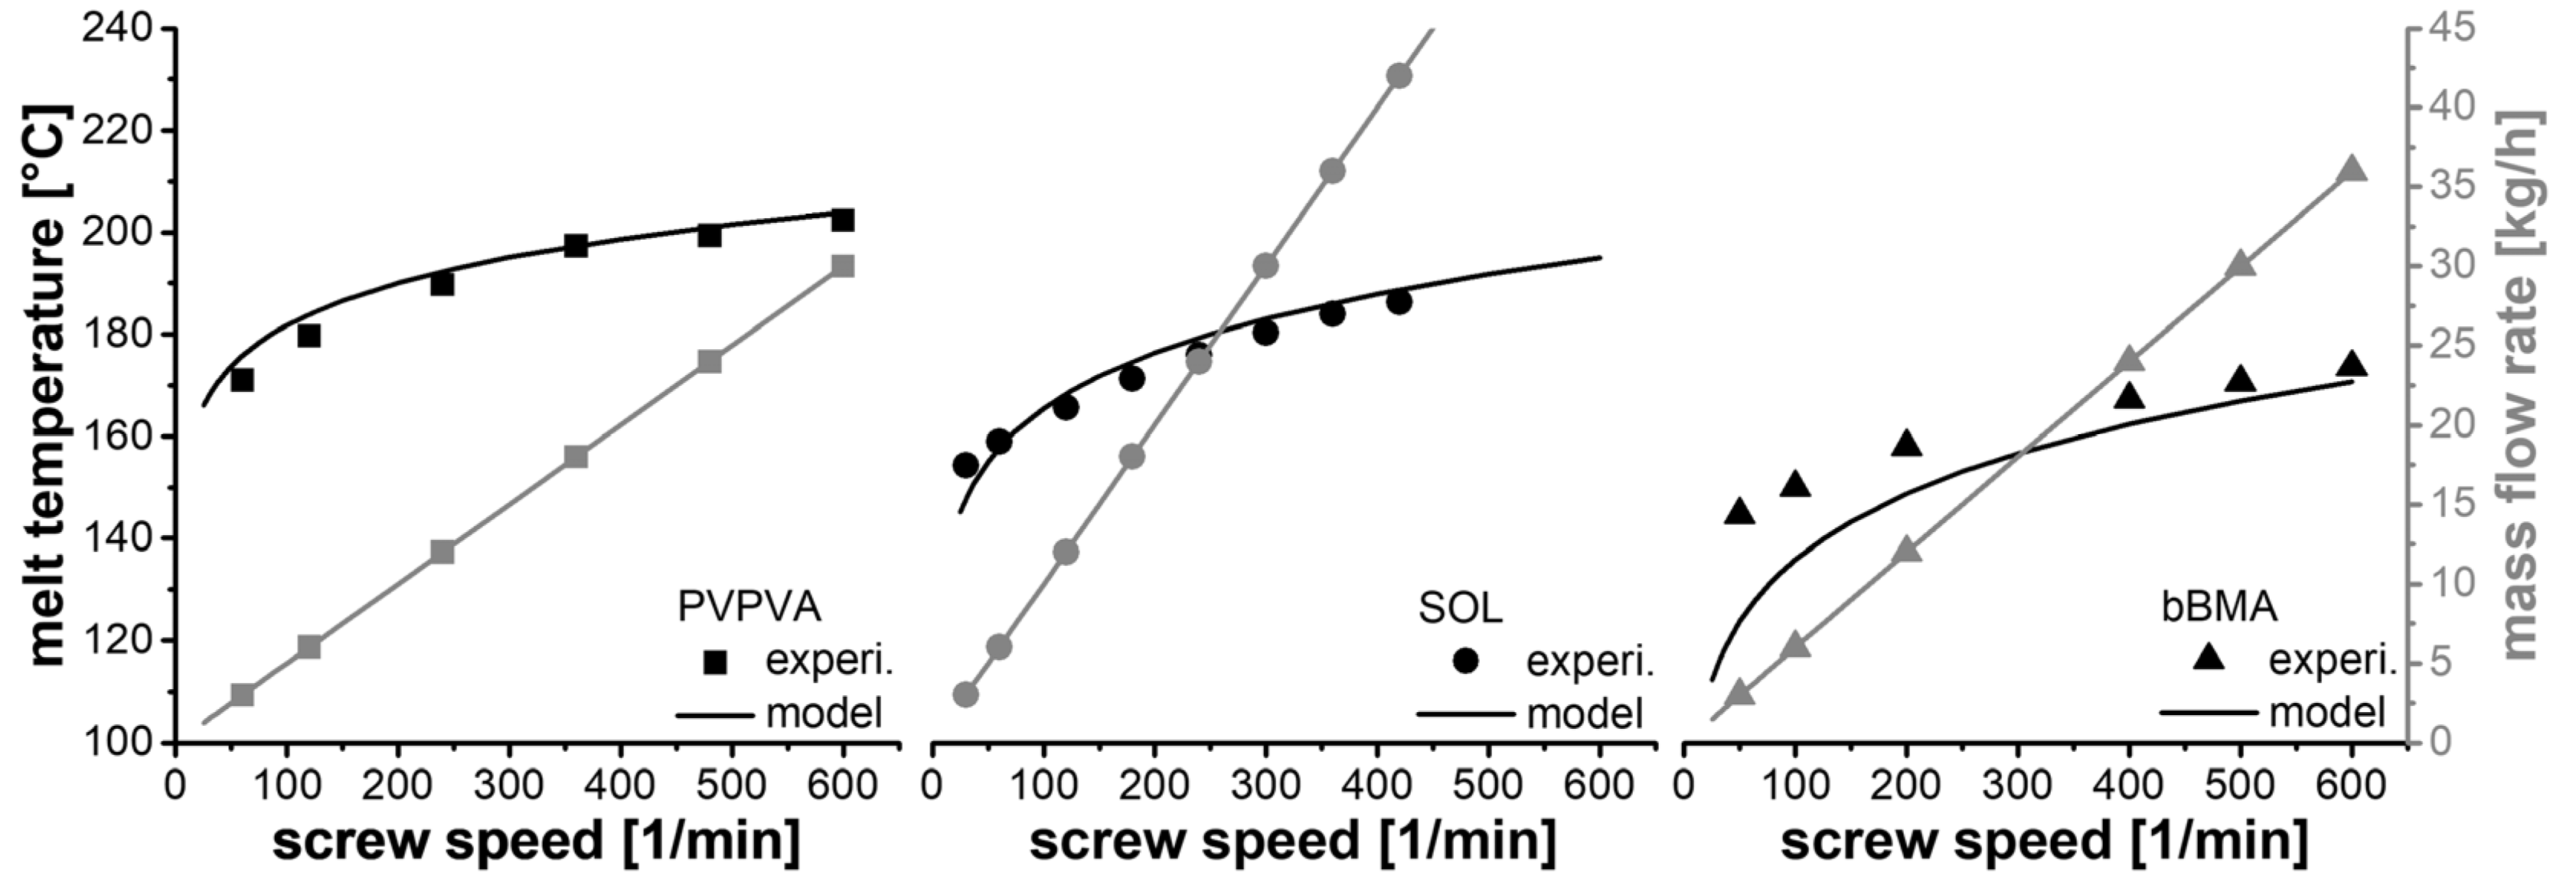
3.3. Melt Temperature
3.4. Guidance for Application
- 1.
- Determine the following material characteristics:
- powder bulk density ()
- material density ()
- melt rheology (e.g., Carreau–Arrhenius)
- 2.
- Determine the following extruder parameters:
- free cross-sectional area of the screw ()
- screw diameter ()
- screw pitch in the feeding section ()
- die radius ()
- die length ()
- 3.
- Determine maximum mass flow () that is transported through the feeding section of the extruder using different screw speeds (n). Calculate the slip () from the slope of linear regression using Equation (12).
- 4.
- Investigate the extruder performance in autogenic conditions using at least two screw speeds at maximum specific feed load.
- Set the barrel temperature to the manufacturer’s recommended process temperature for the material. Cool the feeding section to ambient temperature to avoid clogging.
- Choose a reasonable screw speed (e.g., 200 rpm) and set the mass flow for this specific speed using Equation (5) at SFL* = 1. Note that low screw speeds increase the risk of clogging the extruder (exceeding torque limit), while high speeds increase the material consumption.
- Wait for the steady state of the extrusion process at these conditions, at which point, homogeneous, coherent (commonly transparent) extrudate strands are obtained.
- Turn off the barrel temperature control to allow autogenic extrusion. However, continue cooling the feeding section and heating the die to the manufacturer’s recommended process temperature for the material (particularly necessary for small extruders).
- Measure the melt temperature (e.g., with an IR thermometer) after steady state is reached (power consumption, die pressure and the barrel temperature are constant), which may take several minutes. Note the screw speed, mass flow rate, melt temperature and die pressure.
- Move to other process conditions. If the power consumption is reasonably low (less than 50% of the nominal value), the screw speed and the mass flow rate should be lowered by the same ratio (e.g., two-thirds). If the power consumption is relatively high, the higher screw speed and mass flow rate should be increased by the same ratio (e.g., four-thirds).
- Measure the melt temperature and die pressure after reaching steady state. Note the corresponding mass flow rate and screw speed.
- Fit the model parameters (, and ) in Equations (10) and (11), which describe the correlation between screw speed and extruder-independent viscosity. Calculate the melt temperature as a function of screw speed (Section 3.3).
4. Conclusions
Author Contributions
Funding
Institutional Review Board Statement
Informed Consent Statement
Data Availability Statement
Acknowledgments
Conflicts of Interest
Appendix A

| Polymer | (1/min) | (kg/h) | (°C) | (MPa) |
|---|---|---|---|---|
| PVPVA | 200 | 3 | 181.0 | |
| 150 | 3 | 178.7 | ||
| 100 | 3 | 174.3 | ||
| 80 | 3 | 173.0 | ||
| 60 | 3 | 170.7 | ||
| 50 | 3 | 170.7 | ||
| 60 | 3 | 171.0 | 2.08 | |
| 120 | 6 | 179.7 | 2.51 | |
| 240 | 12 | 189.7 | 2.28 | |
| 360 | 18 | 197.3 | 2.46 | |
| 480 | 24 | 199.3 | 2.62 | |
| 600 | 30 | 202.3 | 2.56 | |
| SOL | 200 | 3 | 168.3 | |
| 150 | 3 | 166.0 | ||
| 100 | 3 | 163.3 | ||
| 80 | 3 | 160.7 | ||
| 60 | 3 | 158.3 | ||
| 40 | 3 | 156.0 | ||
| 20 | 3 | 154.3 | ||
| 30 | 3 | 154.3 | 2.49 | |
| 60 | 6 | 159.0 | 3.59 | |
| 120 | 12 | 165.7 | 4.26 | |
| 180 | 18 | 171.3 | 4.49 | |
| 240 | 24 | 176.0 | 4.51 | |
| 300 | 30 | 180.3 | 4.59 | |
| 360 | 36 | 184.0 | 4.42 | |
| 420 | 42 | 186.3 | 4.30 | |
| bBMA | 200 | 3 | 152.3 | |
| 150 | 3 | 150.7 | ||
| 100 | 3 | 147.3 | ||
| 80 | 3 | 146.3 | ||
| 60 | 3 | 145.7 | ||
| 40 | 3 | 144.0 | ||
| 50 | 3 | 145.3 | ||
| 50 | 3 | 144.7 | 2.50 | |
| 100 | 6 | 150.0 | 2.44 | |
| 200 | 12 | 158.0 | 2.50 | |
| 400 | 24 | 167.3 | 2.68 | |
| 500 | 30 | 170.7 | 2.65 | |
| 600 | 36 | 173.7 | 2.59 |
References
- Lipinski, C. Poor aqueous solubility—An industry wide problem in drug discovery. Am. Pharm. Rev. 2002, 5, 82–85. [Google Scholar]
- Leuner, C.; Dressman, J. Improving drug solubility for oral delivery using solid dispersions. Eur. J. Pharm. Biopharm. 2000, 50, 47–60. [Google Scholar] [CrossRef]
- Vasconcelos, T.; Marques, S.; das Neves, J.; Sarmento, B. Amorphous solid dispersions: Rational selection of a manufacturing process. Adv. Drug Deliv. Rev. 2016, 100, 85–101. [Google Scholar] [CrossRef] [PubMed]
- Baghel, S.; Cathcart, H.; O’Reilly, N.J. Polymeric Amorphous Solid Dispersions: A Review of Amorphization, Crystallization, Stabilization, Solid-State Characterization, and Aqueous Solubilization of Biopharmaceutical Classification System Class II Drugs. J. Pharm. Sci. 2016, 105, 2527–2544. [Google Scholar] [CrossRef] [PubMed] [Green Version]
- Van Den Mooter, G. The use of amorphous solid dispersions: A formulation strategy to overcome poor solubility and dissolution rate. Drug Discov. Today Technol. 2012, 9, e79–e85. [Google Scholar] [CrossRef] [PubMed]
- Solanki, N.; Gupta, S.S.; Serajuddin, A.T. Rheological analysis of itraconazole-polymer mixtures to determine optimal melt extrusion temperature for development of amorphous solid dispersion. Eur. J. Pharm. Sci. 2018, 111, 482–491. [Google Scholar] [CrossRef] [PubMed]
- Kelleher, J.; Gilvary, G.; Madi, A.; Jones, D.; Li, S.; Tian, Y.; Almajaan, A.; Senta-Loys, Z.; Andrews, G.; Healy, A. A comparative study between hot-melt extrusion and spray-drying for the manufacture of anti-hypertension compatible monolithic fixed-dose combination products. Int. J. Pharm. 2018, 545, 183–196. [Google Scholar] [CrossRef] [Green Version]
- Newman, A. (Ed.) Pharmaceutical Amorphous Solid Dispersions; John Wiley & Sons: Hoboken, NJ, USA, 2015; Volume 488, p. 1. [Google Scholar]
- Sarode, A.L.; Sandhu, H.; Shah, N.; Malick, W.; Zia, H. Hot melt extrusion (HME) for amorphous solid dispersions: Predictive tools for processing and impact of drug–polymer interactions on supersaturation. Eur. J. Pharm. Sci. 2013, 48, 371–384. [Google Scholar] [CrossRef]
- Maniruzzaman, M.; Boateng, J.S.; Snowden, M.J.; Douroumis, D. A Review of Hot-Melt Extrusion: Process Technology to Pharmaceutical Products. ISRN Pharm. 2012, 2012, 436763. [Google Scholar] [CrossRef] [Green Version]
- Breitenbach, J. Melt extrusion: From process to drug delivery technology. Eur. J. Pharm. Biopharm. 2002, 54, 107–117. [Google Scholar] [CrossRef]
- Kohlgrüber, K.; Bierdel, M. Co-Rotating Twin-Screw Extruders: Fundamentals, Technology, and Applications; Carl Hanser Publishers Hanser Gardner Publications: Munich, Germany; Cincinnati, OH, USA, 2008; Volume xiii, p. 354. [Google Scholar]
- Kolter, K.; Karl, M.; Gryczke, A. Hot-melt Extrusion with BASF Pharma Polymers: Extrusion Compendium, 2nd ed.; BASF: Ludwigshafen, Germany, 2012; p. 200. [Google Scholar]
- Wesholowski, J.; Hoppe, K.; Nickel, K.; Muehlenfeld, C.; Thommes, M. Scale-Up of pharmaceutical Hot-Melt-Extrusion: Process optimization and transfer. Eur. J. Pharm. Biopharm. 2019, 142, 396–404. [Google Scholar] [CrossRef]
- McKelvey, J.M. Theory of Adiabatic Extruder Operation. Ind. Eng. Chem. 1954, 46, 660–664. [Google Scholar] [CrossRef]
- Repka, M.A.; Langley, N.; Dinunzio, J. (Eds.) Melt Extrusion: Materials, Technology and Drug Product Design; Springer: New York, NY, USA, 2013; p. 474. [Google Scholar]
- Auch, C.; Harms, M.; Mäder, K. How changes in molecular weight and PDI of a polymer in amorphous solid dispersions impact dissolution performance. Int. J. Pharm. 2018, 556, 372–382. [Google Scholar] [CrossRef]
- Moustafine, R.I.; Bukhovets, A.V.; Sitenkov, A.Y.; Kemenova, V.A.; Rombaut, P.; van den Mooter, G. Eudragit E PO as a Complementary Material for Designing Oral Drug Delivery Systems with Controlled Release Properties: Comparative Evaluation of New Interpolyelectrolyte Complexes with Countercharged Eudragit L100 Copolymers. Mol. Pharm. 2013, 10, 2630–2641. [Google Scholar] [CrossRef]
- Ercolin, E.M.A. Characterization of Pharmaceutical Polymers and Validation of 1D Simulation in a Lab-extruder. Master Thesis, TU Dortmund University, Dortmund, Germany, 2022. [Google Scholar]
- Treffer, D.; Troiss, A.; Khinast, J. A novel tool to standardize rheology testing of molten polymers for pharmaceutical applications. Int. J. Pharm. 2015, 495, 474–481. [Google Scholar] [CrossRef]
- EDQM. European Pharmacopoeia, European Directorate for Quality of Medcines and Health Care, 10.8th ed.; 2022. Available online: https://www.coe.int/en/web/democracy/edqm (accessed on 14 July 2022).
- Rudolph, N.; Osswald, T.A. Polymer Rheology—Fundamentals and Applications; Buch—Hanser Verlag: Munich, Germany, 2015. [Google Scholar]
- van Krevelen, D.W.; Te Nijenhuis, H. Properties of Polymers; Elsevier: Amsterdam, The Netherlands, 2009. [Google Scholar]
- Linn, M.; Collnot, E.-M.; Djuric, D.; Hempel, K.; Fabian, E.; Kolter, K.; Lehr, C.-M. Soluplus® as an effective absorption enhancer of poorly soluble drugs in vitro and in vivo. Eur. J. Pharm. Sci. 2012, 45, 336–343. [Google Scholar] [CrossRef]
- Liu, H.; Wang, P.; Zhang, X.; Shen, F.; Gogos, C.G. Effects of extrusion process parameters on the dissolution behavior of indomethacin in Eudragit® E PO solid dispersions. Int. J. Pharm. 2010, 383, 161–169. [Google Scholar] [CrossRef]
- Alshahrani, S.M.; Lu, W.; Park, J.-B.; Morott, J.T.; Alsulays, B.B.; Majumdar, S.; Langley, N.; Kolter, K.; Gryczke, A.; Repka, M.A. Stability-enhanced Hot-melt Extruded Amorphous Solid Dispersions via Combinations of Soluplus® and HPMCAS-HF. AAPS PharmSciTech 2015, 16, 824–834. [Google Scholar] [CrossRef] [Green Version]
- Repka, M.A.; Shah, S.; Lu, J.; Maddineni, S.; Morott, J.; Patwardhan, K.; Mohammed, N.N. Melt extrusion: Process to product. Expert Opin. Drug Deliv. 2012, 9, 105–125. [Google Scholar] [CrossRef]
- Rabinowitsch, B. Über die Viskosität und Elastizität von Solen. Z. Phys. Chem. 1929, 145, 1–26. [Google Scholar] [CrossRef]
- Schröder, T. Rheologie der Kunststoffe-Theorie und Praxis; Buch—Hanser Verlag: Munich, Germany, 2020. [Google Scholar]
- Bagley, E.B. End Corrections in the Capillary Flow of Polyethylene. J. Appl. Phys. 1957, 28, 624–627. [Google Scholar] [CrossRef]
- Cogswell, F.N. Converging flow of polymer melts in extrusion dies. Polym. Eng. Sci. 1972, 12, 64–73. [Google Scholar] [CrossRef]


| Carreau | Arrhenius | ||||
|---|---|---|---|---|---|
| Substance | [K] | ||||
| PVPVA [19] | 169.7 | 133.1 | 0.387 | 198,292 | 473 |
| SOL [20] | 147.3 | 136.7 | 0.411 | 150,773 | 473 |
| bBMA [20] | 25.58 | 1688 | 0.561 | 140,336 | 473 |
| Substance | ||||
|---|---|---|---|---|
| PVPVA | 399 ± 26.9 | 0.409 | 0.131 | 0.958 |
| SOL | 361 ± 12.3 | 0.318 | 0.036 | 0.986 |
| bBMA | 361 ± 14.2 | 0.126 | 0.045 | 0.979 |
Publisher’s Note: MDPI stays neutral with regard to jurisdictional claims in published maps and institutional affiliations. |
© 2022 by the authors. Licensee MDPI, Basel, Switzerland. This article is an open access article distributed under the terms and conditions of the Creative Commons Attribution (CC BY) license (https://creativecommons.org/licenses/by/4.0/).
Share and Cite
Gottschalk, T.; Özbay, C.; Feuerbach, T.; Thommes, M. Predicting Throughput and Melt Temperature in Pharmaceutical Hot Melt Extrusion. Pharmaceutics 2022, 14, 1757. https://doi.org/10.3390/pharmaceutics14091757
Gottschalk T, Özbay C, Feuerbach T, Thommes M. Predicting Throughput and Melt Temperature in Pharmaceutical Hot Melt Extrusion. Pharmaceutics. 2022; 14(9):1757. https://doi.org/10.3390/pharmaceutics14091757
Chicago/Turabian StyleGottschalk, Tobias, Cihangir Özbay, Tim Feuerbach, and Markus Thommes. 2022. "Predicting Throughput and Melt Temperature in Pharmaceutical Hot Melt Extrusion" Pharmaceutics 14, no. 9: 1757. https://doi.org/10.3390/pharmaceutics14091757